improved understanding of in situ chemical oxidation: soil reactivity
TRANSCRIPT

FINAL REPORT Improved Understanding of In Situ Chemical Oxidation
Soil Reactivity
SERDP Project ER-1289
December 2007 Neil Thomson University of Waterloo Kammy Sra University of Waterloo Xiuyuan Xu University of Waterloo
Distribution Statement A: Approved for Public Release, Distribution is Unlimited

This report was prepared under contract to the Department of Defense Strategic Environmental Research and Development Program (SERDP). The publication of this report does not indicate endorsement by the Department of Defense, nor should the contents be construed as reflecting the official policy or position of the Department of Defense. Reference herein to any specific commercial product, process, or service by trade name, trademark, manufacturer, or otherwise, does not necessarily constitute or imply its endorsement, recommendation, or favoring by the Department of Defense.

Prepared for: Strategic Environmental Research and Development Program (SERDP)
AN IMPROVED UNDERSTANDING OF IN SITU CHEMICAL OXIDATION (ER-1289):
Technical Objective II: Soil Reactivity Final Report May 2009 Prepared by: N.R. Thomson, X. Xu, and K. Sra Department of Civil and Environmental Engineering University of Waterloo 200 University Avenue West Waterloo, Ontario N2L 3G1

TABLE of CONTENTS Page
1 ACKNOWLEDGEMENTS ..................................................................................................1
2 EXECUTIVE SUMMARY ...................................................................................................1
3 PROJECT OBJECTIVES ......................................................................................................4
3.1 Document Organization .......................................................................................... 5
4 AQUIFER MATERIALS, TRC, AND COD TESTS ...........................................................6
4.1 Collection and Handling of Aquifer Materials ....................................................... 6
4.2 Sample Characterization ......................................................................................... 8
4.3 Reductive Capabilities of Aquifer Materials .......................................................... 9
4.4 Theoretical Estimation of Total Reductive Capacity (TRC) ................................ 14
4.5 Experimental Estimation of TRC.......................................................................... 15
4.6 Results and Discussion on TRC ............................................................................ 17
4.7 Impact of Air-Drying on the Reductive Properties of Aquifer Materials ............. 18
5 PERMANGANATE ............................................................................................................22
5.1 Background ........................................................................................................... 22
5.1.1 Permanganate Properties and Reactions ...................................................... 22
5.1.2 Permanganate Interaction with Aquifer Materials ......................................... 25
5.1.3 Derivation of Permanganate NOD Kinetic Expressions ................................. 27
5.2 Long-Term Permanganate Consumption by Aquifer Materials ........................... 28
5.2.1 Experimental Methods ..................................................................................... 28
5.2.2 Results and Discussion ..................................................................................... 31
5.2.3 Summary .......................................................................................................... 44
5.3 Permanganate COD Tests ..................................................................................... 47
5.3.1 Methods ............................................................................................................ 47
ii

5.3.2 Results ............................................................................................................... 48
5.3.3 Summary .......................................................................................................... 52
5.4 Short-Term Kinetic Investigations ........................................................................ 53
5.4.1 Experimental Methods ..................................................................................... 53
5.4.2 Results and Analysis ......................................................................................... 54
5.4.3 Summary .......................................................................................................... 59
5.5 Column Investigations .......................................................................................... 60
5.5.1 Methods ............................................................................................................ 60
5.5.2 Results and Discussion ..................................................................................... 62
5.5.3 Summary .......................................................................................................... 72
6 HYDROGEN PEROXIDE ..................................................................................................73
6.1 Background ........................................................................................................... 73
6.2 H2O2 Decomposition in the Presence of Aquifer Materials in Batch Systems ..... 75
6.2.1 Methods ............................................................................................................ 75
6.2.2 Results and Discussion .................................................................................... 76
6.2.3 Summary .......................................................................................................... 82
6.3 Enhanced Stability of Hydrogen Peroxide ............................................................ 83
6.3.1 Introduction ..................................................................................................... 83
6.3.2 Methods ............................................................................................................ 85
6.3.3 Results and Discussions .................................................................................... 86
6.3.4 Summary .......................................................................................................... 90
6.4 Column Experiments ............................................................................................ 90
6.4.1 Introduction ..................................................................................................... 90
6.4.2 Methods ............................................................................................................ 91
iii
6.4.3 Results and Discussion .................................................................................... 93
6.4.4 Summary ........................................................................................................ 100
6.5 Modeling ............................................................................................................. 100
7 PERSULFATE ..................................................................................................................104
7.1 Introduction ......................................................................................................... 104
7.2 Methods............................................................................................................... 104
7.3 Results ................................................................................................................. 106
7.3.1 Batch Reactor Experiments ........................................................................... 106
7.3.2 Column Experiments .................................................................................... 109
7.4 Summary ............................................................................................................. 112
8 REFERENCES ..................................................................................................................113
9 APPENDICES ...................................................................................................................122
iv

LIST of TABLES Table 1: General site information where aquifer material was collected for use in this study.
Table 2: Summary of characterization methods.
Table 3: Summary of aquifer materials characteristics.
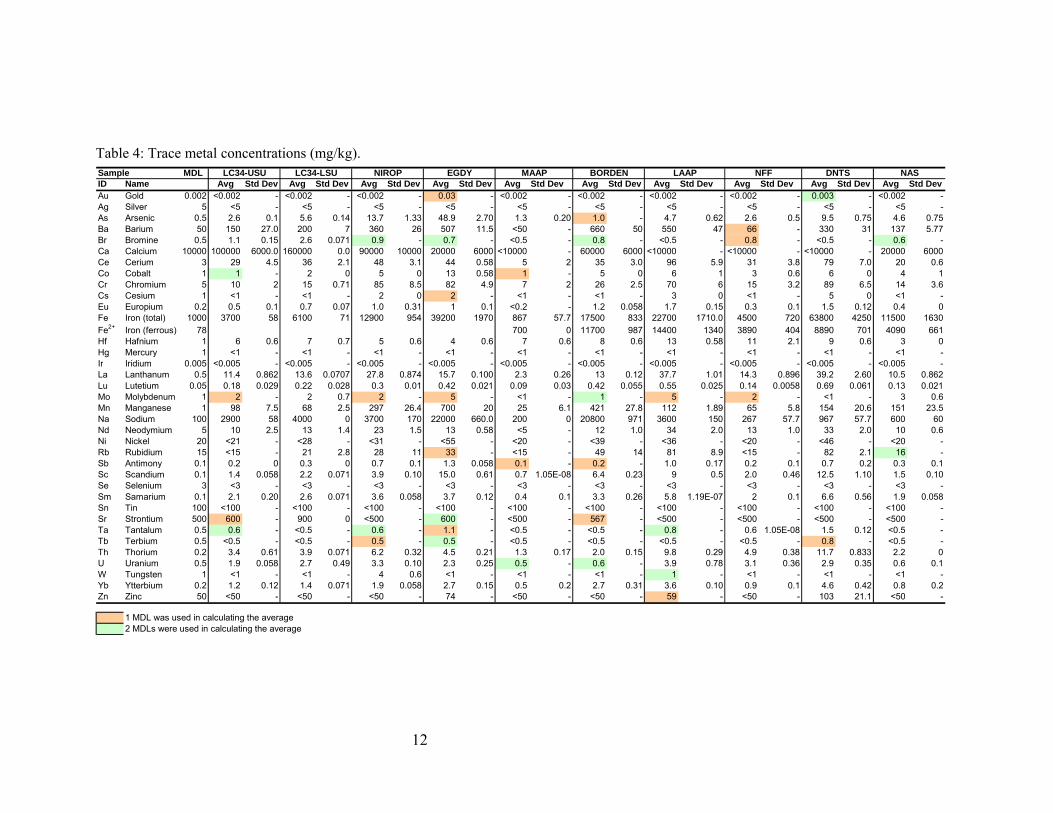
Table 4: Trace metal concentrations (mg/kg).
Table 5: Estimation of the theoretical total reduction capacity and dichromate COD test results (units: meq/g).
Table 6: Description of aquifer material sub-samples used in the air- drying investigation.
Table 7: Properties and characteristics of potassium permanganate (after Siegrist et al., 2001; Hood, 2000)
Table 8: Experimental details of long-term permanganate NOD
Table 9: Estimated permanganate consumption rate (g-KMnO4/kg/day).
Table 10: Best-fitting parameters (kox and COAM for fast reaction, kox for slow reaction, and reduction factor) and other parameters of the long-term NOD kinetic model.
Table 11: Summary of the maximum permanganate consumption as estimated from theoretical considerations of the reductive capacity of various aquifer species, the dichromate and permanganate chemical oxygen demand tests, and from the long-term permanganate NOD batch tests. All values are expressed in terms of g of KMnO4 per kg of dry aquifer material.
Table 12: Experimental details for the excess aquifer material mass kinetic experiments.
Table 13: Experimental details for the excess permanganate mass kinetic experiments.
Table 14: Observed reaction rate coefficients and reaction order for the excess aquifer material mass kinetic experiments.
Table 15: Observed reaction rate coefficients for excess permanganate mass kinetic experiments.
Table 16: Reaction rate coefficients with respect to OAM and permanganate.
Table 17: Summary of column experiments.
Table 18: Characteristic BTC values for the Borden, LC34-LSU, and LC34-USU aquifer material column experiments.
Table 19: Characteristic BTC values for the EGDY and NFF aquifer material column experiments.
Table 20: Characteristic BTC values for the MAAP aquifer material column.
Table 21: NOD (g/kg) estimated from the permanganate BTCs using Eq. (36). The NOD projected was estimated by extrapolating the rate of slow permanganate consumption until it intersected C/Co = 1.
Table 22: Overall permanganate consumption (NOD) rates.
Table 23: Observed hydrogen peroxide reaction rate coefficients in the presence of autoclaved and non-autoclaved aquifer material (15 g solids, 80 mL of 2.0% H2O2 solution with an initial pH of 3.0).
v
LIST of TABLES (con’t)
Table 24: Multiple linear regression equations for the observed hydrogen peroxide reaction rate coefficient (1/hr) as a function of various aquifer material characteristics. All regression coefficients are statistically significant at the 5% LOS.
Table 25: First-order reaction rate coefficients (1/hour) for hydrogen peroxide decomposition in batch experiments.
Table 26: Summary of flow rates (mL/min) used for the hydrogen peroxide column trials.
Table 27: First appearance (in pore volumes) of the bromide tracer and hydrogen peroxide in the column effluent as defined by a detectable concentration in the effluent (0.05% for hydrogen peroxide, and 1.2 mg/L for Br).
Table 28: Observations from the MAAP column experiments with a flow rate of 0.22 mL/min. The effluent pH, dissolved total Fe, and dissolved total Mn were measured after the hydrogen peroxide concentration in the effluent reached a stable value.
Table 29: Observed reaction rate coefficients from selected batch and column experimental systems. (Note: the normalized decomposition rate coefficients are obtained by dividing the corresponding rate coefficients by the aquifer material mass loaded in columns and batch reactors).
Table 30: First-order reaction rate coefficients and half-lives derived from batch reactor and column data.
Table A-1: Results from air drying investigation.
vi

LIST of FIGURES Figure 1: Theoretical estimation of the total reductive capacity using: (a) total organic carbon and the
total Fe, Mn, and S; (b) total organic carbon, total Fe and Mn; (c) total organic carbon, amorphous Fe and Mn; and (d) total organic carbon and the ferrous Fe or total Fe.
Figure 2: Theoretical total reductive capacity (TRC) and dichromate COD test results.
Figure 3: Scatter plot of theoretical total reductive capacity (TRC), dichromate COD, and total organic carbon. The TRC value for the DNTS aquifer material is excluded.
Figure 4: Anaerobic setup for drying aquifer materials.
Figure 5: Average reductive capacity results from the air-drying investigation (a) dichromate-COD data, (b) permanganate-COD data, and (c) 7-day permanganate NOD data.
Figure 6: Pore-scale conceptual model for NOD showing the possibility of reaction with reduced aquifer solid species, reaction with dissolved DNAPLs, and transport of un-reacted MnO4
-. Reduced species include: (a) pyrite and organic matter coatings on grains, (b) reduced minerals such as magnetite and reduced carbonaceous matter such as charcoal, (c) dissolved and non-aqueous phase oil (DNAPL), and (d) organic matter and disseminated pyrite entrained within carbonate grains and lithic fragments (Adapted from Mumford et al., 2005).
Figure 7: Long-term permanganate NOD profiles for each experimental series performed on the eight aquifer materials used in this investigation. Each data point represents the average from triplicate reactors. The legend for each profile indicates the oxidant to solids mass ratio and initial permanganate concentration used for each experimental series. Also noted on each panel is reactor spiking events. Error bars are not shown to avoid confusion.
Figure 8: Scatter plot of the fast rate of permanganate consumption and the oxidant to solids mass ratio for each experimental series. The NOD expressed over the first 7 days was used to estimate the fast rate of permanganate consumption.
Figure 9: NODmax and the 7-day NOD as functions of the oxidant to solids mass ratio for (a) LC34-LSU and (b) LC34-USU aquifer materials at an initial permanganate concentration of 12.7 g/L. The dashed lines are extrapolations of the linear relationship (r2 > 0.90) to oxidant to solids mass ratio values representative of in situ conditions.
Figure 10: The impact of different initial permanganate concentrations on the average observed NODmax.
Figure 11: Scatter plot of the 7-day NOD and NODmax data for all experimental sites.
Figure 12: Observed maximum NOD and NOD at 7 days. The number above the bar indicates the ratio of the 7-day NOD value to the maximum NOD value.
Figure 13: Reduction in COD test values after aquifer materials exposed to permanganate for Borden, DNTS, LC34-LSU, LC34-USU, MAAP, and NIROP aquifer materials compared with observed NODmax for each experimental series.
Figure 14: Best-fit logarithm functions to normalization NOD profiles for (a) DNTS and (b) LC34-USU aquifer materials.
Figure 15: Scatter plot of NODmax and the equivalent NOD based on the bulk soil manganese concentration after exposure to permanganate for >250 days.
vii
LIST of FIGURES (con’t)
Figure 16: The observed and simulated NOD profiles for batch experiments with the Borden, DNTS, EGDY, and MAAP aquifer materials.
Figure 17: The influence of the change of reduction factor kp on the simulated permanganate NOD profile. Square symbols represent the observed NOD values for the test with 20 g Borden aquifer material exposed to a KMnO4 solution with an initial concentration of 20 g/L.
Figure 18: Scatter plot of the dichromate and permanganate chemical oxygen demand test results (average of 5 trials), and the overall maximum permanganate NOD from the long-term batch tests for each aquifer material. All values expressed as g-KMnO4 /kg. Also shown are best-fit linear relationships for each COD test as described by (1) Overall maximum NOD = 0.64±0.14 x (dichromate COD value) – 1.15±3.14 with a r2 = 0.96 for the dichromate test; and (2) Overall maximum NOD = 1.10±0.10 x (permanganate COD value) – 0.83±1.29 with a r2 = 0.99 for the permanganate test.
Figure 19: Scatter plot of the results from the dichromate COD test, the permanganate COD test, the long-term batch test (overall maximum NOD) and the sum of the TOC and the amorphous Fe content of each aquifer material. All values expressed as g-KMnO4 /kg. Also shown are best-fit linear relationships as described by (1) Overall maximum NOD = 0.81 x TRC* – 2.8 with a r2 = 0.83 for the batch test; (2) dichromate COD = 1.3 x TRC* – 2.5 with a r2 = 0.86 for the dichromate COD test; and (3) permanganate COD = 0.73 x TRC* – 1.7 with a r2 = 0.82 for the permanganate COD test; where TRC* is the contribution from TOC and amorphous Fe expressed in g/kg (see Table 1-11).
Figure 20: Sensitivity of the permanganate COD test results due to changes in (a) reaction duration, (b) initial permanganate concentration, and (c) sample mass of aquifer material. All test values are expressed in terms of g of KMnO4 per kg of dry aquifer material. The error bars represent ± one standard deviation.
Figure 21: Permanganate concentration profiles generated from the excess aquifer material mass kinetic experiments. Each data point is the average from duplicate experiments.
Figure 22. OAM data generated from the excess permanganate mass kinetic experiments. Each data point is the average from all aquifer material masses used. Error bars represent ±1 standard deviation.
Figure 23: Scatter plots (a) the reaction order vs. TOC (r2 = 0.68), (b) koam vs. surface area (r2 = 0.63), and (c) koam vs. FeT (r2 = 0.54) and vs. FeT (r2 =0.62). −
4MnOk
Figure 24: Typical columns used in permanganate experiments. Each column has a length of 40 cm and an inner diameter of 3.81 cm, and is equipped with four equally spaced sampling ports along its length.
Figure 25: Permanganate and bromide breakthrough curves for: (a) and (b) Borden aquifer material, (c) and (d) LC34-LSU aquifer material, and (e) and (f) LC34-USU aquifer material.
Figure 26: Permanganate and bromide breakthrough curves for: (a) and (b) EGDY aquifer material, and (c) NFF aquifer material.
Figure 27: Permanganate and bromide breakthrough curves for MAAP aquifer material.
Figure 28: Permanganate NOD from batch and column systems. The column NOD was estimated by extrapolating the rate of slow permanganate consumption until the effluent permanganate BTC intersected C/Co = 1.
viii
LIST of FIGURES (con’t)
Figure 29: Scatter plot of the average 7-day NOD and the maximum 7-day NOD results from the batch tests and the NOD projected from the column experiments. Also shown are best fit linear relationships between the column NOD and the average 7-day NOD (r2 = 0.99) and the maximum 7-day NOD (r2 = 0.99).
Figure 30: Hydrogen peroxide decomposition profiles for non-autoclaved aquifer materials.
Figure 31: Hydrogen peroxide decomposition rate coefficients for autoclaved and non-autoclaved aquifer materials.
Figure 32: Total Fe and Mn dissolved concentrations in batch reactors within the first hour.
Figure 33: Dichromate COD test results for selected aquifer materials prior and after exposure to hydrogen peroxide for two-weeks. The error bars represented ± one standard deviation.
Figure 34: Results of correlation analysis of the hydrogen peroxide decomposition rate coefficients in the presence of non-autoclaved aquifer materials with an initial hydrogen peroxide concentration of 2% and a pH of 3.0. Data for the aquifer materials from NIROP, NFF, and MAAP are excluded from this analysis.
Figure 35: Molecular structure and acidity constants for ethylenediaminetetraacetic acid (EDTA) and ethylenediaminedisuccinic acid (EDDS) (25oC) (adapted from Vandevivere et al., 2001)
Figure 36: Hydrogen peroxide profiles in the presence of (a) DNTS aquifer materials, (b) EGDY aquifer materials, (c) LC34-USU aquifer materials, (d) MAAP aquifer materials, and (e) NIROP aquifer materials. Each data point is the average from triplicate experiments. EDDS was added at 0.5 mmol EDDS per kg of solids, EDTA was added at 1.0 mmol per kg of solids, and ferrous iron was added at a weight ratio of 0.02 (Fe2+/H2O2).
Figure 37: Observed reaction rate coefficients in the presence of aquifer materials for Experimental Series 1, 4, 6 and 7. EDDS was added at 0.5 mmol EDDS per kg of solids, and ferrous iron was added at a weight ratio of 0.02 (Fe2+/H2O2).
Figure 38: Total Fe and Mn dissolved concentrations from Experimental Series 1 and 2. EDTA was added at 1.0 mmol EDTA per kg of solids. Samples were taken within the first hour.
Figure 39: Typical setup for hydrogen peroxide column experiments.
Figure 40: Hydrogen peroxide and bromide breakthrough curves for the column trials performed: (a) and (b) high and low flow rate for the LC34-LSU aquifer material, (c) and (d) high and low flow rate for the LC34-USU aquifer material, (e) and (f) high and low flow rate for the MAAP aquifer material. Also shown in (f) are results from the additional MAAP aquifer material column experiments where the column was first flushed with a H2SO4 solution (pH = 3.0) for two hours prior to a solution of hydrogen peroxide.
Figure 41: Calculated and observed hydrogen peroxide breakthrough curves for columns: (a) without and (b) with EDDS application for the LC34-LSU aquifer material, (c) without and (d) with EDDS application for the LC34-USU aquifer material, (e) without and (f) with EDDS application for the MAAP aquifer material.
Figure 42: Temporal persulfate concentration profiles in the presence of the seven aquifer materials. Each data point represents the average from triplicate reactors. Also shown is the average concentration profile from the control reactor.
ix

LIST of FIGURES (con’t)
Figure 43: The temporal pH profile as observed in the various batch reactor systems.
Figure 44: Pre- and post-oxidant dichromate COD test results for the batch reactors systems.
Figure 45: Total dissolved (a) iron, Fe; (b) manganese, Mn; and (c) organic carbon, DOC concentrations from the batch reactor systems before and after exposure to persulfate for ~80 days.
Figure 46: Persulfate breakthrough curves for LAAP and NIROP aquifer materials.
Figure 47: Normalized persulfate temporal profiles from the stop-flow column experiments.
Figure 48: Column and batch reactor persulfate reaction rate coefficients.
Figure 49: Reaction rate coefficients from the column and batch reactors experiments as a function of the oxidant to aquifer material mass ratio. The batch reactor systems had a mass ratio of ~10, while the column systems had a mass ratio between 2 and 3.
Figure 50: COD test results of aquifer material sub-samples collected along the length of the stop-flow columns (top, 0 cm; middle, 20 cm; and bottom, 40 cm). Also shown are the COD test results prior to persulfate exposure.
Figure A-1: Grain size distribution for the Borden and DNTS aquifer materials.
Figure A-2: Grain size distribution for the EGDY and LAAP aquifer materials.
Figure A-3: Grain size distribution for the LC34-LSU and LC34-USU aquifer materials.
Figure A-4: Grain size distribution for the MAAP, NFF, and NIROP aquifer materials. Figure A-5: XRD trace for the DNTS aquifer material.
Figure A-6: XRD trace for the LAAP aquifer material Figure A-7: XRD trace for the LC34-LSU aquifer material.
Figure A-8: XRD trace for the LC34-USU aquifer material.
Figure A-9: XRD trace for the MAAP aquifer material.
Figure A-10: XRD trace for the NFF aquifer material.
Figure A-11: XRD trace for the NIROP aquifer material.
x
LIST of ACRONYMS
AOM Aquifer Organic Material ASTM American Standard for Testing and Materials
BTC breakthrough curve
oC degrees Celcius CEC Cation Exchange Capacity CFB Canadian Forces Base COD chemical oxygen demand DCOD dichromate chemical oxygen demand DNAPL dense non-aqueous phase liquid DNTS Dover National Test Site DOC dissolved organic carbon DoD Department of Defense DoE Department of Energy EDDS S,S’-ethylenediaminedisuccinate EDTA ethylenediaminetetraacetic acid EGDY East Gate Disposal Yard g gram g/cm3 gram per cubic centimeter g/g gram per gram g/kg gram per kilogram g/mL gram per milliliter g/mol gram per mole g/L gram per liter HEIDA hydroxyethliminodiacetic H2O2 hydrogen peroxide HDPE high density polyethylene ICP inductively coupled plasma INAA Instrumental Neutron Activation Analysis ISCO in situ chemical oxidation k' first order rate constant k'' second order rate constant K potassium kg kilogram kg/m3 kilogram per cubic meter KHP potassium hydrogen phthalate L liter LAAP Longhorn Army Ammunitions Plant LC34 Launch Complex 34 LSU lower sand unit m meter M mole MAAP Milan Army Ammunitions Plant MDL method detection limit meq/g milliequivalents per gram
xi
xii
mg/g milligram per gram mL milliliter µm micrometer mm millimetre mM millimole per liter mmol millimole mmol/kg millimole per kilogram mmol/L millimole per liter MnO2 manganese dioxide MnO4
- permanganate NFF NAS-Dallas Naval Air Station Dallas NIROP Naval Industrial Reserve Ordinance Plant nm nanometer NOD natural oxidant demand NOM natural organic matter NRC natural reductive capacity NTA nitrilotriacetic acid OAM oxidizable aquifer matter PV pore volume SERDP Strategic Environmental Research and Development Program SOD soil oxidant demand TC total carbon TOC total organic carbon TRC total reductive capacity USU upper sand unit XRD X-ray diffraction V volt
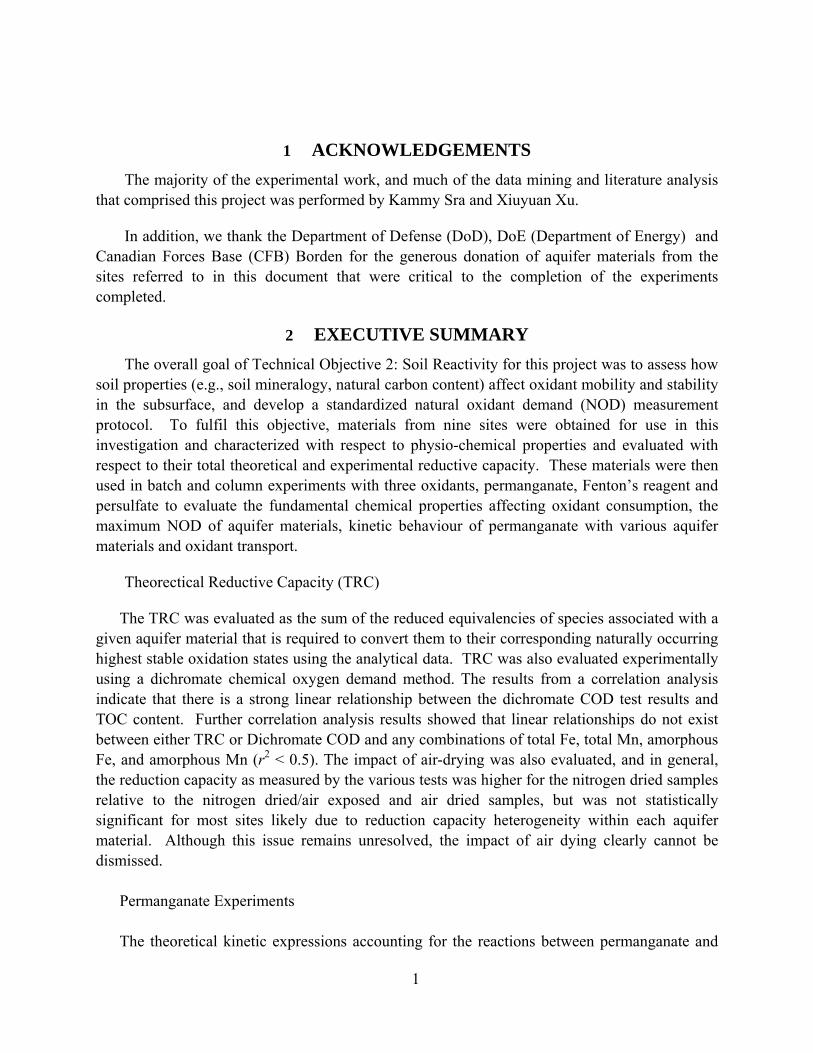
1 ACKNOWLEDGEMENTS
The majority of the experimental work, and much of the data mining and literature analysis that comprised this project was performed by Kammy Sra and Xiuyuan Xu.
In addition, we thank the Department of Defense (DoD), DoE (Department of Energy) and Canadian Forces Base (CFB) Borden for the generous donation of aquifer materials from the sites referred to in this document that were critical to the completion of the experiments completed.
2 EXECUTIVE SUMMARY The overall goal of Technical Objective 2: Soil Reactivity for this project was to assess how
soil properties (e.g., soil mineralogy, natural carbon content) affect oxidant mobility and stability in the subsurface, and develop a standardized natural oxidant demand (NOD) measurement protocol. To fulfil this objective, materials from nine sites were obtained for use in this investigation and characterized with respect to physio-chemical properties and evaluated with respect to their total theoretical and experimental reductive capacity. These materials were then used in batch and column experiments with three oxidants, permanganate, Fenton’s reagent and persulfate to evaluate the fundamental chemical properties affecting oxidant consumption, the maximum NOD of aquifer materials, kinetic behaviour of permanganate with various aquifer materials and oxidant transport.
Theorectical Reductive Capacity (TRC)
The TRC was evaluated as the sum of the reduced equivalencies of species associated with a given aquifer material that is required to convert them to their corresponding naturally occurring highest stable oxidation states using the analytical data. TRC was also evaluated experimentally using a dichromate chemical oxygen demand method. The results from a correlation analysis indicate that there is a strong linear relationship between the dichromate COD test results and TOC content. Further correlation analysis results showed that linear relationships do not exist between either TRC or Dichromate COD and any combinations of total Fe, total Mn, amorphous Fe, and amorphous Mn (r2 < 0.5). The impact of air-drying was also evaluated, and in general, the reduction capacity as measured by the various tests was higher for the nitrogen dried samples relative to the nitrogen dried/air exposed and air dried samples, but was not statistically significant for most sites likely due to reduction capacity heterogeneity within each aquifer material. Although this issue remains unresolved, the impact of air dying clearly cannot be dismissed.
Permanganate Experiments The theoretical kinetic expressions accounting for the reactions between permanganate and
1

aquifer materials were derived, indicating that the influencing factors should at least include permanganate concentration, the composition of components in aquifer materials, and their chemical properties. Three series of experiments (long-term batch tests, short-term batch tests, and column tests) were designed and performed to investigate permanganate behaviour in the presence of aquifer materials.
Long-term batch tests were used to evaluate long-term permanganate NOD kinetic
behaviour. This investigation indicated that the rate of permanganate consumption (i.e., the overall reaction rate) is strongly affected by the oxidant to solids mass loading ratio, and the initial permanganate concentration. In addition, it appears that TOC content determines the maximum NOD value while amorphous Fe content, along with CEC, determines the permanganate consumption rate by aquifer materials.
The first principles and experimental data suggest that the permanganate consumption by aquifer materials is at least consisted of a fast and a slow reaction, accordingly, a conceptual kinetic model accounting of these two reactions was developed to kinetically capture the permanganate NOD profiles observed from long-term experiments. Meanwhile, empirical expression of long-term permanganate NOD (at an initial KMnO4 concentration of 20 g/L) in terms of aquifer materials was also developed, which is expected to provide a guideline for developing NOD empirical expressions under other initial permanganate concentrations.
The result suggests that variations in experimental design will impact reported NOD values, and the kinetic nature of NOD reaction(s) cannot be ignored. Batch experimental determination of a temporal NOD should employ the expected permanganate concentration to be used in situ along with various permanganate to solid mass ratios. Assuming the same controlling factors also affect the oxidant stability in situ, the estimation of in situ permanganate NOD can then be obtained by linear extrapolation.
Short term batch tests were designed to parallel the dichromate COD test for aquifer solids,
but used permanganate in place of dichromate in a modified COD test to determine the maximum NOD of an aquifer material quickly and economically. This proposed test method was used in a comparative study that involved eight different aquifer materials. The results showed that the proposed test method is superior to the dichromate COD test and can be used to directly estimate the maximum NOD for site screening and initial design purposes.
The results from permanganate column experiments suggest that there exist at least three
kinetic regions controlling permanganate consumption by aquifer materials: a very fast reaction, an intermediate reaction(s), and a slow reaction. We believe that different reactive species in the aquifer materials are responsible for these three reactions: (1) the fast reaction may be controlled by labile organic species (possibly as dissolvable organic matter) and easily dissolved reduced metals (e.g., Fe, Mn, and S) loosely attached on the grain surfaces, (2) the intermediate reaction(s) may be controlled by organic species and inorganic compounds containing reduced metal (e.g., Fe, Mn, and S) bound on the grain surface, and (3) the slow reaction is associated
2

with slowly reacting organic matter on grain surfaces, or organic matter and minerals containing reduced iron and manganese internal to the grains.
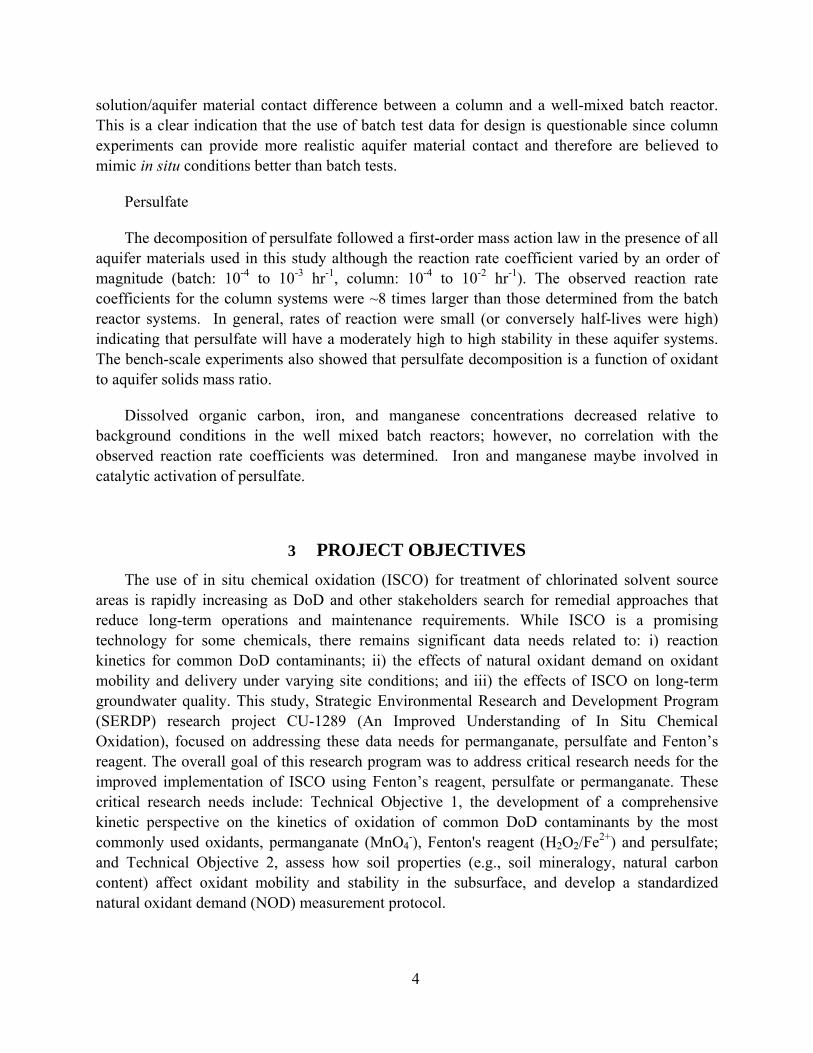
Permanganate consumption in these column experiments display some similar traits as we observed in the batch tests (e.g., sensitivity to concentration, and contact time), therefore, the prediction of permanganate consumption has been successfully realized based on the permanganate consumption in the batch systems as well as based on the permanganate COD test. However, permanganate NOD values estimated from the column trials are generally considerably less than those measured from the batch experiments. This difference is mainly ascribed to the solution/aquifer material contact differences between a column and a well-mixed batch reactor, and illustrates that results from well-mixed batch tests should be used with caution.
Finally, the column results indicated that >60% of the permanganate consumption occurred during the first flush suggesting that there may be an optimal approach to control the unproductive consumption of permanganate by aquifer materials through multiple-oxidant injection episodes.
Hydrogen Peroxide Experiments A series of bench-scale batch and column experiments designed to investigate hydrogen
peroxide fate in the subsurface environment were completed. In addition to evaluating decomposition rate coefficients for various aquifer materials, the impact of chelating reagents to enhance the stability of hydrogen peroxide was also evaluated and a mathematical model was developed to capture hydrogen peroxide decomposition.
The investigation of the enhanced stability of hydrogen peroxide in batch and column tests demonstrated that the addition of ferrous iron generated the largest hydrogen peroxide decomposition rate coefficients, while the presence of a chelating agent (EDDS or EDTA) generated the lowest hydrogen peroxide decomposition rate coefficients. The use of EDDS as a green chelating agent appears to be promising for in situ applications involving the injection of hydrogen peroxide.
The transport of transition metals (Fe and Mn) associated with the application of hydrogen peroxide, especially when an acid flush was conducted prior to hydrogen peroxide, was observed in this investigation. Since Fe and Mn can promote the decomposition of hydrogen peroxide depending on their form (e.g., solid and soluble) and their content within the system, this transport of dissolved metals (Fe and Mn) is expected to affect the behavior of hydrogen peroxide within the subsurface environment.
When a chelating reagent (i.e., EDDS) was used, a relationship related to the hydrogen peroxide decomposition rate coefficient obtained from column systems to batch system data was developed. The hydrogen peroxide decomposition rate coefficients generated from the column data are significantly higher than those generated from the batch test data due to the
3
solution/aquifer material contact difference between a column and a well-mixed batch reactor. This is a clear indication that the use of batch test data for design is questionable since column experiments can provide more realistic aquifer material contact and therefore are believed to mimic in situ conditions better than batch tests.
Persulfate
The decomposition of persulfate followed a first-order mass action law in the presence of all aquifer materials used in this study although the reaction rate coefficient varied by an order of magnitude (batch: 10-4 to 10-3 hr-1, column: 10-4 to 10-2 hr-1). The observed reaction rate coefficients for the column systems were ~8 times larger than those determined from the batch reactor systems. In general, rates of reaction were small (or conversely half-lives were high) indicating that persulfate will have a moderately high to high stability in these aquifer systems. The bench-scale experiments also showed that persulfate decomposition is a function of oxidant to aquifer solids mass ratio.
Dissolved organic carbon, iron, and manganese concentrations decreased relative to background conditions in the well mixed batch reactors; however, no correlation with the observed reaction rate coefficients was determined. Iron and manganese maybe involved in catalytic activation of persulfate.
3 PROJECT OBJECTIVES The use of in situ chemical oxidation (ISCO) for treatment of chlorinated solvent source
areas is rapidly increasing as DoD and other stakeholders search for remedial approaches that reduce long-term operations and maintenance requirements. While ISCO is a promising technology for some chemicals, there remains significant data needs related to: i) reaction kinetics for common DoD contaminants; ii) the effects of natural oxidant demand on oxidant mobility and delivery under varying site conditions; and iii) the effects of ISCO on long-term groundwater quality. This study, Strategic Environmental Research and Development Program (SERDP) research project CU-1289 (An Improved Understanding of In Situ Chemical Oxidation), focused on addressing these data needs for permanganate, persulfate and Fenton’s reagent. The overall goal of this research program was to address critical research needs for the improved implementation of ISCO using Fenton’s reagent, persulfate or permanganate. These critical research needs include: Technical Objective 1, the development of a comprehensive kinetic perspective on the kinetics of oxidation of common DoD contaminants by the most commonly used oxidants, permanganate (MnO4
-), Fenton's reagent (H2O2/Fe2+) and persulfate; and Technical Objective 2, assess how soil properties (e.g., soil mineralogy, natural carbon content) affect oxidant mobility and stability in the subsurface, and develop a standardized natural oxidant demand (NOD) measurement protocol.
4
This project report is divided into two Final Reports that address each of these critical research needs: Contaminant Oxidation Kinetics and Soil Reactivity. This Final Report addresses Soil Reactivity and was completed by the University of Waterloo. The Final Report for Contaminant Oxidation Kinetics was completed by the Oregon Health and Sciences University. These reports build upon the research results previously presented in this project’s 2003 and 2004 Annual Reports submitted to SERDP (Geosyntec, OHSU, and UW, 2003 and 2005).
3.1 Document Organization
The major sections of this report and their contents are listed below.
• Section 4 – Aquifer Materials, TRC and COD Tests – the collection, handling and characterization of the aquifer materials is described, including a discussion of the total reductive capacity (TRC) and chemical oxidant demand (COD) of the aquifer materials;
• Section 5 – Permanganate – the interaction of permanganate with aquifer materials is discussed. A background discussion and theoretical kinetic expressions are presented. The methods, results and discussion of batch and column experiments designed to evaluate the fundamental chemical properties affecting permanganate consumption, the maximum NOD of aquifer materials, kinetic behaviour of permanganate with various aquifer materials and permanganate transport are included in this Section;
• Section 6 – Fenton’s Reagent – the interaction of Fenton’s Reagent with aquifer materials is discussed. A background discussion on relevant hydrogen peroxide reactions, applications in groundwater remediation and decomposition in the subsurface is presented.. The methods, results and discussion of batch and column experiments designed to evaluate the fundamental chemical properties affecting hydrogen peroxide behaviour in the presence of aquifer materials are included in this Section. In addition, the impact of chelating reagents on the oxidant stability is evaluated and the development of a mathematical model to capture hydrogen peroxide decomposition is described;
• Section 7 – Persulfate - the interaction of persulfate with aquifer materials is discussed. A background discussion of persulfate’s use in groundwater remediation is presented. The methods, results and discussion of batch and stop-flow column experiments designed to evaluate the fundamental chemical properties affecting persulfate consumption and kinetic behaviour of persulfate with various aquifer materials and persulfate transport are included in this Section.
5

4 AQUIFER MATERIALS, TRC, AND COD TESTS This section describes the collection, handling, and characterization of the aquifer materials
that were used in this research effort. Based on the physico-chemical properties of these aquifer materials, the theoretical TRC of each aquifer material was estimated and compared with the results from the dichromate COD test.
4.1 Collection and Handling of Aquifer Materials
Wet uncontaminated aquifer material samples from nine sites were obtained for use in this investigation (see Table 1 for site information, soil texture, and a general description of the depositional environment). All of these sites are DoD and/or DoE sites throughout the United Sates except for Borden Canadian Forces Base (CFB) in Canada. Sites were selected based on: (1) the nature of the hydrostratigraphic units present and their suitability to the application of ISCO treatment technology if contaminated, (2) the availability of some basic geochemical information, and (3) the ability to coordinate our sample collection requirements with ongoing drilling activities at each site.
At least 50 kg of wet material was received from each site except for NAS-Dallas where around 10 kg of wet material was received in core tube liners (2-1.0 m long, 0.05 m diameter). Material was collected in the field in 2-19 L (5 US Gallon) buckets, except for the Borden aquifer material which was collected in aluminum core tubes (8-1.5 m long, 0.05 m diameter). Additional aquifer material from both DNTS (5-0.40 m long, 0.09 m diameter) and LAAP (5- 0.45 m long, 0.1 m diameter) was collected in core tube liners. The small mass of NAS-Dallas material limited its utility to those aspects of this investigation that required a minimal mass of aquifer material (i.e., the chemical oxygen demand test). All aquifer material was collected from unconsolidated deposits, with material obtained from seashore erosional deposits, alluvial deposits, fluvial deposits, a prograded beach environment, and a glacial drift deposit. The groundwater redox potential indicated that the aquifer material from LC34-USU, LC34-LSU, DNTS, and MAPP may have been anaerobic; however, only material from DNTS was collected in intact core tube liners in an effort to maintain the original redox state of the aquifer solids. All aquifer materials were stored at 4oC. In addition, where possible, a visual inspection of the aquifer material was immediately conducted after it was received at the University of Waterloo and variations in soil color, stratification details, and anomalies were noted. Based on a visual inspection and grain size data, all aquifer material collected for this investigation was predominantly sand; however, aquifer material from EGDY had large cobbles, material from NIROP contained gravel, and the LAAP material had a significant clay fraction.
6

Table 1: General site information where aquifer material was collected for use in this study.
No. Sample ID Sample Location Soil Texture Depositional Environment
Depth toWater(ft bgs)
K(ft/day)
Sample Depth(ft bgs)
1 Borden Groundwater Field Laboratory,CFB Borden, Ontario fine/medium sand
Late Wisconsinian Period/ deposited in aprograded beach environment/
glaciolacustrine sand/ unconfined aquifer~3 ~3 10-15
2 DNTS National Test Site, Dover AFB,DE sandy loam
Colimbia formation from fluvial deposits;Pleistocene
~20 ~2.8 30-42
3 EGDY East Gate Disposal Yard, FortLewis, WA
loamy sand,gravel, cobbles
Vashon glacial drift deposit/ recessionaloutwash
~18 16-1141 18-25
4 LAAPSite 16 Landfill, Longhorn Army
Ammunition Plant, TXclay loam
Wilcox Group: quaternary alluviummantling & tertiary age formations -generally unconsolidated sediments
~18 2 13-28
5 LC34 LSU Launch Complex 34, CapeCanaveral AFS, FL
loamy coarse/medium sand
Pleistocene and recent seashore erosionaldeposits
~6 1.3-6.4 32-45
6 LC34 USU Launch Complex 34, CapeCanaveral AFS, FL
loamy coarse /medium sand
Pleistocene and recent seashore erosionaldeposits
~6 1.3-6.4 10-27
7 MAAP Milan Army Ammunition Plant,TN sand
Tertiary age sands of Clairborne group(Memphis sand) silt and clay layers insand may be carbonaceous and lignitic
~ 1 ~ 163 46 - 68
8 NIROP NIROP, Bacchus Works Facility,Utah gravels, loam
Harkers formation; Alluvial deposit fromquaternary age
~40 2-238 170-180
9 NFF NFF, Cecil Field, Florida loamy fine sand
Post-Miocene, likely Pliocene toPleistocene; long-transport fluvialdeposits which have experiencedextensive erosion and reworking
~ ~3 24-36
10 NAS NAS Dallas, TX silty loam Information Not Available ~ ~ ~
The first four aquifer materials received at the University of Waterloo (LC34-USU, LC34-LSU, EGDY, and NIROP) were completely air-dried at 80oC in an incubator oven (Gallenkamp, 1H-100) to constant weight, and then allowed to cool to room temperature. Aquifer material from the remaining six sites were not immediately air-dried, but were used in a limited investigation focusing on the impact of air-drying on the reductive capacity of these aquifer materials (see Section 4.7). In response to the findings from this air-drying investigation, aquifer materials from these six remaining sites were also air-dried at 80oC in the incubator oven to constant weight. After air-drying and cooling to room temperature, each aquifer material was homogenized in large sterilized tubs by gently mixing by hand. Care was taken to avoid excess abrasion that may have led to grinding or pulverizing of soil particles. The use of a riffle box for this purpose was explored and deemed to be unsuitable. After mixing, the material was transferred to high density polyethylene (HDPE) bags (Cole-Parmer, 60104), sealed and stored at 4oC. As required during this investigation, sub-samples were selected at random from re-mixed stored material and air dried at 80oC to a constant mass again prior to use.
Due to the handling difficulty with the large size (>2 mm) aquifer materials, only material passing though the No.10 U.S. Standard mesh sieve (2.00 mm) was used primarily throughout this research. However, for aquifer materials with a significant large size (>2 mm) fraction (>10% by weight), separate experiments were performed to quantify permanganate consumption of these materials. Based on this additional experimentation (not reported in this report) the NOD for aquifer material >2 mm was determined to be insignificance relative to the NOD of the aquifer material <2 mm. As a consequence, the permanganate demand results reported in this
7

report should be scaled by the mass fraction of the aquifer material <2 mm (Table 3) to yield an in situ estimate.
4.2 Sample Characterization
An overall description for the sample characterization performed and methods used is listed in Table 2.
PropertiTable 2: Summary of characterization methods.
es Reference
ASTM (1990)
Ball et al. (1990)ASTM (1990)
-
ASTM (1990)
Rhoades (1982)
Amorphous iron andmanganese Jackson et al. (1986)
Total Fe
Fe(II) as FeO
Total Mn
Other trace metals Hoffman (1992)
Total S www.actlabs.com
Total organic carbonChurcher and Dickhout(1987)
Total Carbon www.actlabs.com
Items
Complete combusion of samplesperformed by UofW
Specific gravitySpecific surface area
Selective dissolution analysis method
MethodsASTM method D422-63 with a 152-hydrometerNitrogen multipoint BET analysisASTM method D854-92
Simens D500 difractometer
ASTM method D4972-01Performed by U. of G. using Bariumchloride method
www.actlabs.com
Physical
Chemical
XRD Mineral analysis
Soil pHCation exchangecapacity
Grain size analysis
The infrared method performed byACTlab, Ancaster, ON
The infrared method performed byACTlab, Ancaster, ON
INAA performed by ACTlab, Ancaster, ONTitration with cold acid digestionperformed by ACTlab, Ancaster, ONPerkin Elmer Optima 3000 ICP byACTlab, Ancaster, ONInstrumental Neutron Activation Analysis(INAA)
The grain size distribution was determined by ASTM Method D422-63 with a 152 hydrometer (Appendix A1). Specific gravity was characterized by ASTM Method D854-92. Entrapped air was removed by a vacuum system that was operated for >6 hours and pycnometers were filled with degassed water. Surface area was estimated by Porous Material Inc., Ithaca NY using a nitrogen multipoint BET analysis (Ball et al., 1990). The total organic carbon (TOC) analyses were performed at the University of Waterloo using the method developed by Churcher and Dickhout (1987). Cation Exchange Capacity (CEC) analyses were performed by the University of Guelph using Barium chloride method (Rhoades, 1982). X-ray diffraction (XRD) mineralogical analyses were performed on ground material at the University of Waterloo using an aluminum random powder mount and a Siemens D500 difractometer. Mineral phases were
8
assigned based on comparison of spectra to standards from the International Center for Diffraction Data. This method has a quantification level of 5%.
The analyses of total carbon (TC) and total sulfur were preformed by Activation Laboratories Ltd., Ancaster, ON, Canada with LECO combustion using an infrared spectrometry method with a method detection limit (MDL) of 0.1 mg/g.
All metal analyses were also conducted by Activation Laboratories Ltd., Ancaster, ON. Fe(II), one of the most common reduced metals in aquifer solids, was expressed as FeO, which was determined through titration, using a cold acid digestion of ammonium metavanadate, sulphuric acid and hydrofluoric acid in an open system with a MDL of 78 mg/g (Wilson, 1955). In this method, ferrous ammonium sulphate was added after digestion and potassium dichromate was used as the titrating agent. Total Mn was determined by digesting a 0.25 g sample with four acids beginning with hydrofluoric, followed by a mixture of nitric and perchloric acids. This sequence uses precise heat ramping and holding cycles which takes the sample to dryness. After dryness is attained, samples are brought back into solution using hydrochloric acid. Samples are analyzed using a Perkin Elmer Optima 3000 ICP with a MDL of 1 mg/g. All other reported trace metals were determined by the Instrumental Neutron Activation Analysis (INAA) analytical technique. This technique is dependent on measuring gamma radiation induced in the sample by irradiation with neutrons. The primary source of neutrons for irradiation is usually a nuclear reactor. Each element which is activated emits a “fingerprint” of gamma radiation which can be measured and quantified. Further details are provided by Hoffman (1992).
The results of this sample characterization effort are presented in Table 3 and Table 4. The XRD mineral analyses are presented in Appendix A2.
4.3 Reductive Capabilities of Aquifer Materials
The introduction of a strong chemical oxidant that occurs during ISCO treatment will obviously impacts the naturally-occurring multivalent elements in their reduced states (Mumford, 2002; Siegrist et al., 2001) and lead to its unproductive consumption (for permanganate) or enhanced decomposition (for hydrogen peroxide). Theoretically, the reduced constituents commonly present in aquifer systems that may contribute to the consumption or enhanced decomposition of injected oxidants are organic matter, Fe(II)-contained minerals (e.g., micas, amphiboles, pyroxenes, pyrite and siderite), Mn(II, III)-contained minerals (e.g., rhodocrosite and hausmannite), S(-I, -II)-contained minerals (e.g., pyrite and mackinawite) and other trace metals such as As- and Cr(III)-contained minerals (Appelo and Pastma, 1996). However, in practice, only substrates containing Mn(II), Fe(II), and S(-I,-II), reduced forms of nitrogen (if they exist), and Aquifer Organic Materials (AOMs) are considered the predominant reductants in a natural aquifer while other reduced constituents are minimal (Hartog, 2003; Christensen et al., 2000; Korom et al., 1996; Appelo and Postma, 1996).
9
10
−e
−+ ++→+ eHsOHIIIFeOHIIFe 3)())((3)( 32
−+− ++→+− eHSOOHIIS 884)( 242
−+− ++→+− eHSOOHIS 784)( 242
−+−− ++→+ eHAsOOHAsO 242 3422
−+−+ ++→+ eHNOOHNH 8103 324
+ ++→+ HsMnOOHIIMn 24)(2)( 22
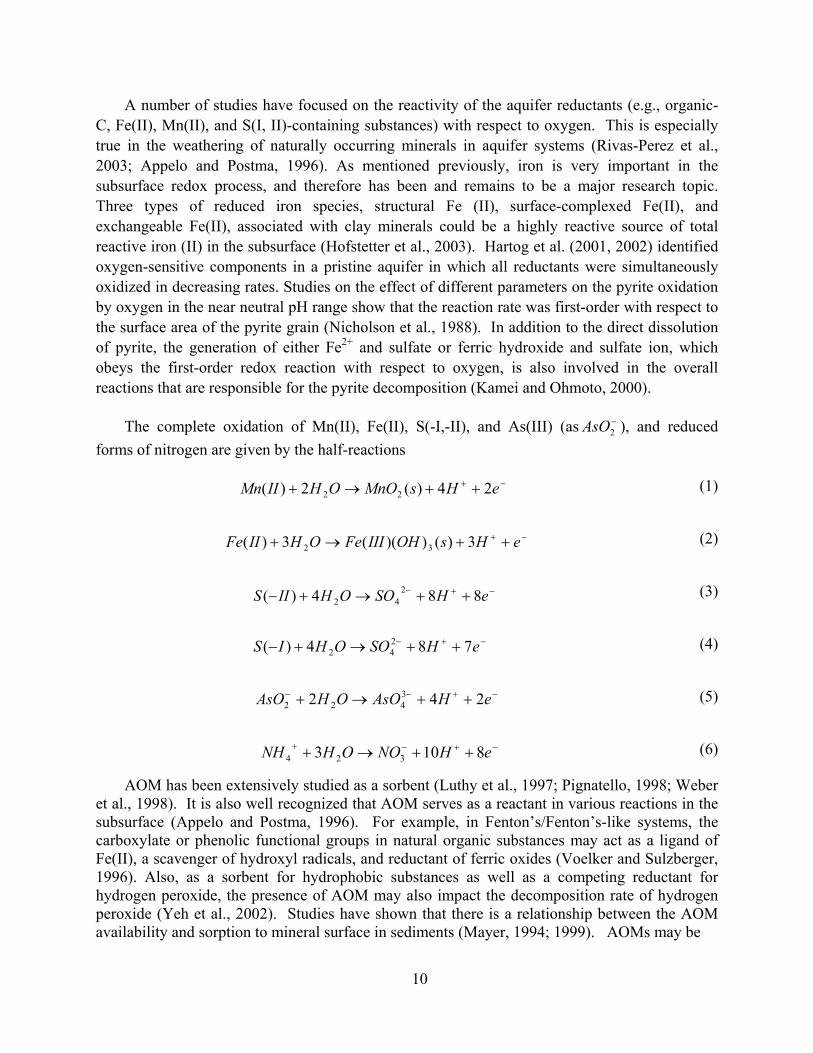
A number of studies have focused on the reactivity of the aquifer reductants (e.g., organic- C, Fe(II), Mn(II), and S(I, II)-containing substances) with respect to oxygen. This is especially true in the weathering of naturally occurring minerals in aquifer systems (Rivas-Perez et al., 2003; Appelo and Postma, 1996). As mentioned previously, iron is very important in the subsurface redox process, and therefore has been and remains to be a major research topic. Three types of reduced iron species, structural Fe (II), surface-complexed Fe(II), and exchangeable Fe(II), associated with clay minerals could be a highly reactive source of total reactive iron (II) in the subsurface (Hofstetter et al., 2003). Hartog et al. (2001, 2002) identified oxygen-sensitive components in a pristine aquifer in which all reductants were simultaneously oxidized in decreasing rates. Studies on the effect of different parameters on the pyrite oxidation by oxygen in the near neutral pH range show that the reaction rate was first-order with respect to the surface area of the pyrite grain (Nicholson et al., 1988). In addition to the direct dissolution of pyrite, the generation of either Fe2+ and sulfate or ferric hydroxide and sulfate ion, which obeys the first-order redox reaction with respect to oxygen, is also involved in the overall reactions that are responsible for the pyrite decomposition (Kamei and Ohmoto, 2000).
The complete oxidation of Mn(II), Fe(II), S(-I,-II), and As(III) (as ), and reduced forms of nitrogen are given by the half-reactions
−2AsO
(1)
(2)
(3)
(4)
(5)
(6)
AOM has been extensively studied as a sorbent (Luthy et al., 1997; Pignatello, 1998; Weber et al., 1998). It is also well recognized that AOM serves as a reactant in various reactions in the subsurface (Appelo and Postma, 1996). For example, in Fenton’s/Fenton’s-like systems, the carboxylate or phenolic functional groups in natural organic substances may act as a ligand of Fe(II), a scavenger of hydroxyl radicals, and reductant of ferric oxides (Voelker and Sulzberger, 1996). Also, as a sorbent for hydrophobic substances as well as a competing reductant for hydrogen peroxide, the presence of AOM may also impact the decomposition rate of hydrogen peroxide (Yeh et al., 2002). Studies have shown that there is a relationship between the AOM availability and sorption to mineral surface in sediments (Mayer, 1994; 1999). AOMs may be
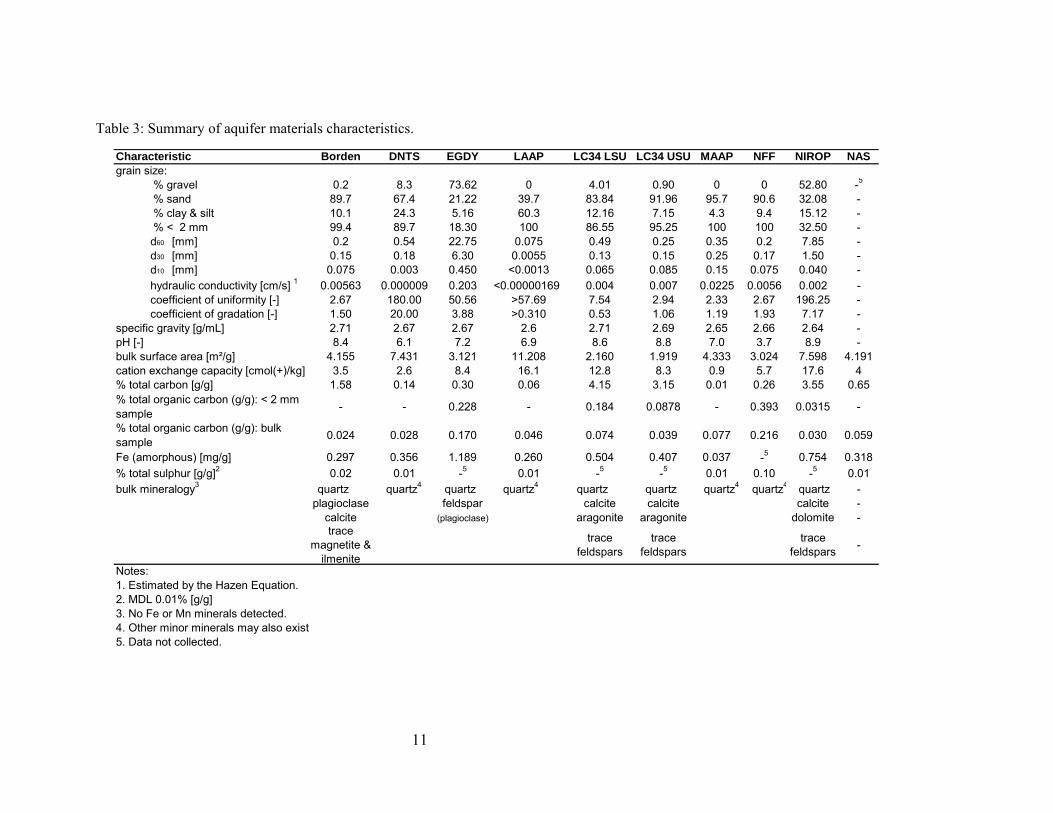
Table 3: Summary of aquifer materials characteristics.
Characteristic Borden DNTS EGDY LAAP LC34 LSU LC34 USU MAAP NFF NIROP NASgrain size: % gravel 0.2 8.3 73.62 0 4.01 0.90 0 0 52.80 -5
% sand 89.7 67.4 21.22 39.7 83.84 91.96 95.7 90.6 32.08 - % clay & silt 10.1 24.3 5.16 60.3 12.16 7.15 4.3 9.4 15.12 - % < 2 mm 99.4 89.7 18.30 100 86.55 95.25 100 100 32.50 - d60 [mm] 0.2 0.54 22.75 0.075 0.49 0.25 0.35 0.2 7.85 - d30 [mm] 0.15 0.18 6.30 0.0055 0.13 0.15 0.25 0.17 1.50 - d10 [mm] 0.075 0.003 0.450 <0.0013 0.065 0.085 0.15 0.075 0.040 - hydraulic conductivity [cm/s] 1 0.00563 0.000009 0.203 <0.00000169 0.004 0.007 0.0225 0.0056 0.002 - coefficient of uniformity [-] 2.67 180.00 50.56 >57.69 7.54 2.94 2.33 2.67 196.25 - coefficient of gradation [-] 1.50 20.00 3.88 >0.310 0.53 1.06 1.19 1.93 7.17 -specific gravity [g/mL] 2.71 2.67 2.67 2.6 2.71 2.69 2.65 2.66 2.64 -pH [-] 8.4 6.1 7.2 6.9 8.6 8.8 7.0 3.7 8.9 -bulk surface area [m²/g] 4.155 7.431 3.121 11.208 2.160 1.919 4.333 3.024 7.598 4.191cation exchange capacity [cmol(+)/kg] 3.5 2.6 8.4 16.1 12.8 8.3 0.9 5.7 17.6 4% total carbon [g/g] 1.58 0.14 0.30 0.06 4.15 3.15 0.01 0.26 3.55 0.65% total organic carbon (g/g): < 2 mmsample - - 0.228 - 0.184 0.0878 - 0.393 0.0315 -
% total organic carbon (g/g): bulksample 0.024 0.028 0.170 0.046 0.074 0.039 0.077 0.216 0.030 0.059
Fe (amorphous) [mg/g] 0.297 0.356 1.189 0.260 0.504 0.407 0.037 -5 0.754 0.318% total sulphur [g/g]2 0.02 0.01 -5 0.01 -5 -5 0.01 0.10 -5 0.01bulk mineralogy3 quartz quartz4 quartz quartz4 quartz quartz quartz4 quartz4 quartz -
plagioclase feldspar calcite calcite calcite -calcite (plagioclase) aragonite aragonite dolomite -trace
magnetite &ilmenite
tracefeldspars
tracefeldspars
tracefeldspars -
Notes:1. Estimated by the Hazen Equation.2. MDL 0.01% [g/g]3. No Fe or Mn minerals detected.4. Other minor minerals may also exist5. Data not collected.
11
MDL
12
ID Name Avg Std Dev Avg Std Dev Avg Std Dev Avg Std Dev Avg Std Dev Avg Std Dev Avg Std Dev Avg Std Dev Avg Std Dev Avg Std Devu Gold 0.002 <0.002 - <0.002 - <0.002 - 0.03 - <0.002 - <0.002 - <0.002 - <0.002 - 0.003 - <0.002 -g Silve
AA r 5 <5 - <5 - <5 - <5 - <5 - <5 - <5 - <5 - <5 - <5 -
s Arsenic 0.5 2.6 0.1 5.6 0.14 13.7 1.33 48.9 2.70 1.3 0.20 1.0 - 4.7 0.62 2.6 0.5 9.5 0.75 4.6 0.75a Barium 50 150 27.0 200 7 360 26 507 11.5 <50 - 660 50 550 47 66 - 330 31 137 5.77r Bromine 0.5 1.1 0.15 2.6 0.071 0.9 - 0.7 - <0.5 - 0.8 - <0.5 - 0.8 - <0.5 - 0.6 -
Ca Calcium 10000 100000 6000.0 160000 0.0 90000 10000 20000 6000 <10000 - 60000 6000 <10000 - <10000 - <10000 - 20000 6000e Cerium 3 29 4.5 36 2.1 48 3.1 44 0.58 5 2 35 3.0 96 5.9 31 3.8 79 7.0 20 0.6
Co Cobalt 1 1 - 2 0 5 0 13 0.58 1 - 5 0 6 1 3 0.6 6 0 4 1r Chromium 5 10 2 15 0.71 85 8.5 82 4.9 7 2 26 2.5 70 6 15 3.2 89 6.5 14 3.6s Cesium 1 <1 - <1 - 2 0 2 - <1 - <1 - 3 0 <1 - 5 0 <1 -u Europium 0.2 0.5 0.1 0.7 0.07 1.0 0.31 1 0.1 <0.2 - 1.2 0.058 1.7 0.15 0.3 0.1 1.5 0.12 0.4 0e Iron (total) 1000 3700 58 6100 71 12900 954 39200 1970 867 57.7 17500 833 22700 1710.0 4500 720 63800 4250 11500 1630
2+ Iron (ferrous) 78 700 0 11700 987 14400 1340 3890 404 8890 701 4090 661f Hafnium 1 6 0.6 7 0.7 5 0.6 4 0.6 7 0.6 8 0.6 13 0.58 11 2.1 9 0.6 3 0g Mercur
A
1 <1 - <1 - <1 - <1 - <1 - <1 - <1 - <1 - <1 - <1 -
BB
C
CCEFFeHH yIr Iridium 0.005 <0.005 - <0.005 - <0.005 - <0.005 - <0.005 - <0.005 - <0.005 - <0.005 - <0.005 - <0.005 -a Lanthanum 0.5 11.4 0.862 13.6 0.0707 27.8 0.874 15.7 0.100 2.3 0.26 13 0.12 37.7 1.01 14.3 0.896 39.2 2.60 10.5 0.862u Lutetium 0.05 0.18 0.029 0.22 0.028 0.3 0.01 0.42 0.021 0.09 0.03 0.42 0.055 0.55 0.025 0.14 0.0058 0.69 0.061 0.13 0.021o Molybdenum 1 2 - 2 0.7 2 - 5 - <1 - 1 - 5 - 2 - <1 - 3 0.6n Manganese 1 98 7.5 68 2.5 297 26.4 700 20 25 6.1 421 27.8 112 1.89 65 5.8 154 20.6 151 23.5
Na Sodium 100 2900 58 4000 0 3700 170 22000 660.0 200 0 20800 971 3600 150 267 57.7 967 57.7 600 60d Neodymium 5 10 2.5 13 1.4 23 1.5 13 0.58 <5 - 12 1.0 34 2.0 13 1.0 33 2.0 10 0.6i Nickel 20 <21 - <28 - <31 - <55 - <20 - <39 - <36 - <20 - <46 - <20 -b Rubidium 15 <15 - 21 2.8 28 11 33 - <15 - 49 14 81 8.9 <15 - 82 2.1 16 -b Antimon
LLMM
NNRS y 0.1 0.2 0 0.3 0 0.7 0.1 1.3 0.058 0.1 - 0.2 - 1.0 0.17 0.2 0.1 0.7 0.2 0.3 0.1
c Scandium 0.1 1.4 0.058 2.2 0.071 3.9 0.10 15.0 0.61 0.7 1.05E-08 6.4 0.23 9 0.5 2.0 0.46 12.5 1.10 1.5 0.10e Selenium 3 <3 - <3 - <3 - <3 - <3 - <3 - <3 - <3 - <3 - <3 -
Sm Samarium 0.1 2.1 0.20 2.6 0.071 3.6 0.058 3.7 0.12 0.4 0.1 3.3 0.26 5.8 1.19E-07 2 0.1 6.6 0.56 1.9 0.058n Tin 100 <100 - <100 - <100 - <100 - <100 - <100 - <100 - <100 - <100 - <100 -r Strontium 500 600 - 900 0 <500 - 600 - <500 - 567 - <500 - <500 - <500 - <500 -a Tantalum 0.5 0.6 - <0.5 - 0.6 - 1.1 - <0.5 - <0.5 - 0.8 - 0.6 1.05E-08 1.5 0.12 <0.5 -b Terbium 0.5 <0.5 - <0.5 - 0.5 - 0.5 - <0.5 - <0.5 - <0.5 - <0.5 - 0.8 - <0.5 -h Thorium 0.2 3.4 0.61 3.9 0.071 6.2 0.32 4.5 0.21 1.3 0.17 2.0 0.15 9.8 0.29 4.9 0.38 11.7 0.833 2.2 0 Uranium 0.5 1.9 0.058 2.7 0.49 3.3 0.10 2.3 0.25 0.5 - 0.6 - 3.9 0.78 3.1 0.36 2.9 0.35 0.6 0.1 Tungsten 1 <1 - <1 - 4 0.6 <1 - <1 - <1 - 1 - <1 - <1 - <1 -
b Ytterbium 0.2 1.2 0.12 1.4 0.071 1.9 0.058 2.7 0.15 0.5 0.2 2.7 0.31 3.6 0.10 0.9 0.1 4.6 0.42 0.8 0.2n Zinc 50 <50 - <50 - <50 - 74 - <50 - <50 - 59 - <50 - 103 21.1 <50 -
1 MDL was used in calculating the average2 MDLs were used in calculating the average
LC34-LSULC34-USUample BORDENMAAPEGDYNIROP NASDNTSNFFLAAP
SS
SSTTTUWYZ
S
Table 4: Trace metal concentrations (mg/kg).
chemically refractory as well as labile towards oxidation, and therefore, the AOM oxidation by an oxidant is highly dependent on the reactivity of the various organic structures that makes up the AOM. In the presence of oxygen, the most labile compounds are consumed at high rates while the degradation of the recalcitrant fraction is at a low rate. As such, a first-order reaction model is employed to describe the overall decrease of AOM reactivity with time (Hartog, 2001; 2003). However, recalcitrant organic compounds such as lignin or macromoleculars degrade much faster under aerobic than anaerobic conditions (Canfield, 1994) in the presence of oxidants (such as nitrate). Furthermore, the co-occurrence of several potentially reactive reductants on the aquifer solid surface might also complicate the reactivity of the organic matter. For example, Hartog (2002) observed that the oxidation of AOM in the fine fractions demonstrated less importance than the oxidation of pyrite and siderite while AOM oxidation was quite important in coarse fractions. This might be attributed to the decreasing reactivity of AOMs in the fine fractions as a result of sorption and complexation of AOMs by clay minerals (Mayer, 1994). Humic acid is stable and resistant to weathering in an oxidative environment (Fujikawa and Fukui, 2001); however, in the presence of alkaline permanganate, the oxidation of humic acids might release different kinds of products (e.g., benzenepolycarboxylic acids, phenolic acids, and fatty acids) with varying resistance to the attack of permanganate, depending on the reaction temperature (Almendros et al., 1989). Degradation to carbon dioxide is generally thought to be the complete mineralization of most organic compounds (Appelo and Postma, 1996; Stewart, 1964; 1965; Stumm and Morgan, 1996), but some studies have also concluded that oxalate might be the only organic product in the oxidation of humic and non-humic soils by permanganate or even hydrogen peroxide (Harada and Inoko, 1977; Farmer and Mitchell, 1963).
Although the reductive reactivity of AOMs depends on their availability and structure as well as the type of the oxidant, almost all studies presumed that the end carbon product of the oxidation of an AOM was carbon dioxide. In addition, many studies tend to consider that the presence of alkyl and O-alkyl moieties was significant in the humic materials (Hatcher et al., 1981; Almendros and Leal, 1990); therefore, regardless of its complexities, AOM is usually presented as a general organic form CH2O (Andersen et al., 2001; Christensen et al., 2000; Hartog et al., 2001; Heron et al., 1994; Mumford, 2002). As such, the reaction can be written as
13
2
++++→+ HnmnCOneOnHHC mn )42(42 222
2225109 959 COOHOOHC
(7) 22 44 COHeOHOCH ++→+ +−
If CnH2m is taken as a general form for organic matter (Verschuren, 1983), the following example half-reaction occurs
(8)
Other expressions for AOMs have been also suggested; for example, Hartog (2002, 2003) identified the main types of organic matter present in their research aquifer material and used syrinagate (C9H10O5) as a representative model which produces
(9) + → +

Other studies have also shown that quinine groups might be the main redox active moieties of humic substances (Kappler and Haderlein, 2003; Scott et al., 1998), and therefore, it might be reasonable to use phthalic acid (C8H6O4 or C6H4(COOH)2) to represent the AOMs (Barcelona and Holm, 1991) with a half-reaction of
(10)
14
−+ ++→+ eHCOOHOHC 3030812 22468
4.4 Theoretical Estimation of Total Reductive Capacity (TRC)
The TRC has been used as an index to quantify the reductive properties of aquifer materials or solids (Christensen et al., 2000) and theoretically, represents the sum of the reduced equivalencies of species associated with a given aquifer material that is required to convert them to their corresponding naturally occurring highest stable oxidation states.
Using the analytical data provided in Table 3 and Table 4, the reduction capacity for selected species was estimated for all the aquifer materials. In these calculations, it was assumed that phthalic acid was a reasonable model compound for the reduction capacity of humic substances (Barcelona and Holm, 1991), and Eq.(10) was used to estimate the TRC contribution from the AOM. Since insufficient information on the form of the inorganic species was available, the calculation of TRC from reduced iron, manganese, and sulfur was conducted with different combinations (i.e., as total or amorphous Fe or Fe(II), total or amphorous Mn, and total S) using Eqs 1 to 4. The estimated theoretical TRC values are listed in Table 5 and shown in Figure 1. Table 5 indicates that the estimated TRC spans from 0.28 to 1.56 meq/g based on TOC, total Fe and Mn, total S, and from 0.08 to 1.23 meq/g based on TOC and amorphous Fe and Mn. As expected, the contribution of total S is <10% to the TRC (as estimated from the total species content) for all aquifer materials except for the NFF aquifer material where the contribution is ~16% of the total TRC. Figure 1 (b) indicates that the contribution from total Mn is insignificant relative to the contribution from total Fe and TOC, while Figure 1(c) indicates that the contribution from amorphous Fe and Mn (in their reduced forms) is insignificant relative to the contribution from TOC. Figure 1(d) indicates that for Borden, DNTS, and LAAP aquifer materials the contribution of ferrous iron content to the total TRC is greater than the TOC contribution. Acknowledging that the TRC reflects the reductive capability, the maximum permanganate NOD is expected for the NFF and EGDY aquifer materials while the minimum permanganate NOD is expected for the MAAP and DNTS aquifer materials.

15
0.0
0.2
0.4
0.6
0.8
1.0
1.2
1.4
1.6
1.8
2.0
Borden
DNTSEGDY
LAAP
LC34-L
SU
LC34-U
SUMAAP
NAS-Dall
as NFF
NIROP
TRC
[meq
/g]
(c) TOC + Fe (amorphous) + Mn (amorphous)
TOC
Fe (amorphous)
Mn (amorphous)
0.0
0.2
0.4
0.6
0.8
1.0
1.2
1.4
1.6
1.8
2.0
Borden
DNTSEGDY
LAAP
LC34-LSU
LC34-U
SUMAAP
NAS-Dall
as NFF
NIROP
TRC
[meq
/g]
(d) TOC + FeT or Fe(+II)
TOC
FeT
Fe(+II)
0.0
0.2
0.4
0.6
0.8
1.0
1.2
1.4
1.6
1.8
2.0
Borden
DNTSEGDY
LAAP
LC34-LSU
LC34-U
SUMAAP
NAS-Dall
as NFF
NIROP
TRC
[meq
/g]
(b) TOC + FeT + MnT
TOC
FeT
MnT
0.45
1.26
1.44
0.580.69
0.340.28
0.42
1.56
0.34
0.0
0.2
0.4
0.6
0.8
1.0
1.2
1.4
1.6
1.8
2.0
Borden
DNTSEGDY
LAAP
LC34-LSU
LC34-U
SUMAAP
NAS-Dall
as NFF
NIROP
TRC
[meq
/g]
(a) TOC + FeT + MnT + ST
0.0
0.2
0.4
0.6
0.8
1.0
1.2
1.4
1.6
1.8
2.0
Borden
DNTSEGDY
LAAP
LC34-L
SU
LC34-U
SUMAAP
NAS-Dall
as NFF
NIROP
(c) TOC + Fe (amorphous) + Mn (amorphous)
TOC
Fe (amorphous)
Mn (amorphous)
TRC
[meq
/g]
0.0
0.2
0.4
0.6
0.8
1.0
1.2
1.4
1.6
1.8
2.0
Borden
DNTSEGDY
LAAP
LC34-LSU
LC34-U
SUMAAP
NAS-Dall
as NFF
NIROP
TRC
[meq
/g]
(d) TOC + FeT or Fe(+II)
TOC
FeT
Fe(+II)
0.0
0.2
0.4
0.6
0.8
1.0
1.2
1.4
1.6
1.8
2.0
Borden
DNTSEGDY
LAAP
LC34-LSU
LC34-U
SUMAAP
NAS-Dall
as NFF
NIROP
TRC
[meq
/g]
(b) TOC + FeT + MnT
TOC
FeT
MnT
0.45
1.26
1.44
0.580.69
0.340.28
0.42
1.56
0.34
0.0
0.2
0.4
0.6
0.8
1.0
1.2
1.4
1.6
1.8
2.0
Borden
DNTSEGDY
LAAP
LC34-LSU
LC34-U
SUMAAP
NAS-Dall
as NFF
NIROP
TRC
[meq
/g]
(a) TOC + FeT + MnT + ST
Figure 1: Theoretical estimation of the total reductive capacity using: (a) total organic carbon and the total Fe, Mn, and S; (b) total organic carbon, total Fe and Mn; (c) total organic carbon, amorphous Fe and Mn; and (d) total organic carbon and the ferrous Fe or total Fe.
4.5 Experimental Estimation of TRC
To quantify the overall reactivity of the naturally-occurring reductants with chemical oxidants, various terminologies such as “natural oxidant demand (NOD)”, “soil oxidant demand (SOD)”, and “total reductive capacity (TRC)” or “natural reductive capacity (NRC)” have been developed (Mumford et al., 2005; Hartog et al., 2002; Huang et al., 2001; Christensen et al., 2000; Hood, 2000; Powell et al., 1988; Barcelona and Holm, 1991; Pedersen et al, 1991). Powell et al. (1988) and Barcelona and Holm (1991) concluded that the reductive capacity measurement could be rapidly realized using acidified dichromate chemical oxygen demand (DCOD) method, and many subsequent studies have used this method to experimentally determine the reductive capacity of aquifer solids (Lee and Batchelor, 2003; Korom et al., 1996; Pedersen et al., 1991).
In this work, the above mentioned dichromate COD test method proposed by Barcelona and Holm (1991) was slightly modified and used to quantify the TRC of aquifer materials. Initially sub-samples of the air-dried aquifer material were ground to <150 µm with a mortar and pestle, and aliquots of dry ground solids (~1.5 g) were transferred to pre-cleaned reaction tubes. A volume (~20 mL) of potassium dichromate digestion solution (potassium dichromate (BDH Laboratories), sulfuric acid (EM Science), and mercury sulphate (EM Science)) and a sulfuric acid reagent solution (sulfuric acid (EM Science) and silver sulphate (Alfa Aesar)) were added to

each reaction tube. The reagents (sulfuric acid/potassium dichromate/mercury sulfate) were prepared following standard methods (APHA, 1998). When gas evolution ceased, the reaction tubes were sealed, inverted carefully by hand three times, and then heated (PMC, Model 350) at 150oC for 3 hours. After cooling, the reaction tubes were centrifuged for 1 hour at 4000 rpm (Beckman, Model TJ-6) to clear the supernatant solution for measurement of un-reacted Cr(VI) by spectrophotometer (Milton Roy, 20D) at 420 nm. A standard curve using potassium hydrogen phthalate (KHP) (EM Science) was developed in parallel, and was used to quantify the chemical oxygen demand (APHA, 1998). KHP has a theoretical chemical oxygen demand of 1.176 mg O2/mg KHP and based on the developed standard curve and the mass of each sample the chemical oxygen demand (g O2/kg of aquifer material) was determined.
The dichromate COD values for the tested aquifer materials are listed in Table 5. For comparison and convenience, all dichromate COD values were converted into an equivalent mole of electrons per mass of aquifer material. All dichromate COD tests were performed three to five times for each aquifer material. Statistical outliers were removed by the Barnett and Lewis (1994) outlier detection test. Because the fraction of reductive components that acidified dichromate ions can react with might vary across different solid materials (Christensen et al., 2000), it is not surprising that the tested aquifer materials exhibit a wide range of dichromate COD values (0.06 to 2.05 meq/g). The maximum dichromate COD (2.05 meq/g) was determined for the NFF aquifer material while the MAAP aquifer material yielded the minimum value (0.06 meq/g). The results from the COD tests confirm the TRC results that suggest that the maximum permanganate NOD will be realized for the NFF and EGDY aquifer materials, while the minimum permanganate NOD will be obtained for the MAAP and DNTS aquifer materials.
Table 5: Estimation of the theoretical total reduction capacity and dichromate COD test results (units: meq/g).
16
TOC +FeT+MnT+ST
TOC+FeT+MnT
TOC +
Amorphous(Fe+Mn)
TOC +FeT or Fe(II)
TOC Avg. Stdev
Borden 0.45 0.40 0.08 0.28 0.08 0.19 0.01DNTS 1.26 1.24 0.09 0.25 0.09 0.12 0.03EGDY 1.44 1.44 0.74 1.42 0.71 1.03 0.02LAAP 0.58 0.55 0.15 0.40 0.14 0.15 0.01LC34-LSU 0.69 0.69 0.58 0.68 0.58 0.57 0.01LC34-USU 0.34 0.34 0.28 0.34 0.28 0.21 0.01MAAP 0.28 0.26 0.24 0.25 0.24 0.06 0.02NAS 0.42 0.40 0.19 0.26 0.18 0.33 0.01NFF 1.56 1.31 1.23 1.30 1.23 2.05 0.01NIROP 0.34 0.34 0.11 0.33 0.10 0.14 0.01
Note: 1. Assuming all FeT is Fe(+II).2. Assuming all Fe (amorphous) is Fe(+II).3. Assuming all MnT is Mn(+II).4. Assuming all Mn (amorphous) is Mn(+II).5. Assuming all ST is S(-II).
TRC (meq/g) DCOD (meq/g)
0.00
0.50
1.00
1.50
2.00
2.50
Borde
nDNTS
EGDYLAAP
LC34 LS
U
LC34 U
SUMAAP
NASNFF
NIROP
[meq
/g]
Dichromate COD
Theoretical TRC
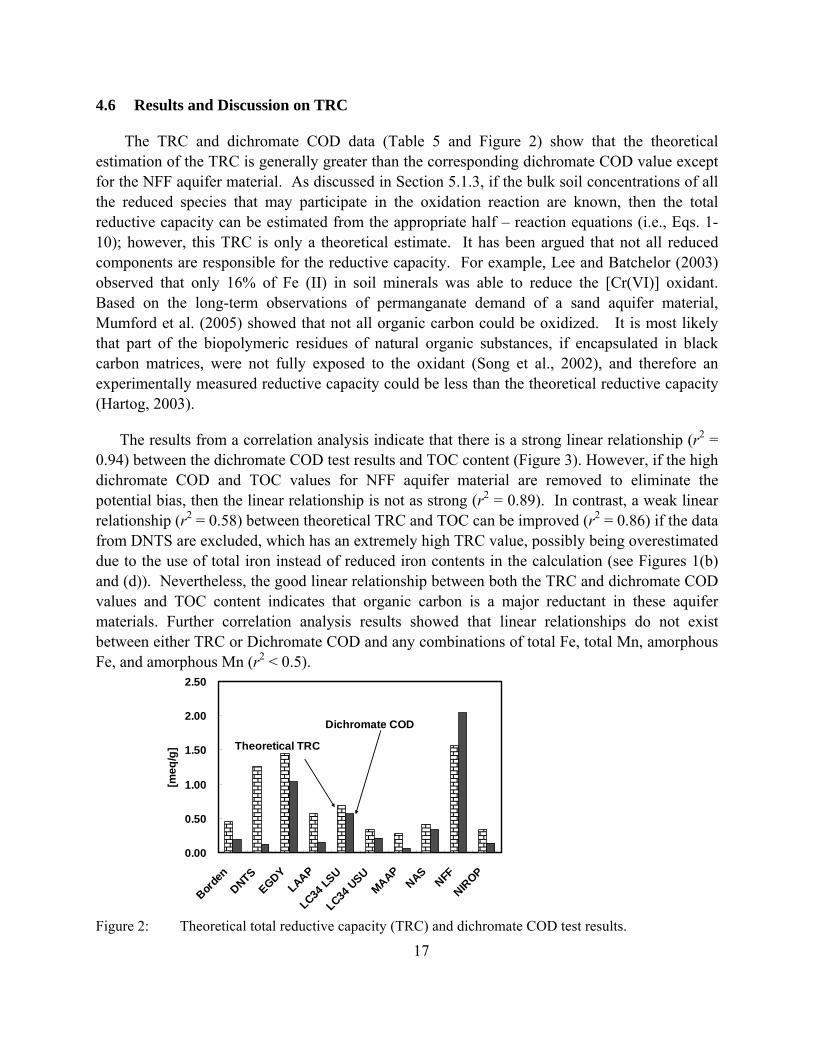
4.6 Results and Discussion on TRC
The TRC and dichromate COD data (Table 5 and Figure 2) show that the theoretical estimation of the TRC is generally greater than the corresponding dichromate COD value except for the NFF aquifer material. As discussed in Section 5.1.3, if the bulk soil concentrations of all the reduced species that may participate in the oxidation reaction are known, then the total reductive capacity can be estimated from the appropriate half – reaction equations (i.e., Eqs. 1-10); however, this TRC is only a theoretical estimate. It has been argued that not all reduced components are responsible for the reductive capacity. For example, Lee and Batchelor (2003) observed that only 16% of Fe (II) in soil minerals was able to reduce the [Cr(VI)] oxidant. Based on the long-term observations of permanganate demand of a sand aquifer material, Mumford et al. (2005) showed that not all organic carbon could be oxidized. It is most likely that part of the biopolymeric residues of natural organic substances, if encapsulated in black carbon matrices, were not fully exposed to the oxidant (Song et al., 2002), and therefore an experimentally measured reductive capacity could be less than the theoretical reductive capacity (Hartog, 2003).
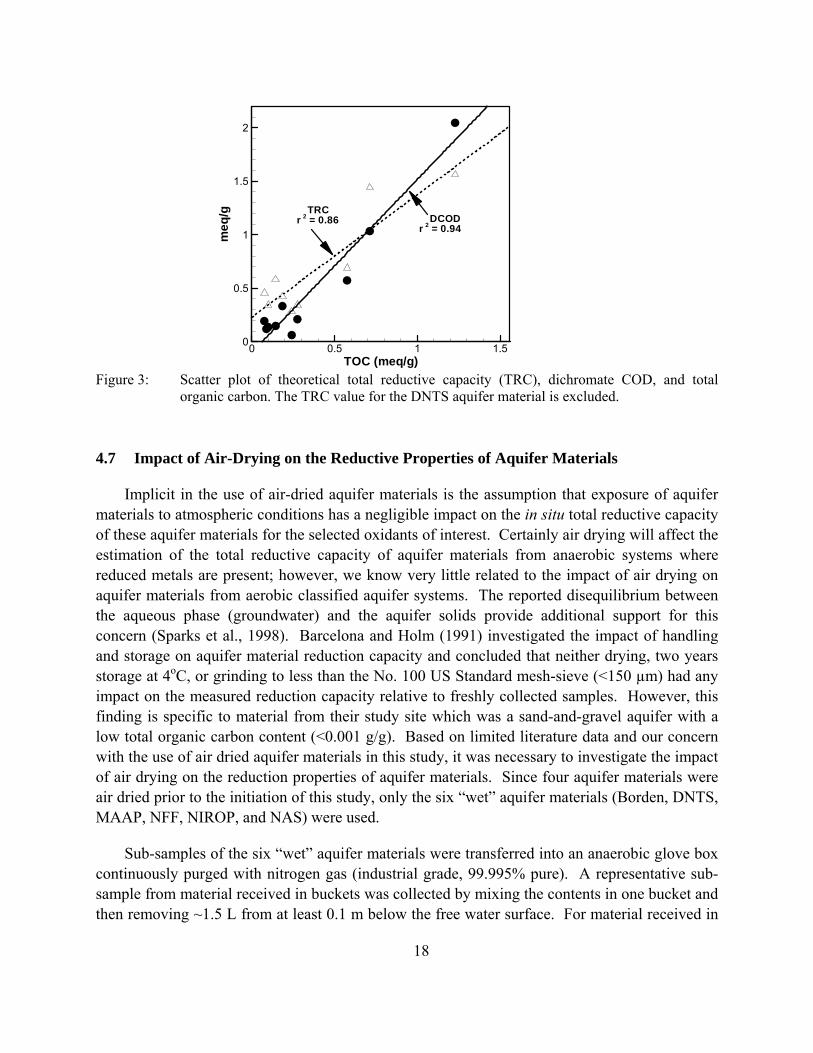
The results from a correlation analysis indicate that there is a strong linear relationship (r2 = 0.94) between the dichromate COD test results and TOC content (Figure 3). However, if the high dichromate COD and TOC values for NFF aquifer material are removed to eliminate the potential bias, then the linear relationship is not as strong (r2 = 0.89). In contrast, a weak linear relationship (r2 = 0.58) between theoretical TRC and TOC can be improved (r2 = 0.86) if the data from DNTS are excluded, which has an extremely high TRC value, possibly being overestimated due to the use of total iron instead of reduced iron contents in the calculation (see Figures 1(b) and (d)). Nevertheless, the good linear relationship between both the TRC and dichromate COD values and TOC content indicates that organic carbon is a major reductant in these aquifer materials. Further correlation analysis results showed that linear relationships do not exist between either TRC or Dichromate COD and any combinations of total Fe, total Mn, amorphous Fe, and amorphous Mn (r2 < 0.5).
Figure 2: Theoretical total reductive capacity (TRC) and dichromate COD test results.
17
TOC (meq/g)
me
18
q/g
0 0.5 1 1.50
0.5
1
1.5
2
r = 0.94
DCOD2
TRCr 2 = 0.86
Figure 3: Scatter plot of theoretical total reductive capacity (TRC), dichromate COD, and total organic carbon. The TRC value for the DNTS aquifer material is excluded.
4.7 Impact of Air-Drying on the Reductive Properties of Aquifer Materials
Implicit in the use of air-dried aquifer materials is the assumption that exposure of aquifer materials to atmospheric conditions has a negligible impact on the in situ total reductive capacity of these aquifer materials for the selected oxidants of interest. Certainly air drying will affect the estimation of the total reductive capacity of aquifer materials from anaerobic systems where reduced metals are present; however, we know very little related to the impact of air drying on aquifer materials from aerobic classified aquifer systems. The reported disequilibrium between the aqueous phase (groundwater) and the aquifer solids provide additional support for this concern (Sparks et al., 1998). Barcelona and Holm (1991) investigated the impact of handling and storage on aquifer material reduction capacity and concluded that neither drying, two years storage at 4oC, or grinding to less than the No. 100 US Standard mesh-sieve (<150 µm) had any impact on the measured reduction capacity relative to freshly collected samples. However, this finding is specific to material from their study site which was a sand-and-gravel aquifer with a low total organic carbon content (<0.001 g/g). Based on limited literature data and our concern with the use of air dried aquifer materials in this study, it was necessary to investigate the impact of air drying on the reduction properties of aquifer materials. Since four aquifer materials were air dried prior to the initiation of this study, only the six “wet” aquifer materials (Borden, DNTS, MAAP, NFF, NIROP, and NAS) were used.
Sub-samples of the six “wet” aquifer materials were transferred into an anaerobic glove box continuously purged with nitrogen gas (industrial grade, 99.995% pure). A representative sub-sample from material received in buckets was collected by mixing the contents in one bucket and then removing ~1.5 L from at least 0.1 m below the free water surface. For material received in
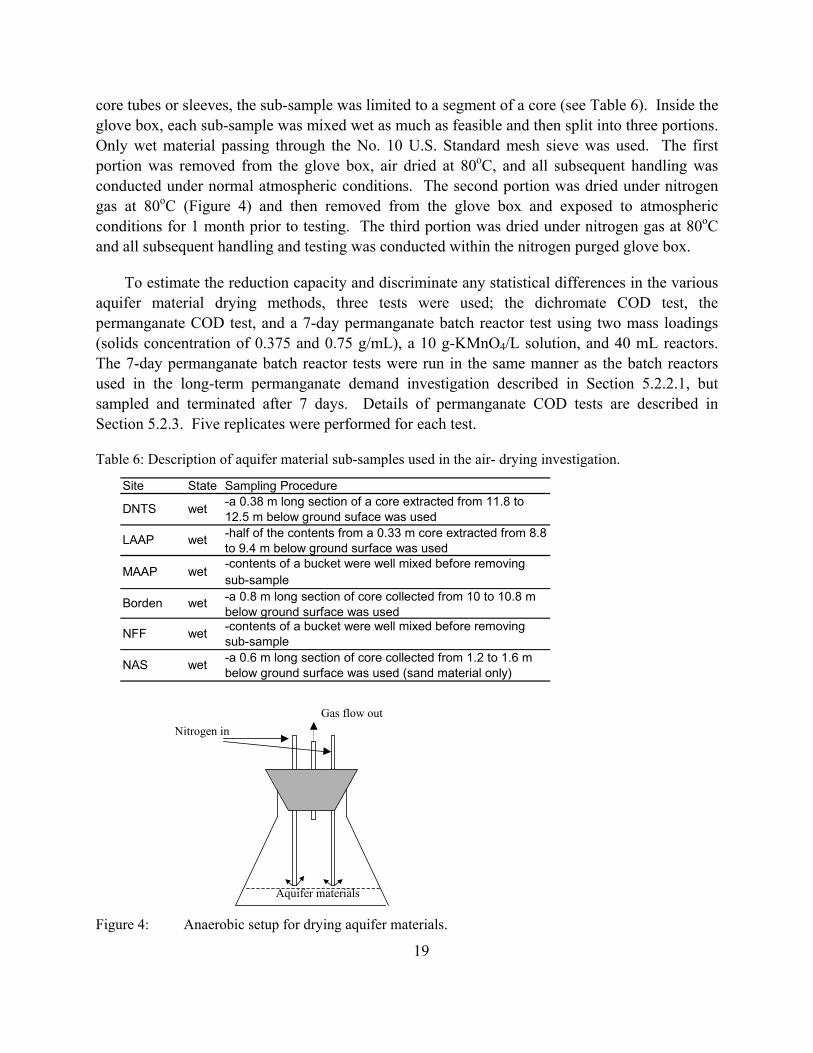
core tubes or sleeves, the sub-sample was limited to a segment of a core (see Table 6). Inside the glove box, each sub-sample was mixed wet as much as feasible and then split into three portions. Only wet material passing through the No. 10 U.S. Standard mesh sieve was used. The first portion was removed from the glove box, air dried at 80oC, and all subsequent handling was conducted under normal atmospheric conditions. The second portion was dried under nitrogen gas at 80oC (Figure 4) and then removed from the glove box and exposed to atmospheric conditions for 1 month prior to testing. The third portion was dried under nitrogen gas at 80oC and all subsequent handling and testing was conducted within the nitrogen purged glove box.
To estimate the reduction capacity and discriminate any statistical differences in the various aquifer material drying methods, three tests were used; the dichromate COD test, the permanganate COD test, and a 7-day permanganate batch reactor test using two mass loadings (solids concentration of 0.375 and 0.75 g/mL), a 10 g-KMnO4/L solution, and 40 mL reactors. The 7-day permanganate batch reactor tests were run in the same manner as the batch reactors used in the long-term permanganate demand investigation described in Section 5.2.2.1, but sampled and terminated after 7 days. Details of permanganate COD tests are described in Section 5.2.3. Five replicates were performed for each test.
Table 6: Description of aquifer material sub-samples used in the air- drying investigation.
Site State
NFF wet -contents of a bucket were well mixed before removingsub-sample
NAS wet -a 0.6 m long section of core collected from 1.2 to 1.6 mbelow ground surface was used (sand material only)
MAAP wet -contents of a bucket were well mixed before removingsub-sample
Borden wet -a 0.8 m long section of core collected from 10 to 10.8 mbelow ground surface was used
DNTS wet -a 0.38 m long section of a core extracted from 11.8 to12.5 m below ground suface was used
LAAP wet -half of the contents from a 0.33 m core extracted from 8.8to 9.4 m below ground surface was used
Sampling Procedure
Nitrogen in
Gas flow out
Aquifer materials
Figure 4: Anaerobic setup for drying aquifer materials.
19
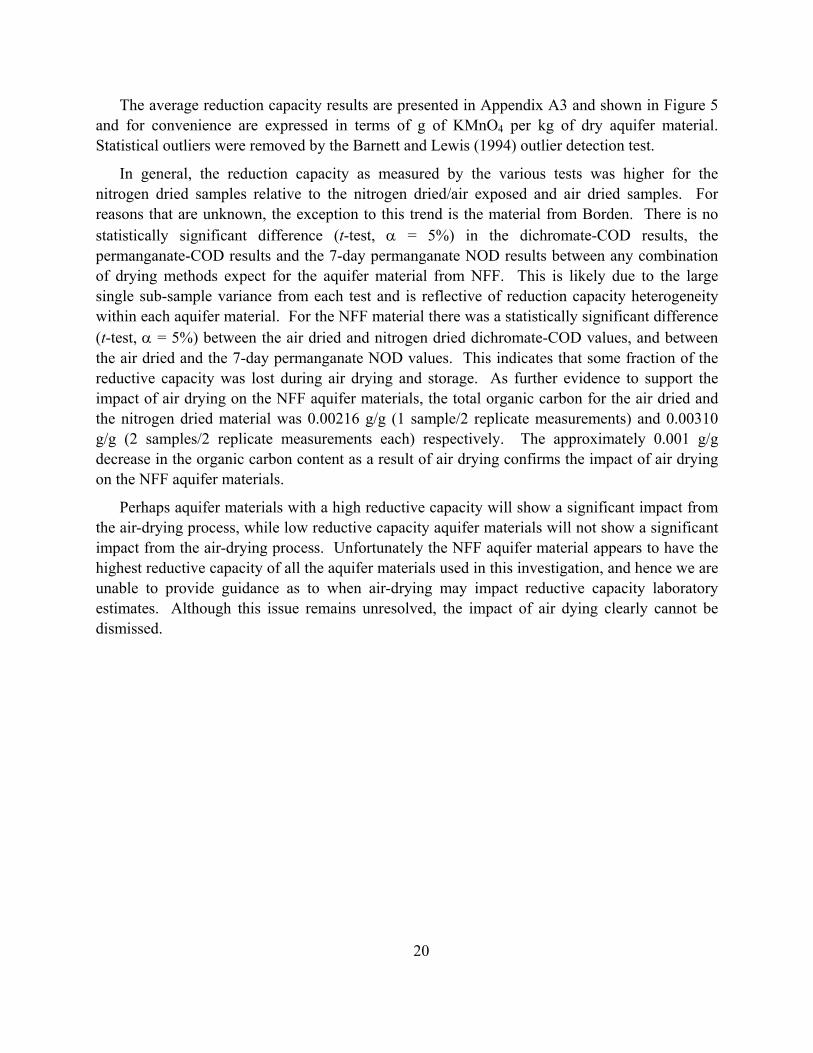
20
The average reduction capacity results are presented in Appendix A3 and shown in Figure 5 and for convenience are expressed in terms of g of KMnO4 per kg of dry aquifer material. Statistical outliers were removed by the Barnett and Lewis (1994) outlier detection test.
In general, the reduction capacity as measured by the various tests was higher for the nitrogen dried samples relative to the nitrogen dried/air exposed and air dried samples. For reasons that are unknown, the exception to this trend is the material from Borden. There is no statistically significant difference (t-test, α = 5%) in the dichromate-COD results, the permanganate-COD results and the 7-day permanganate NOD results between any combination of drying methods expect for the aquifer material from NFF. This is likely due to the large single sub-sample variance from each test and is reflective of reduction capacity heterogeneity within each aquifer material. For the NFF material there was a statistically significant difference (t-test, α = 5%) between the air dried and nitrogen dried dichromate-COD values, and between the air dried and the 7-day permanganate NOD values. This indicates that some fraction of the reductive capacity was lost during air drying and storage. As further evidence to support the impact of air drying on the NFF aquifer materials, the total organic carbon for the air dried and the nitrogen dried material was 0.00216 g/g (1 sample/2 replicate measurements) and 0.00310 g/g (2 samples/2 replicate measurements each) respectively. The approximately 0.001 g/g decrease in the organic carbon content as a result of air drying confirms the impact of air drying on the NFF aquifer materials.
Perhaps aquifer materials with a high reductive capacity will show a significant impact from the air-drying process, while low reductive capacity aquifer materials will not show a significant impact from the air-drying process. Unfortunately the NFF aquifer material appears to have the highest reductive capacity of all the aquifer materials used in this investigation, and hence we are unable to provide guidance as to when air-drying may impact reductive capacity laboratory estimates. Although this issue remains unresolved, the impact of air dying clearly cannot be dismissed.
0.1
1
10
100
DNTS LAAP MAAP Borden NFF NAS-Dallas
[g K
MnO
4 /k
g]
Air DriedNitrogen Dried-Air ExposedNitrogen Dried
(a)
0.1
1
10
100
DNTS LAAP MAAP Borden NFF NAS-Dallas
[g K
MnO
4 /k
g]
Air DriedNitrogen Dried-Air ExposedNitrogen Dried
(b)
0.1
1
10
100
DNTS LAAP MAAP Borden NFF NAS-Dallas
[g K
MnO
4 /k
g]
Air Dried (0.375 g/mL)Air Dried (0.75 g/mL)Nitrogen Dried-Air Exposed (0.375 g/mL)Nitrogen Dried-Air Exposed (0.75 g/mL)Nitrogen Dried (0.375 g/mL)Nitrogen Dried (0.75 g/mL)
(c)
Figure 5: Average reductive capacity results from the air-drying investigation (a) dichromate-COD data, (b) permanganate-COD data, and (c) 7-day permanganate NOD data.
21
5 PERMANGANATE This section focuses on the interaction of permanganate with aquifer materials and begins
with a background discussion of the physical and chemical properties, relevant reactions, and application in groundwater remediation. Then, the theoretical kinetic expressions accounting for the reactions between permanganate and aquifer materials are addressed, followed by details on the experimental investigation and data analyses. Three series of experiments (long-term batch tests, short-term batch tests, and column tests) were designed and performed to investigate permanganate behaviour in the presence of aquifer materials. Long-term batch experiments were conducted to focus on fundamental chemical properties affecting permanganate consumption by aquifer materials. The maximum permanganate NOD determined from long-term batch experiments were then used to examine the potential use of a permanganate COD test to quickly and economically quantify the maximum NOD of aquifer materials. Short-term batch experiments were designed to investigate the kinetic behaviour of permanganate in the presence of various aquifer materials. Column experiments, which mimic in situ conditions, were used to investigate permanganate transport.
5.1 Background
5.1.1 Permanganate Properties and Reactions
Manganese species have the potential valence states ranging from +1 and +7, of which the +2, +4, and +7 states are the only ones that are stable over a wide range of acidity. Manganese in permanganate has the highest oxidation state. Potassium permanganate, which is the most commonly used reagent in ISCO applications, is a crystalline solid that is derived from mined potassium ores. It is relatively stable to thermal decomposition but not to photolytic decomposition (both in the solid form and in solution). Neutral permanganate solutions are relatively stable because water is the only solvent that reduces permanganate very slowly in the presence of manganese dioxide (or dust) in neutral permanganate solutions (Stewart, 1965) according to
223
224 222 2 OOHMnOOHMnO MnO ++⎯⎯ →⎯+ −− (11)
Permanganate solutions in acidic condition are less stable than in neutral conditions, but unless the solutions are boiled, the decomposition is still relatively slow. Concentrated permanganate solutions in alkaline conditions can also slowly decompose to produce oxygen and manganate, which is unstable and can slowly disproportionate to permanganate and manganese dioxide (Steward, 1965). The general physical and chemical properties of permanganate are listed in Table 7.
22
23
2
−
The reaction stoichiometry and kinetics involving permanganate in natural systems are quite complex and are not fully understood. The most common permanganate reaction employed in environmental engineering is the complete reduction of permanganate (Mn(VII)) to manganese dioxide (MnO2) (Mn(IV)) (Schnarr et al., 1998; Siegrist et al., 2001; Crimi and Siegrist, 2004), which is a three-equivalent reaction. This reaction proceeds differently in acidic and basic solutions as given by (Stewart, 1965):
MnO H e MnO s H O4 24 3 2− + −+ + → +( ) Eo(v) = +1.70 V (12)
in acidic solutions, and by
MnO H O e MnO s OH4 2 22 3 4− −+ + → +( ) Eo(v) = +0.59 V (13)
in basic solutions.
In addition to Eqs. (12) and (13), some other reactions involving permanganate participation are given by the following half-reaction equations (Stewart, 1965):
24
344 2 −−− →+ MnOMnOMnO (14)
+•−− ++→+ HOHMnOOHMnO 2424 (15)
)(22)(42 2224 sMnOOHgOHMnO ++→+ +− (16)
OHMneHMnO 22
4 458 +→++ +−+− (17)
OHsMnOOHMnMnO 222
4 2)(5432 +→++ −+− (18)
Eq. (18) is called Guyard reaction (Stewart, 1965) which describes the exchange between Mn(VII), Mn(IV), and Mn(II), and can be used for the volumetric determination of manganese. The Guyard reaction is expected to be very fast in strongly acidic solutions. Permanganate is a strong oxidant and only several oxidants (e.g., solid bismuthate in acid, ammonium persulfate, lead dioxide, potassium periodate, and ozone) are able to oxidize manganese ions to permanganate (Stewart, 1965).
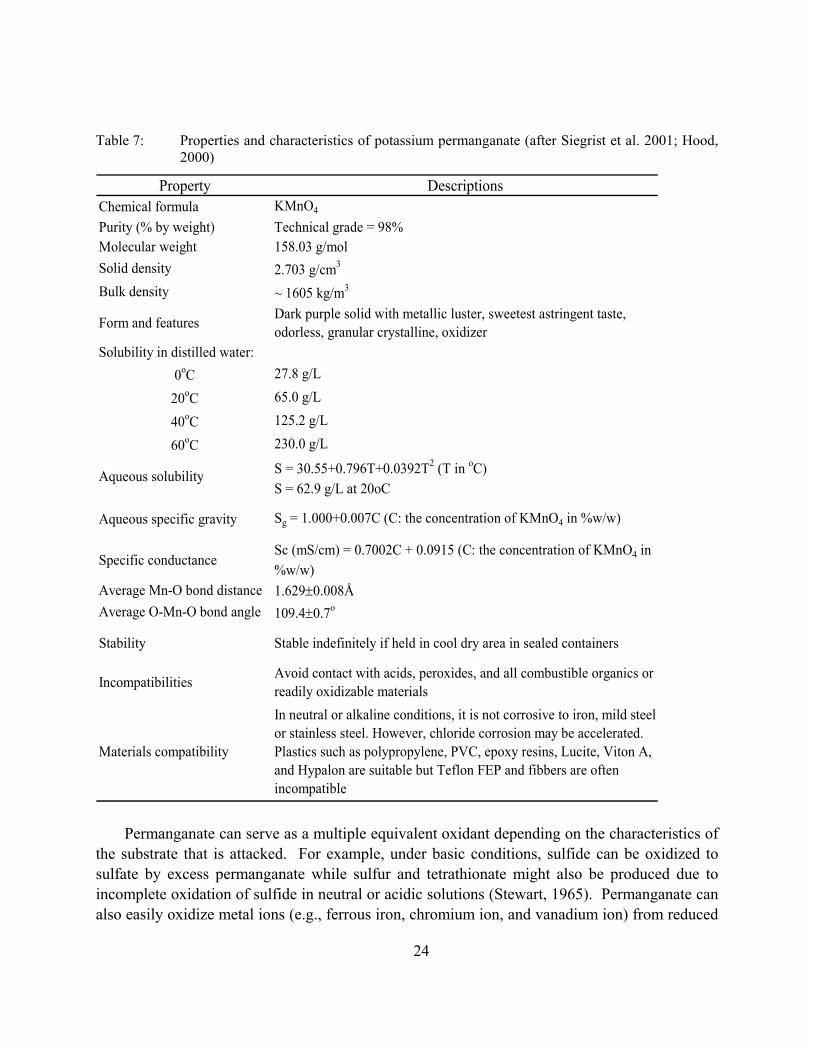
Table 7: Properties and characteristics of potassium permanganate (after Siegrist et al. 2001; Hood, 2000)
Property DescriptionsChemical formula KMnO4
Purity (% by weight) Technical grade = 98%Molecular weight 158.03 g/molSolid density 2.703 g/cm3
Bulk density ~ 1605 kg/m3
Form and features Dark purple solid with metallic luster, sweetest astringent taste,odorless, granular crystalline, oxidizer
Solubility in distilled water:0oC 27.8 g/L
20oC 65.0 g/L
40oC 125.2 g/L
60oC 230.0 g/L
S = 30.55+0.796T+0.0392T2 (T in oC)S = 62.9 g/L at 20oC
Aqueous specific gravity Sg = 1.000+0.007C (C: the concentration of KMnO4 in %w/w)
Specific conductanceSc (mS/cm) = 0.7002C + 0.0915 (C: the concentration of KMnO4 in%w/w)
Average Mn-O bond distance 1.629±0.008ÅAverage O-Mn-O bond angle 109.4±0.7o
Stability Stable indefinitely if held in cool dry area in sealed containers
Incompatibilities Avoid contact with acids, peroxides, and all combustible organics orreadily oxidizable materials
Materials compatibility
In neutral or alkaline conditions, it is not corrosive to iron, mild steelor stainless steel. However, chloride corrosion may be accelerated.Plastics such as polypropylene, PVC, epoxy resins, Lucite, Viton A,and Hypalon are suitable but Teflon FEP and fibbers are oftenincompatible
Aqueous solubility
Permanganate can serve as a multiple equivalent oxidant depending on the characteristics of the substrate that is attacked. For example, under basic conditions, sulfide can be oxidized to sulfate by excess permanganate while sulfur and tetrathionate might also be produced due to incomplete oxidation of sulfide in neutral or acidic solutions (Stewart, 1965). Permanganate can also easily oxidize metal ions (e.g., ferrous iron, chromium ion, and vanadium ion) from reduced
24
25
states to oxidized states (Siegrist et al., 1999; Stewart, 1965). The reactions between permanganate and some organic compounds may involve different reaction pathways such as hydrogen atom abstraction and hydride ion abstraction (Stewart, 1964; Siegrist et al., 2001). Permanganate has a unique affinity for oxidizing organic compounds containing carbon-carbon double bonds, aldehyde groups or hydroxyl groups (Stewart, 1964; 1965). It was also addressed by Stewart (1965) that “permanganate oxidation for organic compounds is often, but by no means, considerably faster in alkaline than in neutral solution” because a change of the organic substrate (e.g., ionization of alcohol) might occur in a basic solution. However, a general phenomenon is that the oxidation rate is accelerated in strongly acidic conditions due to a conversion of permanganate ion to the more active oxidant, permanganate acid.
5.1.2 Permanganate Interaction with Aquifer Materials
The majority of permanganate-based ISCO studies have focused on the oxidation of target contaminants (Huang et al., 1999; Urynowicz and Siegrist, 2005; Waldemer and Tratnyek, 2006), and little effort has been given to the interactions between permanganate and aquifer materials. ISCO pilot-scale experiments have demonstrated that permanganate in excess of the stoichiometric requirements by the target contaminant is usually required. This excess amount of permanganate has been attributed to the consumption of permanganate by the surrounding aquifer material, and is referred to as natural oxidant demand (NOD) and expressed as a mass of KMnO4 per mass of dry aquifer materials (Hood, 2000; Mumford et al., 2004; 2005).
During an ISCO application, an aqueous solution of permanganate is injected into the treatment zone, and will react with oxidizable inorganic and organic substances in the solid phase, and dissolved reductants in the aqueous phase (Crimi and Siegrist; 2004; Mumford et al., 2005). It has been experimentally verified that in ISCO applications, the permanganate ion reacts with various reductants to form manganese dioxide between a pH of 3.5 and 12. In a strong acid condition (pH<3.5), Mn2+ cations are formed. Above a pH of 12, which is a very rare case in natural subsurface systems, Mn(VI) could be formed (Hood, 2000; MacKinnon and Thomson, 2002; Schnarr et al., 1998; Siegrist et al., 2001).
Most of existing studies report permanganate NOD as a single value that applies to the entire aquifer over the entire duration of the ISCO application (Hood, 2000; Drescher et al., 1998; Siegrist et al., 2001). The implication of this instantaneous sink conceptual model is that no injected permanganate can leave a region of an aquifer prior to the satisfaction of the entire NOD within that region (Mumford et al., 2005; Mumford, 2002). Therefore, the single-valued NOD in this conceptual model represents the ultimate NOD or the maximum permanganate mass that could be consumed. However, recent studies (Mumford et al., 2005; Mumford, 2002) have observed that the consumption of permanganate by aquifer materials in batch tests is not an instantaneous reaction process but is kinetically controlled (measurable consumption rates are present for >21 weeks). This finding suggests that, in addition to advection and dispersion, the transport of permanganate within the contaminated region will be controlled by the kinetic competition for permanganate between the target organic compound(s) and the NOD. In an
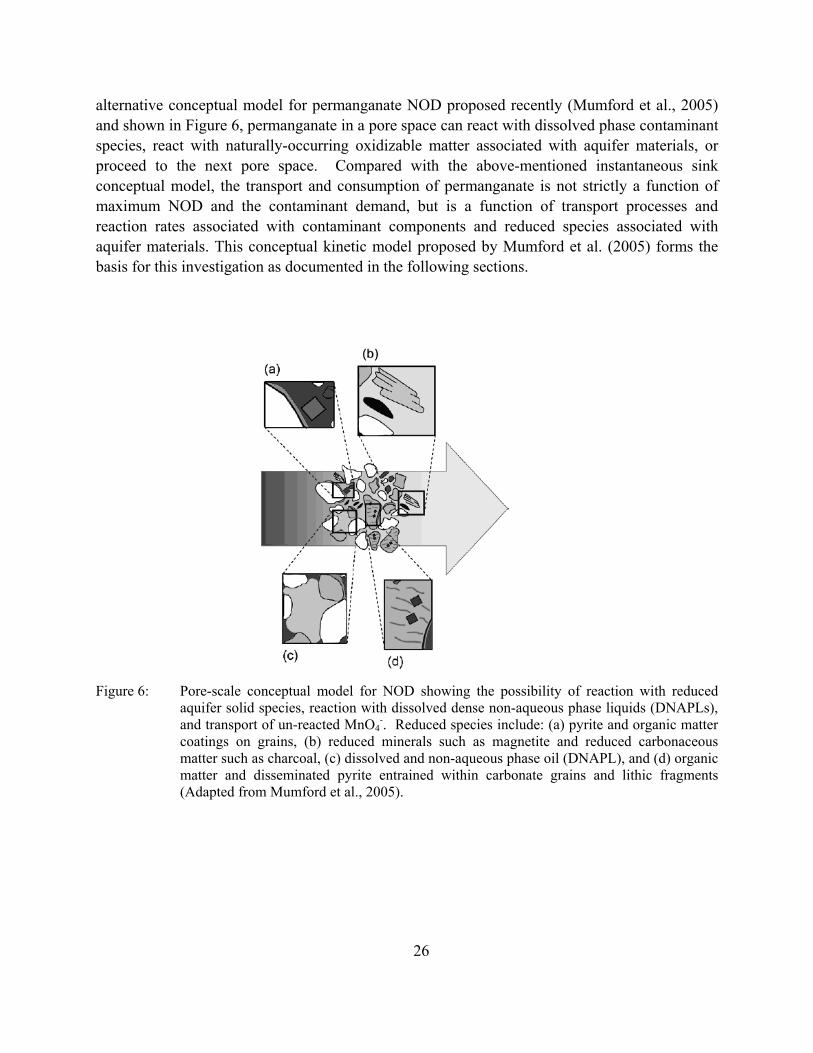
alternative conceptual model for permanganate NOD proposed recently (Mumford et al., 2005) and shown in Figure 6, permanganate in a pore space can react with dissolved phase contaminant species, react with naturally-occurring oxidizable matter associated with aquifer materials, or proceed to the next pore space. Compared with the above-mentioned instantaneous sink conceptual model, the transport and consumption of permanganate is not strictly a function of maximum NOD and the contaminant demand, but is a function of transport processes and reaction rates associated with contaminant components and reduced species associated with aquifer materials. This conceptual kinetic model proposed by Mumford et al. (2005) forms the basis for this investigation as documented in the following sections.
Figure 6: Pore-scale conceptual model for NOD showing the possibility of reaction with reduced aquifer solid species, reaction with dissolved dense non-aqueous phase liquids (DNAPLs), and transport of un-reacted MnO4
-. Reduced species include: (a) pyrite and organic matter coatings on grains, (b) reduced minerals such as magnetite and reduced carbonaceous matter such as charcoal, (c) dissolved and non-aqueous phase oil (DNAPL), and (d) organic matter and disseminated pyrite entrained within carbonate grains and lithic fragments (Adapted from Mumford et al., 2005).
26
5.1.3 Derivation of Permanganate NOD Kinetic Expressions
The overall heterogeneous reaction between the bulk oxidizable aquifer matter (OAM) and permanganate may be written as
OAMqpMnOpMnOOAM -Oxidized 24 +→+ − (19)
where p and q are stochiometric coefficients. The term bulk oxidizable aquifer matter refers to all significant non-target reductants associated with the aquifer materials including organic carbon, and minerals containing S(-II), Mn(+II), and Fe(+II). Associated with (19) are the following general rate law expressions:
αβ )()()(4−−=
MnOOAMOAMbulk
OAM CCkdt
Cd (20)
and
βα )()()(
4
44OAMMnO
MnObulk
MnO CCkdt
Cd−
−−
−= (21)
where and is the bulk reaction rate coefficient with respect to the OAM and permanganate; α and β are the overall reaction order with respect to permanganate and the OAM; t is time, and and are the concentrations of the bulk oxidizable aquifer
material (mass/system volume) and permanganate (mass/volume of solution). In this investigation the concentration of the bulk oxidizable aquifer material ( ) is estimated from
OAMbulkk
−4MnO
bulkk
OAMC −4MnOC
OAMC
totalaqOAM VmDCODC /= (22)
where DCOD is the dichromate COD test result expressed as g-KMnO4/kg of dry aquifer material, maq is the mass of dry aquifer material, and Vtotal is the total system volume (solution and aquifer material); hence the units for are g-KMnO4/L. OAMC
Based on Eqs. (19) to (22), permanganate consumption (e.g., NOD) by aquifer materials is expected to be the function of time, reaction orders, concentrations, and reaction coefficients with respect to OAM and permanganate, as expressed as:
),,,,,,( 44 tkkCCfNOD MnOoamoamMnOt βα= (23)
Equation (23) forms the theoretical basis accounting for permanganate consumption by aquifer materials, indicating that the influencing factors should at least include permanganate concentration, the composition of components in aquifer materials, and their chemical properties.
27
28
5.2 Long-Term Permanganate Consumption by Aquifer Materials
To identify factors controlling permanganate NOD, estimate the ultimate NOD for the various aquifer materials, and to investigate long-term permanganate NOD kinetic behavior, a series of long-term batch experiments were performed.
5.2.1 Experimental Methods
Table 8 lists the details for the long-term batch experiments performed in this study. In order to explore permanganate consumption due to different oxidant to aquifer material mass ratios, a range of initial permanganate concentrations (1 to 20 g KMnO4/L) and mass of aquifer materials (10 to 50 g) were used. For experiments using the Borden, DNTS, LC34, MAAP and NIROP aquifer materials nominal 40 mL reactors were used, while 125 mL reactors were used for the EGDY and NFF aquifer materials due to their high NOD which necessitated a sufficient mass of permanganate to be available. In addition, due to the relatively high NOD of the LC34-USU and LC34-LSU aquifer materials (estimated from TRC and DCOD test), a 125 mL reactor was also used for the 1.0 g/L concentration to ensure that sufficient permanganate mass was present. The various masses of aquifer materials allow for the impact of different oxidant to aquifer material mass ratios to be explored. Nominal oxidant to aquifer mass ratios of 2, 10, 20, 35 g KMnO4/ kg of aquifer solids were used for all aquifer materials expect for EGDY and NFF where nominal oxidant to aquifer mass ratios of 46, 83, 100, 170 g KMnO4/ kg of aquifer solids were used. Experimental controls consisted of identical volume reactors filled with the potassium permanganate solution but containing no aquifer materials.
KMnO4 solutions were prepared by adding analytical grade KMnO4 (EM Science) to Milli-Q water and boiling for ~1 hour. The cooled solution was filtered (0.45-μm glass fiber, Pall Corporation) and standardized by titration into a sulphuric acid and sodium oxalate solution (APHA, 1998). Each test was performed in triplicate and all reactors were shielded from light to prevent photo-catalytic oxidant decomposition (Steward, 1965) and stored in a controlled temperature environment (~20oC). At specified times each reactor was sampled
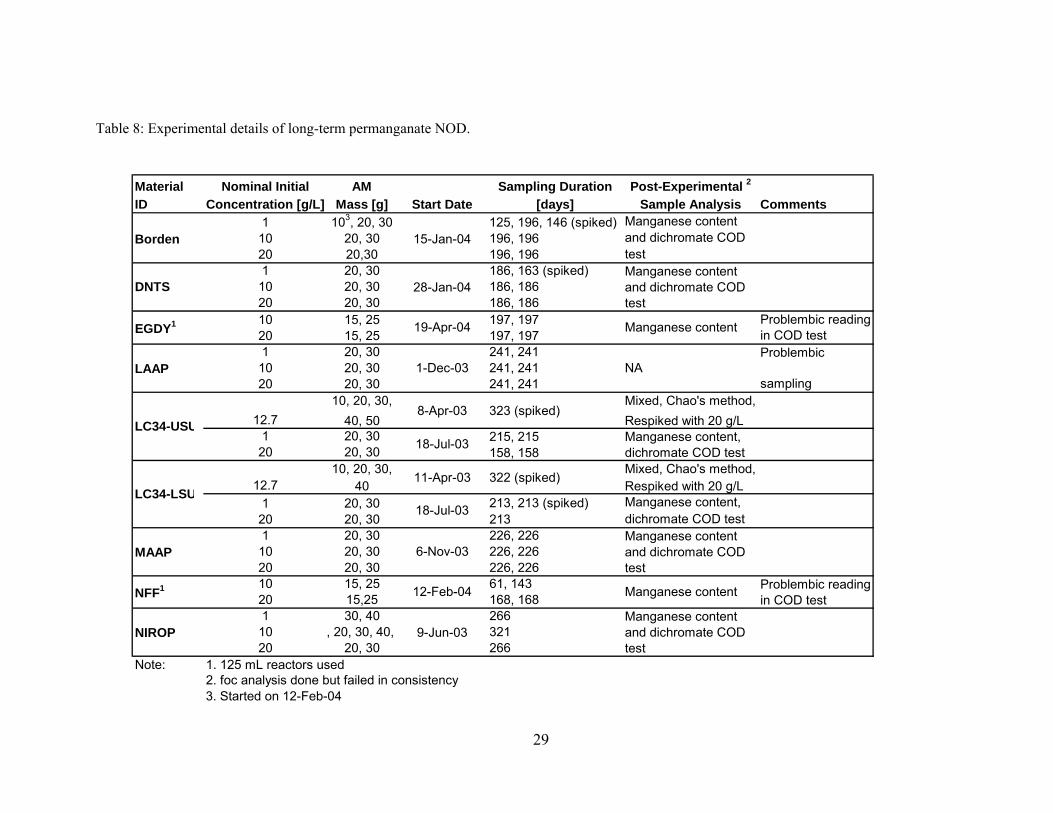
Table 8: Experimental details of long-term permanganate NOD.
Material Nominal Initial AM Sampling Duration Post-Experimental 2
ID Concentration [g/L] Mass [g] Start Date [days] Sample Analysis Comments1 103, 20, 30 125, 196, 146 (spiked)
Borden 10 20, 30 15-Jan-04 196, 19620 20,30 196, 1961 20, 30 186, 163 (spiked)
10 20, 30 28-Jan-04 186, 18620 20, 30 186, 18610 15, 25 197, 19720 15, 25 197, 1971 20, 30 241, 241
LAAP 10 20, 30 1-Dec-03 241, 24120 20, 30 241, 241
12.710, 20, 30,
40, 508-Apr-03 323 (spiked)
Mixed, Chao's method,Respiked with 20 g/L
1 20, 30 215, 21520 20, 30 158, 158
12.710, 20, 30,
4011-Apr-03 322 (spiked)
Mixed, Chao's method,Respiked with 20 g/L
1 20, 30 213, 213 (spiked)20 20, 30 2131 20, 30 226, 226
MAAP 10 20, 30 6-Nov-03 226, 22620 20, 30 226, 22610 15, 25 61, 14320 15,25 168, 1681 30, 40 266
NIROP 10 , 20, 30, 40, 9-Jun-03 32120 20, 30 266
Note: 1. 125 mL reactors used2. foc analysis done but failed in consistency
Manganese contentand dichromate CODtestManganese contentand dichromate CODtest
Manganese contentand dichromate CODtest
Manganese contentand dichromate CODtest
Manganese content,dichromate COD test
Manganese content,dichromate COD test
Manganese content
Problembic
sampling
Problembic readingin COD test
Problembic readingin COD test
NA
Manganese content
DNTS
EGDY1 19-Apr-04
NFF1 12-Feb-04
18-Jul-03LC34-USU
18-Jul-03LC34-LSU
29
3. Started on 12-Feb-04
by removing an aliquot (~150 μL) of the solution and the KMnO4 concentration was determined by spectrophotometry (Milton Roy Company, Spectronic 20D) at 525 nm with a method detection limit of 1.3 mg/L. The spectrophotometer was calibrated prior to each sampling episode. Nitrogen gas was used to fill the head space in the reactor after sampling.
The decrease in permanganate concentration and the mass of aquifer material were used to estimate the NOD (mass KMnO4 consumed / mass of dried aquifer material) after a sampling episode at time t by using
30
testaq
t
crtltox
testtox
crtltox
crtltox
crtltox
testtox
testtox
testtoxt mVVVCmVCmNOD /)]/)(([ 1,1,1,,1,1,,1,∑ −−−−−− −−−= (24)
where, mox is the mass of permanganate, Cox is the concentration of permanganate, Vox is the volume of permanganate solution in the reactor, maq is the mass of dry aquifer material added to the test reactor, the superscripts test and crtl denote the test reactor and control reactor respectively, and the subscript t and t-1 denote values at the current and previous sampling episodes respectively. NOD results from reactors subjected to this sequential sampling method at least 5 times were compared to NOD results from a limited number of reactors sampled once. This comparison indicated that there was no statistical difference in the NOD values (t-test, α = 5%).
Except for the reactors containing the LAAP aquifer material, all reactors were monitored until the NOD value estimated from Eq. (24) stabilized at a maximum value (maximum NOD or NODmax). The LAAP aquifer material proved to be problematic due to the high degree of fine material (~60% silt and clay; d30 = 5.5 μm) which clogged various filters and interfered with analytical aspects. For selected reactors we replenished (spiked) the oxidant mass in the reactors to observe if the NOD stabilization was due to oxidant limitations.
Once the maximum NOD for each experimental reactor was reached, aquifer material was removed and rinsed with Milli-Q water to remove excess permanganate. The rinsed samples from triplicate reactors for each test were mixed together, gently homogenized by hand, and dried at 80oC to a constant weight. Following the modified Chao’s method (Chao, 1972) proposed by Neamana et al. (2004), manganese oxides were extracted for two hours from a 0.5 g of the post-experimental sample of each long-term batch test using acidified 1.0M NH2OH-HCl (pH = 2.0, adjusted by 2% HNO3) solution. The manganese content was quantified using an inductively coupled plasma (ICP) emission spectroscopy (MDL 0.01 mg/L) with a Spectro Flame instrument (Spectro Analytica, Fitchburg, MA). In addition, dichromate COD tests (as illustrated in Section 5.1.5) were also performed to quantify the dichromate COD value for each of post-experimental samples of each long-term batch test.
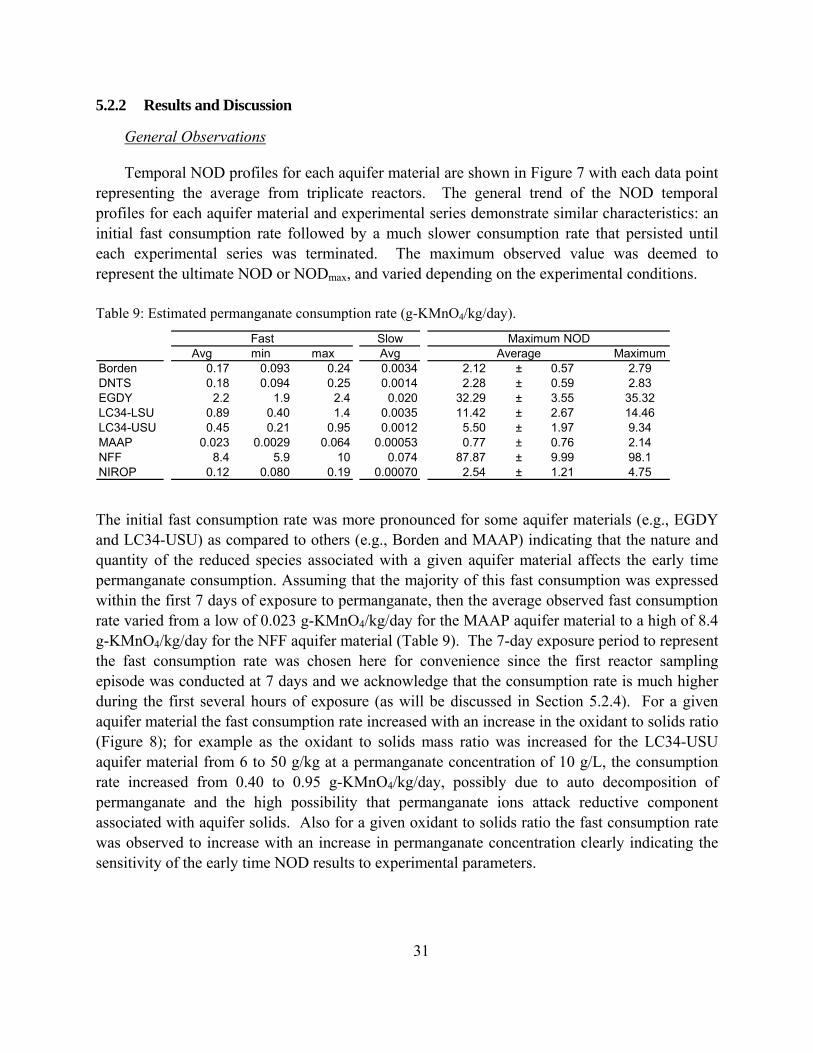
5.2.2 Results and Discussion
General Observations
Temporal NOD profiles for each aquifer material are shown in Figure 7 with each data point representing the average from triplicate reactors. The general trend of the NOD temporal profiles for each aquifer material and experimental series demonstrate similar characteristics: an initial fast consumption rate followed by a much slower consumption rate that persisted until each experimental series was terminated. The maximum observed value was deemed to represent the ultimate NOD or NODmax, and varied depending on the experimental conditions.
Table 9: Estimated permanganate consumption rate (g-KMnO4/kg/day).
SlowAvg min max Avg Maximum
Borden 0.17 0.093 0.24 0.0034 2.12 ± 0.57 2.79DNTS 0.18 0.094 0.25 0.0014 2.28 ± 0.59 2.83EGDY 2.2 1.9 2.4 0.020 32.29 ± 3.55 35.32LC34-LSU 0.89 0.40 1.4 0.0035 11.42 ± 2.67 14.46LC34-USU 0.45 0.21 0.95 0.0012 5.50 ± 1.97 9.34MAAP 0.023 0.0029 0.064 0.00053 0.77 ± 0.76 2.14NFF 8.4 5.9 10 0.074 87.87 ± 9.99 98.1NIROP 0.12 0.080 0.19 0.00070 2.54 ± 1.21 4.75
Maximum NODAverage
Fast
The initial fast consumption rate was more pronounced for some aquifer materials (e.g., EGDY and LC34-USU) as compared to others (e.g., Borden and MAAP) indicating that the nature and quantity of the reduced species associated with a given aquifer material affects the early time permanganate consumption. Assuming that the majority of this fast consumption was expressed within the first 7 days of exposure to permanganate, then the average observed fast consumption rate varied from a low of 0.023 g-KMnO4/kg/day for the MAAP aquifer material to a high of 8.4 g-KMnO4/kg/day for the NFF aquifer material (Table 9). The 7-day exposure period to represent the fast consumption rate was chosen here for convenience since the first reactor sampling episode was conducted at 7 days and we acknowledge that the consumption rate is much higher during the first several hours of exposure (as will be discussed in Section 5.2.4). For a given aquifer material the fast consumption rate increased with an increase in the oxidant to solids ratio (Figure 8); for example as the oxidant to solids mass ratio was increased for the LC34-USU aquifer material from 6 to 50 g/kg at a permanganate concentration of 10 g/L, the consumption rate increased from 0.40 to 0.95 g-KMnO4/kg/day, possibly due to auto decomposition of permanganate and the high possibility that permanganate ions attack reductive component associated with aquifer solids. Also for a given oxidant to solids ratio the fast consumption rate was observed to increase with an increase in permanganate concentration clearly indicating the sensitivity of the early time NOD results to experimental parameters.
31
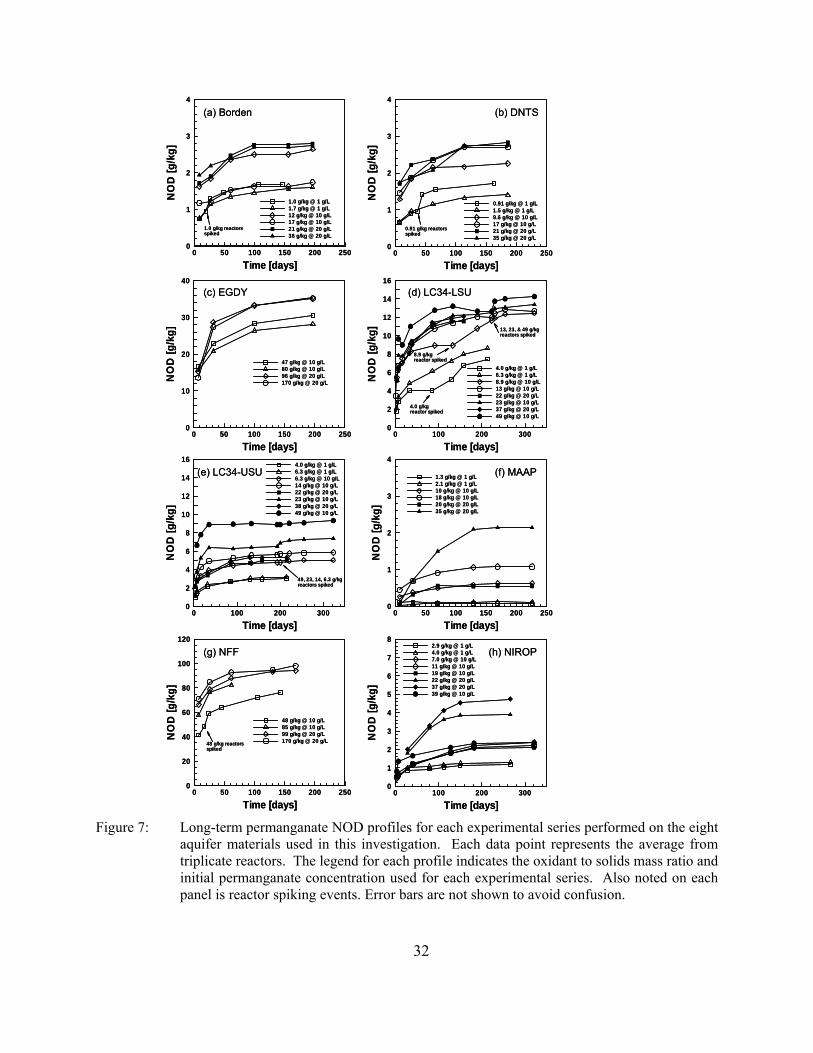
Time [days]
NO
D[g
/kg]
0 50 100 150 200 2500
1
2
3
4
0.91 g/kg @ 1 g/L1.5 g/kg @ 1 g/L9.6 g/kg @ 10 g/L17 g/kg @ 10 g/L21 g/kg @ 20 g/L35 g/kg @ 20 g/L
0.91 g/kg reactorsspiked
Time [days]
NO
D[g
/kg]
0 50 100 150 200 2500
10
20
30
40
47 g/kg @ 10 g/L80 g/kg @ 10 g/L96 g/kg @ 20 g/L170 g/kg @ 20 g/L
Time [days]
NO
D[g
/kg]
0 50 100 150 200 2500
1
2
3
4
1.0 g/kg @ 1 g/L1.7 g/kg @ 1 g/L12 g/kg @ 10 g/L17 g/kg @ 10 g/L21 g/kg @ 20 g/L36 g/kg @ 20 g/L
1.0 g/kg reactorsspiked
Time [days]
NO
D[g
/kg]
0 50 100 150 200 2500
20
40
60
80
100
120
48 g/kg @ 10 g/L85 g/kg @ 10 g/L99 g/kg @ 20 g/L170 g/kg @ 20 g/L48 g/kg reactors
spiked
Time [days]
NO
D[g
/kg]
0 50 100 150 200 2500
1
2
3
4
1.3 g/kg @ 1 g/L2.1 g/kg @ 1 g/L10 g/kg @ 10 g/L18 g/kg @ 10 g/L20 g/kg @ 20 g/L35 g/kg @ 20 g/L
(f) MAAP
(c) EGDY
(a) Borden
(g) NFF
(b) DNTS
Time [days]
NO
D[g
/kg]
0 100 200 3000
1
2
3
4
5
6
7
82.9 g/kg @ 1 g/L4.0 g/kg @ 1 g/L7.0 g/kg @ 10 g/L11 g/kg @ 10 g/L19 g/kg @ 10 g/L22 g/kg @ 20 g/L37 g/kg @ 20 g/L39 g/kg @ 10 g/L
(h) NIROP
Time [days]
NO
D[g
/kg]
0 100 200 3000
2
4
6
8
10
12
14
164.0 g/kg @ 1 g/L6.3 g/kg @ 1 g/L6.3 g/kg @ 10 g/L14 g/kg @ 10 g/L22 g/kg @ 20 g/L23 g/kg @ 10 g/L38 g/kg @ 20 g/L49 g/kg @ 10 g/L
49, 23, 14, 6.3 g/kgreactors spiked
(e) LC34-USU
(d) LC34-LSU
Time [days]
NO
D[g
/kg]
0 100 200 3000
2
4
6
8
10
12
14
16
4.0 g/kg @ 1 g/L6.3 g/kg @ 1 g/L8.9 g/kg @ 10 g/L13 g/kg @ 10 g/L22 g/kg @ 20 g/L23 g/kg @ 10 g/L37 g/kg @ 20 g/L49 g/kg @ 10 g/L
8.9 g/kgreactor spiked
13, 23, & 49 g/kgreactors spiked
4.0 g/kgreactor spiked
Time [days]
NO
D[g
/kg]
0 50 100 150 200 2500
1
2
3
4
0.91 g/kg @ 1 g/L1.5 g/kg @ 1 g/L9.6 g/kg @ 10 g/L17 g/kg @ 10 g/L21 g/kg @ 20 g/L35 g/kg @ 20 g/L
0.91 g/kg reactorsspiked
Time [days]
NO
D[g
/kg]
0 50 100 150 200 2500
10
20
30
40
47 g/kg @ 10 g/L80 g/kg @ 10 g/L96 g/kg @ 20 g/L170 g/kg @ 20 g/L
Time [days]
NO
D[g
/kg]
0 50 100 150 200 2500
1
2
3
4
1.0 g/kg @ 1 g/L1.7 g/kg @ 1 g/L12 g/kg @ 10 g/L17 g/kg @ 10 g/L21 g/kg @ 20 g/L36 g/kg @ 20 g/L
1.0 g/kg reactorsspiked
Time [days]
NO
D[g
/kg]
0 50 100 150 200 2500
20
40
60
80
100
120
48 g/kg @ 10 g/L85 g/kg @ 10 g/L99 g/kg @ 20 g/L170 g/kg @ 20 g/L48 g/kg reactors
spiked
Time [days]
NO
D[g
/kg]
0 50 100 150 200 2500
1
2
3
4
1.3 g/kg @ 1 g/L2.1 g/kg @ 1 g/L10 g/kg @ 10 g/L18 g/kg @ 10 g/L20 g/kg @ 20 g/L35 g/kg @ 20 g/L
(f) MAAP
(c) EGDY
(a) Borden
(g) NFF
(b) DNTS
Time [days]
NO
D[g
/kg]
0 100 200 3000
1
2
3
4
5
6
7
82.9 g/kg @ 1 g/L4.0 g/kg @ 1 g/L7.0 g/kg @ 10 g/L11 g/kg @ 10 g/L19 g/kg @ 10 g/L22 g/kg @ 20 g/L37 g/kg @ 20 g/L39 g/kg @ 10 g/L
(h) NIROP
Time [days]
NO
D[g
/kg]
0 100 200 3000
2
4
6
8
10
12
14
164.0 g/kg @ 1 g/L6.3 g/kg @ 1 g/L6.3 g/kg @ 10 g/L14 g/kg @ 10 g/L22 g/kg @ 20 g/L23 g/kg @ 10 g/L38 g/kg @ 20 g/L49 g/kg @ 10 g/L
49, 23, 14, 6.3 g/kgreactors spiked
(e) LC34-USU
(d) LC34-LSU
Time [days]
NO
D[g
/kg]
0 100 200 3000
2
4
6
8
10
12
14
16
4.0 g/kg @ 1 g/L6.3 g/kg @ 1 g/L8.9 g/kg @ 10 g/L13 g/kg @ 10 g/L22 g/kg @ 20 g/L23 g/kg @ 10 g/L37 g/kg @ 20 g/L49 g/kg @ 10 g/L
8.9 g/kgreactor spiked
13, 23, & 49 g/kgreactors spiked
4.0 g/kgreactor spiked
Figure 7: Long-term permanganate NOD profiles for each experimental series performed on the eight aquifer materials used in this investigation. Each data point represents the average from triplicate reactors. The legend for each profile indicates the oxidant to solids mass ratio and initial permanganate concentration used for each experimental series. Also noted on each panel is reactor spiking events. Error bars are not shown to avoid confusion.
32

Oxidant to solids ratio [g/kg]
Fast
rate
[g/k
g/da
y]
0 10 20 30 40 50 600
0.2
0.4
0.6
0.8
1
LC34-USU
DNTS
Borden
Figure 8: Scatter plot of the fast rate of permanganate consumption and the oxidant to solids mass ratio for each experimental series. The NOD expressed over the first 7 days was used to estimate the fast rate of permanganate consumption.
In general, a slow permanganate consumption rate ranging from 0.00050 to 0.0035 g-KMnO4/kg/day was observed for most of the aquifer materials used in this investigation by ~150 days of exposure to permanganate, with the exception of the EGDY and NFF aquifer materials which continued to have a relatively higher rate of 0.020 and 0.074 g-KMnO4/kg/day at the conclusion of their respective experiments (Table 9). Excluding these two aquifer materials, the overall average slow consumption rate was 0.0018 g-KMnO4/kg/day which is two-orders of magnitude lower then the average observed fast consumption rate.
For reactors in which permanganate was consumed prior to the termination of the experimental trial and were spiked, the consumption rate either remained consistent with the rate prior to the spiking event (Figure 7(e)) or increased presumably in response to the increase in permanganate concentration (Figure 7(b)). In cases where there was a dramatic increase in consumption due to a spiking event, the consumption rate returned quickly to the pre-spiked rate. In either case a permanganate-limiting reaction condition existed which was satisfied by the addition of permanganate.
Table 9 presents both the average NODmax and the overall maximum NOD ( ) from all the experimental series for each aquifer material. The average NODmax captures the expected outcome from a range of experimental parameters and the reflects the conservative
NOD and most likely should be used for design considerations. The varies from 2 to 98
*maxNOD
*maxNOD
NOD*max
33
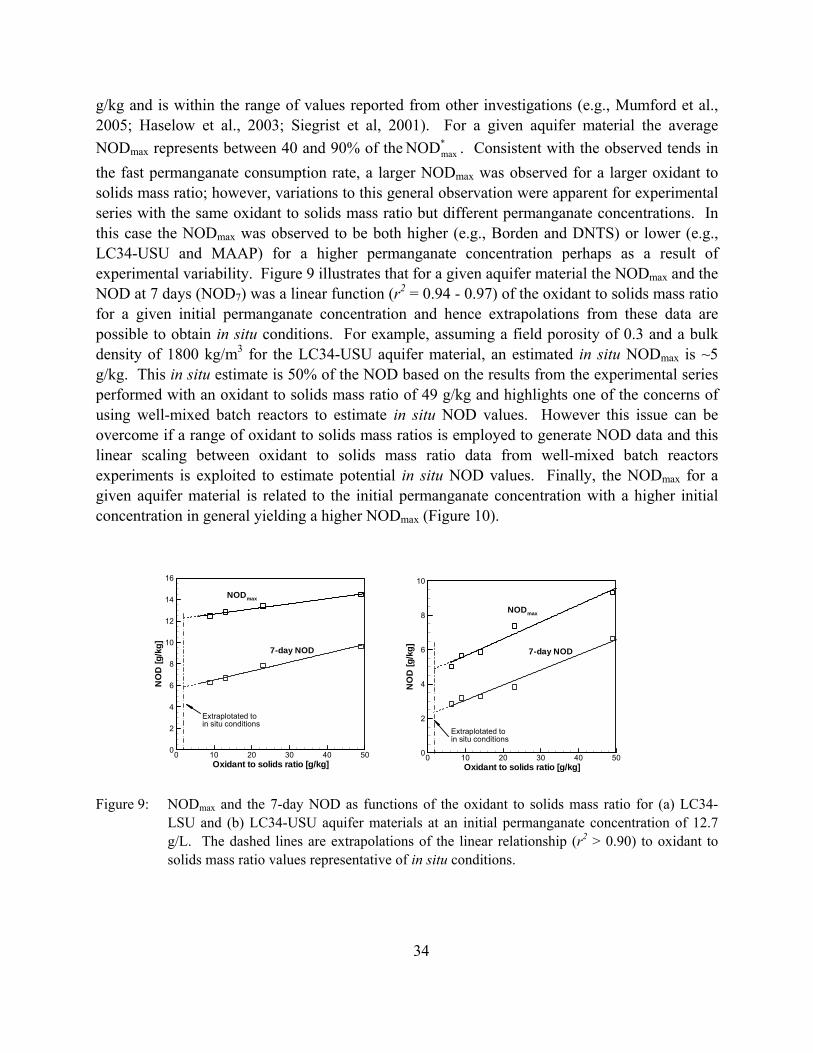
34
Oxidant to solids ratio [g/kg]
NO
D[g
/kg]
0 10 20 30 40 500
2
4
6
8
10
12
14
16
Extraplotated toin situ conditions
7-day NOD
NODmax
Oxidant to solids ratio [g/kg]
NO
D[g
/kg]
0 10 20 30 40 500
2
4
6
8
10
Extrain sit
plotated tou conditions
7-day NOD
NODmax
g/kg and is within the range of values reported from other investigations (e.g., Mumford et al., 2005; Haselow et al., 2003; Siegrist et al, 2001). For a given aquifer material the average NODmax represents between 40 and 90% of the . Consistent with the observed tends in the fast permanganate consumption rate, a larger NODmax was observed for a larger oxidant to solids mass ratio; however, variations to this general observation were apparent for experimental series with the same oxidant to solids mass ratio but different permanganate concentrations. In this case the NODmax was observed to be both higher (e.g., Borden and DNTS) or lower (e.g., LC34-USU and MAAP) for a higher permanganate concentration perhaps as a result of experimental variability. Figure 9 illustrates that for a given aquifer material the NODmax and the NOD at 7 days (NOD7) was a linear function (r2 = 0.94 - 0.97) of the oxidant to solids mass ratio for a given initial permanganate concentration and hence extrapolations from these data are possible to obtain in situ conditions. For example, assuming a field porosity of 0.3 and a bulk density of 1800 kg/m3 for the LC34-USU aquifer material, an estimated in situ NODmax is ~5 g/kg. This in situ estimate is 50% of the NOD based on the results from the experimental series performed with an oxidant to solids mass ratio of 49 g/kg and highlights one of the concerns of using well-mixed batch reactors to estimate in situ NOD values. However this issue can be overcome if a range of oxidant to solids mass ratios is employed to generate NOD data and this linear scaling between oxidant to solids mass ratio data from well-mixed batch reactors experiments is exploited to estimate potential in situ NOD values. Finally, the NODmax for a given aquifer material is related to the initial permanganate concentration with a higher initial concentration in general yielding a higher NODmax (Figure 10).
*maxNOD
Figure 9: NODmax and the 7-day NOD as functions of the oxidant to solids mass ratio for (a) LC34-LSU and (b) LC34-USU aquifer materials at an initial permanganate concentration of 12.7 g/L. The dashed lines are extrapolations of the linear relationship (r2 > 0.90) to oxidant to solids mass ratio values representative of in situ conditions.
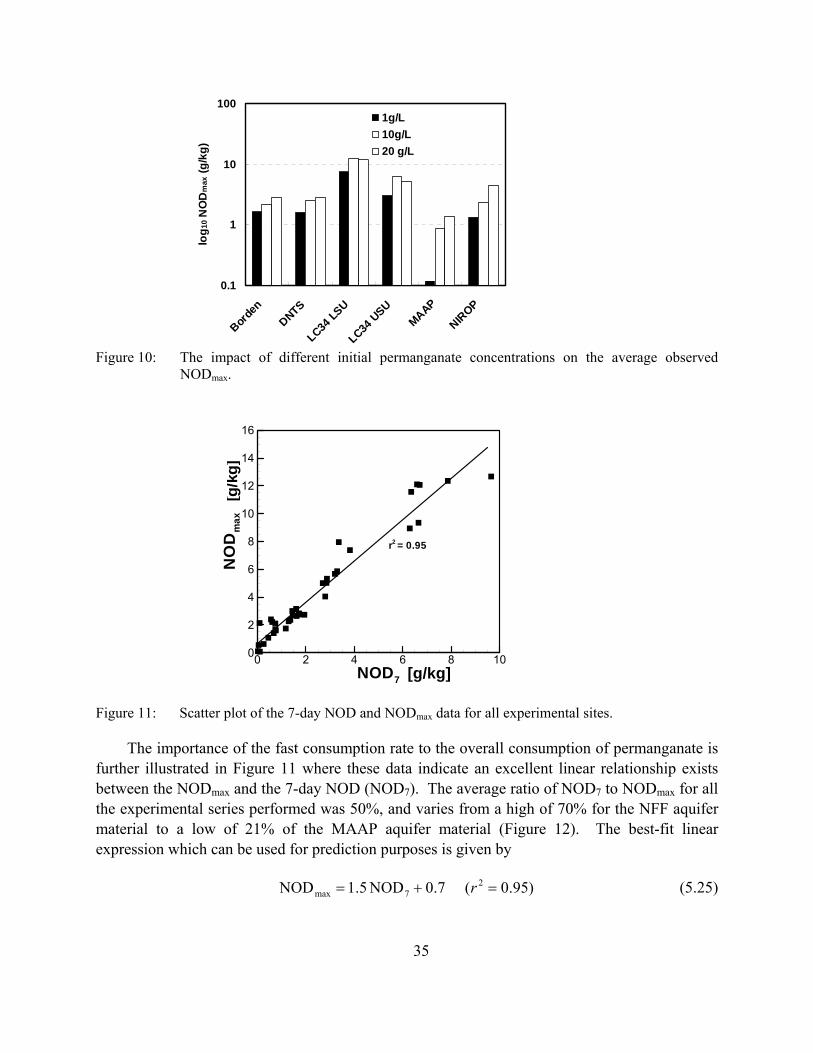
0.1
1
10
100
Borde
nDNTS
LC34 LS
U
LC34 U
SUMAAP
NIROP
log 1
0 NO
Dm
ax (g
/kg)
1g/L10g/L20 g/L
Figure 10: The impact of different initial permanganate concentrations on the average observed NODmax.
NOD7
NO
Dm
ax
0 2 4 6 8 100
2
4
6
8
10
12
14
16
r2 = 0.95
[g/k
g]
[g/kg]
Figure 11: Scatter plot of the 7-day NOD and NODmax data for all experimental sites.
The importance of the fast consumption rate to the overall consumption of permanganate is further illustrated in Figure 11 where these data indicate an excellent linear relationship exists between the NODmax and the 7-day NOD (NOD7). The average ratio of NOD7 to NODmax for all the experimental series performed was 50%, and varies from a high of 70% for the NFF aquifer material to a low of 21% of the MAAP aquifer material (Figure 12). The best-fit linear expression which can be used for prediction purposes is given by
)95.0(7.0NOD5.1NOD 27max =+= r (5.25)
35

where NOD7 and NODmax are in terms of g of KMnO4 per kg. This linear relationship implies that NOD profiles are scaleable over time; a concept that is supported by the approximately identical difference between the NOD7 and NODmax values across a range of oxidant to solids mass ratios for the LC34-USU aquifer material (Figure 9).
0.36
0.67
0.21
0.60
0.58
0.47
0.16
0.61
0.57
0.01
0.1
1
10
100
1000
BORDENDNTS
EGDYLA
AP
LC34
-LSU
LC34
-USU
MAAPNFF
NIROP
NO
D (g
/kg)
Avg. 7-day NOD
Avg. Maximum NOD
Figure 12: Observed maximum NOD and NOD at 7 days. The number above the bar indicates the ratio of the 7-day NOD value to the maximum NOD value.
Reduction in COD [g/kg]
NO
Dm
ax
0 5 10 15 20 25 300
2
4
6
8
10
12
14
r2 = 0.95
[g/k
g]
Figure 13: Reduction in COD test values after aquifer materials exposed to permanganate for Borden, DNTS, LC34-LSU, LC34-USU, MAAP, and NIROP aquifer materials compared with observed NODmax for each experimental series.
The reduction in the COD test values for each experimental series varied from a low of 1% for the MAAP aquifer material to as high at 96% for the LC34-LSU and LC34-USU aquifer materials. This reduction in COD test values is related to the NODmax (Figure 13). Since the initial COD test values can be used as a surrogate for the potentially oxidizable aquifer material
36
as concluded from Section 5.1, the non-zero COD test values at the termination of each experimental series are consistent with the findings reported by Mumford et al. (2005) and indicate that not all of the reduction capacity that is captured by dichromate COD test is oxidizable by permanganate.
Correlation Analysis
In an attempt to relate the various NOD profile metrics (average and maximum NOD7, and average NODmax and ) to relevant aquifer material characteristics (including soil pH, surface area, CEC, total and amorphous Fe and Mn, and TOC) a correlation analysis was preformed excluding data for the NFF aquifer material. The results from this analysis indicated that: (i) the maximum NOD7 and the are highly correlated with TOC content (r = 0.93 and 0.90 respectively), and this correlation only increases slightly with the addition of amorphous Fe (r = 0.94 and 0.91 respectively); (ii) the average NOD7 and average NODmax are highly correlated with TOC content (r = 0.90 and 0.88 respectively); (iii)the average NOD expressed after the 7 days was highly correlated with TOC content (r = 0.86); and (iv) all NOD metrics showed little correlation (r < 0.5) with soil pH, surface area, CEC, and total Fe, and a mild correlation with total Mn (r < 0.75)). The high degree of correlation between the TOC content and the NOD metrics implies that organic carbon is the major reduced species contributing to permanganate consumption for the aquifer materials used in this investigation. Based on this analysis the following empirical relationships were developed and can be used to estimate average NOD7, average NODmax, and
*maxNOD
*maxNOD
*maxNOD
(26a)
⎩⎨⎧
=++=−
=0.826.1Fe) amorphous(TOC0.360.805.1)TOC(36.0
NOD Avg 2
2
7 rr
⎩⎨⎧
=++=−
=0.800.7Fe) amorphous(TOC0.740.784.3)TOC(74.0
NODAvg 2
2
max rr
(26b)
37
⎩⎨⎧
=++=−
=0.838.2Fe) amorphous(TOC0.810.813.2)TOC(80.0
NOD 2
2*max r
r
(26c)
where the units for all terms are expressed in g of KMnO4 per kg of dry aquifer material, and assuming that phthalic acid is a reasonable model compound for the reduction capacity of the TOC content (Barcelona and Holm, 1991) (1 mg/g of TOC = 16.46 g of KMnO4/kg), and the amorphous Fe is in a reduced form (1 mg/g of Fe = 0.94 g of KMnO4/kg). NOD Profile Normalization
As mentioned above, the NOD profiles appear to be scalable over time and following the approach used by Mumford et al. (2005), each NOD profile was normalized by the their

respective NODmax and fit to a logarithmic function of time expressed as
[ ]bta +⋅= )ln(NODNOD(t) max (t ≥ 7) (27)
where a and b are fitting parameters, and t is the time in days. Figure 14 shows examples of the excellent fits of Eq (27) to the DNTS and LC34-USU NOD data, and in general the coefficient of determination was > 0.94 for all fits. The slope parameter a represents the normalized rate of permanganate consumption and the average value for overall aquifer materials and initial concentrations was 0.14 with a 12% coefficient of variation. Attempts to correlate the a and b fitting parameters from NOD profiles with similar oxidant to solids ratio to aquifer material characteristics were unsuccessful perhaps due to experimental variability or the similarity amongst the aquifer material used in this investigation. If only the NOD profiles with an initial KMnO4 concentration of 20 g/L are used, then statistically significant expressions of parameters a and b are given by:
)Fe amorphous(744.0104.0 +=a
r2 = 0.78 (28)
CEC 0158.0Fe) (amorphous 251.0514.0 −−=b r2 = 0.96 (29)
where amorphous Fe is in terms of mg/g, CEC in terms of cmol(+ev)/kg, and all regression coefficients are statistically significant at a level of significance (LOS) of 0.05.
38
ln(time)
NO
D/N
OD
max
0 1 2 3 4 5 60.2
0.4
0.6
0.8
1
1.5 g/kg @ 1g/L
21g/kg @ 20 g/L
17 g/kg @ 10 g/L
(a)
ln(time)
NO
D/N
OD
max
0 1 2 3 4 5 60.2
0.4
0.6
0.8
1
4.0 g/kg @ 1g/L
14 g/kg @ 10 g/L
22 g/kg @ 20 g/L
(b)
Figure 14: Best-fit logarithm functions to normalization NOD profiles for (a) DNTS and (b) LC34-USU aquifer materials.
Substituting Eqs (28) and (29) into Eq. (27), an empirical equation to estimate the temporal NOD is obtained for an initial concentration of 20g/L, as given by:
[ ][ ]⎭
⎬⎫
⎩⎨⎧
−+⋅+
=CEC 0.0158-Fe) (amorphous 251.0514.0
)ln(Fe) (amorphous 744.0104.0NOD)(NOD max
tt (30)
Interestingly, the parameters a and b are not related to TOC which is generally considered to be a major reductant. One possible explanation is that TOC is related to NODmax (as indicated by Eq. 26) and its primary effects have been removed as part of the normalization. The parameter a represents the normalized rate of permanganate consumption. Since CEC indicates the availability of reacting species which are held by negatively charged colloids that have a comparatively large surface area, the strong dependence of parameters a and b on the amorphous Fe content and/or CEC indicates the rate of permanganate consumption may be surface-controlled.
Unfortunately, the lack of sufficient and proper data for other initial concentration levels restricts the development of other permanganate NOD expressions. Given sufficient observations and following the similar procedure as detailed above, temporal permanganate NOD expressions corresponding to other initial permanganate concentrations can be developed.
Manganese Oxide Deposition
The theoretical reduction of permanganate will produce manganese dioxide according to the reaction given by Eq.(12) or Eq.(13). Visual inspection of the post-experimental materials revealed some level of color change of solid grains compared to the pre-experimental materials and dark brown fine particles were present. These dark brown colloidal-like particles are believed to be manganese dioxide, which is the end-product of permanganate reduction by aquifer materials. The quantity of manganese dioxide was observed to be large in reactors containing the NFF and EGDY aquifer materials and smaller in the reactors containing the MAAP and DNTS aquifer materials. If all the permanganate consumed within the batch reactors was presumably reduced to manganese, then quantification of the bulk soil concentration of manganese would provide an indication of the magnitude of this assumed end-product of permanganate reduction, and the level of manganese oxide precipitates associated with the solids. Based on the manganese data determined from selected aquifer material samples after exposure to permanganate for more than 250 days, an equivalent NOD (NODMn) (one mole or 159 g of potassium permanganate is equivalent to 1 mole or 55 g of manganese) was calculated and is presented in Figure 15 along with NODmax data. This figure shows an excellent linear relationship between NODmax and NODMn (r2 = 0.94) and indicates that approximately 97% of permanganate consumed in these batch reactors produced Mn (presumably as manganese dioxide) that was associated with the aquifer solids.
The presence of this manganese oxide coating on the grains will restrict the ability of permanganate to further oxidize reduced species either on the surface or internal to the grains. To investigate this hypothesis, we used Chao’s method (Chao, 1972) to remove the manganese
39
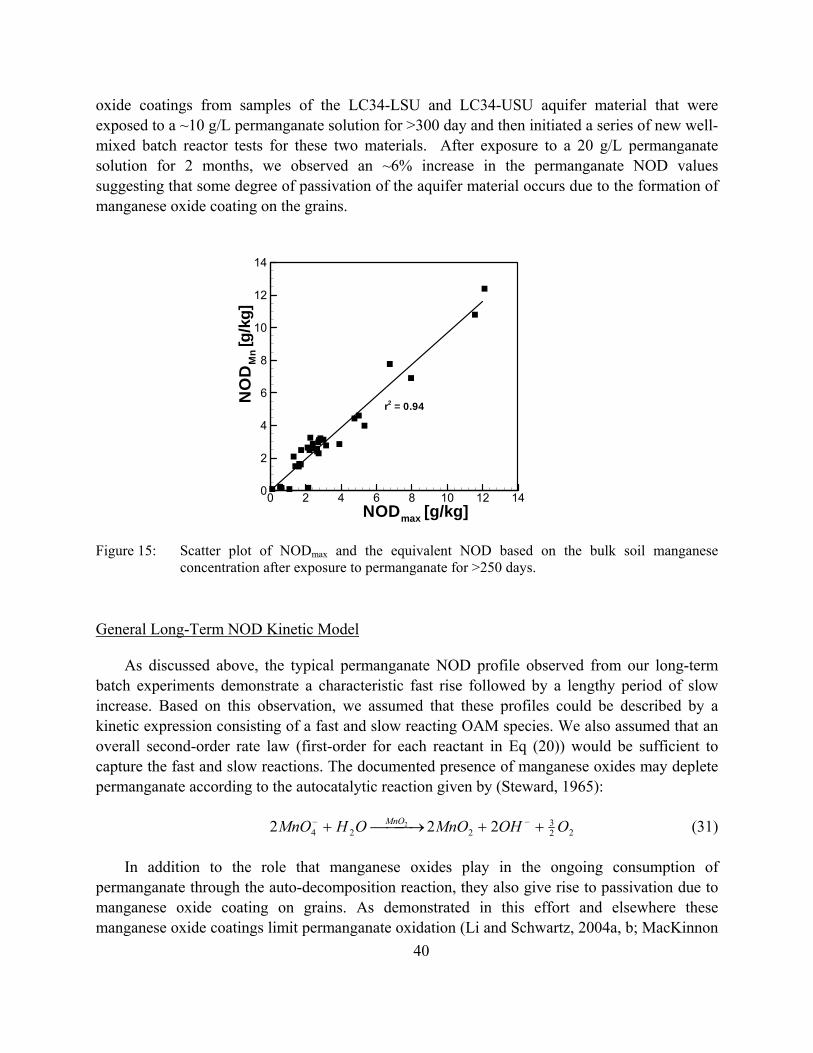
oxide coatings from samples of the LC34-LSU and LC34-USU aquifer material that were exposed to a ~10 g/L permanganate solution for >300 day and then initiated a series of new well-mixed batch reactor tests for these two materials. After exposure to a 20 g/L permanganate solution for 2 months, we observed an ~6% increase in the permanganate NOD values suggesting that some degree of passivation of the aquifer material occurs due to the formation of manganese oxide coating on the grains.
NODmax
NO
DM
n
0 2 4 6 8 10 12 140
2
4
6
8
10
12
14
r2 = 0.94
[g/k
g]
[g/kg]
Figure 15: Scatter plot of NODmax and the equivalent NOD based on the bulk soil manganese
concentration after exposure to permanganate for >250 days.
General Long-Term NOD Kinetic Model
As discussed above, the typical permanganate NOD profile observed from our long-term batch experiments demonstrate a characteristic fast rise followed by a lengthy period of slow increase. Based on this observation, we assumed that these profiles could be described by a kinetic expression consisting of a fast and slow reacting OAM species. We also assumed that an overall second-order rate law (first-order for each reactant in Eq (20)) would be sufficient to capture the fast and slow reactions. The documented presence of manganese oxides may deplete permanganate according to the autocatalytic reaction given by (Steward, 1965):
223
224 222 2 OOHMnOOHMnO MnO ++⎯⎯ →⎯+ −− (31)
In addition to the role that manganese oxides play in the ongoing consumption of permanganate through the auto-decomposition reaction, they also give rise to passivation due to manganese oxide coating on grains. As demonstrated in this effort and elsewhere these manganese oxide coatings limit permanganate oxidation (Li and Schwartz, 2004a, b; MacKinnon
40
and Thomson, 2002). In this kinetic model, we assume that this passivation can be captured by a decreasing reaction rate coefficient for the slow reacting OAM which is equivalent to increasing the diffusional resistance with an increase in the manganese oxide coating thickness. For simplicity, we assumed a linear expression given by:
( ) ⎟⎟⎠
⎞⎜⎜⎝
⎛−=
aq
MnOp
slowOAM
slowOAM m
mkkk 20 (32)
where is the reaction rate coefficient with respect to the slow reacting OAM ([L3M-1T-1]), kp is an empirical reduction factor ([L3M-1T-1]), and are the mass of manganese oxide produced [M] (which can be calculated based on the mass decrease of permanganate) and the mass of aquifer material [M]; and the supscript “0” denotes the manganese dioxide free situation. Therefore, the governing batch system equations are given by:
slowOAMk
2MnOm aqm
TMnOMnOTMnOslowOAM
slowoxTMnO
fastOAM
fastox
TMnO VCkVCCkVCCkdt
VCd−−−
−
−−−=4244
4)(
θθθθ
(33a)
for the rate of change of permanganate,
TMnOfast
OAMfast
OAMT
fastOAM VCCkdt
VdC−−=4
(33b)
for the rate of change of fast reaction OAM, and
TMnOslowOAM
slowOAM
TslowOAM VCCkdt
VdC−−=4
(33c)
for the rate of change of the slow reacting OAM, where θ is the porosity of the system ([L3Lֿ3]), defined as volume of solution per volume of system, and are the concentrations of
the bulk OAM and permanganate ([ML-1], defined by mass of OAM per volume of system and mass of KMnO4 per volume of system, respectively; and are reaction rate coefficients with respect to permanganate and OAM ([L3M-1T-1]); the supscripts “fast” and “slow” denote the “fast reaction” and “slow reaction”, respectively; is the rate coefficient for the permanganate auto-decomposition reaction catalyzed by MnO2 ([T-1]), VT is the total volume of the system, and t is time.
OAMC
oxk
MnOk
−4MnOC
OAMk
2
41
We also assumed that the concentration of OAM could be represented by dichromate chemical oxygen demand (DCOD) test values which serve as a surrogate for the aquifer material reduction capacity as discussed in Section 5.1. Finally, based on mass balance considerations, the stoichiometric mass ratio between permanganate and OAM can be expressed as:
bfast
OAM
fastox
fast kk
ρθ
β = (34a)
( ) bslowOAM
slowox
slowk
k
ρ
θβ 0= (34b)
where β is permanganate mass required by per unit mass of OAM, and ρb is the bulk density of system ([ML-3], mass of solids/volume of system).
Parameters in this kinetic model can be grouped into three categories: (1) the system parameters, θ, ρb, and VT, which are set by the experimental conditions for each batch test; (2) literature parameters , βfast, and βslow which can be assigned reasonable values from the
literature; and (3) the fitting parameters kp, , , and which must be obtained
through model calibration. The first-order coefficient rate coefficient ( ) for the permanganate auto-decomposition reaction catalyzed by manganese oxide was assigned to a value of 5 x 10⁻⁵ day-1 as reported by Steward (1965) for a neutral 0.02 M permanganate solution that decomposed by 0.2% over 6 months. This value of is consistent with the range of first-order rate coefficients estimated from the tails of the long-term NOD profiles (1 x 10⁻⁴ to 1 x 10⁻⁵ day-1). The stoichiometric mass ratio between permanganate and the slow OAM (βslow) was assigned a value of 12 based on the observations reported by Mumford et al. (2005) while βfast was assigned a value of 2.0 based on the assumption that fast reacting OAM species were low-carbon organic matter or highly oxidized forms of organic matter (e.g., organic acids) and minerals containing Fe(II), Mn(II), and S(-II) etc. Model calibration was performed using a least-squares estimator where the fitting parameters were given an initial estimate and bounds. The remaining model parameters ( , , and C ) are related to the fitting parameters through Eq (34) and by
2MnOkfast
oxk slowoxk
slowOAM
fastOAMC
2MnOk
2MnOk
fastOAMk slow
OAMk
finalinitialslowOAM
fastOAM DCODDCODCC −=+ (35)
where DCODinitial and DCODfinal are the initial and final dichromate COD test values expressed in g-KMnO4/kg of dry aquifer material.
The model calibration for experiments using the Borden, DNTS, EGDY, and MAAP aquifer materials is listed in Table 10, and the simulated NOD profiles are shown in Figure 16. The portion of the fast reacting OAM for all aquifer materials is considerably less than the slow
42
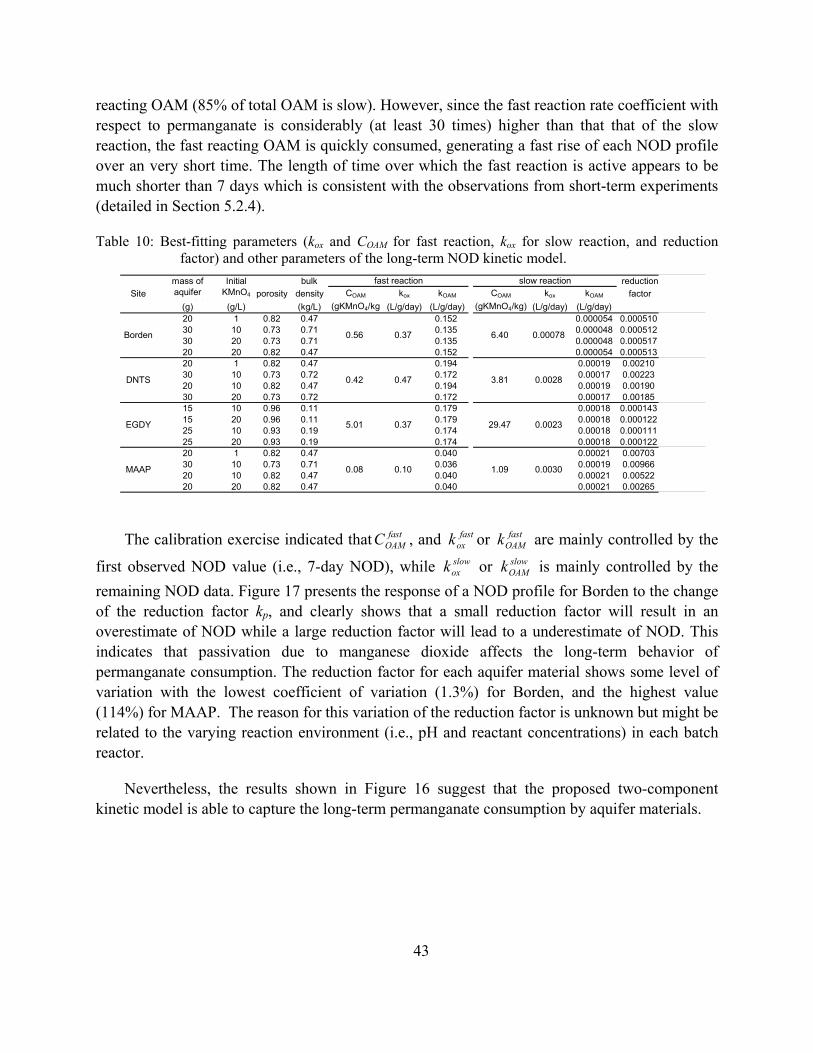
reacting OAM (85% of total OAM is slow). However, since the fast reaction rate coefficient with respect to permanganate is considerably (at least 30 times) higher than that that of the slow reaction, the fast reacting OAM is quickly consumed, generating a fast rise of each NOD profile over an very short time. The length of time over which the fast reaction is active appears to be much shorter than 7 days which is consistent with the observations from short-term experiments (detailed in Section 5.2.4).
Table 10: Best-fitting parameters (kox and COAM for fast reaction, kox for slow reaction, and reduction factor) and other parameters of the long-term NOD kinetic model.
bulk reductionSite porosity density COAM kox kOAM COAM kox kOAM factor
(g) (g/L) (kg/L) (gKMnO4/kg (L/g/day) (L/g/day) (gKMnO4/kg) (L/g/day) (L/g/day)20 1 0.82 0.47 0.152 0.000054 0.00051030 10 0.73 0.71 0.135 0.000048 0.00051230 20 0.73 0.71 0.135 0.000048 0.00051720 20 0.82 0.47 0.152 0.000054 0.00051320 1 0.82 0.47 0.194 0.00019 0.0021030 10 0.73 0.72 0.172 0.00017 0.0022320 10 0.82 0.47 0.194 0.00019 0.0019030 20 0.73 0.72 0.172 0.00017 0.0018515 10 0.96 0.11 0.179 0.00018 0.00014315 20 0.96 0.11 0.179 0.00018 0.00012225 10 0.93 0.19 0.174 0.00018 0.00011125 20 0.93 0.19 0.174 0.00018 0.00012220 1 0.82 0.47 0.040 0.00021 0.0070330 10 0.73 0.71 0.036 0.00019 0.0096620 10 0.82 0.47 0.040 0.00021 0.0052220 20 0.82 0.47 0.040 0.00021 0.00265
0.00078
0.08 0.10 1.09 0.0030
3.81 0.0028DNTS
EGDY
MAAP
mass ofaquifer
t i l
InitialKMnO4
Borden
fast reaction slow reaction
5.01 0.37 29.47 0.0023
0.42 0.47
0.56 0.37 6.40
The calibration exercise indicated that , and or are mainly controlled by the
first observed NOD value (i.e., 7-day NOD), while or is mainly controlled by the remaining NOD data. Figure 17 presents the response of a NOD profile for Borden to the change of the reduction factor kp, and clearly shows that a small reduction factor will result in an overestimate of NOD while a large reduction factor will lead to a underestimate of NOD. This indicates that passivation due to manganese dioxide affects the long-term behavior of permanganate consumption. The reduction factor for each aquifer material shows some level of variation with the lowest coefficient of variation (1.3%) for Borden, and the highest value (114%) for MAAP. The reason for this variation of the reduction factor is unknown but might be related to the varying reaction environment (i.e., pH and reactant concentrations) in each batch reactor.
fastOAMC fast
oxkslowoxk
fastOAMk
slowOAMk
Nevertheless, the results shown in Figure 16 suggest that the proposed two-component kinetic model is able to capture the long-term permanganate consumption by aquifer materials.
43

44
5.2.3 Summary
This investigation indicates that the rate of permanganate consumption (i.e., the overall reaction rate) is strongly affected by the oxidant to solids mass loading ratio, and the initial permanganate concentration. An higher initial permanganate concentration or higher oxidant to solids mass ratio produced relatively faster NOD reaction rates and generated corresponding higher values of NODmax. In addition, it appears that TOC content determines the maximum NOD value while amorphous Fe content, along with CEC, determines the permanganate consumption rate by aquifer materials.
The first principles and experimental data suggest that the permanganate consumption by aquifer materials is at least consisted of a fast and a slow reaction, accordingly, a conceptual kinetic model accounting of these two reactions was developed to kinetically capture the permanganate NOD profiles observed from long-term experiments. Meanwhile, empirical expression of long-term permanganate NOD (at an initial KMnO4 concentration of 20 g/L) in terms of aquifer materials was also developed, which is expected to provide a guideline for developing NOD empirical expressions under other initial permanganate concentrations.
The end-product of permanganate reduction by aquifer materials is manganese dioxide, which might play an important role in 1) auto-decomposition of permanganate, and 2) passivation to the permanganate reaction with OAM due to its coating on the grain surface.
The result suggests that variations in experimental design will impact reported NOD values, and the kinetic nature of NOD reaction(s) cannot be ignored. Batch experimental determination of a temporal NOD should employ the expected permanganate concentration to be used in situ along with various permanganate to solid mass ratios. Assuming the same controlling factors also affect the oxidant stability in situ, the estimation of in situ permanganate NOD can then be obtained by linear extrapolation.

Time (day)
NO
D(g
/kg)
0 50 100 150 200 2500
1
2
320 g @ 1 g/L20 g @ 10 g/Lmodel 20 g @ 1 g/Lmodel 20 g @ 10 g/L
MAAP
Time (day)
NO
D(g
/kg)
0 50 100 150 200 2500
1
2
330 g @ 10 g/L20 g @ 20 g/Lmodel 30 g @ 10 g/Lmodel 20 g @ 20 g/L
MAAP
Time (day)
NO
D(g
/kg)
0 50 100 150 2000
10
20
30
40
15 g @ 10 g/L15 g @ 20 g/Lmodel 15 g @ 10 g/Lmodel 15 g/kg @ 20 g/L
EGDY
Time (day)
NO
D(g
/kg)
0 50 100 150 2000
10
20
30
40
25 g @ 10 g/L25 g @ 20 g/Lmodel 25 g @ 10 g/Lmodel 25 g/kg @ 20 g/L
EGDY
Time (day)
NO
D(g
/kg)
0 50 100 150 2000
1
2
3
20 g @ 1 g/L20 g @ 10 g/Lmodel 20 g @ 1 g/Lmodel 20g @ 10 g/L
DNTS
Time (day)
NO
D(g
/kg)
0 50 100 150 2000
1
2
3
30 g @ 10 g/L30 g @ 20 g/Lmodel 30g @ 10 g/Lmodel 30 g @ 20 g/L
DNTS
Time (day)
NO
D(g
/kg)
0 50 100 150 2000
1
2
3
20 g @ 1 g/L20 g @ 20 g/Lmodel 20 g @ 1 g/Lmodel 20 g @ 20 g/L
Borden
Time (day)
NO
D(g
/kg)
0 50 100 150 2000
1
2
3
30 g @ 10 g/L30 g @ 20 g/LModel 30 g @ 10 g/Lmodel 30 g @ 20 g/L
Borden
Time (day)
NO
D(g
/kg)
0 50 100 150 200 2500
1
2
320 g @ 1 g/L20 g @ 10 g/Lmodel 20 g @ 1 g/Lmodel 20 g @ 10 g/L
MAAP
Time (day)
NO
D(g
/kg)
0 50 100 150 200 2500
1
2
330 g @ 10 g/L20 g @ 20 g/Lmodel 30 g @ 10 g/Lmodel 20 g @ 20 g/L
MAAP
Time (day)
NO
D(g
/kg)
0 50 100 150 2000
10
20
30
40
15 g @ 10 g/L15 g @ 20 g/Lmodel 15 g @ 10 g/Lmodel 15 g/kg @ 20 g/L
EGDY
Time (day)
NO
D(g
/kg)
0 50 100 150 2000
10
20
30
40
25 g @ 10 g/L25 g @ 20 g/Lmodel 25 g @ 10 g/Lmodel 25 g/kg @ 20 g/L
EGDY
Time (day)
NO
D(g
/kg)
0 50 100 150 2000
1
2
3
20 g @ 1 g/L20 g @ 10 g/Lmodel 20 g @ 1 g/Lmodel 20g @ 10 g/L
DNTS
Time (day)
NO
D(g
/kg)
0 50 100 150 2000
1
2
3
30 g @ 10 g/L30 g @ 20 g/Lmodel 30g @ 10 g/Lmodel 30 g @ 20 g/L
DNTS
Time (day)
NO
D(g
/kg)
0 50 100 150 2000
1
2
3
20 g @ 1 g/L20 g @ 20 g/Lmodel 20 g @ 1 g/Lmodel 20 g @ 20 g/L
Borden
Time (day)
NO
D(g
/kg)
0 50 100 150 2000
1
2
3
30 g @ 10 g/L30 g @ 20 g/LModel 30 g @ 10 g/Lmodel 30 g @ 20 g/L
Borden
45
Figure 16: The observed and simulated NOD profiles for batch experiments with the Borden, DNTS, EGDY, and MAAP aquifer materials.

Time (day)
NO
D(g
/kg)
0 50 100 150 2000
2
4
6
8
10
12
14
kp = 0.0006
kp = 0.000513kp = 0.0004
kp = 0.0
Figure 17: The influence of the change of reduction factor kp on the simulated permanganate NOD profile. Square symbols represent the observed NOD values for the test with 20 g Borden aquifer material exposed to a KMnO4 solution with an initial concentration of 20 g/L.
46
47
5.3 Permanganate COD Tests
As discussed in Section 5.1.5, the dichromate COD method has been able to provide reliable results for water and wastewater applications (APHA, 1998). Barcelona and Holm (1991) described modifications to the standard water/wastewater COD test to estimate the reduction capacity of aquifer materials. Our dichromate COD results, as shown in Section 5.1.5, indicated that these modifications could provide reliable estimates of the TRC of aquifer solids. However, a fraction of the complex natural organic matter, and various crystalline and amorphous inorganic components present in aquifer materials may be recalcitrant to permanganate (Christensen et al., 2000; Evanko and Dzomak, 1998; Blair et al., 1995) and therefore using the dichromate COD test to estimate permanganate consumption will lead to significant overestimation.
Permanganate was used as a specified oxidant in the COD test prior to dichromate (APHA, 1946; Burtle and Buswell, 1937); however, some reduced compounds such as acetic acid, propionic acid, butyric acid, stearate acid, and nitrogen species are not readily oxidized by permanganate (APHA, 1946; Burtle and Buswell, 1937; Eckenfelder and Hood, 1950). In response to the inability of permanganate to oxidize some forms of organic compounds in industrial wastewaters, non-uniformity of results and problems with manganese dioxide precipitates, permanganate was replaced by dichromate (Moore et al., 1949, 1951). However, permanganate is still used as a specified oxidant in the COD test for the water industry in Europe (European Environmental Agency, 1999), Japan (Fujimori et al., 2001), and China (Zhou, 1994) due to the advantages of a non-toxic waste stream and its ease of handling.
Considering that the dichromate COD test for aquifer solids is an extension from that used for water and wastewater, the work here attempts to extend the permanganate COD test used in the water and wastewater application to a test of aquifer solids since the ultimate permanganate consumption rather than dichromate demand by aquifer materials is of interest in permanganate treatment applications.
5.3.1 Methods
The developed permanganate COD test is similar in principle to the dichromate COD test described in Section 5.1.5. Aliquots of the dry ground solids (~1.5 g) were transferred to pre-cleaned reaction tubes and 10 mL of a 20% (w/w) concentrated sulfuric acid solution (EM Science) and 15 mL of a 10 g/L KMnO4 solution was added. The potassium permanganate solution was prepared by adding analytical grade KMnO4 (EM Science) to Milli-Q water and boiling for ~1 hour. The cooled solution was then filtered using a 0.45-mm glass fibre filter (Pall Corporation). Each reaction tube was sealed, inverted by hand 3 to 4 times and then heated at 85oC for 2 hours (PMC, Model 350). We used an elevated temperature of 85oC rather than 150 oC as used in the dichromate COD test to be consistent with the historical permanganate COD

48
test for wastewater (APHA, 1946). After cooling, the reaction tubes were centrifuged for 1 hour at 4000 rpm (Beckman, Model TJ-6) to clear the supernatant solution for spectrophotometric measurement (Milton Roy, 20D) of un-reacted potassium permanganate at 525 nm. A standard curve using sodium oxalate (BDH Laboratories) was developed in parallel, and used to quantify the chemical oxygen demand. Sodium oxalate has a theoretical KMnO4 demand of 0.4718 g/g (Method 4500; APHA, 1998) and based on the developed standard curve and the mass of aquifer material used, the KMnO4 demand (g KMnO4/kg of aquifer material) was determined. All tests were performed five times for each aquifer material. A separate series of experiments was also performed to confirm the theoretical KMnO4 demand of sodium oxalate. These experiments involved adding between 0.002 to 0.200 g of sodium oxalate and the same volume and concentration of sulfuric acid and KMnO4 solution as discussed above to reaction tubes. After digestion, the observed mass of KMnO4 consumed per mass of sodium oxalate was determined to be 0.429 ± 0.047 g/g. This measured consumption is not statistically different from the theoretical KMnO4 demand of sodium oxalate and therefore the theoretical demand of 0.4718 g/g was used in this effort.
As part of the development of this permanganate COD test method it was of interest to explore how the test method results varied due to changes in mass of aquifer material, initial permanganate concentration, and reaction duration. To assess these variations we performed a series of experiments using a sub-set of aquifer materials where the mass of aquifer material was varied from 1.0 to 2.0 g, the permanganate concentration was varied from 5 to 20 g/L, and the reaction duration was varied from 0.5 to 3.0 hours.
5.3.2 Results
The average results from the permanganate COD analyses are listed in Table 11. For comparison, the dichromate COD, Maximum NOD, and total reductive capacities (TRC) contributed from TOC, Fe, and Mn are also listed in Table 11. (Although TOC, Fe, and Mn were used to calculate the TRC, we acknowledge that only their reduced contents contribute to the TRC of each aquifer material). From Table 11, except for the results for LC34 USU aquifer material, the dichromate COD test results are 20 to 70% higher (avg. of 50%) than the permanganate COD test results which is not surprising since dichromate can oxidize a wider range of species relative to permanganate (APHA, 1998; Boyles, 1997). The average coefficient of variation for the permanganate COD test and the dichromate COD test are similar (12% compared to 9%) suggesting a comparable level of variability between the two methods.
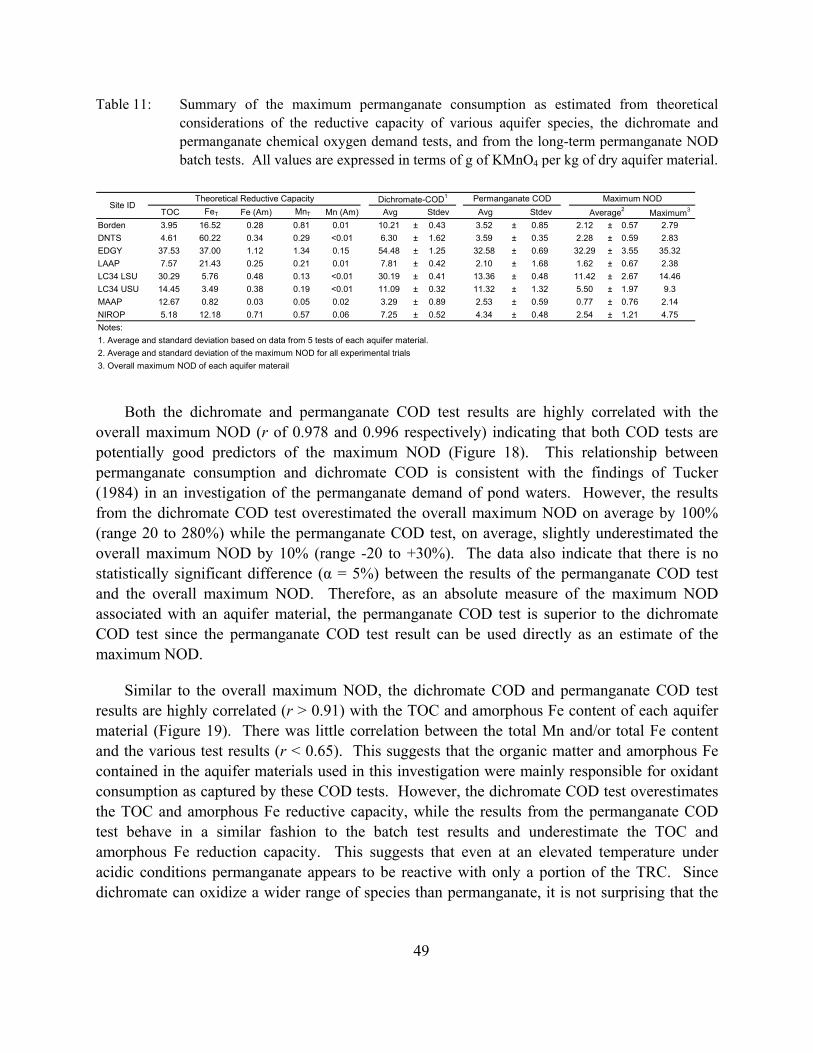
Table 11: Summary of the maximum permanganate consumption as estimated from theoretical considerations of the reductive capacity of various aquifer species, the dichromate and permanganate chemical oxygen demand tests, and from the long-term permanganate NOD batch tests. All values are expressed in terms of g of KMnO4 per kg of dry aquifer material.
TOC FeT Fe (Am) MnT Mn (Am) Avg Stdev Avg Stdev Maximum3
Borden 3.95 16.52 0.28 0.81 0.01 10.21 ± 0.43 3.52 ± 0.85 2.12 ± 0.57 2.79DNTS 4.61 60.22 0.34 0.29 <0.01 6.30 ± 1.62 3.59 ± 0.35 2.28 ± 0.59 2.83EDGY 37.53 37.00 1.12 1.34 0.15 54.48 ± 1.25 32.58 ± 0.69 32.29 ± 3.55 35.32LAAP 7.57 21.43 0.25 0.21 0.01 7.81 ± 0.42 2.10 ± 1.68 1.62 ± 0.67 2.38LC34 LSU 30.29 5.76 0.48 0.13 <0.01 30.19 ± 0.41 13.36 ± 0.48 11.42 ± 2.67 14.46LC34 USU 14.45 3.49 0.38 0.19 <0.01 11.09 ± 0.32 11.32 ± 1.32 5.50 ± 1.97 9.3MAAP 12.67 0.82 0.03 0.05 0.02 3.29 ± 0.89 2.53 ± 0.59 0.77 ± 0.76 2.14NIROP 5.18 12.18 0.71 0.57 0.06 7.25 ± 0.52 4.34 ± 0.48 2.54 ± 1.21 4.75Notes:1. Average and standard deviation based on data from 5 tests of each aquifer material.2. Average and standard deviation of the maximum NOD for all experimental trials 3. Overall maximum NOD of each aquifer materail
Average2
Theoretical Reductive CapacitySite ID
Dichromate-COD1 Permanganate COD Maximum NOD
Both the dichromate and permanganate COD test results are highly correlated with the overall maximum NOD (r of 0.978 and 0.996 respectively) indicating that both COD tests are potentially good predictors of the maximum NOD (Figure 18). This relationship between permanganate consumption and dichromate COD is consistent with the findings of Tucker (1984) in an investigation of the permanganate demand of pond waters. However, the results from the dichromate COD test overestimated the overall maximum NOD on average by 100% (range 20 to 280%) while the permanganate COD test, on average, slightly underestimated the overall maximum NOD by 10% (range -20 to +30%). The data also indicate that there is no statistically significant difference (α = 5%) between the results of the permanganate COD test and the overall maximum NOD. Therefore, as an absolute measure of the maximum NOD associated with an aquifer material, the permanganate COD test is superior to the dichromate COD test since the permanganate COD test result can be used directly as an estimate of the maximum NOD.
Similar to the overall maximum NOD, the dichromate COD and permanganate COD test results are highly correlated (r > 0.91) with the TOC and amorphous Fe content of each aquifer material (Figure 19). There was little correlation between the total Mn and/or total Fe content and the various test results (r < 0.65). This suggests that the organic matter and amorphous Fe contained in the aquifer materials used in this investigation were mainly responsible for oxidant consumption as captured by these COD tests. However, the dichromate COD test overestimates the TOC and amorphous Fe reductive capacity, while the results from the permanganate COD test behave in a similar fashion to the batch test results and underestimate the TOC and amorphous Fe reduction capacity. This suggests that even at an elevated temperature under acidic conditions permanganate appears to be reactive with only a portion of the TRC. Since dichromate can oxidize a wider range of species than permanganate, it is not surprising that the
49
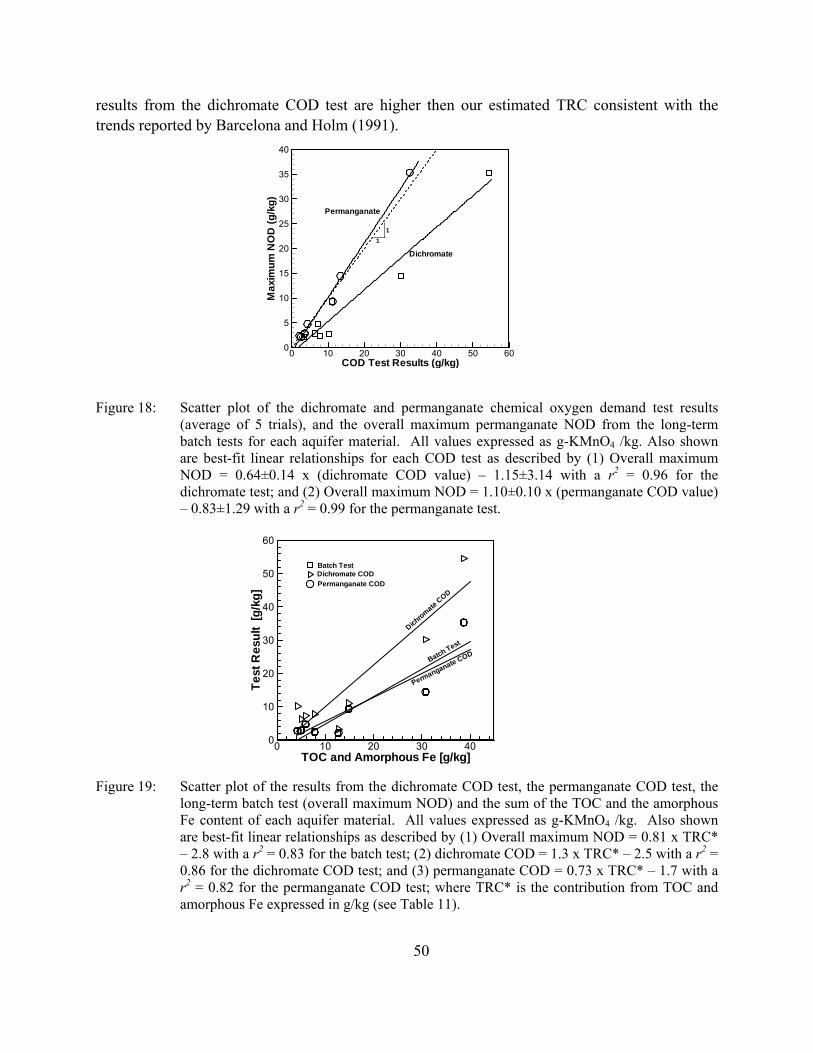
results from the dichromate COD test are higher then our estimated TRC consistent with the trends reported by Barcelona and Holm (1991).
COD Test Results (g/kg)
Max
imum
NO
D(g
/kg)
0 10 20 30 40 50 600
5
10
15
20
25
30
35
40
11
Dichromate
Permanganate
Figure 18: Scatter plot of the dichromate and permanganate chemical oxygen demand test results (average of 5 trials), and the overall maximum permanganate NOD from the long-term batch tests for each aquifer material. All values expressed as g-KMnO4 /kg. Also shown are best-fit linear relationships for each COD test as described by (1) Overall maximum NOD = 0.64±0.14 x (dichromate COD value) – 1.15±3.14 with a r2 = 0.96 for the dichromate test; and (2) Overall maximum NOD = 1.10±0.10 x (permanganate COD value) – 0.83±1.29 with a r2 = 0.99 for the permanganate test.
TOC and Amorphous Fe [g/kg]
Test
Res
ult
[g/k
g]
0 10 20 30 400
10
20
30
40
50
60
Batch Test
Dichromate
COD
Permanganate COD
Dichromate CODPermanganate COD
Batch Test
Figure 19: Scatter plot of the results from the dichromate COD test, the permanganate COD test, the long-term batch test (overall maximum NOD) and the sum of the TOC and the amorphous Fe content of each aquifer material. All values expressed as g-KMnO4 /kg. Also shown are best-fit linear relationships as described by (1) Overall maximum NOD = 0.81 x TRC* – 2.8 with a r2 = 0.83 for the batch test; (2) dichromate COD = 1.3 x TRC* – 2.5 with a r2 = 0.86 for the dichromate COD test; and (3) permanganate COD = 0.73 x TRC* – 1.7 with a r2 = 0.82 for the permanganate COD test; where TRC* is the contribution from TOC and amorphous Fe expressed in g/kg (see Table 11).
50
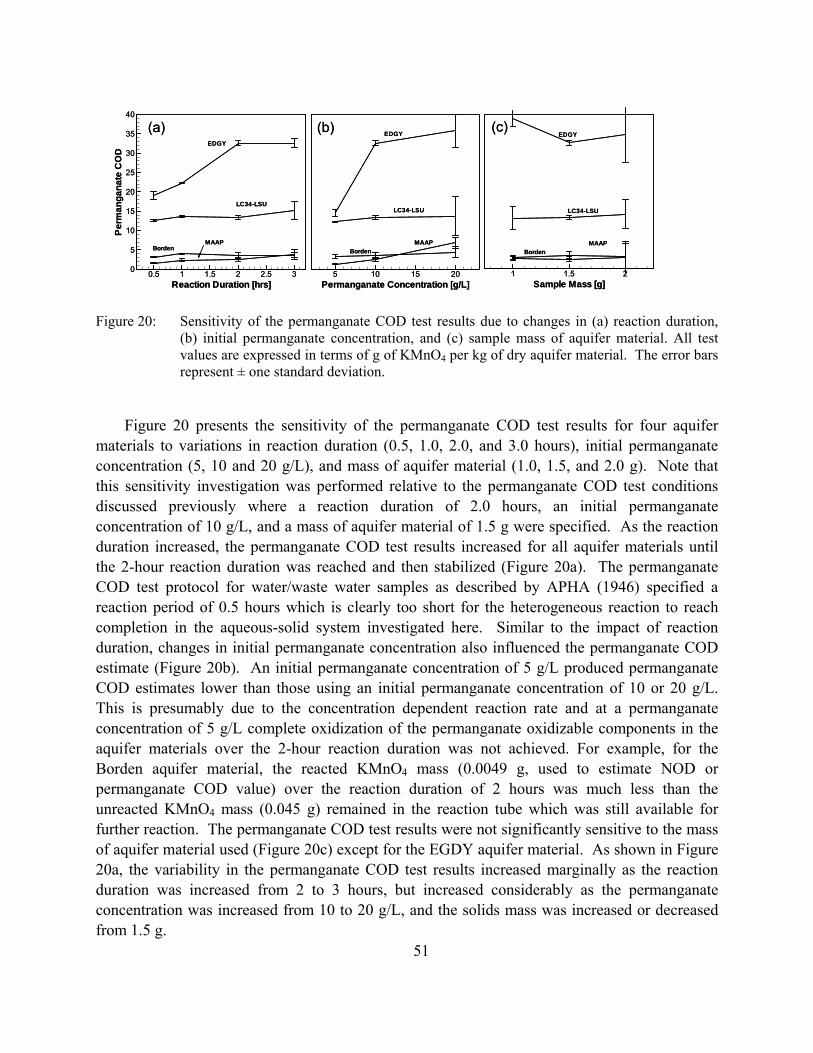
(a) (c)(b)
Reaction Duration [hrs]
Per
man
gana
teC
OD
0.5 1 1.5 2 2.5 30
5
10
15
20
25
30
35
40
Borden
EDGY
LC34-LSU
MAAP
Permanganate Concentration [g/L]5 10 15 20
Borden
EDGY
LC34-LSU
MAAP
Sample Mass [g]1 1.5 2
Borden
EDGY
LC34-LSU
MAAP
(a) (c)(b)
Reaction Duration [hrs]
Per
man
gana
teC
OD
0.5 1 1.5 2 2.5 30
5
10
15
20
25
30
35
40
Borden
EDGY
LC34-LSU
MAAP
Permanganate Concentration [g/L]5 10 15 20
Borden
EDGY
LC34-LSU
MAAP
Sample Mass [g]1 1.5 2
Borden
EDGY
LC34-LSU
MAAP
Figure 20: Sensitivity of the permanganate COD test results due to changes in (a) reaction duration, (b) initial permanganate concentration, and (c) sample mass of aquifer material. All test values are expressed in terms of g of KMnO4 per kg of dry aquifer material. The error bars represent ± one standard deviation.
51
Figure 20 presents the sensitivity of the permanganate COD test results for four aquifer materials to variations in reaction duration (0.5, 1.0, 2.0, and 3.0 hours), initial permanganate concentration (5, 10 and 20 g/L), and mass of aquifer material (1.0, 1.5, and 2.0 g). Note that this sensitivity investigation was performed relative to the permanganate COD test conditions discussed previously where a reaction duration of 2.0 hours, an initial permanganate concentration of 10 g/L, and a mass of aquifer material of 1.5 g were specified. As the reaction duration increased, the permanganate COD test results increased for all aquifer materials until the 2-hour reaction duration was reached and then stabilized (Figure 20a). The permanganate COD test protocol for water/waste water samples as described by APHA (1946) specified a reaction period of 0.5 hours which is clearly too short for the heterogeneous reaction to reach completion in the aqueous-solid system investigated here. Similar to the impact of reaction duration, changes in initial permanganate concentration also influenced the permanganate COD estimate (Figure 20b). An initial permanganate concentration of 5 g/L produced permanganate COD estimates lower than those using an initial permanganate concentration of 10 or 20 g/L. This is presumably due to the concentration dependent reaction rate and at a permanganate concentration of 5 g/L complete oxidization of the permanganate oxidizable components in the aquifer materials over the 2-hour reaction duration was not achieved. For example, for the Borden aquifer material, the reacted KMnO4 mass (0.0049 g, used to estimate NOD or permanganate COD value) over the reaction duration of 2 hours was much less than the unreacted KMnO4 mass (0.045 g) remained in the reaction tube which was still available for further reaction. The permanganate COD test results were not significantly sensitive to the mass of aquifer material used (Figure 20c) except for the EGDY aquifer material. As shown in Figure 20a, the variability in the permanganate COD test results increased marginally as the reaction duration was increased from 2 to 3 hours, but increased considerably as the permanganate concentration was increased from 10 to 20 g/L, and the solids mass was increased or decreased from 1.5 g.

52
Supported by visual observations, we believe that the increased variability in the permanganate COD test results for a 3-hr reaction duration, a permanganate concentration of 20 g/L and a solids mass of 2.0 g is the result of interference by the manganese oxides produced during the oxidation process. These colloidal by-products may influence the test results by (1) promoting self-decomposition of permanganate which occurs in a strong acidic solution under elevated temperature conditions (Steward, 1965), and by (2) affecting our ability to quantify the permanganate concentration by spectrophotometry at a wavelength of 525 nm even though the reaction tubes were centrifuged for 1 hour at 4000 rpm. The first suspected interference would result in an increased demand of permanganate (positive bias), while the second interference would result in the quantification of an apparent higher permanganate concentration (negative bias). The high permanganate COD standard deviation for the 1.0 g sample size is likely related to the non-representative nature of this sample mass. Additional investigative efforts are presently underway to resolve the nature of this interference and develop corrective approaches.
5.3.3 Summary
Current methods used to determine permanganate NOD involve the use of well-mixed batch tests which are time consuming and subject to test variables (e.g., concentration, mass of oxidant to solid ratio, reaction duration, and mixing conditions) that significantly affect the results. The work here suggests that a modified chemical oxygen demand (COD) test method using permanganate can be used to determine the maximum permanganate NOD of an aquifer material quickly and economically. This proposed test method was used in a comparative study that involved eight different aquifer materials. The results showed that the proposed test method is superior to the dichromate COD test and can be used to directly estimate the maximum NOD for site screening and initial design purposes.
Based on this limited sensitivity investigation we recommend that a reaction duration of 2 hours, an initial permanganate concentration of 10 g/L, and a aquifer material sample size of 1.5 g be used in the permanganate COD test to estimate the maximum NOD of aquifer materials. In addition we acknowledge that potential interference of manganese oxides, a reaction by-product, variability in aquifer materials, and error in method may lead to large experimental variability.

53
5.4 Short-Term Kinetic Investigations
5.4.1 Experimental Methods
To investigate the kinetics involved in the reaction between permanganate and aquifer materials, it is necessary to hold one of the two reactants constant or in excess in order to observe changes in the other reactant. Therefore, two series of experiments were conducted: (1) excess aquifer material experiments consisting of ~100 g of aquifer materials digested with various concentrations of permanganate solution (0.06 ~ 2 g/L), and (2) excess permanganate mass experiments consisting of an excess (~20 g/L) of permanganate mixed with various mass (10 ~ 25 g) of aquifer solids. All experiments were performed in replicates or triplicates using 300 mL reactor vessels in conjunction with 3.2 cm stir bar placed on a stir plate. If necessary, permanganate solutions were buffered with phosphates to maintain a neutral pH value.
Excess Aquifer Material Mass Kinetic Experiments
The mass of aquifer material used in these experiments was determined so that the various permanganate masses employed would be at least ten times less than the ultimate permanganate consumption as estimated from the results of the long-term NOD experiments and the permanganate COD tests. Each experimental run consisted of loading the aquifer material mass in the reactor and then adding the permanganate solution. Table 12 lists the aquifer material mass, solution volume, and permanganate concentration used for each experimental run. All KMnO4 solutions were prepared by heating at 80oC for ~1 hour, and then filtering the cooled solution through a 0.45-μm glass fiber filter (Pall Corp.). A phosphate buffer (sodium phosphate dibasic at 10 mM) was added to the permanganate solution to maintain a neutral pH (~7.2). At specified reaction times (nominally 2, 5, 10, 20, 40, 70, 120, 180 min) an aliquot (~2 mL) of the permanganate solution was extracted from the reactor with a syringe (LUER-LOK, Becton & Dickinson), and filtered through a 0.45 μm syringe filter (Acradisc, Pall Corp.). The permanganate concentration was quantified with a spectrophotometer (Milton Roy, 20D) at 525 nm.
Excess Permanganate Mass Kinetic Experiments
In these experimental runs two to three masses of aquifer material from each site were loaded into a reactor followed by the addition of a specified volume (between 100 to 150 mL) of a permanganate solution with a concentration of 20 g/L. After a specified reaction duration (nominally 5, 15, 30, 60 min) the experimental run was quickly terminated by filtering the slurry through a 6-μm filter paper (Whatman, VWR Lab) and rinsing the material retained on the filter with Milli-Q water until only a faint pink color persisted. The solid material remained on the filter paper was then transferred to aluminum trays, dried at 80oC for 24 hours, and ground in a porcelain mortar to pass through a 150-μm sieve. Aliquots of the ground aquifer material were
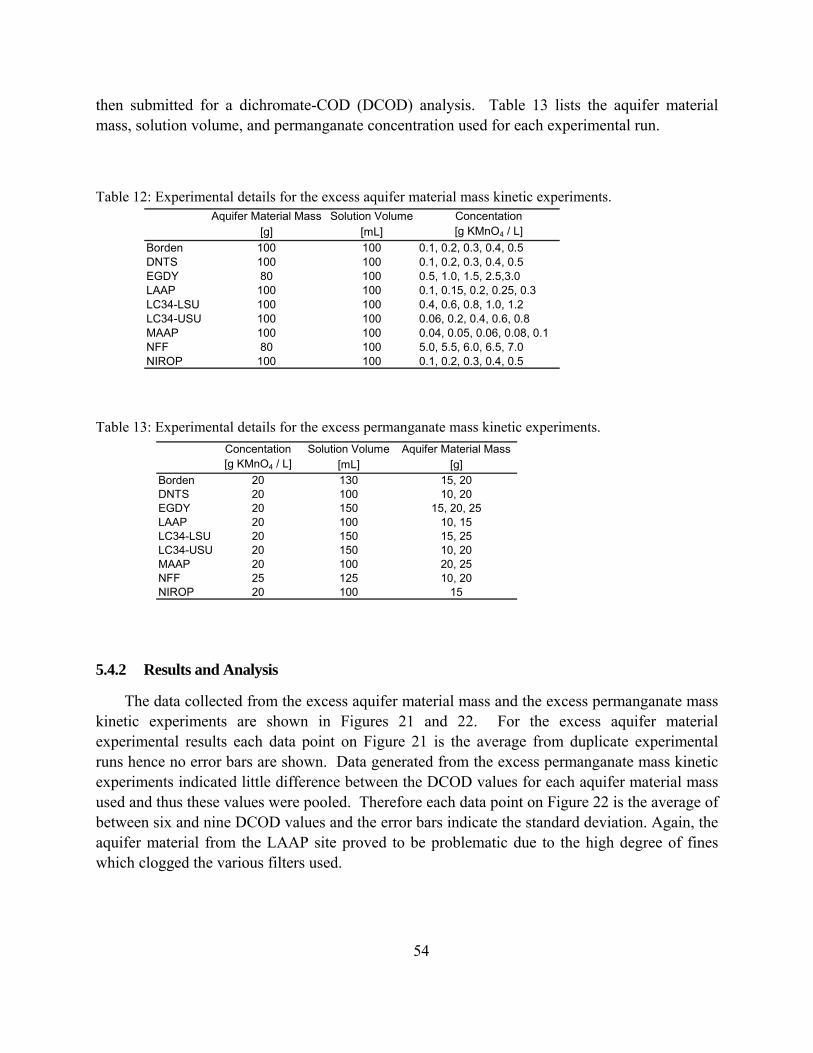
then submitted for a dichromate-COD (DCOD) analysis. Table 13 lists the aquifer material mass, solution volume, and permanganate concentration used for each experimental run.
Table 12: Experimental details for the excess aquifer material mass kinetic experiments. Aquifer Material Mass Solution Volume Concentation
[g] [mL] [g KMnO4 / L]Borden 100 100 0.1, 0.2, 0.3, 0.4, 0.5DNTS 100 100 0.1, 0.2, 0.3, 0.4, 0.5EGDY 80 100 0.5, 1.0, 1.5, 2.5,3.0LAAP 100 100 0.1, 0.15, 0.2, 0.25, 0.3LC34-LSU 100 100 0.4, 0.6, 0.8, 1.0, 1.2LC34-USU 100 100 0.06, 0.2, 0.4, 0.6, 0.8MAAP 100 100 0.04, 0.05, 0.06, 0.08, 0.1NFF 80 100 5.0, 5.5, 6.0, 6.5, 7.0NIROP 100 100 0.1, 0.2, 0.3, 0.4, 0.5
Table 13: Experimental details for the excess permanganate mass kinetic experiments.
Concentation Solution Volume Aquifer Material Mass[g KMnO4 / L] [mL] [g]
Borden 20 130 15, 20DNTS 20 100 10, 20EGDY 20 150 15, 20, 25LAAP 20 100 10, 15LC34-LSU 20 150 15, 25LC34-USU 20 150 10, 20MAAP 20 100 20, 25NFF 25 125 10, 20NIROP 20 100 15
5.4.2 Results and Analysis
The data collected from the excess aquifer material mass and the excess permanganate mass kinetic experiments are shown in Figures 21 and 22. For the excess aquifer material experimental results each data point on Figure 21 is the average from duplicate experimental runs hence no error bars are shown. Data generated from the excess permanganate mass kinetic experiments indicated little difference between the DCOD values for each aquifer material mass used and thus these values were pooled. Therefore each data point on Figure 22 is the average of between six and nine DCOD values and the error bars indicate the standard deviation. Again, the aquifer material from the LAAP site proved to be problematic due to the high degree of fines which clogged the various filters used.
54
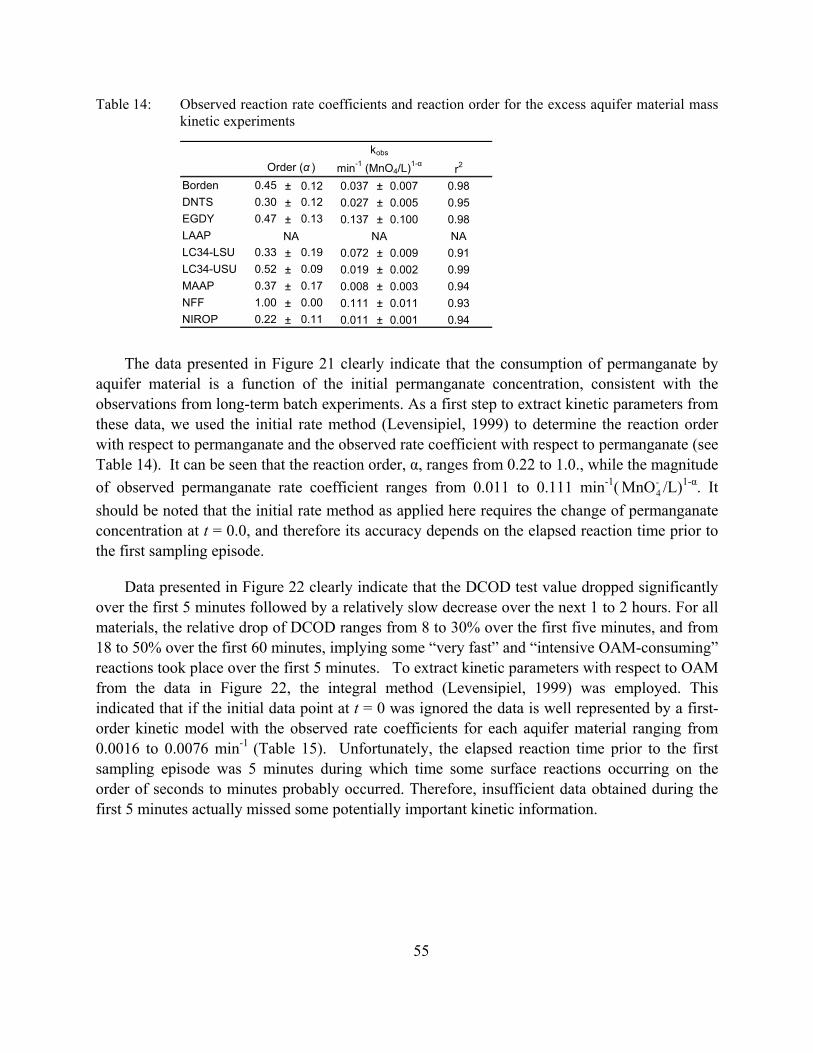
Table 14: Observed reaction rate coefficients and reaction order for the excess aquifer material mass kinetic experiments
r2
Borden 0.45 ± 0.12 0.037 ± 0.007 0.98DNTS 0.30 ± 0.12 0.027 ± 0.005 0.95EGDY 0.47 ± 0.13 0.137 ± 0.100 0.98LAAP NALC34-LSU 0.33 ± 0.19 0.072 ± 0.009 0.91LC34-USU 0.52 ± 0.09 0.019 ± 0.002 0.99MAAP 0.37 ± 0.17 0.008 ± 0.003 0.94NFF 1.00 ± 0.00 0.111 ± 0.011 0.93NIROP 0.22 ± 0.11 0.011 ± 0.001 0.94
NANA
min-1 (MnO4/L)1-α
kobs
Order (α )
The data presented in Figure 21 clearly indicate that the consumption of permanganate by aquifer material is a function of the initial permanganate concentration, consistent with the observations from long-term batch experiments. As a first step to extract kinetic parameters from these data, we used the initial rate method (Levensipiel, 1999) to determine the reaction order with respect to permanganate and the observed rate coefficient with respect to permanganate (see Table 14). It can be seen that the reaction order, α, ranges from 0.22 to 1.0., while the magnitude of observed permanganate rate coefficient ranges from 0.011 to 0.111 min-1( /L)1-α. It should be noted that the initial rate method as applied here requires the change of permanganate concentration at t = 0.0, and therefore its accuracy depends on the elapsed reaction time prior to the first sampling episode.
-4MnO
Data presented in Figure 22 clearly indicate that the DCOD test value dropped significantly over the first 5 minutes followed by a relatively slow decrease over the next 1 to 2 hours. For all materials, the relative drop of DCOD ranges from 8 to 30% over the first five minutes, and from 18 to 50% over the first 60 minutes, implying some “very fast” and “intensive OAM-consuming” reactions took place over the first 5 minutes. To extract kinetic parameters with respect to OAM from the data in Figure 22, the integral method (Levensipiel, 1999) was employed. This indicated that if the initial data point at t = 0 was ignored the data is well represented by a first-order kinetic model with the observed rate coefficients for each aquifer material ranging from 0.0016 to 0.0076 min-1 (Table 15). Unfortunately, the elapsed reaction time prior to the first sampling episode was 5 minutes during which time some surface reactions occurring on the order of seconds to minutes probably occurred. Therefore, insufficient data obtained during the first 5 minutes actually missed some potentially important kinetic information.
55

Table 15: Observed reaction rate coefficients for excess permanganate mass kinetic experiments.
Excesskobs Concentration
[min-1] r2 [g KMnO4/L]Borden 0.0016 ± 0.0019 0.86 20DNTS 0.0059 ± 0.0013 0.99 20EGDY 0.0032 ± 0.0005 0.99 20LAAP NA ± NA NA NALC34-LSU 0.0028 ± 0.0017 0.96 20LC34-USU 0.0018 ± 0.0019 0.89 20MAAP 0.0021 ± 0.0010 0.93 20NFF 0.0076 ± 0.0048 0.96 25NIROP 0.0030 ± 0.0017 0.91 20
Table 16: Reaction rate coefficients with respect to OAM and permanganate.
koam1 kMnO4
2
Borden 4.62E-04 4.95E-03DNTS 2.62E-03 5.86E-03EGDY 8.86E-04 4.07E-03LAAP - -LC34-LSU 1.14E-03 3.30E-03LC34-USU 4.42E-04 2.39E-03MAAP 7.68E-04 3.16E-03NFF 4.03E-04 1.67E-03NIROP 1.67E-03 2.08E-031. units of (1/min)(g of MnO4
- / L of solution)-α
2. units of (1/min)(g of MnO4- / L of solution)1-α(L of system / g of OAM as KMnO4).
Under the assumptions used to extract the kinetic information and with the experimental
condition for each run, the kinetic parameters with respect to permanganate and OAM were calculated and are listed in Table 16. Except for the NIROP aquifer material, the value of reaction rate coefficient with respect to permanganate is 1.20 – 10.0 times greater than that of OAM. These two reaction rate coefficients generally display a similar trend across all aquifer materials: the aquifer material with a high value of the reaction rate coefficient with respect to permanganate will also have a high value of the reaction rate coefficient with respect to OAM; however, there is no good relationship (r2 < 0.3) between these two reaction rate coefficients.
56

Time [min]
C/C
o
0 50 100 1500
0.25
0.5
0.75
1
0.1 g/L0.2 g/L0.3 g/L0.4 g/L0.5 g/L
(h) NIROP
Time [min]
C/C
o
0 50 100 1500
0.25
0.5
0.75
15.0 g/L5.5 g/L6.0 g/L6.5 g/L7.0 g/L
(g) NFF
Time [min]
C/C
o
0 50 100 1500
0.25
0.5
0.75
1
0.04 g/L0.05 g/L0.06 g/L0.08 g/L0.1 g/L
(f) MAAP
Time [min]
C/C
o
0 50 100 1500
0.25
0.5
0.75
10.06 g/L0.2 g/L0.4 g/L0.6 g/L0.8 g/L
(e) LC34 USU
Time [min]
C/C
o
0 50 100 1500
0.25
0.5
0.75
10.4 g/L0.6 g/L0.8 g/L1.0 g/L1.2 g/L
(d) LC34 LSU
Time [min]
C/C
o
0 50 100 1500
0.25
0.5
0.75
10.1 g/L1.0 g/L1.5 g/L2.0 g/L2.5 g/L
(c) EGDY
Time [min]
C/C
o
0 50 100 1500
0.25
0.5
0.75
10.1 g/L0.2 g/L0.3 g/L0.4 g/L0.5 g/L
(b) DNTS
Time [min]
C/C
o
0 50 100 1500
0.25
0.5
0.75
10.1 g/L0.2 g/L0.3 g/L0.4 g/L0.5 g/L
(a) Borden Figure 21: Permanganate concentration profiles generated from the excess aquifer material mass
kinetic experiments. Each data point is the average from duplicate experiments.
57
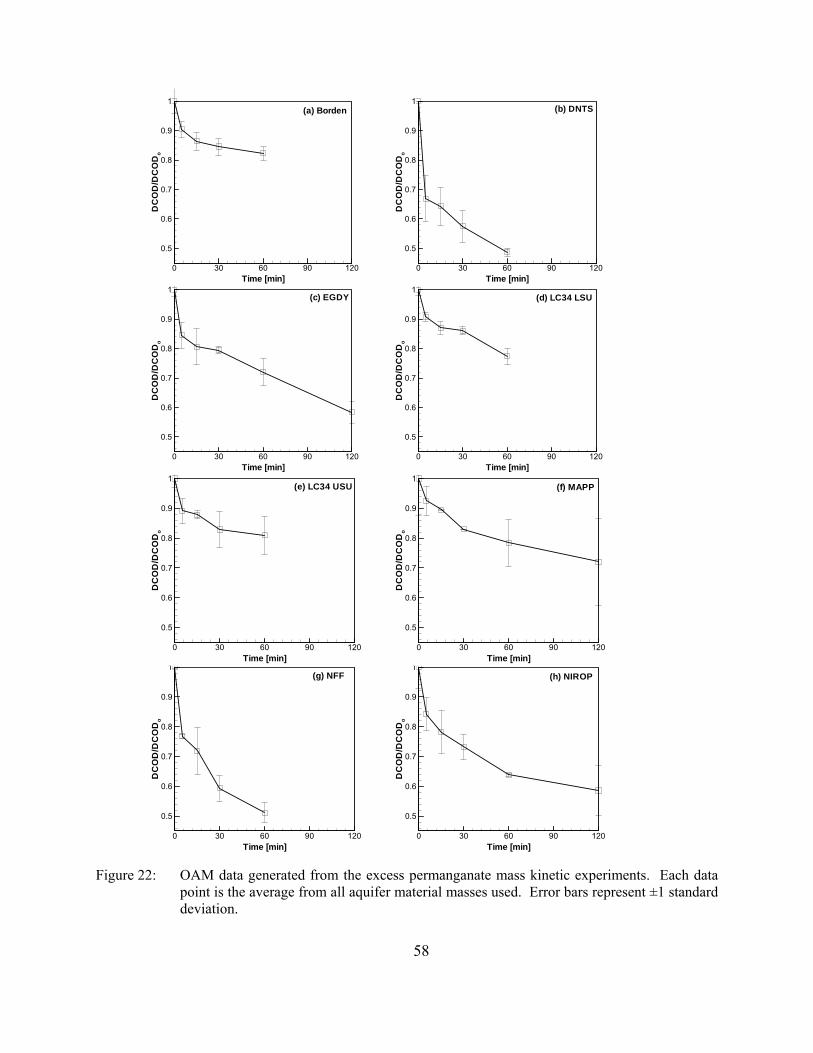
Time [min]
DC
OD
/DC
OD
o
0 30 60 90 120
0.5
0.6
0.7
0.8
0.9
1(h) NIROP
Time [min]
DC
OD
/DC
OD
o
0 30 60 90 120
0.5
0.6
0.7
0.8
0.9
1(g) NFF
Time [min]
DC
OD
/DC
OD
o
0 30 60 90 120
0.5
0.6
0.7
0.8
0.9
1(f) MAPP
Time [min]
DC
OD
/DC
OD
o
0 30 60 90 120
0.5
0.6
0.7
0.8
0.9
1(e) LC34 USU
Time [min]
DC
OD
/DC
OD
o
0 30 60 90 120
0.5
0.6
0.7
0.8
0.9
1(c) EGDY
Time [min]
DC
OD
/DC
OD
o
0 30 60 90 120
0.5
0.6
0.7
0.8
0.9
1(d) LC34 LSU
Time [min]
DC
OD
/DC
OD
o
0 30 60 90 120
0.5
0.6
0.7
0.8
0.9
1(b) DNTS
Time [min]
DC
OD
/DC
OD
o
0 30 60 90 120
0.5
0.6
0.7
0.8
0.9
1(a) Borden
Figure 22: OAM data generated from the excess permanganate mass kinetic experiments. Each data
point is the average from all aquifer material masses used. Error bars represent ±1 standard deviation.
58
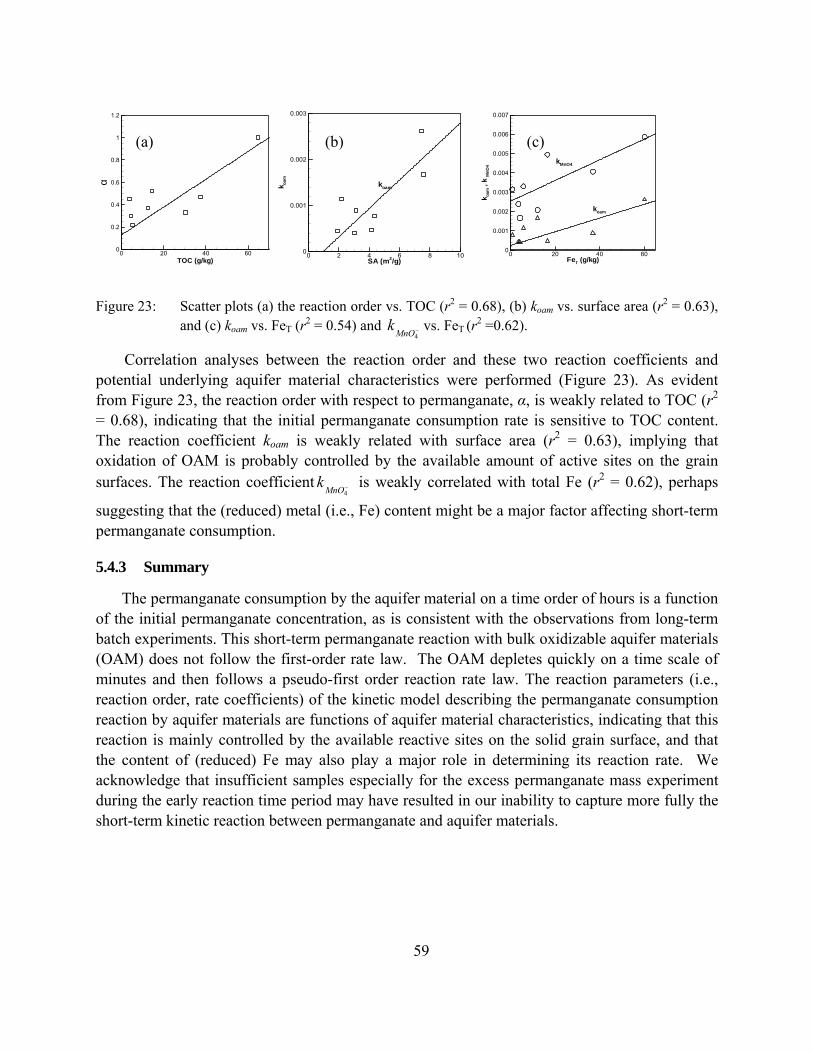
59
TOC (g/kg)
a
0 20 40 600
0.2
0.4
0.6
0.8
1
1.2
α
FeT (g/kg)
k oam
,kM
nO4
0 20 40 600
0.001
0.002
0.003
0.004
0.005
0.006
0.007
koam
kMnO4
SA (m2/g)
k oam
0 2 4 6 8 100
0.001
0.002
0.003
koam
k
(a) (b) (c) Figure 23: Scatter plots (a) the reaction order vs. TOC (r2 = 0.68), (b) koam vs. surface area (r2 = 0.63),
and (c) koam vs. FeT (r2 = 0.54) and vs. FeT (r2 =0.62). −4MnO
Correlation analyses between the reaction order and these two reaction coefficients and potential underlying aquifer material characteristics were performed (Figure 23). As evident from Figure 23, the reaction order with respect to permanganate, α, is weakly related to TOC (r2 = 0.68), indicating that the initial permanganate consumption rate is sensitive to TOC content. The reaction coefficient koam is weakly related with surface area (r2 = 0.63), implying that oxidation of OAM is probably controlled by the available amount of active sites on the grain surfaces. The reaction coefficient is weakly correlated with total Fe (r2 = 0.62), perhaps
suggesting that the (reduced) metal (i.e., Fe) content might be a major factor affecting short-term permanganate consumption.
−4MnO
k
5.4.3 Summary
The permanganate consumption by the aquifer material on a time order of hours is a function of the initial permanganate concentration, as is consistent with the observations from long-term batch experiments. This short-term permanganate reaction with bulk oxidizable aquifer materials (OAM) does not follow the first-order rate law. The OAM depletes quickly on a time scale of minutes and then follows a pseudo-first order reaction rate law. The reaction parameters (i.e., reaction order, rate coefficients) of the kinetic model describing the permanganate consumption reaction by aquifer materials are functions of aquifer material characteristics, indicating that this reaction is mainly controlled by the available reactive sites on the solid grain surface, and that the content of (reduced) Fe may also play a major role in determining its reaction rate. We acknowledge that insufficient samples especially for the excess permanganate mass experiment during the early reaction time period may have resulted in our inability to capture more fully the short-term kinetic reaction between permanganate and aquifer materials.
60
5.5 Column Investigations
Compared to batch experimental systems, column experiments are generally considered to be more representative of in situ conditions since they provide more realistic aquifer material contact. Therefore, a series of permanganate column experiments were designed to complement and expand the findings of the batch experiments. Based on the batch permanganate experiments, aquifer materials from the following six sites were selected for these column experiments: MAAP, Borden, LC34-USU, LC34-LSU, EGDY, and NFF (listed in the order from lowest to highest maximum permanganate NOD).
5.5.1 Methods
A typical column (Figure 24) was constructed from a 40-cm long section of nominal 3.81 cm (1.5-inch) diameter transparent Plexiglas pipe equipped with four equally spaced sampling ports. Due to the high NOD associated with the EGDY and NFF aquifer materials as indicated from the batch test results, columns for these two materials were constructed from 12-cm long sections of nominal 2.54 cm (1-inch) diameter Schedule 40 PVC pipe to minimize experimental time. Permanganate source solutions were prepared by adding analytical grade KMnO4 (EM Science) to Milli-Q water and boiling for ~1 hour. The cooled solution was filtered (0.45-μm glass fibre, Pall Corporation) and standardized by titration into a sulphuric acid and sodium oxalate solution (APHA, 1998).
To avoid problems associated with dry packing, homogenized aquifer material was wet with Milli-Q water to near saturation before use. Each column was packed in three stages: (1) the bottom 1.0 cm of the column (0.3 cm for the EGDY and NFF columns) was filled with 0.59 to 0.84 mm diameter glass beads (Potters Industries Ltd.) on top of which a thin layer of glass wool (Pyrex, VWR) was placed; (2) the next 38 cm (or 10 cm for the EGDY and NFF columns) was packed with aquifer material in 1 to 2 cm lifts compacted using a 1 cm diameter glass rod with the column attached to vertical vibrating rod; and (3) the top of the packed aquifer material was fitted with a 500-mm stainless steel screen, then filled with 0.59 to 0.84 mm diameter glass beads (Potters Industries Ltd.) and topped with a thin layer of glass wool (Pyrex, VWR). Both the bottom and top tubing couplers were fitted with a 500-mm stainless steel screen to prevent solids from escaping. Control columns filled exclusively with clean 0.59 to 0.84 mm diameter glass beads (Potters Industries Ltd.) were used to validate the experimental set-up and quantify apparatus/permanganate interactions.
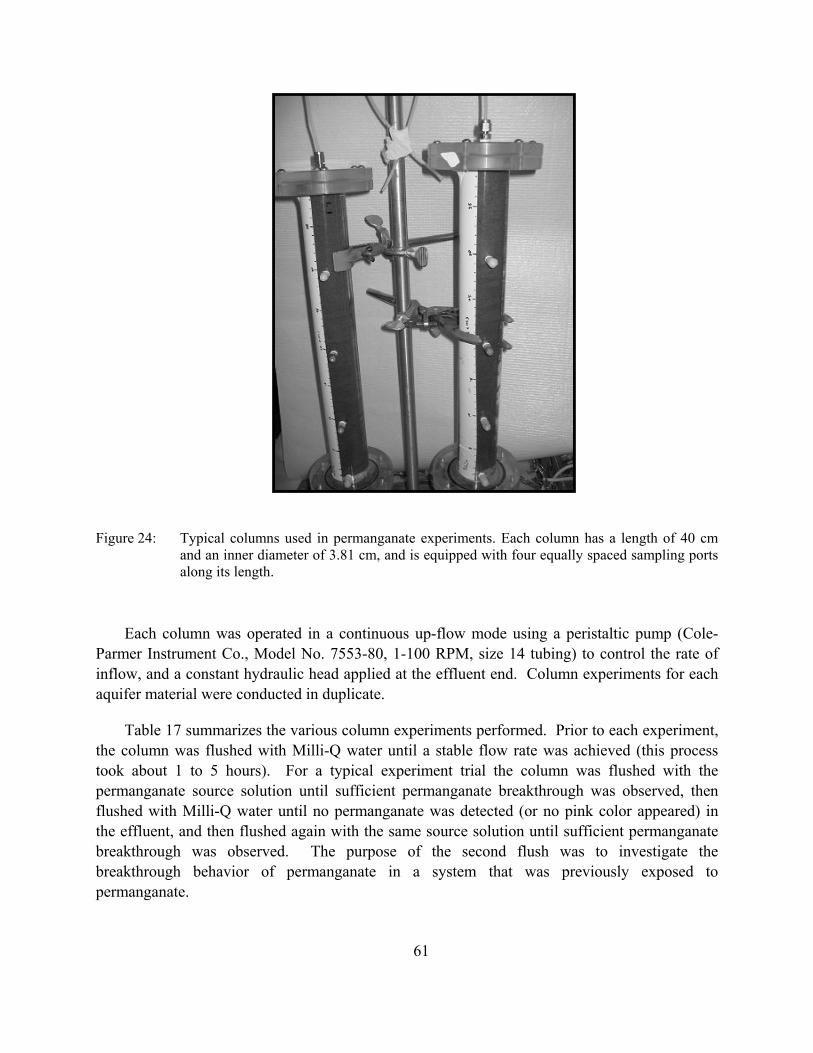
Figure 24: Typical columns used in permanganate experiments. Each column has a length of 40 cm and an inner diameter of 3.81 cm, and is equipped with four equally spaced sampling ports along its length.
Each column was operated in a continuous up-flow mode using a peristaltic pump (Cole-Parmer Instrument Co., Model No. 7553-80, 1-100 RPM, size 14 tubing) to control the rate of inflow, and a constant hydraulic head applied at the effluent end. Column experiments for each aquifer material were conducted in duplicate.
Table 17 summarizes the various column experiments performed. Prior to each experiment, the column was flushed with Milli-Q water until a stable flow rate was achieved (this process took about 1 to 5 hours). For a typical experiment trial the column was flushed with the permanganate source solution until sufficient permanganate breakthrough was observed, then flushed with Milli-Q water until no permanganate was detected (or no pink color appeared) in the effluent, and then flushed again with the same source solution until sufficient permanganate breakthrough was observed. The purpose of the second flush was to investigate the breakthrough behavior of permanganate in a system that was previously exposed to permanganate.
61

Table 17: Summary of column experiments.
Aquifer
MaterialKMnO4 (g/L)
Flow rate
(mL/min)
Mass ofmaterial
packed (g)
Length of the1st flush
(hrs)
Length of the2nd flush
(hrs)
Sampling location(distance from the
influent location) (cm)Borden 5.17 0.84 710 8.6 9.5 20, 38
4.94 23.5 25.30.95 23.5 48.5
4.93 (1st flush)5.47 (2nd flush)
LC34-USU 4.95 0.77 720 10 10 20, 385.28 0.75 7 55.06 0.45 10 10
NFF 5.02 0.30 79 31 32 10
38
100 10
20, 38620 36 27
710
EGDY
LC34-LSU
MAAP
0.30
0.83
Two flow rates (high and low) were used for columns packed with MAAP aquifer materials to allow for different residence times to be investigated, while two permanganate concentrations (high and low) were flushed through the columns packed with EGDY aquifer materials to investigate the response to different permanganate concentrations.
At designed times, samples (with a typical volume of 0.2 to 0.5 mL) were taken and used to quantify permanganate concentration by spectrophotometry (Milton Roy Company, Spectronic 20D) at 525 nm with a method detection limit of 1.3 mg/L. For experiments that employed the longer columns, samples were collected from the mid-port (about 20 cm from the column influent) and from the effluent to investigate permanganate breakthrough at two locations, and for experiments that employed the shorter columns samples were only collected from the column effluent.
Tracer tests using sodium bromide solution (Fischer Scientific) at a constant concentration ranging from 50 to 100 mg/L were conducted to compare the tracer and permanganate breakthrough curves, as well as to evaluate hydrodynamic properties (porosity and dispersivity) of each aquifer material packed column. Bromide concentrations were determined by ion chromatography (IC) (Dionex AS4A-SC 4mm x 250 mm column; 1.8 mM sodium carbonate, 1.7 mM sodium bicarbonate eluate; 1.5 mL/min flow rate) with a MDL of 1.2 mg/L.
5.5.2 Results and Discussion
Temporal concentration profiles of permanganate and bromide (Br-) obtained from the duplicate columns at identical sampling times were normalized to their respective source concentration and averaged. The resulting temporal profiles or breakthrough curves (BTCs) are shown in Figures 25 to 27, while Tables 18 to 20 list some characteristic
62
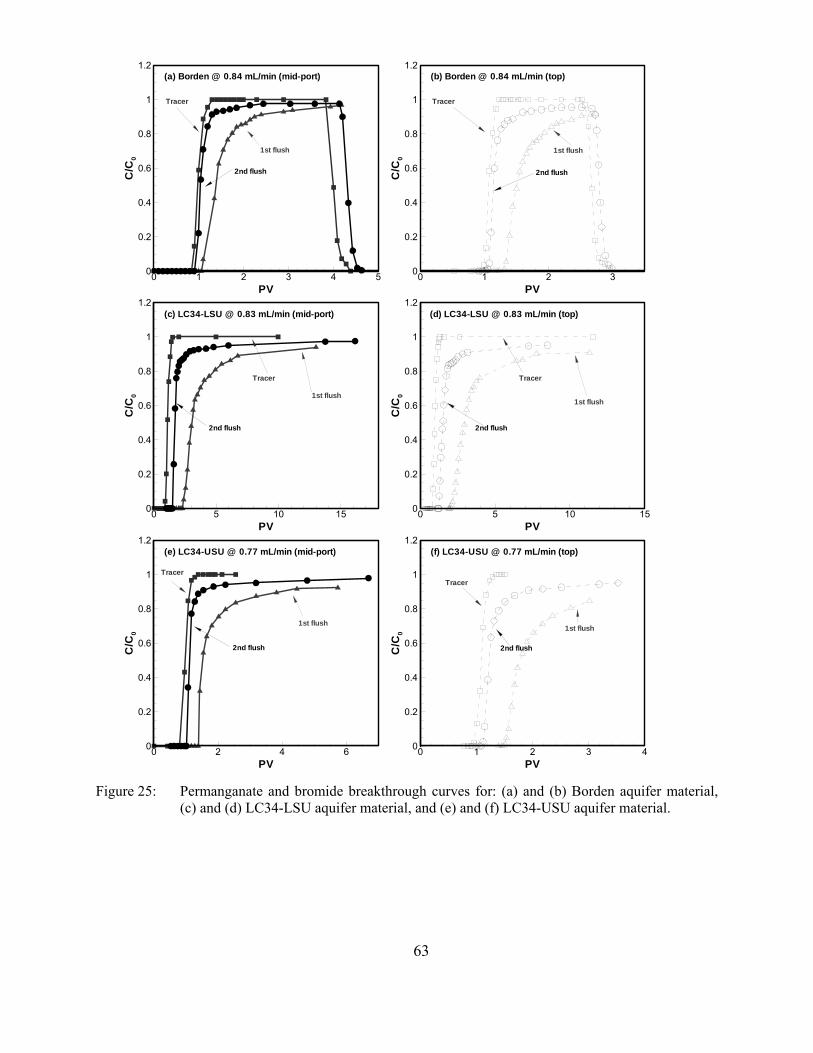
PV
C/C
0
0 1 2 3 4 50
0.2
0.4
0.6
0.8
1
1.2(a) Borden @ 0.84 mL/min (mid-port)
Tracer
2nd flush
1st flush
PV
C/C
0
0 5 10 150
0.2
0.4
0.6
0.8
1
1.2(c) LC34-LSU @ 0.83 mL/min (mid-port)
1st flush
Tracer
2nd flush
PV
C/C
0
0 5 10 150
0.2
0.4
0.6
0.8
1
1.2(d) LC34-LSU @ 0.83 mL/min (top)
1st flush
Tracer
2nd flush
PV
C/C
0
0 1 2 30
0.2
0.4
0.6
0.8
1
1.2(b) Borden @ 0.84 mL/min (top)
Tracer
2nd flush
1st flush
PV
C/C
0
0 2 4 60
0.2
0.4
0.6
0.8
1
1.2(e) LC34-USU @ 0.77 mL/min (mid-port)
Tracer
2nd flush
1st flush
PV
C/C
0
0 1 2 3 40
0.2
0.4
0.6
0.8
1
1.2(f) LC34-USU @ 0.77 mL/min (top)
Tracer
2nd flush
1st flush
PV
C/C
0
0 1 2 3 4 50
0.2
0.4
0.6
0.8
1
1.2(a) Borden @ 0.84 mL/min (mid-port)
Tracer
2nd flush
1st flush
PV
C/C
0
0 5 10 150
0.2
0.4
0.6
0.8
1
1.2(c) LC34-LSU @ 0.83 mL/min (mid-port)
1st flush
Tracer
2nd flush
PV
C/C
0
0 5 10 150
0.2
0.4
0.6
0.8
1
1.2(d) LC34-LSU @ 0.83 mL/min (top)
1st flush
Tracer
2nd flush
PV
C/C
0
0 1 2 30
0.2
0.4
0.6
0.8
1
1.2(b) Borden @ 0.84 mL/min (top)
Tracer
2nd flush
1st flush
PV
C/C
0
0 2 4 60
0.2
0.4
0.6
0.8
1
1.2(e) LC34-USU @ 0.77 mL/min (mid-port)
Tracer
2nd flush
1st flush
PV
C/C
0
0 1 2 3 40
0.2
0.4
0.6
0.8
1
1.2(f) LC34-USU @ 0.77 mL/min (top)
Tracer
2nd flush
1st flush
Figure 25: Permanganate and bromide breakthrough curves for: (a) and (b) Borden aquifer material, (c) and (d) LC34-LSU aquifer material, and (e) and (f) LC34-USU aquifer material.
63

PV
C/C
0
0 5 10 15 20 25 300
0.2
0.4
0.6
0.8
1
1.2(b) EGDY @ 0.30 mL/min & 0.95g/L
Tracer
2nd flush
1st flush
PV
C/C
0
0 5 10 15 20 25 300
0.2
0.4
0.6
0.8
1
1.2(a) EGDY @ 0.30 mL/min & 4.94 g/L
Tracer
2nd flush
1st flush
PV
C/C
0
0 5 10 15 20 25 300
0.2
0.4
0.6
0.8
1
1.2(c) NFF @ 0.30 mL/min
Tracer
2nd flush
1st flush
Figure 26: Permanganate and bromide breakthrough curves for: (a) and (b) EGDY aquifer material, and (c) NFF aquifer material.
PV
C/C
0
0 0.5 1 1.5 2 2.50
0.2
0.4
0.6
0.8
1
1.2(a) MAAP @ 0.745 mL/min
Tracer
1st flush
2nd flush
PV
C/C
0
0 0.5 1 1.5 2 2.50
0.2
0.4
0.6
0.8
1
1.2(b) MAAP @ 0.446 mL/min
Tracer
1st flush
2nd flush
PV
C/C
0
0 0.5 1 1.5 2 2.50
0.2
0.4
0.6
0.8
1
1.2(a) MAAP @ 0.745 mL/min
Tracer
1st flush
2nd flush
PV
C/C
0
0 0.5 1 1.5 2 2.50
0.2
0.4
0.6
0.8
1
1.2(b) MAAP @ 0.446 mL/min
Tracer
1st flush
2nd flush
Figure 27: Permanganate and bromide breakthrough curves for MAAP aquifer material.
64

65
properties of the tracer and permanganate BTCs for each experimental trial. Since the time to collect a sample ranged from 1 to 3 minutes, the characteristic properties listed in Tables 18 to 20 are accurate to within 0.009 to 0.108 pore volumes (PVs) for the high and low flow rates respectively.
In general for all cases, the arrival of permanganate at a given sampling location was delayed with respect to Br; an observation that is more apparent in the first flush BTC rather then the second flush BTC. After breakthrough, the permanganate concentration rapidly increased towards the source concentration, but showed extensive tailing in all but one case (i.e., the MAAP aquifer material) and never reached the source concentration. This incomplete breakthrough (C/C0 <100%) occurred despite at least 5 to more than 70 pore volumes (PVs) being flushed through various columns. This observation suggests that a slow reaction between the aquifer material and permanganate was still occurring at the end of each column trail and is consistent with our observations from the long-term batch experiments in which measurable permanganate consumption was observed for >200 days for most aquifer materials.
5.5.2.1 Identification of Kinetic Regions
Based on the observed BTCs shown in Figures 25 to 27, at least three kinetic regions are identifiable; a fast reaction region, an intermediate reaction region, and a slow reaction region. The extent and nature of these regions vary between the aquifer materials and we propose that a kinetic model for permanganate consumption by aquifer materials should consist of at least three parallel and independent reactions.
Evidence of Fast Reaction:
As shown in Tables 18 to 20, all column trials exhibited a delay in the arrival of permanganate at a given sampling location relative to Br. The delay between the first appearance of Br and permanganate during the first flush at the middle sample port was 0.25, 0.58, and 1.39 PVs for Borden, LC34-USU, and LC34-LSU aquifer materials respectively, while at the effluent location the delay was 0.26, 0.54, and 1.19 PVs for Borden, LC34-USU, and LC34-LSU. Since this delay is similar at the two sampling locations, it suggests that there is no residence time dependency related to this consumption and therefore is indicative of a fast reaction at the time scale of these observations.
When the EGDY aquifer material was flushed with the ~5 g KMnO4/L solution the delay in the first appearance between Br and permanganate for the first flush was 0.76 PVs; however, when it was flushed with the ~1 g KMnO4/L solution the delay increased to 2.76 PVs. While not completed scalable, this increase in the delay of the first appearance of permanganate indicates that this fast reaction behaves like an instantaneous permanganate sink which has a fixed permanganate demand that needs to be satisfied. Therefore it is not surprising that this fast reaction requires more volume of low concentration permanganate solution to fulfill its

permanganate consumption requirements rather than less volume of a high concentration permanganate solution.
Table 18: Characteristic BTC values for the Borden, LC34-LSU, and LC34-USU aquifer material column experiments.
Aquifer
Material
Characteristic
Value (PVs)
Tracer at the
mid-port
Permanganateat the mid-port
(1st flush)
Permanganateat the mid-port
(2nd flush)
Tracer at
the effluent
Permanganateat the effluent
(1st flush)
Permanganateat the effluent
(2nd flush)First Appearance 0.85 1.10 0.90 0.97 1.23 1.02
End of Trial 1.29 4.18 2.44 1.23 2.73 2.20Final BTC C/C0 1.00 0.97 0.98 1.00 0.92 0.95
First Appearance 0.85 2.24 1.49 0.79 1.98 1.22End of Trial 1.49 21.55 16.14 1.31 11.32 8.49
Final BTC C/C0 1.00 0.94 0.97 1.00 0.91 0.95
First Appearance 0.80 1.38 1.01 0.94 1.48 1.09End of Trial 1.38 5.74 6.69 1.34 3.02 3.52
Final BTC C/C0 1.00 0.92 0.98 1.00 0.85 0.95
Borden
LC34-LSU
LC34-USU
Table 19: Characteristic BTC values for the EGDY and NFF aquifer material column experiments.
Aquifer
Material
Characteristic
Value (PVs)
Tracer (forhigh MnO4
-
conc.)
Permanganateat high conc.
(1st flush)
Permanganateat high conc.(2nd flush)
Tracer (forlow MnO4
-
conc.)
Permanganateat low conc.(1st flush)
Permanganateat low conc.(2nd flush)
First Appearance 0.42 1.18 0.69 0.42 3.18 0.51End of Trial 2.27 25.64 27.82 2.27 26.00 52.91
Final BTC C/C0 1.00 0.86 0.94 1.00 0.61 0.87
First Appearance 0.58 10.35 1.71End of Trial 2.62 27.02 27.89
Final BTC C/C0 1.00 0.73 0.91
EGDY
NFF - --
66
Aquifer
Material
Characteristic
Value (PVs)
Tracer athigh flow
rate
Permanganateat high flow rate
(1st flush)
Permanganateat high flow rate
(2nd flush)
Tracer atlow flow
rate
Permanganateat low flow rate
(1st flush)
Permanganateat low flow rate
(2nd flush)First Appearance 0.80 0.87 0.83 0.80 0.83 0.81
End of Trial 1.36 2.20 1.57 1.53 1.89 1.89Final BTC C/C0 1.00 1.00 0.99 1.00 0.99 1.00
MAAP
Table 20: Characteristic BTC values for the MAAP aquifer material column.
It is believed that liable oxidizable species or fast-reacting oxidizable aquifer material (OAM) loosely attached to solid grain surfaces of the aquifer material are responsible for this fast reaction. These oxidizable components may possibly include dissolved organic matter (DOC) and/or NOM, and dissolvable ferrous iron (Fe(II)), manganese (Mn(II)), and/or sulfur (S(0), S(I), and S(II)) (Christensen et al., 2000), which react with permanganate on a time scale of minutes (Stumm, 1992). The delay in the first appearance of permanganate during the second
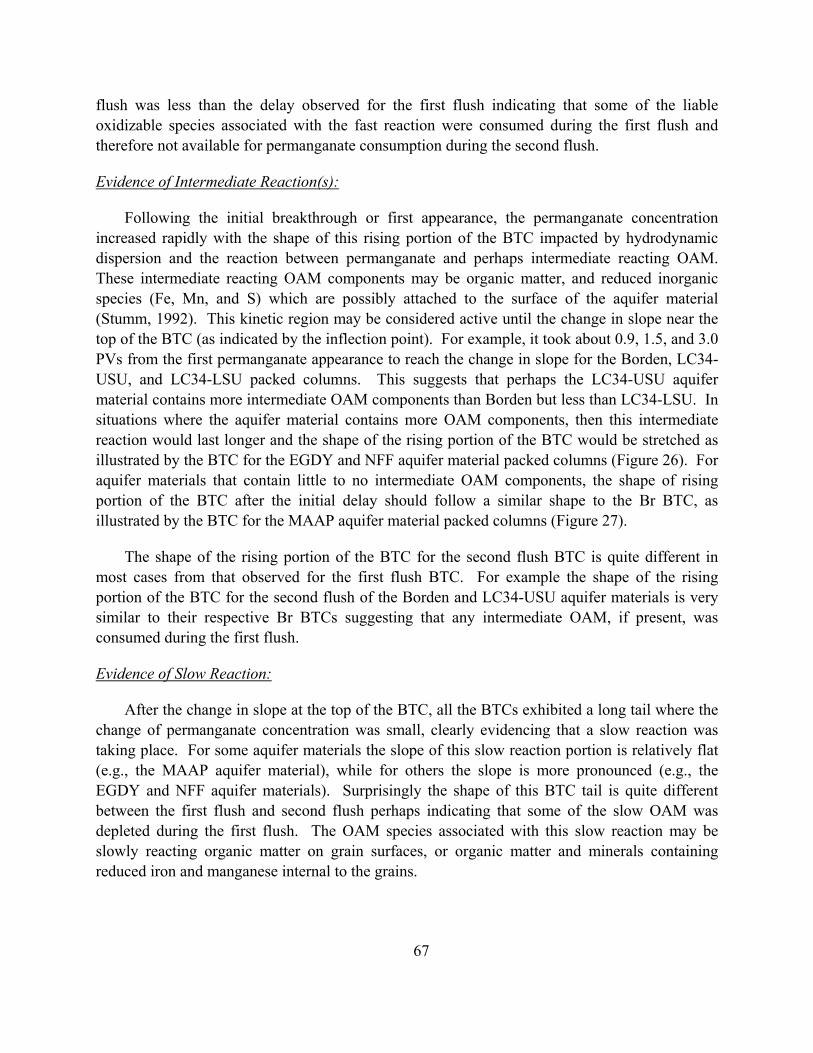
67
flush was less than the delay observed for the first flush indicating that some of the liable oxidizable species associated with the fast reaction were consumed during the first flush and therefore not available for permanganate consumption during the second flush.
Evidence of Intermediate Reaction(s):
Following the initial breakthrough or first appearance, the permanganate concentration increased rapidly with the shape of this rising portion of the BTC impacted by hydrodynamic dispersion and the reaction between permanganate and perhaps intermediate reacting OAM. These intermediate reacting OAM components may be organic matter, and reduced inorganic species (Fe, Mn, and S) which are possibly attached to the surface of the aquifer material (Stumm, 1992). This kinetic region may be considered active until the change in slope near the top of the BTC (as indicated by the inflection point). For example, it took about 0.9, 1.5, and 3.0 PVs from the first permanganate appearance to reach the change in slope for the Borden, LC34-USU, and LC34-LSU packed columns. This suggests that perhaps the LC34-USU aquifer material contains more intermediate OAM components than Borden but less than LC34-LSU. In situations where the aquifer material contains more OAM components, then this intermediate reaction would last longer and the shape of the rising portion of the BTC would be stretched as illustrated by the BTC for the EGDY and NFF aquifer material packed columns (Figure 26). For aquifer materials that contain little to no intermediate OAM components, the shape of rising portion of the BTC after the initial delay should follow a similar shape to the Br BTC, as illustrated by the BTC for the MAAP aquifer material packed columns (Figure 27).
The shape of the rising portion of the BTC for the second flush BTC is quite different in most cases from that observed for the first flush BTC. For example the shape of the rising portion of the BTC for the second flush of the Borden and LC34-USU aquifer materials is very similar to their respective Br BTCs suggesting that any intermediate OAM, if present, was consumed during the first flush.
Evidence of Slow Reaction:
After the change in slope at the top of the BTC, all the BTCs exhibited a long tail where the change of permanganate concentration was small, clearly evidencing that a slow reaction was taking place. For some aquifer materials the slope of this slow reaction portion is relatively flat (e.g., the MAAP aquifer material), while for others the slope is more pronounced (e.g., the EGDY and NFF aquifer materials). Surprisingly the shape of this BTC tail is quite different between the first flush and second flush perhaps indicating that some of the slow OAM was depleted during the first flush. The OAM species associated with this slow reaction may be slowly reacting organic matter on grain surfaces, or organic matter and minerals containing reduced iron and manganese internal to the grains.

5.5.2.2 Estimation of Permanganate NOD
Based on a permanganate BTC, the NOD can be estimated from
⎥⎦⎤
⎢⎣⎡ +−−= ∫
t
MnoMnoaq
PVtCCdtQtCtQCm 0
2/))(( )(1NOD(t) (36)
where Co is the permanganate source concentration [ML-3], CMn is the permanganate concentration associated with the given BTC [ML-3], Q is flow rate [L3T-1], PV is the column pore volume between the inlet and the sampling location [L3], and maq is the mass of aquifer material packed in the column between the inlet and the sampling location. Eq. (36) was developed by considering a mass balance of permanganate mass entering the column (first term), permanganate mass crossing a sampling location (second term), and permanganate mass stored between the inlet and the sampling location (third term). The calculation of the mass of permanganate stored is approximate since the concentration profile within the column is unknown; however, after several PVs have been passed through the column or when the permanganate BTC concentration is close to the source concentration, this approximation results in an insignificant change in the estimated NOD. For example, if we assume that mass of permanganate stored can be estimated by the source concentration rather than by the average concentration, then the relative error in NOD after 2.0 PVs is <10% and decreases to <1% after 10 PVs. Table 21 lists the estimated permanganate NOD values for each flushing episode based on the duration of each episode (Table 17) and Eq. (36). Also listed in Table 21 is an NOD estimate using the observed slow permanganate consumption rate extrapolated until it intersects C/Co = 1, and the overall maximum 7-day NOD and NODmax observed from the batch experiments.
The data in Table 21 show that, except for the MAAP aquifer material, >60% of the NOD was expressed during the first flush indicating that a large portion of the observed permanganate consumption is relatively fast. This observation is consistent with the trends observed from our batch experiments in which over 60% of the maximum NOD was expressed within the first 7-days for all aquifer materials except for MAAP. The data also show that the use of a high permanganate concentration (5 g/L) in the EGDY column experiments generated a much higher NOD than when the lower permanganate concentration (1 g/L) was used (10.95 vs 4.56 g/kg). This again confirms that the NOD reaction is highly sensitive to the concentration of permanganate. The NOD estimated from the MAAP column experiments indicate that the lower flow rate generated a slightly higher NOD then when the high flow rate was used presumably a result of the longer residence time. The NOD estimated from the mid-port sampling location BTC and the effluent BTC (for Borden, LC34-LSU, LC34-USU aquifer materials) produced similar NOD values suggesting that the physical scale of these column trials is sufficient to capture the important NOD reaction processes.
68

Table 21: NOD (g/kg) estimated from the permanganate BTCs using Eq. (36). The NOD projected was estimated by extrapolating the rate of slow permanganate consumption until it intersected C/Co = 1.
1st flush 2nd flush Sum of two flush trials NOD projected 7-day NODmax NODmax
(g/kg) (g/kg) (g/kg) (column) (g/kg) (batch) (g/kg) (batch) (g/kg)Mid-port 0.73 0.18 0.91 0.92Effluent 0.81 0.28 1.09 1.10
C0 = 5 g/L 7.92 3.03 10.95 11.85C0 = 1 g/L 2.71 1.85 4.56 5.03Mid-port 4.65 1.95 6.60 6.91Effluent 4.43 2.14 6.57 6.99Mid-port 1.14 0.37 1.51 1.55Effluent 1.05 0.43 1.48 1.52
High flow 0.07 0.07 0.15 0.15Low flow 0.12 0.10 0.22 0.22
NFF C0 =5.2 g/L 25.50 7.42 32.93 36.55 70.80 98.18
35.32
1.94
16.75
2.14
AquiferMaterial
LC34-LSU 14.46
LC34-USU 9.34
Borden 2.79
EGDY
9.65
6.20
0.45MAAP
0.1
1.0
10.0
100.0
Borden EGDY LC34-LSU
LC34-USU
MAAP NFF
NO
D (g
/kg)
Avg. NODmax (batch)NOD (Column)
Figure 28: Permanganate NOD from batch and column systems. The column NOD was estimated by extrapolating the rate of slow permanganate consumption until the effluent permanganate BTC intersected C/Co = 1.
Figure 28 displays the average NODmax observed from batch experiments and the average NOD projected from column experiments. In all cases the average NODmax observed from the batch experiments was 2.0 to 10.0 times greater than the NOD extrapolated from the column experiments. Moreover, even the average 7-day NODmax observed from batch experiments (Table 21) is also greater than the average projected NOD for column experiments. This is consistent with the findings from Mumford et al. (2005) and is assumed to be related to the different aquifer material contact characteristics between batch and column tests. It is noted that the projected NOD estimates are based on the premise that the slow permanganate consumption
69
rate observed at the end of the column experiment remains constant. If this rate does decrease then this assumption would lead to an underestimation of the NOD.
A correlation analysis indicates an excellent linear relationship (r2 = 0.99) between both the average 7-day and maximum NOD from the batch tests and the extrapolated NOD from the column experiments (Figure 29). This suggests that permanganate consumption in a column system can be projected from batch system data using the following expression
48.0(batch) 61.0 (column) averageday -7 += NODNOD (r2 = 0.99) (37)
Batch 7-day NOD (g/kg)
Col
umn
NO
D(g
/kg)
0 20 40 60 800
10
20
30
40
7-d avg.7-d max
Figure 29: Scatter plot of the average 7-day NOD and the maximum 7-day NOD results from the batch tests and the NOD projected from the column experiments. Also shown are best fit linear relationships between the column NOD and the average 7-day NOD (r2 = 0.99) and the maximum 7-day NOD (r2 = 0.99).
Furthermore, a good linear relationship between the NOD value projected from the column experiments and permanganate COD value is given by
98.258.0 (column) −= PCODNOD (r2 = 0.91) (38)
where PCOD is the permanganate COD test value (g-KMnO4 / kg of dry aquifer materials). Since permanganate COD tests (Section 5.2.3) are easily and quickly implemented relative to batch experiments, Eq. (37) is expected to be more applicable than Eq. (38) for estimating the in situ permanganate consumption.
70

5.5.2.3 Overall Permanganate Consumption Rates
Overall permanganate consumption rates were calculated (Table 22) for each column experiment corresponding to: (1) the first appearance of permanganate which reflects the fast reaction rate, and (2) the tail of the permanganate BTC which reflects the slow permanganate rate. The fast permanganate consumption rate was calculated by assuming plug-flow conditions estimated by the delay in the first appearance of permanganate relative to Br as estimated from
( ) aqoaBr
aMnaq
aBr
aMno
fastNOD mCQttmttQCr /)(/)( =−−= (39)
where is the fast permanganate consumption rate, t and t are the elapsed time with respect to the first arrival of permanganate and bromide at the sampling location. The slow consumption rate was estimated from the slope of NOD(t) as given by Eq. (36).
fastNODr a
MnaBr
Table 22: Overall permanganate consumption (NOD) rates.
First Flush Second Flush First Flush Second Flush
Mid-Port 3.9 0.93 0.31 0.37Effluent 1.8 0.45 0.21 0.20
High Conc. 14 8.4 3.1 1.4Low Conc. 3.6 0.73 1.6 0.61Mid-Port 11 8.6 1.0 0.52Effluent 5.7 3.7 0.90 0.52Mid-Port 5.1 1.6 1.1 0.36Effluent 2.8 1.0 0.81 0.32
High Flow Rate 0.64 0.29 0.053 0.039Low Flow Rate 0.16 0.056 0.036 0.036
NFF Effluent 28 18 7.6 2.6
MAAP
Aquifer
MaterialSample port
Borden
EGDY
LC34-LSU
LC34-USU
Fast NOD rate (g/kg/day) Slow NOD rate (g/kg/day)
From data given in Table 22, the estimate of the fast consumption rate varies from 0.2 to 30 g/kg/day for the first-flush BTCs, and was considerably less for the second flush BTCs for all trials, indicating that a majority of fast reacting OAM was consumed during the first flush. The slow permanganate consumption rates estimated for both the MAAP and Borden aquifer materials for the first and second flush are similar indicating that perhaps that the OAM related to the fast and intermediate reactions rates have been depleted at the end of the first flush; this was not the case for LC34-USU, LC34-LSU, EGDY, and NFF aquifer materials, and as is consistent with our observations discussed in Section 5.2.5.2.1.
71
72
5.5.3 Summary
The results from these permanganate column experiments suggest that there exist at least three kinetic regions controlling permanganate consumption by aquifer materials: a very fast reaction, an intermediate reaction(s), and a slow reaction. We believe that different reactive species in the aquifer materials are responsible for these three reactions: (1) the fast reaction may be controlled by labile organic species (possibly as dissolvable organic matter) and easily dissolved reduced metals (e.g., Fe, Mn, and S) loosely attached on the grain surfaces, (2) the intermediate reaction(s) may be controlled by organic species and inorganic compounds containing reduced metal (e.g., Fe, Mn, and S) bound on the grain surface, and (3) the slow reaction is associated with slowly reacting organic matter on grain surfaces, or organic matter and minerals containing reduced iron and manganese internal to the grains.
Permanganate consumption in these column experiments display some similar traits as we observed in the batch tests (e.g., sensitivity to concentration, and contact time), therefore, the prediction of permanganate consumption has been successfully realized based on the permanganate consumption in the batch systems as well as based on the permanganate COD test. However, permanganate NOD values estimated from the column trials are generally considerably less than those measured from the batch experiments. This difference is mainly ascribed to the solution/aquifer material contact differences between a column and a well-mixed batch reactor, and illustrates that results from well-mixed batch tests should be used with caution.
Finally, these column results indicated that >60% of the permanganate consumption occurred during the first flush suggesting that there may be an optimal approach to control the unproductive consumption of permanganate by aquifer materials through multiple-oxidant injection episodes.

73
6 HYDROGEN PEROXIDE
This section addresses the interaction between hydrogen peroxide and aquifer materials, and begins with a background review on relevant hydrogen peroxide reactions, applications in groundwater remediation, and decomposition in the subsurface. Following this review, results from a series of bench-scale experiments designed to investigate hydrogen peroxide fate in the subsurface environment are discussed. Batch experiments with mixtures of hydrogen peroxide and non-autoclaved or autoclaved aquifer materials from eight sites provided an overall understanding of hydrogen peroxide behavior in the presence of aquifer materials. The impact of chelating reagents to enhance the stability of hydrogen peroxide was also evaluated under several scenarios. Finally, results from column experiments designed to complement and expand the findings of the batch experiments are presented, along with a mathematical model developed to capture hydrogen peroxide decomposition.
6.1 Background
While the first use of hydrogen peroxide in groundwater occurred in the late 1980s as an oxygen source for in situ biodegradation of contaminants (Nyer and Vance, 1999), there exist very few examples of direct field application of hydrogen peroxide alone as an oxidant in environmental engineering although theoretically hydrogen peroxide has a relatively high oxidation potential (Jones, 1999). Two approaches associated with hydrogen peroxide (Fenton’s and Fenton-like approaches) have been explored and widely applied in subsurface remediation since the first report on hydrogen peroxide use for ISCO in the 1990s (Watts et al., 1990). Watts and Teel (2005) proposed the term “Catalyzed Hydrogen Peroxide Propagations (CHP)” to unify these two approaches because the principle of these two approaches is that the catalysis of high concentrations of hydrogen peroxide generates a suite of reactive oxygen species through propagation reactions (Pignatello et al., 2006; Neyens et al, 2003; Chen et al., 2001; Jones, 1999), which are hypothesized to be responsible for destroying target contaminants in the subsurface (Pignatello et al., 2006; Neyens et al, 2003). In subsurface remediation, only thermal Fenton’s processes rather than photochemical processes are applicable since light can not penetrate the subsurface beyond a few millimeters (Pignatello et al., 2006). Therefore, the following discussion focuses only on the ISCO thermal Fenton’s processes.
The rapid decomposition of hydrogen peroxide in soils may limit the application of Fenton’s reagent for in situ chemical remediation of contaminated sites. The presence of iron minerals (e.g., goethite, magnetite, and hematite) or other transition metals (Mn(II, IV), Ti(III)) in a peroxide system can significantly facilitate contaminant oxidation via catalysis (Watts et al.,
1999c; Baciocchi et al., 2003; Teel et al., 2001; Gallard and De-Laat, 2000; Lin and Gurol 1998). Furthermore, studies have indicated that aquifer organic matter (AOM) or natural organic matter (NOM) can give rise to complex interactions and its impact on the oxidation effectiveness and efficiency depend on the concentration of the NOM (Kwan and Voelker 2003; Petigara et al. 2002), or may have no significant effect (Huling et al., 2001). The effect of humic acid on the oxidation rate and extent depends on its concentration, and that humic acid can act as a free radical scavenger, a radical chain promoter, and a catalytic site inhibitor (Valentine and Wang, 1998; Voelker and Sulzberger, 1996). In addition, microbioactivity may also be responsible for hydrogen peroxide decomposition (Vogt et al., 2004; Petigara et al. 2002).
The mechanisms of hydrogen peroxide decomposition are complicated by the presence of various reductants and catalysts. Four types of mechanisms are potentially responsible for the hydrogen peroxide decomposition: (1) the oxidation of hydrogen peroxide to oxygen, (2) Harber-Weiss reaction, (3) the catalase-type reaction, and (4) the peroxidase-type reaction (Petigara et al., 2002). The catalase-type decomposition occurs when free hydroxyl radicals generated by the Harber-Weiss reaction react with excess hydrogen peroxide and the overall reaction products will be oxygen and water. The peroxidase-type reaction responsible for hydrogen peroxide decomposition can be written as (Petigara et al., 2002)
OHSOHS OXRED 222 +→+ (40)
where SRED represents the soil constituents (usually reductants), and SOX represents the oxidized substrates.
Lin and Gurol (1998) demonstrated that the decomposition rate of hydrogen peroxide in the presence of goethite was proportional to the concentration of the goethite surface sites and hydrogen peroxide. Kwan and Voelker (2003) showed that the generation rate of hydroxide radicals was proportionally related to the product of the hydrogen peroxide concentration and the solid concentration containing iron-oxides; however, this radical generation rate did not equal to the decomposition rate of hydrogen peroxide. De-Laat and Gallard (1999) summarized that four steps are involved in the catalytic decomposition of hydrogen peroxide by soluble Fe(III): (1) the hydrolysis of Fe(III); (2) the initiation step; (3) the propagation step; and (4) the recombination step. For each reaction step, an overall second-order reaction was used to describe the kinetic model. The concentration-time profile for a particular species is described with a lumped equation of all the step reactions involving that species (Gallard and De-Laat, 2000).
74

75
6.2 H2O2 Decomposition in the Presence of Aquifer Materials in Batch Systems
6.2.1 Methods
Two sets of experiments were performed: one with non-autoclaved aquifer materials and the other with autoclaved aquifer materials. The autoclaved aquifer materials were obtained by autoclaving (Castle®, MDT Steam Sterilizer) the corresponding air-dried aquifer materials for about 30 minutes. For each set of experiments, 15 g of dried aquifer material and 80 mL of a hydrogen peroxide solution (2.0%) were added to a 110 mL amber reactor fitted with a Teflon cap. The hydrogen peroxide solution was made from a stock 30% hydrogen peroxide solution (VWR, Toronto, Canada). The initial pH of the H2O2 solution was adjusted to 3.0 ± 0.2 using 1.0 N NaOH and 1.0 N H2SO4. All experiments were performed in replicates (for autoclaved aquifer materials), or triplicates (for non-autoclaved aquifer materials).
All reactors were placed on a reciprocal shaker (Eberbach Corp., Ann Arbor, Michigan). At designated times, an aliquot of the soild/aqueous solution (~0.5 mL) was removed with a syringe and filtered through a 0.45 µm filter (Nalgene). The concentration of hydrogen peroxide in the filtrate was quantified with an iodiometric titration method (Schumb et al., 1955). The solution pH was monitored throughout the course of each experiment using a pH meter (Model 81-02, Orion). In addition, an aliquot of solution (~5 mL) was taken from each batch reactor within the first hour, filtered through a 0.45 µm filter (Nalgene) and used to quantify total iron (Fe) and manganese (Mn) dissolved concentrations using an ICP emission spectroscopy with a Spectro Flame instrument (Spectro Analytical, Fitchburg, MA) with a MDL of 0.1 mg/L for Fe and 0.01 mg/L for Mn, respectively.
A third set of experiments was performed to investigate changes in the bulk reduction capacity to each aquifer material to prolonged exposure to hydrogen peroxide. In this set of experiments, a series of reactors containing 80 mL of a 2% H2O2 solution (initial pH 3.0) and 15 g of non-autoclaved aquifer materials (DNTS, EGDY, LC34 USU, MAAP, and NIROP) were shielded from light for two weeks (triplicates for each aquifer material) and gently shaken on a reciprocal shaker for one hour daily. After the two-week reaction period, aquifer materials in these reactors were rinsed three times with Milli-Q water, and dried at 80oC to a constant weight. After cooling to room temperature, dichromate COD tests were performed on these dried aquifer materials using the method presented in Section 4.7.
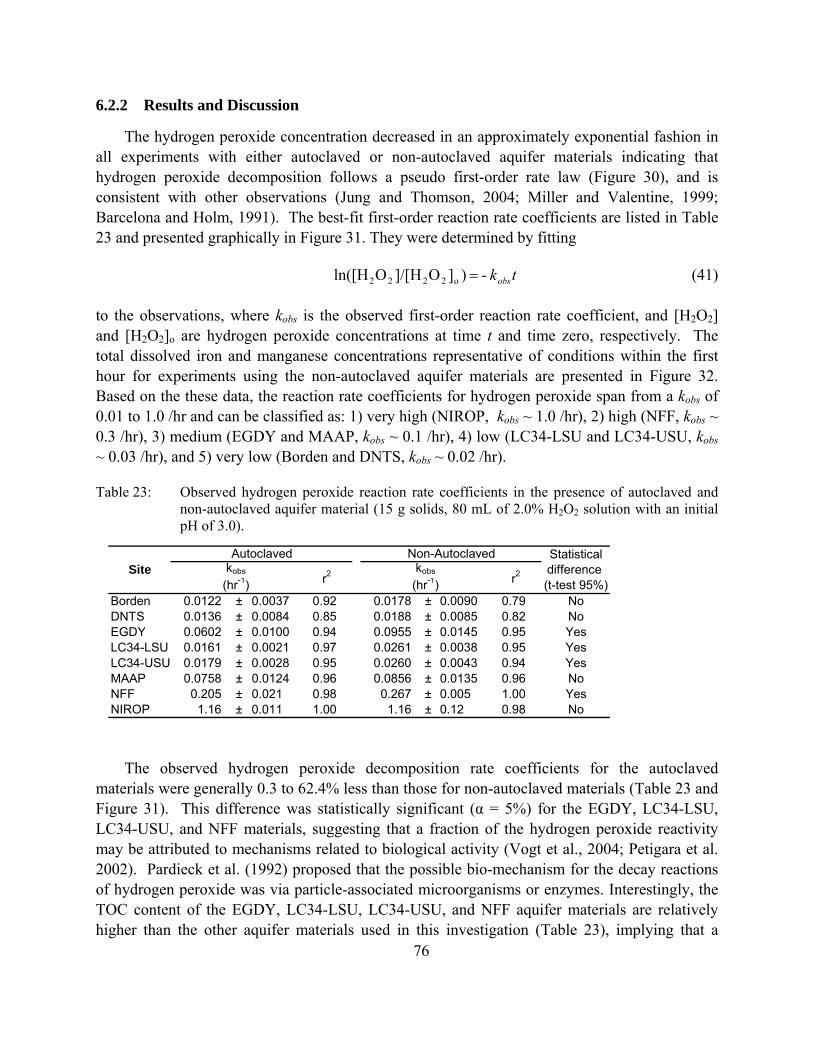
6.2.2 Results and Discussion
The hydrogen peroxide concentration decreased in an approximately exponential fashion in all experiments with either autoclaved or non-autoclaved aquifer materials indicating that hydrogen peroxide decomposition follows a pseudo first-order rate law (Figure 30), and is consistent with other observations (Jung and Thomson, 2004; Miller and Valentine, 1999; Barcelona and Holm, 1991). The best-fit first-order reaction rate coefficients are listed in Table 23 and presented graphically in Figure 31. They were determined by fitting
tkobs = - )]O]/[HOln([H o2222 (41)
to the observations, where kobs is the observed first-order reaction rate coefficient, and [H2O2] and [H2O2]o are hydrogen peroxide concentrations at time t and time zero, respectively. The total dissolved iron and manganese concentrations representative of conditions within the first hour for experiments using the non-autoclaved aquifer materials are presented in Figure 32. Based on the these data, the reaction rate coefficients for hydrogen peroxide span from a kobs of 0.01 to 1.0 /hr and can be classified as: 1) very high (NIROP, kobs ~ 1.0 /hr), 2) high (NFF, kobs ~ 0.3 /hr), 3) medium (EGDY and MAAP, kobs ~ 0.1 /hr), 4) low (LC34-LSU and LC34-USU, kobs ~ 0.03 /hr), and 5) very low (Borden and DNTS, kobs ~ 0.02 /hr).
Table 23: Observed hydrogen peroxide reaction rate coefficients in the presence of autoclaved and non-autoclaved aquifer material (15 g solids, 80 mL of 2.0% H2O2 solution with an initial pH of 3.0).
76
Borden 0.0122 ± 0.0037 0.92 0.0178 ± 0.0090 0.79 NoDNTS 0.0136 ± 0.0084 0.85 0.0188 ± 0.0085 0.82 NoEGDY 0.0602 ± 0.0100 0.94 0.0955 ± 0.0145 0.95 YesLC34-LSU 0.0161 ± 0.0021 0.97 0.0261 ± 0.0038 0.95 YesLC34-USU 0.0179 ± 0.0028 0.95 0.0260 ± 0.0043 0.94 YesMAAP 0.0758 ± 0.0124 0.96 0.0856 ± 0.0135 0.96 NoNF 0.205 ± 0.021 0.98 0.267 ± 0.005 1.00 YesNIROP 1.16 ± 0.011 1.00 1.16 ± 0.12 0.98 No
kobs
(hr-
F
1)Site
Statistical difference (t-test 95%)
Autoclaved Non-Autoclaved
r2 r2kobs
(hr-1)
The observed hydrogen peroxide decomposition rate coefficients for the autoclaved materials were generally 0.3 to 62.4% less than those for non-autoclaved materials (Table 23 and Figure 31). This difference was statistically significant (α = 5%) for the EGDY, LC34-LSU, LC34-USU, and NFF materials, suggesting that a fraction of the hydrogen peroxide reactivity may be attributed to mechanisms related to biological activity (Vogt et al., 2004; Petigara et al. 2002). Pardieck et al. (1992) proposed that the possible bio-mechanism for the decay reactions of hydrogen peroxide was via particle-associated microorganisms or enzymes. Interestingly, the TOC content of the EGDY, LC34-LSU, LC34-USU, and NFF aquifer materials are relatively higher than the other aquifer materials used in this investigation (Table 23), implying that a
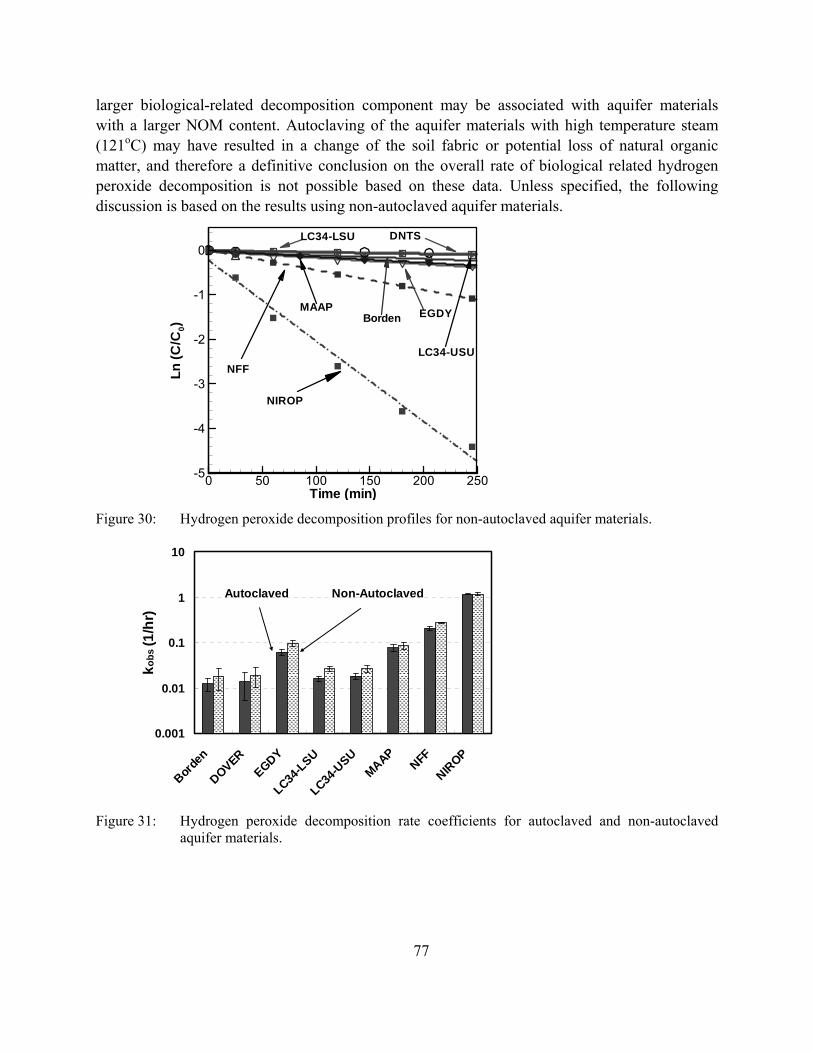
Time (min)
Ln(C
/C0)
0 50 100 150 200 250-5
-4
-3
-2
-1
0
NFF
MAAP EGDY
NIROP
Borden
DNTS
LC34-USU
LC34-LSU
larger biological-related decomposition component may be associated with aquifer materials with a larger NOM content. Autoclaving of the aquifer materials with high temperature steam (121oC) may have resulted in a change of the soil fabric or potential loss of natural organic matter, and therefore a definitive conclusion on the overall rate of biological related hydrogen peroxide decomposition is not possible based on these data. Unless specified, the following discussion is based on the results using non-autoclaved aquifer materials.
Figure 30: Hydrogen peroxide decomposition profiles for non-autoclaved aquifer materials.
0.001
0.01
0.1
1
10
Borde
n
DOVEREGDY
LC34-LSU
LC34-U
SUMAAP
NFF
NIROP
kobs
(1/h
r)
Autoclaved Non-Autoclaved
Figure 31: Hydrogen peroxide decomposition rate coefficients for autoclaved and non-autoclaved
aquifer materials.
77
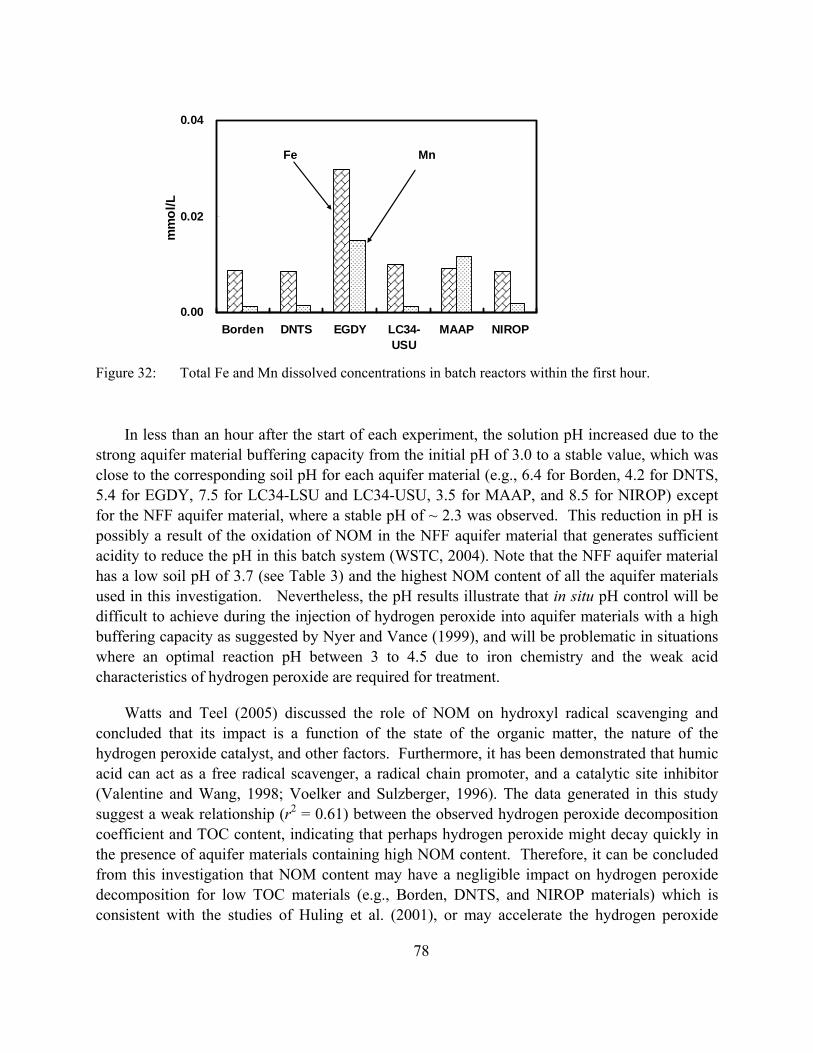
0.00
0.02
0.04
Borden DNTS EGDY LC34-USU
MAAP NIROP
mm
ol/L
Fe Mn
Figure 32: Total Fe and Mn dissolved concentrations in batch reactors within the first hour.
In less than an hour after the start of each experiment, the solution pH increased due to the strong aquifer material buffering capacity from the initial pH of 3.0 to a stable value, which was close to the corresponding soil pH for each aquifer material (e.g., 6.4 for Borden, 4.2 for DNTS, 5.4 for EGDY, 7.5 for LC34-LSU and LC34-USU, 3.5 for MAAP, and 8.5 for NIROP) except for the NFF aquifer material, where a stable pH of ~ 2.3 was observed. This reduction in pH is possibly a result of the oxidation of NOM in the NFF aquifer material that generates sufficient acidity to reduce the pH in this batch system (WSTC, 2004). Note that the NFF aquifer material has a low soil pH of 3.7 (see Table 3) and the highest NOM content of all the aquifer materials used in this investigation. Nevertheless, the pH results illustrate that in situ pH control will be difficult to achieve during the injection of hydrogen peroxide into aquifer materials with a high buffering capacity as suggested by Nyer and Vance (1999), and will be problematic in situations where an optimal reaction pH between 3 to 4.5 due to iron chemistry and the weak acid characteristics of hydrogen peroxide are required for treatment.
Watts and Teel (2005) discussed the role of NOM on hydroxyl radical scavenging and concluded that its impact is a function of the state of the organic matter, the nature of the hydrogen peroxide catalyst, and other factors. Furthermore, it has been demonstrated that humic acid can act as a free radical scavenger, a radical chain promoter, and a catalytic site inhibitor (Valentine and Wang, 1998; Voelker and Sulzberger, 1996). The data generated in this study suggest a weak relationship (r2 = 0.61) between the observed hydrogen peroxide decomposition coefficient and TOC content, indicating that perhaps hydrogen peroxide might decay quickly in the presence of aquifer materials containing high NOM content. Therefore, it can be concluded from this investigation that NOM content may have a negligible impact on hydrogen peroxide decomposition for low TOC materials (e.g., Borden, DNTS, and NIROP materials) which is consistent with the studies of Huling et al. (2001), or may accelerate the hydrogen peroxide
78
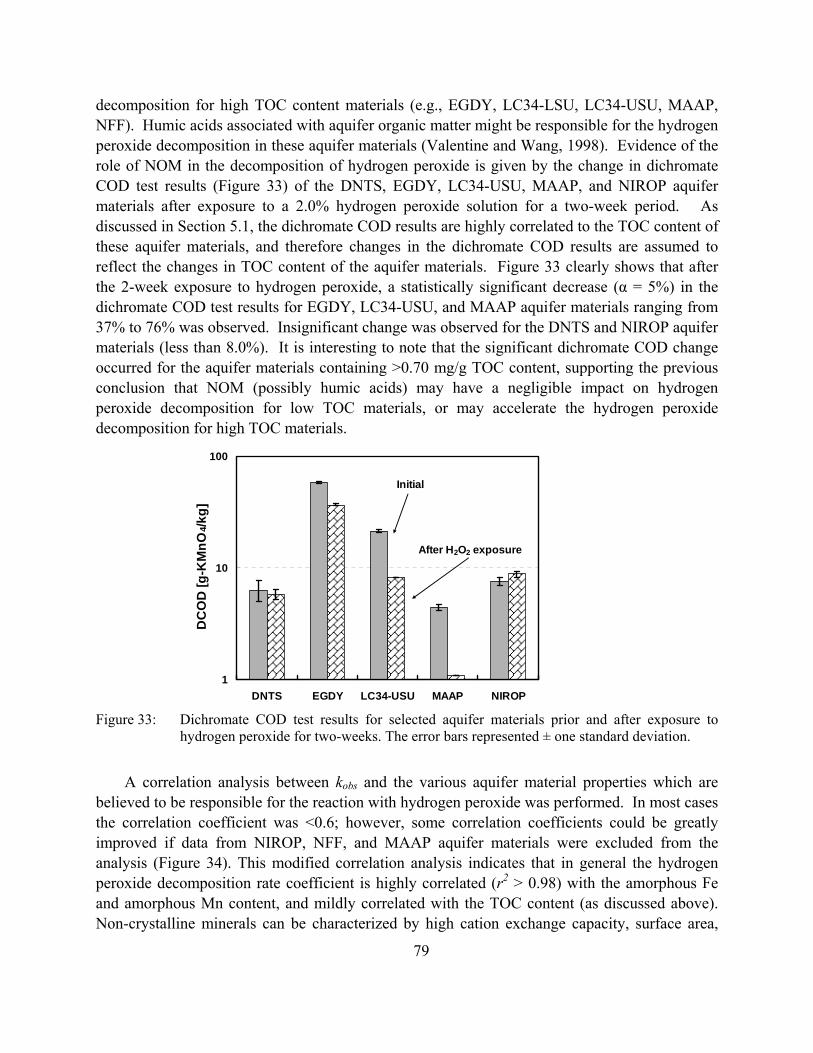
decomposition for high TOC content materials (e.g., EGDY, LC34-LSU, LC34-USU, MAAP, NFF). Humic acids associated with aquifer organic matter might be responsible for the hydrogen peroxide decomposition in these aquifer materials (Valentine and Wang, 1998). Evidence of the role of NOM in the decomposition of hydrogen peroxide is given by the change in dichromate COD test results (Figure 33) of the DNTS, EGDY, LC34-USU, MAAP, and NIROP aquifer materials after exposure to a 2.0% hydrogen peroxide solution for a two-week period. As discussed in Section 5.1, the dichromate COD results are highly correlated to the TOC content of these aquifer materials, and therefore changes in the dichromate COD results are assumed to reflect the changes in TOC content of the aquifer materials. Figure 33 clearly shows that after the 2-week exposure to hydrogen peroxide, a statistically significant decrease (α = 5%) in the dichromate COD test results for EGDY, LC34-USU, and MAAP aquifer materials ranging from 37% to 76% was observed. Insignificant change was observed for the DNTS and NIROP aquifer materials (less than 8.0%). It is interesting to note that the significant dichromate COD change occurred for the aquifer materials containing >0.70 mg/g TOC content, supporting the previous conclusion that NOM (possibly humic acids) may have a negligible impact on hydrogen peroxide decomposition for low TOC materials, or may accelerate the hydrogen peroxide decomposition for high TOC materials.
1
10
100
DNTS EGDY LC34-USU MAAP NIROP
DC
OD
[g-K
MnO
4/kg]
Initial
After H2O2 exposure
Figure 33: Dichromate COD test results for selected aquifer materials prior and after exposure to
hydrogen peroxide for two-weeks. The error bars represented ± one standard deviation.
A correlation analysis between kobs and the various aquifer material properties which are
believed to be responsible for the reaction with hydrogen peroxide was performed. In most cases the correlation coefficient was <0.6; however, some correlation coefficients could be greatly improved if data from NIROP, NFF, and MAAP aquifer materials were excluded from the analysis (Figure 34). This modified correlation analysis indicates that in general the hydrogen peroxide decomposition rate coefficient is highly correlated (r2 > 0.98) with the amorphous Fe and amorphous Mn content, and mildly correlated with the TOC content (as discussed above). Non-crystalline minerals can be characterized by high cation exchange capacity, surface area,
79
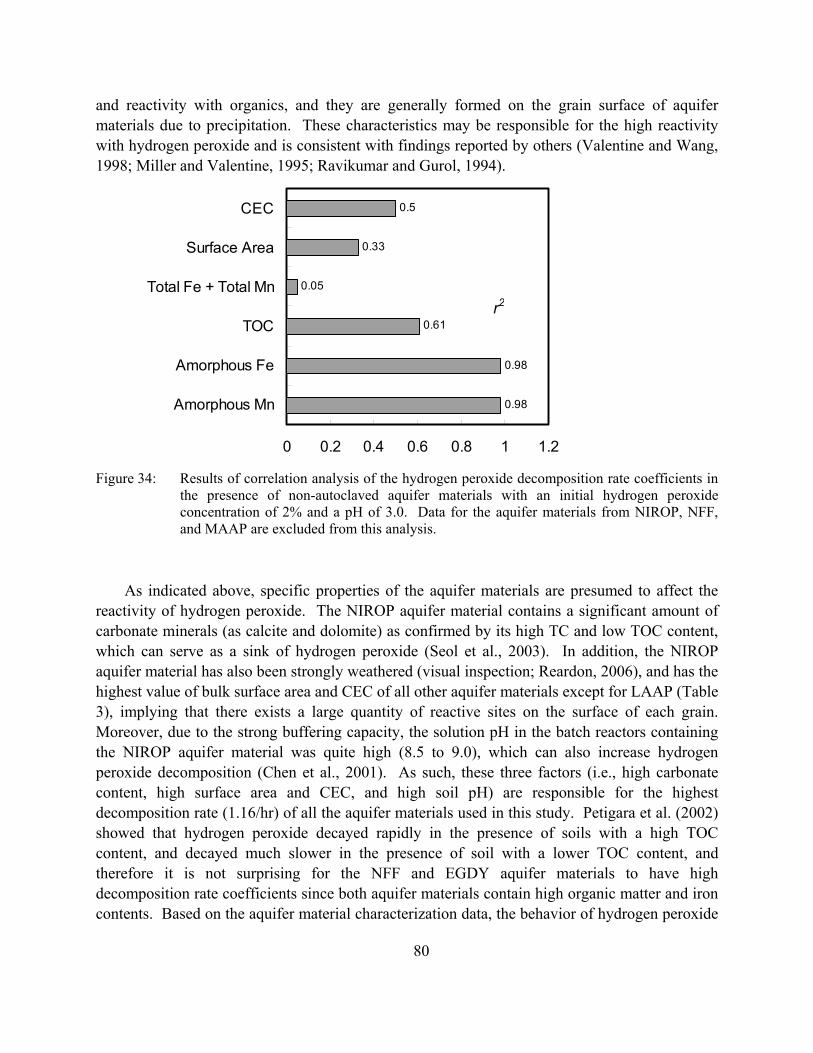
and reactivity with organics, and they are generally formed on the grain surface of aquifer materials due to precipitation. These characteristics may be responsible for the high reactivity with hydrogen peroxide and is consistent with findings reported by others (Valentine and Wang, 1998; Miller and Valentine, 1995; Ravikumar and Gurol, 1994).
0.98
0.98
0.61
0.05
0.33
0.5
0 0.2 0.4 0.6 0.8 1 1.2
Amorphous Mn
Amorphous Fe
TOC
Total Fe + Total Mn
Surface Area
CEC
r2
Figure 34: Results of correlation analysis of the hydrogen peroxide decomposition rate coefficients in
the presence of non-autoclaved aquifer materials with an initial hydrogen peroxide concentration of 2% and a pH of 3.0. Data for the aquifer materials from NIROP, NFF, and MAAP are excluded from this analysis.
As indicated above, specific properties of the aquifer materials are presumed to affect the reactivity of hydrogen peroxide. The NIROP aquifer material contains a significant amount of carbonate minerals (as calcite and dolomite) as confirmed by its high TC and low TOC content, which can serve as a sink of hydrogen peroxide (Seol et al., 2003). In addition, the NIROP aquifer material has also been strongly weathered (visual inspection; Reardon, 2006), and has the highest value of bulk surface area and CEC of all other aquifer materials except for LAAP (Table 3), implying that there exists a large quantity of reactive sites on the surface of each grain. Moreover, due to the strong buffering capacity, the solution pH in the batch reactors containing the NIROP aquifer material was quite high (8.5 to 9.0), which can also increase hydrogen peroxide decomposition (Chen et al., 2001). As such, these three factors (i.e., high carbonate content, high surface area and CEC, and high soil pH) are responsible for the highest decomposition rate (1.16/hr) of all the aquifer materials used in this study. Petigara et al. (2002) showed that hydrogen peroxide decayed rapidly in the presence of soils with a high TOC content, and decayed much slower in the presence of soil with a lower TOC content, and therefore it is not surprising for the NFF and EGDY aquifer materials to have high decomposition rate coefficients since both aquifer materials contain high organic matter and iron contents. Based on the aquifer material characterization data, the behavior of hydrogen peroxide
80

in the presence of the LC34-USU, LC34-LSU, and MAAP aquifer materials should be similar; however, the hydrogen peroxide decomposition rate coefficient in the presence of the MAAP aquifer material is much higher due to the higher dissolved Mn concentration in the reactor solution for the MAAP aquifer material than for the LC34-LSU and LC34-USU aquifer materials (Figure 32) even though the MAAP aquifer material itself contains a relatively low content of total Fe and Mn. This is consistent with the interaction between hydrogen peroxide and soluble Fe reported by Watts and Teel (2005). The low hydrogen peroxide decomposition rate coefficients observed for the Borden and DNTS aquifer materials are attributed to their low TOC content and dissolvable Fe and Mn content.
A multiple linear regression analysis was performed on the observed hydrogen peroxide reaction rate coefficients with the various aquifer material characteristics. No significantly statistical model could be obtained unless data from NIROP and NFF aquifer materials were excluded. These two aquifer materials had the largest observed reaction rate coefficients (0.3 and 1.2 /hr) and their exclusion indicates that perhaps the hydrogen peroxide decomposition mechanisms are significantly different for these materials. In general, the observed reaction rate coefficients could be expressed by combinations of TOC, total Fe and total Mn contents, amorphous Fe and Mn contents, surface area, and CEC (Table 24). Each of these characteristics alone (except for amorphous Fe and Mn) did not yield a satisfactory relationship (r2 < 0.62) for the hydrogen peroxide decomposition rate coefficient, indicating that hydrogen peroxide decomposition is a result of the combined influence of various aquifer material characteristics. Table 24 lists various expressions for the observed hydrogen peroxide decomposition rate coefficient using data from only 4, 5, and 6 aquifer materials. When data from four aquifer materials were considered the best-fit expressions involved combinations of surface area, total Fe and amorphous Mn. When an additional aquifer material was added to the analysis, a series of the best fit expressions were obtained, one of simplest involved only amorphous Fe given by:
0.0126]F Amorphous[0899.0 −•= ekobs (r2 = 0.99) (42)
where amorphous Fe is expressed in terms of mg/g, ranging from 0.29 to 1.2 mg/g. Moreover, if
data from 6 aquifer materials (i.e., Borden, DNTS, EGDY, LC34-LSU, LC34-USU, and MAAP)
were used, only the following statistically significant expression was generated:
0.0385CEC00949.0TOC613.0 +•−•=obsk (r2 = 0.94) (43)
where CEC is the cation exchange capacity (cmol/kg), and TOC is expressed in terms of mg/g. Eq. (42) is suitable for practical use since it is the simplest; however, Eq.(43) involves data from 6 rather than 5 aquifer materials and thus may provide a more representative estimate.
81
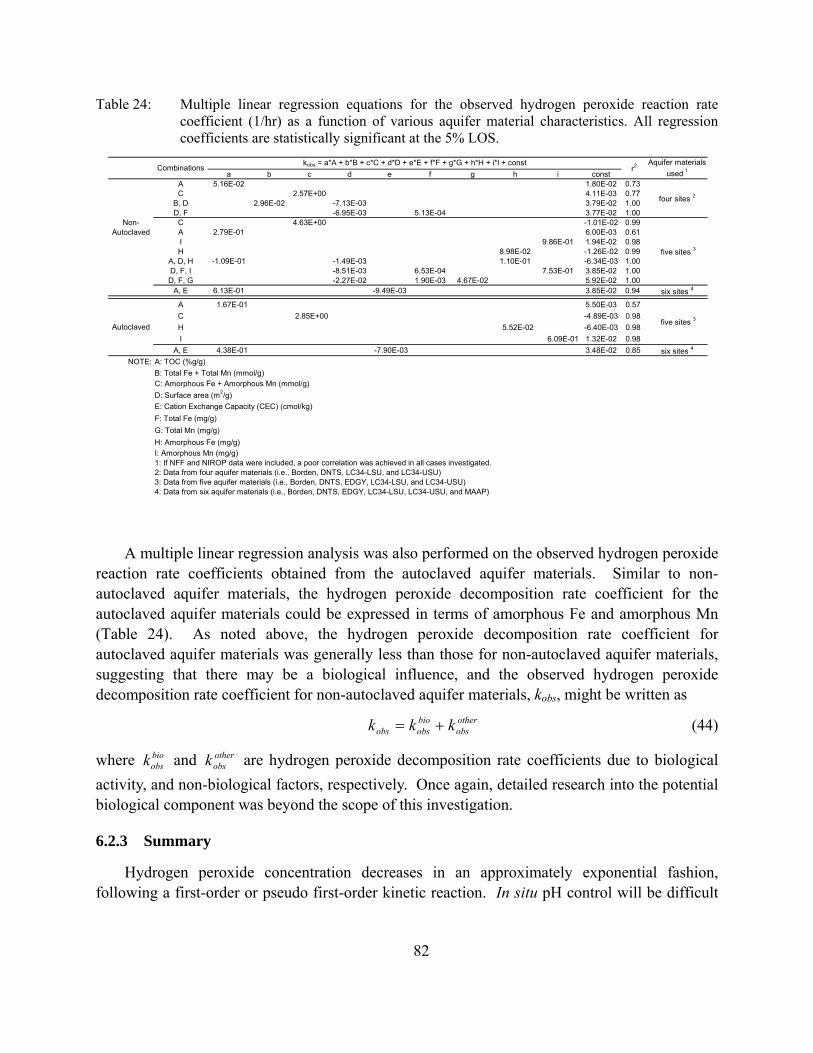
Table 24: Multiple linear regression equations for the observed hydrogen peroxide reaction rate coefficient (1/hr) as a function of various aquifer material characteristics. All regression coefficients are statistically significant at the 5% LOS.
a b c d e f g h i constA 5.16E-02 1.80E-02 0.73C 2.57E+00 4.11E-03 0.77
B, D 2.96E-02 -7.13E-03 3.79E-02 1.00D, F -6.95E-03 5.13E-04 3.77E-02 1.00
Non- C 4.63E+00 -1.01E-02 0.99Autoclaved A 2.79E-01 6.00E-03 0.61
I 9.86E-01 1.94E-02 0.98H 8.98E-02 -1.26E-02 0.99
A, D, H -1.09E-01 -1.49E-03 1.10E-01 -6.34E-03 1.00D, F, I -8.51E-03 6.53E-04 7.53E-01 3.85E-02 1.00D, F, G -2.27E-02 1.90E-03 4.67E-02 5.92E-02 1.00
A, E 6.13E-01 -9.49E-03 3.85E-02 0.94 six sites 4
A 1.67E-01 5.50E-03 0.57C 2.85E+00 -4.89E-03 0.98H 5.52E-02 -6.40E-03 0.98I 6.09E-01 1.32E-02 0.98
A, E 4.38E-01 -7.90E-03 3.48E-02 0.85 six sites 4
NOTE: A: TOC (%g/g)B: Total Fe + Total Mn (mmol/g)C: Amorphous Fe + Amorphous Mn (mmol/g)D: Surface area (m2/g)E: Cation Exchange Capacity (CEC) (cmol/kg)F: Total Fe (mg/g)G: Total Mn (mg/g)H: Amorphous Fe (mg/g)I: Amorphous Mn (mg/g)1: If NFF and NIROP data were included, a poor correlation was achieved in all cases investigated. 2: Data from four aquifer materials (i.e., Borden, DNTS, LC34-LSU, and LC34-USU)3: Data from five aquifer materials (i.e., Borden, DNTS, EDGY, LC34-LSU, and LC34-USU)4: Data from six aquifer materials (i.e., Borden, DNTS, EDGY, LC34-LSU, LC34-USU, and MAAP)
CombinationsAquifer materials
used 1
four sites 2
kobs = a*A + b*B + c*C + d*D + e*E + f*F + g*G + h*H + i*I + constr2
Autoclaved five sites 3
five sites 3
A multiple linear regression analysis was also performed on the observed hydrogen peroxide reaction rate coefficients obtained from the autoclaved aquifer materials. Similar to non-autoclaved aquifer materials, the hydrogen peroxide decomposition rate coefficient for the autoclaved aquifer materials could be expressed in terms of amorphous Fe and amorphous Mn (Table 24). As noted above, the hydrogen peroxide decomposition rate coefficient for autoclaved aquifer materials was generally less than those for non-autoclaved aquifer materials, suggesting that there may be a biological influence, and the observed hydrogen peroxide decomposition rate coefficient for non-autoclaved aquifer materials, kobs, might be written as
otherobs
bioobsobs kkk += (44)
where and are hydrogen peroxide decomposition rate coefficients due to biological activity, and non-biological factors, respectively. Once again, detailed research into the potential biological component was beyond the scope of this investigation.
bioobsk other
obsk
6.2.3 Summary
Hydrogen peroxide concentration decreases in an approximately exponential fashion, following a first-order or pseudo first-order kinetic reaction. In situ pH control will be difficult
82

83
to achieve during the injection of hydrogen peroxide into aquifer materials with a high buffering capacity.
The decomposition of hydrogen peroxide in the presence of aquifer materials is strongly correlated to the content of amorphous Fe and Mn rather than their crystalline forms, and is weakly related to the content of total organic matter. Moreover, natural organic matter may have a negligible influence on hydrogen peroxide decomposition for low TOC aquifer materials or may accelerate the hydrogen peroxide decomposition for high TOC aquifer materials. Finally, biological activity may play a role in the hydrogen peroxide decomposition in the presence of aquifer materials containing high NOM, although investigations with little data could not achieve a conclusive statement about the biological related hydrogen peroxide decomposition.
Multiple linear regression analyses based on the batch experiment results with the aquifer materials from six sites were performed and a variety of expressions for hydrogen peroxide decomposition rate coefficients were generated. These relationships can be used to predict hydrogen peroxide decomposition rate coefficients, given aquifer material properties.
6.3 Enhanced Stability of Hydrogen Peroxide
6.3.1 Introduction
As discussed in Section 6.1, the successful application of hydrogen peroxide-based ISCO is limited by the instability of hydrogen peroxide (Pignatello et al., 2006; Watts and Teel, 2006), and many efforts have been undertaken to enhance the stability of hydrogen peroxide in subsurface environments (Kakarla et al., 1997; 2002; Watts et al., 1999a, b, c). Ethylenediaminetetraacetic (EDTA) is a popular chelating agent used to reduce the decomposition of hydrogen peroxide by suppressing the catalytic activity of naturally-occurring transition metals (Watts and Teel, 2005; Ramo, 2003; Jones and Williams, 2002); however, calcium ions may interfere with its chelating efficiency and EDTA is not easily biodegradable and therefore its accumulation in the natural environment is a concern (Jones and Williams, 2002). An inorganic mixture of ammonium sulfate and monobasic sodium phosphate has been also used to stabilize hydrogen peroxide (Watts et al., 1999c). Of the four inorganic compound stabilizers (i.e., monobasic potassium phosphate, dibasic potassium phosphate, sodium tripolyphosphate, and silicic acid) for hydrogen peroxide, monobasic phosphate was found to propagate hydrogen peroxide the longest distance in soil columns (Kakarla et al., 1997); however, it was depleted by adsorption, and may also function as a radical scavenger (Watts et al., 1999c). A comprehensive evaluation of 50 chelating reagents indicated that nitrilotriacetic (NTA) and hydroxyethliminodiacetic (HEIDA) were the most effective chelating reagents for iron (Sun and Pignatello, 1992), and EDTA had a comparable chelating efficiency to NTA (Tandy et al., 2006a). Although the application of chelating reagents has been intensively studied, the long-term potential impact of these chelating reagents on the environment has not been evaluated (Watts and Teel, 2005) and in recent years concern for potential environmental

impacts have resulted in a search for “green” hydrogen peroxide stabilizers (Ramo, 2003; Jones and Williams, 2002).
HOOC – CH2
HOOC – CH2 CH2 – COOH
CH2 – COOH
N – CH2 – CH2 – N
HOOC – CH2
HOOC – CH2 CH2 – COOH
CH2 – COOH
N – CH2 – CH2 – N
HOOC – CH2
HOOC – CH – NH – CH2 – CH2 – NH – CH – COOH
CH2 – COOHHOOC – CH2
HOOC – CH – NH – CH2 – CH2 – NH – CH – COOH
CH2 – COOH
EDTA (MW = 292 g/mol)
EDDS (MW = 292 g/mol)
pK1 2.4 2.1pK2 3.9 3.0pK3 6.8 6.4pK4 9.8 10.4
EDDS EDTA
pK1 2.4 2.1pK2 3.9 3.0pK3 6.8 6.4pK4 9.8 10.4
EDDS EDTA
Figure 35: Molecular structure and acidity constants for ethylenediaminetetraacetic acid (EDTA) and ethylenediaminedisuccinic acid (EDDS) (25oC) (adapted from Vandevivere et al., 2001)
While currently used or proposed cheating reagents are either poorly biodegradable (eg., EDTA), associated with health issues (e.g., cancer-causing agent, NTA), or are not very effective (e.g., citrate) (Vandeviviwre et al., 2001), a newly available and environment-friendly chelating agent, S,S’-ethylenediaminedisuccinate (EDDS) is readily-biodegradable, does not lose its chelating efficiency for transition metals in the presence of calcium ions (Jones and Williams, 2002), and has been proposed as an alternative chelating agent to EDTA in other industrial applications (Grcman, et al., 2003; Jones and Williams, 2001; 2002; Ramo, 2003). For example, in ex-situ washing of soils contaminated with heavy metals, EDDS showed the best extraction efficiency compared to other chelating agents such as nitrilotriacetic acid (NTA) and EDTA (Tandy et al., 2004; 2006a). EDDS has also been found to be more effective when used during phytoextraction of heavy metals in soils than EDTA (Tandy et al., 2006b; Grcman et al., 2003; Kos and Lestan, 2003), while NTA and citric acid showed insignificant chelating efficiency on the uptake of transition heavy metals (Meers et al., 2005). Recent studies have shown that EDDS effectively prevents the contact of transition metals with hydrogen peroxide, and can be used as an excellent stabilizer for hydrogen peroxide over a wide pH range in the pulp and paper industry
84
85
(Jones and Williams, 2002; Ramo, 2003). According to our knowledge EDDS has never been used in ISCO applications with hydrogen peroxide. Therefore, the experiments we performed in this study were designed to explore the applicability of EDDS as a chelating agent for hydrogen peroxide stabilization during ISCO. To compare the stabilizing effects of EDDS on hydrogen peroxide decomposition we used EDTA, one of the most commonly used chelating agents (Watts and Teel, 2005).
Figure 35 shows the molecular structure and acidity constants for EDTA and EDDS, and indicates that EDDS is a close isomer to EDTA. Commercial EDDS has been available from Octel Performance Chemicals Company, Cheshire, UK (http://www.octel-pc.com) in recent years.
6.3.2 Methods
As discussed in Section 6.2.2, hydrogen peroxide decomposition rate coefficients in the presence of the various aquifer materials used in this study span the range from 0.018 to 1.16 hr-
1. Based on these data, five representative aquifer materials (DNTS, EGDY, LC34-USU, MAAP, and NIROP) were chosen to investigate the enhanced stability of hydrogen peroxide. Prior to use, aquifer materials were air-dried to a constant weight, and only materials passing the US No. 10 standard sieve (<2 mm) were used.
Solutions used in these experiments were prepared with the use of 30% hydrogen peroxide (VWR, Toronto, Canada), ferrous sulfate heptahydrate (J.T. Baker, Phillipsburg, NJ), EDTA (BDH, Toronto, Canada), and EDDS (Fluka Chemika, Sigma-Aldrick, Steinheim, UK). In addition, 1 N sodium hydroxide solution and 1 N sulfuric acid solution were used for initial pH adjustment as required.
This study investigated the stability of hydrogen peroxide in four different experimental solution matrices (Table 25):
1. a solution with an initial pH of 3.0 and a hydrogen peroxide concentration of 2.0%
(Experimental Series 1, which has been addressed in Section 5.3.2);
2. a solution with an initial pH of 3.0, hydrogen peroxide concentration of 2.0%, and either
EDTA or EDDS added in a ratio of 0.5 mmol or 1.0 mmol per kg of aquifer material,
respectively (Experimental Series 2, 3, and 4);
3. a solution with an initial pH of 3.0, hydrogen peroxide concentration of 2.0% mixed with
ferrous iron in a weight ratio of Fe2+/H2O2 of 0.005 or 0.02 (Experimental Series 5 and
6); and
4. a solution with an initial pH of 3.0, hydrogen peroxide concentration of 2.0%, ferrous
iron in a weight ratio of Fe2+/H2O2 of 0.005, and EDDS in a ratio of 0.5 mmol EDDS per

kg of aquifer material (Experimental Series 7).
Each experiment was performed in triplicate and consisted of adding 15 g of aquifer material and 80 mL of the appropriate solution into a 110 mL amber reactor fitted with a Teflon cap. The experimental procedure for Series 2 to 4 is the same as that used for the Series 1 experiments which were described in Section 5.3.2.1 for the non-autoclaved aquifer materials.
Table 25: First-order reaction rate coefficients (1/hour) for hydrogen peroxide decomposition in batch experiments.
Fe2+/H2O2
Ratio [w/w] Avg 95% CI Avg 95% CI Avg 95% CI Avg 95% CI Avg 95% CI1 2% - - 0.0188 ± 0.008 0.0955 ± 0.014 0.0260 ± 0.0043 0.0856 ± 0.0135 1.16 ± 0.12
2 2% 1.0 mmol/kgEDTA - 0.00437 ± 0.0011 0.0268 ± 0.005 0.0192 ± 0.0014 0.00328 ± 0.0004 0.161 ± 0.037
3 2% 1.0 mmol/kgEDDS - 0.00331 ± 0.0007 0.0260 ± 0.002 0.0238 ± 0.0009 0.00462 ± 0.0008 0.177 ± 0.034
4 2% 0.5 mmol/kgEDDS - 0.00288 ± 0.0003 0.0235 ± 0.002 0.0197 ± 0.0003 0.00279 ± 0.0008 0.213 ± 0.04
5 2% - 0.005 0.0547 ± 0.01 0.0736 ± 0.01 0.0876 ± 0.01 0.164 ± 0.012 0.708 ± 0.046 2% - 0.02 0.919 ± 0.177 1.06 ± 0.119 0.306 ± 0.031 1.10 ± 0.125 0.461 ± 0.028
7 2% 0.5 mmol/kgEDDS 0.02 0.420 ± 0.048 0.345 ± 0.031 0.230 ± 0.021 0.450 ± 0.04 0.364 ± 0.042
Series H2O2 ChelateNIROPDNTS EDGY LC34-USU MAAP
6.3.3 Results and Discussions
The hydrogen peroxide concentration profiles corresponding to the four different solution matrices for each aquifer material are shown in Figure 36. These profiles all show some level of hydrogen peroxide decomposition which can be captured by a pseudo first-order kinetic model. The best-fit first-order reaction rate coefficients are listed in Table 25 and visually displayed in Figure 37. Similar to the observations for Experimental Series 1 as discussed in Section 6.2.2, in less than an hour after the start of each experiment, the solution pH in Experimental Series 2 to 4 increased due to the strong aquifer material buffering capacity from the initial pH of 3.0 to a stable value, which was less than but close to the corresponding soil pH for each aquifer material (e.g., 4.2 for DNTS, 5.4 for EGDY, 7.5 for LC34-USU, 3.5 for MAAP, and 8.5 for NIROP), again suggesting that in situ pH control will be difficult to achieve during the injection of hydrogen peroxide into aquifer materials with a high buffering capacity.
Based on the data in Table 25, there is no statistically significant difference (α = 5%, t-test) between the observed hydrogen peroxide first-order rate constants for the two chelating agents (EDTA and EDDS) used in this investigation (Experimental Series 2 and 3). This suggests that EDDS has a comparable chelating efficiency to EDTA in the presence of various aquifer materials. Figure 38 shows that the addition of EDTA resulted in an increase of the dissolved phase concentrations of transition metals (Fe and Mn) in each experimental system which is similar to the results we obtained for EDDS (not shown). This increase in metal concentration is because chelating reagents complex with metal ions in the solid phase and extract them from aquifer materials (Stumm and Morgan, 1995). Compared to uncomplexed forms of these metals,
86

87
the catalytic activity of these complexed metals with respect to hydrogen peroxide reactivity is suppressed in the aqueous phase (Jones and Williams, 2002; Ramo, 2003).
As other studies have illustrated, the presence of chelating agents in the aqueous phase can reduce the availability of transitional metals to react with hydrogen peroxide (Jones and Williams, 2002; Ramo, 2003), and therefore increase the stability of hydrogen peroxide in situations where naturally-occurring transitional metals are involved. In this investigation with the presence of various aquifer materials, the addition of chelating reagents resulted in a significant drop in the hydrogen peroxide decomposition rate coefficient (Experimental Series 2, 3, and 4). For example, in the case of the addition of 0.5 mmol/kg EDDS, the hydrogen peroxide decomposition rate coefficient was reduced by about 97% for MAAP, 82% for DNTS, 73% for EGDY, 24% for LC34-USU, and 82% for NIROP aquifer materials. Although the addition of a higher dosing of the chelating reagent (1.0 compared to 0.5 mmol/kg EDDS) generally produced a slightly lower hydrogen peroxide decomposition rate coefficient, the difference between these rate coefficients was not statistically significant (α = 5%, t-test). Both the DNTS and NIROP aquifer materials have a relatively low TOC content (0.28 mg/g and 0.30 mg/g respectively), and therefore the main factors influencing hydrogen peroxide decomposition in the presence of these aquifer materials is their amount of dissolvable Fe and Mn; hence the use of chelates for these aquifer materials is beneficial. The EGDY aquifer material has a relatively high TOC content (2.28 mg/g) and amorphous Fe and Mn content which leads to a high dissolved Fe and Mn concentration (see Figure 38) which can be affected by the chelating agents and therefore improvements in hydrogen peroxide stability are realized. Although the MAAP aquifer material contains an relatively average TOC content (0.77 mg/g) and a relatively low content of total Fe and Mn as well as amorphous Fe and Mn, it has a high dissolvable Fe and Mn content as confirmed by high concentrations of dissolved Fe and Mn present in the solution (see Figure 38). The LC34-USU aquifer material also has a relatively average TOC content (0.87 mg/g), but the dissolved Fe and Mn concentrations are quite low (see Figure 38), so the influence of chelating reagents to stabilize hydrogen peroxide is relatively insignificant compared to the other aquifer materials used in this study.
The addition of ferrous iron generally resulted in a significant increase in the hydrogen peroxide decomposition rate coefficient which increased with the amount of ferrous iron added (Experimental Series 5 and 6). For example, in comparison to the case with no addition of iron or chelating reagent, the addition of iron at the weight ratio of 0.005 (Fe2+/H2O2) increased the hydrogen peroxide decomposition rate coefficient by approximately 100% for the MAAP aquifer material, and by 200% for the DNTS and LC34-USU aquifer materials. Surprisingly, the addition of ferrous iron did not increase the hydrogen peroxide decomposition rate coefficient for the NIROP aquifer materials. In fact as the amount of iron was increased, the hydrogen peroxide decomposition rate coefficient decreased. This may be due to experimental error and variability or may be related to the high soil pH, the high CEC and bulk surface area, and the high carbonate content associated the NIROP aquifer materials, resulting in an unknown mechanism.
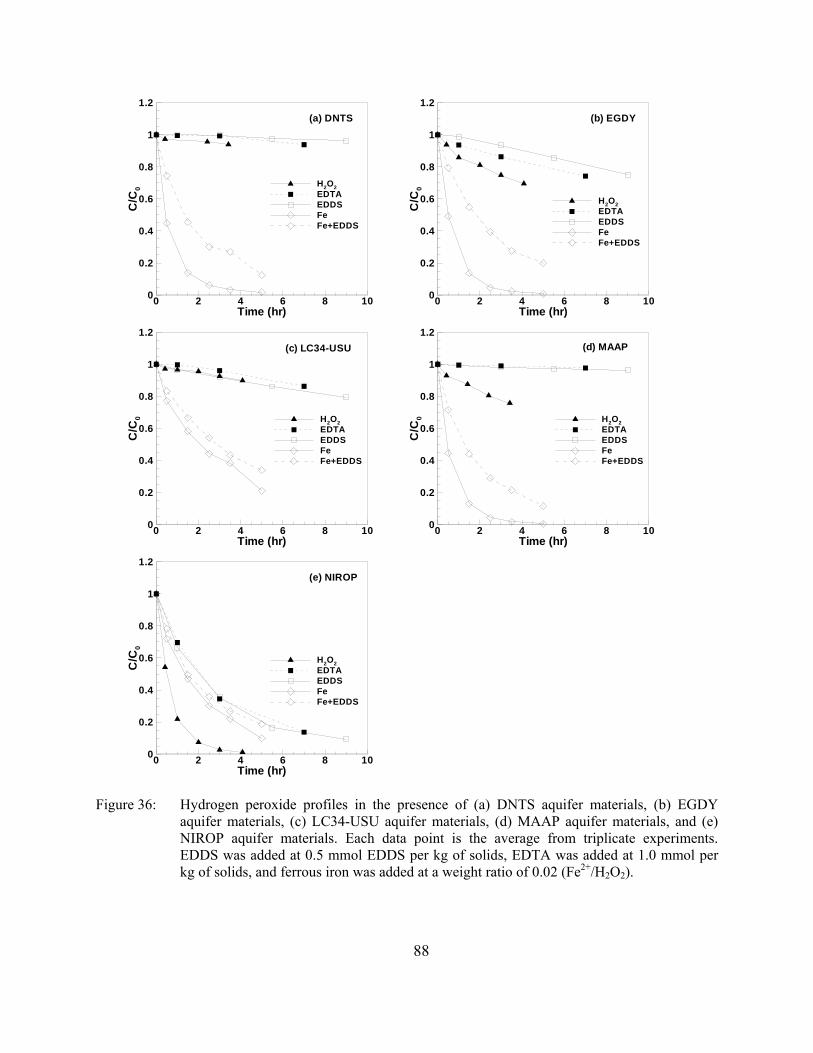
88
Time (hr)
C/C
0
0 2 4 6 8 100
0.2
0.4
0.6
0.8
1
1.2
H2O2EDTAEDDSFeFe+EDDS
(e) NIROP
Time (hr)
C/C
0
0 2 4 6 8 100
0.2
0.4
0.6
0.8
1
1.2
H2O2EDTAEDDSFeFe+EDDS
(c) LC34-USU
Time (hr)
C/C
0
0 2 4 6 8 100
0.2
0.4
0.6
0.8
1
1.2
H2O2EDTAEDDSFeFe+EDDS
(a) DNTS1.
Time (hr)
C/C
0
0 2 4 6 8 100
0.2
0.4
0.6
0.8
1
1.2
H2O2EDTAEDDSFeFe+EDDS
(d) MAAP
Time (hr)
C/C
0
0 2 4 6 8 100
0.2
0.4
0.6
0.8
1
2
H2O2EDTAEDDSFeFe+EDDS
(b) EGDY
Figure 36: Hydrogen peroxide profiles in the presence of (a) DNTS aquifer materials, (b) EGDY aquifer materials, (c) LC34-USU aquifer materials, (d) MAAP aquifer materials, and (e) NIROP aquifer materials. Each data point is the average from triplicate experiments. EDDS was added at 0.5 mmol EDDS per kg of solids, EDTA was added at 1.0 mmol per kg of solids, and ferrous iron was added at a weight ratio of 0.02 (Fe2+/H2O2).

0
0.2
0.4
0.6
0.8
1
1.2
1.4
DNTS EGDY LC34-USU MAAP NIROP
Rat
e (1
/hr)
H2O2EDDSFeEDDS+Fe
H2O2
Figure 37: Observed reaction rate coefficients in the presence of aquifer materials for Experimental Series 1, 4, 6 and 7. EDDS was added at 0.5 mmol EDDS per kg of solids, and ferrous iron was added at a weight ratio of 0.02 (Fe2+/H2O2).
0.00
0.02
0.04
0.06
0.08
DNTS EGDY LC34-USU MAAP NIROP
mm
ol/L
FeFe (EDTA)MnMn (EDTA)
Figure 38: Total Fe and Mn dissolved concentrations from Experimental Series 1 and 2. EDTA was added at 1.0 mmol EDTA per kg of solids. Samples were taken within the first hour.
When both the chelating reagent and ferrous iron were added (e.g., ferrous iron was added according at a weight ratio of 0.02 (Fe2+/H2O2), and EDDS was added according to the ratio of 0.5 mmol EDDS per kg of solids), the hydrogen peroxide decomposition rate was higher than when only the EDDS was added, and lower then when only the ferrous iron was added. This observation further supports the above findings that ferrous iron accelerates hydrogen peroxide decomposition, and that chelating reagents (i.e., EDDS) can stabilize hydrogen peroxide in the
89

90
presence of various aquifer materials by suppressing the catalytic activity of metals (e.g., iron and manganese).
6.3.4 Summary
This investigation of the enhanced stability of hydrogen peroxide demonstrated that the addition of ferrous iron generated the largest hydrogen peroxide decomposition rate coefficients, while the presence of a chelating agent (EDDS or EDTA) generated the lowest hydrogen peroxide decomposition rate coefficients. Even for the high pH and carbonate rich NIROP aquifer material, the hydrogen peroxide decomposition rate was still decreased by an order of magnitude (from 1.2 to 0.2 / hour) with chelate addition.
Fenton’s Reagent (a mixture of hydrogen peroxide, ferrous iron, and sulfuric acid) is used widely in water and wastewater treatment, and has gained popularity as an oxidant for ISCO applications (Chen et al., 2001; Pignatello et al., 2006). However, Watts and Teel (2005) determined that the optimal treatment environment in the presence of most natural aquifer materials was not to add ferrous iron. The experimental results from this investigation show that the stability of hydrogen peroxide is greatly degraded when ferrous iron was added to the system, and therefore we also recommend that if the site geochemistry is favorable that additional ferrous iron not be used.
It is recommended that EDDS be considered as an alternative chelating agent for stabilizing hydrogen peroxide in ISCO application since: (1) EDDS has been proven to be easily biodegraded (Jones and Williams, 2002); and (2) our results show that EDDS is comparable to EDTA in terms of chelating efficiency for transition metals (Fe and Mn) in the presence of various aquifer materials. The application of EDDS is especially effective in reducing the hydrogen peroxide decomposition rate for those materials with low TOC and/or high amorphous iron and manganese contents.
6.4 Column Experiments
6.4.1 Introduction
As indicated in Sections 6.2.2 and 6.3.4, hydrogen peroxide in the presence of aquifer materials decomposes at a rate that is well-represented by a pseudo-first order mass action law, and the addition of EDDS improves the stability of hydrogen peroxide by reducing the decomposition rate. Relative to batch reactor systems, results from aquifer material packed columns are considered more representative of in situ conditions since they provide more realistic aquifer material contact, and therefore column experiments were designed to complement and expand the findings from the batch experiments.
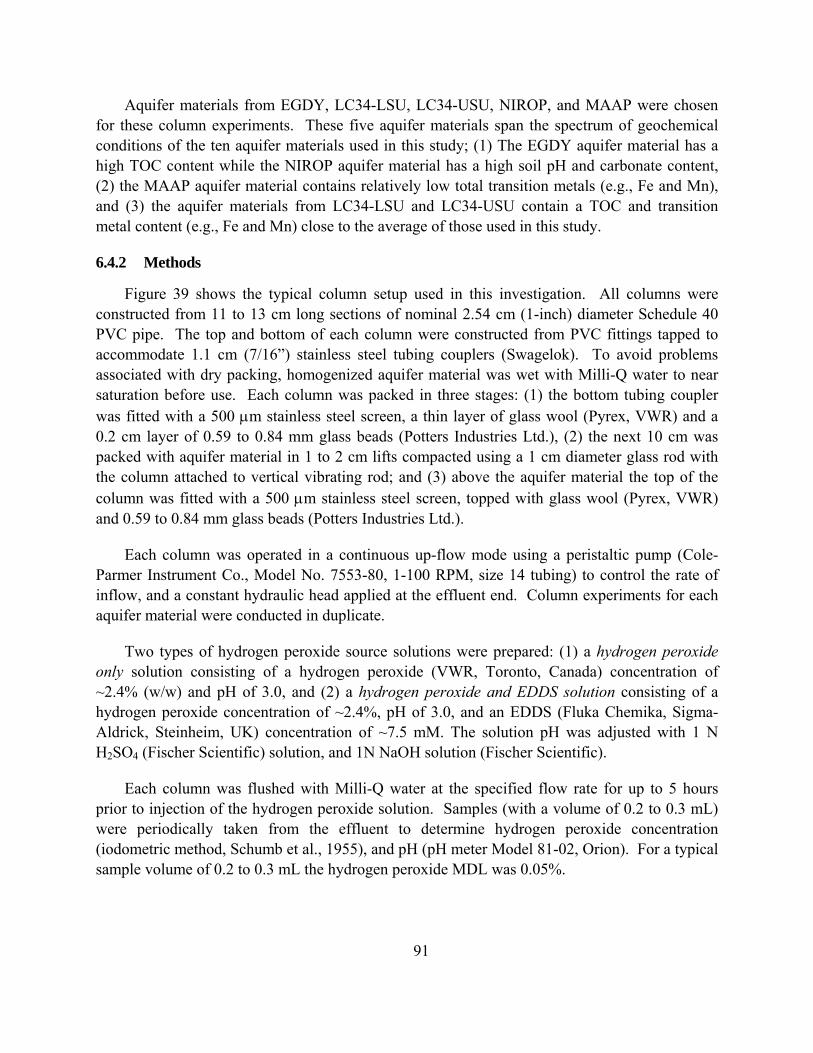
91
Aquifer materials from EGDY, LC34-LSU, LC34-USU, NIROP, and MAAP were chosen for these column experiments. These five aquifer materials span the spectrum of geochemical conditions of the ten aquifer materials used in this study; (1) The EGDY aquifer material has a high TOC content while the NIROP aquifer material has a high soil pH and carbonate content, (2) the MAAP aquifer material contains relatively low total transition metals (e.g., Fe and Mn), and (3) the aquifer materials from LC34-LSU and LC34-USU contain a TOC and transition metal content (e.g., Fe and Mn) close to the average of those used in this study.
6.4.2 Methods
Figure 39 shows the typical column setup used in this investigation. All columns were constructed from 11 to 13 cm long sections of nominal 2.54 cm (1-inch) diameter Schedule 40 PVC pipe. The top and bottom of each column were constructed from PVC fittings tapped to accommodate 1.1 cm (7/16”) stainless steel tubing couplers (Swagelok). To avoid problems associated with dry packing, homogenized aquifer material was wet with Milli-Q water to near saturation before use. Each column was packed in three stages: (1) the bottom tubing coupler was fitted with a 500 μm stainless steel screen, a thin layer of glass wool (Pyrex, VWR) and a 0.2 cm layer of 0.59 to 0.84 mm glass beads (Potters Industries Ltd.), (2) the next 10 cm was packed with aquifer material in 1 to 2 cm lifts compacted using a 1 cm diameter glass rod with the column attached to vertical vibrating rod; and (3) above the aquifer material the top of the column was fitted with a 500 μm stainless steel screen, topped with glass wool (Pyrex, VWR) and 0.59 to 0.84 mm glass beads (Potters Industries Ltd.).
Each column was operated in a continuous up-flow mode using a peristaltic pump (Cole-Parmer Instrument Co., Model No. 7553-80, 1-100 RPM, size 14 tubing) to control the rate of inflow, and a constant hydraulic head applied at the effluent end. Column experiments for each aquifer material were conducted in duplicate.
Two types of hydrogen peroxide source solutions were prepared: (1) a hydrogen peroxide only solution consisting of a hydrogen peroxide (VWR, Toronto, Canada) concentration of ~2.4% (w/w) and pH of 3.0, and (2) a hydrogen peroxide and EDDS solution consisting of a hydrogen peroxide concentration of ~2.4%, pH of 3.0, and an EDDS (Fluka Chemika, Sigma-Aldrick, Steinheim, UK) concentration of ~7.5 mM. The solution pH was adjusted with 1 N H2SO4 (Fischer Scientific) solution, and 1N NaOH solution (Fischer Scientific).
Each column was flushed with Milli-Q water at the specified flow rate for up to 5 hours prior to injection of the hydrogen peroxide solution. Samples (with a volume of 0.2 to 0.3 mL) were periodically taken from the effluent to determine hydrogen peroxide concentration (iodometric method, Schumb et al., 1955), and pH (pH meter Model 81-02, Orion). For a typical sample volume of 0.2 to 0.3 mL the hydrogen peroxide MDL was 0.05%.
Figure 39: Typical setup for hydrogen peroxide column experiments.
For the LC34-LSU, LC34-USU, and MAAP aquifer materials two flow rates were used (high and low) to allow for different resident times to be investigated (Table 26). For each flow rate, the column was flushed with the source solution until a stable or near stable hydrogen peroxide concentration in the effluent was observed, then flushed with Milli-Q water until no hydrogen peroxide was detected in the effluent, and then flushed again with the same source solution until a stable hydrogen peroxide concentration in the effluent was observed. The purpose of the second flush was to investigate the breakthrough behavior of hydrogen peroxide in a system that was previously exposed to hydrogen peroxide.
Table 26: Summary of flow rates (mL/min) used for the hydrogen peroxide column trials.
92
Solution EGDY LC34-LSU LC34-USU MAAP NIROPH2O2 high 0.57 0.65 0.43H2O2 low 0.26 0.23 0.22
H2O2 + EDDS high 0.57 0.65H2O2 + EDDS low 0.26 0.23
0.41
0.41
0.33
0.330.22
Tracer tests using a sodium bromide solution at a constant concentration of 50 to 100 mg/L (Fischer Scientific) were conducted to compare the breakthrough behavior between a
93
conservative tracer and the hydrogen peroxide solution as well as to evaluate hydrodynamic properties (porosity and dispersivity) of each aquifer material packed column. Bromide concentrations were determined by ion chromatography (IC) (Dionex AS4A-SC 4mm x 250 mm column; 1.8 mM sodium carbonate, 1.7 mM sodium bicarbonate eluate; 1.5 mL/min flow rate) with a MDL of 1.2 mg/L.
As demonstrated in the batch experiments (Sections 6.2.2 and 6.3.4), dissolved Fe and Mn played a significant role in the decomposition of hydrogen peroxide, especially for the MAAP aquifer material. Therefore, an additional column experiment with the MAAP aquifer material was performed to investigate the influence of dissolved metals (e.g., Fe and Mn) on hydrogen peroxide decomposition in the column system. A low flow rate (0.22 mL/min) was used for this experiment, and the columns were flushed with a sulfuric acid solution (pH = 3.0) for about 2 hours to decrease the dissolved metal (Fe and Mn) concentration produced in this column system, and then flushed with the hydrogen peroxide only solution. When the effluent hydrogen peroxide concentration reached a nearly stable value, a solution sample (~ 5 mL) from each column effluent was taken, filtered (0.45 µm filter (Nalgene)), and used to quantify Fe and Mn concentrations with an ICP emission spectroscopy with a Spectro Flame instrument (Spectro Analytical, Fitchburg, MA), which had a MDL of 0.01 mg/L for Mn and 0.1 mg/L for Fe. For comparison, samples were also taken from the effluent of the MAAP column experiments flushed with the hydrogen peroxide only solution and the hydrogen peroxide and EDDS solution, and the dissolved Fe and Mn concentrations were determined.
6.4.3 Results and Discussion
6.4.3.1 General Observations
Temporal concentration profiles of hydrogen peroxide and bromide (Br) obtained from the duplicate columns at identical sampling times were averaged for the MAAP, LC34-LSU, and LC34-USU aquifer materials and are shown in Figure 40. No hydrogen peroxide was detected in the effluent from the columns packed with EGDY and NIROP aquifer materials after flushing for ~10 hours (~14 and 10 pore volumes for the columns containing EGDY and NIROP aquifer material, respectively) with the hydrogen peroxide only solution. The high hydrogen peroxide decomposition rate in the presence of EGDY and NIROP aquifer materials is the result of the high TOC (~3 mg/g) and transition metal (e.g., Fe and Mn) content in the EGDY aquifer material, and high surface area, high CEC, and the strong buffering capability (pH 8.5 to 9.0) of the NIROP aquifer material where the carbonates act as a scavenger (sink) for hydroxyl radicals (Seol et al., 2003; Watts and Teel, 2005). When the hydrogen peroxide and EDDS solution was used, hydrogen peroxide breakthrough in the columns packed with NIROP and EGDY aquifer material was observed with stable effluent concentrations of 0.01% and 0.1% respectively. This is consistent with the batch test results which indicated that the addition of EDDS improves the stability of hydrogen peroxide in the presence of these aquifer materials.

Table 27: First appearance (in pore volumes) of the bromide tracer and hydrogen peroxide in the column effluent as defined by a detectable concentration in the effluent (0.05% for hydrogen peroxide, and 1.2 mg/L for Br).
1st flush 2nd flush 1st flush 2nd flushLC34-LSU 0.26 0.64 0.80 0.69 0.72 0.69LC34-LSU 0.57 0.67 0.77 0.70 0.74 0.67LC34-USU 0.23 NA 0.82 0.63 0.69 0.63LC35-USU 0.65 0.64 0.71 0.71 0.71 0.64
MAAP 0.22 0.61 2.65 0.95 0.95 0.75MAAP 0.43 0.74 1.72 0.93 - -
H2O2 + EDDSSite
0.32
0.36
H2O2 only
0.32
Flow Rate (mL/min)
Porosity Tracer
The first appearance of hydrogen peroxide and the Br tracer as defined by a detectable concentration in the effluent (0.05% for hydrogen peroxide, and 1.2 mg/L for Br) are listed in Table 27 for the LC34-LSU, LC34-USU, and MAAP aquifer materials. Since the time required to collect a typical sample volume was 1 minute for the fast flow rate and 3 minutes for the slow flow rate, the first appearance is accurate within 0.014 to 0.12 PVs for the fast and slow flow rates, respectively. The delay in the first appearance of the first-flush hydrogen peroxide only solution relative to Br varies from 0.07 to 0.98 PVs at the high flow rate, and from 0.10 to 2.04 PVs at the low flow rate. This delay is markedly less for the second-flush of the hydrogen peroxide only solution where a delay from zero to 0.19 PVs was observed at the high flow rate, and a delay from 0.05 to 0.34 PVs was observed at the low flow rate. In both flushing episodes the delay in the first appearance of hydrogen peroxide was accentuated at the lower flow rates due to the longer contact time with aquifer materials. The cause of this delay is related to the presence of labile species associated with the aquifer material which contribute to an increased consumption of hydrogen peroxide during the first flush relative to the second flush. These labile species may include reactive organic matter which contributes to the consumption of hydrogen peroxide through redox reactions during the first-flush episode, and transition metals (e.g., Fe and Mn) which promote hydrogen peroxide decomposition (Watts and Teel, 2005). Some of the transition metals are in the dissolved form and are removed from the column system during the first flush (Table 28). Evidence of the removal of dissolved metals (Fe and Mn) from the column system is presented later in this section when the results from the additional MAAP column experiment are discussed.
When the hydrogen peroxide and EDDS solution was used, the delay in the first appearance of hydrogen peroxide varied from 0.07 to 0.34 PVs for the first flush, and from zero to 0.15 PVs for the second flush. In all cases the presence of EDDS resulted in a delay less than or equal to the delay observed during the first flush with the hydrogen peroxide only solution. For example, under the low flow rate the first appearance of hydrogen peroxide in the presence of EDDS for the LC34-LSU and MAAP aquifer materials was about 0.08 and 1.7 PVs ahead of the first appearance of hydrogen peroxide with the hydrogen peroxide only solution. It is interesting to note that delay in the first appearance of hydrogen peroxide for the first flush with the hydrogen
94
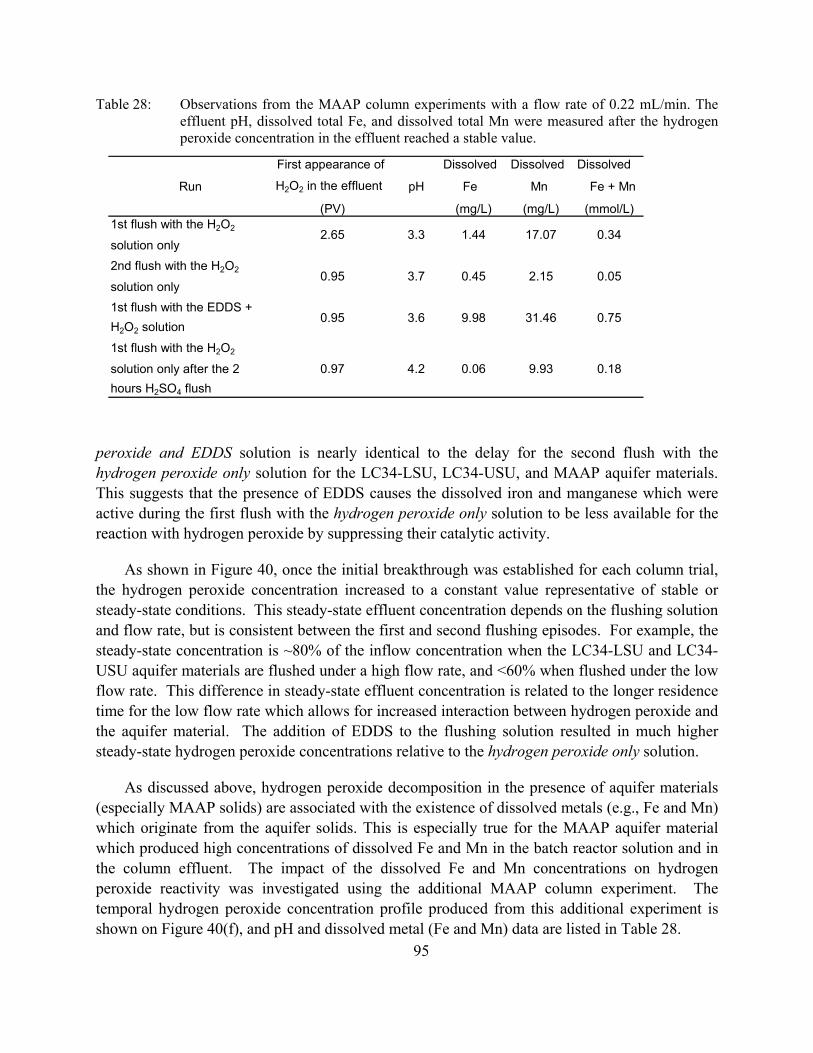
Table 28: Observations from the MAAP column experiments with a flow rate of 0.22 mL/min. The effluent pH, dissolved total Fe, and dissolved total Mn were measured after the hydrogen peroxide concentration in the effluent reached a stable value.
Run
First appearance of
H2O2 in the effluent
(PV)
pH
Dissolved
Fe
(mg/L)
Dissolved
Mn
(mg/L)
Dissolved
Fe + Mn
(mmol/L)1st flush with the H2O2
solution only2.65 3.3 1.44 17.07 0.34
2nd flush with the H2O2
solution only0.95 3.7 0.45 2.15 0.05
1st flush with the EDDS + H2O2 solution
0.95 3.6 9.98 31.46 0.75
1st flush with the H2O2
solution only after the 2 hours H2SO4 flush
0.97 4.2 0.06 9.93 0.18
peroxide and EDDS solution is nearly identical to the delay for the second flush with the hydrogen peroxide only solution for the LC34-LSU, LC34-USU, and MAAP aquifer materials. This suggests that the presence of EDDS causes the dissolved iron and manganese which were active during the first flush with the hydrogen peroxide only solution to be less available for the reaction with hydrogen peroxide by suppressing their catalytic activity.
As shown in Figure 40, once the initial breakthrough was established for each column trial, the hydrogen peroxide concentration increased to a constant value representative of stable or steady-state conditions. This steady-state effluent concentration depends on the flushing solution and flow rate, but is consistent between the first and second flushing episodes. For example, the steady-state concentration is ~80% of the inflow concentration when the LC34-LSU and LC34-USU aquifer materials are flushed under a high flow rate, and <60% when flushed under the low flow rate. This difference in steady-state effluent concentration is related to the longer residence time for the low flow rate which allows for increased interaction between hydrogen peroxide and the aquifer material. The addition of EDDS to the flushing solution resulted in much higher steady-state hydrogen peroxide concentrations relative to the hydrogen peroxide only solution.
As discussed above, hydrogen peroxide decomposition in the presence of aquifer materials (especially MAAP solids) are associated with the existence of dissolved metals (e.g., Fe and Mn) which originate from the aquifer solids. This is especially true for the MAAP aquifer material which produced high concentrations of dissolved Fe and Mn in the batch reactor solution and in the column effluent. The impact of the dissolved Fe and Mn concentrations on hydrogen peroxide reactivity was investigated using the additional MAAP column experiment. The temporal hydrogen peroxide concentration profile produced from this additional experiment is shown on Figure 40(f), and pH and dissolved metal (Fe and Mn) data are listed in Table 28.
95
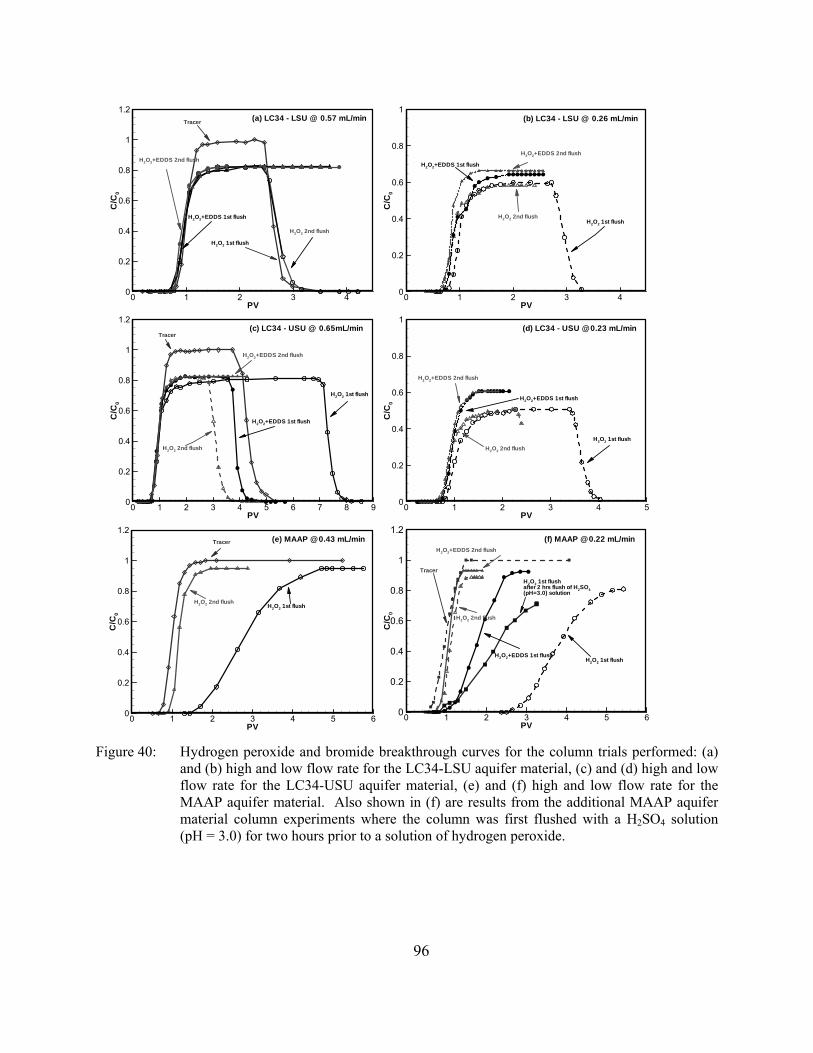
96
PV
C/C
0
0 1 2 3 40
0.2
0.4
0.6
0.8
1
1.(a) LC34 - LSU @ 0.57 mL/min
H2O2+EDDS 2nd flush
Tracer
H2O2 1st flush
H2O2+EDDS 1st flush
H2O2 2nd flush
2
PV
C/C
0
0 1 2 3 40
0.2
0.4
0.6
0.8
1(b) LC34 - LSU @ 0.26 mL/min
H2O2+EDDS 2nd flush
H2O2 1st flush
H2O2+EDDS 1st flush
H2O2 2nd flush
PV
C/C
0
0 1 2 3 4 5 6 7 8 90
0.2
0.4
0.6
0.8
1
1.(c) LC34 - USU @ 0.65mL/min
H2O2+EDDS 1st flush
H2O2 1st flush
Tracer
H2O2 2nd flush
H2O2+EDDS 2nd flush
2
PV
C/C
0
0 1 2 3 4 50
0.2
0.4
0.6
0.8
1(d) LC34 - USU @0.23 mL/min
H2O2+EDDS 2nd flush
H2O2 2nd flush
H2O2+EDDS 1st flush
H2O2 1st flush
PV
C/C
0
0 1 2 3 4 5 60
0.2
0.4
0.6
0.8
1
1.(e) MAAP @0.43 mL/min
H2O2 1st flush
Tracer
H2O2 2nd flush
2
PV
C/C
0
0 1 2 3 4 5 60
0.2
0.4
0.6
0.8
1
1.2(f) MAAP @0.22 mL/min
H2O2+EDDS 1st flush
H2O2 1st flushafter 2 hrs flush of H2SO4(pH=3.0) solution
Tracer
H2O2+EDDS 2nd flush
H2O2 2nd flush
H2O2 1st flush
PV
C/C
0
0 1 2 3 40
0.2
0.4
0.6
0.8
1
1.(a) LC34 - LSU @ 0.57 mL/min
H2O2+EDDS 2nd flush
Tracer
H2O2 1st flush
H2O2+EDDS 1st flush
H2O2 2nd flush
2
PV
C/C
0
0 1 2 3 40
0.2
0.4
0.6
0.8
1(b) LC34 - LSU @ 0.26 mL/min
H2O2+EDDS 2nd flush
H2O2 1st flush
H2O2+EDDS 1st flush
H2O2 2nd flush
PV
C/C
0
0 1 2 3 4 5 6 7 8 90
0.2
0.4
0.6
0.8
1
1.(c) LC34 - USU @ 0.65mL/min
H2O2+EDDS 1st flush
H2O2 1st flush
Tracer
H2O2 2nd flush
H2O2+EDDS 2nd flush
2
PV
C/C
0
0 1 2 3 4 50
0.2
0.4
0.6
0.8
1(d) LC34 - USU @0.23 mL/min
H2O2+EDDS 2nd flush
H2O2 2nd flush
H2O2+EDDS 1st flush
H2O2 1st flush
PV
C/C
0
0 1 2 3 4 5 60
0.2
0.4
0.6
0.8
1
1.(e) MAAP @0.43 mL/min
H2O2 1st flush
Tracer
H2O2 2nd flush
2
PV
C/C
0
0 1 2 3 4 5 60
0.2
0.4
0.6
0.8
1
1.2(f) MAAP @0.22 mL/min
H2O2+EDDS 1st flush
H2O2 1st flushafter 2 hrs flush of H2SO4(pH=3.0) solution
Tracer
H2O2+EDDS 2nd flush
H2O2 2nd flush
H2O2 1st flush
Figure 40: Hydrogen peroxide and bromide breakthrough curves for the column trials performed: (a) and (b) high and low flow rate for the LC34-LSU aquifer material, (c) and (d) high and low flow rate for the LC34-USU aquifer material, (e) and (f) high and low flow rate for the MAAP aquifer material. Also shown in (f) are results from the additional MAAP aquifer material column experiments where the column was first flushed with a H2SO4 solution (pH = 3.0) for two hours prior to a solution of hydrogen peroxide.

97
For the column treated with the sulfuric acid solution (pH = 3.0), the first appearance of hydrogen peroxide in the column effluent (0.97 PV) was nearly identical to that for the first flush with the hydrogen peroxide and EDDS solution (0.95 PV), and for the second flush with the hydrogen peroxide only solution (0.95 PV) (Table 28). The shape of the rising portion of the hydrogen peroxide profile for the column treated with the sulfuric acid solution is almost identical to that produced by the first flush with the hydrogen peroxide only solution, suggesting that the quantity of hydrogen peroxide used in actual ISCO application may be considerably decreased by performing an acidic flush prior to the injection of hydrogen peroxide. The effluent pH ranged from 3.3 to 4.2 with an average value of 3.7 of all column observations, indicating that an acidic condition remained within the column, and that the pH condition was suitable for Fenton’s reaction (Pignatello et al., 2006; Watts and Teel, 2005). Under this acidic condition, more dissolved metals (including Fe and Mn) would be released from aquifer solids and then removed from the column system by the acidic flush (Nicholson et al., 2003), leading to a low content of Fe and Mn remained within the column and an decrease of the unproductive depletion of hydrogen peroxide by aquifer materials. When the effluent hydrogen peroxide concentration stabilized, the total dissolved concentration of Fe and Mn for the flush with the hydrogen peroxide only solution following the treatment with the sulfuric acid solution was 0.18 mmol/L, which is less than that (0.34 mmol/L) for the first-flush with the hydrogen peroxide only solution but greater than that (0.05 mmol/L) for the second-flush with the hydrogen peroxide only solution. A reasonable explanation for this observation is that a portion of the dissolvable metals (Fe and Mn) in the MAAP aquifer material were removed from the column during the initial flush with the sulfuric acid solution. The results from the batch experiments as presented in Table 25 indicated that the hydrogen peroxide decomposition rate coefficient increases as the transition metal (Fe and Mn) concentration in the system increases, and therefore it is not surprising that with the high dissolved metal concentration (0.34 mmol/L) the first appearance of hydrogen peroxide during the first-flush with the hydrogen peroxide only solution lags behind the second-flush with the hydrogen peroxide only solution. Interestingly, all these three dissolved metal concentration values are much less than that (0.75 mmol/L) for the first-flush with the hydrogen peroxide and EDDS solution, and the first appearance of hydrogen peroxide for the column experiments with the hydrogen peroxide and EDDS solution was nearly identical to that for the second-flush with the hydrogen peroxide only solution. This suggests that the presence of EDDS causes the dissolved iron and manganese to be less available for the reaction with hydrogen peroxide by suppressing their catalytic activity. This high metal concentration (0.75 mmol/L) in the column effluent solution for the hydrogen peroxide and EDDS solution compared to the other cases is because EDDS complexes metal ions in the solid phase and extracts them from aquifer materials. This observation is consistent with the results form the batch system discussed in Section 6.3.4.
6.4.3.2 Observed H2O2 Decomposition Rate Constants
As concluded from the batch experiments, the decomposition of hydrogen peroxide in the presence of aquifer materials follows the first-order rate law, given as
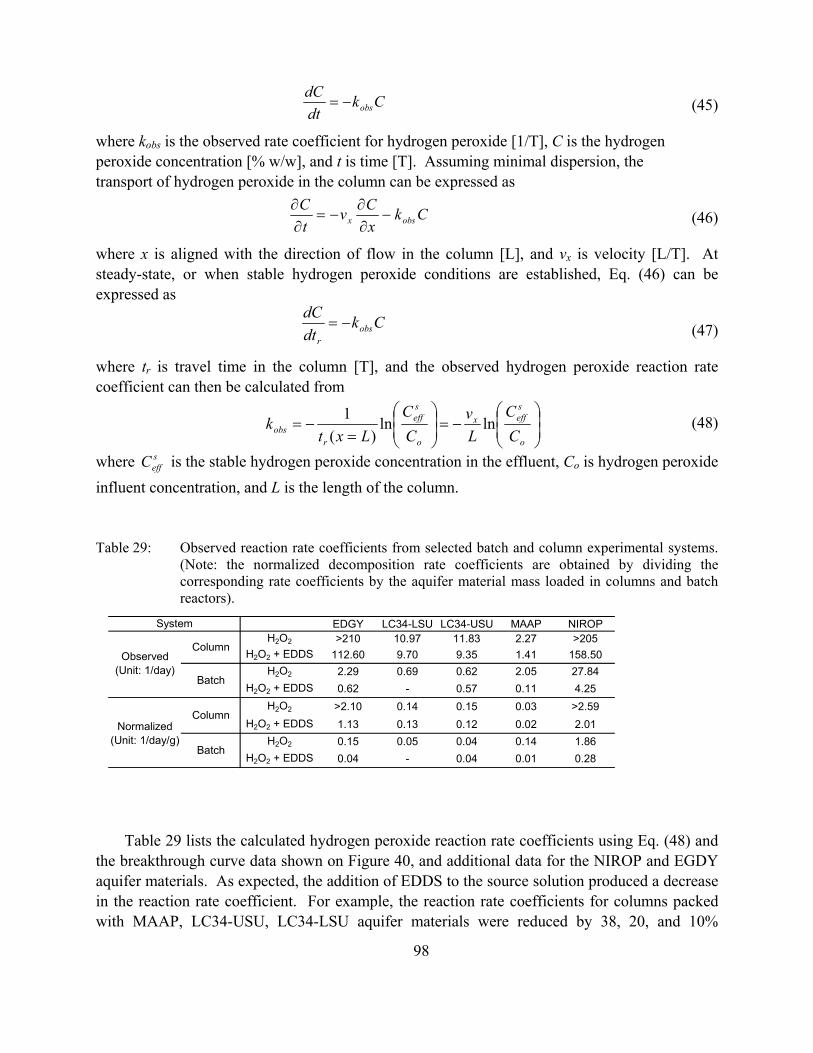
CkdtdC
obs−= (45)
where kobs is the observed rate coefficient for hydrogen peroxide [1/T], C is the hydrogen peroxide concentration [% w/w], and t is time [T]. Assuming minimal dispersion, the transport of hydrogen peroxide in the column can be expressed as
CkxCv
tC
obsx −∂∂
−=∂∂
(46)
CkdtdC
obsr
−=
where x is aligned with the direction of flow in the column [L], and vx is velocity [L/T]. At steady-state, or when stable hydrogen peroxide conditions are established, Eq. (46) can be expressed as
(47)
where tr is travel time in the column [T], and the observed hydrogen peroxide reaction rate coefficient can then be calculated from
98
EDGY LC34-LSU LC34-USU MAAP NIROPH2O2 >210 10.97 11.83 2.27 >205
H2O2 + EDDS 112.60 9.70 9.35 1.41 158.50H2O2 2.29 0.69 0.62 2.05 27.84
H2O2 + EDDS 0.62 - 0.57 0.11 4.25H2O2 >2.10 0.14 0.15 0.03 >2.59
H2O2 + EDDS 1.13 0.13 0.12 0.02 2.01H2O2 0.15 0.05 0.04 0.14 1.86
H2O2 + EDDS 0.04 - 0.04 0.01 0.28
(Un t: 1/day/g)
System
Observed(U it: 1/day)
Normalized
Column
Batch
Column
Batchi
n
⎟⎟⎠
⎞⎜⎜⎝
⎛−=⎟
⎟⎠
⎞⎜⎜⎝
⎛
=−=
o
seffx
o
seff
robs C
CLv
CC
Lxtk lnln
)(1 (48)
where C is the stable hydrogen peroxide concentration in the effluent, Co is hydrogen peroxide influent concentration, and L is the length of the column.
seff
Table 29: Observed reaction rate coefficients from selected batch and column experimental systems. (Note: the normalized decomposition rate coefficients are obtained by dividing the corresponding rate coefficients by the aquifer material mass loaded in columns and batch reactors).
Table 29 lists the calculated hydrogen peroxide reaction rate coefficients using Eq. (48) and the breakthrough curve data shown on Figure 40, and additional data for the NIROP and EGDY aquifer materials. As expected, the addition of EDDS to the source solution produced a decrease in the reaction rate coefficient. For example, the reaction rate coefficients for columns packed with MAAP, LC34-USU, LC34-LSU aquifer materials were reduced by 38, 20, and 10%
99
respectively with the addition of EDDS. The hydrogen peroxide decomposition rate coefficients for EGDY and NIROP were decreased from greater than 200 day-1 to less than 160 day-1 by the addition of EDDS.
6.4.3.3 Comparison of the Hydrogen Peroxide Decomposition in Column and Batch Systems
Along with the calculated hydrogen peroxide reaction rate coefficients from the column experiments, the observed decomposition rate coefficients obtained from batch experiments are also listed in Table 29.
For all aquifer materials, the hydrogen peroxide reaction rate coefficients based on the column data are much greater (>18% for the hydrogen peroxide only solution, and >1500% for hydrogen peroxide and EDDS solution) than those estimated from the batch test data. This increase is a direct result of higher mass of aquifer material to solution mass ratio in the column experiments, which leads to higher decomposition rate coefficients. To remove this influence, all decomposition rate coefficients from both column and batch experiments were divided by the corresponding mass of aquifer materials used in each system, and for comparison these normalized decomposition rate coefficients are also listed in Table 29. It can be seen that after this normalization, the hydrogen peroxide reaction rate coefficients based on the column data are greater (>28% for the hydrogen peroxide only solution except for the MAAP aquifer material, and >58% for hydrogen peroxide and EDDS solution) than those estimated from the batch test data. As discussed in Section 6.2.2, the MAAP aquifer material contains a relatively low content of total Fe and Mn but a relatively high content of dissolvable Fe and Mn, leading to a high concentration level of dissolved Mn and Fe in the solution of the corresponding batch reactors (Figure 32). The dissolved Fe and Mn were retained in the reactors throughout the reaction process for batch experiments while these species were likely removed from the column, resulting in differing hydrogen peroxide decomposition for these two systems.
Acknowledging the limited data availability, a correlation analysis was performed between the observed hydrogen peroxide decomposition rate coefficients generated from the batch and the column experiments. The results from this analysis indicated a weak correlation for the hydrogen peroxide and EDDS solution (r = 0.8, n = 4), and for the hydrogen peroxide only solution (r = 0.6, n = 4); neither of these correlations produced statistically significant linear relationships. However, for the normalized decomposition rate coefficient, the correlation coefficient for the hydrogen peroxide and EDDS solution increased from r = 0.8 to r = 0.88, but decreased from r = 0.6 to <0.5 for the hydrogen peroxide only solution.
Contrary to the good correlation between the hydrogen peroxide decomposition rate coefficients from the column and batch systems for the hydrogen peroxide and EDDS solution, a poor correlation was obtained for the hydrogen peroxide only solution. This may be due to the combined influence of the EDDS stabilizing effect on hydrogen peroxide and the solution/aquifer material contact difference between column and well-mixed batch reactor systems. The presence of EDDS causes the dissolved Fe and Mn to be less available for the
100
reaction with hydrogen peroxide by suppressing their catalytic activity in both experimental systems, and thus provides a relatively comparable reaction environment for hydrogen peroxide in these two systems. As mentioned previously, without EDDS addition, the differing concentrations of dissolved Fe and Mn in the batch and column systems likely led to completely different reaction conditions for hydrogen peroxide.
6.4.4 Summary
The results from these column experiments clearly demonstrate that the addition of EDDS was able to successfully stabilize hydrogen peroxide in the presence of the aquifer materials used in this study. This is especially true for the EGDY and NIROP aquifer materials where we were unable to propagate hydrogen peroxide through a 10-cm long column with the hydrogen peroxide only solution, but were able to achieve some level of breakthrough with the hydrogen peroxide and EDDS solution. Therefore, the use of EDDS as a green chelating agent appears to be promising for in situ applications involving the injection of hydrogen peroxide.
The transport of transition metals (Fe and Mn) associated with the application of hydrogen peroxide, especially when an acid flush was conducted prior to hydrogen peroxide, was observed in this investigation. Since Fe and Mn can promote the decomposition of hydrogen peroxide depending on their form (e.g., solid and soluble) and their content within the system, this transport of dissolved metals (Fe and Mn) is expected to affect the behavior of hydrogen peroxide within the subsurface environment.
When a chelating reagent (i.e., EDDS) was used, a relationship related to the hydrogen peroxide decomposition rate coefficient obtained from column systems to batch system data was developed. The hydrogen peroxide decomposition rate coefficients generated from the column data are significantly higher than those generated from the batch test data due to the solution/aquifer material contact difference between a column and a well-mixed batch reactor. This is a clear indication that the use of batch test data for design is questionable since column experiments can provide more realistic aquifer material contact and therefore are believed to mimic in situ conditions better than batch tests.
6.5 Modeling
Models are especially important in understanding the oxidant behavior in subsurface systems, not only because they allow the complex subsurface system to be economically investigated and the observed data to be reproduced, but also because they provide a tool for the appropriate design of ISCO systems.
The transport of hydrogen peroxide in a one-dimensional subsurface system can be described using the advective-dispersion equation as expressed by:
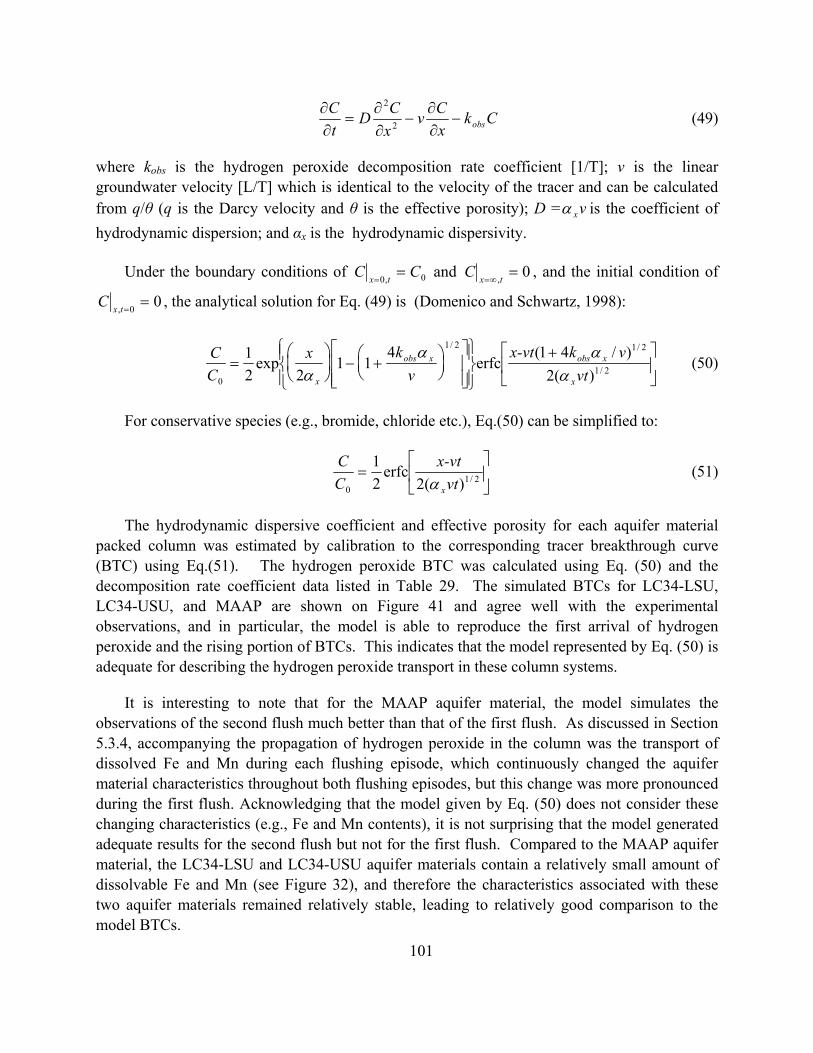
CkxCv
xCD
tC
obs−∂∂
−∂∂
=∂∂
2
2
(49)
where kobs is the hydrogen peroxide decomposition rate coefficient [1/T]; v is the linear groundwater velocity [L/T] which is identical to the velocity of the tracer and can be calculated from q/θ (q is the Darcy velocity and θ is the effective porosity); D = vxα is the coefficient of hydrodynamic dispersion; and αx is the hydrodynamic dispersivity.
Under the boundary conditions of 0,0 CC tx ==
and 0, =∞= txC , and the initial condition of
00, ==txC , the analytical solution for Eq. (49) is (Domenico and Schwartz, 1998):
⎥⎦
⎤⎢⎣
⎡ +
⎪⎭
⎪⎬⎫
⎪⎩
⎪⎨⎧
⎥⎥⎦
⎤
⎢⎢⎣
⎡⎟⎠⎞
⎜⎝⎛ +−⎟
⎠⎞
⎜⎝⎛
= 2/1
2/12/1
0 )(2)/41(
erfc4
112
exp21
vtvkx-vt
vkx
CC
x
xobsxobs
x ααα
α (50)
For conservative species (e.g., bromide, chloride etc.), Eq.(50) can be simplified to:
⎥⎦
⎤⎢⎣
⎡= 2/1
0 )(2erfc
21
vtx-vt
CC
xα (51)
The hydrodynamic dispersive coefficient and effective porosity for each aquifer material packed column was estimated by calibration to the corresponding tracer breakthrough curve (BTC) using Eq.(51). The hydrogen peroxide BTC was calculated using Eq. (50) and the decomposition rate coefficient data listed in Table 29. The simulated BTCs for LC34-LSU, LC34-USU, and MAAP are shown on Figure 41 and agree well with the experimental observations, and in particular, the model is able to reproduce the first arrival of hydrogen peroxide and the rising portion of BTCs. This indicates that the model represented by Eq. (50) is adequate for describing the hydrogen peroxide transport in these column systems.
It is interesting to note that for the MAAP aquifer material, the model simulates the observations of the second flush much better than that of the first flush. As discussed in Section 5.3.4, accompanying the propagation of hydrogen peroxide in the column was the transport of dissolved Fe and Mn during each flushing episode, which continuously changed the aquifer material characteristics throughout both flushing episodes, but this change was more pronounced during the first flush. Acknowledging that the model given by Eq. (50) does not consider these changing characteristics (e.g., Fe and Mn contents), it is not surprising that the model generated adequate results for the second flush but not for the first flush. Compared to the MAAP aquifer material, the LC34-LSU and LC34-USU aquifer materials contain a relatively small amount of dissolvable Fe and Mn (see Figure 32), and therefore the characteristics associated with these two aquifer materials remained relatively stable, leading to relatively good comparison to the model BTCs.
101

102
Based on the above discussion, an accurate model for hydrogen peroxide transport in the subsurface appears to be the one which could account for the content and form of transition metals (Fe and Mn) in the system. However, quantifying this change of aquifer material characteristics is quite difficult and is perhaps the reason why there are very few mathematical models describing hydrogen peroxide transport in the subsurface.

103
Time (min)
C/C
0
100 200 300 4000
0.2
0.4
0.6
0.8
1
Model (high)Model (low)Flush1 (high)Flush2 (high)Flush1 (low)Flush2 (low)
(e)
Time (min)
C/C
0
50 100 150 200 2500
0.2
0.4
0.6
0.8
1
Model (high)Model (low)Flush1 (low)Flush2 (low)
(f)
Time (min)
C/C
0
50 100 150 2000
0.2
0.4
0.6
0.8
1
Model (high)Model (low)Flush1 (high)Flush2 (high)Flush1 (low)Flush2 (low)
(c)
Time (min)
C/C
0
20 40 60 80 100 120 1400
0.2
0.4
0.6
0.8
1
Model (high)Model (low)Flush1 (high)Flush2 (high)Flush1 (low)Flush2 (low)
(a)
Time (min)
C/C
0
20 40 60 80 100 120 1400
0.2
0.4
0.6
0.8
1
Model (high)Model (low)Flush1 (high)Flush2 (high)Flush1 (low)Flush2 (low)
(b)
Time (min)
C/C
0
50 100 150 2000
0.2
0.4
0.6
0.8
1
Model (high)Model (low)Flush1 (high)Flush2 (high)Flush1 (low)Flush2 (low)
(d)
Figure 41: Calculated and observed hydrogen peroxide breakthrough curves for columns: (a) without and (b) with EDDS application for the LC34-LSU aquifer material, (c) without and (d) with EDDS application for the LC34-USU aquifer material, (e) without and (f) with EDDS application for the MAAP aquifer material.
104
7 PERSULFATE
7.1 Introduction
Persulfate is an emerging oxidant which has numerous advantages; a high oxidation potential of 2.6 V through formation of sulfate free radicals, a high solubility in water, widespread reactivity with environmental contaminants, and high stability in aqueous systems (Huang et al., 2002; Liang et al., 2003; Huang et al., 2005; Watts and Teel, 2006). Although there have been numerous studies reporting the effectiveness of persulfate to treat contaminants ranging from chlorinated solvents to petroleum hydrocarbons to polycyclic aromatic hydrocarbons (e.g., Kronholm and Riekkola, 1999; Liang et al., 2004; Huang et al., 2005; Watts and Teel, 2006), peer-reviewed literature on the interaction between persulfate with aquifer materials and the stability of persulfate in groundwater is scarce. An understanding of this interaction is required for cost effective design (e.g., quantifying site specific oxidant dosing requirements and selecting oxidant delivery systems), and to establish persulfate as a viable oxidant for wide-spread use at the field scale.
7.2 Methods
To investigate the interaction between persulfate and aquifer solids, two types of bench-scale experimental systems were used: well-mixed batch reactors, and stop-flow columns. Seven aquifer materials were used in these experiments: Borden, DNTS, LAAP, LC34-LSU, LC34-USU, MAAP, and NIROP.
For each well-mixed batch reactor system 100 g of aquifer solids was loaded into a 300 mL reactor and 100 mL of Milli-Q water was added. After 24 hours a sample of the solution was extracted and analyzed for background dissolved iron (Fe), manganese (Mn) and organic carbon concentrations (DOC). Sufficient sodium persulfate (Aldrich Chem. Co., Milwaukee) mass was then added to establish an initial persulfate concentration of 1000 mg/L. Each reactor was manually shaken daily to maximize contact. At regular time intervals over the ~80-day reaction period an aliquot of the supernatant from each reactor was removed and analyzed for persulfate. Triplicate reactors were used for each aquifer material. Solution pH was also monitored regularly. To evaluate the effects of a different oxidant to solids mass ratio, an additional set of reactors using 150 g of the LC34-LSU aquifer material instead of 100 g was also employed in this investigation. At the end of the ~80 day reaction period solution samples were again analyzed for dissolved Fe, Mn, and DOC concentrations. The contents of each reactor were then thoroughly flushed with Milli-Q water to remove residual persulfate and air dried at 80oC to a constant weight. Triplicate sub-samples of the air-dried aquifer material were analyzed for a
105
post-persulfate exposure estimate of the chemical oxidant demand (COD) following the procedure described in Section 6.2.2.
To closely mimic in situ conditions with respect to oxidant and aquifer material contact and to further examine the affect of oxidant to aquifer solids mass ratio on persulfate degradation a series of stop-flow columns experiments were employed for each aquifer material. A typical column was constructed from a 40-cm long section of nominal 3.81 cm (1.5-inch) diameter transparent Plexiglas pipe equipped with four equally spaced sampling ports. Each column was with dry packing with homogenized aquifer material, flushed with carbon dioxide gas and the flushed with Milli-Q water at a flow rate of 0.8 mL/min for 24 hours to ensure complete water saturation. A 1000 mg/L persulfate solution was then flushed through the column in up-flow mode for two pore volumes and effluent samples were analyzed to generate a persulfate breakthrough curve. Due to the low persulfate degradation rates observed from the batch experimental systems and the near conservative tracer-like breakthrough curve observed during the initial persulfate flush, a stop-flow column operation as opposed to a continuous flow operation was adopted. Hence, after completion of the initial persulfate flush the pump was removed and the injection port at the bottom of the column was used to collect aqueous samples at regular intervals and analyzed for persulfate. During each sampling episode nitrogen gas was used to pressurize the top of the column to aid in sample collection. The implication of using this stop-flow mode of column operation implies that there is no change of aquifer material properties over time due to exposure to persulfate. Each column test was run for 20 to 35 days depending upon the ease of sample collection and the observed persulfate concentration. Once each column test was completed the column was flushed with Milli-Q water to remove residual persulfate, and aquifer solids were collected from three vertical locations in the column (0 cm, 20 cm and 40 cm from top). Each aquifer material sub-sample was air-dried at 80oC to constant weight, and then analyzed for a post-persulfate exposure COD estimate.
Quantification of sodium persulfate concentration was performed following the procedure described by Huang et al. (2002) with a slight variation to account for the interferences arising from aqueous sample coloration due to the presence of aquifer solids. Total dissolved Fe and Mn concentrations were determined using ICP emission spectroscopy (Spectro Analytical, Fitchburg, MA) with a MDL of 0.1 mg/L for total dissolved Fe and 0.01 mg/L for total dissolved Mn. DOC was quantified using a Total Organic Carbon analyzer (Model-5050A, Shimadzu). The solution pH was monitored using a pH meter (Model 290A, Orion).

7.3 Results
Time (days)
Rel
ativ
eP
ersu
lfate
Con
cent
ratio
n
0 20 40 60 800
0.1
0.2
0.3
0.4
0.5
0.6
0.7
0.8
0.9
1
1.1
LC34-LSU-150LC34-LSU-100
NIROP
LC34-USU
DNTS
Control
LAAP
BordenMAA
Rel
ativ
eP
ersu
lfate
Con
cent
ratio
n
0 20 40 60 800
0.1
0.2
0.3
0.4
0.5
0.6
0.7
0.8
0.9
1
1.1
LC34-LSU-150LC34-LSU-100
NIROP
LC34-USU
DNTS
Control
LAAP
BordenMAAP
7.3.1 Batch Reactor Experiments
Normalized persulfate concentration temporal profiles over the ~80 day reaction period for each aquifer material are shown in Figure 42. Each data point represents the average from triplicate reactors. For the LC34-LSU aquifer material the notation LC34-LSU-100 and LC34-LSU-150 indicate results from reactors using 100 and 150 g of aquifer solids respectively. The control reactor which contained only persulfate at a concentration of 1000 mg/L showed no indication of persulfate degradation. For all aquifer materials, the decomposition of persulfate followed first-order reaction kinetics. Reaction rate coefficients varied by an order of magnitude from 10-4 to 10-3 hr-1 for the seven aquifer materials used in this investigation (Table 30). In general, the half-life data (inversely proportional to the reaction rate coefficient) suggests that persulfate will be highly stable in aquifer systems and hence from a remediation perspective is a suitable ISCO oxidant. The results from the tests performed using the LC34-LSU aquifer material (with 100 and 150 g of solids) show that the observed reaction rate coefficient is higher for LC34-LSU-150 than for LC34-LSU-100.
Figure 42: Temporal persulfate concentration profiles in the presence of the seven aquifer materials. Each data point represents the average from triplicate reactors. Also shown is the average concentration profile from the control reactor.
106
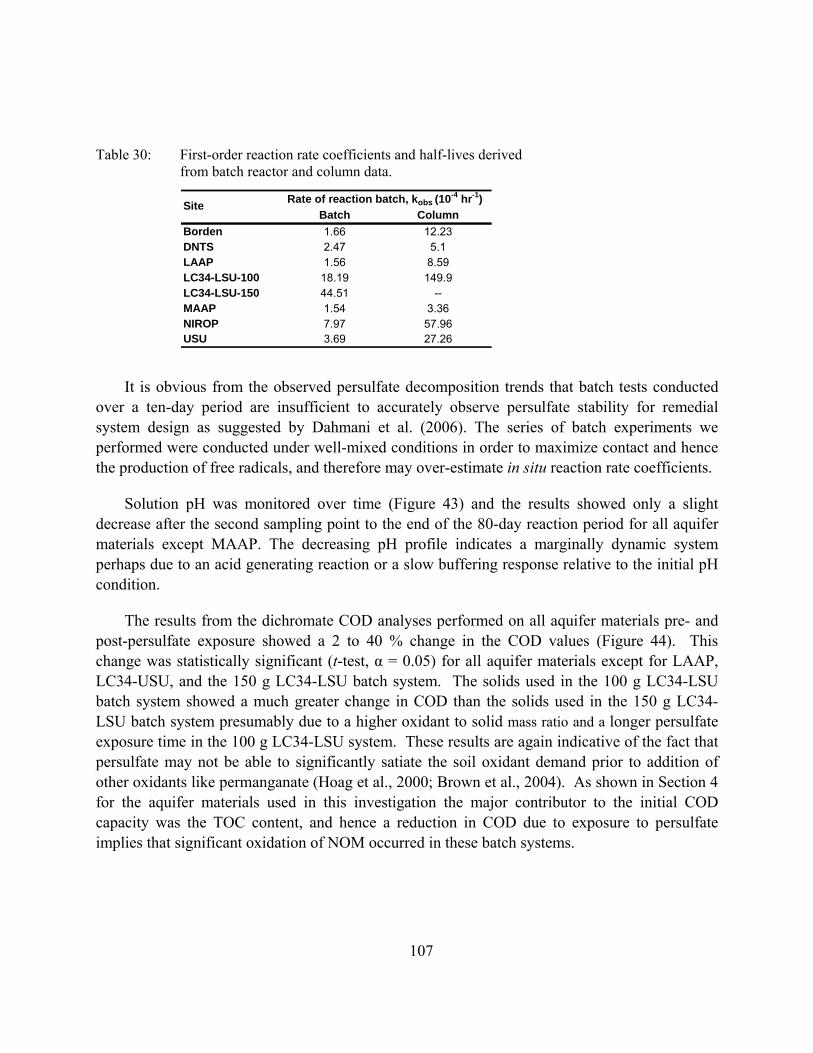
Table 30: First-order reaction rate coefficients and half-lives derived
from batch reactor and column data.
Rate of reaction batch, kobs (10-4 hr-1)Batch Column
Borden 1.66 12.23DNTS 2.47 5.1LAAP 1.56 8.59LC34-LSU-100 18.19 149.9LC34-LSU-150 44.51 --MAAP 1.54 3.36NIROP 7.97 57.96USU 3.69 27.26
Site
It is obvious from the observed persulfate decomposition trends that batch tests conducted over a ten-day period are insufficient to accurately observe persulfate stability for remedial system design as suggested by Dahmani et al. (2006). The series of batch experiments we performed were conducted under well-mixed conditions in order to maximize contact and hence the production of free radicals, and therefore may over-estimate in situ reaction rate coefficients.
Solution pH was monitored over time (Figure 43) and the results showed only a slight decrease after the second sampling point to the end of the 80-day reaction period for all aquifer materials except MAAP. The decreasing pH profile indicates a marginally dynamic system perhaps due to an acid generating reaction or a slow buffering response relative to the initial pH condition.
The results from the dichromate COD analyses performed on all aquifer materials pre- and post-persulfate exposure showed a 2 to 40 % change in the COD values (Figure 44). This change was statistically significant (t-test, α = 0.05) for all aquifer materials except for LAAP, LC34-USU, and the 150 g LC34-LSU batch system. The solids used in the 100 g LC34-LSU batch system showed a much greater change in COD than the solids used in the 150 g LC34-LSU batch system presumably due to a higher oxidant to solid mass ratio and a longer persulfate exposure time in the 100 g LC34-LSU system. These results are again indicative of the fact that persulfate may not be able to significantly satiate the soil oxidant demand prior to addition of other oxidants like permanganate (Hoag et al., 2000; Brown et al., 2004). As shown in Section 4 for the aquifer materials used in this investigation the major contributor to the initial COD capacity was the TOC content, and hence a reduction in COD due to exposure to persulfate implies that significant oxidation of NOM occurred in these batch systems.
107
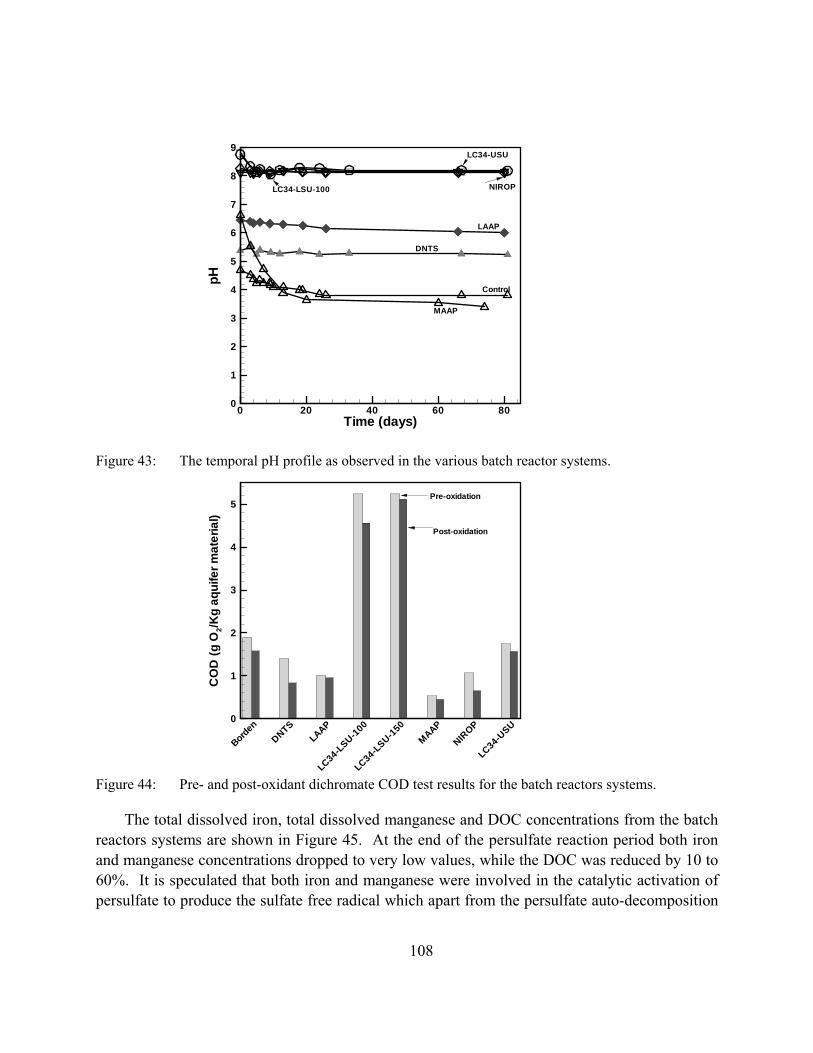
Time (days)
pH
0 20 40 60 800
1
2
3
4
5
6
7
8
9
108
MAAP
Control
DN
LAAP
NIROP
LC34-USU
LC34-LSU-100
TS
Figure 43: The temporal pH profile as observed in the various batch reactor systems.
CO
D(g
O2/K
gaq
uife
rmat
eria
l)
BordenDNTS
LAAP
LC34-LSU-100
LC34-LSU-150
MAAP
NIROP
LC34-USU
0
1
2
3
4
5Pre-oxidation
Post-oxidation
Figure 44: Pre- and post-oxidant dichromate COD test results for the batch reactors systems.
The total dissolved iron, total dissolved manganese and DOC concentrations from the batch reactors systems are shown in Figure 45. At the end of the persulfate reaction period both iron and manganese concentrations dropped to very low values, while the DOC was reduced by 10 to 60%. It is speculated that both iron and manganese were involved in the catalytic activation of persulfate to produce the sulfate free radical which apart from the persulfate auto-decomposition

reactions may have resulted in DOC oxidation to CO2. However, most likely due to slow nature of the reactions no gas production was visually observed in any of the batch reactors.
Tota
ldis
solv
edFe
(mg/
L)
Borden
DNTSLA
AP
LC34-LSU-100
LC34
-LSU-150MAAP
NIROP
LC34-USU
0
5
10
15
20
25
Pre-oxidation
Post-oxidation
Tota
ldis
solv
edM
n(m
g/L)
BordenDNTS
LAAP
LC34-LSU-100
LC34-LSU-150MAAP
NIROP
LC34-USU
0
1
2
3
4
5
6
7
Pre-oxidation Post-oxidation
Dis
solv
edor
gani
cca
rbon
,DO
C(m
g/L)
Borden
DNTSLAAP
LC34-LSU-100
LC34-LSU-150MAAP
NIROP
LC34-USU
0
5
10
15
20
25
Pre-oxidation
Post-oxidation
(a) (b) (c)
Tota
ldis
solv
edFe
(mg/
L)
Borden
DNTSLA
AP
LC34-LSU-100
LC34
-LSU-150MAAP
NIROP
LC34-USU
0
5
10
15
20
25
Pre-oxidation
Post-oxidation
Tota
ldis
solv
edM
n(m
g/L)
BordenDNTS
LAAP
LC34-LSU-100
LC34-LSU-150MAAP
NIROP
LC34-USU
0
1
2
3
4
5
6
7
Pre-oxidation Post-oxidation
Dis
solv
edor
gani
cca
rbon
,DO
C(m
g/L)
Borden
DNTSLAAP
LC34-LSU-100
LC34-LSU-150MAAP
NIROP
LC34-USU
0
5
10
15
20
25
Pre-oxidation
Post-oxidation
(a) (b) (c)
Figure 45: Total dissolved (a) iron, Fe; (b) manganese, Mn; and (c) organic carbon, DOC concentrations from the batch reactor systems before and after exposure to persulfate for ~80 days.
A correlation analysis between the observed reaction rate coefficients and various physico-chemical aquifer properties that may be responsible for the degradation reaction was performed; however, no significant (r > 0.7) correlation was apparent. In addition, no significant correlation was observed between dissolved iron, manganese or organic carbon concentrations and the observed reaction rate coefficients.
Time (hours)
Per
sulfa
teco
ncen
tratio
n(m
g/L)
0 10 20 30 40 500
200
400
600
800
1000
LAAP
NIROP
7.3.2 Column Experiments
Persulfate breakthrough curves for LAAP and NIROP aquifer materials are shown in Figure 46. Persulfate in these column experiments behaves like a conservative tracer, implying that a long residence time would be required to observe a noticeable change in persulfate concentration.
Figure 46: Persulfate breakthrough curves for LAAP and NIROP aquifer materials. 109

Time (days)
Rel
ativ
eP
ersu
lfate
Con
cent
ratio
n
0 10 20 300
0.1
0.2
0.3
0.4
0.5
0.6
0.7
0.8
0.9
1
1.1
LC34-LSU
NIROP
LC34-USU
Borden
LAAP
MAAP
DNTS
Figure 47: Normalized persulfate temporal profiles from the stop-flow column experiments.
Normalized persulfate concentration temporal profiles for the stop-flow column experiments are shown in Figure 47. Consistent with the batch reactor results, the decomposition of persulfate can be captured by a first-order kinetic rate law (r2 > 0.95 for all aquifer materials). Based on the column data, the reaction rate coefficients varied from 10-4 to 10-2 hr-1 which is almost an order of magnitude higher than the corresponding batch test results (Table 30). In fact, as shown in Figure 48, a reaction rate coefficient from the batch reactor tests can be scaled by a factor of ~8 to yield the equivalent column test reaction rate coefficient. This indicates a strong sensitivity of reaction rates to the oxidant to aquifer solids mass ratio. Figure 49 shows that decreasing the persulfate to aquifer solids mass ratio from the batch to the column scale will increase reaction rate coefficient suggesting that the lower contact area per unit oxidant mass in the batch reactors experiments is responsible for the lower rate coefficient relative to the stop-flow column experiments. This also implies that persulfate degradation kinetics maybe scalable from bench-scale to in situ conditions.
The results from the COD tests conducted on persulfate exposed aquifer materials from three locations along the length of the column indicate varied behavior across aquifer materials (Figure 50). Since repeated aqueous sampling was performed at the bottom port (40 cm) of the column while gas pressure was applied at the top of the column, the three locations in the column where aquifer material was sampled are representative of exposure time to persulfate. The sub-sample collected from the top of the column (0 cm) was the least exposed while the sub-sample collected from the bottom of the column (40 cm) was the most exposed. Some aquifer materials (i.e., LAAP, NIROP, LC34-USU) showed no significant reduction of COD from pre-persulfate exposure conditions, others aquifer materials showed moderate (i.e., Borden, LC34-LSU) to a high (i.e., DNTS, MAAP) decrease between the three locations and against the background COD. These results are consistent with the batch reactors COD results. This implies that some depletion of oxidizable constituents in the aquifer materials has taken place in the presence of
110

kobs Batch Tests (10-4 hr-1)
k obs
Col
umn
Test
s(1
0-4hr
-1)
0 20 40 60 80 100 120 140 1600
20
40
60
80
100
120
140
160
1
1
persulfate, and this depletion is directly proportional to the exposure time for these aquifer materials. For the aquifer materials that showed substantial depletion of COD, the first-order reaction rate coefficient values (Table 30) should be considered as an average value for the column since the assumption under which the stop-flow column approach was used (no change in aquifer material properties) was violated.
Figure 48: Column and batch reactor persulfate reaction rate coefficients.
Oxidant to aquifer material mass ratio ( 10-4 g/g)
k obs
(10-4
hr-1
)
1 1100
101
102
LC34-LSU
NIROP
LC34-USU
MAAP
DNTS
Borden
LAAP
0
Figure 49: Reaction rate coefficients from the column and batch reactors experiments as a function of the oxidant to aquifer material mass ratio. The batch reactor systems had a mass ratio of ~10, while the column systems had a mass ratio between 2 and 3.
111
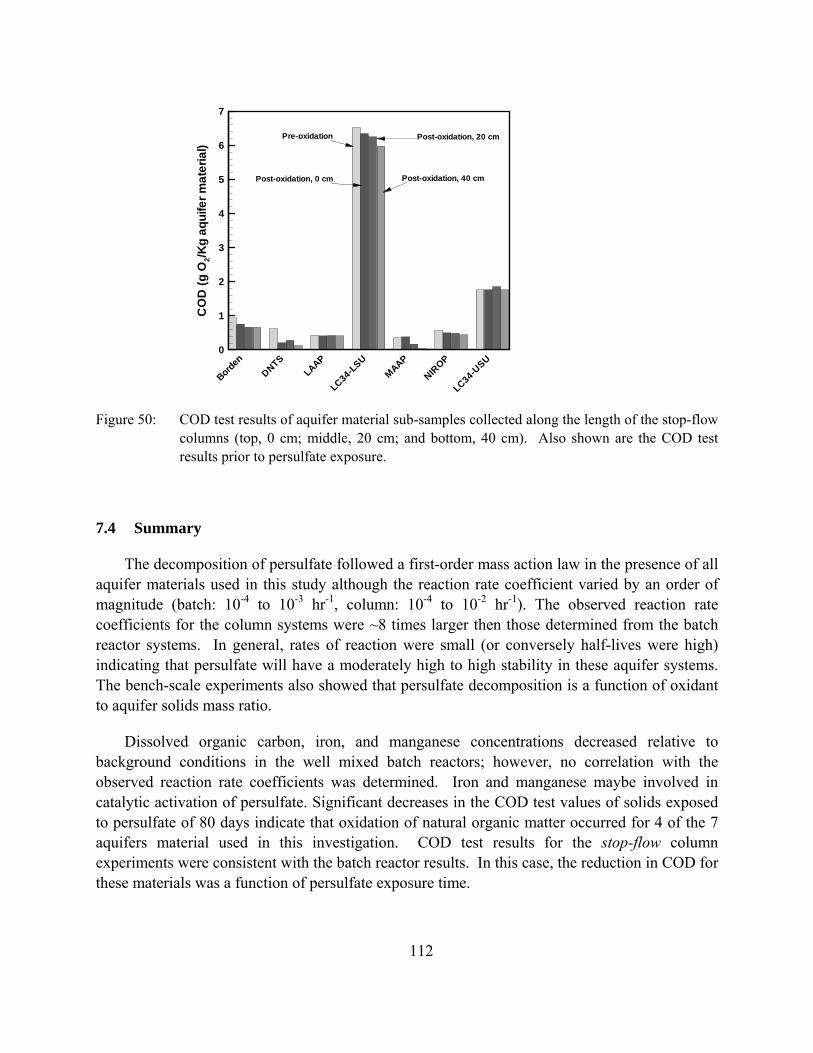
CO
D(g
O2/K
gaq
uife
rmat
eria
l)
BordenDNTS
LAAP
LC34-LSUMAAP
NIROP
LC34-USU
0
1
2
3
4
5
6
7
Pre-oxidation Post-oxidation, 20 cm
Post-oxidation, 40 cmPost-oxidation, 0 cm
Figure 50: COD test results of aquifer material sub-samples collected along the length of the stop-flow columns (top, 0 cm; middle, 20 cm; and bottom, 40 cm). Also shown are the COD test results prior to persulfate exposure.
7.4 Summary
The decomposition of persulfate followed a first-order mass action law in the presence of all aquifer materials used in this study although the reaction rate coefficient varied by an order of magnitude (batch: 10-4 to 10-3 hr-1, column: 10-4 to 10-2 hr-1). The observed reaction rate coefficients for the column systems were ~8 times larger then those determined from the batch reactor systems. In general, rates of reaction were small (or conversely half-lives were high) indicating that persulfate will have a moderately high to high stability in these aquifer systems. The bench-scale experiments also showed that persulfate decomposition is a function of oxidant to aquifer solids mass ratio.
Dissolved organic carbon, iron, and manganese concentrations decreased relative to background conditions in the well mixed batch reactors; however, no correlation with the observed reaction rate coefficients was determined. Iron and manganese maybe involved in catalytic activation of persulfate. Significant decreases in the COD test values of solids exposed to persulfate of 80 days indicate that oxidation of natural organic matter occurred for 4 of the 7 aquifers material used in this investigation. COD test results for the stop-flow column experiments were consistent with the batch reactor results. In this case, the reduction in COD for these materials was a function of persulfate exposure time.
112
113
8 REFERENCES Almendros, G., Gonzalez-Vila, F. J., and Martin, F., 1989. Room temperature alkaline
permanganate oxidation of representative humic acids. Soil Biology and Biochemistry, 21 (4), 481-486.
Almendros, G. and Leal, J.A., 1990. An evaluation of some oxidative degradation methods of humic substances applied to carbohydrate-derived humic-like polymers. Journal of Soil Science, 41, 51-59.
Andersen, M.S., Larsen, F., and Postma, D., 2001. Pyrite oxidation in unsaturated aquifer sediments: reaction stoichiometry and rate of oxidation. Environ. Sci. Technol., 35, 4074-4079.
APHA (American Public Health Association and America Water Works Association), 1946. Standard Methods for the Examination of Water and Sewage, 9th Ed., New York.
APHA (American Public Health Association and America Water Works Association), 1998. Standard Methods for the Examination of Water and Sewage, 20th Ed., New York.
Appelo, C.A.J. and Postma, D., 1996. Geochemistry, groundwater and pollution. A.A.Balkema/Rotterdam/Brookfield.
ASTM, 1990. ASTM Book of Standards on Road and Paving Materials. American Society for Testing and Materials.
Baciocchi, R., Boni, M.R., and D’Aprile, L., 2003. Hydrogen peroxide lifetime as an indicator of the efficiency of 3-chlorpphenol Fenton’s and Fenton-like oxidation in soils. Journal of Hazardous Matters, B96, 305-329.
Ball, W.P., Buehler, CH., Harmon, T.C., Mackay, D.M., and Roberts, P.V., 1990. Characterization of a sandy aquifer material at the grain size scale. J. Contam. Hydrol., 5, 253 -295.
Barcelona, M.J. and Holm, T., 1991. Oxidation – reduction capacities of aquifer solids. Environ. Sci. Technol., 25(9), 1565-1572.
Barnett, V. and Lewis, T., 1994. Outliers in Statistical Data. John Wiley and Sons, 1994.
Blair, G.J., R.D.B. Lefroy, L. Lisle, 1995. Soil carbon fractions based on their degree of oxidation and the development of carbon management index for agricultural systems. Australian Journal of Agricultural Research, 46, 1459-1466.
Boyles, W., 1997. The Science of Chemical Oxygen Demand. Technical Information Series, Booklet No.9, Hach Company, Loveland, CO.
Burtle, J., A.M. Buswell, 1937. Oxygen Demand Studies. Sewage Works Journal, 9: 224-238.
Brown, R.A., and Robinson, D., 2004. Response to naturally occurring organic material: permanganate versus persulfate, In: Proceedings of the Fourth International Conference of Remediation of Chlorinated and Recalcitrant Compounds (Monterey, CA, May 24-27, 2004), (Gavaskar, A.R., and Chen, A.S.C., Eds.), Battelle Press, Columbus, Ohio.

114
Canfield, D.E., 1994. Factors influencing organic carbon preservation in marine sediments. Chemical Geology, 114, pp.315-329.
Chao, T.T. 1972. Selective dissolution of manganese oxides from soils and sediments with acidified hydroxylamine hydrochloride. Soil Sci. Soc. Am. J. 36:764–768.
Chen, G.E., Hoag, G.E., Chedda, P., Nadim, F., Woody, B.A., and Dobbs, G.M., 2001. The mechanism and applicability of in situ oxidation of trichloroethylene with Fenton’s reagent. Journal of Hazardous Materials, B87, 171-186.
Christensen, T.H., Bjerg, P.L., Banwart, S.A., Jakobsen, R., Heron, G., and Albrechtsen, H.J., 2000. Characterization of redox conditions in groundwater contaminant plumes. J. Contam. Hydrol., 45, 165-241.
Churcher, P.L. and Dickout, R.D., 1987. Analysis of ancient sediments for total organic carbon – some new ideas. Journal of Geochemical Exploration, 29, 235-246.
Crimi, M.L. and Siegrist, R.L., 2004. Impact of reaction conditions on MnO2 genesis during permanganate oxidation. Journal of Environmental Engineering, 130(5), 562-567.
Dahmani, M.A., Huang, K., and Hoag, G.E., 2006. Sodium persulfate oxidation for the remediation of chlorinated solvents (USEPA superfund innovative technology evaluation program), Water, Air and Soil Pollution: Focus, 6, 127-141.
De-Laat, J. and Gallard, H., 1999. Catalytic decomposition of hydrogen peroxide by Fe(III) in homogeneous aqueous solution: mechanism and kinetic modeling. Environ. Sci. Technol., 33, 2726-2732.
Domenico, P. A. and Schwartz, F.W., 1998. Physical and Chemical Hydrogeology, Second edition. John Wiley & Sons, New York.
Drescher, E., Gavaskar, A. R., Sass, B.M., Cumming, L.J., Drescher, M.J., and Williamson, T.K.J., 1998. Batch and column testing to evaluate chemical oxidation of DNAPL source zones. In Proceeding from the 1st International Conference on Remediation of Chlorinated and Recalcitrant Compounds, Battelle, Monterey, Calif., 1998.
Eckenfelder, W.W., J.W. Hood, 1950. A critical evaluation of routine sewage analysis. Water & Sewage Works, 97:138-141.
European Environment Agency, 1999. Requirements for Water Monitoring, Topic Report No 1/1996.
Evanko, C.A., D.A. Dzombak, 1998. Influence of structural features on sorption on NOM-analogue organic acids to goethite, Environ. Sci. Technol., 32(19), 2846-2855.
Farmer, V.C. and Mitchell, B.D., 1963. Occurrence of oxalates in soil clays following hydrogen peroxide treatment. Soil Science, 96, 221- 229.
Fujikawa, Y. and Fukui, M., 2001. Vertical distribution of trace metals in natural soil horizons from Japan. Part 2: effect of organic components in soil. Water, Air, and Soil Pollution, 132, 305-328.

115
Fujimori, K., W. Ma, T. Moriuchi-Kawakami, Y. Shibutani, N. Takenaka, H. Bandow, Y. Maeda, 2001. Chemiluminescence method with potassium permanganate for the determination of organic pollutants in seawater, Analytical Sci., 16, 975-978.
Gallard, H. and De-Laat, J., 2000. Kinetic modeling of Fe(III)/H2O2 oxidation reactions in dilute aqueous solution using atrazine as a model organic compound. Water Research, 34(12), 3107-3116.
Grcman, H., Vodnik, D., Velikonja-Bolta, S., and Lestan, D., 2003. Heavy metals in the environment: Ethylenediaminedissuccinate as a new chelate for environmentally safe enhanced lead phytoextraction, J. Environ. Qual., 32, 500-506.
Harada, Y. and Inoko, A., 1977. The oxidation products formed from soil organic matter by hydrogen peroxide treatment. Soil Sci. Plant Nutr., 23(4), 513-521.
Hartog, N., Griffioen, J., and van der Weijden, C. H., 2002. Distribution and reactivity of O2-reducing components in sediments frm a layered aquifer. Environ. Sci. Technol., 36, 2338-2344.
Hartog, N. 2003. Reactivity of organic matter and other reductants in aquifer sediments. Ph.D thesis of University Utrecht, Netherland.
Hartog, N., Griffieon, J., Van Bergen, P.F., and Van-Der Weijden, C. H., 2001. Determining the reactivity of reduced components in Dutch aquifer sediments. Impact of Human Activity on Groundwater Dynamics, Proceeding of a Symposium Held during the Sixth IAHS Scientific Assembly at Maastricht, The Netherlands, July 2001. IAHS Publ., no.229. 221-227.
Haselow, J. S., Siegrist, R. L., Crimi, M., and Jarosch, T., 2003. Estimating the total oxidant demand for in situ chemical oxidation design. Remediation Journal, 13(4), 5-16.
Hatcher, P.G., Schnizer, M., Dennis, L.W., and Maciel, G.E., 1981. Aromaticity of humic substances in soil. Soil Society of America Journal, 45, 1089-1094.
Heron, G., Christensen, T.H. and Tjell, J.C., 1994. Oxidation capacity of aquifer sediments. Environ. Sci. Technol., 28, 153-158.
Hoag, G.E., Chheda, P.V., Woody, B.A., and Dobbs, G.M., 2000. Chemical oxidation of volatile organic compounds. United States Patent Number: 6019548.
Hoffman, E.R., 1992. Instrumental Neutron Activation in Geoanalysis. Journal of Geochemical Exploration, V. 44, 297-319.
Hofstetter, T. B., Schwarzenbach, R.P., and Haderlein, S.B., 2003. Reactivity of Fe(II) species associated with clay minerals. Environ. Sci. Technol., 37, 519-528.
Hood, E.D., 2000. Permanganate flushing of DNAPL source zones: experimental and numerical investigation. PhD thesis, University of Waterloo, Waterloo, Canada.
Huang, K.-C., Hoag, G. E., Chheda, P., Woody, B.A., and Dobbs, G.M., 1999. Kinetic study of oxidation of trichloroethene by potassium permanganate. Environmental Engineering Science, 16(4), 265-274.
Huang, K.C., Hoag, G.E., Chheda, P., Woody, B.A., and Dobbs, G.M., 2001. Kinetics study of oxidation of chlorinated ethenes with permanganate. J. Hazard. Mater., 87, 155-169.
116
Huang, K., Couttenye, R.A., and Hoag, G.E., 2002. Kinetics of heat-assisted persulfate oxidation of methyl tert-butyl ether (MTBE), Chemosphere, 49, 413-420.
Huang, K., Zhao, Z., Hoag, G.E., Dahmani, A., and Block, P.A., 2005. Degradation of volatile organic compounds with thermally activated persulfate oxidation, Chemosphere, 61, 551-560.
Huling, S.G., Arnold, R. G., Sierka, R.A., and Miller, M.R., 2001. Influence of peat on Fenton oxidation. Water Research, 35(7), 1687-1694.
Jones, C.W., 1999. Applications of hydrogen peroxide and derivatives. The royal Society of Chemistry, UK.
Jones, P.W. and Williams, D.R., 2001. Chemical speciation simulation used to assess [S,S’]-ethylenediaminediaminedisuccinic acid (EDDS) as a readily-biodegradable replacement for EDTA in radiochemical decontamination formulations. Applied Radiation and Isotopes, 54, 587-593.
Jones, P.W. and Williams, D.R., 2002. Chemical speciation simulation used to assess the efficiency of environment-friendly EDTA alternative for use in pulp and paper industry, Inorganica Chimica Acta, 339, 41-50.
Jung, H. and Thomson, N.R., 2004. Characteristics and kinetics of hydrogen peroxide decomposition in the presence of aquifer materials. The 3rd International Conference on Oxidation and Reduction Technologies for In-Situ Treatment of Soil and Groundwater. San Diego, CA. Oct 22-28, 2004.
Kakarla, P.K., Andrews, T., Greenberg, R. S. and Zervas, D.S., 2002. Modified Fenton’s processes for effective in-situ chemical oxidation-laboratory and field evaluation. Remediation, Autumn, 2002, 23-36.
Kakarla, P.K.C. & Watts, R.J., 1997. Depth of Fenton-like oxidation in remediation of surface soils. J. Enviro. Eng. 123, 11-17.
Kamei, G. and Ohmoto, H., 2000. The kinetics of reactions between pyrite and O2-bearing water revealed from in situ monitoring of DO, Eh and pH in a closed system. Geochimica et Cosmochimica Acta, 64(15), 2585-2601.
Kappler, A. and Harderlein, S.B., 2003. Natural organic matter as reductant for chlorinated aliphatic pollutants. Environ. Sci. Technol., 37, 2714-2719.
Korom, S.F., McFarland, M. J., and Sims, R.C. 1996. Reduced sediments: a factor in the design of subsurface oxidant delivery systems. GWMR, Winter 1996, 100-105.
Kos, B. and Lestan, D., 2003. Influence of a biodegradable ([S,S]-EDDS) and nondegradable (EDTA) chelate and hydrogel modified soil water sorption capacity on Pb phytoextraction and leaching. Plant and Soil, 253, 403-411.
Kronholm, J., and Riekkola, M., 1999. Potassium persulfate as oxidant in pressurized hot water, Environ. Sci. Technol., 33, 2095-2099.
117
Kwan, W. and Voelker, B.M., 2003. Rates of hydroxyl radical generation and organic compound oxidation in mineral-catalyzed Fenton-like systems. Environ. Sci. Technol., 37, 1150-1158.
Lee, W. and Batchelor, B., 2003. Reductive capacity of natural reductants. Environ. Sci. Technol., 37, 535-541.
Levenspiel, O. 1999. “Chemical reaction engineering (3rd Edition)”. John Wiley & Sons, Inc., New York.
Li, X.D., Schwartz, F.W., 2004a. DNAPL remediation with in situ chemical oxidation using potassium permanganate part I. Mineralogy of Mn oxide and its dissolution in organic acids. J. Contam. Hydrol. 68 (1–2), 39– 53.
Li, X.D., Schwartz, F.W., 2004b. DNAPL remediation with in situ chemical oxidation using potassium permanganate. II. Increasing removal efficiency by dissolving Mn oxide precipitates. J. Contam. Hydrol. 68 (3–4), 269– 287.
Liang, C., Bruell, C.J., Marley, M.C., and Sperry, K.L., 2004. Persulfate oxidation for in situ remediation of TCE. I and II, Chemosphere, 55, 1225-1233.
Liang, C.J., Bruell, C.J., Marley, M.C., and Sperry, K.L., 2003. Thermally activated persulfate oxidation of trichloroethylene (TCE) and 1,1,1-trichloroethane (TCA) in aqueous systems and soil slurries, Soil Sediment Contam., 12,(2), 207-228.
Lin, S.-S. and Gurol, M., 1998. Catalytic decomposition of hydrogen peroxide on iron oxide: kinetics, mechanism, and implication. Environ. Sci. Technol., 32, 1417-1423.
Luthy, R.G., Aiken, G.R., Brusseau, M.L., Cunningham, S.D., Gschwend, P.M., Pignatello, J.J., Reinhard, M., Trainina, S.J., Weber, W.J., and Westall, J.C., 1997. Sequestration of hydrophobic organic contaminants by geosorbents. Environmental Science and Technology, 31, 3341-3347.
MacKinnon, L.K. and Thomson, N.R., 2002. Laboratory-scale in situ chemical oxidation of a perchloroethylene pool using permanganate. J. Contam. Hydrol., 56, 49-74.
Mayer, L.M., 1994. Relationships between mineral surface and organic carbon concentrations in soil and sediments. Chemical Geology, 114, 347-363.
Mayer, L.M., 1999. Extent of mineral surfaces by organic matter in marine sediments. Geochimica et Cosmochimica Acta, 63(2), 205-275.
Meers, E., Ruttens, A., Hopgood, M.J., Samson, D., and Tack., F.M.G., 2005. Comparison of EDTA and EDDS as potential soil amendments for enhanced phytoextraction of heavy metals. Chemosphere, 58, 1011-1022.
Miller, C.M. and Valentine, R., 1995. Oxidation behavior of aqueous contaminants in the presence of hydrogen peroxide and filter media. Journal of Hazardous Materials, 41, 105-116.
Miller, C.M. and Valentine, R.L., 1999. Mechanistic studies of surface catalyzed H2O2 decomposition and contaminant degradation in the presence of sand. Water Research, 33(12), 2805-2816.
118
Moore, W.A., R.C. Kroner and C.C. Ruchhoft, 1949. Dichromate reflux method for determination of oxygen consumed: Effectiveness in oxidation of organic compounds. Analytical Chemistry, 21(8), 953-957.
Moore, W. A., F. J. Ludzack, C. C. Ruchhoft, 1951. Determination of oxygen consumed values of organic wastes: A comparative study of methods. Analytical Chemistry, 29 (9), 1297-1300.
Mumford, K.G., 2002. Investigation of natural oxidant demand reactions in a sandy aquifer materials. Master of Applied Science Thesis, University of Waterloo.
Mumford, K.G., Thomson, N. R., and Allen-King, R.M., 2005. Bench-Scale Investigation of Permanganate Natural Oxidant Demand Kinetics. Environ. Sci. Technol., 39(8), 2835-2840.
Neamana, A., Wallerb, B., Mouéléc, F., Trolarda, F., and Bourriéa, G., 2004. Improved methods for selective dissolution of manganese oxides from soils and rocks. European Journal of Soil Science, 55 (1), 47 – 54.
Neyens, E. and Baeyens, J., 2003. A review of classic Fenton’s peroxidation as an advanced oxidation technique. Journal of Hazardous Materials, B98, 33-50.
Nyer, E. K. and Vance, D., 1999. Hydrogen peroxide treatment: the good, the bad, and the ugly. Ground Water Monitoring & Remediation. 19, 54-57.
Nicholson, A., Davis, A., and Helgen, S., 2003. Elements influencing cost allocation in the Pinal Creek aquifer, Arizona, USA. Part II: Geochemical controls on groundwater quality recovery. Environmental Forensics, 4, 271-286.
Nicholson, R.V., Gillham, R.W., and Reardon, E.J. 1988. Pyrite oxidation in carbonate-buffered solution: 1. experimental kinetics. Geochim. Cosmochim. ACTA 54, 395-402.
Pardieck, D.L., Bouwer, E.J., and Stone, A.T., 1992. Hydrogen peroxide use to increase oxidant capacity for in situ bioremediation of contaminated soils and aquifers: A review. J. Contam. Hydrol., 9, 221-242.
Pedersen, J.K., Bjerg, P.L., and Cheristensen, T.H., 1991. Correlation of nitrate profiles with groundwater and sediment characteristics in a shallow sandy aquifer. J. Hydrol., 124. 263-277.
Petigara, B. R., Blough, N.V., and Mignerey, A., 2002. Mechanisms of hydrogen peroxide decomposition in soils. Environ. Sci. Technol., 36, 639-645.
Pignatello, J.J., 1998. Soil organic matter as a nanoporous sorbent of organic pollutants. Advances in Colloid and Interface Science, 76-77, 445-467.
Pignatello, J.J., Oliveros, E., and MacKay, Allison. 2006. Advanced oxidation processes for organic contaminated destruction based on the Fenton reaction and related chemistry. Critical Reviews in Environmental Science and Technology, 36, 1-84.

119
Powell, R.M., Callaway, R.W., Michalowski, J.T., Vandegrift, S.A., and White, M.V., 1988. Comparison of methods to determine oxygen demand for bioremediation of a fuel contamination of a fuel contaminated aquifer. Intern. J. Environ. Anal. Chem., Vol. 34, 253-263.
Ramo, J., 2003. “Hydrogen peroxide-metals-chelating agents: interactions and analytical techniques”, Oulu university Press, Oulu.
Ravikumar, J.X.and Gurol, M.D., 1994. Chemical Oxidation of Chlorinated Organics by Hydrogen Peroxide in the Presence of Sand. Environ. Sci. Technol., Vol. 28, No. 3, 394-400.
Reardon, E. D., 2006. Personal communication.
Rhoades, J.D., 1982. Cation exchange capacity. pp. 149 –157. In A L. Page (ed.), Methods of Soil Analysis, Agron., No.9, Part 2: Chemical and Mineralogical Properties. Am. Soc. Agron., Madison, WI, USA.
Schnarr, M., Truax, C., Farquhar, G., Hood, E., Gonullu, T., and Stickney, B., 1998. Laboratory and controlled field experiments using potassium permanganate to remediate trichloroethylene and perchloroethylene DNAPLs in porous media. J. Contam. Hydrol., 29, 205-224.
Schumb, W.C., Satterfield, C.N., Wentworth, R.L., 1955. Hydrogen Peroxide, ACS Monograph 128, Reinhold Publishing Co., New York, 759 pp.
Scott, D.T., McKnight, D.M., Blunt-Harris, E.L., Kolesar, S.E., and Lovley, D.R., 1998. Quinone moieties act as electron acceptors in the reduction of humic substances by humic-reducing microorganisms. Environ. Sci. Technol., 32, 2984-2989.
Seol, Y., Zhang, H., and Schwartz, F.W., 2003. A review of in situ chemical oxidation and heterogeneity. Environmental & Engineering Geoscience, Vol. IX, No.1, 37-49.
Siegrist, R.L., Urynowicz, M.A., West, O.R., 1999. An overview of in situ chemical oxidation technology features and applications. Proceedings of the Conference on Abiotic In-Situ Technologies for Groundwater Remediation, Aug.31-Sep.2, 1999, Dallas, Texas, USA.
Siegrist, R. L., Urynowicz, M.A, West, O.R., Crimi, M.L., Lowe, K.S., 2001. Principles and practices of in situ chemical oxidation using permanganate. Battelle Press, Columbus, OH, USA.
Song, J., Peng, P., and Huang, W., 2002. Black carbon and kerogen in soils and sediments. 1. quantification and characterization. Environ. Sci. Technol., 36, 3960-3967.
Sparks, D.L., 1989. Kinetics of soil chemical processes. Academic Press, New York.
Stewart, R., 1964. Oxidation mechanisms: application to organic chemistry. W.A.Benjamin, Inc., New York, USA.
Stewart, R., 1965. Oxidation by permanganate. In: Wiberg, K.B. (ed.), Oxidation in Organic Chemistry, Part A. Academy Press, New York.
Stumm, W., 1992. Chemistry of the solid-water interface, John Wiley & Sons, New York.
Stumm, W. and Morgan, J.J., 1995. Aquatic chemistry: chemical equilibria and rates in natural waters (Third Edition). John Wiley & Sons Inc., New York.
120
Sun, Y., Pignatello, J.J., 1992. Chemical treatment of pesticide wastes. Evaluation of Fe(III) chelates for catalytic hydrogen peroxide oxidation of 2,4-D at circumneutral pH. J. Agr. Food Chem., 40(2), 332-337.
Tandy, S., Bossart, K., Mueller, R., Ritschel, J., Hauser, L., Schulin, R., and Nowack, B., 2004. Extraction of heavy metals from soils using biodegradable chelating agents. Environ. Sci. Technol., 38, 937-944.
Tandy, S.; Ammann, A., Schulin, R., Nowack, B., 2006a. Biodegradation and speciation of residual SS-ethylenediaminedisuccinic acid (EDDS) in soil solution left after soil washing. Environmental Pollution.142(2), 191-199.
Tandy, S., Schulin, R., and Nowack, B., 2006b. Uptake of metals during chelant-assisted phytoextraction with EDDS related to the solubilized metal concentration. Environ. Sci. Technol., 40, 2753-2758.
Teel, A.L., Warberg, C.R., Atkinson, D.A., and Watts, R.J., 2001. Comparison of mineral and soluble iron Fenton’s catalysts for the treatment of trichloroethylene. Water Research, 35(4), 977-984.
Tucker, C.S., 1984. Potassium permanganate demand of pond waters. Progressive Fish-Culturist, 46(1), 24-28.
Urynowicz, M.A., and Siegrist, R.L., 2005. Interphase mass transfer during chemical oxidation of TCE DNAPL in an aqueous system. J. Contam. Hydrol., 80, 93-106.
Valentine, R. L., and Wang, H. C. A., 1998. Iron oxide surface catalyzed oxidation of quinoline by hydrogen peroxide. J. Environ. Eng., 124(1), 31–38.
Vandevivere, P. C., Saveyn, H., Verstraete, W., Feijtel, T.C., and Schowanek, D. R., 2001. Biodegradation of metal-[S,S]-EDDS complexes. Environ. Sci. Technol., 35, 1765-1770.
Verschuren, K. 1983. Handbook of Environmental Data on Organic Chemicals, Second Edition. Van Nostrand Reinhold, New York
Voelker, B. M. and Sulzberger, B., 1996. Effects of fulvic acid on Fe(II) oxidation by hydrogen peroxide. Environ. Sci. Technol., 30, 1106-1114.
Vogt, C., Alfreider, A., Lorbeer, H., Hoffmann, D., Wuensche, L., Babel, W., 2004. Bioremediation of chlorobenzene-contaminated ground water in an in situ reactor mediated by hydrogen peroxide. J. Contam. Hydrol., 68, 121-141.
Waldemer, R.H. and Tratnyek, P.G., 2006. Kinetics of Contaminant Degradation by Permanganate. Environ. Sci. Technol., 40(3), 1055 –1061.
Watts, R.J., Udell, M.D., Rauch, P.A., & Leung, S.W., 1990. Treatment of pentachlorophenol-contaminated soils using Fenton’s reagent. Hazardous Waste Hazardous Materials, 7(4), 335-345.
Watts, R.J., Borrenberg, B.C., Hess, T.F., Jensen, M.D., & Teel, A.L. 1999a. Role of reductants in the enhanced desorption and transformation of chloroaliphatic compounds by modified Fenton’s reactions. Environ. Sci. Technol., 33, 3432-3437.

121
Watts, R.J., Foget, M.K., Kong, S.H., and Teel., A.L., 1999b. Hydrogen peroxide decomposition in model subsurface systems. Journal of Hazardous Materials, B69, 229-243.
Watts, R.J., Udell, M. D., Kong, S., and Leung, S. W., 1999c. Fenton-like soil remediation catalyzed by naturally occurring iron minerals. Environmental Engineering Science, v.16 (1), 93 - 102.
Watts, R. J. and Teel, A.L., 2005. Chemistry of modified Fenton’s reagent (catalyzed H2O2 propagation-CHP) for in situ soil and groundwater remediation. Journal of Environmental Engineering, 131(4), 612-622.
Watts, R. J. and Teel., A.L., 2006. Treatment of contaminated soils and groundwater using ISCO. Practice Periodical of Hazardous, Toxic, and Radioactive Waste Management. 10(1), 2-9.
Water Science and Technology Board (WSTC), 2004. Contaminants in the subsurface : source zone assessment and remediation, Division on Earth and Life Studies, National Research Council of the National Academies, The National Academic Press, Washington, D.C., USA.
Weber, W.J., Huang, W., and Leboeuf, E.J., 1998. A three-domain model for sorption and desorption of organic contaminants by soils and sediments. In “Mineral-Water Interfacial Reactions, Sparks, D.L., and Grundl, T.J., Eds.; American Chemical Society: Washington DC.
Wilson, A.D., 1955. A new method for the determination of ferrous iron in rocks and minerals. Bull. Geol. Surv. G.B., 9:56–58.
Yeh, C.K.-J., Kao, Y.-A., and Cheng, C.-P., 2002. Oxidation of chlorophenols in soil at natural pH by catalyzed hydrogen peroxide: the effect of soil organic matter. Chemosphere, 46, 67-73.
Zhou, Y., 1994. Condition control for determination of measuring permanganate index (in Chinese). China Environmental Monitoring, 10(2), 36-37.
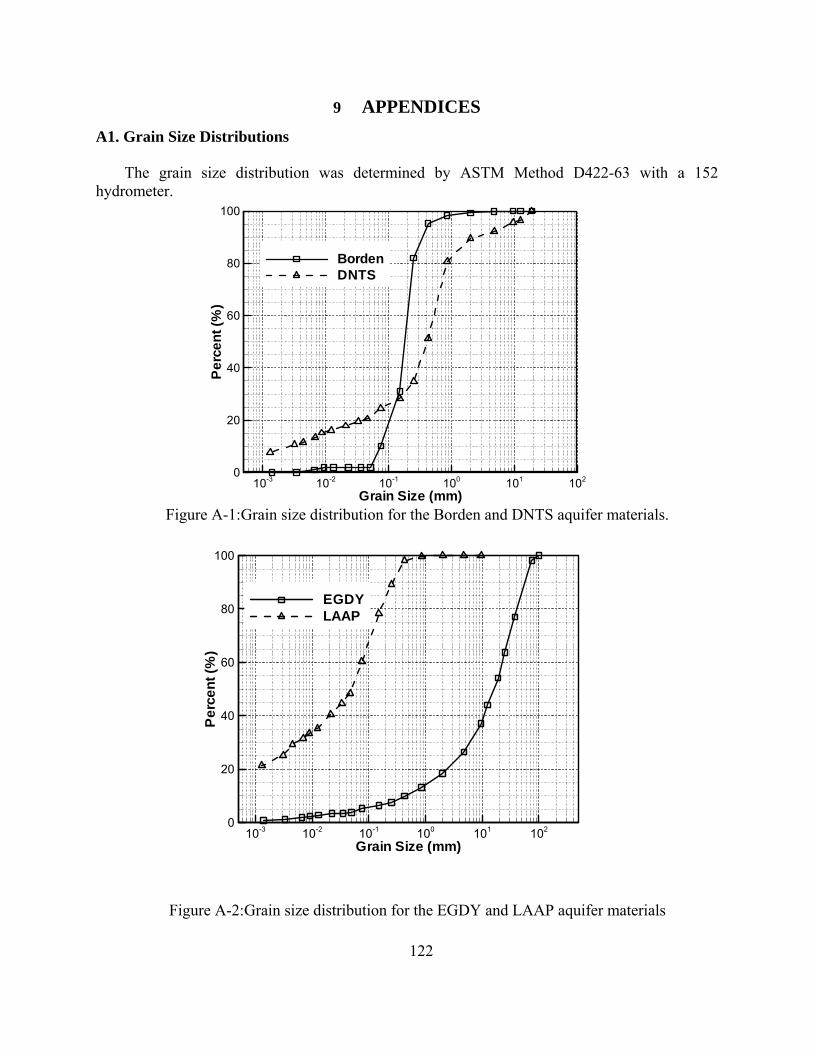
9 APPENDICES A1. Grain Size Distributions
Grain Size (mm)
Per
cent
(%)
10-3 10-2 10-1 100 101 1020
20
40
60
80
100
BordenDNTS
The grain size distribution was determined by ASTM Method D422-63 with a 152 hydrometer.
Figure A-1: Grain size distribution for the Borden and DNTS aquifer materials.
100
EGDYLAAP80
Per
cent
(%)
60
40
20
0
122
Grain Size (mm)10-3 10-2 10-1 100 101 102
Figure A-2: Grain size distribution for the EGDY and LAAP aquifer materials
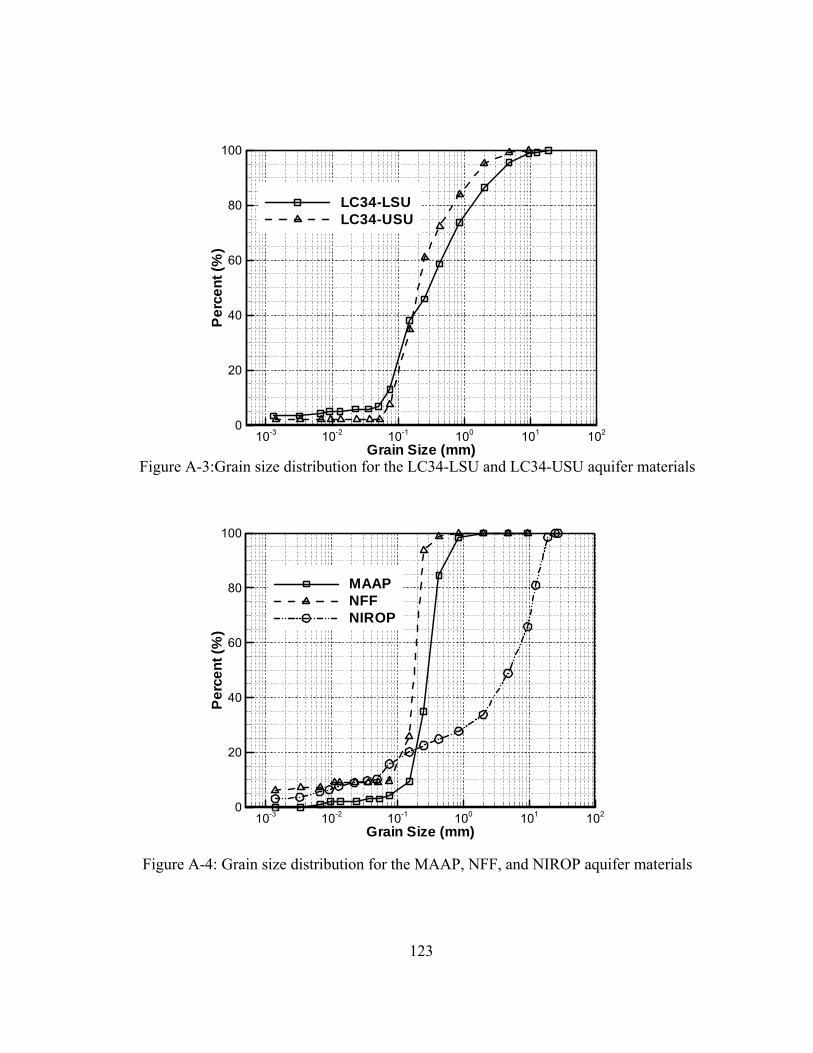
Grain Size (mm)
Per
cent
(%)
10-3 10-2 10-1 100 101 1020
20
40
60
80
100
LC34-LSULC34-USU
Figure A-3: Grain size distribution for the LC34-LSU and LC34-USU aquifer materials
Grain Size (mm)
Per
cent
(%)
10-3 10-2 10-1 100 101 1020
20
40
60
80
100
MAAPNFFNIROP
Figure A-4: Grain size distribution for the MAAP, NFF, and NIROP aquifer materials
123
124
A2. Interpretation of XRD Diffractograms
Using a computerized search, each sample’s diffractogram was compared to the powder
diffraction file maintained by the International Centre for Diffraction Data (ICDD). The software
searches for all minerals composed of elements chosen by the user and then overlays the
reference diffractogram onto the sample diffractogram. Several different sets of elements were
used as outlined below. Elements that are underlined and in bold font are “must contain”
elements for the reference file search. Elements in normal type are “may contain” elements.
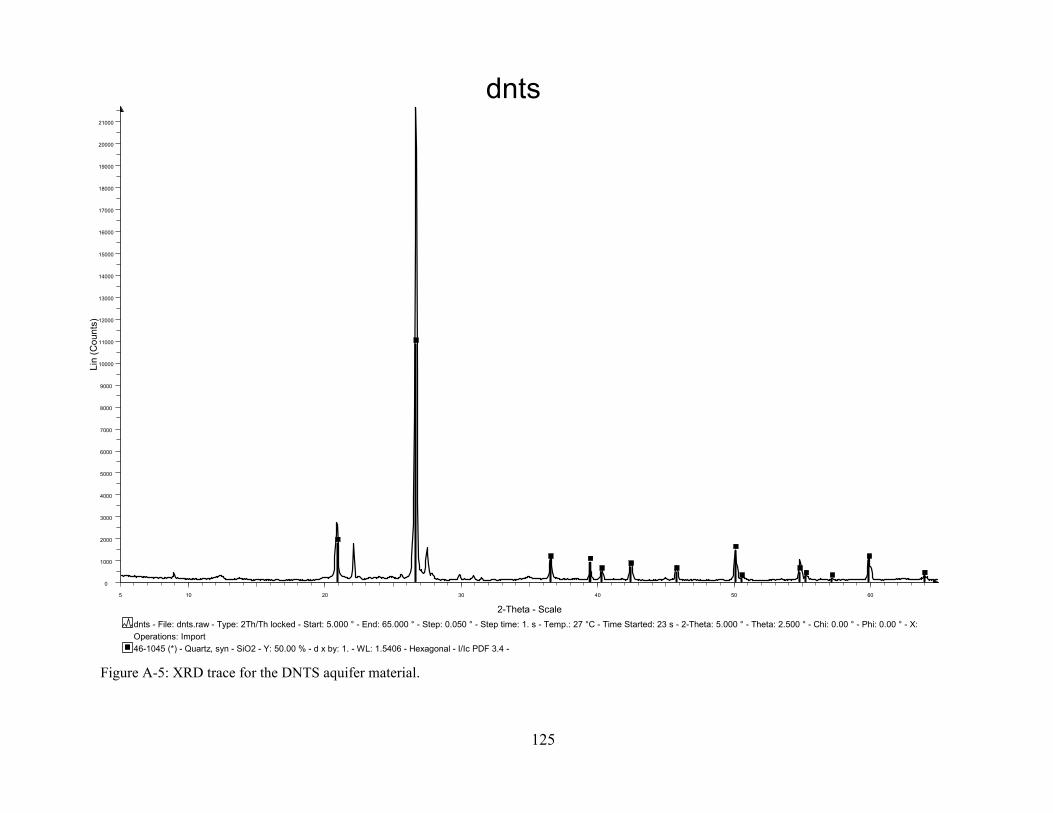
dnts
46-1045 (*) - Quartz, syn - SiO2 - Y: 50.00 % - d x by: 1. - WL: 1.5406 - Hexagonal - I/Ic PDF 3.4 - Operations: Importdnts - File: dnts.raw - Type: 2Th/Th locked - Start: 5.000 ° - End: 65.000 ° - Step: 0.050 ° - Step time: 1. s - Temp.: 27 °C - Time Started: 23 s - 2-Theta: 5.000 ° - Theta: 2.500 ° - Chi: 0.00 ° - Phi: 0.00 ° - X:
Lin
(Cou
nts)
0
1000
2000
3000
4000
5000
6000
7000
8000
9000
10000
11000
12000
13000
14000
15000
16000
17000
18000
19000
20000
21000
2-Theta - Scale5 10 20 30 40 50 60
Figure A-5: XRD trace for the DNTS aquifer material.
125

laap
46-1045 (*) - Quartz, syn - SiO2 - Y: 50.00 % - d x by: 1. - WL: 1.5406 - Hexagonal - I/Ic PDF 3.4 - Operations: Importlaap - File: laap.raw - Type: 2Th/Th locked - Start: 5.000 ° - End: 65.000 ° - Step: 0.050 ° - Step time: 1. s - Temp.: 27 °C - Time Started: 26 s - 2-Theta: 5.000 ° - Thet
Lin (Counts)
0
1000
2000
3000
4000
5000
6000
7000
8000
9000
10000
11000
12000
13000
14000
2-Theta - Scale5 10 20 30 40 50
Figure A-6: XRD trace for the LAAP aquifer material
126

lsu
41-1475 (*) - Aragonite - CaCO3 - Y: 50.00 % - d x by: 1. - WL: 1.5406 - Orthorhombic - I/Ic PDF 1. - S-Q 48.3 %46-1045 (*) - Quartz, syn - SiO2 - Y: 50.00 % - d x by: 1. - WL: 1.5406 - Hexagonal - I/Ic PDF 3.4 - S-Q 14.2 %05-0586 (*) - Calcite, syn - CaCO3 - Y: 50.00 % - d x by: 1. - WL: 1.5406 - Rhombohedral - I/Ic PDF 2. - S-Q 24.2 %04-0787 (*) - Aluminum, syn [NR] - Al - Y: 50.00 % - d x by: 1. - WL: 1.5406 - Cubic - I/Ic PDF 3.6 - S-Q 13.4 %Operations: X Offset -0.083 | X Offset -0.010 | X Offset -0.115 | X Offset -0.052 | X Offset -0.104 | Importlsu - File: lsu.raw - Type: 2Th/Th locked - Start: 5.000 ° - End: 60.000 ° - Step: 0.050 ° - Step time: 1. s - Temp.: 27 °C - Time Started: 22 s - 2-Theta: 5.000 ° - Theta:
Lin (Counts)
0
1000
2000
3000
4000
5000
6000
7000
8000
9000
10000
11000
2-Theta - Scale5 10 20 30 40
Figure A-7: XRD trace for the LC34-LSU aquifer material.
127
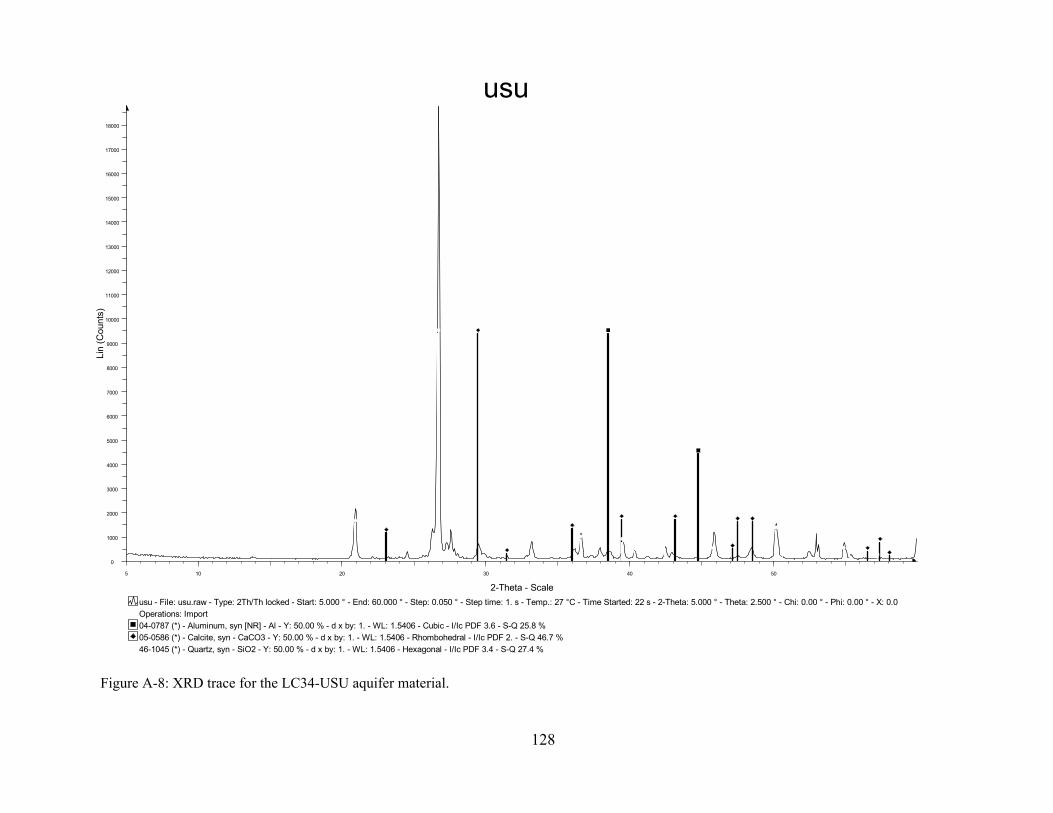
usu
46-1045 (*) - Quartz, syn - SiO2 - Y: 50.00 % - d x by: 1. - WL: 1.5406 - Hexagonal - I/Ic PDF 3.4 - S-Q 27.4 %05-0586 (*) - Calcite, syn - CaCO3 - Y: 50.00 % - d x by: 1. - WL: 1.5406 - Rhombohedral - I/Ic PDF 2. - S-Q 46.7 %04-0787 (*) - Aluminum, syn [NR] - Al - Y: 50.00 % - d x by: 1. - WL: 1.5406 - Cubic - I/Ic PDF 3.6 - S-Q 25.8 %Operations: Importusu - File: usu.raw - Type: 2Th/Th locked - Start: 5.000 ° - End: 60.000 ° - Step: 0.050 ° - Step time: 1. s - Temp.: 27 °C - Time Started: 22 s - 2-Theta: 5.000 ° - Theta: 2.500 ° - Chi: 0.00 ° - Phi: 0.00 ° - X: 0.0
Li
n (C
ount
s)
0
1000
2000
3000
4000
5000
6000
7000
8000
9000
10000
11000
12000
13000
14000
15000
16000
17000
18000
2-Theta - Scale5 10 20 30 40 50
6
Figure A-8: XRD trace for the LC34-USU aquifer material.
128
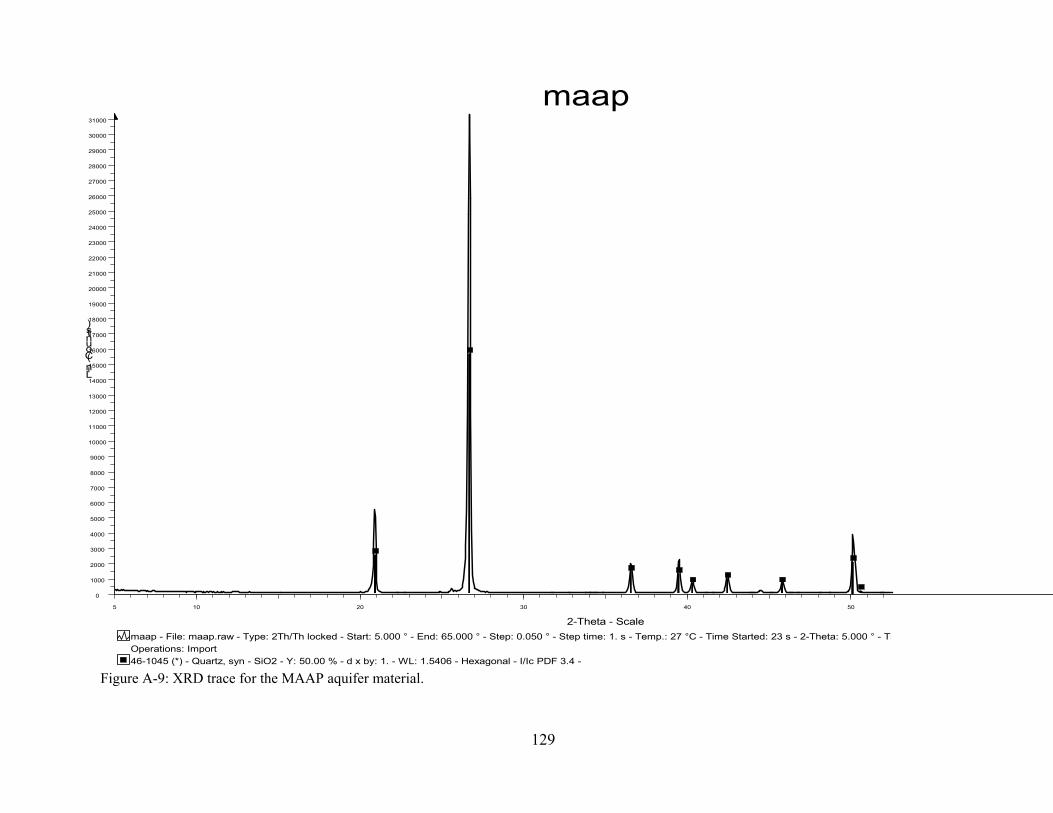
maap
46-1045 (*) - Quartz, syn - SiO2 - Y: 50.00 % - d x by: 1. - WL: 1.5406 - Hexagonal - I/Ic PDF 3.4 - Operations: Importmaap - File: maap.raw - Type: 2Th/Th locked - Start: 5.000 ° - End: 65.000 ° - Step: 0.050 ° - Step time: 1. s - Temp.: 27 °C - Time Started: 23 s - 2-Theta: 5.000 ° - Th
Lin (Counts)
0
1000
2000
3000
4000
5000
6000
7000
8000
9000
10000
11000
12000
13000
14000
15000
16000
17000
18000
19000
20000
21000
22000
23000
24000
25000
26000
27000
28000
29000
30000
31000
2-Theta - Scale5 10 20 30 40 50
Figure A-9: XRD trace for the MAAP aquifer material.
129
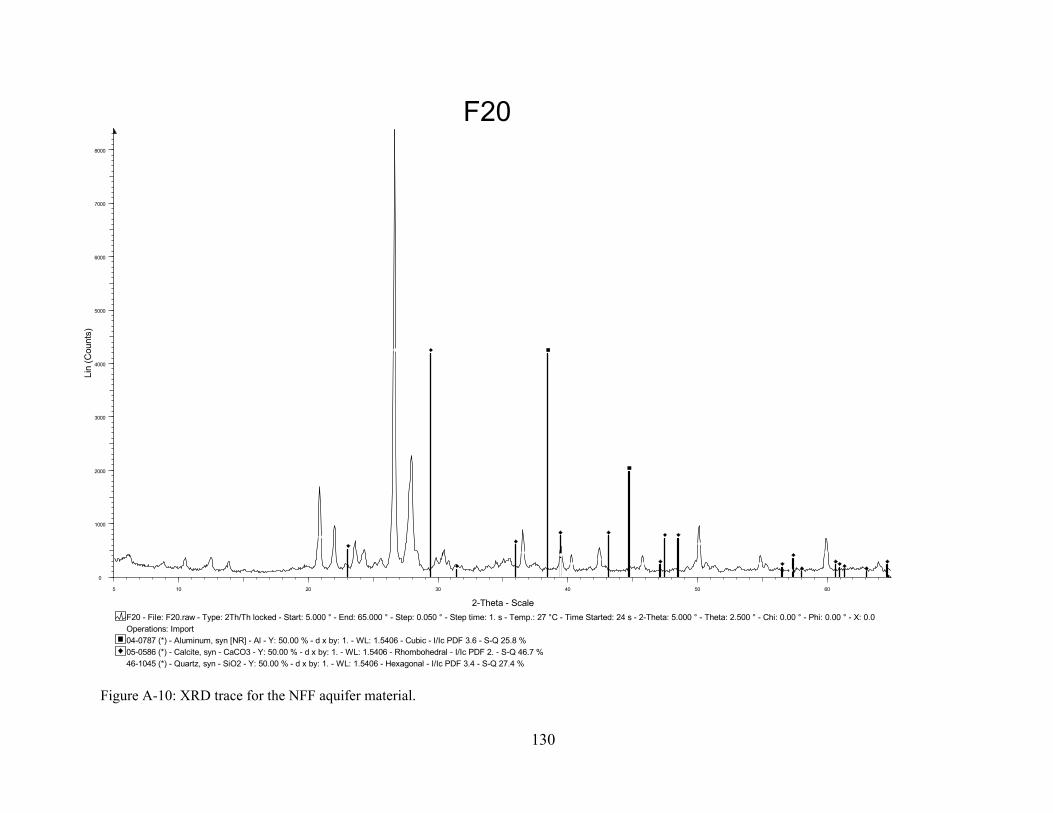
F20
46-1045 (*) - Quartz, syn - SiO2 - Y: 50.00 % - d x by: 1. - WL: 1.5406 - Hexagonal - I/Ic PDF 3.4 - S-Q 27.4 %05-0586 (*) - Calcite, syn - CaCO3 - Y: 50.00 % - d x by: 1. - WL: 1.5406 - Rhombohedral - I/Ic PDF 2. - S-Q 46.7 %04-0787 (*) - Aluminum, syn [NR] - Al - Y: 50.00 % - d x by: 1. - WL: 1.5406 - Cubic - I/Ic PDF 3.6 - S-Q 25.8 %Operations: ImportF20 - File: F20.raw - Type: 2Th/Th locked - Start: 5.000 ° - End: 65.000 ° - Step: 0.050 ° - Step time: 1. s - Temp.: 27 °C - Time Started: 24 s - 2-Theta: 5.000 ° - Theta: 2.500 ° - Chi: 0.00 ° - Phi: 0.00 ° - X: 0.0
Lin
(Cou
nts)
0
1000
2000
3000
4000
5000
6000
7000
8000
2-Theta - Scale5 10 20 30 40 50 60
Figure A-10: XRD trace for the NFF aquifer material.
130

nirop
46-1045 (*) - Quartz, syn - SiO2 - Y: 50.00 % - d x by: 1. - WL: 1.5406 - Hexagonal - I/Ic PDF 3.4 - S-Q 27.4 %05-0586 (*) - Calcite, syn - CaCO3 - Y: 50.00 % - d x by: 1. - WL: 1.5406 - Rhombohedral - I/Ic PDF 2. - S-Q 46.7 %04-0787 (*) - Aluminum, syn [NR] - Al - Y: 50.00 % - d x by: 1. - WL: 1.5406 - Cubic - I/Ic PDF 3.6 - S-Q 25.8 %Operations: X Offset 0.146 | X Offset 0.250 | Importnirop - File: nirop.raw - Type: 2Th/Th locked - Start: 5.000 ° - End: 65.000 ° - Step: 0.050 ° - Step time: 1. s - Temp.: 27 °C - Time Started: 24 s - 2-Theta: 5.000 ° - Theta: 2.500 ° - Chi: 0.00 ° - Phi: 0.00 ° - X: 0.
Lin
(Cou
nts)
0
1000
2000
3000
4000
5000
6000
7000
8000
9000
2-Theta - Scale6 10 20 30 40 50 60
131
Figure A-11: XRD trace for the NIROP aquifer material.

A3. Air Drying Investigation
Average reduction capacity results from the air drying investigation (all values in g KMnO4/kg). Five replicates were used for each testing method. It needs to be pointed out that the dichromate COD and 7-day permanganate NOD values for each air-dried aquifer material listed in Table A-1 might be different from those in other parts of this report. It is likely because the air-dried sub-samples used in other parts of this report were randomly taken from the homogenized bulk aquifer materials, as is not the case for the investigation conducted here.
Table A-1: Results from air drying investigation. Method
Dichormate - COD 3.87 ± 1.32 6.20 ± 0.68 4.41 ± 2.86 13.87 ± 1.99 58.09 ± 1.33 17.55 ± 2.15
Permanganate - COD 4.86 ± 1.21 2.10 ± 0.68 2.52 ± 1.38 2.14 ± 1.33 62.03 ± 3.99 9.17 ± 0.57
Permanganate - NOD(0.375 g/mL) 1.33 ± 0.27 0.97 ± - 0.35 ± 0.20 1.73 ± 0.28 6.38 ± 1.61 2.29 ± 0.41(0.750 g/mL) 1.30 ± 0.54 0.98 ± - 0.13 ± 0.06 1.77 ± 0.22 - -
Dichormate - COD 4.97 ± 0.80 - - 11.06 ± 1.09 61.87 ± 2.98 -
Permanganate - COD 5.34 ± 1.66 - 3.12 ± 1.22 1.18 ± 0.48 - -
Permanganate - NOD(0.375 g/mL) 2.00 ± 0.07 - 0.65 ± 0.51 1.29 ± 0.35 - -(0.750 g/mL) 1.85 ± 0.13 - 0.11 ± 0.08 1.44 ± 0.10 - -
Dichormate - COD 5.00 ± 1.22 6.36 ± 0.44 6.72 ± 5.66 11.84 ± 0.77 68.22 ± 0.86 18.27 ± 2.20
Permanganate - COD 5.36 ± 1.18 - 4.29 ± 1.52 1.23 ± 0.49 - 8.34 ± 1.14
Permanganate - NOD(0.375 g/mL) 1.75 ± 0.24 1.16 ± - 0.22 ± 0.08 1.42 ± 0.01 14.19 ± 2.45 2.51 ± 0.24(0.750 g/mL) 1.67 ± 0.12 1.49 ± - 0.20 ± 0.09 1.26 ± 0.21 - -
N2 d
ried/
air e
xpos
edN
2 drie
dai
r drie
d
DNTS NAS-DallasLAAP MAAP Borden NFF
132