improved schedule analysis considering rework impact and
TRANSCRIPT

Improved Schedule Analysis Considering Rework Impact
and Optimum Delay Mitigation
by
Mohamed Said
A thesis
presented to the University of Waterloo
in fulfillment of the
thesis requirement for the degree of
Master of Applied Science
in
Civil Engineering
Waterloo, Ontario, Canada, 2009
© Mohamed Said 2009

ii
AUTHOR'S DECLARATION
I hereby declare that I am the sole author of this thesis. This is a true copy of the thesis,
including any required final revisions, as accepted by my examiners.
I understand that my thesis may be made electronically available to the public.
Mohamed Said

iii
ABSTRACT
Rework has been a primary cause of cost and schedule overruns in the construction of
heavy industrial projects such as those related to oil and gas. It has been reported that
the direct cost of rework is about 5% of total construction costs. Several research
studies have analyzed the causes and effects of rework in construction projects, but
almost no research exists to support decisions with respect of an effective strategy for
mitigating the effects of rework on the cost and schedule of the project. This research
introduces a new schedule analysis mechanism that considers the impact of rework on
project delays and then optimises corrective actions for mitigating those delays. The
proposed mechanism considers rework from three perspectives: (1) a schedule
representation of the magnitude of rework as a negative percentage completed with
respect to the activities affected, as documented on a specific schedule date, (2) a day-
by-day delay analysis for quantifying and apportioning project delays among the parties
responsible, and (3) an optimization mechanism for determining the best mitigation
strategy for recovering rework at a minimum additional cost. The proposed mechanism
can represent and mitigate rework caused by both the Owner and the Contractor. The
proposed schedule analysis mechanism has been applied to a case study in order to
demonstrate its usefulness and applicability. The resulting mechanism offers a
quantitative approach to the consideration of rework in delay analysis and the
optimization of corrective action, which are important aspects of effective project control.

iv
ACKNOWLEDGEMENTS
I would like to express my sincere appreciation and gratitude to my supervisor, Dr.
Tarek Hegazy, for his invaluable guidance, patience, kindness, and respect. I am deeply
impressed with his wealth of knowledge, excellent teaching, and dedication to academic
research.
I would also like to express my sincerest gratitude to my family, whose love and support
have made this work possible.
Above all, praise is to God.

v
DEDICATION
To My Parents

vi
TABLE OF CONTENTS
LIST OF FIGURES ......................................................................................................... ix
LIST OF TABLES .......................................................................................................... xii
CHAPTER 1 .................................................................................................................... 1
INTRODUCTION ............................................................................................................. 1
1.1 Construction Rework .......................................................................................... 1
1.2 Research Motivation ............................................................................................... 3
1.3 Research Scope and Objectives ............................................................................ 5
1.4 Research Methodology .......................................................................................... 6
1.5 Organization of the Thesis ..................................................................................... 6
CHAPTER 2 .................................................................................................................... 9
LITERATURE REVIEW ................................................................................................... 9
2.1 Introduction ............................................................................................................ 9
2.2 Research on Construction Rework ......................................................................... 9
2.2.1 Root Causes of Rework ................................................................................. 10
2.2.2 Impact of Rework on Project Performance ..................................................... 17
2.2.3 Rework Indexes ............................................................................................. 19
2.3 Recording and Analysis of Construction Progress ............................................... 20
2.3.1 Recording Site Events .................................................................................... 21
2.3.2 Schedule Analysis Techniques ...................................................................... 25
2.3.3 Latest Development: Daily Windows Analysis ............................................... 28
2.4 Conclusion ........................................................................................................... 32
CHAPTER 3 .................................................................................................................. 34
PROPOSED REWORK REPRESENTATION ............................................................... 34
3.1 Introduction .......................................................................................................... 34
3.2 Typical Schedule Representation ......................................................................... 34
3.3 New Representation of Rework ............................................................................ 37
vii
3.4 The Effect of Rework on Construction Schedules ................................................ 39
3.4.1 Case Involving Rework for a Non-Critical Activity .......................................... 39
3.4.2 Case Involving Rework for a Critical Activity .................................................. 40
3.4.3 Case Involving Rework and Resource Limits ................................................. 42
3.4.4 General Case Involving Rework ..................................................................... 44
3.5 Conclusion ........................................................................................................... 47
CHAPTER 4 .................................................................................................................. 48
SCHEDULE ANALYSIS CONSIDERING ...................................................................... 48
REWORK, DELAY, AND ACCELERATION .................................................................. 48
4.1 Introduction .......................................................................................................... 48
4.2 Rework Mitigation Strategies ................................................................................ 48
4.3 Utilizing Existing Schedule Analysis Tools ........................................................... 50
4.2.1 Analysis Using the Traditional Daily Windows Analysis ................................. 52
4.3.2 Analysis Considering Resource Over-Allocation ............................................ 54
4.3 Schedule Analysis Considering Rework and Acceleratio ..................................... 56
4.4 Analysis of Rework Due to Multiple Parties .......................................................... 63
4.4 Detailed Schedule Analysis Procedure ................................................................ 67
4.5 Conclusion ........................................................................................................... 71
CHAPTER 5 .................................................................................................................. 72
PROTOTYPE AND CASE STUDY ................................................................................ 72
5.1 Introduction .......................................................................................................... 72
5.2 Case Study Implementation ................................................................................. 72
Activity Number and Name ..................................................................................... 73
Sequence ................................................................................................................ 73
5.2.1 Baseline Schedule ......................................................................................... 73
5.2.2 Actual Progress Events .................................................................................. 76
5.2.3 The Challenge of Representing Rework ........................................................ 77
5.2.4 Optimizing the Mitigation Decision ................................................................. 85
5.2.5 Discussion of Results ..................................................................................... 88

viii
5.3 Conclusion ........................................................................................................... 89
CHAPTER 6 .................................................................................................................. 90
CONCLUSION ............................................................................................................... 90
6.1 Conclusion ........................................................................................................... 90
6.2 Future Research and Development ...................................................................... 91
REFERENCES .............................................................................................................. 94

ix
LIST OF FIGURES
Fig. 2.1: Fishbone Classification Model of the Causes Of Rework ................................ 13
Fig. 2.2: Classification of rework causes (based on Fayek et al. 2004) ......................... 14
Fig. 2.3: Primary Rework Factors (based on Love et al. 2004) ...................................... 16
Fig. 2.4: Rework control criteria (based on Love et al. 2004) ........................................ 16
Fig. 2.5: Cost Impacts of Rework Reported In the Literature ......................................... 18
Fig. 2.6: Recording Site Data in a Bar Chart (based on Scott 1990) ............................. 22
Fig. 2.7: Representing Delays on Scheduling Software (based on Stumpf, 2000) ........ 23
Fig. 2.8: Recording Site Data Using an Intelligent Bar Chart ......................................... 24
Fig. 2.9: Bar Charts for a Small Example of Windows Analysis ..................................... 29
Fig. 2.10: Daily Windows Analysis Showing the Window for Day 3 ............................... 30
Fig. 2.11: Daily Windows Analysis Showing the Window for Day 4 ............................... 31
Fig. 2.12: Daily Windows Analysis Showing the Window for Day 5 ............................... 31
Fig. 3.1: Planned and Updated Schedules in Microsoft Project ..................................... 35
Fig. 3.2: Primavera P6 Project Schedule ....................................................................... 36
Fig. 3.3: Activity Profile Primavera 6 .............................................................................. 36
Fig. 3.4: Changing the Percentage Complete as a Result of Rework ............................ 37
Fig. 3.5: Representing Rework as Negative Progress ................................................... 38
Fig. 3.6: Simple As-Planned Construction Schedule ..................................................... 39
Fig. 3.7: Effect of Rework on a Non-Critical Activity ...................................................... 40
Fig. 3.8: Effect of rework on the Critical Path ............................................................... 41
Fig. 3.9: Resource Loading Over the Planned Schedule ............................................... 42
Fig. 3.10: Resource Over-Allocation Due to Rework ..................................................... 43
FIG. 3.11: Extension of the Project Caused By Resolving The Resource ..................... 43
Fig. 3.12: Effect of Rework on the Schedule ................................................................. 44
Fig. 3.13: Schedule with a Varity of Events, Showing Resource Over-Allocation .......... 45
Fig. 3.14: Updated Schedule with Delays to Resolve .................................................... 46
Fig. 3.15: General Case of Progress Events Including, Multi-Party Rework .................. 46
Fig. 4.1: Acceleration Strategies .................................................................................... 49
Fig. 4.2: As-Planned and As-Built Schedules for a Simple Case Study ......................... 51

x
Fig. 4.3: Traditional Daily Windows Analysis (Window for Day 4).................................. 52
Fig. 4.4: Traditional Daily Windows Analysis (Window for Day 5).................................. 53
Fig. 4.5: Traditional Daily Windows Analysis (Window for day 6) .................................. 53
Fig. 4.6: Modified Daily Windows Analysis (window of day 4) ....................................... 55
Fig. 4.7: Modified Daily Windows Analysis (Window of day 6)....................................... 55
Fig. 4.8: Schedules for a Simple Case Study that Considers Rework ........................... 57
Fig. 4.9: Updated Schedule (Window of Day 4) ............................................................. 58
Fig. 4.10: Extended Daily Windows Analysis (Window for Day 5) ................................. 59
Fig. 4.11: Modified Daily Windows Analysis (Window for Day 6) ................................... 60
Fig. 4.12: Accelerated Schedule (Window for Day 6) .................................................... 60
Fig. 4.13: Extended Daily Windows Analysis (Window for Day 10) ............................... 61
Fig. 4.14: Effect of Rework on Multiple Activities (Window for Day 10) ......................... 62
Fig. 4.15: Updated Schedule Showing Rework (Window of Day 10) ............................. 62
Fig. 4.16: Case Study with Rework Due to Multiple Parties ........................................... 64
Fig. 4.17: Daily Windows Analysis for Day 4 ................................................................. 65
Fig. 4.18: Daily Windows Analysis for Days 6 to 8 ......................................................... 66
Fig. 4.19: Day 9 Analysis with both Owner and Contractor Rework .............................. 67
Fig. 4.20: Flowchart of the Rework Analysis Process .................................................... 69
Fig. 4.21: Flowchart of the Schedule Analysis that Takes ............................................. 70
Fig. 5.1: General Project Information ............................................................................. 74
Fig. 5.2: Activities and Their Construction Methods ....................................................... 74
Fig. 5.3: Relationships among the Activities and Resulting Schedule ........................... 75
Fig. 5.4: Saving the Project Baseline Schedule ............................................................. 76
Fig. 5.5: Form for Entering Activity Progress Information on Day 6 ............................... 76
Fig. 5.6: Schedule at the End of Day 7 with the Project Duration Still 25 Days ............. 77
Fig. 5.7: Recording the Progress for Day 6, Before Rework .......................................... 77
Fig. 5.8: Updating Activity 4 on Day 6 Based on the Observed Rework ........................ 78
Fig. 5.9: Revised Schedule Showing the Rework in Activity 4 and Its Consequences .. 79
Fig. 5.10: Effect of Rework on Multiple Activities ........................................................... 80
Fig. 5.11: Updated Schedule Showing the Resource Over-Allocation ........................... 81
Fig. 5.12: Updated Schedule That considers Rework and Pacing Delays ..................... 81

xi
Fig. 5.13: Traditional Window Analysis Using One Window of 27 Days ........................ 82
Fig. 5.14: Extended Windows Analysis - Window for Day 8 Before Owner Rework ...... 83
Fig. 5.15: Window for Day 9 After Owner Rework ......................................................... 84
Fig. 5.16: Three Acceleration Options ........................................................................... 87
Fig. 5.17: Schedule Optimization Options ..................................................................... 87
Fig. 5.18: Updated Schedule after Acceleration (Activity 7) ........................................... 88
Fig. 6.1: Effect of the Timing of rework mitigation .......................................................... 92

xii
LIST OF TABLES
Table 2.1: Categorise of Deviation that Causes Rework (based Burati et al., 1992) ..... 12
Table 2.2: Causes of Rework (based on Fayek et al., 2004) ......................................... 13
Table 2.3: Rework Cost Categories Causes (based on Love et al. 2003) ..................... 15
Table 2.4: Research Related to Rework (based on Love and Edwards 2004) .............. 19
Table 2.5: Summary of Rework Indexes ........................................................................ 20
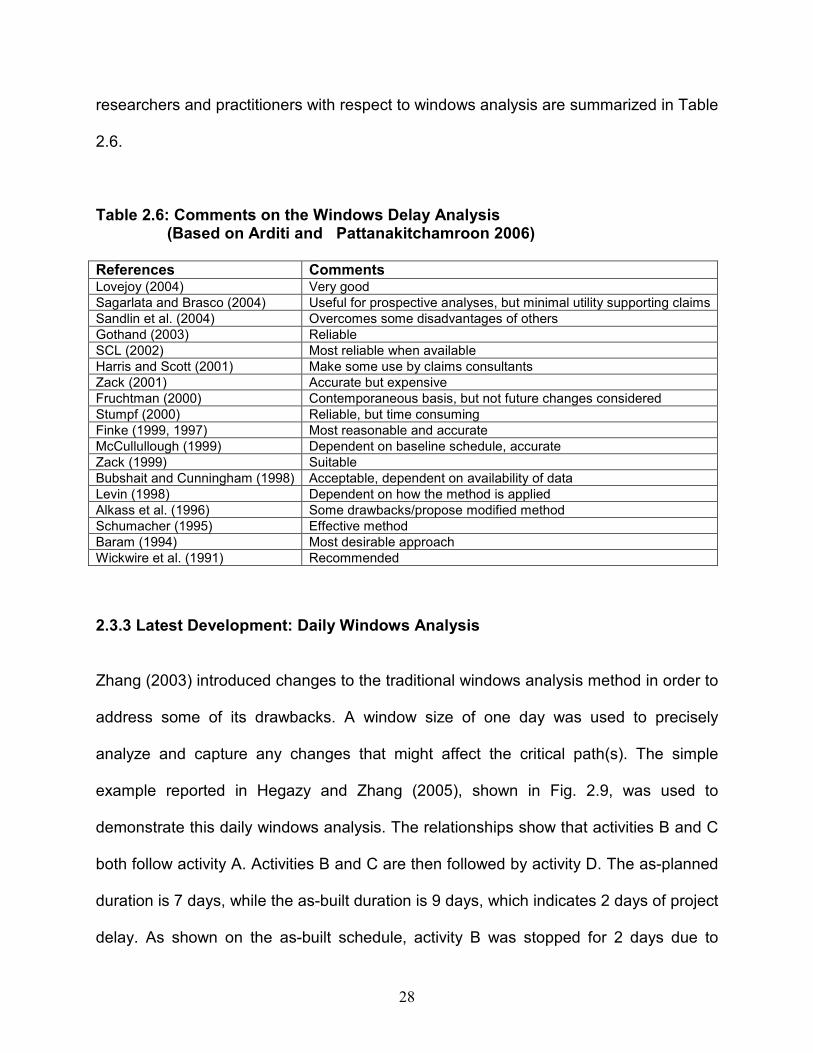
Table 2.6: Comments on the Windows Delay Analysis ................................................. 28
Table 4.1: Results of the Traditional and Modified Daily Windows Analyses ................. 56
Table 5.1: Activities and Their Logical Relationships ..................................................... 73

1
CHAPTER 1
INTRODUCTION
1.1 Construction Rework
Construction projects all over the world involve many challenges, particularly for large
industrial oil and gas projects. These challenges affect the delivery of projects within
specified deadlines and the estimated budget. Most oil and gas projects involve multiple
contractors, suppliers, and trades that interact with one another and can thus affect
progress in other areas. In such a complex environment, in which hundreds of activities
take place simultaneously, errors, omissions, and misunderstandings often cause
undesirable outcomes that must be reworked. Several research studies, therefore, have
focused on the major role that rework plays in cost and schedule overruns, particularly
for large industrial projects. According to the Construction Industry Institute (CII), the
cost of rework is estimated to be about 5 % of the total value of construction contracts
(CII, 2005). Another study conducted by the Construction Industry Development Agency
in Australia (CIDA) estimates the direct cost of rework to be 10 % or higher (Love and
Li, 2000). In a study by Love (2002a), it was reported that rework is one of the
significant factors contributing to construction delays. Burati et al. (1992) also showed
that quality problems, including rework, are responsible for more than a 12 % deviation
from the value of the contract. Hammarlund and Josephson (1991) also found such
defects to be 6 % of the production cost.
2
In the literature, the term “rework” has been used interchangeably with other terms such
as “quality deviations,” “non-conformance,” “defects,” and “quality failures.” All of these
terms indicate that a specific activity or task must be redone or reworked. As well,
several definitions of rework appear in the literature. Ashford (1992) defines rework as
“the process by which an item is made to conform to the original requirement by
completion or correction.” CIDA’s definition of rework is “doing something at least one
extra time due to non-conformance to requirements” (CIDA 1995). Another realistic
definition of rework was adopted by Love et al. (2000): “the unnecessary effort of
redoing a process or activity that was incorrectly implemented the first time.” As
distinguished from general rework, field rework has been defined as “activities in the
field that have to be done more than once in the field or activities which remove work
previously installed as part of the project” (Rogge et al 2001). A more detailed definition
of field rework has been adopted by the Construction Owners Association of Alberta
(COAA, 2001), which defines field rework as “the total direct cost of redoing work in the
field regardless of initiating cause.” COAA also clarifies that field rework does not
constitute change orders (for new work), off-site fabricator errors, or off-site modular
fabrication errors (Fayek et al. 2004).
Since rework is the act of performing a task more than once, it can occur at different
stages throughout the project life cycle. Rework can therefore occur during the design
phase or the project execution phase. The Building Research Establishment in the UK
(BRE, 1981) found that 50 % of the origin of errors in buildings occurred during the
design stage and 40 % during the construction stage. Cnuddle (1991) reported the cost

3
of non-conformance to be between 10 % and 20 % of the total project cost. It was also
found that 46 % of total deviation costs were created during the design phase,
compared with 22 % during construction. In a comprehensive study of field rework,
Fayek et al. (2003) reported the major causes as “engineering and reviews,” (55.4 %),
followed by “equipment and material” (23.5 %), while human error was found to
contribute only 18.3 %.
As indicated by the above research, rework clearly has a huge impact whether projects
can be completed within time and cost constraints. Rework also has a large general
impact on the industry as a whole. In addition to recognizing the impact of rework and
its causes, which have been extensively reported in the literature, it is important that
project managers have adequate tools not only to analyze the time and cost
implications of rework but also to generate practical plans for corrective action that is
cost effective and that can mitigate the impact of rework on the time and cost of a
project. The literature contains few studies that have proposed such tools for the
construction industry, which is therefore the objective of this research.
1.2 Research Motivation
Rework has been a primary cause of cost and schedule overruns in construction,
particularly for heavy industrial projects such as those needed to oil and gas. Because
oil and gas represents a multi-billion dollar industry, a small percentage of rework
means huge loss in investments and/or revenues. Even a minor reduction in the cost
associated with rework can translate into substantial benefit for individual projects and

4
for the industry as a whole. For this important topic, the research motivation can be
summarized as follows:
• The Contribution of rework to major increase in project time and cost overruns.
As mentioned previously, several studies such as CII (2004), have reported that
the direct costs of rework is about 5 % of total construction costs. In most cases,
the impact of rework extends beyond its direct costs. A delay in production, for
example, means not only large losses in revenue but also apply penalties, and a
detrimental effect on reputation.
• The absence of a dynamic method of measuring the effect of rework on the
project schedule.
No quantitative studies have been conducted with respect to analyzing the
impact of rework on a schedule. The existing literature on the causes has
emphasized the importance of such analysis (Hwang et al., 2009)
• The lack of detailed analysis and mitigation decision support
Almost no research exists that analyzes the responsibility for rework-related
delays and supports decisions with respect to an effective strategy for mitigating
the effects of rework on the cost and schedule of the project.

5
1.3 Research Scope and Objectives
This research introduces a new schedule analysis mechanism that considers the impact
of rework on project delays and optimises corrective actions for mitigating those delays.
The detailed research objectives are as follows:
1. Introduce a new schedule representation of the magnitude of rework as a
negative percentage completed with respect to the activities affected, as
documented on a specific date in the schedule.
2. Develop a modified daily windows delay analysis in order to quantify and
apportion among the responsible parties project delays that are caused by
rework and other progress events.
3. Examine a variety of project acceleration strategies and use an optimization
mechanism in order to determine the best acceleration strategy that recovers
rework at a minimum additional cost.
The proposed mechanism can represent and mitigate the rework caused by both the
Owner and the Contractor. The resulting mechanism can therefore be used as a tool for
optimum project control and also as a delay analysis tool.

6
1.4 Research Methodology
To achieve the research objectives, the following methodology was followed:
• Conduct a comprehensive literature review of the causes and impact of rework.
• Study existing strategies for recovering project delays through acceleration.
• Study existing schedule analysis techniques that can quantify the time and cost
implications of rework-associated delays.
• Introduce a new method of representing rework on the schedule.
• Develop an analysis procedure for calculating the impact of rework o time and
cost, as well as the impact of the acceleration strategies needed in order to
recover delays.
• Design and develop an optimization mechanism for determining the least costly
acceleration strategy that recovers the impact of the rework.
• Design and implement a modified schedule analysis approach that reads the as-
built data and apportion rework-related delays among the parties who caused the
rework.
• Present a case study for a computer prototype in order to validate the results of
the method developed.
1.5 Organization of the Thesis
The thesis consists of 5 additional chapters. Chapter 2 is a literature review of the
studies related to rework and its cause and effects in the construction industry. Chapter
7
2 also includes a review of schedule analysis techniques, which are important for
mitigating the effect of rework.
Chapter 3 begins with a brief description of the representation of a schedule in existing
commercial software. The chapter then introduces a new representation of the amount
and timing of rework and responsibility for it. Next, the application of the new
representations to specific cases is described in order to illustrate the effects of rework.
In Chapter 4, the investigation of a number of acceleration and mitigation strategies in
the construction industry is presented. These strategies are used later in the research
as a method of overcoming the effects of rework. The chapter includes a description of
the modified daily window analysis that has been developed in order to accommodate
the new rework representation for single and multiple-activity occurrences. The
development of a detailed schedule analysis procedure for considering rework events
with respect to the project schedule is explained, and its application in a case study is
described.
In Chapter 5, the implementation of the proposed analysis mechanism in a prototype
computer program is introduced. The chapter includes a description of the
demonstration of the prototype using a small industrial case study in order to determine
the practicality of the new representation and the ability of the schedule optimization
mechanism to determine the least costly acceleration strategy for mitigating the impact
of rework on the project schedule.

8
In chapter 6, a summary of the study and areas of possible future research are
presented.
9
CHAPTER 2
LITERATURE REVIEW
2.1 Introduction
Construction projects involve many challenges that jeopardize the cost, schedule and
contractual obligations associated with the project. One main source of these
challenges is rework. This chapter, therefore, provides a review of the available
construction literature concerning rework and examines previous research regarding its
root causes, its impact on project performance and indexes for categorizing it. The
chapter then presents the available research with respect to progress recording and
delay analysis techniques used in the construction industry, with the goal of helping to
quantify the impact of rework.
2.2 Research on Construction Rework
Rework is a serious problem in large construction projects, particularly industrial
projects that involve multiple contractors, suppliers, and trades. In such a complex
environment in which many activities take place simultaneously, errors, omissions, and
misunderstandings often cause undesirable outcomes that must be reworked. Rework
has therefore been defined as the effort of redoing a process or activity that was
incorrectly implemented the first time (Love, 2000). In the literature, the term “rework”
has been related to other terms such as “quality deviations” (Burati et al., 1992), “non-
conformance” (Ashford, 1992; Abdul-Rahman, 1995), “defects” (Josephson and
Hammarlund, 1999), and “quality failures” (Barber et al., 2000). Since rework can occur

10
at different stages throughout the project life cycle, the term “field rework” has been
defined by the Construction Owners Association of Alberta (COAA, 2001) as not
incorporating change orders or off-site fabrication errors.
A number of researchers have studied rework from different perspectives: its root
causes, its impact on project performance, and its categorization using a verity of
indexes. Details of each of these three research areas are highlighted in the following
subsections.
2.2.1 Root Causes of Rework Several researchers have extensively studied the causes and effects of rework (Love
and Smith, 2003; O’Conner and Tucker, 1986; CII, 1989; Davis et al., 1989; Burati et al.,
1992; Love et al., 1999a, b; Love, 2002b; Fayek et al., 2003; Love and Sohale, 2003;
Love and Edwards, 2004; Ruwanpura et al., 2003; Hwang et al., 2009). Almost all
studies have reported that rework plays a major role in cost and schedule overruns.
They have, therefore, identified the main root causes of rework as errors, omissions,
failures, damage, poor leadership, poor communication, and ineffective decision-
making.
Almost all studies have emphasized the fact that more rework originates in the design
stage than in the construction stage. The Building Research Establishment in the UK
(BRE, 1981), for example, found that 50 % of the origin of errors in buildings occurred in
the design stage and 40 % during the construction stage. Burroughs (1993) reported

11
that a major Australian Contractor had experienced rework costs amounting to 5 % of
the contract value in one of its major projects and that these costs were attributable to
poor documentation by design consultants. Since many causes of rework originate
during the design phase, effective design management has been reported as a key
factor in reducing rework (Love and Smith, 2003).
Since rework has been defined as a form of quality deviation, research with respect to
quality problems, such as the survey conducted by the National Economic Development
Office (NEDO, 1987), has reported that the main factors affecting the quality of building
projects are related to design. These design factors (affecting 46 % of total deviation
costs) include lack of coordination of the design as well as unclear and missing
documentation. In addition to design-related factors, quality is also affected by poor
workmanship (contributing to about 22 % of construction deviations). This research
confirms the findings of earlier studies on quality, such as Cusack (1992) who
suggested that projects without a quality system typically require rework that results in a
10 % increase in the cost.
One interesting study by Burati et al. (1992) involving nine industrial construction
projects, identified the causes of rework in the form of a list of deviation categories that
are result in rework, as summarized in Table 2.1.

12
Table 2.1: Categorise of Deviation that Causes Rework (based Burati et al., 1992) Deviation Category Description Construction Change Change in the method of construction
Construction Error Results of erroneous construction methods
Construction Omissions Omission of some construction activity or task
Design Error Error during design
Design Omission Omission made during design
Design Change/Construction Changes in design at the request of field/construction personnel
Design Change/ Field Changes by the designer due to unforeseen field conditions
Design change/Owner Design change initiated by Owner (Scope definition)
Design Change/Process Design change in the process, initiated by Owner/designer
Design Change/Fabrication Design change initiated or requested by fabricator or supplier
Design change/Improvement Design revisions, modifications, and improvements
Design Change/ Unknown Redesign due to an error
Operability Change Change to improve operability
Fabrication Change Change during fabrication
Fabrication Error Error during fabrication
Fabrication Omission Omission during fabrication
Transportation Change Change to the method of transportation
Transportation Error Error in the method of transportation
Transportation Omission Omission in the transportation
In other research (e.g., Ruwanpura et al., 2003; COAA, 2001; Fayek et al., 2003) the
root causes of rework have been represented in a fishbone diagram, showing all the
potential or actual causes of rework. The fishbone diagram (Fig. 2.1) consists of five
basic sources of rework, with four possible sub-sources in each of the basic sources.
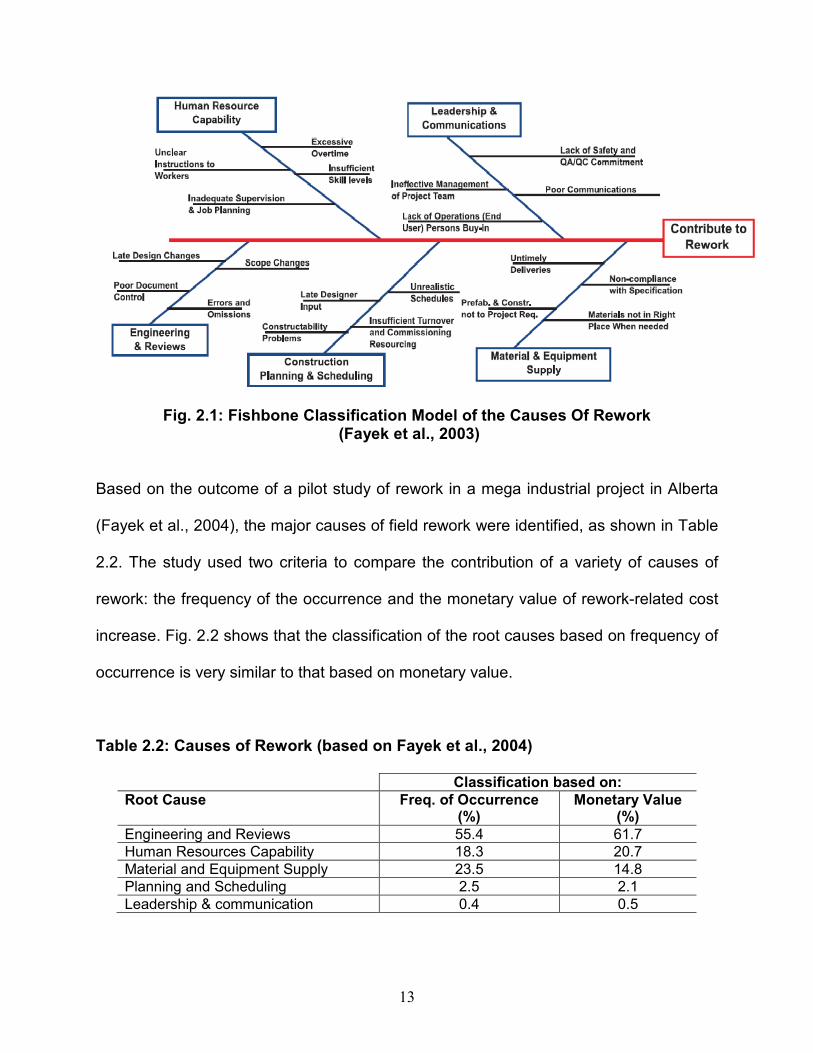
13
Fig. 2.1: Fishbone Classification Model of the Causes Of Rework (Fayek et al., 2003)
Based on the outcome of a pilot study of rework in a mega industrial project in Alberta
(Fayek et al., 2004), the major causes of field rework were identified, as shown in Table
2.2. The study used two criteria to compare the contribution of a variety of causes of
rework: the frequency of the occurrence and the monetary value of rework-related cost
increase. Fig. 2.2 shows that the classification of the root causes based on frequency of
occurrence is very similar to that based on monetary value.
Table 2.2: Causes of Rework (based on Fayek et al., 2004)
Classification based on:
Root Cause Freq. of Occurrence (%)
Monetary Value (%)
Engineering and Reviews 55.4 61.7 Human Resources Capability 18.3 20.7 Material and Equipment Supply 23.5 14.8 Planning and Scheduling 2.5 2.1 Leadership & communication 0.4 0.5

Fig. 2.2: Classification of rework causes (b
An interesting study by Love et al. (1999) compared the causes and effects
experienced in many countries around the world. The study concluded that the
variability in the cost of rework
authoritative, but merely indicative, as levels and interpretations of quality wi
Local practices, industry culture, and contractual agreements may also have a
significant influence on the incidence and cost of rework in any situation and
Another interesting study by Love et al.
categories based on the initiator
are shown in Table 2.3
18%
24%
3%
Frequency of Occurrence
14
assification of rework causes (based on Fayek et al.
by Love et al. (1999) compared the causes and effects
experienced in many countries around the world. The study concluded that the
rework in different countries “K should not be considered to be
authoritative, but merely indicative, as levels and interpretations of quality wi
Local practices, industry culture, and contractual agreements may also have a
significant influence on the incidence and cost of rework in any situation and
Another interesting study by Love et al. (2003) grouped the causes of
categories based on the initiator of the cause. The ranked causes within each category
55%
Frequency of Occurrence
62%
20%
15%3%
Monetry Value
ased on Fayek et al. 2004)
by Love et al. (1999) compared the causes and effects of rework
experienced in many countries around the world. The study concluded that the
countries “K should not be considered to be
authoritative, but merely indicative, as levels and interpretations of quality will differ KK
Local practices, industry culture, and contractual agreements may also have a
significant influence on the incidence and cost of rework in any situation and locality.”
causes of rework into
. The ranked causes within each category
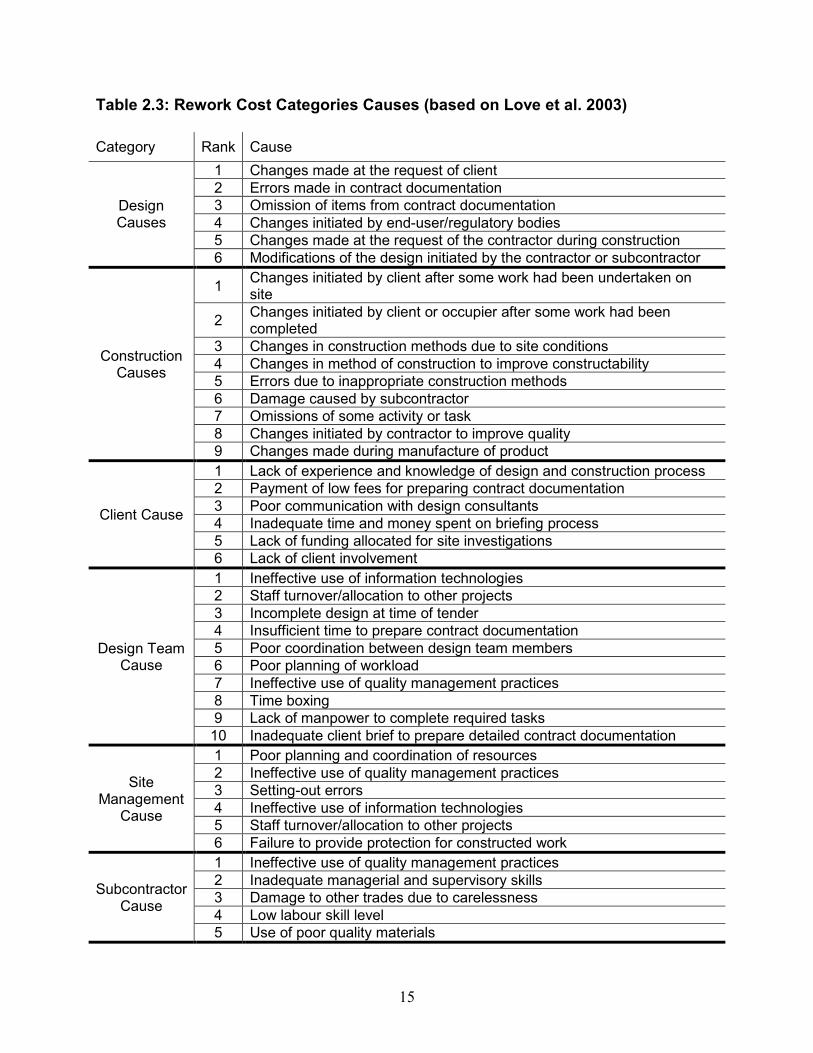
15
Table 2.3: Rework Cost Categories Causes (based on Love et al. 2003)
Category Rank Cause
Design Causes
1 Changes made at the request of client 2 Errors made in contract documentation 3 Omission of items from contract documentation 4 Changes initiated by end-user/regulatory bodies 5 Changes made at the request of the contractor during construction 6 Modifications of the design initiated by the contractor or subcontractor
Construction Causes
1 Changes initiated by client after some work had been undertaken on site
2 Changes initiated by client or occupier after some work had been completed
3 Changes in construction methods due to site conditions 4 Changes in method of construction to improve constructability 5 Errors due to inappropriate construction methods 6 Damage caused by subcontractor 7 Omissions of some activity or task 8 Changes initiated by contractor to improve quality 9 Changes made during manufacture of product
Client Cause
1 Lack of experience and knowledge of design and construction process 2 Payment of low fees for preparing contract documentation 3 Poor communication with design consultants 4 Inadequate time and money spent on briefing process 5 Lack of funding allocated for site investigations 6 Lack of client involvement
Design Team Cause
1 Ineffective use of information technologies 2 Staff turnover/allocation to other projects 3 Incomplete design at time of tender 4 Insufficient time to prepare contract documentation 5 Poor coordination between design team members 6 Poor planning of workload 7 Ineffective use of quality management practices 8 Time boxing 9 Lack of manpower to complete required tasks 10 Inadequate client brief to prepare detailed contract documentation
Site Management
Cause
1 Poor planning and coordination of resources 2 Ineffective use of quality management practices 3 Setting-out errors 4 Ineffective use of information technologies 5 Staff turnover/allocation to other projects 6 Failure to provide protection for constructed work
Subcontractor Cause
1 Ineffective use of quality management practices 2 Inadequate managerial and supervisory skills 3 Damage to other trades due to carelessness 4 Low labour skill level 5 Use of poor quality materials

In Australia, Love et al. (2004) found that the
construction rework were as shown in Fig. 2.3
Love et al. (2004), also, concluded that to reduce rework in projects, attention should be
given to a number of design and production management strategies,
2.4. According to that study, these strategies are perceived to be relatively
straightforward and do not require significant changes
Fig. 2.3: Primary Rework Factors (based on Love et al. 2004)
Fig. 2.4: Rework control criteria (based on Love et al. 2004)
Primary Factors
Understanding and identifying endrequirements
Enhancing contract documentation
Auditing contract documentation
Implementing quality management
Enhancing skills and knowledge through training programs
Useing of the last planner approach during production planning
16
In Australia, Love et al. (2004) found that the primary factors that contribut
construction rework were as shown in Fig. 2.3. Based on several studies
concluded that to reduce rework in projects, attention should be
given to a number of design and production management strategies, as
2.4. According to that study, these strategies are perceived to be relatively
straightforward and do not require significant changes in current practices
: Primary Rework Factors (based on Love et al. 2004)
: Rework control criteria (based on Love et al. 2004)
Factors
Lack of understanding of endrequirements
Poor contract documentation and low consultant fees
Lack of focus on quality
Poor standard of workmanship
Poor supervision and inspection
Minimize rework Potential
Understanding and identifying end-user requirements
Enhancing contract documentation
Auditing contract documentation
Implementing quality management
Enhancing skills and knowledge through training programs
Useing of the last planner approach during production planning
rimary factors that contribute to
Based on several studies of rework,
concluded that to reduce rework in projects, attention should be
as shown in Fig.
2.4. According to that study, these strategies are perceived to be relatively
s.
: Primary Rework Factors (based on Love et al. 2004)
: Rework control criteria (based on Love et al. 2004)
Lack of understanding of end-user
Poor contract documentation and low
Lack of focus on quality
Poor standard of workmanship
Poor supervision and inspection
rework Potential

17
2.2.2 Impact of Rework on Project Performance Several studies in literature have focused on analysing the impact of rework on
construction projects and on the whole construction industry. Josephson and
Hammarlund (1999) reported that the cost of rework in residential, industrial, and
commercial building projects ranged from 2 % to 6 % of their contract values. Similarly,
Love and Li (2000), in their study of rework costs for a residential and an industrial
building, found the cost of rework to be 3.15 % and 2.40 % of the contract value,
respectively. In addition, Love and Li (2000) found that when a Contractor implemented
a quality assurance system in conjunction with an effective continuous improvement
strategy, rework costs were found to be less than 1 % of the contract value.
Two key research studies have indicated the cost of quality deviations in civil and heavy
industrial engineering projects. First, the study by Burati et al. (1992) of nine major
engineering projects indicated that, for all nine projects, quality deviations accounted for
an average of 12.4 % of the contract value. A significantly lower figure was reported by
Abdul-Rahman (1995), who found the non-conformance costs (excluding material
wastage and head office overheads) of a highway project to be 5 % of the contract
value. Abdul-Rahman (1995) pointed out that non-conformance costs may be
significantly higher for projects characterized by poor quality management.
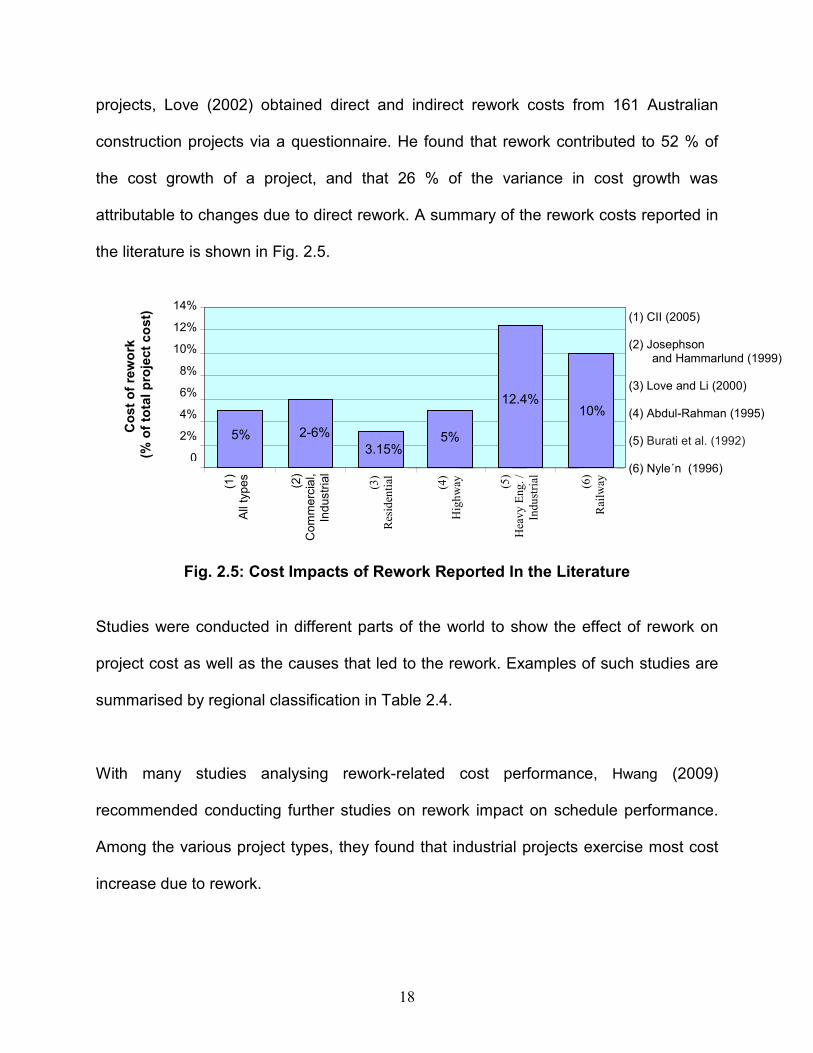
In a recent study undertaken with the goal of identifying the influence of the type of
project and procurement methods on the cost of rework for building construction
18
projects, Love (2002) obtained direct and indirect rework costs from 161 Australian
construction projects via a questionnaire. He found that rework contributed to 52 % of
the cost growth of a project, and that 26 % of the variance in cost growth was
attributable to changes due to direct rework. A summary of the rework costs reported in
the literature is shown in Fig. 2.5.
Fig. 2.5: Cost Impacts of Rework Reported In the Literature Studies were conducted in different parts of the world to show the effect of rework on
project cost as well as the causes that led to the rework. Examples of such studies are
summarised by regional classification in Table 2.4.
With many studies analysing rework-related cost performance, Hwang (2009)
recommended conducting further studies on rework impact on schedule performance.
Among the various project types, they found that industrial projects exercise most cost
increase due to rework.
14%
12%
10%
8%
6%
4%
2%
0
Cost of rework
(% of total project cost)
5% 2-6%
3.15% 5%
12.4% 10%
(1
) A
ll ty
pes
(2)
Co
mm
erc
ial,
In
dustr
ial
(3)
Res
iden
tial (4)
Hig
hw
ay (5)
Hea
vy E
ng. /
Indust
rial
(6)
Rai
lway
(1) CII (2005) (2) Josephson and Hammarlund (1999) (3) Love and Li (2000) (4) Abdul-Rahman (1995) (5) Burati et al. (1992) (6) Nyle´n (1996)

19
Table 2.4: Research Related to Rework (based on Love and Edwards 2004) Region Study cause of Rework cost of Rework
Australia Cusack (1992) Documentation errors 10 % cost increase Burroughs (1993) Poor documentation produced by design
consultants 5 % of contract value
Gardiner (1994) Design consultant errors 20 % of consultant fee CIDA (1995) Poor communication
Traditional lump sum procurement Lack of a formal quality management
15 % of a project’s contract value
Singapore
CIDB (1989) Rectifying errors 5 % and 10% of the project costs
Sweden Hammarlund et al. (1990)
Quality failures 20 % of the quality failures registered
Josephson and hammarlund (1999)
Defects 2.3 % to 9.3 % of the production cost
Nylén (1996) Quality failures due to the client and consultants during the design process
10 % of project’s production cost
UK Abdul-rahman (1993)
Non-conformances 2.5 % of contract value
Barber et al. (2000) Quality failure 6 % and 23 % of contract value
USA Bowersox et al. (1985)
A poor quality product Eight times original cost
Farrington (1987) Cost of rework (including re-designs) 12.4 % of total project cost
Willis and willis (1996)
Cost of failure and deviation correction 12 % of labour expenses for design & const.
2.2.3 Rework Indexes To help provide early warning of field rework, four rework indexes shown in Table 2.5
are currently used to provide general suggestions to help reduce rework. While these
indexes are useful, no mechanism exists for incorporating rework in current scheduling
and project control tools to enable the assessment of the impact of rework, the
allocation of responsibility for delays, or the devising of cost-effective mitigation action.
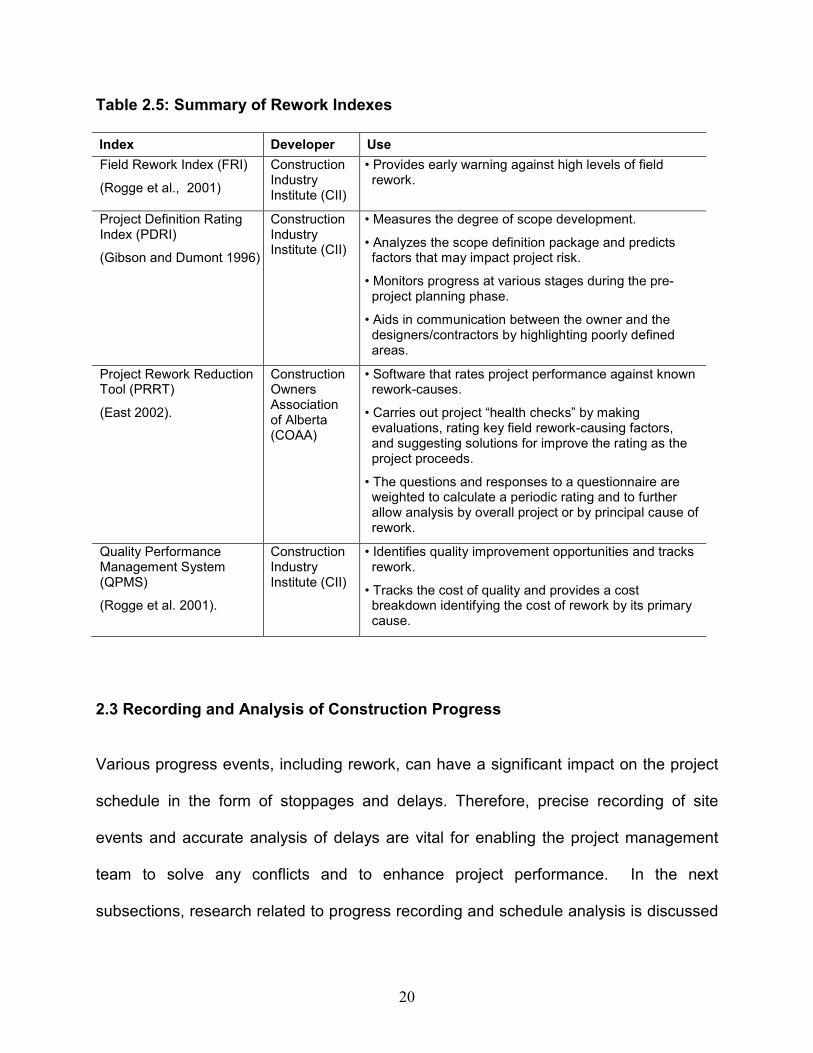
20
Table 2.5: Summary of Rework Indexes
Index Developer Use
Field Rework Index (FRI)
(Rogge et al., 2001)
Construction Industry Institute (CII)
• Provides early warning against high levels of field rework.
Project Definition Rating Index (PDRI)
(Gibson and Dumont 1996)
Construction Industry Institute (CII)
• Measures the degree of scope development.
• Analyzes the scope definition package and predicts factors that may impact project risk.
• Monitors progress at various stages during the pre-project planning phase.
• Aids in communication between the owner and the designers/contractors by highlighting poorly defined areas.
Project Rework Reduction Tool (PRRT)
(East 2002).
Construction Owners Association of Alberta (COAA)
• Software that rates project performance against known rework-causes.
• Carries out project “health checks” by making evaluations, rating key field rework-causing factors, and suggesting solutions for improve the rating as the project proceeds.
• The questions and responses to a questionnaire are weighted to calculate a periodic rating and to further allow analysis by overall project or by principal cause of rework.
Quality Performance Management System (QPMS)
(Rogge et al. 2001).
Construction Industry Institute (CII)
• Identifies quality improvement opportunities and tracks rework.
• Tracks the cost of quality and provides a cost breakdown identifying the cost of rework by its primary cause.
2.3 Recording and Analysis of Construction Progress
Various progress events, including rework, can have a significant impact on the project
schedule in the form of stoppages and delays. Therefore, precise recording of site
events and accurate analysis of delays are vital for enabling the project management
team to solve any conflicts and to enhance project performance. In the next
subsections, research related to progress recording and schedule analysis is discussed
21
in order to account for rework and its impact and to provide a basis for the discussion of
improvements in this area in subsequent chapters.
2.3.1 Recording Site Events Daily recording of the actions performed by all parties on a construction site is
necessary for effective delay analysis. Site events involve a large amount of data
related to weather, staffing, use of resource, work accomplished, work stoppage,
accidents, delivery of materials, and change orders. This information is recorded using a
variety of media such as daily site diaries, notes from progress meetings, daily weather
records, photographs, and weekly progress reports. When analysis is required a search
through all of these records is therefore very time consuming. In practice, this process
usually takes place after construction and only in the case of a conflict or a dispute.
An important schedule analysis tool is delay analyses, which requires progress-related
data, such as start and finish times, work completed, resources used, idle times, and
work disruption periods. For a realistic analysis of delays, the recorded site data should
be sufficient to define the progress of activities as slow, stopped, or accelerated. Slow
progress occurs when the work production is less than that planned. Acceleration, on
the other hand, means that more work is produced than was planned, and it should be
defined as either Contractor-desired acceleration or Owner-forced acceleration (Hegazy
et al., 2005).

22
Although the daily site report is an important document for following the progress of an
activity, it is often given the least attention (Pogorilich, 1992). Some researchers have
been interested in developing computerized systems for daily site reporting. Scott
(1990) developed a bar chart as a graphical form of progress reporting. In his bar chart
(Fig. 2.6), the daily status of each activity is recorded as one of the following four
conditions:
X - Activity working all day
H - Activity working half day
W - Activity not working all day due to weather
R - Activity not working half day due to weather
Code Activity Description June 90
6 7 8 9 12
13
14
15
16
19
20
21
22
23
E101 Excavate topsoil X E102 General Excavation X R X E103 Excavate pier X E104 Excavate S abut X H E105 Excavate N abut H X E106 Backfill S abut E107 Backfill N abut S101 Blind S pier W H H S102 Blind N pier X W H X X X H
Legend: X: Activity working all day H: Activity working half day W: Activity not working all day due to weather R: Activity not working half day due to weather
Fig. 2.6: Recording Site Data in a Bar Chart (based on Scott 1990)
Stumpf (2000) presented an approach that manipulates existing software in order to
facilitate the analysis. His approach simulates each delay by adding a separate activity
with duration equal to the delay period, as shown in Fig. 2.7. For example, the activity
“Excavation” in Fig. 2.7 involved an Owner-caused delay (due to unexpected rock) for 2

23
days. This situation is represented by the addition of a new activity for the delay and by
the splitting of the original activity into two parts (a and b). The activity then becomes 3
components that are manually linked by appropriate logical relations.
Fig. 2.7: Representing Delays on Scheduling Software (based on Stumpf, 2000)
Hegazy et al. (2005) showed that the evolution of the progress of the project can be
accurately indicated by recording the daily percentage completed for each activity,
which can be calculated from the start and finish dates, and then comparing it to the
planned percentage. Slow progress can then be identified when actual progress results
in lower productivity than planned; acceleration, when work results in higher productivity
than planned; and suspension, when work is completely stopped. They then presented
a bar chart made of spreadsheet cells, each representing one day or one week, or any
unit of time. The activities are thus represented not in bars (as in commercial software)
but as a group of adjacent cells making up the duration of the activity. The proposed bar
Two added activities for the delays

24
chart records the daily percentage completed for each activity, the delays, the party
responsible for each delay, and any other related data.
Delays are recorded on the bar chart on the day they occur. As shown in Fig. 2.8, if an
activity is delayed for Owner-related reasons, an “O” is shown for that day. In the same
manner, if the delay is Contractor-related, a “C” is shown. In the case of delays that are
not attributable to the Owner or the Contractor, e.g., the weather, an “N” is shown. If
concurrent delays occur, a combination of these three letters is shown (e.g., “O+N” or
“O+C”). The reasons for delays are also recorded as text comments in the delay cells.
Fig. 2.8: Recording Site Data Using an Intelligent Bar Chart
(based on Hegazy et al., 2005)
One of key benefits of this representation is the clear manner in which the complete
evolution of the schedule and all the actions of all parties are shown. This system
facilitates accurate calculation of responsibility for project delays with less disagreement
among the parties involved in the project. This representation can therefore be a good
basis for improvements that can enhance the representation of rework on the schedule.
Description: The contractor didn’t order the garage doors until the end of week 11, which was four weeks later than the original late start date.
25
2.3.2 Schedule Analysis Techniques Delay analysis, or more generally, schedule analysis, is an analytical process in which
the critical path method is employed together with a review of project documentation
and site records in order to apportion project delays among the parties responsible
(Holloway, 2002). Several delay analysis methods are available; the selection of the
proper method depends on a variety of factors, including the value of the dispute, the
records available, and the time available for the analysis. The four traditional methods
often mentioned in the literature are described briefly below, and the latest
developments in the Daily Windows Analysis, which is used in this research, are
discussed in a separate subsection.
The As-Planned Versus As-Built Comparison: Comparing the as-planned with the
as-built schedule is the simplest method of analysing schedule delays. The majority of
researchers do not recommend this method because it simply determines the net
impact of all delay events as a whole rather than examining each individual delay event
separately.
The Impacted As-Planned Method (what-if approach): The impacted as-planned
method adopts the as-planned schedule as a baseline. The delays caused by either the
Contractor or the Owner are added to the as-planned schedule, and the impact on the
project duration is calculated. The impacted as-planned schedule reflects how the as-
planned schedule could be impacted as a result of Owner or Contractor-caused delays
being inserted into the schedule. For example, contractors who submit claims that
26
involve a time extension add only Owner-caused delays to the as-planned schedule in
the appropriate sequence.
The Collapsed As-Built Method (but-for method): The collapsed as-built method is
used by contractors to demonstrate a schedule that they could have achieved “but for”
the actions of the Owner. This method adopts the as-built schedule as its baseline. The
delays attributable to the Owner are subtracted from the as-built schedule. The
compensable delay (i.e., delays because of the Owner) is the difference between the
as-built schedule and the but-for schedule. The collapsed as-built method is a very
practical approach that offers a good combination of benefits (Lovejoy, 2004). But-for
schedules are frequently used for delay analysis because of the following advantages:
• This method is more reliable than several other delay analysis methods.
• It requires less time and effort than detailed event-by-event analysis.
• It is accepted by courts and boards.
On the other hand, the collapsed as-built method has the following drawbacks:
• Concurrent delays cannot be recognized.
• The dynamic nature of the project’s critical paths is not considered.
• It is highly subjective, and the results are different when the analysis is
conducted from the Owner’s versus Contractor’s point-of-view.
27
Based on these points, using the collapsed as-built analysis is resonable when the time
and resources available for detailed analysis are limited, but it should be used with an
awareness of its limitations and weaknesses.
The Contemporaneous Period Analysis Method (window analysis): This method
breaks the construction period into discrete time increments and examines the effects of
delays attributable to each of the project participants as the delays occur. It adopts the
as-planned schedule as its baseline, but the as-planned schedule is updated at the end
of each planned time period. Ideally, the windows method can be followed during the
course of construction and is distinguishable from the but-for method because it
incorporates delays attributable to both parties into the analysis and because the
dynamic nature of the project’s critical paths is taken into consideration. Some
researchers have developed computer implementations of the traditional windows
technique using commercial scheduling software (e.g., Alkass et al., 1995; Lucas,
2002).
The majority of the researchers agree that windows analysis yields the most reliable
results. Despite its advantages, windows analysis requires significant time and effort.
Since it is based on a large amount of information, and the schedule needs to be
updated periodically, this method may not be appropriate for projects that lack strict
administrative procedures and schedules updates. Arditi and Pattanakitchamroon
(2006) presented the views of some of the researchers and practitioners who wrote
about delay analysis methods from 1990 to 2004. The comments of a sample of these
28
researchers and practitioners with respect to windows analysis are summarized in Table
2.6.
Table 2.6: Comments on the Windows Delay Analysis (Based on Arditi and Pattanakitchamroon 2006) References Comments Lovejoy (2004) Very good Sagarlata and Brasco (2004) Useful for prospective analyses, but minimal utility supporting claims Sandlin et al. (2004) Overcomes some disadvantages of others Gothand (2003) Reliable SCL (2002) Most reliable when available Harris and Scott (2001) Make some use by claims consultants Zack (2001) Accurate but expensive Fruchtman (2000) Contemporaneous basis, but not future changes considered Stumpf (2000) Reliable, but time consuming Finke (1999, 1997) Most reasonable and accurate McCullullough (1999) Dependent on baseline schedule, accurate Zack (1999) Suitable Bubshait and Cunningham (1998) Acceptable, dependent on availability of data Levin (1998) Dependent on how the method is applied Alkass et al. (1996) Some drawbacks/propose modified method Schumacher (1995) Effective method Baram (1994) Most desirable approach Wickwire et al. (1991) Recommended
2.3.3 Latest Development: Daily Windows Analysis Zhang (2003) introduced changes to the traditional windows analysis method in order to
address some of its drawbacks. A window size of one day was used to precisely
analyze and capture any changes that might affect the critical path(s). The simple
example reported in Hegazy and Zhang (2005), shown in Fig. 2.9, was used to
demonstrate this daily windows analysis. The relationships show that activities B and C
both follow activity A. Activities B and C are then followed by activity D. The as-planned
duration is 7 days, while the as-built duration is 9 days, which indicates 2 days of project
delay. As shown on the as-built schedule, activity B was stopped for 2 days due to

29
Owner caused events, while activity C experienced one day of work stoppage due to
the Contractor. The key question now is how to apportion the project delay between the
2 parties.
Activity Day Number
1 2 3 4 5 6 7 8 9
A
B
C
D
(a) As-Planned Bar Chart (b) As-Built Bar Chart
Fig. 2.9: Bar Charts for a Small Example of Windows Analysis
Using the traditional windows analysis with a traditional window size equal to the full
duration of the project (9 days), the final critical path is A-B-D, and the project delay
would therefore be attributed to the Owner alone since the 2 Owner delays (o) occurred
on the final critical path.
Applying daily window method can provide a more accurate result. First, all progress
events are removed from the as-built schedule shown in Fig 2.9, so that the process
begins with the as-planned schedule. The events of each day are then entered and their
impact analysed. It is assumed in this representation of daily progress that the work
stop caused by each party (c or o) is for a full day and that progress is stopped in each
case.
Activity Day Number
1 2 3 4 5 6 7 8 9
A
B o o
C c
D
Owner delay
Contractor delay
30
Following the daily windows process in this example yields 9 daily windows which can
be analyzed as follows:
Days 1 and 2: The project did not experience any delays, so the project duration
remains 7 days.
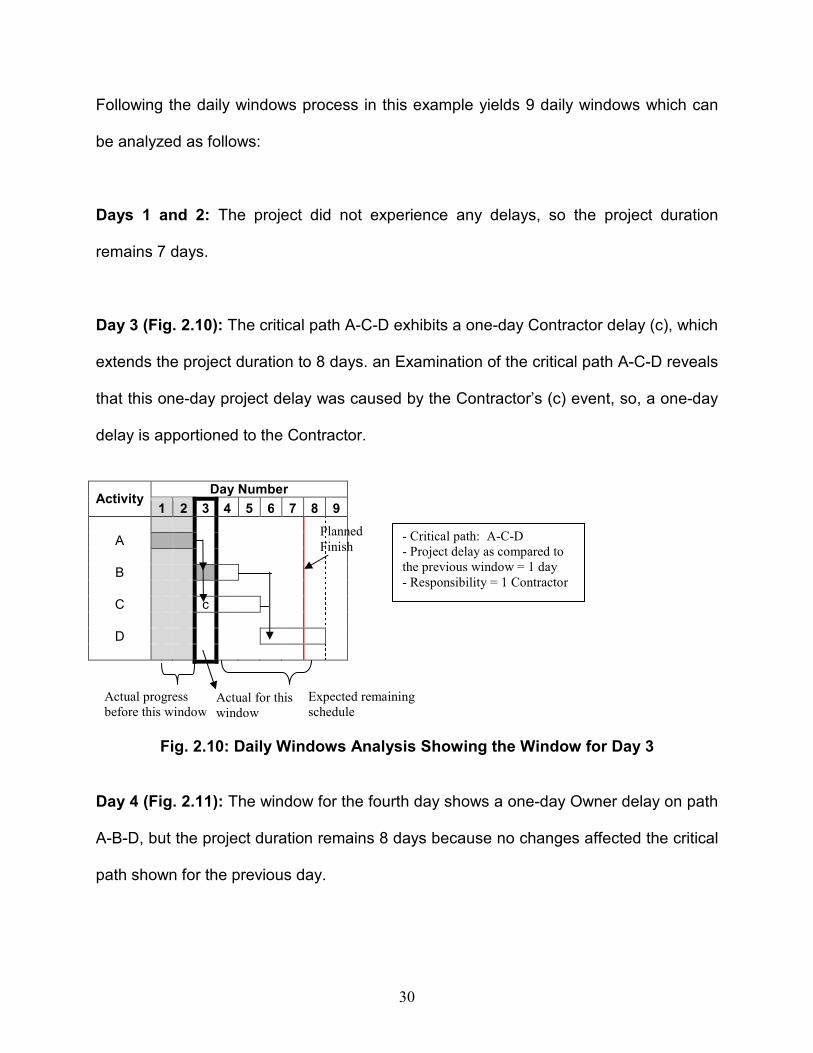
Day 3 (Fig. 2.10): The critical path A-C-D exhibits a one-day Contractor delay (c), which
extends the project duration to 8 days. an Examination of the critical path A-C-D reveals
that this one-day project delay was caused by the Contractor’s (c) event, so, a one-day
delay is apportioned to the Contractor.
Activity Day Number
1 2 3 4 5 6 7 8 9
A
B
C c
D
Fig. 2.10: Daily Windows Analysis Showing the Window for Day 3
Day 4 (Fig. 2.11): The window for the fourth day shows a one-day Owner delay on path
A-B-D, but the project duration remains 8 days because no changes affected the critical
path shown for the previous day.
Actual progress
before this window Actual for this
window
Expected remaining
schedule
- Critical path: A-C-D
- Project delay as compared to
the previous window = 1 day
- Responsibility = 1 Contractor
Planned
Finish

31
Activity Day Number
1 2 3 4 5 6 7 8 9
A
B o
C c
D
Fig. 2.11: Daily Windows Analysis Showing the Window for Day 4
Day 5 (Fig. 2.12): The project is delayed by one day due to the Owner’s delay on
critical path A-B-D, thus extending the project duration to 9 days and apportioning a
one-day delay to the Owner.
Activity Day Number
1 2 3 4 5 6 7 8 9
A
B o o
C c
D
Fig. 2.12: Daily Windows Analysis Showing the Window for Day 5
Days 6 to End: Progress continues as planned, and no additional delays occur. The
final result of the daily window analysis is that 2 days of project delays are attributed as
follows:
- Critical paths: A-C-D & A-B-D
- Project delay as compared to
previous window = 0
- Responsibility = none
RemaininCompleted
- Critical path: A-B-D
- Project delay as compared to the
previous window = 1 day
- Responsibility = 1 Owner
RemaininCompleted
Planned
Finish
Planned
Finish

32
• One-day Contractor delay (1 c)
• One-day Owner delay (1 o)
As demonstrated by this simple example, the daily windows analysis considers every
change in the critical path(s), which could be overlooked using the traditional windows
analysis. However, the daily windows analysis still needs improvement because it does
not take into consideration other factors such as rework events.
2.4 Conclusion
As demonstrated in many studies, rework clearly has a huge impact on the completion
of projects on time and within cost constraints. Rework has been reported as a main
contributor to cost and schedule overruns and is the cause of more than 10 % of the
contract price, which represents a very large amount in heavy construction areas such
as oil and gas projects. A number of researchers have studied rework from a variety of
perspectives: root causes, the impact on project performance, and the categorization of
rework using several indexes. While these studies are useful, no mechanism yet exists
for incorporating rework into current scheduling and project control tools to enable the
assessment of the impact of rework, the allocation of responsibility for the delays, and
the determination of cost-effective mitigation actions.
In addition to recognizing the causes and impacts of rework, which have been reported
extensively in the literature, it is also important that project managers have adequate
tools not only for analyzing the time and cost implications of rework but also for
generating practical and cost-effective corrective action plans. The literature reported

33
little or no effort devoted to proposing such tools for the construction industry, which is
the objective of this research.

34
CHAPTER 3
PROPOSED REWORK REPRESENTATION
3.1 Introduction
Available project management tools have standardized schedule representations of a
project in the form of a set of activities and milestones. During the actual progress of a
project, when rework can happen, it’s important to document the rework events within
the standard schedule representation. Since existing tools do not facilitate the
documentation of rework within the schedule, a new representation of rework has been
developed and is described in this chapter. The new technique includes an analysis
mechanism for automatically quantifying the impact of rework on the schedule. A
schedule analysis mechanism has also been created for optimizing rework-related
corrective actions and apportioning the associated project delays. This mechanism is
presented in chapter 4.
3.2 Typical Schedule Representation
Existing project management tools allow the representation of some information about
the baseline schedule and the updated schedule. In none of these tools, however, is it
possible to incorporate a structured representation of rework or a calculation procedure
for considering rework events and apportioning delays and accelerations. In most of
them, a rework event is typically represented by the introduction of a new activity, and
then an attempt is made to tie the new activity into the rest of the schedule. In heavy
construction projects such as an oil and gas project, this task is not simple. Because

35
schedules that have thousands of activities and relations, it is extremely difficult to
update or change the schedule in order to introduce a rework activity. Fig. 3.1 shows an
example of the representation of activities in MS Project, a commonly used software
tool, in which that a rework event has occurred on a specific date is very difficult. The
solution is to split the activity into pieces so that the rework portion can be added in the
correct place and then linked with the rest of the schedule. This process is lengthy and
tedious, especially for large projects.
a) Planned
b) Updated
Fig. 3.1: Planned and Updated Schedules in Microsoft Project

36
Primavera P6 (2007), which is industry-standard software, also has numerous options
for entering the progress of an activity, as shown in fig 3.2. However, even in its latest
version, P6 does not offer an effective way to represent a rework event in the project
schedule. While P6 does have a new option for uploading a daily profile for an activity,
as shown in fig. 3.3, but although this is an important function, it does not include a
mechanism that allows documentation of the reasons. Furthermore, all analysis
mechanisms must be programmed in the Primavera language, which is not simple.
Fig. 3.2: Primavera P6 Project Schedule
Fig. 3.3: Activity Profile Primavera 6
Does not allow for entering
the daily events

37
3.3 New Representation of Rework
For better progress documentation and project control, this research has developed a
new method of representing rework events on the project schedule. Improving the
schedule representation to include rework can be accomplished in several ways. One
simple approach is to consider rework as a negative percentage complete for the
related activities, as shown in Fig. 3.4. The value of the negative percent complete is
equal to the amount of work that needed to be redone for the specific activity. Fig. 3.4
illustrates an example in which the activity involves 10 steel columns which are planned
to be constructed in 5 days. After 60 % of the job is completed (6 columns in 3 days),
the site supervisors discover that they have 2 columns not properly aligned and decide
that they need to be realigned. Since the amount of rework is 20 %, as shown in Fig.
3.4, 20 % is subtracted from the earlier 60 % complete so that the cumulative progress
(shown on the right side of Fig.3.4) is only 40 % complete. While this representation is
simple and can be implemented in existing software, the project end date did not reflect
the change, and it is difficult to keep track of the individual history of all project events,
since the latest value replaces the previous one.
Fig. 3.4: Changing the Percentage Complete as a Result of Rework
End date did
not change

38
As developed in this research a more practical approach, is to use a daily
representation of the actual progress so that rework can be specified in terms of exact
times and quantities, as shown in Fig. 3.5. The new representation includes colour
coding on the schedule to indicate that rework has been recorded for an individual
activity, with the specific information about the rework shown as, for example “C-20”
indicating Contractor responsibility and the amount of rework. the rework percentage
amount could be calculated in 2 ways:
1- As a percentage of the work performed or the current progress i.e., 2 columns
out of the 6 completed, or 33 %
2- As a percentage of the total activity quantity i.e., 2 columns of the total 10,
or 20 %
Fig. 3.5: Representing Rework as Negative Progress
For ease of calculation, this research adopted the second approach. The letter before
the value of the rework represents the party responsible. For example, O-20 for a
specific activity means that 20 % of the total activity has to be redone and that the
rework is the result of Owner’s action. This new rework representation has been
demonstrated for a number of activity cases, as presented in the following section.
Act. Day Number
1 2 3 4 5 6
Planned 20 20 20 20 20
Actual 20 30 10 20 20
Act. Day Number
1 2 3 4 5 6
Planned 20 20 20 20 20
Actual 20 30
20 20 20
Rework
Amount =20%
10% - C-20%
Remaining Remaining
39
3.4 The Effect of Rework on Construction Schedules Depending on the construction schedule, there are several cases in which a rework
event can have an impact on other activities, the project completion, and resource
allocation. The cases described in the following subsections are presented in order of
complexity, from simple to more involved.
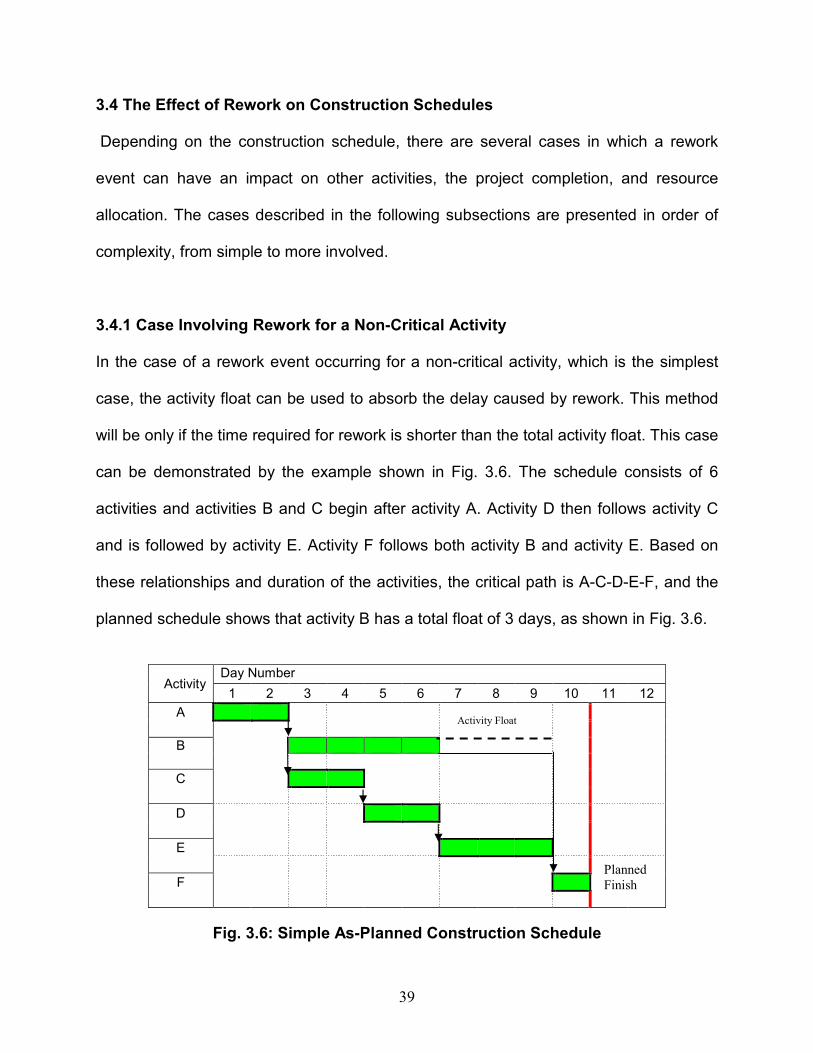
3.4.1 Case Involving Rework for a Non-Critical Activity
In the case of a rework event occurring for a non-critical activity, which is the simplest
case, the activity float can be used to absorb the delay caused by rework. This method
will be only if the time required for rework is shorter than the total activity float. This case
can be demonstrated by the example shown in Fig. 3.6. The schedule consists of 6
activities and activities B and C begin after activity A. Activity D then follows activity C
and is followed by activity E. Activity F follows both activity B and activity E. Based on
these relationships and duration of the activities, the critical path is A-C-D-E-F, and the
planned schedule shows that activity B has a total float of 3 days, as shown in Fig. 3.6.
Activity Day Number
1 2 3 4 5 6 7 8 9 10 11 12
A
B
C
D
E
F
Fig. 3.6: Simple As-Planned Construction Schedule
Planned
Finish
Activity Float

40
Fig. 3.7 shows a rework event during the execution of activity B, which is a non-critical
activity. The rework event is shown on day 4 as C-25, indicating a rework amount of 25
% is needed for the activity. Based on this rework amount, the duration of activity B is
extended to 5 days [4 days planned + 25% * 4 for rework = 5 days]. Since the activity is
non-critical and has a total float of 3 days, the project duration will not be extended. The
duration of the activity after the inclusion of rework can thus be calculated using the
following equation:
New Activity Duration = Planned Duration + Rework% * Planned Duration (1)
Activity Day Number
1 2 3 4 5 6 7 8 9 10 11 12
A
B C-25
C
D
E
F Completed Remaining
Fig. 3.7: Effect of Rework on a Non-Critical Activity
3.4.2 Case Involving Rework for a Critical Activity Undesired effects may occur when a critical activity requires rework. This situation can
be demonstrated for the same as-planned schedule shown in Fig. 3.6. The progress
schedule is shown in Fig. 3.8, with rework occurring for activity C, which is a critical
Planned
Finish
Activity Float
Reduced

41
activity. If the amount of rework is 50 %, using equation 1 the activity is extended by one
day. A general expression of the extension of the total project can thus be calculated as
follows:
Project Extension (>0, or 0 if negative) =
(New Activity Duration (Eq.1) – Original Activity Duration) – Activity Total Float (2)
Activity Day Number
1 2 3 4 5 6 7 8 9 10 11 12
A
B
C C-50
D
E
F Completed Remaining
Fig. 3.8: Effect of rework on the Critical Path
As shown in Fig 3.8, rework events that affect the project schedule as a whole can lead
to undesired results, including project delay and cost overruns. It should be noted that
the new rework representation and related calculations can show clearly the impact of
rework on the overall project duration, which was not possible with existing tools.
Planned
Finish
Expected
Finish

42
3.4.3 Case Involving Rework and Resource Limits Another more practical case that demonstrates the impact of rework on a schedule
involves project that has limited resources. To illustrate this case for the planned
schedule shown in Fig. 3.6, the specific labour resource required for each activity are
indicated by����, as shown in Fig. 3.9. Assuming that the resource limit for the project is
2 workers per day, the planned schedule meets this constraint.
In this case, a rework event is introduced for activity B, which is non-critical as in the
case described in 3.3.1. However, due to the resource limits, the impact of the rework
event is different because it creates an over-allocation of the project resources, as
shown in Fig. 3.10. While in the first case, described in section 3.3.1, the rework does
not affect the completion date, in this case, when limited resources are involved, the
rework causes a one-day project extension because the resource over-allocation must
be resolved, as shown in Fig. 3.11.
Activity Day Number 1 2 3 4 5 6 7 8 9 10 11 12
A �� �� B � � � � C � � D � � E �� �� �� F �
Daily Sum 2 2 2 2 2 2 2 2 2 1
Fig. 3.9: Resource Loading Over the Planned Schedule
Planned
Finish

43
Therefore, in the case of a Rework event involving a schedule with resource limits, even
when the rework occurs with respect to a non-critical activity, it might also delay the
overall project schedule because of resource over-allocation.
Activity Day Number 1 2 3 4 5 6 7 8 9 10 11 12
A �� ��
B � C-25 � � �
C � �
D � �
E �� �� ��
F � Completed Remaining
Res. L 2 2 2 2 2 2 3 2 2 1
Fig. 3.10: Resource Over-Allocation Due to Rework
Activity Day Number 1 2 3 4 5 6 7 8 9 10 11 12
A �� �� B � C-25 � � � C � � D � � 1 E �� �� �� F � Completed Remaining
Res. L 2 2 2 2 2 2 1 2 2 2 1
FIG. 3.11: Extension of the Project Caused By Resolving The Resource Over-Allocation
Over
Allocation
Planned
Finish
Planned
Finish Expected
Finish Resolving over-allocation by introducing a
start delay to activity E
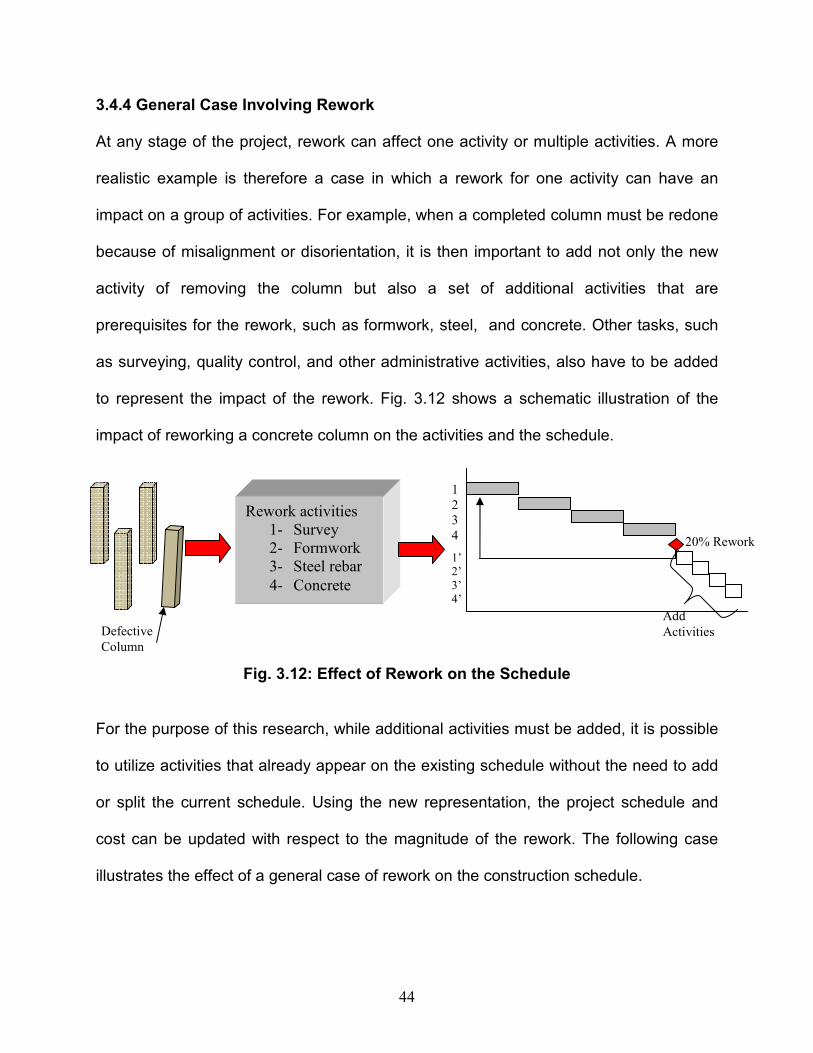
44
3.4.4 General Case Involving Rework At any stage of the project, rework can affect one activity or multiple activities. A more
realistic example is therefore a case in which a rework for one activity can have an
impact on a group of activities. For example, when a completed column must be redone
because of misalignment or disorientation, it is then important to add not only the new
activity of removing the column but also a set of additional activities that are
prerequisites for the rework, such as formwork, steel, and concrete. Other tasks, such
as surveying, quality control, and other administrative activities, also have to be added
to represent the impact of the rework. Fig. 3.12 shows a schematic illustration of the
impact of reworking a concrete column on the activities and the schedule.
Fig. 3.12: Effect of Rework on the Schedule For the purpose of this research, while additional activities must be added, it is possible
to utilize activities that already appear on the existing schedule without the need to add
or split the current schedule. Using the new representation, the project schedule and
cost can be updated with respect to the magnitude of the rework. The following case
illustrates the effect of a general case of rework on the construction schedule.
20% Rework
Rework activities
1- Survey
2- Formwork
3- Steel rebar
4- Concrete
1
2
3
4
1’
2’
3’
4’
z
Defective
Column
Add
Activities

45
The planned schedule used is the one shown in Fig. 3.9, with the activities’ resources
loaded. For the general case, additional schedule events were introduced into the
schedule, as shown in Fig. 3.13. In this case, the schedule is affected not only by delays
from rework events , but also by delays resulting from the actions of the Owner and the
Contractor, which are indicated on the schedule as “o” for work stops due to Owner, and
“c” for work stops caused by Contractor. Example of Owner-related work stoppage are
delaying the approvals of documents or changing the conditions they contain.
Contractor delays include late procurement or supply of materials or equipment.
Recording such events on the project schedule affects the resource allocation, as
shown in Fig. 3.13. As a result of the resource over-allocation, delays are introduced for
some activities. A start delay equal to 3 days is thus introduced into activity E, which
was to start on day 8. The resulting updated schedule is as shown in Fig. 3.14, with an
overall project delay of 4 days.
Activity Day Number 1 2 3 4 5 6 7 8 9 10 11 12
A �������� �� B � C C C-50 � � � � C � � D � � E O �� �� �� F �
Completed Remaining Daily Sum 2 2 2 2 2 2 1 3 3 3 1
Fig. 3.13: Schedule with a Varity of Events, Showing Resource Over-Allocation
Planned
Finish
Expected
Finish

46
Activity Day Number
1 2 3 4 5 6 7 8 9 10 11 12 13 14 15 A �������� �� B � C C C-50 � � � � C � � D � � E O �� �� ��
F �
Completed Remaining Daily Sum 2 2 2 2 2 2 2 1 1 1 2 2 2 1
Fig. 3.14: Updated Schedule with Delays to Resolve the Resource Over-Allocation
This case then becomes more complex when a rework event occurs with respect to any
of the remaining activities, as shown in Fig. 3.15. This general case, then, becomes
challenging not only because the impact of the rework on the project completion date
must be understood, but also because the responsibility of each party for the net delay
must be analyzed so that accurate mitigation action can be taken. A mechanism for
conducting this detailed analysis is presented in Chapter 4.
Activity Day Number
1 2 3 4 5 6 7 8 9 10 11 12 A �������� �� B � � � C-50 C � � D � O-33 E �� �� �� F �
Completed Remaining Daily Sum 2 2 2 2 2 2 2 2 2 1
Fig. 3.15: General Case of Progress Events Including, Multi-Party Rework
Expected
Finish Planned
Finish
Delay to avoid resource
over allocation
Planned
Finish

47
3.5 Conclusion
This chapter has presented a simplified approach for representing rework as a negative
percentage complete as recorded on a specific date on the schedule. Several rework
cases have been presented, and a general case involving rework and other progress
events is highlighted. This general case is considered in subsequent chapters along
with the development of a schedule analysis mechanism for quantifying the impact of
rework on the duration of the project and to apportion project delays among the parties
responsible, in order to optimize corrective actions.

48
CHAPTER 4
SCHEDULE ANALYSIS CONSIDERING
REWORK, DELAY, AND ACCELERATION
4.1 Introduction
As mentioned in Chapter 3, the basis for the new rework representation is the daily
recording of events, including rework, on the schedule. Based on this daily
representation, schedule analysis should be applied in order to determine the amount of
the project extension and the responsibility for the delays. In the literature, two specific
studies (Hegazy and Menesi, 2008; Hegazy and Zhang, 2005) have proposed schedule
analysis mechanisms that use a daily representation but that does not include rework. It
is thus important to extend previous schedule analysis mechanisms by incorporating
rework into the formulation. This chapter therefore begins with a description of the
previous analysis mechanism and then introduces the suggested modifications for
incorporating rework.
4.2 Rework Mitigation Strategies
Rework mitigation mandates the acceleration of the project in order to recover the
resulting delays. According to the American Association of Cost Engineers International
(AACE 2004), acceleration, which sometimes referred to as schedule compression or
schedule crashing, is formally defined as “A method of schedule analysis used to
shorten the critical path of the schedule.”

49
Generally, however, Construction literature mentions three main acceleration strategies,
which depend on the type of project and its duration and on the type of delay to be
recovered. The three common types of acceleration strategies are shown in Fig. 4.1 and
briefly discussed below:
Fig. 4.1: Acceleration Strategies
Change the Activities’ Logical Relations: One of the easiest ways for a Contractor to
accelerate a project is to re-sequence the activities. Most construction schedules have
logical links that are driven by either physical constraints (hard logic) or resource
constraints. Some of the logical links may also be driven by the Contractor, which
means that the logical links can be flexible (soft logic) and can be changed to save
project time.
Improve Construction Productivity: The addition of extra resources to improve
productivity is often the first response to a direction to accelerate, although this step
may not be the most economical. The added resources could either be equipment or
labour. Another approach for increasing productivity is to schedule overtime work.
However, may lead to reduced productivity over an extended period, and involves the
Acceleration Strategies
Change Activities’
Logical Relations
Improve Construction
Productivity
Expedite and Reduce
Delivery Time

50
payment of an overtime premium, which must also be included in the cost of the
acceleration.
Expedite and Reduce Material Delivery Lead-Time: If the critical path of a project
includes procurement activities, shortening the material lead-time results in an
accelerated schedule. The lead-time could be shortened by paying for the reduced lead-
time or by adopting a partial delivery approach, in which the material delivery is divided
into smaller delivery packages that are sequenced according to the site need dates.
Another approach to controlling the delivery of the material is through close expediting
and follow-up with vendors in order to resolve any obstacles or delays that might arise
in the production or supply of materials and equipment.
The above strategies could be used to accelerate the project after the amount that must
be accelerated or mitigated is quantified. This amount depends on a thorough analysis
of the schedule.
4.3 Utilizing Existing Schedule Analysis Tools
The latest schedule analysis mechanism developed by Hegazy and Menesi (2008) uses
the daily windows analysis that was first introduced by Hegazy and Zhang (2005), but
with two important extensions: (1) consideration of the impact of multiple baseline
updates and (2) consideration of the impact of resource over-allocation on delay
analysis. To capture and consider all the fluctuations in the critical path(s), the window
size used is one day. The simple example in Fig. 4.2 demonstrates this daily windows
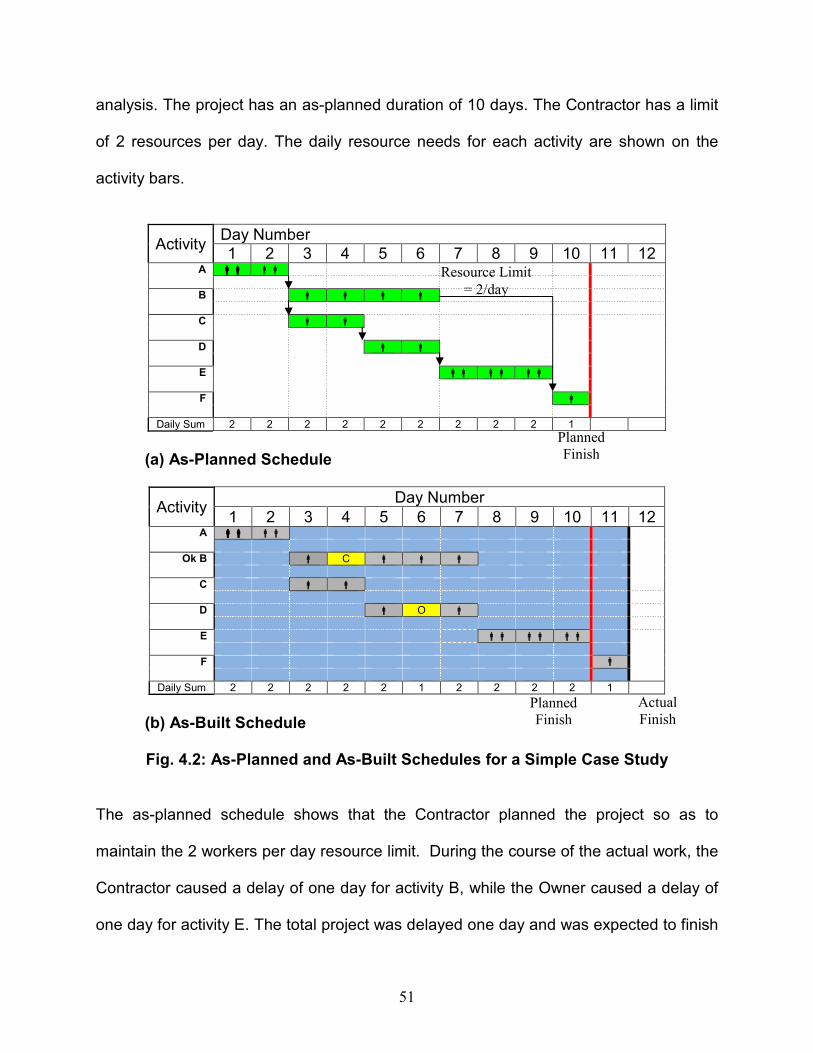
51
analysis. The project has an as-planned duration of 10 days. The Contractor has a limit
of 2 resources per day. The daily resource needs for each activity are shown on the
activity bars.
Activity Day Number 1 2 3 4 5 6 7 8 9 10 11 12
A �������� �� B � � � � C � � D � � E �� �� �� F �
Daily Sum 2 2 2 2 2 2 2 2 2 1
(a) As-Planned Schedule
Activity Day Number
1 2 3 4 5 6 7 8 9 10 11 12 A �������� ��
Ok B � C � � � C � � D � O � E �� �� �� F �
Daily Sum 2 2 2 2 2 1 2 2 2 2 1
(b) As-Built Schedule
Fig. 4.2: As-Planned and As-Built Schedules for a Simple Case Study
The as-planned schedule shows that the Contractor planned the project so as to
maintain the 2 workers per day resource limit. During the course of the actual work, the
Contractor caused a delay of one day for activity B, while the Owner caused a delay of
one day for activity E. The total project was delayed one day and was expected to finish
Planned
Finish
Resource Limit
= 2/day
Planned
Finish
Actual
Finish
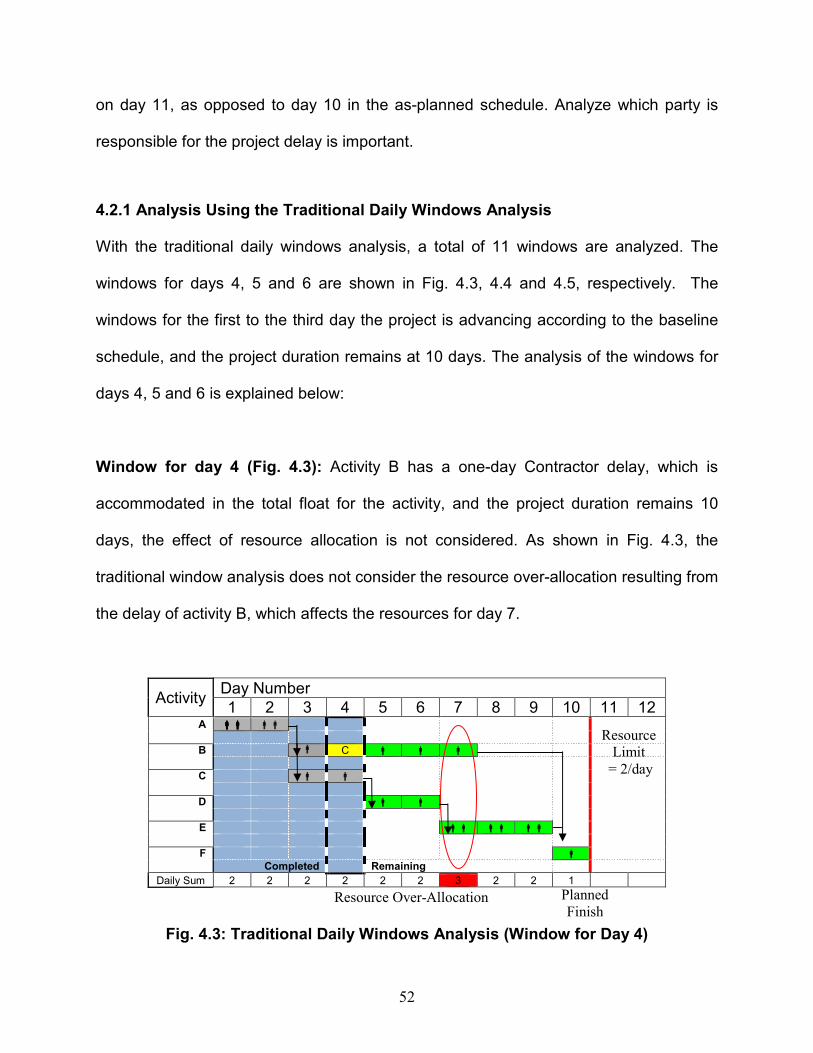
52
on day 11, as opposed to day 10 in the as-planned schedule. Analyze which party is
responsible for the project delay is important.
4.2.1 Analysis Using the Traditional Daily Windows Analysis With the traditional daily windows analysis, a total of 11 windows are analyzed. The
windows for days 4, 5 and 6 are shown in Fig. 4.3, 4.4 and 4.5, respectively. The
windows for the first to the third day the project is advancing according to the baseline
schedule, and the project duration remains at 10 days. The analysis of the windows for
days 4, 5 and 6 is explained below:
Window for day 4 (Fig. 4.3): Activity B has a one-day Contractor delay, which is
accommodated in the total float for the activity, and the project duration remains 10
days, the effect of resource allocation is not considered. As shown in Fig. 4.3, the
traditional window analysis does not consider the resource over-allocation resulting from
the delay of activity B, which affects the resources for day 7.
Activity Day Number 1 2 3 4 5 6 7 8 9 10 11 12
A �������� �� B � C � � � C � � D � � E �� �� �� F �
Completed Remaining
Daily Sum 2 2 2 2 2 2 3 2 2 1
Fig. 4.3: Traditional Daily Windows Analysis (Window for Day 4)
Planned
Finish
Resource
Limit
= 2/day
Resource Over-Allocation
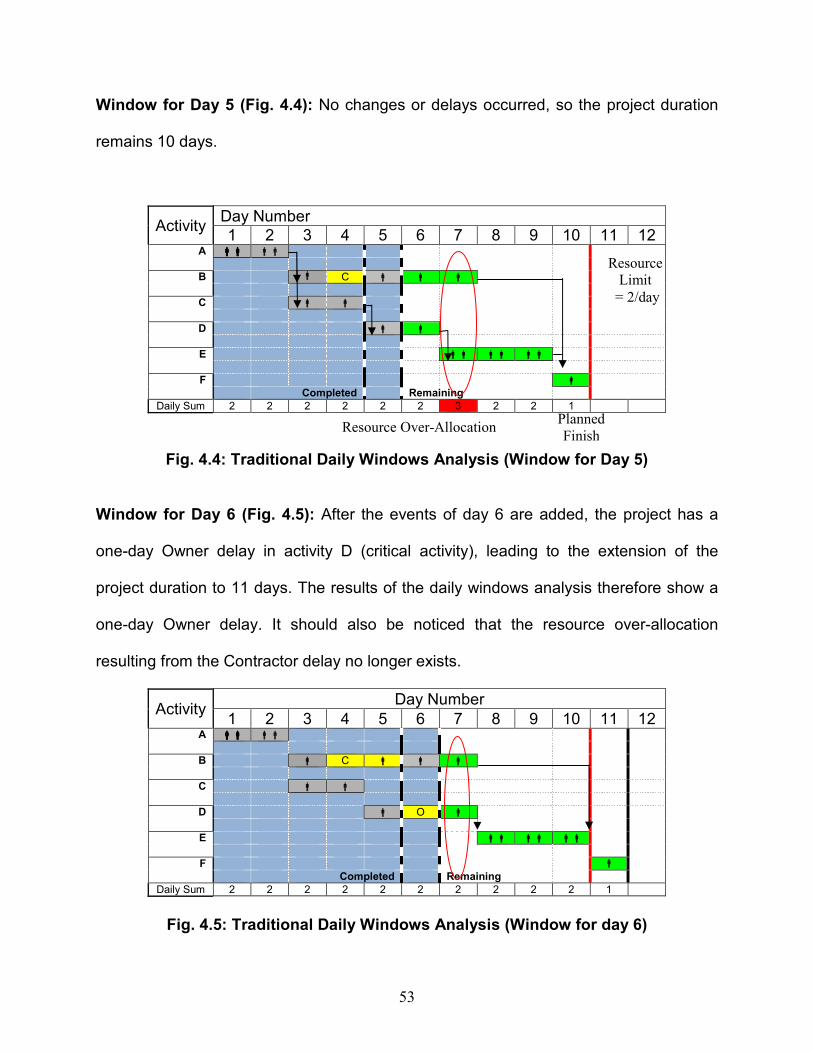
53
Window for Day 5 (Fig. 4.4): No changes or delays occurred, so the project duration
remains 10 days.
Activity Day Number 1 2 3 4 5 6 7 8 9 10 11 12
A �������� �� B � C � � � C � � D � � E �� �� �� F �
Completed Remaining Daily Sum 2 2 2 2 2 2 3 2 2 1
Fig. 4.4: Traditional Daily Windows Analysis (Window for Day 5)
Window for Day 6 (Fig. 4.5): After the events of day 6 are added, the project has a
one-day Owner delay in activity D (critical activity), leading to the extension of the
project duration to 11 days. The results of the daily windows analysis therefore show a
one-day Owner delay. It should also be noticed that the resource over-allocation
resulting from the Contractor delay no longer exists.
Activity Day Number
1 2 3 4 5 6 7 8 9 10 11 12 A �������� �� B � C � � � C � � D � O � E �� �� �� F �
Completed Remaining Daily Sum 2 2 2 2 2 2 2 2 2 2 1
Fig. 4.5: Traditional Daily Windows Analysis (Window for day 6)
Planned
Finish
Resource
Limit
= 2/day
Resource Over-Allocation
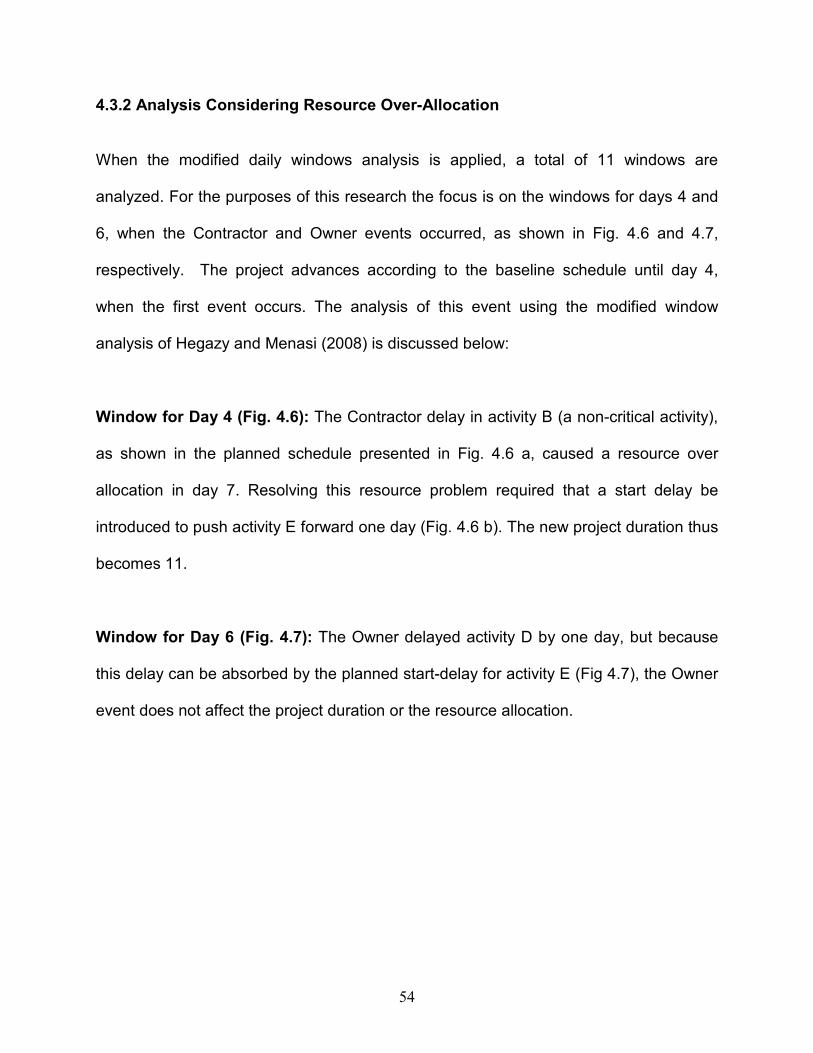
54
4.3.2 Analysis Considering Resource Over-Allocation When the modified daily windows analysis is applied, a total of 11 windows are
analyzed. For the purposes of this research the focus is on the windows for days 4 and
6, when the Contractor and Owner events occurred, as shown in Fig. 4.6 and 4.7,
respectively. The project advances according to the baseline schedule until day 4,
when the first event occurs. The analysis of this event using the modified window
analysis of Hegazy and Menasi (2008) is discussed below:
Window for Day 4 (Fig. 4.6): The Contractor delay in activity B (a non-critical activity),
as shown in the planned schedule presented in Fig. 4.6 a, caused a resource over
allocation in day 7. Resolving this resource problem required that a start delay be
introduced to push activity E forward one day (Fig. 4.6 b). The new project duration thus
becomes 11.
Window for Day 6 (Fig. 4.7): The Owner delayed activity D by one day, but because
this delay can be absorbed by the planned start-delay for activity E (Fig 4.7), the Owner
event does not affect the project duration or the resource allocation.

55
Activity Day Number
1 2 3 4 5 6 7 8 9 10 11 12 A �������� �� B � C � � � C � � D � � E �� �� �� F �
Completed Remaining
Daily Sum 2 2 2 2 2 2 3 2 2 1
a) Schedule Before Resolving the Resource Over-Allocation
Activity Day Number
1 2 3 4 5 6 7 8 9 10 11 12 A �������� �� B � C � � � C � � D � � E 1 �� �� ��
F �
Completed Remaining Daily Sum 2 2 2 2 2 2 1 2 2 2 1
b) Schedule After Resolving the Resource Over-Allocation
Fig. 4.6: Modified Daily Windows Analysis (window of day 4)
Activity Day Number
1 2 3 4 5 6 7 8 9 10 11 12 A �������� �� B � C � � � C � � D � O � E �� �� �� F �
Completed Remaining Daily Sum 2 2 2 2 2 1 2 2 2 2 1
Fig. 4.7: Modified Daily Windows Analysis (Window of day 6)
Planned
Finish
Resource
Limit
= 2/day
Resource Over-Allocation
Resource Limit
= 2/day
Planned Finish Expected
Finish
Planned
Finish Expected
Finish

56
When the process is continued for the remaining windows (from day 7 to day 11), the
project duration remains at 11 days. Therefore, the conclusion of the modified daily
windows analysis is a one-day Contractor delay since the Contractor would have
delayed the project one day even if the Owner had not caused the further delay. A
comparison of the modified versus the traditional daily windows results is shown in
Table 4.1. This example thus demonstrated the importance of considering resource
over-allocation to produce accurate schedule analysis.
Table 4.1: Results of the Traditional and Modified Daily Windows Analyses
Approach Delay Responsibility
Owner (O) Contractor (C) Traditional Daily Windows 1 0 Modified Daily Windows 0 1
4.3 Schedule Analysis Considering Rework and Acceleratio
In this section, the approach of Hegazy and Menasi (2008) has been extended to
include consideration of rework events caused by any of the project parties, that is, the
Owner or The Contractor. The extended analysis technique is also beneficial for
detailed project documentation and record keeping. Using the same as-planned
schedules presented in the previous section, rework events are recorded on the
schedule along with other schedule events, such as accelerations and delays. The as-
planned and as-built schedules are shown in Fig. 4.8a, and Fig 4.8b, respectively.
When the modified daily windows analysis is applied to the schedule, a total of 14
windows are analyzed. The current research focused on the windows for days 4, 5, 6, 7,
10, 11, 12, 13, and 14, explained below:
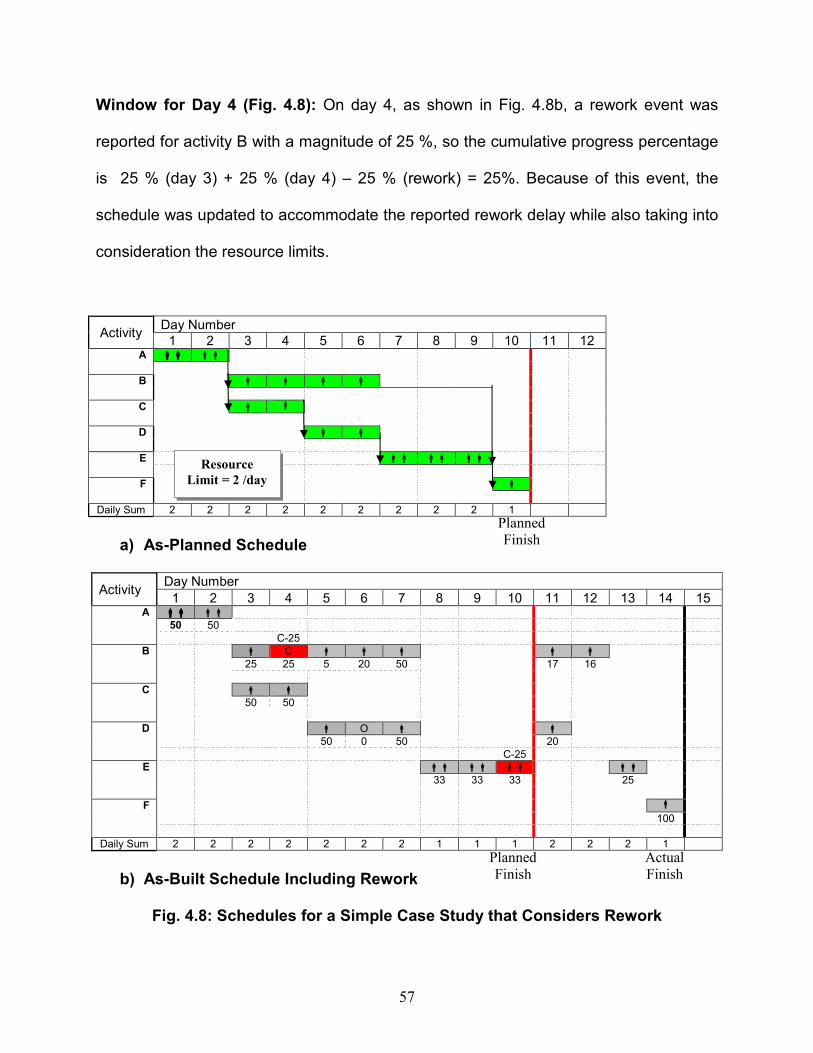
57
Window for Day 4 (Fig. 4.8): On day 4, as shown in Fig. 4.8b, a rework event was
reported for activity B with a magnitude of 25 %, so the cumulative progress percentage
is 25 % (day 3) + 25 % (day 4) – 25 % (rework) = 25%. Because of this event, the
schedule was updated to accommodate the reported rework delay while also taking into
consideration the resource limits.
Activity Day Number
1 2 3 4 5 6 7 8 9 10 11 12 A �������� �� B � � � � C � � D � � E �� �� �� F �
Daily Sum 2 2 2 2 2 2 2 2 2 1
a) As-Planned Schedule
Activity Day Number
1 2 3 4 5 6 7 8 9 10 11 12 13 14 15 A �������� �� 50 50 C-25 B � C � � � � � 25 25 5 20 50 17 16 C � � 50 50 D � O � � 50 0 50 20 C-25 E �� �� �� �� 33 33 33 25 F � 100
Daily Sum 2 2 2 2 2 2 2 1 1 1 2 2 2 1
b) As-Built Schedule Including Rework
Fig. 4.8: Schedules for a Simple Case Study that Considers Rework
Planned
Finish
Planned
Finish Actual
Finish
Resource
Limit = 2 /day
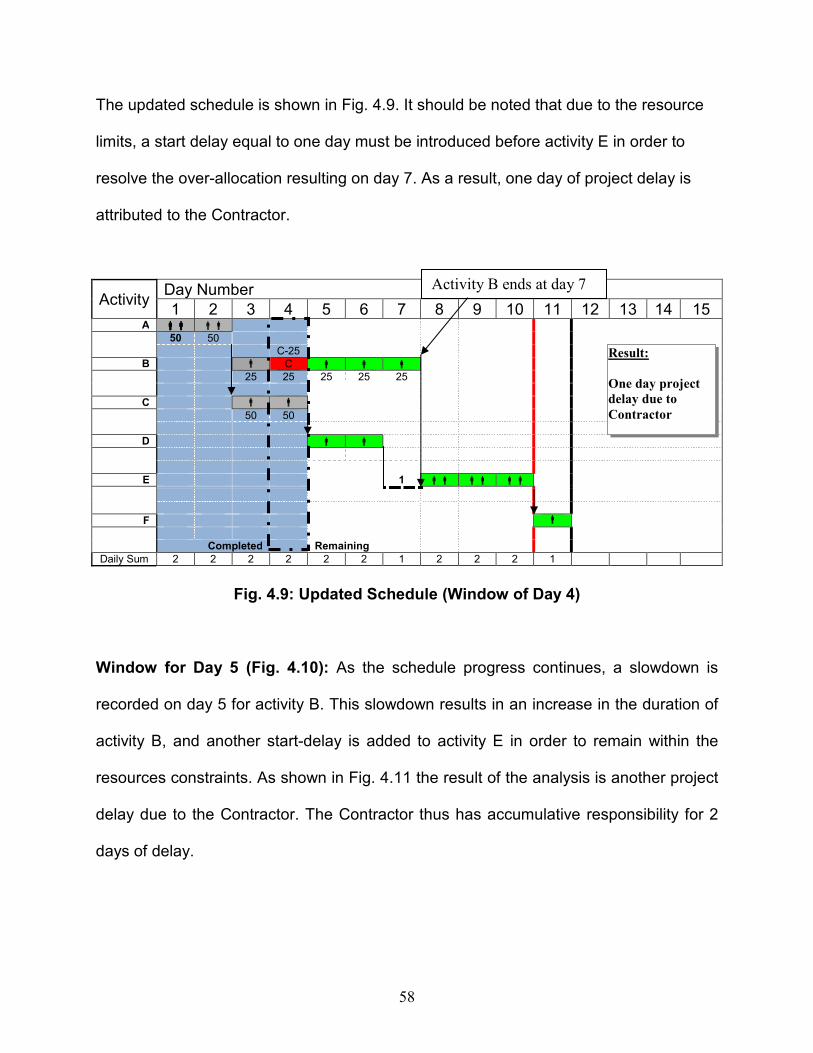
58
The updated schedule is shown in Fig. 4.9. It should be noted that due to the resource
limits, a start delay equal to one day must be introduced before activity E in order to
resolve the over-allocation resulting on day 7. As a result, one day of project delay is
attributed to the Contractor.
Activity Day Number
1 2 3 4 5 6 7 8 9 10 11 12 13 14 15 A �������� �� 50 50 C-25 B � C � � � 25 25 25 25 25 C � � 50 50 D � � E 1 �� �� ��
F �
Completed Remaining Daily Sum 2 2 2 2 2 2 1 2 2 2 1
Fig. 4.9: Updated Schedule (Window of Day 4)
Window for Day 5 (Fig. 4.10): As the schedule progress continues, a slowdown is
recorded on day 5 for activity B. This slowdown results in an increase in the duration of
activity B, and another start-delay is added to activity E in order to remain within the
resources constraints. As shown in Fig. 4.11 the result of the analysis is another project
delay due to the Contractor. The Contractor thus has accumulative responsibility for 2
days of delay.
Result:
One day project
delay due to
Contractor
Activity B ends at day 7

59
Activity Day Number
1 2 3 4 5 6 7 8 9 10 11 12 13 14 15 A �������� �� 50 50 C-25 B � C � � � � 25 25 5 C � � 50 50 D � � 50 E 2 �� �� ��
F �
Completed Remaining Daily Sum 2 2 2 2 2 2 1 1 2 2 2 1
Fig. 4.10: Extended Daily Windows Analysis (Window for Day 5)
Window for Day 6 (Fig. 4.11): When the progress for day 6 is recorded, another
slowdown is documented for activity B, and an Owner event has stopped the work on
activity D. When the schedule is updated with the progress data and the remaining
duration is calculated for activities B and D, the project duration remains at 12 days, as
shown in Fig. 4.11. At this stage, the Contractor decided to accelerate activity B by
using a different method of execution that doubles productivity, and the remaining
duration of activity B was therefore decreased by one day, as shown in Fig. 4.12.
Accordingly, the duration of the project is shortened by one day so that the end date is
day 11 rather than day 12.
Planned
Finish Expected
Finish
Result:
2 days project
delay due to
Contractor
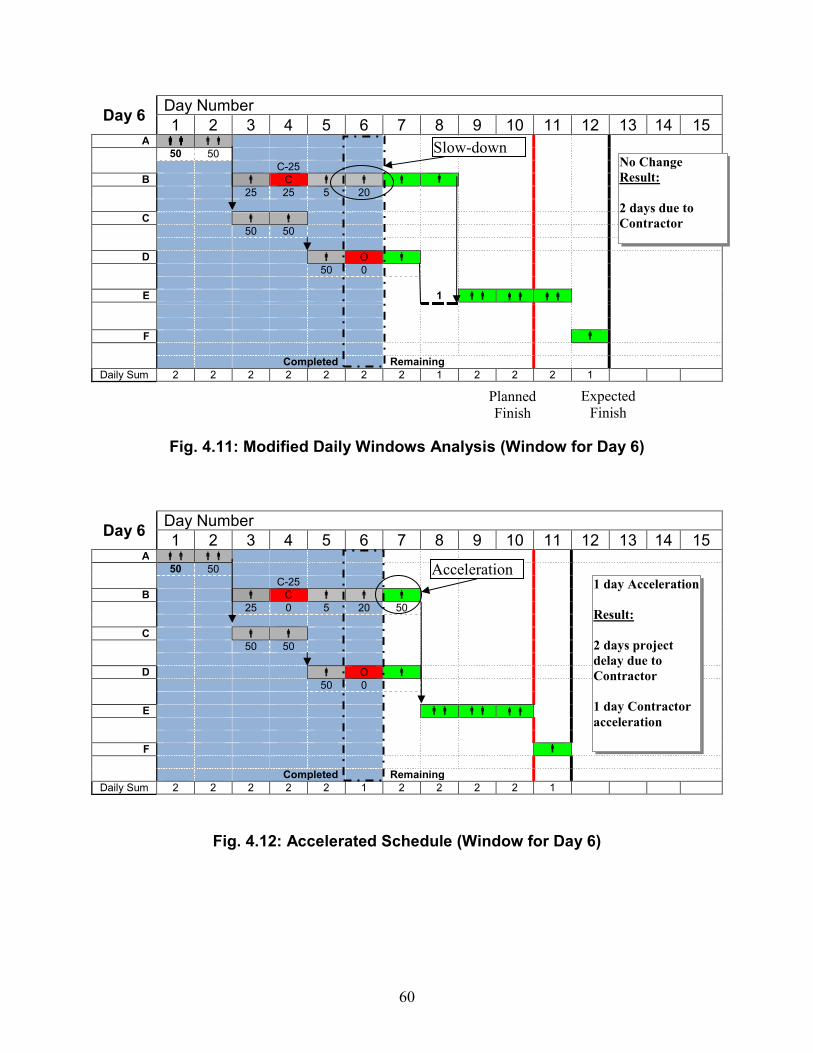
60
Day 6 Day Number
1 2 3 4 5 6 7 8 9 10 11 12 13 14 15 A �������� �� 50 50 C-25 B � C � � � � 25 25 5 20 C � � 50 50 D � O � 50 0 E 1 �� �� ��
F �
Completed Remaining Daily Sum 2 2 2 2 2 2 2 1 2 2 2 1
Fig. 4.11: Modified Daily Windows Analysis (Window for Day 6)
Day 6 Day Number 1 2 3 4 5 6 7 8 9 10 11 12 13 14 15
A �� �� 50 50 C-25 B � C � � � 25 0 5 20 50 C � � 50 50 D � O � 50 0 E �� �� �� F �
Completed Remaining Daily Sum 2 2 2 2 2 1 2 2 2 2 1
Fig. 4.12: Accelerated Schedule (Window for Day 6)
Planned
Finish Expected
Finish
No Change
Result:
2 days due to
Contractor
1 day Acceleration
Result:
2 days project
delay due to
Contractor
1 day Contractor
acceleration
Acceleration
Slow-down

61
Window for Day 10 (Fig. 4.13): AS the daily updates continues, a rework event is
recorded on day 10 for activity E with a value of 25 %, as shown in Fig. 4.13. The
rework required for activity E affects not only that activity but also other activities which
have already been completed. Activities B and D will therefore need to include rework
with amounts equal to 33 % and 20 %, respectively (Fig. 4.14). Since the rework in
activity E cannot start until the rework for the preceding activity is completed, the
calculation of remaining schedule must take into consideration the relations of the
activities and the resource limits, as shown in Fig.4.15. The schedule indicates a project
delay until day 14. Since all events are the Contractor’s responsibility, the analysis
results in 4 days allocated to the Contractor delay. This example thus shows the micro
level required for a consideration of the effect of schedule variables on project time, and
accordingly, cost.
Day 10 Day Number 1 2 3 4 5 6 7 8 9 10 11 12 13 14 15
A �� �� 50 50 C-25 B � C � � � 25 25 5 20 50 C � � 50 50 D � O � 50 0 50 C-25 E �� �� �� 34 33 33 F �
Completed Remaining Daily Sum 2 2 2 2 2 1 2 2 2 2 1
Fig. 4.13: Extended Daily Windows Analysis (Window for Day 10)
Planned
Finish Expected
Finish
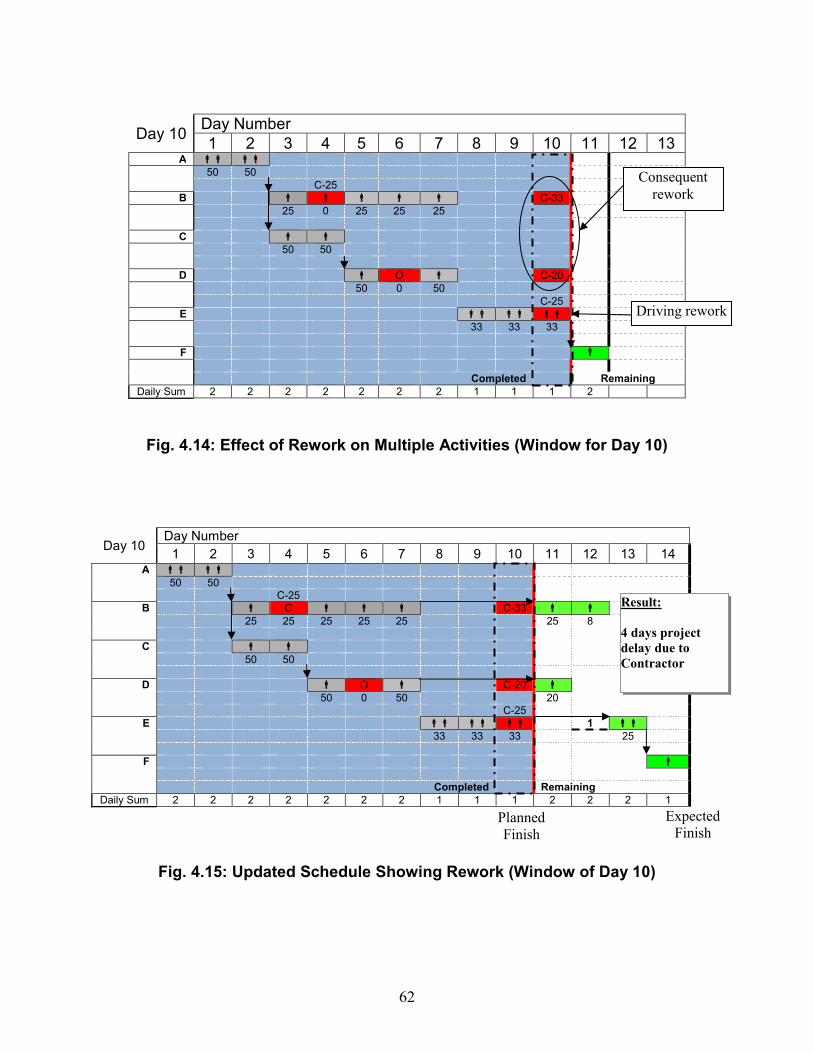
62
Day 10 Day Number 1 2 3 4 5 6 7 8 9 10 11 12 13
A �� �� 50 50 C-25 B � � � � � C-33 25 0 25 25 25 C � � 50 50 D � O � C-20 50 0 50 C-25 E �� �� �� 33 33 33 F �
Completed Remaining
Daily Sum 2 2 2 2 2 2 2 1 1 1 2
Fig. 4.14: Effect of Rework on Multiple Activities (Window for Day 10)
Day 10 Day Number
1 2 3 4 5 6 7 8 9 10 11 12 13 14 A �� �� 50 50 C-25 B � C � � � C-33 � � 25 25 25 25 25 25 8 C � � 50 50 D � O � C-20 � 50 0 50 20 C-25 E �� �� �� 1 �� 33 33 33 25 F � Completed Remaining
Daily Sum 2 2 2 2 2 2 2 1 1 1 2 2 2 1
Fig. 4.15: Updated Schedule Showing Rework (Window of Day 10)
Driving rework
Consequent
rework
Planned
Finish
Expected
Finish
Result:
4 days project
delay due to
Contractor

63
4.4 Analysis of Rework Due to Multiple Parties
For an even more complex situation involving rework due to multiple parties can be
examined through consideration of the simple case study shown in fig. 4.16, which is a
modified version of the previous case study. Fig. 4.16 shows a 10-day plan in which all
resources are within the specified limit of 2 per day. Several progress events are shown
for the first 8 days, including work stops by the Owner and the Contractor. On the
current progress date (day 9) shown in Fig. 4.16b, rework caused by the Contractor
affects activity E (C-25%), and rework for activity B is the responsibility of the Owner,
and “O-33%” is therefore indicated. This rework thus extends the project to day 13
before the resource over-allocation is resolved and to day 14 after the resource over-
allocation is resolved (Fig. 4.16b). It should be noted that due to the rework, activity B
must be extended 2 days since the planned progress is 25 % daily, and the rework
amount is 33 %. At this point, the Contractor must consider all the daily events, the
rework, and the resource limit in order to calculate his share of the project delay.
Because the first 3 days of progress followed the planned schedule, the daily windows
analysis begins with day 4. As shown in Fig. 4.17, the Owner’s work stop (o) for activity
B caused an extension to the duration of the activity duration, thus causing a resource
over-allocation on day 7. When the Contractor resolves the resource allocation by
delaying activity E one day, as shown, a project delay of one day is then anticipated.
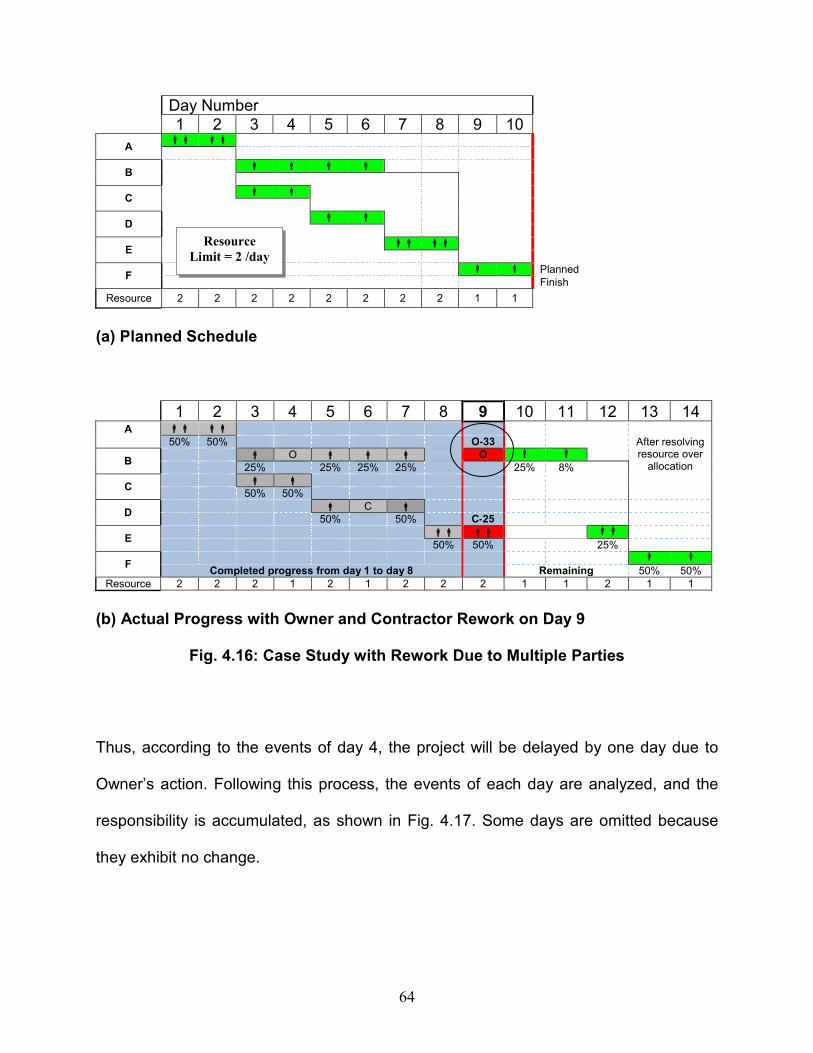
64
Day Number 1 2 3 4 5 6 7 8 9 10
A �� ��
B � � � �
C � �
D � �
E �� ��
F � � Planned Finish
Resource 2 2 2 2 2 2 2 2 1 1
(a) Planned Schedule
1 2 3 4 5 6 7 8 9 10 11 12 13 14 A
�� �� 50% 50% O-33 After resolving
resource over allocation B
� O � � � O � �
25% 25% 25% 25% 25% 8%
C � � 50% 50%
D � C �
50% 50% C-25
E �� �� �� 50% 50% 25%
F � �
Completed progress from day 1 to day 8 Remaining 50% 50% Resource 2 2 2 1 2 1 2 2 2 1 1 2 1 1
(b) Actual Progress with Owner and Contractor Rework on Day 9
Fig. 4.16: Case Study with Rework Due to Multiple Parties
Thus, according to the events of day 4, the project will be delayed by one day due to
Owner’s action. Following this process, the events of each day are analyzed, and the
responsibility is accumulated, as shown in Fig. 4.17. Some days are omitted because
they exhibit no change.
Resource
Limit = 2 /day
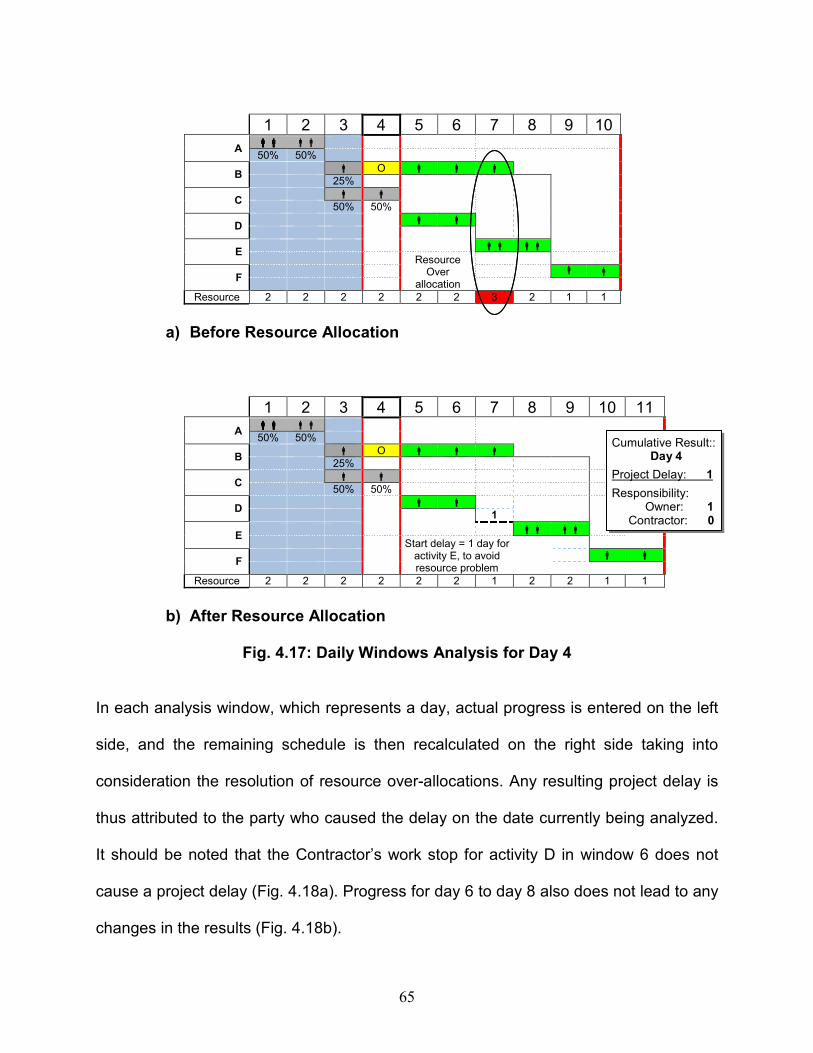
65
1 2 3 4 5 6 7 8 9 10
A �������� �� 50% 50%
B � O � � � 25%
C � � 50% 50%
D � �
E �� �� Resource
Over allocation
F � �
Resource 2 2 2 2 2 2 3 2 1 1
a) Before Resource Allocation
1 2 3 4 5 6 7 8 9 10 11
A �������� ��
One day
delay due to Owner
50% 50%
B � O � � � 25%
C � � 50% 50%
D � � 1
E �� �� Start delay = 1 day for
activity E, to avoid resource problem
F � �
Resource 2 2 2 2 2 2 1 2 2 1 1
b) After Resource Allocation
Fig. 4.17: Daily Windows Analysis for Day 4
In each analysis window, which represents a day, actual progress is entered on the left
side, and the remaining schedule is then recalculated on the right side taking into
consideration the resolution of resource over-allocations. Any resulting project delay is
thus attributed to the party who caused the delay on the date currently being analyzed.
It should be noted that the Contractor’s work stop for activity D in window 6 does not
cause a project delay (Fig. 4.18a). Progress for day 6 to day 8 also does not lead to any
changes in the results (Fig. 4.18b).
Cumulative Result:: Day 4
Project Delay: 1
Responsibility: Owner: 1 Contractor: 0

66
Day 6 1 2 3 4 5 6 7 8 9 10 11
A �� �� 50% 50%
B � O � � � 25% 25% 25% 25%
C � � 50% 50%
D � C � 50% 50%
E �� �� 50% 50%
F � � 50% 50%
Resource 2 2 2 2 2 2 2 2 2 1 1
a) Window for Day 6
Day 8 1 2 3 4 5 6 7 8 9 10 11
A �� �� 50% 50%
B � O � � � 25% 25% 25% 25%
C � � 50% 25%
D � C � 50% 50%
E �� �� 50% 50%
F � � 50% 50%
Resource 2 2 2 2 2 2 2 2 2 1 1
b) Window for Day 8
Fig. 4.18: Daily Windows Analysis for Days 6 to 8
The analysis for day 9, which included both Owner and Contractor rework (Fig. 4.16),
requires a detailed assessment of the actions of each party, and of both combined, as
shown in Fig. 4.19. The analysis for window 9 is as follows:
• The cumulative result from the previous window (8) is as follows: Owner (1),
Contractors (0), and Neither (0).
• The project extension in window 9 changes from day 11 (window 8) to day 14.
• The day 14 delay appears only when both actions are combined (right side of the
schedule in Fig. 4.19). Day 14 is therefore attributed to Owner + Contractor.
Result of days 1-5: Owner: 1 Contractor: 0
Day 6
Additional Delay: No
Result of days 1-7: Owner: 1 Contractor: 0
Day 8
Additional Delay: No
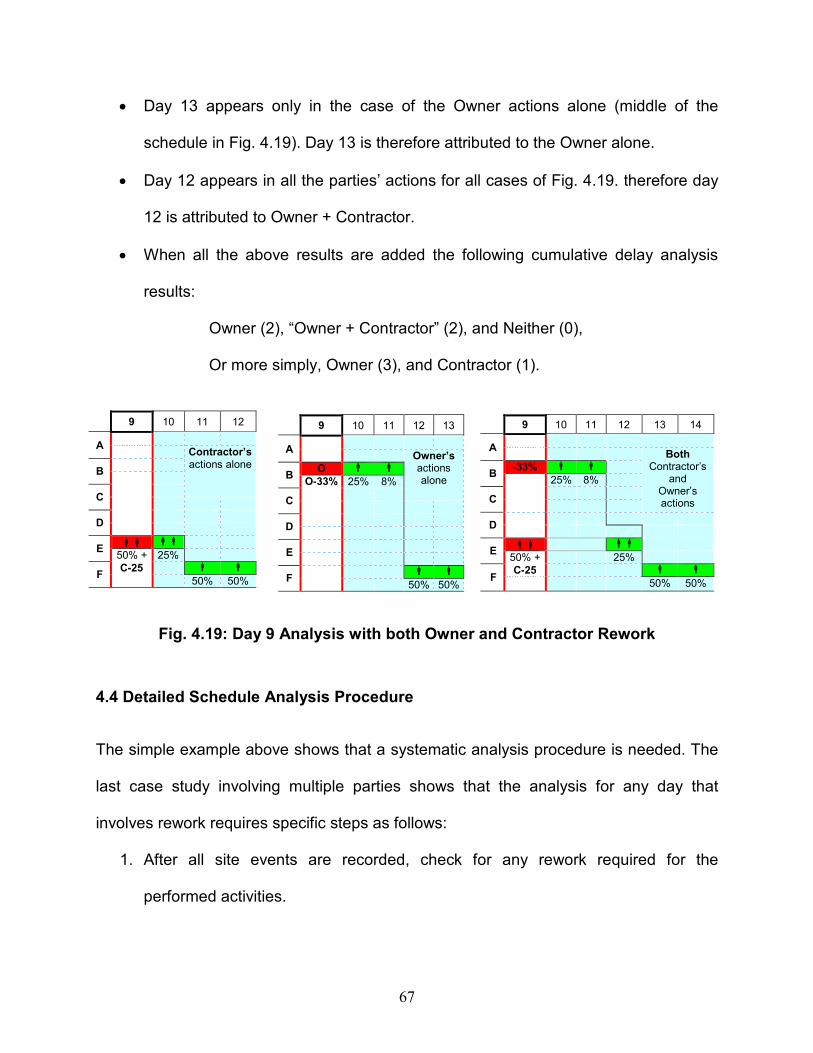
67
• Day 13 appears only in the case of the Owner actions alone (middle of the
schedule in Fig. 4.19). Day 13 is therefore attributed to the Owner alone.
• Day 12 appears in all the parties’ actions for all cases of Fig. 4.19. therefore day
12 is attributed to Owner + Contractor.
• When all the above results are added the following cumulative delay analysis
results:
Owner (2), “Owner + Contractor” (2), and Neither (0),
Or more simply, Owner (3), and Contractor (1).
9 10 11 12
A Contractor’s
actions alone B
C
D
E �� ��
50% + 25%
F C-25 � �
50% 50%
Fig. 4.19: Day 9 Analysis with both Owner and Contractor Rework
4.4 Detailed Schedule Analysis Procedure
The simple example above shows that a systematic analysis procedure is needed. The
last case study involving multiple parties shows that the analysis for any day that
involves rework requires specific steps as follows:
1. After all site events are recorded, check for any rework required for the
performed activities.
9 10 11 12 13
A Owner’s
actions alone B
O � �
O-33% 25% 8%
C
D
E
F � �
50% 50%
9 10 11 12 13 14
A Both
Contractor’s and
Owner’s actions
B -33% � �
25% 8%
C
D
E �� ��
50% + 25%
F C-25 � �
50% 50%

68
2. Check whether the rework affects multiple activities and calculate the magnitude
of the work needed for each activity.
3. Confirm whether the rework will be performed or postponed, or not performed.
a. If the decision is postponed or not performed repeat step one.
b. If the rework will be performed go to step 4.
4. Calculate the modified activity percentage complete (MPC %), as follows:
MPC % = Actual Progress to Date (%) – Rework Amount (%) (4.1)
Calculate the modified activity duration accordingly,
Modified Activity Duration
= Actual Duration to Date + Remaining Duration (4.2)
Where Remaining Duration = Planned Duration * (1 – MPC) (4.3)
5. Update the schedule to accommodate the required duration needed to perform
the reworked activities.
6. Check for resource allocation and use start delays to resolve any resource over-
allocation.
7. Update the schedule and check for baseline changes; if any exist, check the new
project duration (NPD).
8. Calculate delay = NPD – current project duration (CPD) (4.4)
9. If acceleration is required, check the strategies available and select the least
costly strategy that restores the CPD.
10. End and advance to the next day.

69
This detailed rework analysis procedure is shown in Fig. 4.20, and Fig. 4.21 also shows
the incorporation of the rework procedure into the extended daily window analysis
developed in this research.
Fig. 4.20: Flowchart of the Rework Analysis Process
Record daily site progress
Check for rework occurrence and
record magnitude
Multiple
activities
Calculate time required for
rectification
Update schedule
Yes
No
No
Assign rework and
magnitude for each activity
Rectify
Yes
Resolve over allocation if
any
CPD = Current project duration
NPD = New project duration
Project delay d =NPD - CPD
Mitigate
delay
No
Check acceleration strategies
Update schedule
Yes
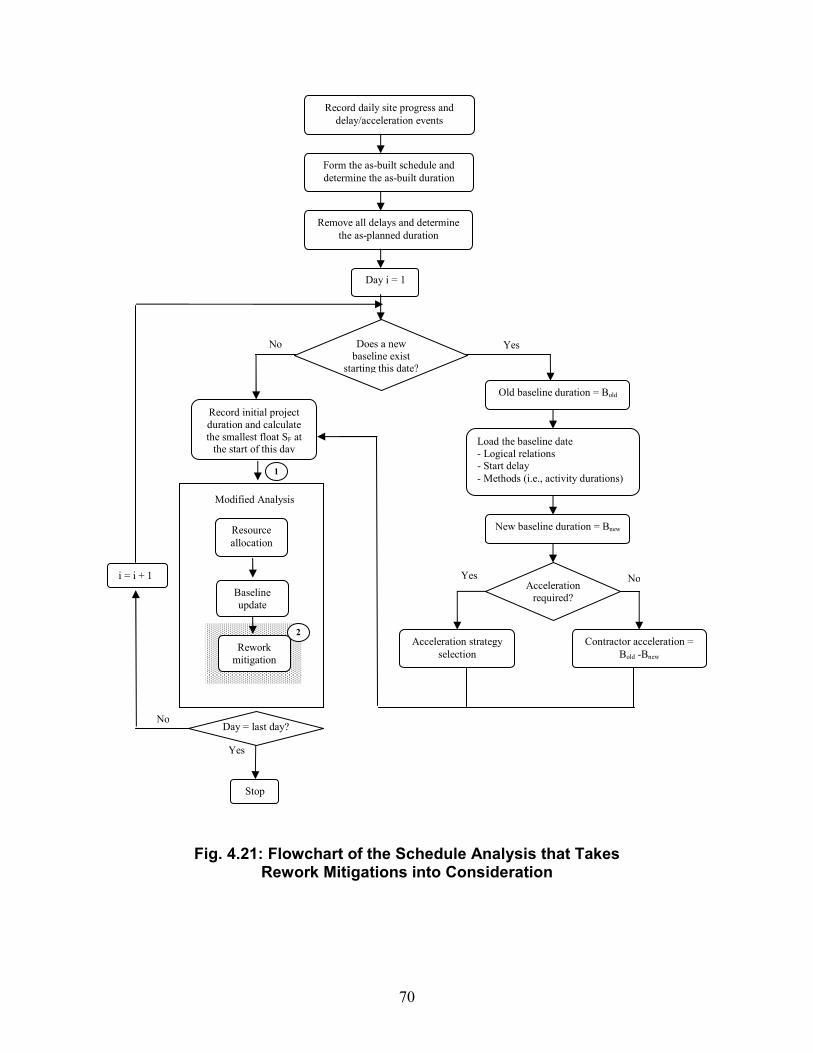
70
Fig. 4.21: Flowchart of the Schedule Analysis that Takes Rework Mitigations into Consideration
Record daily site progress and
delay/acceleration events
Form the as-built schedule and
determine the as-built duration
Remove all delays and determine
the as-planned duration
Day i = 1
Does a new
baseline exist starting this date?
Old baseline duration = Bold
Load the baseline date
- Logical relations - Start delay
- Methods (i.e., activity durations)
New baseline duration = Bnew
Acceleration
required?
Contractor acceleration =
Bold -Bnew
Acceleration strategy
selection
Yes
Yes No
No
Yes
i = i + 1
No
Record initial project
duration and calculate
the smallest float SF at the start of this day
Resource
allocation
Baseline
update
Chapter 4
Modified Analysis
1
2
Rework
mitigation
Day = last day?
Stop
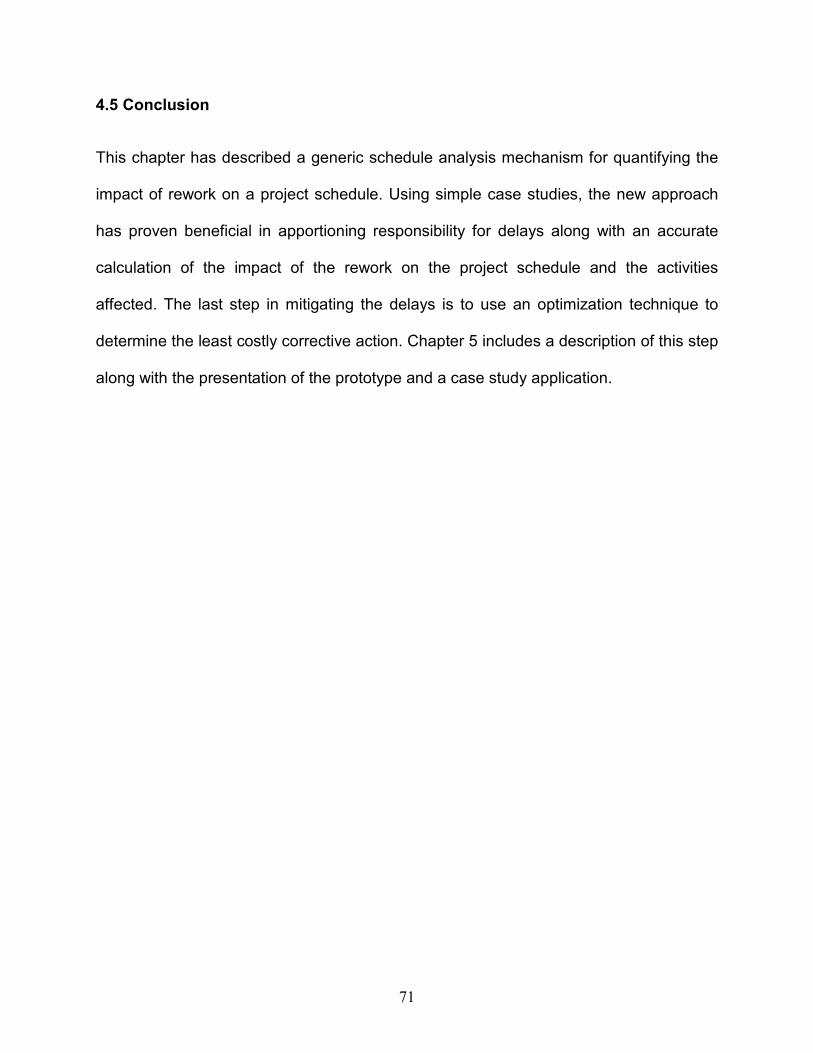
71
4.5 Conclusion
This chapter has described a generic schedule analysis mechanism for quantifying the
impact of rework on a project schedule. Using simple case studies, the new approach
has proven beneficial in apportioning responsibility for delays along with an accurate
calculation of the impact of the rework on the project schedule and the activities
affected. The last step in mitigating the delays is to use an optimization technique to
determine the least costly corrective action. Chapter 5 includes a description of this step
along with the presentation of the prototype and a case study application.
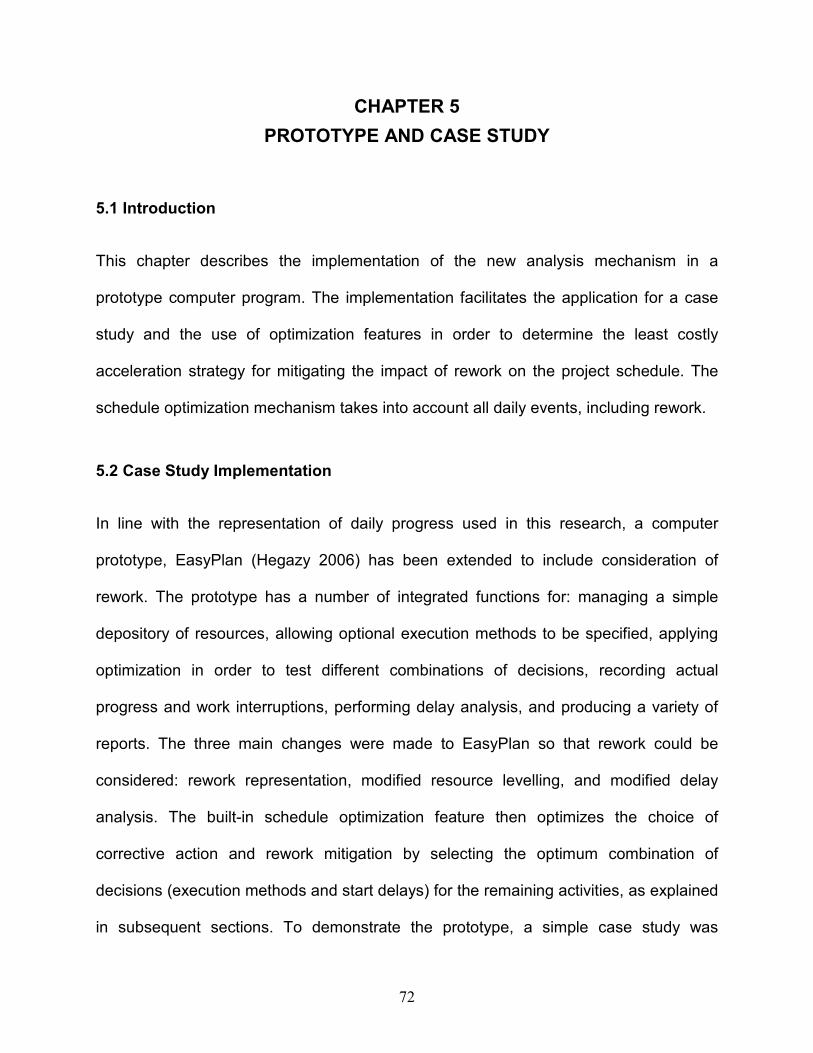
72
CHAPTER 5
PROTOTYPE AND CASE STUDY
5.1 Introduction
This chapter describes the implementation of the new analysis mechanism in a
prototype computer program. The implementation facilitates the application for a case
study and the use of optimization features in order to determine the least costly
acceleration strategy for mitigating the impact of rework on the project schedule. The
schedule optimization mechanism takes into account all daily events, including rework.
5.2 Case Study Implementation
In line with the representation of daily progress used in this research, a computer
prototype, EasyPlan (Hegazy 2006) has been extended to include consideration of
rework. The prototype has a number of integrated functions for: managing a simple
depository of resources, allowing optional execution methods to be specified, applying
optimization in order to test different combinations of decisions, recording actual
progress and work interruptions, performing delay analysis, and producing a variety of
reports. The three main changes were made to EasyPlan so that rework could be
considered: rework representation, modified resource levelling, and modified delay
analysis. The built-in schedule optimization feature then optimizes the choice of
corrective action and rework mitigation by selecting the optimum combination of
decisions (execution methods and start delays) for the remaining activities, as explained
in subsequent sections. To demonstrate the prototype, a simple case study was

73
analyzed using the prototype.
The case study is a segment of a real offshore oil and gas project. The selected
activities relate to the off-site preparation of the pipeline (sandblasting and coating),
transportation, and installation. Because the durations of the real activities were long, it
is not possible to demonstrate them clearly in this chapter. Therefore, for demonstration
purposes, the durations of the activities have been reduced, but the relationships
remained unchanged. The sample activities are thus shown in Table 5.1.
Table 5.1: Activities and Their Logical Relationships
Activity Number and Name Sequence 1. Material delivery 2. Sand blasting 3. Fusion Bond Epoxy (FBE) coating for type 1pipes 4. Concrete coating for type 2 pipes 5. Concrete curing for type 2 pipes 6. Transportation for FBE pipes (type 1) 7. Transportation for concrete coated pipes (type 2)
8. Loading to the transportation vessel and 9. Pipe installation
None (first activity) Starts after end of activity1 Starts after end of activity 2 Starts after end of activity 2 Starts one day after start of activity 4 Starts three days after start of activity 3 Starts after end of activity 6 and six days after start of activity 5 Starts after end of both activities 6 and 7 Starts after end of activity 8
5.2.1 Baseline Schedule Using the prototype, the project information is first entered into the project information
window shown in Fig. 5.1: project start date, deadline duration, and the delay penalty for
each day beyond the deadline. In this window, the resource availability limits are also
specified, as follows: resource L1 (limit = 3 per day) and resource L2 (limit = 1 per day).

74
Fig. 5.1: General Project Information
After the project general information is entered, the project activities and their optional
methods of construction, along with their durations, costs, and resource needs, are
defined in the system (Fig. 5.2). Initially, the cheapest construction option is used for the
activities and the more expensive alternatives, which have a shorter duration, are saved
as optional execution methods that can be used by the schedule optimization feature in
case the project needs to be accelerated for any reason, as discussed earlier. The
information about the activities is shown in Fig. 5.2.
Fig. 5.2: Activities and Their Construction Methods
Cheap & Slow
Option
Expensive & Fast
Option
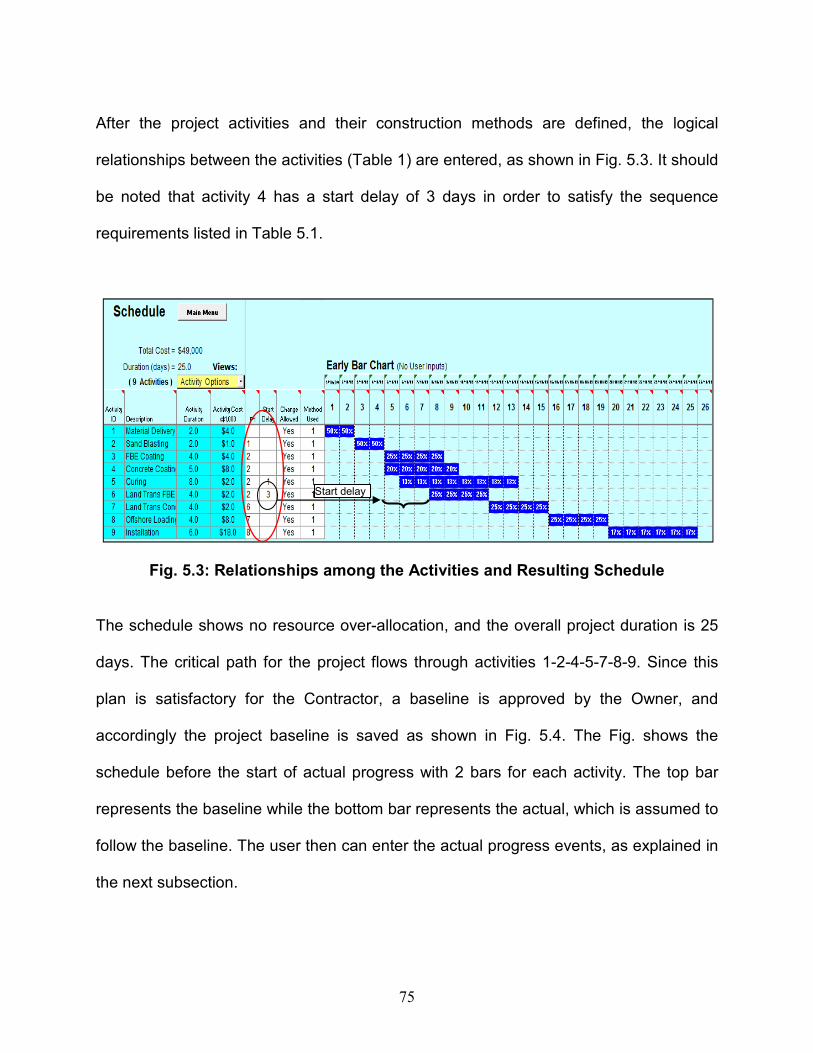
75
After the project activities and their construction methods are defined, the logical
relationships between the activities (Table 1) are entered, as shown in Fig. 5.3. It should
be noted that activity 4 has a start delay of 3 days in order to satisfy the sequence
requirements listed in Table 5.1.
Fig. 5.3: Relationships among the Activities and Resulting Schedule
The schedule shows no resource over-allocation, and the overall project duration is 25
days. The critical path for the project flows through activities 1-2-4-5-7-8-9. Since this
plan is satisfactory for the Contractor, a baseline is approved by the Owner, and
accordingly the project baseline is saved as shown in Fig. 5.4. The Fig. shows the
schedule before the start of actual progress with 2 bars for each activity. The top bar
represents the baseline while the bottom bar represents the actual, which is assumed to
follow the baseline. The user then can enter the actual progress events, as explained in
the next subsection.
Start delay
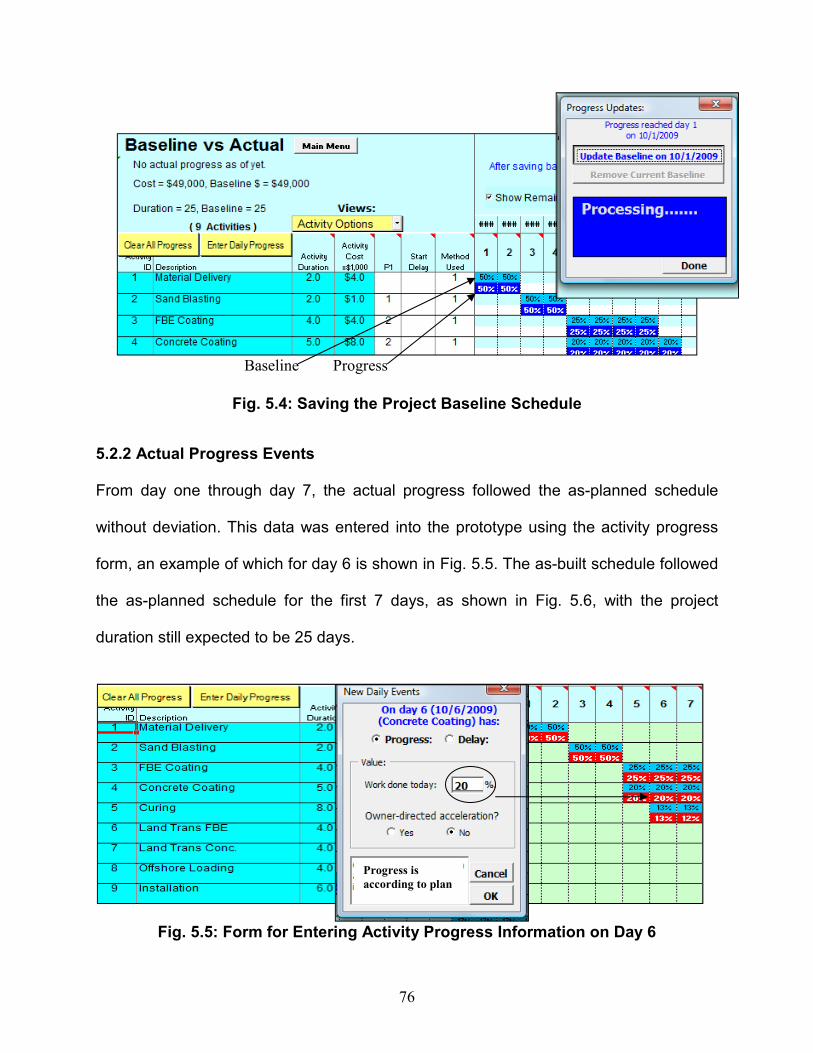
76
Fig. 5.4: Saving the Project Baseline Schedule
5.2.2 Actual Progress Events From day one through day 7, the actual progress followed the as-planned schedule
without deviation. This data was entered into the prototype using the activity progress
form, an example of which for day 6 is shown in Fig. 5.5. The as-built schedule followed
the as-planned schedule for the first 7 days, as shown in Fig. 5.6, with the project
duration still expected to be 25 days.
Fig. 5.5: Form for Entering Activity Progress Information on Day 6
Progress is
according to plan
Baseline Progress
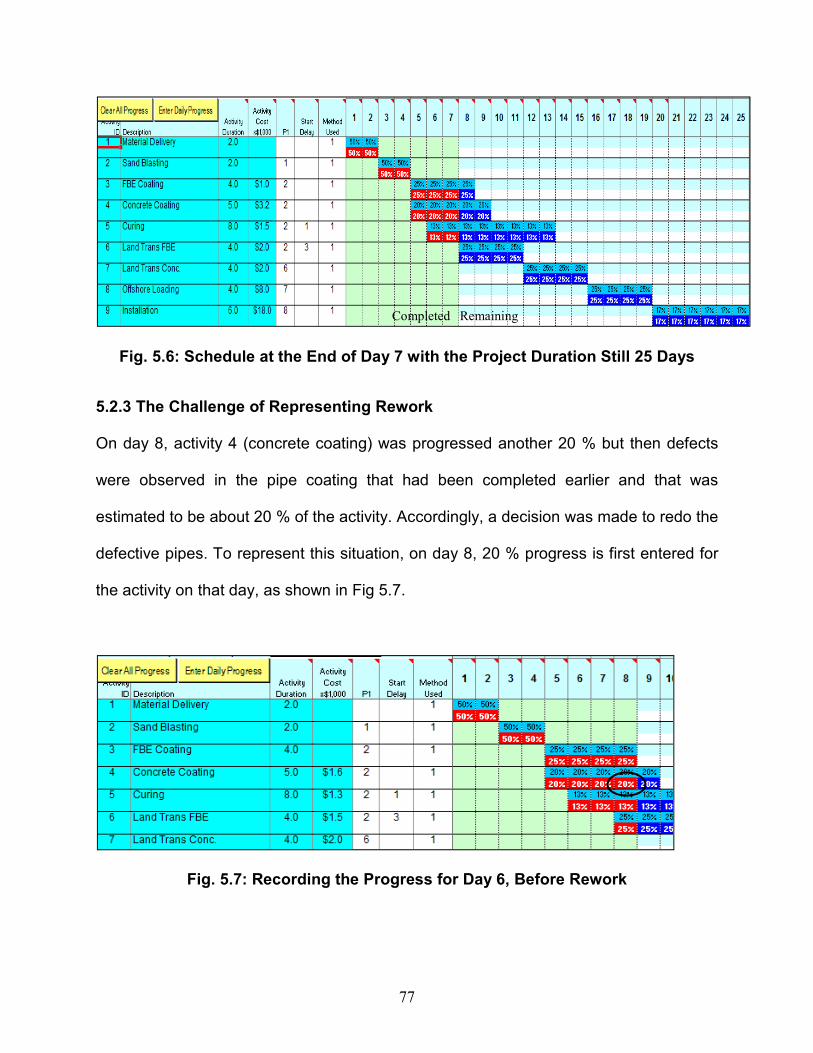
77
Fig. 5.6: Schedule at the End of Day 7 with the Project Duration Still 25 Days
5.2.3 The Challenge of Representing Rework On day 8, activity 4 (concrete coating) was progressed another 20 % but then defects
were observed in the pipe coating that had been completed earlier and that was
estimated to be about 20 % of the activity. Accordingly, a decision was made to redo the
defective pipes. To represent this situation, on day 8, 20 % progress is first entered for
the activity on that day, as shown in Fig 5.7.
Fig. 5.7: Recording the Progress for Day 6, Before Rework
Completed Remaining

78
Then, since the magnitude of the rework is calculated as 20 %, a rework event is then
entered as a negative percentage complete. Thus, the total amount of progress for the
activity on that day is zero, as shown in Fig 5.8.
Fig. 5.8: Updating Activity 4 on Day 6 Based on the Observed Rework
As a result of the rework, the duration of the activity is extended by the amount of time
needed to perform the rework, in this case, from 5 days in Fig. 5.7 to 6 days in Fig. 5.8.
It should be noted that the remaining part of the activity duration is calculated using Eq.
4.1. Therefore, activity 4 is scheduled to finish on day 10 rather than day 9. Moreover,
the extended duration of activity 4 was assessed and found to affect other activities as
follows:
• Successor activity 5 (curing) must be performed for the reworked pipes, and a
curing rework of 13 % must therefore be added, which will extend the total
duration for curing to 9 days (ending on day 14)
• Transportation activity 7 must be rearranged, and transportation will thus take 5
days rather than 4.
20% (progress)
+ C-20(20% rework)

79
Once these changes are made to the schedule, the project duration is extended to
26 days rather than 25, as shown in Fig. 5.9.
Fig. 5.9: Revised Schedule Showing the Rework in Activity 4 and Its Consequences
Concurrently with the Contractor events on day 8 described above, the Owner was
contemplating another rework on the same day, due to a design change for activity 3
(FBE coating), which represented 25 % of the total work for the activity. This rework
caused by the Owner is expected to impact other activities, mainly sandblasting (activity
2) in order to remove the old FBE coating (also 30 % of the work executed in activity 2).
The updated schedule resulting from these events is shown in Fig 5.10.

80
Fig. 5.10: Effect of Rework on Multiple Activities
As a result of these schedule events, the Contractor is not in a rush to complete the
transportation activity with the as-planned speed. To ensure the continued flow of
transportation activity and to save money, the Contractor decided to slow down the
remaining transportation activity, perceiving that it will not have a negative effect on the
schedule. However, the schedule in this case as shown in Fig. 5.11, also included a
resource over-allocation for day 12 due to the extension of activity 5 (FBE pipes
transportation). It is noted that the Contractor’s action of slowing down some activities is
common in practice and has been referred to in the literature as a pacing delay, which
changes the pace of some activities to match the pace of others (Zack, 1999).
O-25 for 25% rework forced
by the Owner in activity 3
Additional O-25 for related
Owner rework of 25% for
activity 2

81
Fig. 5.11: Updated Schedule Showing the Resource Over-Allocation
To resolve the resource over-allocation, the Contractor was forced to introduce a start
delay of one day to activity 7 (concrete coated pipes transportation). This start delay
affects the project duration by one day, so, the final updated schedule for the project
has 27-day duration, with a total delay of 2 days compared to the baseline. After all the
rework events and their effects on the project schedule are taken into consideration,
and after all the resource over-allocations are resolved, the schedule is updated as
shown in Fig. 5.12.
Fig. 5.12: Updated Schedule That considers Rework and Pacing Delays
Over Allocation
due to slow down

82
Based on the delay penalty amount mentioned in the project information (delay penalty
= $5,000 per day), the project team decided to investigate the mitigation strategies
available to enable them to meet the original project deadline.
Accelerating the project schedule involves changing some of the execution methods by
selecting faster (although more costly) ones. First, the responsibility for the delays
should be apportioned among the project parties. Both the traditional and the extended
daily window analysis were used to compare the results.
The traditional window analysis was used first when the project was analyzed as one
window of 27 days without considering the effect of resource over-allocation as shown
in Fig. 5.13, the 2 days of project delay were apportioned to the Contractor.
Fig. 5.13: Traditional Window Analysis Using One Window of 27 Days
Contractor Delayed Activities indicated Critical-Path has all Contractor events. Result:
2 days project delay is Contractor Responsibility
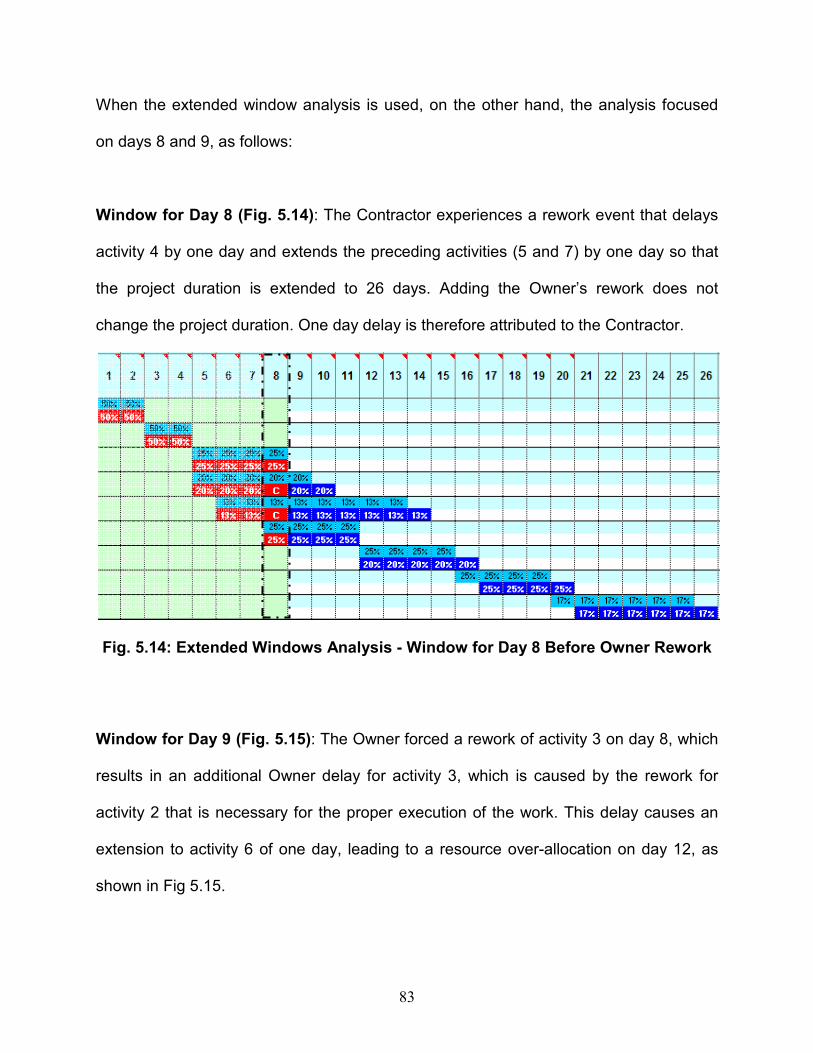
83
When the extended window analysis is used, on the other hand, the analysis focused
on days 8 and 9, as follows:
Window for Day 8 (Fig. 5.14): The Contractor experiences a rework event that delays
activity 4 by one day and extends the preceding activities (5 and 7) by one day so that
the project duration is extended to 26 days. Adding the Owner’s rework does not
change the project duration. One day delay is therefore attributed to the Contractor.
Fig. 5.14: Extended Windows Analysis - Window for Day 8 Before Owner Rework
Window for Day 9 (Fig. 5.15): The Owner forced a rework of activity 3 on day 8, which
results in an additional Owner delay for activity 3, which is caused by the rework for
activity 2 that is necessary for the proper execution of the work. This delay causes an
extension to activity 6 of one day, leading to a resource over-allocation on day 12, as
shown in Fig 5.15.
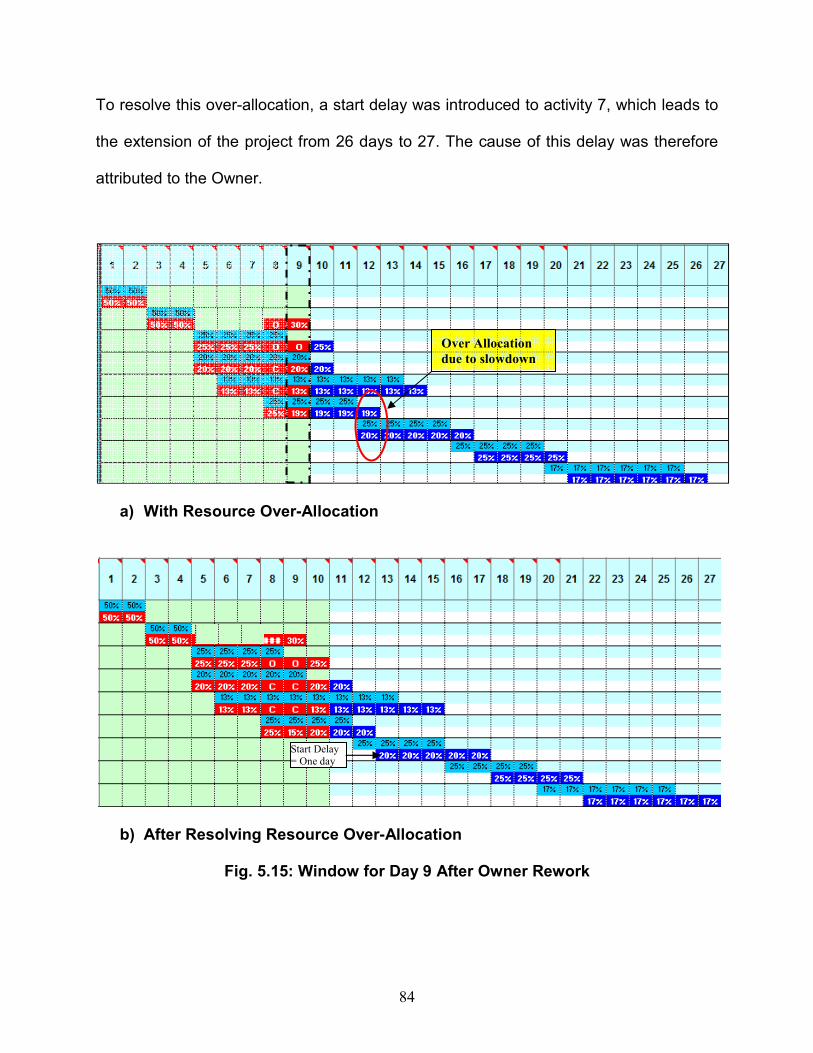
84
To resolve this over-allocation, a start delay was introduced to activity 7, which leads to
the extension of the project from 26 days to 27. The cause of this delay was therefore
attributed to the Owner.
a) With Resource Over-Allocation
b) After Resolving Resource Over-Allocation
Fig. 5.15: Window for Day 9 After Owner Rework
Over Allocation
due to slowdown
Start Delay = One day

85
The results of the analysis the project delays are as follows;
• One day of Contractor rework delay on day 8
• One day of Owner resource over-allocation delay on day 12
Based on this analysis, the project team then investigates the options for mitigating the
rework delay, as explained in the following subsection.
5.2.4 Optimizing the Mitigation Decision Once the results of the delay analysis are known (Owner (1) and Contractor (1)), the
Contractor can present these results to the Owner so that the Contractor can choose
between 2 options: (1) request a one-day extension due to the Owner delay and attempt
to mitigate his own one-day delay; (2) mitigate all delays by considering a one-day
Owner-directed acceleration. In general, however, the ability of the Contractor to
mitigate delays depends on when the rework is discovered and scheduled. The earlier
the rework occurs in the project, the less impact it will have and more options will also
be available for mitigating the impact. In the present case study, the rework was
introduced nearly in the middle of the project. The Contractor therefore seek to mitigate
all delay days and so that the 25-day duration deadline can be met without violating the
resource limit.
To facilitate the planning of corrective action, this research uses optimization to help the
Contractor select the best mitigation strategy. The mechanism basically involves total
cost minimization under time and resource constraints, which also takes into
86
consideration any penalty, incentive, or indirect costs. To enable the optimization,
optional execution methods (e.g., larger crew formations, better equipment, and/or
overtime hours) need to be identified for the activities remaining in the schedule. In
essence, two basic decisions are needed for each of the remaining activities: (1) the
execution method that will enable the deadline to be met with at minimum cost (e.g.,
normal versus a speedier and more costly option), and (2) any start time delay that can
be applied to any activity (as in Fig. 5.12 on day 12) to avoid resource over-allocation.
The combination of these activity decisions represents a corrective action plan.
Because of the number of possibilities for speeding up one activity versus another and
for delaying one activity versus another, any real-life project requires some automation
so that different combinations can be tested until a satisfactory or near optimum,
solution is determined.
Exploring the options available for the remaining duration of the project reveal 3
possible options. The Contractor has the option to crash one of 3 activities:
1- Activity 7, Concrete land transportation: an increase in cost of $ 2000
2- Activity 8, Offshore loading: an increase in cost of $ 4000
3- Activity 9, Installation: an increase in cost of $ 8000
Fig. 5.16 shows these crashed schedule options.
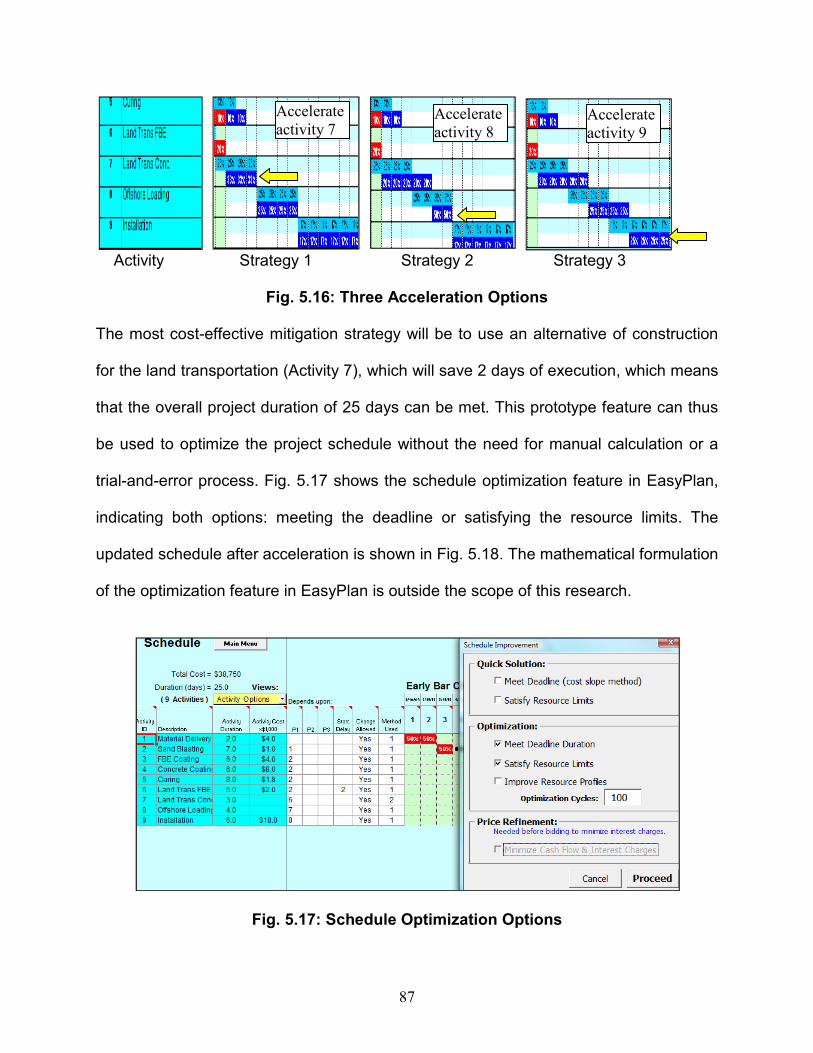
87
Activity Strategy 1 Strategy 2 Strategy 3
Fig. 5.16: Three Acceleration Options The most cost-effective mitigation strategy will be to use an alternative of construction
for the land transportation (Activity 7), which will save 2 days of execution, which means
that the overall project duration of 25 days can be met. This prototype feature can thus
be used to optimize the project schedule without the need for manual calculation or a
trial-and-error process. Fig. 5.17 shows the schedule optimization feature in EasyPlan,
indicating both options: meeting the deadline or satisfying the resource limits. The
updated schedule after acceleration is shown in Fig. 5.18. The mathematical formulation
of the optimization feature in EasyPlan is outside the scope of this research.
Fig. 5.17: Schedule Optimization Options
Accelerate
activity 7 Accelerate
activity 8 Accelerate
activity 9

88
Fig. 5.18: Updated Schedule after Acceleration (Activity 7)
5.2.5 Discussion of Results
The case study demonstrated the implementation of the proposed schedule analysis
mechanism on a portion of a simulated real project. The new rework representation
appears to provide an easier, more practical way to represent rework events in the
project schedule, without the need to introduce new activities or to split existing ones.
The project schedule is thus kept clear and visually informative in order to facilitate
progress updates and record keeping. The case study also shows the effects of rework
events on the project schedule.
The case study included examples of rework due to different causes. The first rework
was associated with a critical activity (activity 4) and was due to an error by the
Contractor on day 8, which is a common cause of rework. The rework therefore had a
direct effect on the schedule because it delayed the activities affected and their
successors. The second rework event occurred for a different reason. It was part of a
Faster
Execution

89
non-critical activity (activity 3) and occurred due a design change or omission that was
forced by the Owner. This rework event affected another (already completed) activity
(activity 2). In this case, the modeling included the realistic situation that involved the
Contractor slowing down an activity to balance the pace of construction. The rework
time also caused a resource over-allocation for activity 7, which led to the extension of
the project by an additional day.
The case study illustrates the effectiveness and practicality of the schedule analysis
procedure and the optimization mechanism. The system demonstrated its ability to
evaluate a number of acceleration methods, to compare their consequences with the
reported delay, and to propose a cost effective mitigation strategy and schedule
optimization procedure.
5.3 Conclusion
This chapter has discussed a simple implementation of the proposed rework analysis
mechanism on a computer program. Applying the prototype to a case study has
demonstrated its ability to consider a variety of causes of rework and to analyze their
consequences with respect to delay. To mitigate these delays, optional execution
methods have been examined in order to determine the least costly corrective active
plan. While the prototype allows a reasonably accurate representation of site events
and related analysis, several areas could be improved, as discussed in the following
chapter.

90
CHAPTER 6
CONCLUSION
6.1 Conclusion
Rework is a serious problem in the construction industry and has been identified as one
of the main causes of schedule delays and cost overruns. It has been reported that the
direct costs of rework exceed about 5 % of the total construction costs. Despite this
significant impact, traditionally no quantitative methods of schedule analysis have been
developed that consider the impact of rework on the project schedule.
The research has addressed this problem by introducing a new technique for
quantifying rework over the project schedule, through day-by-day segmentation of the
duration of activities. This method has proven to be beneficial for representing all
progress events, including rework. Scheduling in this case is more practical when it
reacts to the specific timing of progress events rather than relying on the cumulative
percentage complete.
The developed technique for analysing rework has been designed as a project control
tool with a core cost optimization feature. The technique has been demonstrated to
have several interesting features, including the following:
• It represents project rework events for activities affected on the same bar chart
used to display progress updates.

91
• It considers the magnitude of the rework and recalculates the remaining duration
of the activity.
• The responsibility for and magnitude and effects of the rework are apportioned
over the project schedule to the party responsible.
• The update of project schedule for each day includes all rework events, delays,
and accelerations.
• The prototype dynamically checks the project resources and provides prompt
resource over-allocation alerts.
• The baseline is updated whenever any changes occur in the logical relationships
between the activities and/or the duration of any of the activities is changed.
• The schedule can be optimized so that it adheres to deadlines and resource
limits.
6.2 Future Research and Development
More research is still needed so that practical situations can be considered within a
computational framework in order to support decisions about corrective action. This
research could be used as an initial point for further study that would enhance the
proposed technique and the prototype. Areas of potential improvement are as follows:
• Introduce a rework performance index that can be calculated during the
execution of a project in order to measure project performance with respect to
rework.
• One possible improvement to the representation presented in this research is to
consider the delay time before the commencement of the rework, as shown in
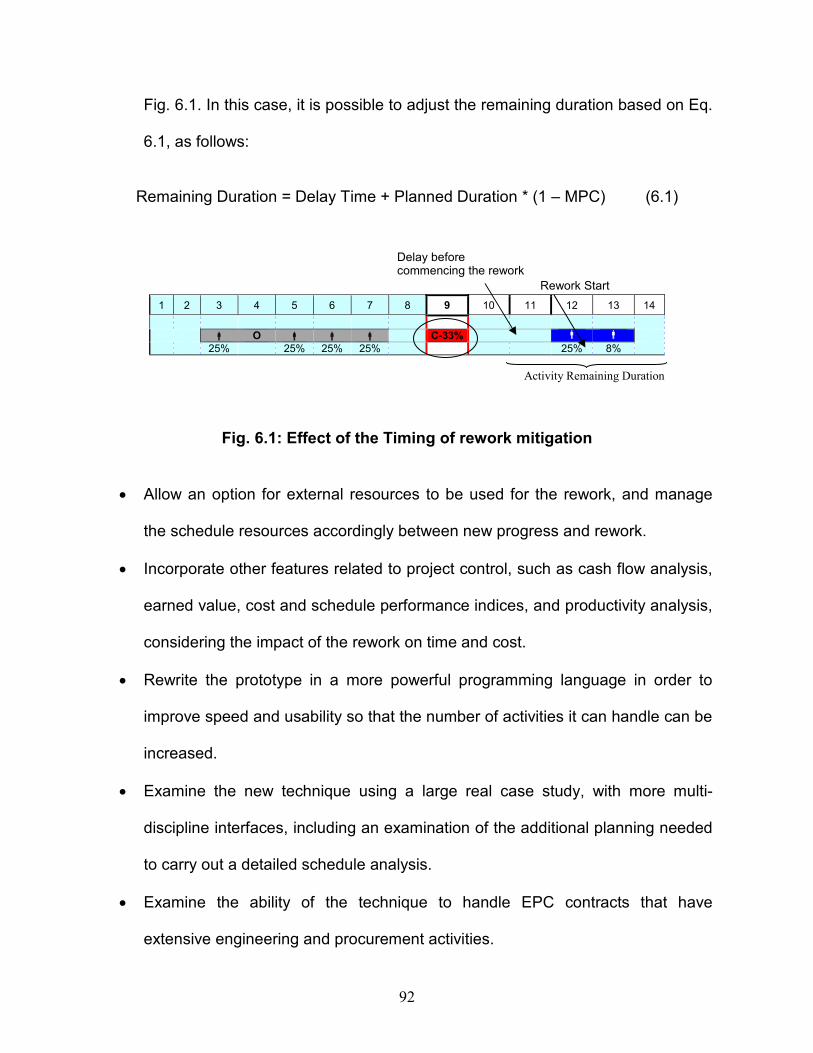
92
Fig. 6.1. In this case, it is possible to adjust the remaining duration based on Eq.
6.1, as follows:
Remaining Duration = Delay Time + Planned Duration * (1 – MPC) (6.1)
1 2 3 4 5 6 7 8 9 10 11 12 13 14 � O � � � C-33% � �
25% 25% 25% 25% 25% 8%
Fig. 6.1: Effect of the Timing of rework mitigation
• Allow an option for external resources to be used for the rework, and manage
the schedule resources accordingly between new progress and rework.
• Incorporate other features related to project control, such as cash flow analysis,
earned value, cost and schedule performance indices, and productivity analysis,
considering the impact of the rework on time and cost.
• Rewrite the prototype in a more powerful programming language in order to
improve speed and usability so that the number of activities it can handle can be
increased.
• Examine the new technique using a large real case study, with more multi-
discipline interfaces, including an examination of the additional planning needed
to carry out a detailed schedule analysis.
• Examine the ability of the technique to handle EPC contracts that have
extensive engineering and procurement activities.
Activity Remaining Duration
Rework Start
Delay before commencing the rework

93
• Experiment with different evolutionary optimization techniques in order to speed
up the optimization process.
• Add an early warning mechanism that can recognise rework events and
benchmark the areas that have a high frequency of occurrence so that the
project team can focus on these areas in future projects.
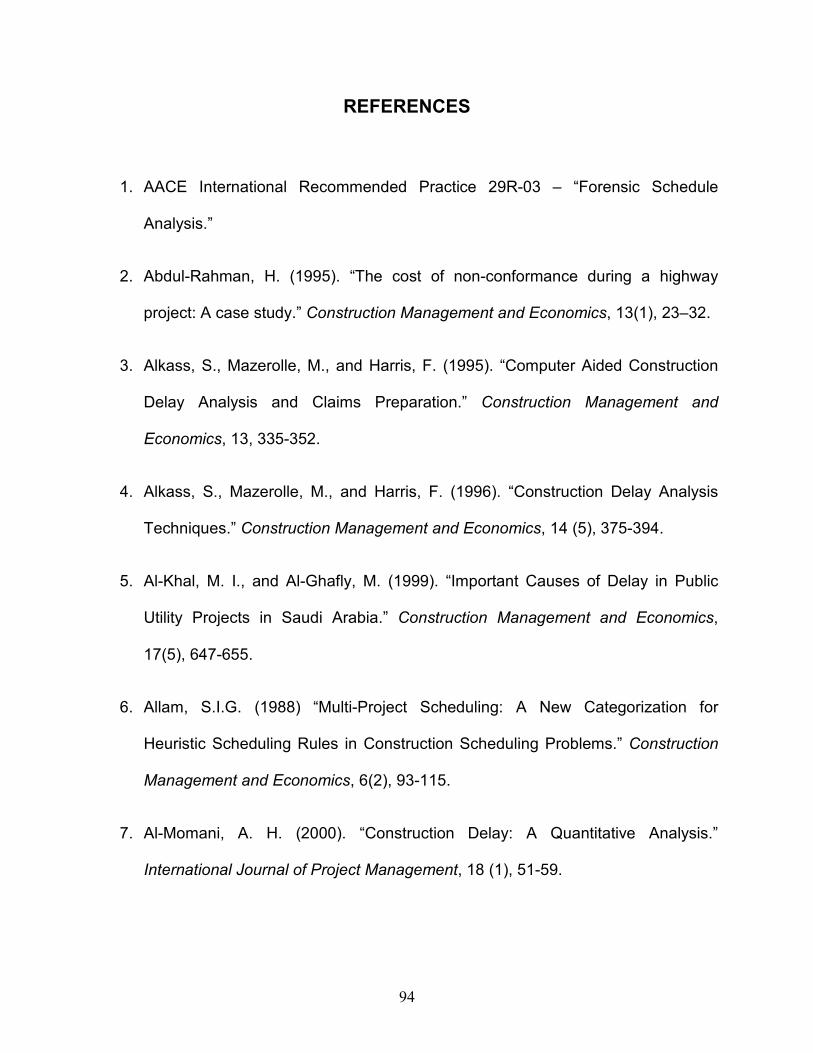
94
REFERENCES
1. AACE International Recommended Practice 29R-03 – “Forensic Schedule
Analysis.”
2. Abdul-Rahman, H. (1995). “The cost of non-conformance during a highway
project: A case study.” Construction Management and Economics, 13(1), 23–32.
3. Alkass, S., Mazerolle, M., and Harris, F. (1995). “Computer Aided Construction
Delay Analysis and Claims Preparation.” Construction Management and
Economics, 13, 335-352.
4. Alkass, S., Mazerolle, M., and Harris, F. (1996). “Construction Delay Analysis
Techniques.” Construction Management and Economics, 14 (5), 375-394.
5. Al-Khal, M. I., and Al-Ghafly, M. (1999). “Important Causes of Delay in Public
Utility Projects in Saudi Arabia.” Construction Management and Economics,
17(5), 647-655.
6. Allam, S.I.G. (1988) “Multi-Project Scheduling: A New Categorization for
Heuristic Scheduling Rules in Construction Scheduling Problems.” Construction
Management and Economics, 6(2), 93-115.
7. Al-Momani, A. H. (2000). “Construction Delay: A Quantitative Analysis.”
International Journal of Project Management, 18 (1), 51-59.

95
8. Arditi, D. and Pattanakitchamroon, T. (2006). “Selecting a Delay Analysis Method
in Resolving Construction Claims.” International Journal of Project Management,
24, 145-155.
9. Arditi, D., Akan, G. T., and Gurdamar, S. (1985). “Reasons for Delays in Public
Projects in Turkey.” Construction Management and Economics, 3, 171-181.
10. Arditi, D., and Robinson, M. A. (1995). “Concurrent Delays in Construction
Litigation.” Cost Engineering Journal, AACE International, 37(7), 20-31.
11. Ashford, J.L. (1992). The management of quality in construction, E & F Spon,
London, U.K.
12. Assaf, S. A., Al-khalil, M., and Al-Hazmi, M. (1995). “Causes of Delay in Large
Building Construction Projects.” Journal of Management in Engineering, ASCE,
11(2), 45-50.
13. Assaf, S. A., and Al-Hejji, S. (2006). “Causes of Delay in Large Construction
Projects.” International Journal of Project Management, 24, 349-357.
14. Baldwin, J. R., Mathei, J. M., Rothbart, H., and Harris, R. B. (1971). “Causes of
Delay in the Construction Industry.” Journal of Construction Division, ASCE,
97(2), 177-187.
15. Baram, GE. (1994). “Delay Analysis-Issue not for Granted.” 1994 AACE
Transactions, AACE, DCL.5.1-DCL.5.9.

96
16. Barber, P., Graves, A., Hall, M., Sheath, D., and Tomkins, C. (2000). “Quality
failure costs in civil engineering projects.” International Journal of Quality and
Reliability Management, 17(4/5), 479–492.
17. Bordoli, D. W., and Baldwin, A. N. (1998). “A Methodology for Assessing
Construction Project Delays.” Construction Management and Economics, 16,
327-337.
18. Bubshait, A., and Cunningham, M. (1998) “Comparison of Delay Analysis
Methodologies.” Journal of Construction Engineering and Management, ASCE,
124(4), 315-322.
19. Burati, J. L., Farrington, J. J., and Ledbetter, W. B. (1992). “Causes of quality
deviations in design and construction.” Journal of Construction Engineering and
Management, ASCE, 118(1), 34–49.
20. Chan, D. W. M., and Kumaraswamy, M. M. (1996). “Reasons for Delay in Civil
Engineering Projects-The case of Hong Kong.” Hong Kong Institution of
Engineers Transactions, 2(3), 1-8.
21. Chua, D. K. H., and Shen, L. J. (2005). “Key Constraints Analysis with Integrated
Production Scheduler.” Journal of Construction Engineering and Management,
ASCE, 131(7), 753-764.
22. Cnuddle, M. (1991) “Lack Of Quality In Construction Economic Losses.”
Proceedings of 1991 European Symposium on Management, Quality and
Economics in Housing and other Building Sectors, pp. 508–15.

97
23. Construction Industry Institute (CII). (1989) “Costs of quality deviations in design
and construction.” RS 10-1 (Jan.), The Univ. of Texas at Austin, Austin, Texas.
24. Construction Owners Association of Alberta (COAA). (2001). Field Rework
Committee meeting minutes, 28 September 2001, Edmonton, Al., Canada.
25. Cusack, D., Implementation of ISO 9000 in construction, in ISO 9000 Forum
Symposium, Gold Coast, Australia, November, 1992.
26. Davis, E. W. (1974). “Networks: Resource Allocation.” Journal of Industrial
Engineering, 6(4), 22-32.
27. Davis, E. W., and Patterson, J. H. (1975) “A Comparison of Heuristic and
Optimum Solutions in Resource-Constrained Project Scheduling.” Management
Science, 21(8), 944-955.
28. Davis, K., Ledbetter, W. B., and Burati, J. L. (1989). “Measuring design and
construction quality costs.” Journal of Construction Engineering and
Management, ASCE, 115(3), 385–400.
29. Dlakwa, M. M., and Culpin, M. F. (1990). “Reasons for Overrun in Public Sector
Construction Projects in Nigeria.” International Journal of Project Management, 8
(4), 237-241.
30. Faridi, A. S., and El-Sayegh, S. M. (2006). “Significant Factors Causing Delay in
the UAE Construction Industry.” Construction Management and Economics, 24,
1167-1176.

98
31. Fayek, A.R., Dissanayake, M., and Campero, O. (2003). “Measuring and
classifying construction field rework: A pilot study.” Research Rep. (May),
Construction Owners Association of Alberta (COAA), The University of Alberta,
Edmonton, Al., Canada.
32. Fayek, A.R., Dissanayake, M., and Campero, O.(2004). “Developing a standard
methodology for measuring and classifying construction field rework.” Canadian
Journal of Civil Engineering, CSCE, 31: 1077–1089.
33. Finke, M. (1997). “Contemporaneous Analysis of Excusable Delays.” Cost
Engineering Journal, AACE International, 39(12), 26-31.
34. Finke, M. (1999). “Window analyses of compensable delays.” Journal of
Construction Engineering and Management, 125(2), 96–100.
35. Finke, M. (1999). “Window Analysis of Compensable Delays.” Journal of
Construction Engineering and Management, ASCE, 125(2), 96-100.
36. Finke, M. (1999). “Window Analysis of Compensable Delays.” Journal of
Construction Engineering and Management, ASCE, 125(2), 96-100.
37. Fondahl, J. W. (1991). “The Development of the Construction Engineer: Past
Progress and Future Problems.” Journal of Construction Engineering and
Management, ASCE, 117(3), 380-392.
38. Fruchtman, E. (2000). “Delay Analysis - Eliminating the Smoke and Mirrors.”
2000 AACE Transactions, AACE, CDR.6.1-CDR.6.4.
99
39. Gavish, B. and Pirkul, H. (1991). “Algorithms for Multi-Resource Generalized
Assignment Problem.” Management Science, 37(6), 695-713.
40. Gibson, G.E., and Dumont, P.R. (1996). Project Definition Rating Index (PDRI)
for industrial projects. Construction Industry Institute Implementation Resource
113-2, Construction Industry Institute, Austin, TX.
41. Gothand, K. D., (2003). “Schedule Delay Analysis: Modified Windows Approach.”
Cost Engineering Journal, AACE International, 45(9), 18-23.
42. Harris, R. A., and Scott, S. (2001). “UK Practice in Dealing with Claims for
Delay.” Engineering, Construction and Architectural Management, 8(5-6): 317-
324.
43. Hegazy, T. (1999). “Optimization of Resource Allocation and Levelling Using
Genetic Algorithms.” Journal of Construction Engineering and Management,
ASCE, 125(3), 167-175.
44. Hegazy, T. (2002) "Computer-Based Construction Project Management,"
Prentice Hall, Upper Saddle River, NJ, USA.
45. Hegazy, T. (2007). “EasyPlan Project Management System.” Available from:
http://www.civil.uwaterloo.ca/tarek/EasyPlan.html.
46. Hegazy, T. and El-Zamzamy, H. (1998) “Project Management Software that Meet
the Challenge,” Cost Engineering Journal, AACE International, 4(5), 25-33.

100
47. Hegazy, T. and Menesi, W. (2008) “Delay Analysis Under Multiple Baseline
Updates.” Construction Engineering and Management, ASCE, 134(8), 575-582.
48. Hegazy, T., and Zhang, K. (2005). “Daily Window Delay Analysis”. Journal of
Construction Engineering and Management, ASCE, 131(5), 505-512
49. Hegazy, T., Elbeltagi, E., and Zhang, K. (2005). “Keeping Better Site Records
Using Intelligent Bar Charts.” Construction Engineering and Management, ASCE,
131(5), 513-521.
50. Holloway, S. (2002). “Introductory Concepts in Delay Claims.” Construction Law
and Business, 2(6), 3-6.
51. Hwang, B.G., Thomas, S.R., Haas, C.T., and Caldas, C.H. (2009). "Measuring
the Impacts of Rework on Construction Cost Performance." Journal of
Construction Engineering and Management, ASCE, 135(3), 187-198.
52. Ibbs, W., and Nguyen, L. D. (2007). “Schedule Analysis under the Effect of
Resource Allocation.” Journal of Construction Engineering and Management,
ASCE, 133(2), 131-138.
53. Johnson, R. (1992). “Resource Constrained Scheduling Capabilities of
Commercial Project Management Software.” Project management Journal, PMI,
XXII(4), 39-43.
101
54. Josephson, P. E., and Hammarlund, Y. (1999). “The causes and costs of defects
in construction: A study of seven building projects.” Automation in Construction,
8(6), 681–687.
55. Kartam, S. (1999). “Generic Methodology for Analyzing Delay Claims.” Journal of
Construction Engineering and Management, ASCE, 125(6), 409-419.
56. Levin, P. (1998). “Construction Contract Claims, Changes and Dispute
Resolution.” 2nd edition. New York (NY): ASCE Press.
57. Lo, T. Y., Fung, I. W. H., and Tung, K. C. F. (2006). “Construction Delays in Hong
Kong Civil Engineering Projects.” Journal of Construction Engineering and
Management, ASCE, 132(6), 636-649.
58. Love, P. E. D., and Edwards, D. (2004). “Forensic project management: The
underlying causes of rework in construction projects.” Civil Engineering and
Environmental Systems, 12(3), 207–228.
59. Love, P. E. D., and Li, H. (2000). “Quantifying the causes and costs of rework in
construction.” Construction Management and Economics, 18(4), 479–490.
60. Love, P. E. D., Mandal, P., and Li, H. (1999). “Determining the casual structure of
rework influences in construction.” Construction Management and Economics,
17(4), 505–517.

102
61. Love, P.E.D. and Smith, J. (2003). “Bench-marking, Bench-action and Bench-
learning: Rework Mitigation in Projects.” Journal of Management in Engineering,
ASCE, 19 (4), 147-159.
62. Lovejoy, V. A. (2004). “Claims Schedule Development and Analysis: Collapsed
As-built Schedule for Beginners.” Cost Engineering Journal, AACE International,
46(1), 27-30.
63. Lowsley, S., and Linnett, C. (2006). “About Time: Delay Analysis in
Construction.” RICS Business Services Limited.
64. Lu, M., and Li, H. (2003). “Resource-Activity Critical-Path Method for
Construction Planning.” Journal of Construction Engineering and Management,
ASCE, 129(4), 412-420.
65. Lucas, D. (2002). “Schedule Analyzer Pro-an Aid in the Analysis of Delay Time
Impact Analysis.” Cost Engineering Journal, AACE International, 44(8), 30-36.
66. Lyer, K. C., and Jha, K. N. (2006). “Critical Factors Affecting Schedule
Performance: Evidence from Indian Construction Projects.” Journal of
Construction Engineering and Management, ASCE, 132(8), 871-881.
67. Mansfield, N. R., Ugwu, O. O., and Doran, T. (1994). “Causes of Delay and Cost
Overruns in Nigerian Construction Projects.” International Journal of Project
Management, 12 (4), 254-260.

103
68. Mbabazi, A., Hegazy, T. and Saccomanno, F. (2005). “Modified But-For Method
for Delay Analysis.” Journal of Construction Engineering and Management,
ASCE, 131(10), 1142-1144.
69. McCullough, R. B. (1999). “CPM Schedules in Construction Claims from
Contractors Perspective.” 1999 AACE Transactions, AACE, CDR.2.1-CDR.2.4.
70. Menasi, W. (2007). “Construction Delay Analysis under Multiple Baseline
Updates.” Master’s Thesis, Civil Engineering, University of Waterloo, Waterloo,
Ontario, N2L 3G1.
71. National Economic Development Office (NEDO) (1987),”Achieving Quality on
Building Sites”, Millbank, London, UK, pp. 18-19.
72. Nylén, K.O. (1996). “Cost of Failure in a Major Civil Engineering Project”,
Licentiate Thesis, Division of Construction Management and Economics,
Department of Real Estate and Construction Management, Royal Institute of
Technology, Stockholm, Sweden.
73. O’Conner, J. T., and Tucker, R. L. (1986). “Industrial project constructability
improvement.” Construction Engineering and Management, ASCE, 112(1), 69–
82.
74. Ogunlana, S. O., Promkuntong, K., and Jearkjirm, V. (1996). “Construction
Delays in a Fast-Growing Economy: Comparing Thailand with Other Economies.”
International Journal of Project Management, 14 (1), 37-45.
104
75. Oliveros, A. and Fayek. Amina R. (2005). “Fuzzy Logic Approach for Activity
Delay Analysis and Schedule Updating.” Journal of Construction Engineering and
Management, ASCE, 131(1), 42-51.
76. Primavera P6 (2007). “Primavera Enterprise Project Portfolio Management.”
Oracle Corporation 500 Oracle Parkway Redwood Shores, CA 94065.
77. Rogge, D.F., Cogliser, C., Alaman, H., and McCormack, S. (2001). RR153-11.
“An investigation of field rework in industrial construction. Construction Industry
Institute.”
78. Ruwanpura, J.Y., Meek, D., Nutting, T., Greaves, D., Hamlin, J., and Timler, M.
(2003). “Most significant causes for rework due to engineering deliverables.” In
Proceedings of the 5th Construction Specialty Conference, Moncton, N.B., June
2003. Edited by M. Massièra and N. El-Jabi. CSCE.
79. Sagarlata, M. A., and Brasco, C. J. (2004). “Successful Claims Resolution
Through An Understanding of the Law Governing Allocation of Risk for Delay and
Disruption.” CM ejournal, CMAA, Available from http://cmaanet.org/ejournal.php.
80. Sandlin, L. S., Sapple J. R., and Gautreaux, R. M. (2004). “Phased Root Cause
Analysis: A Distinctive View on Construction Claims.” Cost Engineering Journal,
AACE International, AACE, 46(6), 16-20.
81. Schumacher, Lee, PE. (1995). “Quantifying and Apportioning Delay on
Construction Projects.” Cost Engineering Journal, AACE International, 37(2), 11-
13.
105
82. Scott, S. (1990). “Keeping Better Site Records.” International Journal of Project
Management, 8(4), 243-249.
83. Semple, C., Hartman, F. T., and Jergeas, G. (1994). “Construction Claims and
Disputes: Causes and Cost/Time Overruns.” Journal of Construction Engineering
and Management, ASCE, 120(4), 785-795.
84. Shi, J., Cheung, S., and Arditi. D (2001). “Construction Delay Computation
Method.” Journal of Construction Engineering and Management, ASCE, 127(1),
60-65.
85. Stumpf, George R. (2000). “Schedule Delay Analysis.” Cost Engineering Journal,
AACE International, 42(7), 32-43.
86. Talbot, F. and Patterson, J. (Dec. 1979). “Optimal Methods for Scheduling
Projects under Resource Constrains.” Project Management Quarterly, 26-33.
87. Wickwire, J., Driscoll, T., and Hurlbut, S. (1991). “Construction, Liability, and
Claims.” New York (NY): Wiley Law Publications.
88. Wiest, D. (1964). “Some Properties of Schedules for Large Projects with Limited
Resource.” Operations Research, 12, 395-416.
89. Wiest, J. D. (1967). “A Heuristic Model for Scheduling Large Projects with Limited
Resources.” Management Science, 13(6), B359-B377.

106
90. Willis, R. J. (1985). “Critical Path Analysis and Resource Constrained Project
Scheduling-Theory and Practice.” European Journal of Operational Research,
21, 149-155.
91. World Bank (1990). “Annual Review of Project Performance Results.” World
Bank.
92. Zack, J. G., Jr. (1999). “Pacing Delays - the Practical Effect.” 1999 AACE
Transactions, AACE, CDR.1.1-CDR.1.6.
93. Zack, Jr. J. (2001). “But-for Schedule- Analysis and Defence.” Cost Engineering
Journal, AACE International, 43(8), 13-17.
94. Zhang, K. (2003). “Delay Analysis Using a Daily Windows Approach.” Master’s
Thesis, Civil Engineering, University of Waterloo, Waterloo, Ontario, N2L 3G1.