improved processing of high alloy steels for wear...
TRANSCRIPT

ORNL/TM-2012/520
Improved Processing of High Alloy Steels for Wear Components in Energy Generation Systems, Transportation and Manufacturing Systems
9/30/2013
Prepared by William H. Peter, Alan L. Liby, Wei Chen, Yukinori Yamamoto, Peter J. Blau

DOCUMENT AVAILABILITY
Reports produced after January 1, 1996, are generally available free via the U.S. Department of Energy (DOE) Information Bridge. Web site http://www.osti.gov/bridge Reports produced before January 1, 1996, may be purchased by members of the public from the following source. National Technical Information Service 5285 Port Royal Road Springfield, VA 22161 Telephone 703-605-6000 (1-800-553-6847) TDD 703-487-4639 Fax 703-605-6900 E-mail [email protected] Web site http://www.ntis.gov/support/ordernowabout.htm Reports are available to DOE employees, DOE contractors, Energy Technology Data Exchange (ETDE) representatives, and International Nuclear Information System (INIS) representatives from the following source. Office of Scientific and Technical Information P.O. Box 62 Oak Ridge, TN 37831 Telephone 865-576-8401 Fax 865-576-5728 E-mail [email protected] Web site http://www.osti.gov/contact.html
This report was prepared as an account of work sponsored by an agency of the United States Government. Neither the United States Government nor any agency thereof, nor any of their employees, makes any warranty, express or implied, or assumes any legal liability or responsibility for the accuracy, completeness, or usefulness of any information, apparatus, product, or process disclosed, or represents that its use would not infringe privately owned rights. Reference herein to any specific commercial product, process, or service by trade name, trademark, manufacturer, or otherwise, does not necessarily constitute or imply its endorsement, recommendation, or favoring by the United States Government or any agency thereof. The views and opinions of authors expressed herein do not necessarily state or reflect those of the United States Government or any agency thereof.

ORNL/TM-2012/520
Final Technical Report
Improved Processing of High Alloy Steels for Wear Components in Energy
Generation Systems, Transportation and Manufacturing Systems
CPS Agreement No. 20978
Project Period: July 2008 – May 2012
Primary Investigators:
Drs. William H. Peter, Alan L. Liby, Wei Chen, Yukinori Yamamoto, Peter J. Blau
Oak Ridge National Laboratory
1 Bethel Valley Rd, Oak Ridge, Tennessee 37831
Industrial Participants:
Mr. Dave Peltier
Avure Technologies Inc.
Mr. Louis W. Lherbier and Mr. David J. Novotnak
Carpenter Technology Corporation
Date Published: September, 2013
Prepared by
OAK RIDGE NATIONAL LABORATORY
Oak Ridge, Tennessee 37831-6283
managed by
UT-BATTELLE, LLC
for the
U.S. DEPARTMENT OF ENERGY
under contract DE-AC05-00OR22725

iv
Acknowledgments
This report is based upon work supported by the Advanced Manufacturing Office of the U. S.
Department of Energy under Award No.18716.
The authors would like to acknowledge Mr. David Harper for coordination of the tasks in the
materials processing laboratory, Mr. Kevin Harper and Mr. Greg Cox for help with heat treatment,
Mr. Jackie Mayotte for optical metallography and hardness measurements, Ms. Rita Ayers and Mr.
Hiram Rogers for their help as administrative support including the formatting the report.
Research was also supported by ORNL’s Shared Research Equipment (SHaRE) User Facility, which
is sponsored by the Office of Basic Energy Sciences, U.S. Department of Energy.
v
CONTENTS
LIST OF ACRONYMS ......................................................................................................................... vi LIST OF FIGURES .............................................................................................................................. vii LIST OF TABLES ................................................................................................................................ ix EXECTIVE SUMMARY ....................................................................................................................... 1 1. INTRODUCTION .......................................................................................................................... 3 2. BACKGROUND ............................................................................................................................ 5
2.1 ISOSTATIC PRESSING ...................................................................................................... 5 2.2 MICRO-PIT TESTING ........................................................................................................ 5
3. RESULTS AND DISCUSSION ..................................................................................................... 7 3.1 MATERIAL PROCUREMENTS AND SURVEY .............................................................. 7 3.2 HEAT TREATMENT AND MIRCOSTRUCTURAL ANALYSIS .................................... 8 3.3 COMPONENT FABRICATION ....................................................................................... 12 3.4 MICRO-PITTING TESTING ............................................................................................ 13
3.4.1 First Attempt of Micro-pitting Test ....................................................................... 13 3.4.2 Optimized Test Conditions Dedicated Micro-pitting Formation........................... 20
4. BENEFIT ASSESSMENTS ......................................................................................................... 28 5. COMMERCIALIZATION & RECOMMENDATIONS ............................................................. 30 6. ACCOMPLISHMENTS ............................................................................................................... 32 7. CONCLUSION ............................................................................................................................ 33 8. REFERENCES ............................................................................................................................. 34

LIST OF ACRONYMS
AC Air Cooled
AW Air Warmed
BSE Back-scattered Electron
CHIP Cold isostatic press and sinter, followed by Hot Isostatic Press
CIP Cold Isostatic Press
EDS Energy Dispersive X-ray Spectroscopy
HIP Hot Isostatic Press
MP Micro-Pitting
MPR Micro-Pitting test Rig
N Newton
OQ Oil Quenched
ORNL Oak Ridge National Laboratory
P Pitting
PM Powder Metallurgy
SE Secondary Electron
S Sliding
SHaRE Shared Research Equipment
SEM Scanning Electron Microscopes
TBtu Trillion British Thermal Units
UK United Kingdom
XRD X-Ray Diffraction

vii
LIST OF FIGURES
Figure ................................................................................................................................................... Page
FIGURE 1. ILLUSTRATION OF THE MAJOR BEARING SYSTEMS IN A WIND TURBINE. ..................... 3 FIGURE 2. M. SMEETH OF PCS INSTRUMENTS PROVIDED A TUTORIAL TO FOUR ORNL STAFF
MEMBERS AFTER INSTALLING THE MACHINE. ................................................................................ 6 FIGURE 3. CLUSTER TO ROLLERS SURROUNDING A SMALLER CENTRAL TEST ROLLER
(CHAMBER DOOR OPEN). THE TEMPERATURE PROBE ENTERS THE CHAMBER FROM THE
UPPER LEFT. ............................................................................................................................................... 6 FIGURE 4. CALCULATED PHASE EQUILIBRIUM OF THE ALLOYS (440C, 440XH, M62, AND 52100)
BY JMATPRO. NOTE THAT THE CALCULATION RESULT OF M50 WAS SIMILAR TO THAT OF
52100, ALTHOUGH THE PREDICTED CARBIDES WERE NOT FE3C BUT M23C6 (10%) + M6C (4%)
+ M(C,N) (2%) AT 600OC............................................................................................................................. 8
FIGURE 5. OPTICAL MICROGRAPHS OF THE AS-RECEIVED MATERIALS. .......................................... 10 FIGURE 6. OPTICAL MACROGRAPHS OF THE HEAT-TREATED MATERIALS. .................................... 10 FIGURE 7. SEM-BACK SCATTERED ELECTRON IMAGES OF THE HARDENED AND TEMPERED
SPECIMENS. .............................................................................................................................................. 11 FIGURE 8. (A) DRAWING OF THE TEST SPECIMEN, AND (B) SPECIMENS AFTER ROUGH
MACHINING. ............................................................................................................................................. 12 FIGURE 9. THE TEST SPECIMEN (440XH) AFTER FINAL MACHINING. ................................................. 13 FIGURE 10. MICROPIT PRODUCED OF A STEEL SURFACE DURING A PRELIMINARY
EXPERIMENT. ........................................................................................................................................... 14 FIGURE 11. (A) LOAD HISTORY, CORRESPONDING FRICTION COEFFICIENT, AND (B) WEAR
RESULTS FOR M50. .................................................................................................................................. 15 FIGURE 12. AVERAGE FRICTION FOR EACH LOADING STEP FOR TWO TESTS OF EACH ALLOY. 16 FIGURE 13. WEAR SUMMARY FOR TWO TESTS OF EACH ALLOY (AVERAGE WEAR FROM 2
RUNS). FOR ALL BUT THE 440XH WITH ITS HIGHER HARDNESS, THE RUNNING-IN WEAR
DOMINATED STAGES 1 AND 2 AND WEAR IN STAGE 3 WAS LOWER. ....................................... 16 FIGURE 14. WEAR DATA COMPARISON OF (A) THE TEST-INTERRUPTED SAMPLES FOR
MICROSTRUCTURE CHARACTERIZATION AND (B) THE SAMPLES CONTINUED TO STAGE 4.
..................................................................................................................................................................... 18 FIGURE 15. A PICTURE OF THE SAMPLE (440XH) BEFORE TESTING. ................................................... 18 FIGURE 16. SEM SECONDARY ELECTRON IMAGES OF THE SAMPLE SURFACE. .............................. 19 FIGURE 17. SEM BACK-SCATTERED ELECTRON IMAGES OF THE CROSS-SECTIONAL VIEW. ...... 20 FIGURE 18. HIERARCHY OF SURFACE FEATURES OBSERVED ON METALLIC SURFACES
SUBJECTED TO A COMBINATION OF ROLLING AND SLIDING. .................................................... 22 FIGURE 19. ABRASIVE WEAR GROOVES AND A FEW MICRO-PITS ON THE SURFACE OF AN M-50
STEEL ROLLER. ........................................................................................................................................ 22 FIGURE 20. (A) A ROUNDED MICRO-PIT IN 440C STEEL, AND (B) DISTORTED MICRO-PITS IN M50
TOOL STEEL WHERE SHEAR HAS PARTLY OR FULLY CLOSED THEM, LEAVING FINE
CRACKS AT BOTH ENDS. ....................................................................................................................... 23 FIGURE 21. MICRO-PIT IN 52100 SHOWING (A) A BLOCKY NETWORK OF MICRO-CRACKS, AND
(B), AN OBLIQUE VIEW OF MICRO-PITS IN THE SAME STEEL SPECIMEN SHOWING THE
ARC-LIKE SHAPE OF A MICRO-CRACK THAT UNDERLIES A SHELF OF MATERIAL, AS SEEN
AT THE RIGHT IN THE CROSS-SECTION IN FIGURE 7(A). .............................................................. 23 FIGURE 22. POLISHED AND ETCHED (2% NITAL) CROSS-SECTION OF THE 52100 STEEL ROLLER
SHOWING (A) A SERIES OF MICRO-FRACTURES EXTENDING FROM THE BOTTOM OF A
MICRO-PIT LIKE THAT SHOWN IN FIGURE 21(A), AND (B) A ROW OF MICRO-CRACKS
UNDERLYING THE SURFACE. THE OPEN END OF ONE SUCH CRACK CAN BE SEEN IN
FIGURE 21(B). THE SLIP DIRECTION WAS RIGHT TO LEFT, SINCE THE PITS OPEN IN THE
TENSILE FIELD FOLLOWING PASSAGE OF THE CONTACT PATCH. ............................................ 24 FIGURE 23. SERIES OF MICRO-PITS ON 52100 STEEL THAT ARE CONNECTED BY MICRO-
CRACKS. THE WIDTHS AND INTERIOR SCRATCHES WITHIN THE ABRASIVE GROOVES ARE

viii
SIMILAR IN SIZE TO THE BREATH OF THE MICRO-PITS SUGGESTING THAT WEAR DEBRIS
FROM THE PITS CAN SERVE AS THIRD-BODY ABRADANTS. .......................................................24 FIGURE 24. PARTICLE OF 52100 STEEL ABOUT TO LEAVE THE SURFACE TO LEAVE A MICRO-
PIT BEHIND. (2% NITAL ETCH) .............................................................................................................24 FIGURE 25. REDUCED FREQUENCY AND SIZE OF MICRO-PITS IN ALLOY 440XH. ..........................25 FIGURE 26. HAIRLINE, TRANSVERSE CRACKS SUGGESTIVE OF MICRO-PITTING INITIATION IN
THE RING SPECIMEN USED WITH M-50 ROLLERS. ..........................................................................26 FIGURE 27. WHITE LAYER ON A BEARING STEEL USED IN A WIND TURBINE GEARBOX
BEARING SHOWING A SUBSURFACE VOID AND EXTENDING MICRO-CRACKS ASSOCIATED
WITH THE NUCLEATION OF SPALLS. .................................................................................................27 FIGURE 28. MICRO-CRACKS AVOIDING CARBIDE PARTICLES AS THEY EXTEND FROM THE
BOTTOM OF A MICRO-PIT. (GLYCEREGIA ETCH) ............................................................................27 FIGURE 29. US WIND POWER MARKET GROWTH CURVE FROM 1998 TO 2011. .................................29 FIGURE 30. THE POWDER METALLURGY STRUCTURAL COMPONENTS MARKETS ........................30 FIGURE 31. PRODUCTION OF IRON AND STEEL FROM POWDER METALLURGY 1998-2010. ..........31

ix
LIST OF TABLES
TABLE 1. COMPOSITIONS OF THE ALLOYS STUDIED (IN WEIGHT PERCENT, BALANCED FE) ....... 7 TABLE 2. PREDICTED PHASE EQUILIBRIUM AT 600
OC (THE MATRIX IS -FE), TOGETHER WITH
THE HARDNESS (ROCKWELL HARDNESS C) OF THE HEAT-TREATED SAMPLES. ..................... 7 TABLE 3. HARDENING AND TEMPERING HEAT-TREATMENT ................................................................ 8 TABLE 4. HARDNESS OF THE INGOTS BEFORE AND AFTER HEAT-TREATMENT............................... 9 TABLE 5. HARDNESS OF THE SAMPLES BEFORE AND AFTER HEAT-TREATMENT ......................... 13 TABLE 6. MICRO-PITTING TEST PROTOCOL (FIRST TRIAL) .................................................................. 15 TABLE 7. WEAR DATA OF THE ALLOYS (IN TERMS OF DISPLACEMENT, ΜM) FOR MICRO-
PITTING TESTING. ................................................................................................................................... 17 TABLE 8. MICRO-PITTING TEST PROTOCOL (SECOND TRIAL) .............................................................. 21 TABLE 9. CATEGORIZATION OF FEATURES OBSERVED ON SURFACES OF STEEL TEST
SPECIMENS ............................................................................................................................................... 25 TABLE 10: INDUSTRIAL OPERATIONS WITH SIGNIFICANT ANNUAL WEAR CONSEQUENCES .... 28


1
EXECTIVE SUMMARY
Oak Ridge National Laboratory (ORNL), in Partnership with Avure Technologies Inc. and Carpenter
Technology Corporation, explored methods to improve durability of steels considered essential to
bearings in wind turbine applications by using hot isostatic pressing of steel alloy powders as a
manufacturing method.
The objective of the project was to evaluate the wear mechanism of selected high alloy tool steels,
440C, 440XH, and M62, fabricated by powder metallurgy (PM) techniques via the hot isostatic press
(HIP) process, and compare these results to two conventionally produced wrought alloys, 52100 and
M50. Samples from the five candidate metals were characterized microstructurally via optical and
scanning microscopy methods. A micro-pit wear testing machine was purchased and used to simulate
bearing loads in a wind turbine gear box The candidate samples were subsequently heat treated in
accordance with industrial protocols and machined into wear test specimens suitable for the micro-pit
wear testing machine. . Wear testing produced surfaces that were subsequently analyzed for wear
and damage using both optical microscopy and scanning electron microscopy methods.
Optimized rolling-sliding experiments with a relatively small slip ratio (5%) and higher load (650N)
exhibited signs of abrasive wear on all specimens, but not all specimens had the same degree of
micro-pitting damage. The conventional wrought 52100 steel had the most severe micro-pitting,
consisting of distorted craters, many of which were connected by micro-cracks. Cross-sectional
examination showed multiple micro-cracks extending into the alloy microstructure from the same pit.
The depth of the cracks was several times the depth of the micro-pit. Type 440XH had the least
amount of micro-pitting damage under similar test conditions. Micro-pits on 440HX were more
localized and the micro-cracks associated with them tended to avoid carbides during propagation.
Abrasive processes were observed on all the test specimens and were produced by debris from mico-
pitting. The combination of micro-pitting in conjunction with abrasive processes could work together
to worsen the surface damage, diminishing bearing service life.
The results suggest that there is a potential advantage of PM consolidated high alloy tool steels, such
as 440XH produced via hot isostatic pressing to better resist micro-pitting when compared to other
alloy types and wrought processing methods.

2

3
1. INTRODUCTION
Friction and wear of components in transportation and energy generation equipment reduces system
efficiencies, reduces component life, and parasitically consumes energy. Significant improvements in
material wear translate to enduring energy savings and lower systems cost through lower frictional
drag and reduced or predictable maintenance intervals. Oak Ridge National Laboratory, in
Partnership with Avure Technologies Inc. and Carpenter Technology Corporation explored
improvements in wear component performance through Hot Isostatic Pressing (HIP) of high alloy
steel powders for wear applications specifically targeting wind turbine applications.
Potential applications of the materials being studied in addition to wind turbine gear / bearing
applications are listed below;
Transportation: Hardened components are needed in any engine driven vehicle, whether the
vehicle is a small car, a race car, a truck or an ocean vessel.
General mechanical equipment: forging presses, steel rolling mills, machine tools; drivelines
of mining equipment and heavy duty transmissions; earth moving equipment and heavy duty
construction cranes. The combination of wear resistance and fatigue strength is a key
characteristic of steels used for these applications.
There are multiple bearing systems in a wind turbine, such as the blade bearing, generator, gear box,
main bearing, yaw bearing, and hydraulic system, as illustrated in Figure 1. Mechanical failures for
wind turbines in the field are usually gear/bearing related, and a typical failure can cost $200,000 to
$400,000. This cost drives a strong demand for advanced bearing steels with higher strength and
wear-resistance.
Figure 1. Illustration of the major bearing systems in a wind turbine.
High alloy steels have a potential to improve wear performance due to the precipitation of hard
second-phases such as carbides or intermetallic compounds that are formed during solidification and
heat treatment. However, it is difficult to control the size and distribution of the desirable, hard,
second phases because the second phase manifestation is controlled by solidification dynamics and
result in a course heterogeneous distribution when section thicknesses are large. Heterogeneous
coarse carbide or intermetallic second phase distributions in the microstructure, due to segregation
upon solidification, have a negative effect on wear resistance, reduce ductility, lower fracture
toughness, and decreases fatigue life.
4
The negative effect on wear is commonly attributable to the matrix microstructure surrounding the
hard second phase having insufficient strength to retain the particle during high bearing load
conditions. The surface area to volume ratio of the hard second phase particle also plays a role in
matrix retention. The larger the second phase particle, the less surface area is available for the matrix
to act upon it, hence large hard second phase particles are easier to pull from the matrix under high
bearing load conditions, than small well distributed particles. Once the second phase is released from
the metal matrix it becomes debris in the bearing contact zone, further acting upon the bearing surface
as a wear particle.
Improvements in wear, with materials of the same composition, can be achieved by reducing the size
and increasing the homogeneity of the distribution of the hard second phase. Powder metallurgy
approaches remove the solidification constraints of the second phase distribution and allow the
fabrication of large section thickness with an improved second phase size. Powders made via liquid
metal processing retain the desired chemical composition due to rapid solidification during
atomization. When the powders are consolidated into a large component with significant section
thickness, the second phase particles remain small in size and homogeneous, resulting in improved
wear.
In addition to the improved wear brought upon by a small homogeneous distribution of hard second
phase particles, ductility, fracture toughness and fatigue performance are maintained at acceptable
levels.
Alloy steel powders with a particle size of less than 5 micrometers were produced by Carpenter
Technology Corporation using gas atomization. The powders were consolidated into test coupons
using hot isostatic pressing.
The objective of this project was to test the wear resistance of selected high alloy tool steels, 440C,
440XH, and M62, fabricated by consolidating powders via hot isostatic pressing (HIP) and compare
those selected steels with commercial wrought tool steels, 52100 and M50, now used in wind turbine
bearings. The evaluating test was a micro-pitting test, conducted using a contact fatigue testing
machine that simulated wear in the bearing of a wind turbine gear box. The objective was to not only
assess wear of the different materials in a relevant test, but to develop powder metallurgy fabrication
methods that would allow commercialization of bearing manufacturing via HIP, if significant wear
improvements were realized.

5
2. BACKGROUND
2.1 ISOSTATIC PRESSING
Hot isostatic pressing, or HIP, is the process of reducing porosity of a casting or consolidating a
powder metallurgy component by applying pressure at an elevated temperature over a moderate time
interval. Pressure is applied with an inert gas in a pressure vessel, with pressures up to 2070 bar
(30,000 psi) and temperatures up 1320°C for steels and nickel based superalloys. In HIP processing,
the gas pressure surrounds the work piece in all directions; isostatic pressure. Heat is applied usually
through resistance heaters that are integral to the pressure vessel. If powder metallurgy components
are to be successfully consolidated in the HIP process, the components must either be over 92% dense
or must be encapsulated in a metal container (usually carbon steel) to act as a collapsible pressure
boundary; otherwise the applied gas pressure permeates the partially consolidated powder negating
the compression of the powder. The collapse of the can during the HIP cycle provides the physical
pressure boundary, or sealing surface that consolidates the can’s contents.
In many instances, the work piece may be cold isostatically pressed before HIPing to achieve a
density greater than 55%. Sintering will increase the density up to 92%+. When hot isostatic
pressing is preceded by cold isostatic pressing (CIP) and sintering the common acronym is CHIP.
Powders are commonly measured/weighed and placed into polymer (polyurethane or rubber) bags
before cold isostatic pressing, whereby the bag acts as the pressure boundary between the porous
powder bed and the pressurizing media. CIP is performed at room temperature in a high pressure
vessel. Fluid is used to fill the vessel and acts as the pressurizing medium.
Hot isostatic pressing has been performed on a wide range of materials systems with success. The
process is commonly used in the production of aircraft components from powders, or for reducing
porosity in cast components. Avure has demonstrated improvements of 30-50 % in wear performance
of HIPed powder metallurgy components compared to conventionally processed steel.
2.2 MICRO-PIT TESTING
Evaluation of wear mechanisms for wind turbine gear boxes indicates that a new contact fatigue
testing machine was required to investigate the durability of current and promising new experimental
alloy steels in this project. Based upon an extensive survey of current commercial wear test systems,
a dedicated micro-pitting test machine (MPR) produced by PCS Instruments was selected and
purchased (Figure 2). The specialized bearing test apparatus was based on a design from Imperial
College, London, and enables a highly-flexible, protocol-scripted approach to rolling contact fatigue
testing, under lubricated environments such as those in wind turbine gearboxes, automotive power
transmissions, and rolling bearings in general. It is especially designed to produce a form of
localized surface damage called ‘micro-pitting,’ which is common in wind turbine gearboxes. The
micro-pitting tester provided the ability to produce micro-pitting damage of the type observed on
wind turbine gearbox bearings to the test matrix of steels.
The basic components of the machine are twin motors, a torque-monitored drive train, and a specimen
chamber (Figure 3) that holds three outer rollers and in a smaller inner roller the test specimen of
interest. Exclusive of the computer, the machine is approximately the size of a large refrigerator and
weighs approximately 170 kg (375 lb). The maximum applied load to test specimens is 1250 N and
the maximum surface speed between rollers is 4.0 m/s. The maximum lubricant temperature is 135 oC. Conditions from pure slip to nearly pure rolling without slip are achievable by adjusting the
relative rotational speeds of inner and outer rollers. Two software applications were included. One

6
enabled the user to establish a script of operating instructions used to control each test segment. The
second was the MPR test control software that ran whatever script that was selected.
Since conditions in a bearing can vary depending on the machine components around it and how it is
used, the ability to adjust load, speed, temperature, and duration of testing is essential. In order to
prepare the MPR to evaluate alloys developed in the project, conditions for measuring the effects of
processing and alloy composition on resistance to micro-pitting were first established. For each
experimental alloy specimen, a corresponding material and heat treatment of the outer rollers that
apply the contact force to the test alloy were selected. The surface hardness of the outer rollers was
higher than that of the experimental specimen for each case. Development efforts of processing
protocols was also developed for each pairing of outer work rollers and alloy specimens, guided by
typical wind turbine gearbox operating conditions based on industry information.
Figure 2. M. Smeeth of PCS Instruments provided a tutorial to four ORNL staff members after
installing the machine.
Figure 3. Cluster to rollers surrounding a smaller central test roller (chamber door open). The
temperature probe enters the chamber from the upper left.

7
3. RESULTS AND DISCUSSION
3.1 MATERIAL PROCUREMENTS AND SURVEY
Candidate bearing alloys to be examined in this project were selected and are shown in Table 1
below. The first 3 alloys; 440C, 440-XH and M62 are Carpenter Micro-Melt powder metallurgy
alloys. The latter two alloys in the table are standard bearing alloys made by cast-and-wrought
process. Type 52100 is a long-standing composition usually produced by air melting, but is also
available as vacuum melted material. M-50 is usually vacuum-melted.
Table 1. Compositions of the alloys studied (in weight percent, balanced Fe)
Alloy C Mn Si Cr Ni Mo V W
440C 0.95/1.20 1.00 1.00 16/18 - 0.75 - -
440-XH 1.60 0.50 0.40 16 0.35 0.80 0.45 -
M62 1.30 0.70 0.60 3.75 - 10.50 2.00 6.25
52100 0.98/1.10 0.25/0.45 0.15/0.35 1.30/1.60 - - - -
M-50 0.77/0.85 0.35 0.25 3.75/4.25 0.10 4.00/4.50 0.90/1.10 -
Theoretical phase equilibrium of the alloys calculated from JMatPro (a computational thermodynamic
calculation tool) is shown in Figure 4. The equilibrated second-phase carbides at 600oC are quite
different with each alloy: 18% of M23C6 in 440C; 12% of M7C3 plus 8% of M23C6 in 440XH; 22% of
M6C plus 6% of M23C6 plus 4% of M(C,N) in M62; 14% of Fe3C in 52100, and 10% of M23C6 plus
4% of M6C plus2% of M(C,N) in M50 (not in the figure). The 600°C temperature graphs, in the
predictive model were used to mimic tempered conditions of bearing steels. The M62 alloy shows
the largest total amount of second-phase carbides, and the 52100 the lowest, among the alloys
studied. JMatPro does not predict the size and distribution of equilibrium phases, only the amount.
These calculated results were consistent with the microstructure characterization and XRD analysis of
the samples after hardening/ tempering heat-treatments. Calculations show that some fine carbides in
440C, 440XH and M62 formed by the rapid solidification of the gas atomization process do not
completely dissolve at temperatures very close to the melting point of these alloys.
Table 2 summarizes the phase equilibrium of the alloys at 600oC predicted by JMatPro, together with
the corresponding hardness of the heat-treated alloys. Note that the predicted amounts of the second-
phases do not precisely reflect the actual amounts of the phases in the heat-treated samples, but could
be used for comparison purposes. The comparison indicates that the hardness of the materials tends to
increase with increasing the total amount of second-phases, except for M50. The M50 had a heat
treatment that resulted in a higher carbon austenite than the other alloys of the test matrix. The
martensitic transformation for M50 therefore resulted in a high carbon martensite and the hardness
value is dominated by the matrix hardness.
Table 2. Predicted phase equilibrium at 600oC (the matrix is -Fe), together with the
hardness (Rockwell hardness C) of the heat-treated samples.
Alloy Second-phases, wt%
HRC M23C6 M7C3 M6C M(C,N) Fe3C Total
440C 18 - - - - 18 64.0 ± 0.3
440-XH 8 12 - - - 20 64.3 ± 0.4
M62 6 - 22 4 - 32 65.9 ± 0.4
52100 - - - - 14 14 60.0 ± 0.4
M-50 10 - 4 2 - 16 66.4 ± 0.2

8
Figure 4. Calculated phase equilibrium of the alloys (440C, 440XH, M62, and 52100) by JMatPro.
Note that the calculation result of M50 was similar to that of 52100, although the predicted carbides were
not Fe3C but M23C6 (10%) + M6C (4%) + M(C,N) (2%) at 600oC.
3.2 HEAT TREATMENT AND MIRCOSTRUCTURAL ANALYSIS
Three HIPed powder metallurgy (PM) ingots and a cast-and-wrought 52100 ingot arrived at ORNL in
the normalized condition. The M-50 ingot was purchased from a commercial vendor also in the
normalized condition. A small piece was sectioned from each alloy bar in the as-received ingot for
microstructural characterization and hardness measurement. Additional pieces of each material were
heat-treated to the hardened and tempered condition. After hardening and tempering, the samples
were again measured for hardness and microstructurally characterized. The heat-treatments are
summarized in Table 3.
Table 3. Hardening and tempering heat-treatment
Alloy Hardening Tempering
440C and
440XH
1925F (1052C)/2h/AC
+ -100F (-73C)/1h/AW 300F (149C) /1h/AC
M62 1525F (829C)/10min (preheat)
→2150F (1177C)/5min/AC
1200F (649C)/2h/AC (stress relief)
+ 1050F (566C)/2h/AC, x3
52100 1425F (775C)/4h/AC
+ 1540F (838C)/15min/OQ 300F (149C) /1h/AC
M50
2025F (1107C)/5min →quench in a
salt bath at 1050-1150F (566-621C)
→AC to below 150F (66C)
1000F (538C)/2h/AC, x3
*AC: air cooling, AW: air warming, OQ: oil quenching

9
Note that the micro-pitting specimens for this work were rough machined prior to heat-treatment.
After the tempering process, the specimens were ground to meet the specimen geometry. The
resulting hardness values of the ground specimens are summarized in Table 4.
Table 4. Hardness of the ingots before and after heat-treatment
Alloy Hardness Rockwell C (Micro-Vickers hardness)
as received heat-treated
440C 40.6 ± 0.9 (399 ± 9) 67.0 ± 0.9 (905 ± 31)
440XH 41.0 ± 1.0 (403 ± 10) 68.6 ± 0.8 (984 ± 44)
M62 39.6 ± 1.6 (389 ± 15) 63.7 ± 0.5 (793 ± 13)
52100 42.6 ± 0.8 (421 ± 10) 63.0 ± 1.2 (775 ± 25)
The hardness of the three PM ingots after heat treatment was 64-69 HRC, consistent with the numbers
in the datasheets that Carpenter Technology Corporation provided. The 52100 sample showed
comparable hardness to the PM materials.
Microstructures of the materials before and after heat-treatment are shown in Figure 5 and Figure 6,
respectively. The 440C and 440XH samples showed spherodized carbides, presumably M23C6 (M:
mainly Cr), in the as-received materials which were coarsened after the heat-treatment. The matrix of
the 440C and 440XH samples after heat-treatment exhibited a bainitic microstructure with a
commensurate hardness increase over the as-received material. The M62 sample showed spherodized
carbides, presumably M6C (M: mainly Mo and Fe), with almost no size and morphology changes
before and after the heat-treatment. The matrix of the M62 sample exhibited slight changes in the
etched contrast after the heat-treatment, although it was difficult to identify the microstructural
feature with the resolution of optical microscope. The microstructure of as-received 52100 material
showed a typical air-cooled microstructure consisting of perlite in the matrix together with primary
cementite precipitated on the grain boundary. However, after heat-treatment, the microstructure
consisted of a martensite matrix with partially transformed perlite (typical oil-quenched
microstructure), which showed the formation of spherodized particles in the perlite.
It should be noted that all PM materials show what appears to be some microporosity in the as
received HIP’ed condition. This apparent microporosity remains in fully heat treated material but in
reality are due to small carbides or small oxides being removed during polishing of the micro
samples. The HIP process, with the temperatures and pressure applied to the powder always produces
a 100% dense structure. This condition has no effect on the performance of the alloys..

10
Figure 5. Optical micrographs of the as-received materials.
Figure 6. Optical macrographs of the heat-treated materials.

11
Further microstructural characterization of the hardened and tempered specimens was conducted by
using scanning electron microscopy (SEM) and energy dispersive X-ray spectroscopy (EDS). The
440C and 440XH steels showed similar microstructures containing at least two different second-
phases as shown in Figure 7a and Figure 7b, respectively. SEM-EDS analysis revealed that the dark
contrast phases are Cr-rich carbide, possibly M7C3 or M23C6, and the light gray contrast phase are Cr-,
Fe-, and Mo-rich, possibly M23C6 or -FeCr phase. Note that the formation of -FeCr is not
consistent with the literature [1]. A detailed phase analysis such as X-ray diffraction would be
required to positively confirm the carbide stoichiometry but is beyond the scope of this work. The
M62 in Figure 7c shows three different phases; bright contrast spherical precipitates (Fe-, Mo-, and
W-rich, possibly Fe2[Mo,W]-Laves phase), bright plate shape precipitates (Mo-rich, possibly Mo2C),
and gray contrast precipitates (Fe-, Mo-, V-, and Si-rich, possibly M6C). All three PM samples
showed a second phase pull out porosity less than 500nm in size and a very small volume percent.
The 52100 steel in Figure 7d showed a duplex microstructure with a typical martensitic
microstructure (light gray matrix) and fine perlite microstructure (dark gray area) containing many
spherodized particles with less than 1µm size, likely Fe3C cementite.
Figure 7. SEM-back scattered electron images of the hardened and tempered specimens.

12
3.3 COMPONENT FABRICATION
The micro-pitting specimens were machined from five different materials. Figure 8 shows the
drawing of the specimen, and a picture of the rough-machined specimens. Since the materials were
too hard to be machined after hardening (and tempering) heat-treatments, the rough machining was
conducted in the as-received (normalized) condition. The rough machined samples had 0.4mm of
excess material left to account for final grinding. After the heat-treatment, the samples were ground to
final size.
(a)
(b)
Figure 8. (a) Drawing of the test specimen, and (b) specimens after rough machining.
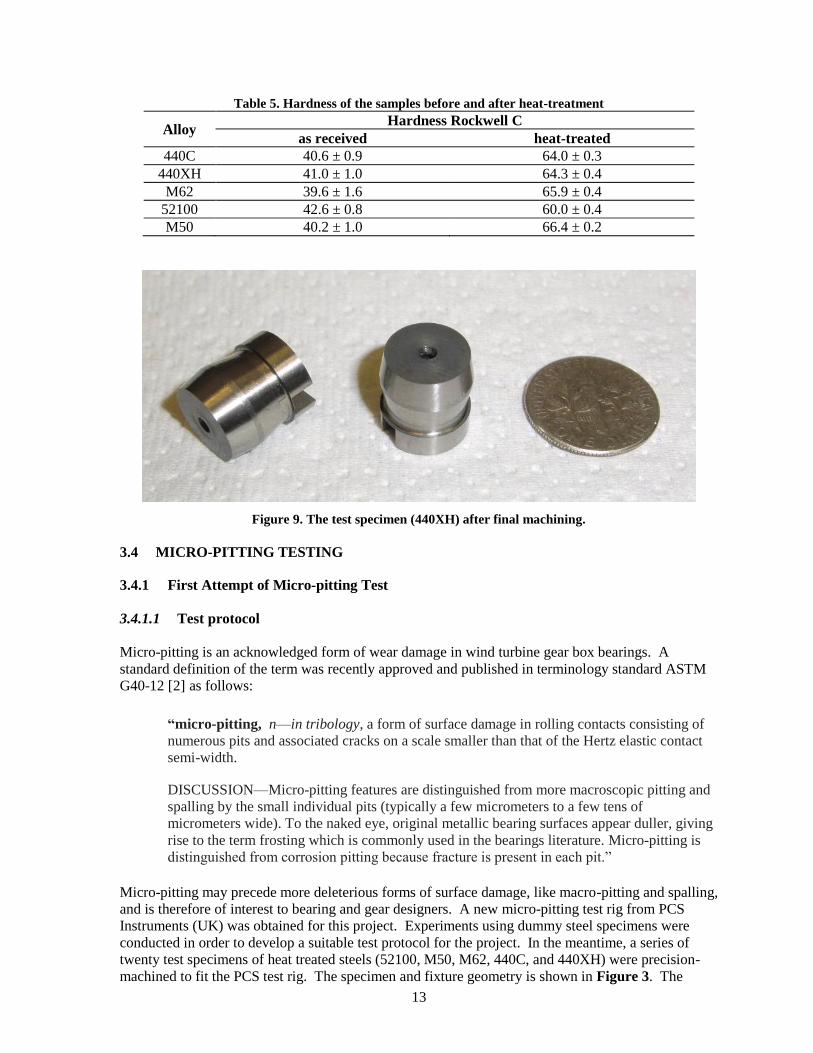
The hardness of the samples before and after the heat-treatment is summarized in Table 5. There was
no significant difference between the hardness of the small sample heat treatments (Table 4) and the
specimen heat treatment. The sample after final machining is shown in Figure 9 .
13
Table 5. Hardness of the samples before and after heat-treatment
Alloy Hardness Rockwell C
as received heat-treated
440C 40.6 ± 0.9 64.0 ± 0.3
440XH 41.0 ± 1.0 64.3 ± 0.4
M62 39.6 ± 1.6 65.9 ± 0.4
52100 42.6 ± 0.8 60.0 ± 0.4
M50 40.2 ± 1.0 66.4 ± 0.2
Figure 9. The test specimen (440XH) after final machining.
3.4 MICRO-PITTING TESTING
3.4.1 First Attempt of Micro-pitting Test
3.4.1.1 Test protocol
Micro-pitting is an acknowledged form of wear damage in wind turbine gear box bearings. A
standard definition of the term was recently approved and published in terminology standard ASTM
G40-12 [2] as follows:
“micro-pitting, n—in tribology, a form of surface damage in rolling contacts consisting of
numerous pits and associated cracks on a scale smaller than that of the Hertz elastic contact
semi-width.
DISCUSSION—Micro-pitting features are distinguished from more macroscopic pitting and
spalling by the small individual pits (typically a few micrometers to a few tens of
micrometers wide). To the naked eye, original metallic bearing surfaces appear duller, giving
rise to the term frosting which is commonly used in the bearings literature. Micro-pitting is
distinguished from corrosion pitting because fracture is present in each pit.”
Micro-pitting may precede more deleterious forms of surface damage, like macro-pitting and spalling,
and is therefore of interest to bearing and gear designers. A new micro-pitting test rig from PCS
Instruments (UK) was obtained for this project. Experiments using dummy steel specimens were
conducted in order to develop a suitable test protocol for the project. In the meantime, a series of
twenty test specimens of heat treated steels (52100, M50, M62, 440C, and 440XH) were precision-
machined to fit the PCS test rig. The specimen and fixture geometry is shown in Figure 3. The

14
central roller, approximately 12 mm in diameter is trapped between three outer disks producing three
contact stress cycles for each rotation of the inner roller. The relative speed of the inner roller and
disks is chosen to provide a desired amount of slip. Friction, torque, oil temperature and wear are
recorded.
A computer program (profile) is generated for each test or portion of each test. This enables tests to
consist of a sequence of stages of variable duration. The object is to produce micro-pits on the
specimens after a reasonable period of exposure such that the relative resistance to this phenomenon
can be determined. Figure 10 shows a micropit developed during procedure development. It was
observed after 1.6 x 10⁶ contact stress cycles. Hairline ‘tensile’ cracks appear perpendicular to the
horizontal slip direction that is indicated by the scuffing marks. Coalescing cracks eventually
produce loss of material and pits a few micrometers or tens of micrometers across.
Figure 10. Micropit produced of a steel surface during a preliminary experiment.
All five alloys were micro-pitting tested with the protocol shown in Table 6. There were three
different stages to apply the different loads (230, 305, and 390N) with a constant rate (3.0 m/s) and
slip (20%). Figure 11 shows the loading steps (loads in kilo-newtons), the corresponding friction
coefficient data (Figure 11a), and wear results (Figure 11b) for the first test run on M50 tool steel.
Friction coefficient decreases as the surface runs in. The friction coefficient data was averaged in
each step, and used for the discussion later in Figure 12. Most wear typically occurs during the first
stage of the test because the initial surface runs in and conforms to the counterface. High-spots on the
machined roller and disk profiles are quickly worn away. Near the end of the first stage, the wear rate
tends to slow down.

15
Table 6. Micro-pitting Test Protocol (first trial)
Stage Conditions Duration
0 Run-in: Speed at 3.0 m/s, increase from 0 to 230 N, maintain 0% slip, room
temperature
5 min
1 First load stage: Speed constant at 3.0 m/s, load at 230 N, 20% slip, room temperature 60 min
2 Second load stage: Speed constant at 3.0 m/s, load at 305 N, 20% slip, room
temperature
60 min
- Remove and examine the test roller for signs of surface damage, then replace --
3 Third load stage: Speed constant at 3.0 m/s, load at 390 N, 20% slip, room temperature 60 min
- Remove and examine the test roller for signs of surface damage --
4 Fourth stage: same load, speed, and slip conditions as for third stage, but adding 2.5
hours of additional running time to generate more wear (run on selected specimens)
150 min
(a) (b)
Figure 11. (a) Load history, corresponding friction coefficient, and (b) wear results for M50.
3.4.1.2 Test results (first attempt)
Figure 12 summarizes the friction data for all ten micro-pitting tests (repeats for each alloy). All
alloys survived the full protocol, and the automated shut-off controls, based on excessive vibration or
temperatures exceeding 135o C did not activate. Therefore, none of the alloys exhibited the kind of
catastrophic micro-pitting, which would trigger a premature shut-down. The friction coefficients are
reported as mean values for each load stage. With a few exceptions, the friction coefficient tends to
decrease for each load stage for the five alloys. The relative influence of material properties for the
rolling/sliding couple on the friction coefficient is dependent on a combination of factors such as the
lubricant properties, the regime of lubrication, and the state of surface roughness. The latter effects
are summarized by a parameter called the film thickness to roughness ratio (Λ). This is defined as the
ratio of the minimum lubricant film thickness divided by the root-mean-square of the arithmetic
average roughness (Ra) of opposing surfaces. As temperature increases, the viscosity of the lubricant
decreases, leading to a thinner film and the likelihood of more incidental surface contact, (Λ
decreases). From this point of view, the higher the friction coefficient, the more likely that the
materials were playing a role in its magnitude. Friction coefficients in the range of 0.08 to 0.2 (typ.)
are in the boundary lubrication regime, suggesting that both the lubricant and materials contributed to
the friction coefficient. Also note that as wear leads to an increase in surface roughness, the Λ ratio
decreases, promoting solid-solid contact and accelerating the degradation. Within the scatter of μ
data, no alloy appeared significantly better than the others.

16
Figure 12. Average friction for each loading step for two tests of each alloy.
Figure 13 summarizes the wear for stages 1 and 2, for stage 3, and for the entire test, given in terms
of specimen displacement, z (μm). Most displacement of the roller/disk couple, associated with wear
and conformity of the interface, occurred during the earlier stages of the test despite the lower applied
loads. This indicates that running-in of the initial surface finish dominated the wear during the first
part of the tests. The 440XH had least initial wear, suggesting that its higher hardness tended to retard
the effects of initial wear-in. Note also that there was a greater degree of consistency in z for
duplicate tests in Stages 1 and 2, and a much larger variability in repeated tests for Stage 3.
Figure 13. Wear summary for two tests of each alloy (average wear from 2 runs). For all but the 440XH
with its higher hardness, the running-in wear dominated Stages 1 and 2 and wear in Stage 3 was lower.

17
In micro-pitting tests, wear occurs by the development and loss of small spalls of material that may
not significantly result in surface recession. As debris is lost, the load is transferred to the remaining
material and most of the bearing surface remains. From displacement data alone, one would conclude
that the 52100 and 440XH had the best performance; however, quantifying wear only by the
displacement of the surfaces may be problematical for the reasons described, and such results should
be combined with observations of the damage as well. Furthermore, considering the need to clean the
specimens of residual lubricant and the potential for debris embedment, it is impractical to measure
wear of micro-pitting specimens by weight loss.
Table 7 summarizes the wear data of the alloys in terms of displacement. Two tests were conducted
in each material, and one of them was used for microstructure characterization by interrupting the test
after stage 3. Figure 14 shows the wear data comparison of (a) the test-interrupted samples for
microstructure characterization, and (b) the samples continued to stage 4. During stages 1 and 2
(which correspond to the lower loading test steps with 230 and 305N, respectively), the displacement
seems consistent in each material. The 440XH showed minimum displacement among the samples,
the 52100 followed, and the M50 showed maximum displacement, in both Figure 14a and Figure
14b. However, after stage 3 with 390N loading, the displacement significantly varied in the same
materials. The smaller displacements tend to show the material dependence similar to the
displacement in stages 1 and 2 (Figure 14a). These samples were used for microstructure
characterization. On the other hand, the larger displacements after stage 3 do not show any reasonable
relationship with the displacements in stages 1 and 2 (Figure 14b). Further continuous testing in
stage 4 with the same loading resulted in a similar tendency to that in stage 3. It is still unclear
whether this reflects the material nature or experimental errors, and it needs to be addressed by
conducting additional testing with a different condition.
Table 7. Wear data of the alloys (in terms of displacement, μm) for micro-pitting testing.
Alloy ID Stages 1+2
(60+60 min)
Stage 3
(60 min)
Total wear
(1 through
3)
Stage 4
(+150 min)
Total wear
(1 through 4) Remarks
52100 102 20.3 8.4 28.7 25 53.7
103 15 0.7 15.7 - - Test interrupted
M50 101 40 23.1 63.1 36 99.1
100 31 7.4 38.4 - - Test interrupted
M62 107 31 7.7 38.7 10 48.7
106 27 6.9 33.9 - - Test interrupted
440C 104 25.4 20.5 45.9 35 80.9
105 25.5 4.3 29.8 - - Test interrupted
440XH 108 9 24.8 33.8 40 73.8
109 9.9 1.6 11.5 - - Test interrupted

18
Figure 14. Wear data comparison of (a) the test-interrupted samples for microstructure
characterization and (b) the samples continued to stage 4.
3.4.1.3 Microstructure characterization
Microstructure characterization of the tested samples after stage 3 was completed. The specimen
surface and cross-sectional view were observed by SEM (scanning electron microscopes). Figure 15
shows a picture of the sample together with the indications of the observed portions. A narrow band
at the sample ridge corresponds to the tested surface contacted to the alloy steel disks, and the slopes
in both sides of the band correspond to the untested surface. The cross-sectional samples were
prepared after completing the surface observation. Figure 16 shows the SEM-SE (secondary
electron) images of the sample surfaces, with and without micro-pitting testing. The vertical axis
corresponds to the rolling/slipping (tested surface) and machining (untested surface) directions.
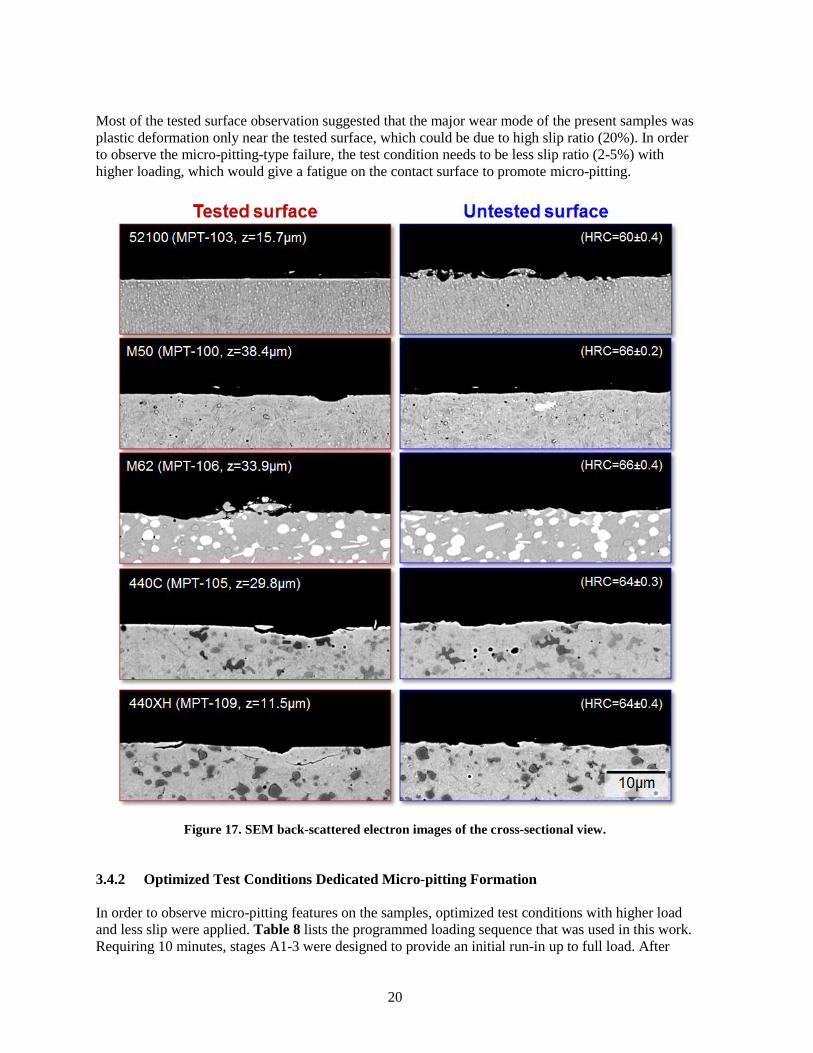
Figure 17 shows the SEM-BSE (back-scattered electron) images of the cross-sectional views of the
samples, in the same orders of those in Figure 16.
Figure 15. A picture of the sample (440XH) before testing.
The roughness of as-machined (untested) surfaces of the 52100 and 440XH seems very high, the
440C follows, and the M62 and M50 show less roughness. This indicates that the roughness would

19
depend on the hardness of the materials. However, from the cross-sectional views, the gap of the
surface relief between top and bottom is less than 3μm, so that it is almost negligible compared to the
displacement after stage 3 (11.5 to 38.4μm). All tested surfaces became relatively flat compared to
the untested surfaces. The M62 and 440XH showed smeared features on the tested surfaces,
indicating that they were plastically deformed. However, there was no significant change in the cross-
sectional microstructure near the surface. All PM materials showed cracks inside the matrix after
testing, which were initiated from the second-phases or the interphase boundaries. Most of the cracks
propagated parallel to the surface, indicating that there may be a work-hardened layer on the tested
surface which would fail to cause micro-pitting. Previous macroscopic observation found the micro-
pitting feature only on the 52100 and M62. However, no apparent relationship between the wear
resistance and microstructure was observed.
Figure 16. SEM secondary electron images of the sample surface.
20
Most of the tested surface observation suggested that the major wear mode of the present samples was
plastic deformation only near the tested surface, which could be due to high slip ratio (20%). In order
to observe the micro-pitting-type failure, the test condition needs to be less slip ratio (2-5%) with
higher loading, which would give a fatigue on the contact surface to promote micro-pitting.
Figure 17. SEM back-scattered electron images of the cross-sectional view.
3.4.2 Optimized Test Conditions Dedicated Micro-pitting Formation
In order to observe micro-pitting features on the samples, optimized test conditions with higher load
and less slip were applied. Table 8 lists the programmed loading sequence that was used in this work.
Requiring 10 minutes, stages A1-3 were designed to provide an initial run-in up to full load. After
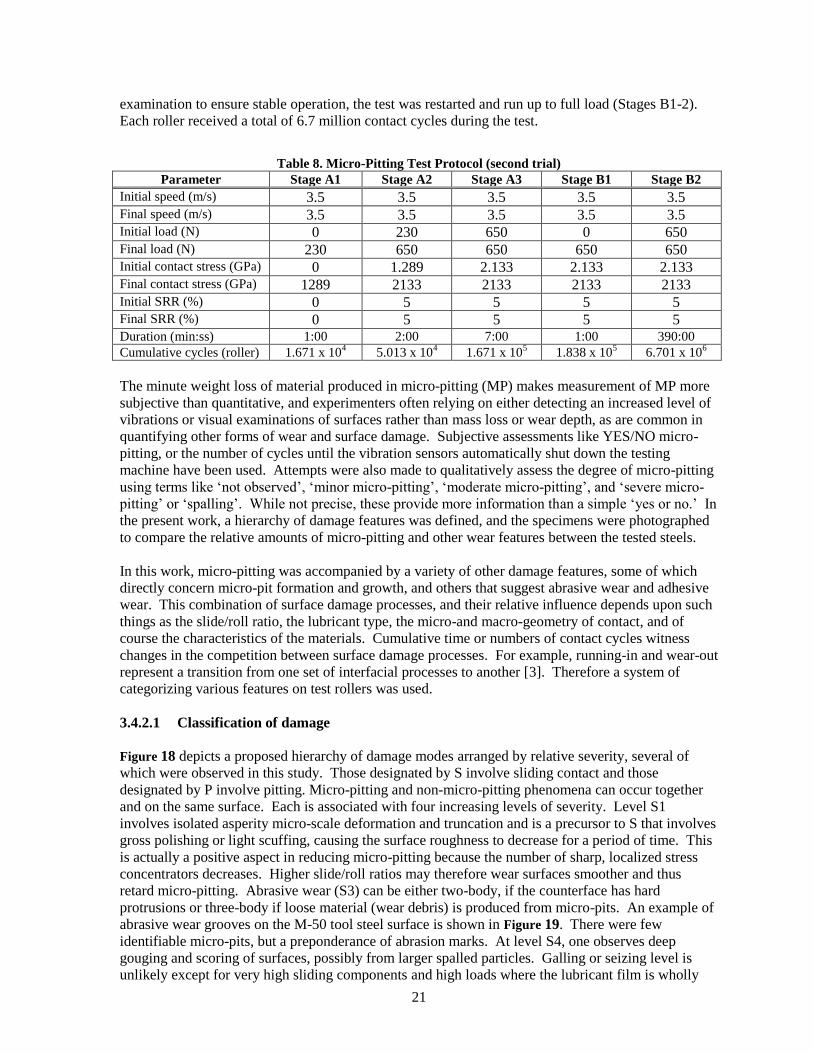
21
examination to ensure stable operation, the test was restarted and run up to full load (Stages B1-2).
Each roller received a total of 6.7 million contact cycles during the test.
Table 8. Micro-Pitting Test Protocol (second trial)
Parameter Stage A1 Stage A2 Stage A3 Stage B1 Stage B2
Initial speed (m/s) 3.5 3.5 3.5 3.5 3.5 Final speed (m/s) 3.5 3.5 3.5 3.5 3.5 Initial load (N) 0 230 650 0 650 Final load (N) 230 650 650 650 650 Initial contact stress (GPa) 0 1.289 2.133 2.133 2.133 Final contact stress (GPa) 1289 2133 2133 2133 2133 Initial SRR (%) 0 5 5 5 5 Final SRR (%) 0 5 5 5 5 Duration (min:ss) 1:00 2:00 7:00 1:00 390:00
Cumulative cycles (roller) 1.671 x 10⁴ 5.013 x 10
4 1.671 x 10
5 1.838 x 10
5 6.701 x 10
6
The minute weight loss of material produced in micro-pitting (MP) makes measurement of MP more
subjective than quantitative, and experimenters often relying on either detecting an increased level of
vibrations or visual examinations of surfaces rather than mass loss or wear depth, as are common in
quantifying other forms of wear and surface damage. Subjective assessments like YES/NO micro-
pitting, or the number of cycles until the vibration sensors automatically shut down the testing
machine have been used. Attempts were also made to qualitatively assess the degree of micro-pitting
using terms like ‘not observed’, ‘minor micro-pitting’, ‘moderate micro-pitting’, and ‘severe micro-
pitting’ or ‘spalling’. While not precise, these provide more information than a simple ‘yes or no.’ In
the present work, a hierarchy of damage features was defined, and the specimens were photographed
to compare the relative amounts of micro-pitting and other wear features between the tested steels.
In this work, micro-pitting was accompanied by a variety of other damage features, some of which
directly concern micro-pit formation and growth, and others that suggest abrasive wear and adhesive
wear. This combination of surface damage processes, and their relative influence depends upon such
things as the slide/roll ratio, the lubricant type, the micro-and macro-geometry of contact, and of
course the characteristics of the materials. Cumulative time or numbers of contact cycles witness
changes in the competition between surface damage processes. For example, running-in and wear-out
represent a transition from one set of interfacial processes to another [3]. Therefore a system of
categorizing various features on test rollers was used.
3.4.2.1 Classification of damage
Figure 18 depicts a proposed hierarchy of damage modes arranged by relative severity, several of
which were observed in this study. Those designated by S involve sliding contact and those
designated by P involve pitting. Micro-pitting and non-micro-pitting phenomena can occur together
and on the same surface. Each is associated with four increasing levels of severity. Level S1
involves isolated asperity micro-scale deformation and truncation and is a precursor to S that involves
gross polishing or light scuffing, causing the surface roughness to decrease for a period of time. This
is actually a positive aspect in reducing micro-pitting because the number of sharp, localized stress
concentrators decreases. Higher slide/roll ratios may therefore wear surfaces smoother and thus
retard micro-pitting. Abrasive wear (S3) can be either two-body, if the counterface has hard
protrusions or three-body if loose material (wear debris) is produced from micro-pits. An example of
abrasive wear grooves on the M-50 tool steel surface is shown in Figure 19. There were few
identifiable micro-pits, but a preponderance of abrasion marks. At level S4, one observes deep
gouging and scoring of surfaces, possibly from larger spalled particles. Galling or seizing level is
unlikely except for very high sliding components and high loads where the lubricant film is wholly

22
inadequate. Levels P1-P2-P3 reflect features observed in this work. Level P4 is associated with more
gross failures, such as those described elsewhere for spherical roller-type gearbox bearings [4].
Figure 18. Hierarchy of surface features observed on metallic surfaces subjected to a combination of
rolling and sliding.
Figure 19. Abrasive wear grooves and a few micro-pits on the surface of an M-50 steel roller.
3.4.2.2 Microstructural observations
An example of a relatively new pit that has not yet been distorted by plastic shear, is shown in Figure
20a for a 440C steel roller. The rim of the pit seems smooth and polished, perhaps because it stood
higher than the surrounding surface after the material inside the pit was pulled out. In comparison,
most of the micro-pits observed in this work were distorted or sheared closed in a crescent shape,
such as those shown in Figure 20b for M50 tool steel. Note the prominent abrasive groove entering
from the center right in Figure 20b that seems to produce displacement of the right side rim of the pit
almost to touch the opposite side. Also in Figure 20b some of the displaced material from the pit can
be seen overhanging the horizontal groove that lies below the pits, indicating that this material was
displaced after the groove was formed. The micro-fracture coalescence mechanism of pit formation is
indicated by the brick-wall like network of defects at the bottom of a pit in 52100 steel made visible
after the overlying material was lost (Figure 21a). The manner in which cracks can extend from the
maximum depth of a micro-pit to the free surface at each edge can be seen in the oblique view of a

23
micro-pit from the same roller in Figure 21b. Corresponding cross-sectional views of these defects in
52100 are shown in Figure 22.
(a) (b)
Figure 20. (a) A rounded micro-pit in 440C steel, and (b) distorted micro-pits in M50 tool steel
where shear has partly or fully closed them, leaving fine cracks at both ends.
Figure 21. Micro-pit in 52100 showing (a) a blocky network of micro-cracks, and (b), an oblique
view of micro-pits in the same steel specimen showing the arc-like shape of a micro-crack that underlies a
shelf of material, as seen at the right in the cross-section in Figure 7(a).
(a) (b)

24
Figure 22. Polished and etched (2% nital) cross-section of the 52100 steel roller showing (a) a series
of micro-fractures extending from the bottom of a micro-pit like that shown in Figure 21(a), and (b) a
row of micro-cracks underlying the surface. The open end of one such crack can be seen in Figure 21(b).
The slip direction was right to left, since the pits open in the tensile field following passage of the contact
patch.
In examining the steels, of which 52100 showed the most extensive MP-related damage, the features
revealed a direct interaction between sliding (abrasion)-related phenomena and rolling-related
mechanisms. For example, a flap of material partially covering a micro-pit could be loosened by
fatigue to the point where a passing asperity from the counterface or a loose particle of debris could
remove it by abrasion.
Like any metal fatigue process, micro-pitting is thought to consist of a nucleation period during which
subsurface damage accumulates, then crack initiation, crack propagation, and eventual material loss
when cracks break the surface and linkup (see Figure 23). The interior walls of micro-pits in several
of the alloys contained evidence for fatigue and for the presence of branched networks of micro-
cracks that consolidate below the surface prior to the loss of a debris particle that eventually forms a
pit. A piece of material about to be lost to form a new pit is shown in Figure 24.
Figure 23. Series of micro-pits on 52100 steel that are connected by micro-cracks. The widths and
interior scratches within the abrasive grooves are similar in size to the breath of the micro-pits suggesting
that wear debris from the pits can serve as third-body abradants.
Figure 24. Particle of 52100 steel about to leave the surface to leave a micro-pit behind. (2% nital etch)

25
The types of damage on the surfaces of roller specimens, observed using optical microscopy at
magnifications of 210 to 420 X, were characterized using the hierarchical structure displayed in
Figure 18. Results are shown in Table 9. All specimens contained varying degrees of both sliding-
related and rolling (fatigue) related damage, but non showed evidence for P4. Therefore, a column
has been added to the right of Table 9 to provide a qualitative assessment of the pitting severity.
Table 9. Categorization of Features Observed on Surfaces of Steel Test Specimens
Alloy S1 S2 S3 S4 P1 P2 P3 Observations
52100 X X X X X severe connected
MP, local scuffing,
abrasion
M50 X X X limited MP, mainly
significant abrasion
M62 X X limited MP, mainly
significant abrasion
440C X X X few areas of MP
near edges
440XH X X least MP
The 52100 steel showed the most severe indications of MP, and the pits were beginning to link up,
possibly to produce larger spalls (e.g. see Figure 23). In contrast, the 440XH alloy, showed less
evident micro-pitting (e.g. see Figure 25). Alloy 440C was also less MP prone, but there were some
areas near the edges of the rollers with minor MP. Interestingly there seemed to be no direct
relationship between Rockwell C hardness and MP tendency. Both the softest (52100, ~HRC 60) and
the hardest (M50, ~HRC 66) alloys displayed more incidence of MP than the stainless steels which
had intermediate hardness (~ HRC 63-64). Carbon content did not seem to correlate with MP either,
but the most obvious compositional difference in the steels is that the two 400-type martensitic
stainless steels, with their high Cr contents, performed best overall. The 440XH grade contains a
finer and more uniform microstructure and that may be one reason why MP nucleation was less
prevalent.
Figure 25. Reduced frequency and size of micro-pits in alloy 440XH.
A tribosystem of the type studied here involves two counter-surfaces of dissimilar composition: the
roller and the rings; therefore it is worth noting some observations concerning the ring specimens as
well as the rollers. The ring specimens were made intentionally smoother than the rollers to focus
micro-pitting on the latter, but there was also evidence of surface breaking cracks on the ring

26
specimens. For example, the ring used for the 52100 steel which micro-pitted significantly tended to
have S3 level abrasive scratches and grooves, but with no clear indications of micro-pitting. In
contrast, the test rings used against M-50 steel retained their polished appearance, but did show
surface-breaking micro-cracks (Figure 26).
Figure 26. Hairline, transverse cracks suggestive of micro-pitting initiation in the ring specimen
used with M-50 rollers.
Clearly, opposing rolling element surfaces such as those used in the current work experience
comparable loading histories, and in the current work, the authors acknowledge that contact damage
was not exclusive to the roller specimen. However, the emphasis here was on characterizing the five
steels used for rollers, and a detailed characterization of the disks was not undertaken.
3.4.2.3 A note on white layers and micro-pitting
In recent years there has been increased interest in the formation of what have been called ‘white
layers’ in the zone below contact surfaces (e.g., [5,6,7,8,9,10]). Features that appear white or nearly
featureless in polished and etched cross-sections have been observed in conjunction with wear for
many years, especially on ferrous materials and in heavily-loaded applications like railroad rails, gear
teeth, and highly-stressed rolling elements. Their appearance can vary depending on the materials
involved, the severity and geometry of surface contact, and even the type of etchants used to reveal
them. In prior work on worn wind turbine bearings [4], relatively thick white layers were easily
visible, and many contained networks of fine cracks associated with spalls and other surface damage
features (e.g., see Figure 27). In the present work, however, etched cross-sections of the test
specimens revealed no clear evidence of such layers although there are localized areas in which the
near-surface microstructures of the rollers were distorted and sheared (e.g, see Figure 22). High
magnification optical examination of the most micro-pitting resistant steels (440C and 440XH)
revealed micro-cracks emanating below micro-pits that avoided the blocky carbide particles in the
microstructure as they propagated through the matrix material (see Figure 28). Note that the micro-
crack extends below the surface several times the depth of the surface pit, but there is no apparent
white layer. Based on the present work, white layers seem less associated with MP, which occurs on
the localized asperity level, than with macro-pitting which seems to be associated with more
extensive, heavily work-hardened subsurface regions, extending many times the length and breadth of
individual features.

27
Figure 27. White layer on a bearing steel used in a wind turbine gearbox bearing showing a
subsurface void and extending micro-cracks associated with the nucleation of spalls.
Figure 28. Micro-cracks avoiding carbide particles as they extend from the bottom of a micro-pit.
(glyceregia etch)

28
4. BENEFIT ASSESSMENTS
The benefits in prolonging the life of steel components for energy applications are discussed from two
perspectives: 1) loss of steel in wear, and 2) downtime of a renewable energy system (particularly in
the area of renewable energy such as wind turbine bearings). The first area of interest for energy
assessments is universal and relates to the shortcomings in using steel in wear prone applications
without devising mitigation strategies. Often, purchases of materials/components are based on initial
costs, and may not capture maintenance, repair, and downtime to develop cost models for full life of
system. Steel components, especially steel bearings, are used in many renewable energy systems. Of
particular interests are wind turbines where bearings are used throughout the system and their failure
can lead to sizeable downtime, component replacement and service costs, and loses in recoverable
energy.
Steels are used through a broad range of engineering applications including bearings due to their
mechanical properties, availability, and relatively low cost. However, most steels are not optimally
designed for wear resistance. Direct and indirect costs and energy losses associated with the wear of
steel components are not easily aggregated. One study performed in 1978 attempted to quantify the
annual cost to the U.S. economy. Estimated at $20 billion annually at the time of the report, this
would have the same buying power as ~$65 billion dollars annually today [11xi]. Estimates provided
in an ASM handbook from 2001 listed annual energy loses in lost weight of steel due to wear of
components in industrial operations, Table 10 [8]. Included in their estimate is 505 TBtus of energy in
steel loss due to wear in utilities, 52 TBtus in mining, 19 TBtus in agriculture, and 14 TBtus in
primary metal fabrication [8]. Another statistic [8] stated that “Highway vehicles alone use annually
14,600 TBtu/ton of energy represented in lost weight of steel and 18.6% of this energy could be saved
through effective wear-control measures.”
Table 10: Industrial operations with significant annual wear consequences
Wear is a significant issue in the recovery of renewable energy. Steel components are used through-
out infrastructure and equipment. Wind turbine components, specifically steel bearings located in the
nacelle, are a great example of the issues of wear in renewable energy. Reports from Sweden,
Finland, and Germany between the years of 1997 and 2004 have illustrated both the number of
occurrences of specific failures and the downtime to repair the failure . While electrical systems have
the highest rate of occurrence, gearbox failures result in the longest overall downtime (~20 to 30% of
downtime). An average repair to the gearbox takes over 200 hours to repair, and the bearings fail

29
more often than any other specific component. Furthermore, a failure to a bearing can often result in
the repair or replacement with other components adjacent to the bearing. From the results reported in
Sweden, the average turbine has a failure 0.402 times a year. In 2012, the United States brought the
total wind energy capacity to 60GW. 60GW represents $120B of investment, the equivalent power
required for 14.7 million homes, avoids the consumption of 36.6 billion gallons of water, and avoids
95.9 million tons of CO2. If we assume the U.S. has similar failures to Europe, and then look at the
total amount of down time due to only gearbox failures, we would be looking at ~0.08 times a year.
For the 60 GW of installed power in 2012 that equates to 0.55 GW of lost generation capacity due to
wear. The growth curve for installed wind power generation is shown in Figure 29 and is expected to
continue. Clearly enhanced bearings will have a significant impact on energy savings.
Figure 29. US wind power market growth curve from 1998 to 2011.

30
5. COMMERCIALIZATION & RECOMMENDATIONS
The fabrication of steel components from powder metallurgy is a mature technology that is used
in high performance applications such as tooling, biomedical components, automotive, aircraft,
appliances, and energy production figure 30). Powder production via gas atomization and
consolidation of powders by canning and hot isostatic pressing has been commercialized by
companies such as Carpenter Technology Corporation, one of this project’s main industrial
collaborators. The estimated sales of PM components for North America alone are over $7
billion, and represent 25,000 jobs (figure 31). The objective of this project was to determine and
provide information on the potential benefits from PM microstructures over casting
microstructures that may improve PM bearings and other components for application in wind
energy generation and other energy industries. In the Metal Powder Industries Federation’s “PM
Industry Roadmap” written in 2012, alternative energy is listed as one market that represents a
significant opportunity for PM industry. Wind energy is the first renewable discussed in this
report, and bearings and gears are listed as components required by this industry that could be
fabricated using PM.
Figure 30. The powder metallurgy structural components markets.

31
Figure 31. Production of iron and steel from powder metallurgy 1998-2010.
The early results found in this project illustrate some advantages of component enhancements
from the PM microstructures compared to the cast microstructures for the given fabrication
procedures and testing conditions as will be further discussed in conclusions. However, several
key evaluations should be performed beyond the current scope of this project that may better
illustrate the advantages for PM in this area of application. Some of the alloys exhibited
improved micro-pitting wear resistance over cast alloys; this area needs to be further explored to
better understand how and if this will translate into increased longevity of PM bearings. In
addition, a larger range of commercial alloys being evaluated may better characterize the
difference in properties. Powder metallurgy allows fabrication of graded structures. For
example, a bearing could be fabricated with ceramic particles in a metal matrix composite at the
surface of the bearing in any wear prone areas. For the scope of this project the team tried to stay
with alloys that were similar between castings and powder metallurgy. Further testing should be
performed with alloys only possible through solid state processing. Examples of potential alloys
that could be evaluated include the nanocomposite materials recently highlighted in Scientific
American [12]. Metal matrix composites and alloys with high concentrations of interstitials are
possible with powder metallurgy and could further improve the wear resistance.
In this project, only the bearing materials were investigated; changing lubrications and the
differential hardness between rollers and discs (bearings and gears) would also provide further
understanding on the performance of powder metallurgy materials. The test samples used in this
project were from samples that were from small castings or PM samples. Many bearings would
be made from much larger castings. The microstructures would vary from the outside surface to
the center of the casting due to the large thermal gradients and inconsistent cooling rates; these
differences were not evaluated in this testing. Finally, the test methods investigated in this
project were chosen due to the comparative ease of testing, ability to evaluate multiple modes of
wear, and elimination of risk to wind turbine equipment. However, field testing may provide
further evidence as to the difference in materials. A laboratory test cannot fully capture field
conditions, and events, contaminates, debris, or aggressive environments could modify the
results witnessed in a wind turbine. After further laboratory evaluation, field tests would provide
valuable feedback as to the accuracy of the laboratory testing.

32
6. ACCOMPLISHMENTS
Following accomplishments have been made possible through the present project;
– Installed a computer-controlled micro-pitting test rig (MPR) in the tribology laboratory of
ORNL’s Materials Science and Technology Division, and developed wear mechanism to see high
cycle rolling contact fatigue characteristics under lubricated environments.
– Developed test geometry and machining practices with MPR to perform work on these wear
resistant alloys which simulate the actual wear behavior (i.e. micro-pitting) of the bearing
materials in a wind turbine gear box.
– Tested total 5 different alloys/ 15 specimens to determine the benefit of power metallurgy on the
wear resistant alloys to be used as bearing materials.
– One extended abstract with the following title was published.
P. J. Blau, Y. Yamamoto, K. M. Cooley, and S. Reeves, “INVESTIGATION and
CHARACTERIZATION of MICRO-PITTING DAMAGE in BEARING STEELS”
An oral presentation with the same title above was presented for a meeting “Society of
Tribologists and Lubrication Engineers (STLE) Annual Meeting 2013,” which was held at
Detroit, MI in May 2013.

33
7. CONCLUSION
Oak Ridge National Laboratory, in Partnership with Avure Technologies Inc. and Carpenter
Technology, has investigated the potential for improving the wear resistance of wind turbine gearbox
bearings by fabrication using the Hot Isostatic Pressing (HIP) of high alloy steel powders. Three
candidate bearing steels 440C, 440XH, and M62, were selected for this processing study. A
commercial high chromium bearing steel, AISI 52100, and a common tool steel, M50, were also
included for comparison. All five steels, the three test steels and the two reference steels, were
hardened by established heat-treatment practices. Wind turbine gearbox makers have recently
focused on reducing micro-pitting, an early form of surface damage that can lead to more severe
problems. Therefore, a durability test method specifically designed to evaluate micro-pitting
behavior under lubricated rolling contact conditions was employed in this work. The resultant wear
test data, coupled with surface observations, were used to compare the micro-pitting characteristics of
microstructurally well-characterized high alloy steels. Information developed in this work was
intended to determine the extent to which the application of advanced HIP process can improve
bearing durability in contact fatigue environments like wind turbine gearboxes. Of the five steels
tested, the 440XH was particularly resistant to micro-pitting in comparison to the 52100 steel which
exhibited extensive surface damage. Under lubricated conditions, the relative roles of the materials,
the surface roughness, and the lubricant properties of friction and wear must be taken into
consideration. The current work has focused the role of the materials by using a relatively poor
lubricant.
First trial rolling-sliding testing with relatively larger slip ratio (20%) and lower load (305N) resulted
in showing wear behavior as a dominant mode, rather than micro-pitting feature. The M50 showed
the largest displacement (or the amount of surface wear) among the tested materials, but this test
condition could not differentiate the wear characteristic or resistance of the other materials. Cross-
sectional observation of tested surface indicated the micro-crack initiation associated with existing
carbides.
Optimized rolling-sliding experiments with relatively smaller slip ratio (5%) and higher load (650N)
exhibited signs of abrasive wear, but not all had the same degree of micro-pitting damage. The 52100
steel had the most severe micro-pitting, consisting of distorted craters, many of which were connected
by micro-cracks. Cross-sectional examination showed multiple micro-cracks extending into the alloy
microstructure from the same pit, and the depth of the cracks was several times the depth of the
micro-pit. Type 440XH had the least evident micro-pitting damage. Pits were more localized and the
micro-cracks associated with them tended to avoid carbides during propagation. Abrasive processes
were produced by debris from mico-pitting, and the two processes could work together to worsen the
surface damage. A system of progressive sliding and rolling contact damage was proposed. There was
no evidence for the formation of what are called ‘white layers’ in the current micro-pitted specimens,
in contrast to such layers that are found in conjunction with macro-pitting of rolling element bearings
and gears.
All these results suggested the potential advantage of high alloy tool steels, such as 440XH, for a
better resistance of micro-pitting features, compared to conventional cast-and-wrought type tool steels
with relatively low alloying elements. Only PM process can realize the optimization of microstructure
of the high alloy tool steels suitable for the expected properties

34
8. REFERENCES
[1] D. W. Hetznera, W.V. Geertruydenb, “Crystallography and metallography of carbides in high
alloy steels”, Materials Characterization, vol. 59 (2008) pp. 825-841.
[2] ASTM G-40-12 Standard Terminology Relating to Wear and Erosion, ASTM Annual Book of
Standards, Vol. 03.02
[3] P. J. Blau (1989) Friction and Wear Transitions of Materials: Break-in, Wear-in, Run-in, Noyes
Pub., Park Ridge, NJ.
[4] P. J. Blau (2010) “Wear Analysis of Wind Turbine Gearbox Bearings,” Oak Ridge National
Laboratory Technical Report ORNL/TM-2010/59, (figure 1001SK02), p 22.
[5] T. S. Eyre and D. Maynard (1971) “Surface aspects of metal-to-metal wear,” Wear, Vol. 18(4),
pp. 301-310.
[6] T. S. Eyre and A. Baxter (1972) “The formation of white layers at rubbing surfaces,” Tribology,
Vol. 5 (6), pp. 256-261.
[7] P. J. Blau (1985) "Measurements and Interpretations of Sliding Wear Damage in Metals," J. of
Tribology, Vol. 107, p. 483.
[8] P. J. Blau and A. D. Doyle (1987) "Metallographic Evidence for the Nucleation of Subsurface
Microcracks During Unlubricated Sliding of Metals," Wear, Vol. 117, p. 381.
[9] Y. Y. Yang, H. S. Fang, and W. G. Huang (1996) “A study on wear resistance of the white
layer,” Trib. International, Vol. 29 (5), pp. 425-428.
[10] G. Baumann, H. J. Fecht, and S. Liebelt (1996) “Formation of white-etching layers on rail
treads,” Wear, Vol. 191 (1-2), pp. 133-140.
[11] Surface Engineering for Corrosion and Wear Resistance. J.R. Davis Ed. ASM International,
Materials Park, OH. 2001.
[12] 9 Materials That Will Change the Future of Manufacturing, Scientific American, Steven Ashley
and Larry Greenemeier, 2013, http://www.scientificamerican.com/slideshow.cfm?id=9-
materials-that-will-change-manufacturing