improved method for evaluating the dead volume and protein–protein interactions by...
TRANSCRIPT

Improved Method for Evaluating the Dead Volume and Protein−Protein Interactions by Self-Interaction ChromatographyElaheh Binabaji,† Suma Rao,‡ and Andrew L. Zydney*,†
†Department of Chemical Engineering, The Pennsylvania State University, University Park, Pennsylvania 16802, United States‡Purification Process Development, Amgen, Inc., Mail Stop 30W-2-A, Thousand Oaks, California 91320, United States
ABSTRACT: Self-interaction chromatography (SIC) is awell-established method for studying protein−protein inter-actions. The second virial coefficient in SIC is evaluateddirectly from the measured retention coefficient for the proteinusing a column packed with resin on which the same proteinhas been immobilized on the pore surface. One of thechallenges in determining the retention coefficient is theevaluation of the dead volume, which is the retention volumethat would be measured for a noninteracting solute with thesame effective size as the protein of interest. Previous studiesof SIC have used a “dead column” packed with the same resinbut without the immobilized protein to evaluate the dead volume, but this creates several experimental and theoretical challenges.We have developed a new approach using a dextran standard with effective size equal to that of the protein (as determined bysize exclusion chromatography). The second virial coefficient was evaluated for a monoclonal antibody over a range of bufferconditions using this new approach. The data were in good agreement with independent measurements obtained by membraneosmometry under conditions dominated by repulsive interactions. The simplicity and accuracy of this method should facilitatethe use of self-interaction chromatography for quantifying protein−protein interactions.
Self-interaction chromatography (SIC) is a widely usedmethod for studying protein−protein interactions that are
important in protein formulation,1−4 crystallization,5−10 andpurification,2−11 as well as being important with regard tounderstanding protein aggregation in both in vitro and in vivosystems. SIC was first introduced by Patro and Przybycien.12
Tessier et al.13 subsequently showed that the measuredretention coefficient (k′) could be used to calculate the secondvirial coefficient (B2), as
ρϕ= − ′
B Bk
2 HSs (1)
where ϕ is the effective phase ratio (equal to the accessiblesurface area divided by the mobile phase volume), ρs theamount of protein immobilized per unit pore surface area, andBHS the hard sphere contribution to the virial coefficient. B2provides a measure of the potential of mean force for two-bodyinteractions, which is directly related to the magnitude of theintermolecular interactions between proteins in the solution ofinterest.SIC has been used to evaluate the second virial coefficient for
bovine serum albumin (BSA),8,9 lysozyme,4,6,13−15 α-chymo-trypsinogen,13 and monoclonal antibodies3,7,16 among others,with results in agreement with independent estimates of B2from static light scattering,17 neutron scattering,17 small-angleX-ray scattering,18−20 low-angle laser light scattering,21,22 size-exclusion chromatography,23 and membrane osmometery. Incomparison to other methods, SIC uses much-smaller
quantities of protein (typically <1 mg), it generally requiresless time, and it is easily automated. Recent studies haveexamined several factors that influence the performance of SIC,including the degree of immobilization,13,15 the possibility ofmultibody interactions,15 the properties of the basin resin,6 andthe orientation of the immobilized protein.24
One of the other challenges in evaluating the second virialcoefficient using SIC is the evaluation of the dead volume (V0)in the expression for the retention coefficient:
′ =−
kV V
Vr 0
0 (2)
where Vr is the retention volume of the protein of interest andV0 is the retention volume of a noninteracting molecule of thesame size as the protein. It is not possible to evaluate V0 fromdata with a small (noninteracting) solute (e.g., acetone),because the small solute can access much more of the porespace than the protein due to the large difference in physicalsize. This effect becomes even more pronounced when usingSIC for large proteins such as monoclonal antibodies.Tessier et al.13,25 evaluated V0 by multiplying the measured
retention volume for acetone by the ratio of the retentionvolumes for the protein and acetone in a second column
Received: June 9, 2013Accepted: August 25, 2013Published: August 25, 2013
Article
pubs.acs.org/ac
© 2013 American Chemical Society 9101 dx.doi.org/10.1021/ac4017242 | Anal. Chem. 2013, 85, 9101−9106

containing identical chromatographic particles but without anyimmobilized protein:
=′′
−⎛⎝⎜
⎞⎠⎟V V
V
VV0 acetone
protein
acetoneimmobilized
(3)
where the primes refer to the measured retention volumes inthe dead column and Vimmobilized is the volume occupied by theimmobilized protein molecules in the first column, typicallyestimated by dividing the measured mass of immobilizedprotein by the protein density .Although eq 3 is widely used to evaluate V0 in previous
studies of SIC, there are many concerns with this approach.First, eq 3 requires the use of a second chromatographiccolumn, significantly increasing the time for the experimentalmeasurements. Second, the use of the ratio of the retentionvolumes in the second column as a correction factor is onlyappropriate if there are no interactions between the protein andthe stationary phase (in the absence of immobilized protein)and if the two columns have equivalent packing characteristics.Third, the estimation of the volume of immobilized proteinrequires an accurate value for the protein density.The objective of this work was to develop a more accurate
approach for evaluating the dead volume in SIC through theuse of a dextran standard with the same effective size as theprotein (as determined by size exclusion chromatography (asthe noninteracting molecule)). This completely eliminates theneed for a second column, reducing the experimental time andimproving the accuracy of the SIC measurements. Theeffectiveness of this approach was demonstrated for amonoclonal antibody under conditions dominated by repulsiveinteractions, with the calculated values of the second virialcoefficient in good agreement with independent measurementsobtained by membrane osmometry.
■ EXPERIMENTAL PROCEDURESProtein and Dextran. Experiments were performed using a
highly purified monoclonal antibody provided by Amgen, Inc.,with a molecular weight of 142 kDa and an isoelectric point of8.1. The antibody was stored at −80 °C and slowly thawedprior to use. The antibody was placed in the desired buffer bydiafiltration through a fully retentive Ultracel compositeregenerated cellulose membrane with 10 kDa nominalmolecular weight cutoff (Millipore Corp., Bedford, MA). Theresulting protein solution was kept at 4 °C. Narrow dextranstandards with polydispersity <1.5 and with molecular weightsof 33, 42, 62, and 80 kDa (American Polymer Standards,Mentor, OH) and also 50 kDa (Sigma−Aldrich) were dissolvedin the appropriate buffer solution.Buffered salt solutions were prepared by dissolving
appropriate amounts of sodium acetate (Sigma, Product No.S7670), sodium phosphate monobasic (Sigma, Product No.S9638), and/or sodium phosphate dibasic (Sigma, Product No.S7907) in deionized water obtained from a NANOpureDiamond water purification system (Barnstead ThermolyneCorporation, Dubuque, IA) with a resistivity of >18 MΩ cm.The ionic strength was adjusted using NaCl (BDH Chemicals,Product No. BDH0286), and the pH was adjusted as neededusing 0.1 N NaOH or HCl. All buffer solutions were prefilteredthrough 0.2-μm-pore-size Supor 200 membranes (Pall Corp.,Ann Arbor, MI) to remove any undissolved salt or particulates.Antibody concentrations were determined spectrophoto-
metrically using a SPECTRAmax Plus 384 UV−vis spectropho-
tometer (MD Corp., Sunnyvale, CA) with the absorbancemeasured at 280 nm. Samples were diluted as needed to ensurethat the measured absorbance was in the linear range(absorbance between 0.1 and 0.4). Actual concentrationswere evaluated by comparison of the absorbance with that ofknown protein standards, with results reported as the mean ±standard deviation for a minimum of four repeat measurements.
Column Preparation. The monoclonal antibody wasrandomly immobilized on the surface of a Toyopearl AFFormyl 650 M resin (Tosoh Bioscience LLC, Tokyo, Japan) byreaction of the free amine groups with the reactive aldehydegroup on the resins.25 Approximately 3 mL of the resin werefirst washed four times using 50 mL of deionized water with theparticles collected by centrifugation. The resin particles werethen rinsed with 50 mL of 0.1 M potassium phosphate buffer atpH 7.5. The collected particles were added to 10 mL of a 5 g/Lsolution of the monoclonal antibody in 0.1 M potassiumphosphate buffer at pH 7.5. Approximately 90 mg of sodiumcyanoborohydride was added to the solution (with extremecaution) to initiate the reaction. The mixture was incubated atroom temperature with constant agitation provided by a rotaryshaker (Innova 4000, New Brunswick Scientific). The amountof protein immobilized on the particles was calculated from thedifference in protein concentration in the reaction solutionbefore and after reaction.The particles with immobilized protein were washed four
times with 200 mL of phosphate buffer. The particles were thenadded to a 15 mL solution of 1 M ethanolamine at pH 8 to capany unreacted aldehyde groups. Approximately 20 mg ofsodium cyanoborohydride was also added to the mixture toinitiate the reaction. The reaction mixture was incubated atroom temperature for 4 h, and the particles were then washedagain with 1 M NaCl at pH 7 to remove any unbound protein.Approximately 2.5 mL of resin particles were prepared as a
50% slurry and packed into a Tricorn 5/50 column (GEHealthcare, Tyron, PA) at a flow rate of 3 mL/min for 15 min,with the flow rate reduced and maintained at 0.5 mL/min foran additional 2 h to ensure uniform packing. The quality of thecolumn packing was evaluated by injecting a 1% acetonesolution; columns were only used if the acetone gave a sharpsymmetric Gaussian peak with a peak width (at half height) of<0.5 mL at an eluent flow rate of 0.1 mL/min.
Self-Interaction Chromatography (SIC). SIC wasperformed using an Agilent 1100 series chromatography system(Agilent Technologies, Palo Alto, CA). The column was firstequilibrated with 10 column volumes of the buffer of interest ata flow rate of 0.1 mL/min. A 50-μL sample of the antibody,acetone, or dextran was injected into the column, with theretention volume evaluated at an eluent flow rate of 0.1 mL/min. The column was then washed with 5 mM phosphatebuffer at pH 7 with 1 M NaCl for four column volumesfollowed by seven column volumes of 5 mM phosphate bufferat pH 7 (with no additional salt) before re-equilibrating with anew buffer. All retention volumes were evaluated in triplicatewith results reported as the mean ± standard deviation. Thecolumn was stored at 4 °C when not in use. Data were alsoobtained with a “dead column” packed with the same particles,with the aldehyde groups capped by reaction with sodiumcyanoborohydride but without any immobilized protein.The same chromatography system was used for size-
exclusion chromatography but with a Superdex 200 10/300GL column (GE Healthcare, Product No. 17-5175-01). Sodium
Analytical Chemistry Article
dx.doi.org/10.1021/ac4017242 | Anal. Chem. 2013, 85, 9101−91069102

phosphate buffer (50 mM) at pH 7 with 150 mM NaCl wasused as the eluent at a flow rate of 0.3 mL/min.
■ RESULTSDead Volume. Our initial efforts to evaluate the column
dead volume (V0) were based on the use of a “dead column”packed with the Toyopearl AF Formyl 650 M resin in whichthe aldehyde groups were capped by reaction with sodiumcyanoborohydride and ethanolamine, but without any immo-bilized protein, following the procedures described by Tessieret al.13 However, measurements obtained on multiple deadcolumns, prepared and packed following identical procedures,showed a range of Vprotein′ /Vacetone′ values from 0.78 to 0.79,resulting in a 0.017 mL difference in the calculated deadvolumes given by eq 3. This small (1.7%) variation in the deadvolume led to more than a 30% variation in the calculatedvalues of k′ (given by eq 2) and, in turn, the second virialcoefficient (given by eq 1).It is also possible to obtain a rough estimate of the dead
volume using a simple partitioning model. The mean value ofthe acetone retention volume in the dead column was 1.3 mL.The protein retention volume for a resin with uniformcylindrical pores can be estimated as
′ = ′ − + ′⎜ ⎟⎛⎝
⎞⎠V V
rR
V1protein pores
2
void (4)
where rs is the protein radius and R is the pore radius. Equation4 gives Vprotein′ = 1.21 mL using rs = 5.43 nm for the monoclonalantibody and R = 73.9 nm for the 650 M resin,26 assuming thatthe acetone volume is equally distributed between the porespace (Vpore′ ) and the interparticle void volume (Vvoid′ ). Similarresults were obtained by integrating over the pore sizedistribution.26 Although eq 4 is an only an approximation,the very large difference between the calculated value of Vprotein′and the value measured experimentally using the dead column(Vprotein′ = 1.02 mL) suggests that the use of the dead columnmay not provide an accurate estimate of Vprotein′ . This could bedue to the presence of nonspecific interactions between theantibody and the resin in the dead column.A similar approach can be used to estimate the accuracy of
the dead volume calculated using eq 3. The surface coverage ofthe immobilized protein was evaluated as 13% of a monolayerbased on the mass uptake of antibody during the immobiliza-tion reaction using an internal surface area per settled particlevolume of 9 m2/mL, based on the inverse size exclusionchromatography data presented by DePhillips and Lenhoff.26
The column containing the resin with immobilized protein isassumed to be identical to the dead column with Vvoid = 0.65mL and Vpore = 0.62 mL accounting for the reduction in porevolume associated with the immobilized protein. The deadvolume for this column can then be evaluated theoreticallyusing eq 4 as V0 = 1.18 mL using R = 68.5 nm. In contrast, thecalculated value of V0 from eq 3 is 0.96 mL using theexperimental values for Vprotein′ and Vacetone′ . Similar calculationsusing the theoretical values for Vprotein′ give V0 = 1.15 mL, bothof which are in poor agreement with the model calculation.An alternative approach to evaluating the dead volume in the
protein-immobilized column is to use a noninteracting solutethat has the same effective volume as the protein of interest.Dextrans have been used extensively as noninteracting solutesin inverse size exclusion chromatography to evaluate the poresize distribution of different chromatographic resins,26 suggest-
ing that they might be appropriate in SIC as well. Previousstudies of the effects of dextran on protein solubility27 areconsistent with an excluded volume effect, suggesting that thereare no specific dextran−protein interactions in these systems.Table 1 shows data for the measured retention volume of a
series of narrow molecular weight dextran standards in aSuperdex 200 resin packed in a 10/300 GL column. The finalcolumn shows the calculated value of the Stokes radii for thedifferent dextrans evaluated using the correlation28
=r 0.0488MWs0.437
(5)
The last row of Table 1 shows results for the monoclonalantibody. The retention volume for the antibody is essentiallyidentical to that of the 50 kDa dextran standard, which has aweight-average molecular weight of 48 600 Da; the Stokesradius for the antibody was evaluated as rs = 5.43 nm byinterpolation of the size exclusion chromatography results. Theresults in Table 1 suggest that the 50 kDa dextran standard canbe used as a noninteracting molecule with equivalent effectivesize to the antibody to evaluate the dead volume in the proteinimmobilized column.Figure 1 shows typical chromatograms for the 50 kDa
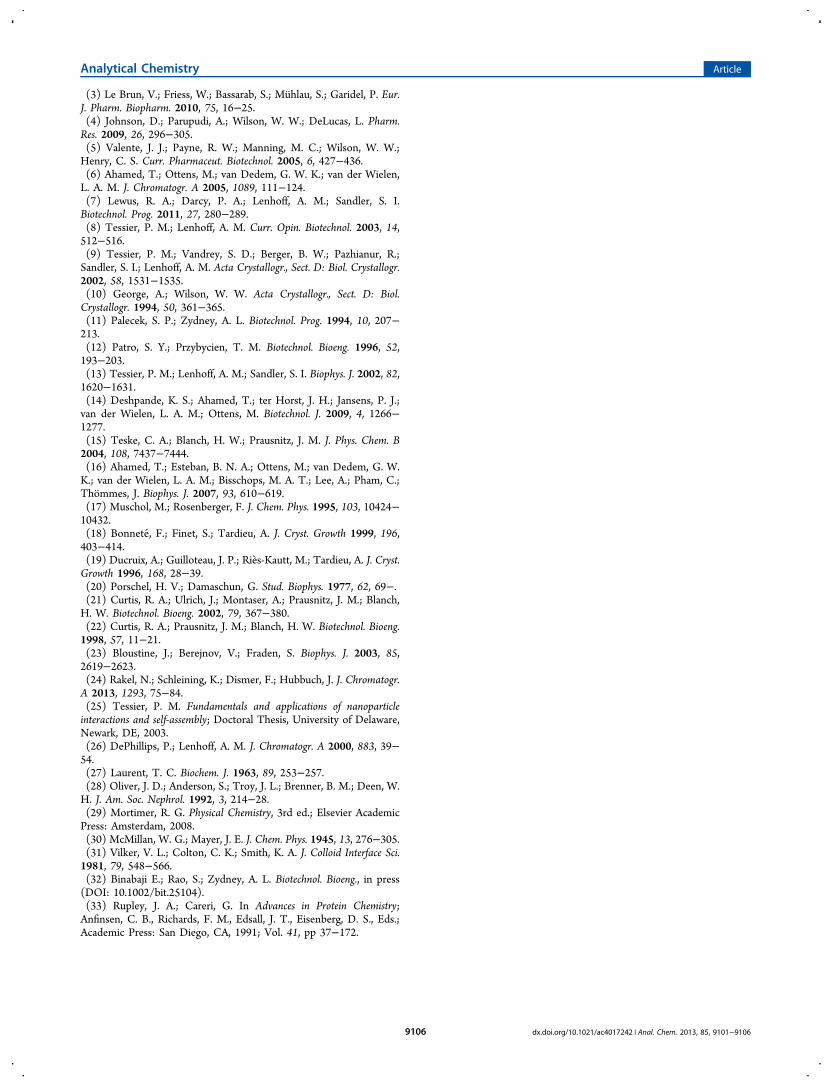
dextran and acetone. The running buffer for the dextran was a
50 mM phosphate buffer with 150 mM NaCl to minimize anyelectrostatic interactions associated with the charged antibodywithin the resin pores. The measured retention volume for thedextran is 1.186 mL, compared to 1.265 mL for the acetone in aprotein immobilized column with 13% surface coverage. Theacetone retention volume was independent of the buffer
Table 1. Retention Volumes for the Dextran Standards andthe Monoclonal Antibody Determined from Size-ExclusionChromatography Using the Superdex Column
species retention volume (mL) radius (nm)a
dextran, 33 kDa 13.6 ± 0.1 4.63dextran, 42 kDa 12.9 ± 0.1 5.15dextran, 50 kDa 12.5 ± 0.1 5.45dextran, 62 kDa 12.0 ± 0.1 6.09dextran, 80 kDa 11.4 ± 0.1 6.81monoclonal antibody 12.6 ± 0.1 5.43
aDextran radius estimated from the molecular weight using eq 5.
Figure 1. Comparison of acetone and the 50 kDa dextran elutionpeaks in the protein-immobilized column.
Analytical Chemistry Article
dx.doi.org/10.1021/ac4017242 | Anal. Chem. 2013, 85, 9101−91069103

concentration. The dextran retention volume (1.186 mL) is invery good agreement with the value of V0 calculated from thecylindrical pore model (1.18 mL), providing further support forusing dextran as a noninteracting solute.Second Virial Coefficients. The bottom panel of Figure 2
shows the measured retention volumes for the monoclonal
antibody in a protein-immobilized column with 13% surfacecoverage at pH 5 for solutions prepared using a 5 mM acetatebuffer with different amounts of added NaCl. These conditionsare similar to those used for many monoclonal antibodyformulations, with the intermolecular interactions dominatedby repulsive interactions. The data are plotted as a function ofsolution ionic strength, calculated based on the known amountsof acetate and NaCl (neglecting any contribution from theprotein).The protein retention volume was calculated from the
location of the peak maximum due to the presence ofsignificant peak tailing in some of the runs. This tailing islikely due to mass-transfer limitations or nonspecificinteractions with the base matrix, as observed previously byAhamed et al.16 under similar conditions, and thus does notprovide a measure of the magnitude of the protein−proteininteractions in this system. Ahamed et al.16 also used the peakmaximum in their analysis of protein−protein interactionsusing SIC. In each case, data were obtained for three repeatmeasurements, with results reported as the mean retentionvolume. The data were highly reproducible, with the standarddeviation between the repeat measurements of <0.02 mL(∼2%).
The antibody retention volume increased from 0.979 mL to1.095 mL as the ionic strength was increased from 3 mM to 153mM. This increase in retention volume is consistent with areduction in electrostatic exclusion (repulsion) of the positivelycharged antibody from the positively charged pores of theantibody-immobilized column because of the increase inelectrostatic shielding provided by the bulk electrolyte. Themeasured retention volumes appear to approach a constantvalue at high ionic strength, with Vprotein = 1.095 mL beingslightly smaller than the dead volume determined from the 50kDa dextran (V0 = 1.186 mL). This is discussed in more detailbelow.The upper panel in Figure 2 shows the second virial
coefficients calculated directly from eq 1 using the retentioncoefficients given by eq 2 and the measured retention volumesof the antibody and the 50 kDa dextran. The surface density ofthe immobilized antibody was evaluated from a simple massbalance on the protein solution used for the immobilizationreaction giving 1.4 × 10¹⁵ molecules/m2. The effective phaseratio was estimated from data for the pore size distribution ofthe Toyopearl AF Formyl 650 M particles evaluated byDePhillips and Lenhoff26 via inverse size-exclusion chromatog-raphy using dextrans with a range of different molecularweights. Since the maximum possible immobilization densitycorresponds to a protein monolayer, all pores with R ≫ 3rs willbe accessible to the antibody (corresponding to 7.4 m2/mL).Tessier25 assumed that an effective protein monolayercorresponded to ∼30% surface coverage. Since the density ofimmobilized antibody in this work was only 13%, a significantfraction of smaller pores should also be accessible. Thisadditional pore volume was estimated as 0.13/0.30 = 0.43 ofthe pores with radii between rs and 3rs. This gives a totalaccessible area of ϕ = 10.9 m2/mL. The protein excludedvolume (BHS) was estimated as29
π=
⎛⎝⎜⎜
⎞⎠⎟⎟B
r NM
163HS
s3
Av
p2
(6)
where NAv is Avogadro’s number and Mp is the antibodymolecular weight. The protein radius was taken as rs = 5.43 nm,independent of ionic strength, based on the SEC data in Table1.The second virial coefficient decreases with increasing
solution ionic strength, which is consistent with the increasein electrostatic shielding of the intermolecular repulsiveinteractions between the positively charged antibody molecules.The values at high ionic strength become nearly constant withB2 ≈ 2.4 × 10⁻⁴ mL mol/g2. Note that the calculated value ofB2 using the dead volume determined from the acetone peak inthe “dead column” was slightly negative under these conditions,in contrast to the positive values reported in the literature.3
The solid curve in the top panel of Figure 2 is a modelcalculation developed using the potential of mean force forcharge−charge electrostatic interactions between hardspheres:30
∫π= + −−∞
⎪ ⎪
⎪ ⎪⎧⎨⎩
⎡⎣⎢⎢
⎤⎦⎥⎥⎫⎬⎭
B BW r
k Tr r2 1 exp
( )d
r
ij2 HS
2 b
2
s (7)
where kb is Boltzmann’s constant, T the absolute temperature, rthe radial distance measured from the center of the protein, andWij the potential of mean force:31
Figure 2. Retention volume (bottom panel) and second virialcoefficient (upper panel) as a function of ionic strength for themonoclonal antibody in 5 mM acetate buffer at pH 5. The solid curvein the upper panel is a model calculation for second virial coefficientsdeveloped using the potential of mean force for charge−chargeelectrostatic interactions between hard spheres.
Analytical Chemistry Article
dx.doi.org/10.1021/ac4017242 | Anal. Chem. 2013, 85, 9101−91069104
εκ
κ= ×
− −+
W rZe
rr r
r( )
( ) exp( ( 2 ))(1 )ij
s
s
2
2(8)
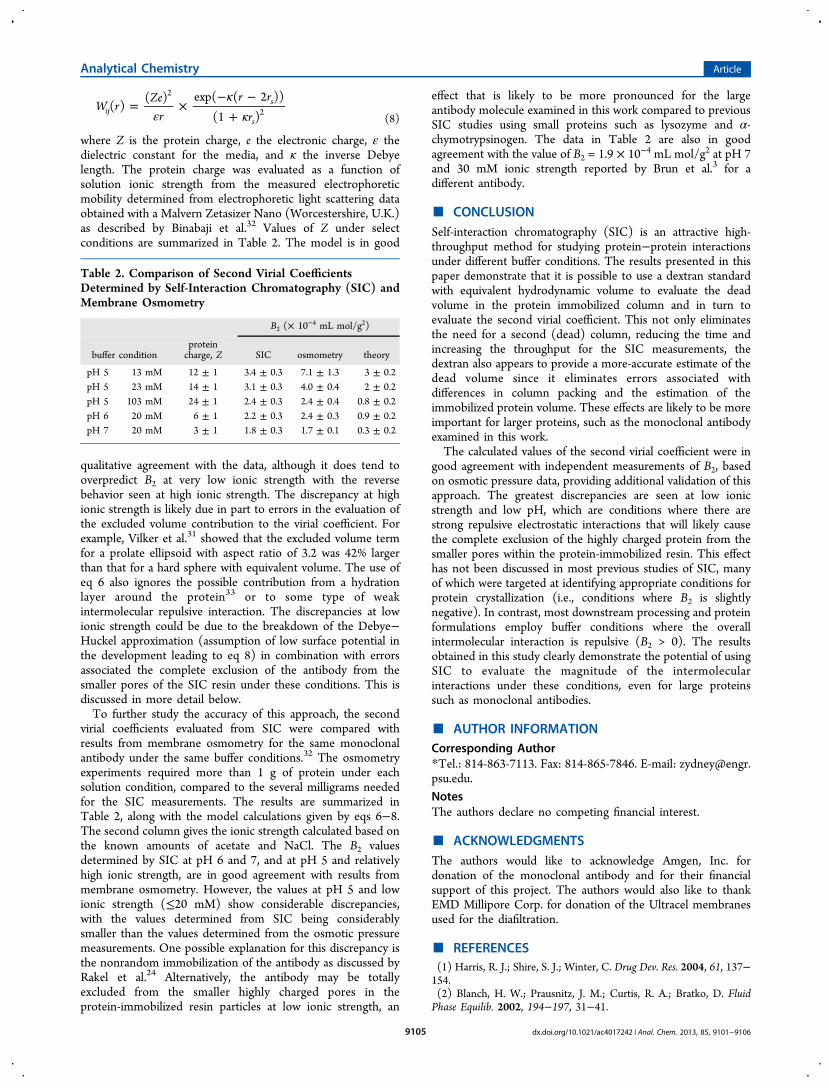
where Z is the protein charge, e the electronic charge, ε thedielectric constant for the media, and κ the inverse Debyelength. The protein charge was evaluated as a function ofsolution ionic strength from the measured electrophoreticmobility determined from electrophoretic light scattering dataobtained with a Malvern Zetasizer Nano (Worcestershire, U.K.)as described by Binabaji et al.32 Values of Z under selectconditions are summarized in Table 2. The model is in good
qualitative agreement with the data, although it does tend tooverpredict B2 at very low ionic strength with the reversebehavior seen at high ionic strength. The discrepancy at highionic strength is likely due in part to errors in the evaluation ofthe excluded volume contribution to the virial coefficient. Forexample, Vilker et al.31 showed that the excluded volume termfor a prolate ellipsoid with aspect ratio of 3.2 was 42% largerthan that for a hard sphere with equivalent volume. The use ofeq 6 also ignores the possible contribution from a hydrationlayer around the protein33 or to some type of weakintermolecular repulsive interaction. The discrepancies at lowionic strength could be due to the breakdown of the Debye−Huckel approximation (assumption of low surface potential inthe development leading to eq 8) in combination with errorsassociated the complete exclusion of the antibody from thesmaller pores of the SIC resin under these conditions. This isdiscussed in more detail below.To further study the accuracy of this approach, the second
virial coefficients evaluated from SIC were compared withresults from membrane osmometry for the same monoclonalantibody under the same buffer conditions.32 The osmometryexperiments required more than 1 g of protein under eachsolution condition, compared to the several milligrams neededfor the SIC measurements. The results are summarized inTable 2, along with the model calculations given by eqs 6−8.The second column gives the ionic strength calculated based onthe known amounts of acetate and NaCl. The B2 valuesdetermined by SIC at pH 6 and 7, and at pH 5 and relativelyhigh ionic strength, are in good agreement with results frommembrane osmometry. However, the values at pH 5 and lowionic strength (≤20 mM) show considerable discrepancies,with the values determined from SIC being considerablysmaller than the values determined from the osmotic pressuremeasurements. One possible explanation for this discrepancy isthe nonrandom immobilization of the antibody as discussed byRakel et al.24 Alternatively, the antibody may be totallyexcluded from the smaller highly charged pores in theprotein-immobilized resin particles at low ionic strength, an
effect that is likely to be more pronounced for the largeantibody molecule examined in this work compared to previousSIC studies using small proteins such as lysozyme and α-chymotrypsinogen. The data in Table 2 are also in goodagreement with the value of B2 = 1.9 × 10⁻⁴ mL mol/g2 at pH 7and 30 mM ionic strength reported by Brun et al.3 for adifferent antibody.
■ CONCLUSIONSelf-interaction chromatography (SIC) is an attractive high-throughput method for studying protein−protein interactionsunder different buffer conditions. The results presented in thispaper demonstrate that it is possible to use a dextran standardwith equivalent hydrodynamic volume to evaluate the deadvolume in the protein immobilized column and in turn toevaluate the second virial coefficient. This not only eliminatesthe need for a second (dead) column, reducing the time andincreasing the throughput for the SIC measurements, thedextran also appears to provide a more-accurate estimate of thedead volume since it eliminates errors associated withdifferences in column packing and the estimation of theimmobilized protein volume. These effects are likely to be moreimportant for larger proteins, such as the monoclonal antibodyexamined in this work.The calculated values of the second virial coefficient were in
good agreement with independent measurements of B2, basedon osmotic pressure data, providing additional validation of thisapproach. The greatest discrepancies are seen at low ionicstrength and low pH, which are conditions where there arestrong repulsive electrostatic interactions that will likely causethe complete exclusion of the highly charged protein from thesmaller pores within the protein-immobilized resin. This effecthas not been discussed in most previous studies of SIC, manyof which were targeted at identifying appropriate conditions forprotein crystallization (i.e., conditions where B2 is slightlynegative). In contrast, most downstream processing and proteinformulations employ buffer conditions where the overallintermolecular interaction is repulsive (B2 > 0). The resultsobtained in this study clearly demonstrate the potential of usingSIC to evaluate the magnitude of the intermolecularinteractions under these conditions, even for large proteinssuch as monoclonal antibodies.
■ AUTHOR INFORMATIONCorresponding Author*Tel.: 814-863-7113. Fax: 814-865-7846. E-mail: [email protected] authors declare no competing financial interest.
■ ACKNOWLEDGMENTSThe authors would like to acknowledge Amgen, Inc. fordonation of the monoclonal antibody and for their financialsupport of this project. The authors would also like to thankEMD Millipore Corp. for donation of the Ultracel membranesused for the diafiltration.
■ REFERENCES(1) Harris, R. J.; Shire, S. J.; Winter, C. Drug Dev. Res. 2004, 61, 137−154.(2) Blanch, H. W.; Prausnitz, J. M.; Curtis, R. A.; Bratko, D. FluidPhase Equilib. 2002, 194−197, 31−41.
Table 2. Comparison of Second Virial CoefficientsDetermined by Self-Interaction Chromatography (SIC) andMembrane Osmometry
B2 (× 10−4 mL mol/g2)
buffer conditionproteincharge, Z SIC osmometry theory
pH 5 13 mM 12 ± 1 3.4 ± 0.3 7.1 ± 1.3 3 ± 0.2pH 5 23 mM 14 ± 1 3.1 ± 0.3 4.0 ± 0.4 2 ± 0.2pH 5 103 mM 24 ± 1 2.4 ± 0.3 2.4 ± 0.4 0.8 ± 0.2pH 6 20 mM 6 ± 1 2.2 ± 0.3 2.4 ± 0.3 0.9 ± 0.2pH 7 20 mM 3 ± 1 1.8 ± 0.3 1.7 ± 0.1 0.3 ± 0.2
Analytical Chemistry Article
dx.doi.org/10.1021/ac4017242 | Anal. Chem. 2013, 85, 9101−91069105
(3) Le Brun, V.; Friess, W.; Bassarab, S.; Muhlau, S.; Garidel, P. Eur.J. Pharm. Biopharm. 2010, 75, 16−25.(4) Johnson, D.; Parupudi, A.; Wilson, W. W.; DeLucas, L. Pharm.Res. 2009, 26, 296−305.(5) Valente, J. J.; Payne, R. W.; Manning, M. C.; Wilson, W. W.;Henry, C. S. Curr. Pharmaceut. Biotechnol. 2005, 6, 427−436.(6) Ahamed, T.; Ottens, M.; van Dedem, G. W. K.; van der Wielen,L. A. M. J. Chromatogr. A 2005, 1089, 111−124.(7) Lewus, R. A.; Darcy, P. A.; Lenhoff, A. M.; Sandler, S. I.Biotechnol. Prog. 2011, 27, 280−289.(8) Tessier, P. M.; Lenhoff, A. M. Curr. Opin. Biotechnol. 2003, 14,512−516.(9) Tessier, P. M.; Vandrey, S. D.; Berger, B. W.; Pazhianur, R.;Sandler, S. I.; Lenhoff, A. M. Acta Crystallogr., Sect. D: Biol. Crystallogr.2002, 58, 1531−1535.(10) George, A.; Wilson, W. W. Acta Crystallogr., Sect. D: Biol.Crystallogr. 1994, 50, 361−365.(11) Palecek, S. P.; Zydney, A. L. Biotechnol. Prog. 1994, 10, 207−213.(12) Patro, S. Y.; Przybycien, T. M. Biotechnol. Bioeng. 1996, 52,193−203.(13) Tessier, P. M.; Lenhoff, A. M.; Sandler, S. I. Biophys. J. 2002, 82,1620−1631.(14) Deshpande, K. S.; Ahamed, T.; ter Horst, J. H.; Jansens, P. J.;van der Wielen, L. A. M.; Ottens, M. Biotechnol. J. 2009, 4, 1266−1277.(15) Teske, C. A.; Blanch, H. W.; Prausnitz, J. M. J. Phys. Chem. B2004, 108, 7437−7444.(16) Ahamed, T.; Esteban, B. N. A.; Ottens, M.; van Dedem, G. W.K.; van der Wielen, L. A. M.; Bisschops, M. A. T.; Lee, A.; Pham, C.;Thommes, J. Biophys. J. 2007, 93, 610−619.(17) Muschol, M.; Rosenberger, F. J. Chem. Phys. 1995, 103, 10424−10432.(18) Bonnete, F.; Finet, S.; Tardieu, A. J. Cryst. Growth 1999, 196,403−414.(19) Ducruix, A.; Guilloteau, J. P.; Ries-Kautt, M.; Tardieu, A. J. Cryst.Growth 1996, 168, 28−39.(20) Porschel, H. V.; Damaschun, G. Stud. Biophys. 1977, 62, 69−.(21) Curtis, R. A.; Ulrich, J.; Montaser, A.; Prausnitz, J. M.; Blanch,H. W. Biotechnol. Bioeng. 2002, 79, 367−380.(22) Curtis, R. A.; Prausnitz, J. M.; Blanch, H. W. Biotechnol. Bioeng.1998, 57, 11−21.(23) Bloustine, J.; Berejnov, V.; Fraden, S. Biophys. J. 2003, 85,2619−2623.(24) Rakel, N.; Schleining, K.; Dismer, F.; Hubbuch, J. J. Chromatogr.A 2013, 1293, 75−84.(25) Tessier, P. M. Fundamentals and applications of nanoparticleinteractions and self-assembly; Doctoral Thesis, University of Delaware,Newark, DE, 2003.(26) DePhillips, P.; Lenhoff, A. M. J. Chromatogr. A 2000, 883, 39−54.(27) Laurent, T. C. Biochem. J. 1963, 89, 253−257.(28) Oliver, J. D.; Anderson, S.; Troy, J. L.; Brenner, B. M.; Deen, W.H. J. Am. Soc. Nephrol. 1992, 3, 214−28.(29) Mortimer, R. G. Physical Chemistry, 3rd ed.; Elsevier AcademicPress: Amsterdam, 2008.(30) McMillan, W. G.; Mayer, J. E. J. Chem. Phys. 1945, 13, 276−305.(31) Vilker, V. L.; Colton, C. K.; Smith, K. A. J. Colloid Interface Sci.1981, 79, 548−566.(32) Binabaji E.; Rao, S.; Zydney, A. L. Biotechnol. Bioeng., in press(DOI: 10.1002/bit.25104).(33) Rupley, J. A.; Careri, G. In Advances in Protein Chemistry;Anfinsen, C. B., Richards, F. M., Edsall, J. T., Eisenberg, D. S., Eds.;Academic Press: San Diego, CA, 1991; Vol. 41, pp 37−172.
Analytical Chemistry Article
dx.doi.org/10.1021/ac4017242 | Anal. Chem. 2013, 85, 9101−91069106