improved market representation of agent …hrudnick.sitios.ing.uc.cl/paperspdf/marambio.pdf ·...
TRANSCRIPT

PONTIFICIA UNIVERSIDAD CATOLICA DE CHILE
SCHOOL OF ENGINEERING
IMPROVED MARKET REPRESENTATION
OF AGENT PREFERENCES IN A
RENEWABLE ENVIRONMENT
RODRIGO MARAMBIO GRANIC
Thesis submitted to the Office of Graduate Studies in
partial fulfillment of the requirements for the degree of
Doctor in Engineering Sciences
Advisor:
HUGH RUDNICK
Santiago de Chile, August 2017
c� MMXVII, RODRIGO MARAMBIO GRANIC

PONTIFICIA UNIVERSIDAD CATOLICA DE CHILE
SCHOOL OF ENGINEERING
IMPROVED MARKET REPRESENTATION
OF AGENT PREFERENCES IN A
RENEWABLE ENVIRONMENT
RODRIGO MARAMBIO GRANIC
Members of the Committee:
HUGH RUDNICK
LUIS CONTESSE
RODRIGO PALMA
DAVID WATTS
ROSS BALDICK
CRISTIAN VIAL
Thesis submitted to the Office of Graduate Studies in
partial fulfillment of the requirements for the degree of
Doctor in Engineering Sciences
Santiago de Chile, August 2017

To Marıa Jose, Gabriel and Amaya,
for their love and support
throughout this journey...

ACKNOWLEDGEMENTS
This research is the fruit of people who contributed with their support, knowledge and
presence on this whole process.
First of all, I want to thank my advisor, Professor Hugh Rudnick, who placed his trust in
this project and whose disposition allowed us to achieve the proposed objectives. It has
been an honor to count with his knowledge and advice throughout these years.
I am also grateful to Professor Ross Baldick and his group, for kindly hosting me at the
University of Texas at Austin during the research internship. His work and advice had a
huge impact on the development of this research.
I also thank Carlos Barrıa for his friendship, support and valuable talks during this time,
which were an essential part of this process.
To the funding program of the Pontificia Universidad Catolica de Chile (DIPEI, VRI), the
CONICYT doctoral scholarship program, the BECAS CHILE internship program and the
FONDECYT 1141082.
Thanks to the DIPEI staff, for their support and advice on doctoral issues, especially Fer-
nanda Kattan, Nicole Yurgens, Debbie Meza and Maria Troncoso.
Finally, I thank my family for accompanying me on this journey, especially to Gabriel, for
his unconditional love even in adversity.
iv

TABLE OF CONTENTS
ACKNOWLEDGEMENTS . . . . . . . . . . . . . . . . . . . . . . . . . . . . . iv
LIST OF FIGURES . . . . . . . . . . . . . . . . . . . . . . . . . . . . . . . . . ix
LIST OF TABLES . . . . . . . . . . . . . . . . . . . . . . . . . . . . . . . . . . xi
ABSTRACT . . . . . . . . . . . . . . . . . . . . . . . . . . . . . . . . . . . . . xii
RESUMEN . . . . . . . . . . . . . . . . . . . . . . . . . . . . . . . . . . . . . xiv
1. INTRODUCTION . . . . . . . . . . . . . . . . . . . . . . . . . . . . . . . 1
1.1. Generation sector . . . . . . . . . . . . . . . . . . . . . . . . . . . . . . 1
1.1.1. Energy . . . . . . . . . . . . . . . . . . . . . . . . . . . . . . . . . 3
1.1.2. Capacity . . . . . . . . . . . . . . . . . . . . . . . . . . . . . . . . 4
1.1.3. Security . . . . . . . . . . . . . . . . . . . . . . . . . . . . . . . . 4
1.2. Renewable energy . . . . . . . . . . . . . . . . . . . . . . . . . . . . . 5
1.2.1. Operational challenges . . . . . . . . . . . . . . . . . . . . . . . . . 6
1.2.2. Regulatory challenges . . . . . . . . . . . . . . . . . . . . . . . . . 7
1.3. Chilean context . . . . . . . . . . . . . . . . . . . . . . . . . . . . . . . 8
1.3.1. Energy: Long term energy auctions . . . . . . . . . . . . . . . . . . 9
1.3.2. Capacity: Capacity remuneration . . . . . . . . . . . . . . . . . . . 10
1.3.3. Security: Liquefied natural gas imports . . . . . . . . . . . . . . . . 12
1.4. Objectives of the work . . . . . . . . . . . . . . . . . . . . . . . . . . . 13
1.5. Hypothesis . . . . . . . . . . . . . . . . . . . . . . . . . . . . . . . . . 13
1.6. Methodology . . . . . . . . . . . . . . . . . . . . . . . . . . . . . . . . 14
1.6.1. Energy: . . . . . . . . . . . . . . . . . . . . . . . . . . . . . . . . . 14
1.6.2. Capacity: . . . . . . . . . . . . . . . . . . . . . . . . . . . . . . . . 15
1.6.3. Security: . . . . . . . . . . . . . . . . . . . . . . . . . . . . . . . . 15
1.7. Work overview . . . . . . . . . . . . . . . . . . . . . . . . . . . . . . . 16
v

2. A NOVEL INCLUSION OF INTERMITTENT GENERATION RESOURCES IN
LONG TERM ENERGY AUCTIONS . . . . . . . . . . . . . . . . . . . . . . 19
2.1. Background . . . . . . . . . . . . . . . . . . . . . . . . . . . . . . . . . 19
2.1.1. Auctions . . . . . . . . . . . . . . . . . . . . . . . . . . . . . . . . 19
2.1.2. Renewable technologies in auctions . . . . . . . . . . . . . . . . . . 19
2.1.3. Short term issue of hourly power obligation . . . . . . . . . . . . . . 20
2.1.4. Chile case . . . . . . . . . . . . . . . . . . . . . . . . . . . . . . . 23
2.2. Mechanism design . . . . . . . . . . . . . . . . . . . . . . . . . . . . . 25
2.2.1. Bidders offered energy . . . . . . . . . . . . . . . . . . . . . . . . . 26
2.2.2. Bidders generation profile . . . . . . . . . . . . . . . . . . . . . . . 26
2.2.3. Bidders price indifference curve . . . . . . . . . . . . . . . . . . . . 27
2.2.4. Awarding . . . . . . . . . . . . . . . . . . . . . . . . . . . . . . . . 28
2.3. Modeling . . . . . . . . . . . . . . . . . . . . . . . . . . . . . . . . . . 29
2.3.1. System modeling . . . . . . . . . . . . . . . . . . . . . . . . . . . . 30
2.3.2. Generators modeling . . . . . . . . . . . . . . . . . . . . . . . . . . 32
2.4. Results of the chapter . . . . . . . . . . . . . . . . . . . . . . . . . . . . 38
2.4.1. Case 1: The three companies are required to supply the auctioned energy 38
2.4.2. Case 2: Two companies can supply all the auctioned energy . . . . . . 40
2.4.3. Case 3: Two companies can supply the auctioned energy and the solar
technology has preference in the backed energy awarding . . . . . 44
2.5. Discussion . . . . . . . . . . . . . . . . . . . . . . . . . . . . . . . . . 48
2.5.1. Arbitrary technology support . . . . . . . . . . . . . . . . . . . . . . 48
2.5.2. Strategic behavior of the generators . . . . . . . . . . . . . . . . . . 49
2.6. Conclusions of the chapter . . . . . . . . . . . . . . . . . . . . . . . . . 50
3. NEW CAPACITY MECHANISM DESIGN TO INCLUDE RENEWABLE TECH-
NOLOGIES . . . . . . . . . . . . . . . . . . . . . . . . . . . . . . . . . . . 53
3.1. Background . . . . . . . . . . . . . . . . . . . . . . . . . . . . . . . . . 53
3.1.1. Adequacy . . . . . . . . . . . . . . . . . . . . . . . . . . . . . . . 53
3.1.2. Renewables in adequacy . . . . . . . . . . . . . . . . . . . . . . . . 54
vi

3.2. Mechanism design . . . . . . . . . . . . . . . . . . . . . . . . . . . . . 55
3.3. Modeling . . . . . . . . . . . . . . . . . . . . . . . . . . . . . . . . . . 56
3.3.1. System modeling . . . . . . . . . . . . . . . . . . . . . . . . . . . . 56
3.3.2. Demand modeling . . . . . . . . . . . . . . . . . . . . . . . . . . . 61
3.3.3. Generators modeling . . . . . . . . . . . . . . . . . . . . . . . . . . 65
3.4. Results of the chapter . . . . . . . . . . . . . . . . . . . . . . . . . . . . 67
3.4.1. Capacity valuation comparison . . . . . . . . . . . . . . . . . . . . . 67
3.4.2. VOLL sensitivity . . . . . . . . . . . . . . . . . . . . . . . . . . . . 70
3.4.3. Renewable technology mix sensitivity . . . . . . . . . . . . . . . . . 71
3.4.4. Renewable technology level sensitivity . . . . . . . . . . . . . . . . . 72
3.5. Conclusions of the chapter . . . . . . . . . . . . . . . . . . . . . . . . . 73
4. MARKET MECHANISM TO DETERMINE LNG IMPORT VOLUME . . . . 75
4.1. Background . . . . . . . . . . . . . . . . . . . . . . . . . . . . . . . . . 75
4.1.1. Liquefied Natural Gas (LNG) . . . . . . . . . . . . . . . . . . . . . 76
4.1.2. Natural Gas and LNG in the Electric Sector . . . . . . . . . . . . . . 77
4.1.3. South America Overview . . . . . . . . . . . . . . . . . . . . . . . . 78
4.1.4. Take-or-pay Contracts . . . . . . . . . . . . . . . . . . . . . . . . . 78
4.1.5. Take-or-pay contracts effect for the LNG importers in the electric system 79
4.1.6. LNG Importers as insurers . . . . . . . . . . . . . . . . . . . . . . . 81
4.1.7. Generators with supply contracts as insureds . . . . . . . . . . . . . . 82
4.2. Mechanism design . . . . . . . . . . . . . . . . . . . . . . . . . . . . . 82
4.2.1. System optimal amount to import . . . . . . . . . . . . . . . . . . . 83
4.2.2. LNG insurance market . . . . . . . . . . . . . . . . . . . . . . . . . 84
4.2.3. Bids structure . . . . . . . . . . . . . . . . . . . . . . . . . . . . . 85
4.2.4. Awarding of the auction . . . . . . . . . . . . . . . . . . . . . . . . 85
4.3. Modeling . . . . . . . . . . . . . . . . . . . . . . . . . . . . . . . . . . 86
4.3.1. System modeling . . . . . . . . . . . . . . . . . . . . . . . . . . . . 87
4.3.2. LNG Importers modeling . . . . . . . . . . . . . . . . . . . . . . . 88
4.3.3. Generators modeling . . . . . . . . . . . . . . . . . . . . . . . . . . 90
vii

4.4. Results of the chapter . . . . . . . . . . . . . . . . . . . . . . . . . . . . 92
4.4.1. System total amount to import . . . . . . . . . . . . . . . . . . . . . 92
4.4.2. Special case as renewables support . . . . . . . . . . . . . . . . . . . 94
4.5. Discussion . . . . . . . . . . . . . . . . . . . . . . . . . . . . . . . . . 96
4.6. Conclusions of the chapter . . . . . . . . . . . . . . . . . . . . . . . . . 100
5. CONCLUSIONS . . . . . . . . . . . . . . . . . . . . . . . . . . . . . . . . 102
REFERENCES . . . . . . . . . . . . . . . . . . . . . . . . . . . . . . . . . . . 104
viii

LIST OF FIGURES
2.1 Extreme assignment schemes . . . . . . . . . . . . . . . . . . . . . . . . . 23
2.2 Sample generation profile . . . . . . . . . . . . . . . . . . . . . . . . . . . 27
2.3 Installed capacity by type . . . . . . . . . . . . . . . . . . . . . . . . . . . 32
2.4 System average spot price for each hour and NCRE scenario . . . . . . . . . 33
2.5 SIC daily average load profile . . . . . . . . . . . . . . . . . . . . . . . . . 34
2.6 Generation profile by technology . . . . . . . . . . . . . . . . . . . . . . . 35
2.7 Case 1 hourly assignment (actual methodology) . . . . . . . . . . . . . . . . 39
2.8 Case 1 hourly assignment (coal/solar/wind) = (low/high/medium) risk aversions 40
2.9 Case 1 hourly assignment (coal/solar/wind) = (high/low/medium) risk aversions 41
2.10 Annual savings for the LSE (compared to actual mechanism), Case 1 . . . . . 42
2.11 Annual savings for the LSE (compared to actual mechanism), Case 2 . . . . . 43
2.12 Hourly assignment probability, Cases 2 and 3 . . . . . . . . . . . . . . . . . 45
2.13 Annual over cost of the solar supporting scheme for the LSE (Actual mechanism) 46
2.14 Annual over cost of the solar supporting scheme for the LSE (Proposed mecha-
nism). . . . . . . . . . . . . . . . . . . . . . . . . . . . . . . . . . . . . . 47
3.1 Methodology block diagram . . . . . . . . . . . . . . . . . . . . . . . . . . 56
3.2 Net load histogram and distribution function . . . . . . . . . . . . . . . . . 58
3.3 Load, solar and wind daily profiles . . . . . . . . . . . . . . . . . . . . . . 59
3.4 Fitted distributions for hour 10 . . . . . . . . . . . . . . . . . . . . . . . . . 60
3.5 Hourly average price . . . . . . . . . . . . . . . . . . . . . . . . . . . . . . 66
3.6 Capacity price curve for every hour of the day . . . . . . . . . . . . . . . . . 67
3.7 Existing curve design . . . . . . . . . . . . . . . . . . . . . . . . . . . . . 68
3.8 Economic surplus of traditional curve minus proposed . . . . . . . . . . . . 69
ix

3.9 Consumer surplus of traditional curve minus proposed . . . . . . . . . . . . 70
3.10 Revenue for 1 MW under three VOLL scenarios . . . . . . . . . . . . . . . 71
3.11 Revenue for 1 MW under two renewable mix scenarios . . . . . . . . . . . . 72
3.12 Revenue for 1 MW under two renewable level scenarios . . . . . . . . . . . 73
4.1 Natural gas production by region . . . . . . . . . . . . . . . . . . . . . . . 75
4.2 LNG plants operational margin . . . . . . . . . . . . . . . . . . . . . . . . 80
4.3 Solar daily generation and supply contract profiles . . . . . . . . . . . . . . 83
4.4 System load duration curve . . . . . . . . . . . . . . . . . . . . . . . . . . 89
4.5 Generators risk aversion histogram . . . . . . . . . . . . . . . . . . . . . . 91
4.6 Price curves of the coal generators . . . . . . . . . . . . . . . . . . . . . . . 92
4.7 Quantity curves of the coal generators . . . . . . . . . . . . . . . . . . . . . 93
4.8 Total surplus as a function of imported LNG volume (medium risk aversion case) 94
4.9 Average total surplus as a function of imported LNG volume . . . . . . . . . 95
4.10 Centralized imported volume decision over cost . . . . . . . . . . . . . . . . 96
4.11 Offer prices in the NCRE market . . . . . . . . . . . . . . . . . . . . . . . 96
4.12 Total surplus in the NCRE market . . . . . . . . . . . . . . . . . . . . . . . 97
x

LIST OF TABLES
2.2 Backed price calculation factors . . . . . . . . . . . . . . . . . . . . . . . . 35
2.3 Backed Price by risk aversion (US$/MWh) . . . . . . . . . . . . . . . . . . 36
2.4 Marketed Price by risk aversion (US$/MWh) . . . . . . . . . . . . . . . . . 37
2.5 Awarded combinations out of the total number of risk scenarios . . . . . . . . 42
2.6 Marketed price by risk aversion (US$/MWh), Case 3 . . . . . . . . . . . . . 45
3.1 Installed capacity by non dispatchable element . . . . . . . . . . . . . . . . 59
4.1 Installed capacity by technology . . . . . . . . . . . . . . . . . . . . . . . . 88
xi

ABSTRACT
The context given by the growing inclusion of variable renewable energies in power
systems worldwide, presents both operational and regulatory challenges. The large-scale
entry of these technologies changes the dynamics of the market, so existing market mecha-
nisms and regulatory schemes lose effectiveness in this new paradigm. In this sense, some
dimensions of the involved agents are not being fully represented by existing mechanisms,
whose effect is accentuated as the inclusion of these technologies advances.
This raises the need to design and evaluate new market mechanisms that allow ad-
vancing towards an ideal market under these new conditions imposed by this renewable
environment.
The objective of the research is to design mechanisms for the generation sector, that
allow to improve conditions in the areas of energy, capacity and security, through a better
representation of agents’ preferences participating in this new renewable scenario. In the
area of energy, a long-term energy auction design is proposed, which considers a represen-
tation of the short-term profile of the participants at the time of allocation of the auction. In
the area of capacity, a capacity market is proposed, where the construction of the demand
curve considers both the statistics of renewable power plants and the demand preferences.
In the area of security, a mechanism is proposed to determine the optimum systemic vol-
ume of Liquefied Natural Gas to be imported on the basis of a risk hedging market, in order
to have the necessary volume of such fuel.
The document presents an analysis of the problem that each mechanism tries to solve,
the design of each one of them and the development of case studies to evaluate their effec-
tiveness.
The contribution of the doctoral research is to: i) identify areas of the Chilean electric-
ity market where an insufficient representation of the agents’ preferences is being carried
out and the problems that are present due to that insufficiency, ii) the design of three market
xii

mechanisms that improve the preferences’ representation of the involved agents, in relation
to what actually exists in the Chilean market, iii) the characterization of the considered
agents through a modeling of their preferences, iv) an evaluation of the effectiveness of
the proposed mechanisms. The developed mechanisms bring elements to the regulator that
could serve as a starting point for the design of new mechanisms in a renewable environ-
ment.
It is concluded that through market mechanisms that improve the representation of
agents’ preferences in this new context, given by the inclusion of variable technologies,
it is possible to reduce risk and improve the allocation of resources. In all the proposed
mechanisms, a benefit is obtained in comparison with existing mechanisms in the Chilean
electricity market.
xiii

RESUMEN
El contexto dado por la creciente inclusion de energıas renovables intermitentes e
inciertas en los sistemas electricos del mundo, presenta tanto desafıos operacionales como
regulatorios. La entrada a gran escala de estas tecnologıas cambia la dinamica del mercado,
por lo que los mecanismos de mercado y esquemas regulatorios existentes pierden eficacia
en este nuevo paradigma. En este sentido, algunas dimensiones de los agentes involucra-
dos no estn siendo plenamente representadas por mecanismos existentes, cuyo efecto se
acentua a medida que avanza la inclusion de estas tecnologıas.
Esto plantea la necesidad de disenar y evaluar nuevos mecanismos de mercado, que
permitan avanzar hacia un mercado ideal bajo estas nuevas condiciones impuestas por este
entorno renovable.
El objetivo de la investigacion es disenar mecanismos para el sector generacion, que
permitan mejorar condiciones en las areas de energıa, capacidad y seguridad, a traves de
una mejor representacion de las preferencias de los agentes que participan en este nuevo
escenario renovable. En el area de energıa, se propone un diseno de subasta de energıa de
largo plazo, el cual considera una representacion del perfil de corto plazo de los partici-
pantes a la hora de adjudicar la subasta. En el area de capacidad, se propone un mercado de
capacidad, donde la construccion de la curva de demanda considera tanto las estadısticas
de las centrales renovables como las preferencias de la demanda. En el ambito de la se-
guridad, se propone un mecanismo para determinar el volumen sistemico optimo de Gas
Natural Licuado a importar sobre la base de un mercado de cobertura de riesgo, con el fin
de disponer del volumen necesario de dicho combustible.
El documento presenta un analisis del problema que cada mecanismo intenta resolver,
el diseno de cada uno de ellos y el desarrollo de casos de estudio para evaluar su efectividad.
La contribucion de la investigacion doctoral es: i) identificar areas del mercado electrico
Chileno donde se esta realizando una representacion insuficiente de las preferencias de los
xiv

agentes y los problemas que se presentan debido a dicha insuficiencia, ii) el diseno de tres
mecanismos de mercado que mejoren la representacion de las preferencias de los agentes
involucrados, en relacion con lo que actualmente existe en el mercado Chileno, iii) la car-
acterizacion de los agentes considerados a traves de una modelacion de sus preferencias,
iv) una evaluacion de la efectividad de los mecanismos propuestos. Los mecanismos de-
sarrollados aportan elementos al regulador que podrıan servir como punto de partida para
el diseno de nuevos mecanismos en un entorno renovable.
Se concluye que a traves de mecanismos de mercado que mejoran la representacion
de las preferencias de los agentes en este nuevo contexto, dado por la inclusion de tec-
nologıas intermitentes e inciertas, es posible reducir el riesgo y mejorar la asignacion de
recursos. En todos los mecanismos propuestos, se obtiene un beneficio en comparacion
con los mecanismos existentes en el mercado electrico Chileno.
xv

11. INTRODUCTION
The energy sector, and in particular the electricity sector, is an essential pillar for the
socio-economic development of the countries, so progress towards a more efficient and
harmonious sector has been a priority at the global level. The advance to a deregulation
of the electricity sector, which began in the 1980s, aims precisely at increasing efficiency
through the implementation of market schemes in the segments of the system that would
benefit from it. On the other hand, a perfect market is still an ideal, even more so if the
system on which the market is built is a complex system such as the electric one, which
obeys different restrictions such as those given by the technical characteristics of the power
plants and physical laws for the transmission of electricity through power lines, among
others. However, this does not imply that we cannot move forward in the direction of this
ideal, which has been carried out through the continuous implementation of new market
mechanisms and regulatory measures that provide both new levels of efficiency and mit-
igation of negative externalities. In this sense, a characteristic of a perfect market is free
access on equal terms, which results in a perfect representation of the agents involved. This
often cannot be achieved by information asymmetries and technological limitations, but to
generate progress in this regard is an actual concern that is currently present in different
power systems. This work intends to propose market mechanisms that present an improve-
ment in that direction, that is to say, they better represent some dimension of the agents
that are not currently being fully considered, and thus obtain a better representation of their
preferences. The development is particularly focused on developing countries, where such
mechanisms are vital to reduce the perceived risk of agents.
1.1. Generation sector
The generation sector comprises companies that have a portfolio of power plants with
which to produce and commercialize electricity. It is part of the wholesale electricity mar-
ket, where electricity purchase and sale transactions take place among these generation

2
companies, large consumers and resellers such as distribution companies and traders. In
this way, companies belonging to this sector interact on two levels.
At a commercial level they interact in a competitive market structure in a framework
defined by the regulatory entity which designs and implements incentive mechanisms and
norms that are in line with the country’s energy policy. In general, this structure is com-
posed of a short-term market (“spot” market), where each generation company offers both
the quantity and the price at which it is willing to sell the electricity commodity produced
by its plant, so that a system market operator (MO), giving priority to the lowest offers,
determines the transactions and clearing prices following a marginal pricing scheme.
On the other hand, there is a physical level that is strongly linked to the commercial
level. One particularity of the electric market is the difficulty of storing electrical energy at a
large scale, so it has to be produced the instant it is consumed. This implies that the system’s
power plants operations must be coordinated by an Independent System Operator (ISO). At
each moment, the ISO will make the operational decisions that present the greatest benefit
to the system, for which it considers both the transactions determined by the MO and the
technical and security constraints of the system. In several systems such as the ones in the
United States and Chile, the ISO fulfils both the ISO and MO functions, so in the rest of
the work we are assuming that this is the case.
Finally, the commercial level considers other instruments such as bilateral long-term
contracts, forwards contracts and remuneration for additional services, among others, either
informally or through formal mechanisms. In this sense, it is worth noting that in some
power systems there are also physical bilateral contracts, where the physical dispatch is a
consequence of the agreement between the parties.
Another peculiarity of the generation sector in a competitive market, is that its evolu-
tion over time does not respond to a centralized planning process carried out by the reg-
ulator, but depends exclusively on the investment decisions of the participants, which are
based on their expectations of the future.

3
In theory, the result of this interaction in a perfect market where the cost of failure is
correctly valued would be equivalent to that obtained through centralized planning (Stoft,
2002). However the market is not perfect and each generation company has its own expec-
tations and risk aversion, therefore the regulator has an important role through the imple-
mentation of mechanisms and norms that deliver the appropriate signals for an harmonic
and safe development, consistent with the guidelines of the country’s energy policy, such
as what technologies are required and where to locate them.
On the other hand, investing in a power plant is a long-term decision, where the re-
quired investment cost is usually significant. This, along with the fact that most agents
are risk averse (Porrua et al., 2005), implies that the perceived risk must be limited when
it comes to obtain financing. In this sense, besides clear rules in the market, mechanisms
and regulations must exist in order to allow the generation companies to mitigate to some
degree their perceived risk, allowing in this way a safe, reliable and low cost supply.
There are 3 areas in the market that allow generation companies to earn income, being
them energy, capacity and security (ancillary services).
1.1.1. Energy
Energy is the main product transacted in the electricity market and corresponds to
power delivered in a time interval, which is valued in the spot market. The price of transac-
tion and the way it is calculated will depend on the specific implementation of the market,
for example a market with nodal prices such as the PJM (Tong, 2004) or a single mar-
ket price such as the Spanish case (Ciarreta & Espinosa, 2012). Independent if the price
is nodal or system wide, it will be given by the intersection between supply and demand
curves (in the case of nodal prices, the differences among them will account for losses in
the transmission system and congestion costs), being the demand curve elastic or inelastic
according to the particular power system. This product constitutes the main income re-
ceived by so called “baseload” power plants, which correspond to plants with a high cost
of investment and a low variable cost of operation such as nuclear and renewables, and
others with high capacity factor such as the coal plants

4
Finally, additional elements to the spot market such as long-term contracts allow gen-
eration companies to stabilize their revenues by selling energy over time, thus reducing the
faced risk.
1.1.2. Capacity
The capacity product refers to a specified amount of capacity available in a specific
zone when called on within the obligation time span (Zhao & Litvinov, 2010). In theory,
with a correct valuation of the value of lost load (VOLL), the price of energy would be
sufficient to remunerate this product (Stoft, 2002) and there are even markets known as
“energy only” that do not explicitly remunerate it, such as ERCOT (Hogan et al., 2012)
and the NEM in Australia (Nelson et al., 2015). However, in other markets explicit mecha-
nisms for capacity remuneration are considered, such as capacity markets as in PJM (PJM,
2016) and NYISO (NYISO, 2016) or capacity payments as in Spain, Portugal and Ireland
(Linklaters, 2014). The plants whose income is most dependent of this concept are the so-
called “peaker” power plants, corresponding to those with a low investment cost and a high
variable cost of operation. In general, because they are the plants with the highest operating
cost of the system, they only receive profits from the sale of energy when the spot price is
higher than such cost, that is, the VOLL. An erroneous estimation of the VOLL results in
the “missing money”1 problem (Joskow, 2013), which leads to the implementation of the
aforementioned capacity remuneration mechanisms.
1.1.3. Security
To this area belong the elements grouped under the name “ancillary services”, con-
sidering products such as frequency control and operating reserves that allow the system
to have a certain level of security and flexibility to respond to failures and variations in
demand. Although there are specific markets for the transaction of some of these services
such as operating reserves, there are others such as voltage support that still maintains side
payments schemes (Chen, 2016). Different levels of sophistication can be observed in the
1Money that is needed in order to keep the optimal generation mix, but is missing due to a low set VOLL.

5
implementation of these markets, for example in some US power systems such as PJM and
NYISO, services are assigned almost at the time of operation in the real time market, while
in others such as MISO and CAISO, it takes place the day before in the day ahead market
(Zhou et al., 2016). The main plants that receive revenues for this concept are those whose
technical characteristics allow a quick operational response on their part (for example in
startup time and ramp rate) such as natural gas turbines, diesel engines or storage units
such as reservoir plants.
The entry of variable renewable energies at a large scale is significantly changing the
dynamics of the electricity market, both at its physical and commercial levels. There are
regulatory challenges at both levels in the concepts of energy, capacity and flexibility, where
new mechanisms and adjustments to existing ones need to be implemented, in order to
obtain the greatest benefit for the system under this new paradigm.
1.2. Renewable energy
Large-scale entry of renewable energies is going on in the power systems around the
world, and everything indicates that the growing trend will continue. At the global level,
the International Energy Agency (IEA) projects in its main scenario that 60% of the new
generation capacity will come from renewable sources by 2040 (IEA, 2016).
To a large extent, its development has been the result of policies implemented by pi-
oneer countries such as Germany, Spain, USA and Denmark, which, recognizing the im-
portance of energy in national and economic security, have created markets for this type of
technology in order to decrease their dependence on fossil fuels. In addition, the impact of
these fuels in relation to climate change and other negative externalities, have resulted in
agreements at a global level to reduce their use, further boosting energy projects based on
renewable sources (REN21, 2014).

6
In its beginnings, these technologies were not profitable under a market scheme due
to their high investment costs; however, currently the levelized cost of energy2 of some of
these technologies is competitive with conventional baseload plants, due to the significant
decrease in their investment costs. The main mechanisms used to promote this type of
technology correspond to feed in tariffs (FIT) and renewable portfolio standards (RPS).
In the case of FITs, they correspond to award long-term fixed tariffs, to be paid for the
generated energy by certain renewable sources, in order to ensure that they can cover their
investment costs. On the other hand, the RPS corresponds to require that part of the energy
supplied by the electricity companies come from renewable sources. This gives rise to a
renewable energy market, where different renewable power plants compete to offer their
energy for that purpose. The result of the use of these instruments will depend heavily
on the specific implementation carried out by the regulator, because decisions on price (in
the case of FIT) or quantity (in both cases) will determine the level of penetration of these
technologies.
These technologies drastically change the dynamics of the electricity market due to its
intermittent and uncertain characteristics, presenting operational and regulatory challenges.
1.2.1. Operational challenges
At the operational level, the inherent variability of these technologies makes it diffi-
cult to coordinate with the rest of the generating park, due to technical constraints such as
technical operating minima, startup time and ramp rate, among others. If on the one hand,
all generators could startup and change their generated power as quickly as renewable re-
sources can vary, and on the other hand operators could reliably predict those resources,
then accommodating any amount of renewable energy would not be a problem. In this
sense, the operational inflexibility of conventional baseload plants is a major obstacle for
the coordination with renewable power plants. In order to obtain the actual levels of stabil-
ity and security in a mostly renewable system, additional generation to renewable resources
2The levelized cost of energy of a power plant corresponds to its expected lifetime costs (including construc-tion, financing, fuel, maintenance, taxes, insurance and incentives), divided by its expected lifetime producedenergy.

7
should come from more flexible plants such as gas turbines or reservoir hydro plants in or-
der to cover the peak load hours, and demand would have to be handled more efficiently
and intelligently.
On the other hand the storage technologies are the perfect complement to maintain
those standards considering this type of variability. Like renewable technologies, there
is huge diversity in the characteristics of such technologies, such as size and speed of
response. To this category belong the water reservoirs power plants, with a strong presence
in hydrothermal systems of both Nordic and Latin American countries, which depend on
“non electrical” elements for filling up, such as the running waters of their affluent rivers.
Moreover, great relevance are acquiring new storage technologies that require electricity
for their filling, such as flywheels and batteries, which additionally present great potential
within the concept of “smart grids”.
1.2.2. Regulatory challenges
The inclusion of these technologies also presents challenges at the regulatory level.
The most obvious case comes from the price of energy or spot price, since one of the main
characteristics of this type of technologies is to present a practically null variable cost.
Because of this, the spot price tends to fall when renewable power plants are generating
energy, especially when there is a high level of renewable penetration, a situation known
as the merit order effect (Sensfuss et al., 2008). This characteristic drastically modifies
the price signals when they enter massively in the electrical systems, mainly affecting the
baseload thermal power plants such as the coal-fired power plants that cannot enter or leave
the system with the speed that this new scenario requires. In this way, these last plants begin
to stop being profitable in systems with these characteristics.
In theory this low profitability is a signal in the right direction for a system with a
considerable proportion of renewable energies, since it translates into an incentive to the
investment in plants that complement the operational characteristics of the renewable ones.
Nevertheless, it must be considered that an existing generator park with sunk costs already

8
exists, so a radical transition to a mostly renewable system is a major challenge from the
operational and market point of view.
Storage units also play an important role in this new scenario, since buying energy
when the spot price is low (when the renewables are generating) and selling it when it is
high, result in a more stable price through the day, allowing a less risky system in terms of
prices.
In the same direction of the energy concept, it is necessary to rethink other mechanisms
such as long-term contracts and auctions, since these technologies face a greater risk when
entering into an energy contract. This is due to the fact that they don’t have their own
energy production when prices are higher. In terms of capacity, it is necessary to define the
extent to which these technologies contribute to this concept, and consider an according
remuneration. Finally, the appropriate signals must be sent in order to allow the necessary
flexibility to accommodate these technologies in the power system, so that this new context
does not imply a decrease in security of supply.
In the proposals developed in this work we only consider variable technologies such
as solar and wind. Although hydroelectricity is considered within the renewable technolo-
gies, this technology has been present since the beginnings of the power systems, so that
its operational characteristics do not modify the current state of the market. On the other
hand, renewable technologies such as geothermal and biomass present a fairly stable en-
ergy production (coupled with the fact that there are non trivial variables at stake, such as
location and construction) so they do not add more complexity than the hydro plants to the
system.
1.3. Chilean context
As in the rest of the world, in the particular case of Chile an increasing trend has
been observed in new renewable technologies such as solar and wind. A distinction used
in Chile is the category of Non Conventional Renewable Energy (NCRE), which includes
solar, wind, biomass, geothermal, tidal and mini hydro technologies. This is in contrast to

9
conventional renewable technologies, mainly large hydroelectric plants whose large scale
presence in the system has been observed since its inception.
A mechanism of the RPS type was established with the objective of having 20% of the
total demanded energy produced by NCRE technologies by the year 2025. This mecha-
nism responds to the strategic direction of following a more sustainable development and
decreasing dependence on foreign fuels (Chilean Senate, 2010). In this sense, according to
the National Energy Commission (CNE), 40% of the generated energy could come from
these sources by 2035 (CNE, 2016), which raises a new scenario in terms of renewable
energy in the country.
As mentioned above, the existing regulatory and market elements will be affected by
this new scenario, so in this work we are proposing improvements in mechanisms that
affect the three areas described in point 1.1, in order to take advantage of the dynamics that
this new scene presents.
1.3.1. Energy: Long term energy auctions
The first of these mechanisms responds to securing the energy supply in the long term,
more specifically the long-term energy auctions. This mechanism is present mainly in
South American countries, however in some countries in Europe and Southeast Asia can
also be found. This type of mechanism is of particular importance for the baseload plants,
which need long term contracts to finance their high investment costs. Since renewable
technologies are part of this group, the mechanism is especially impacted by their inclusion
on a large scale.
The energy supply auctions for regulated customers in the Chilean system were im-
plemented to solve the lack of investment in the generation sector that was observed in the
electric market. This lack of investment originated in the late 1990s. Specifically, in 1998
there was the greatest drought in 30 years, for which the system was not ready (in fact,
1997 had been rainy, and 1998 was expected to maintain this condition). This situation
resulted in rationing episodes, which in turn brought economic implications in the country.

10
At the regulatory level, this episode involved a modification of the electric law, specif-
ically article “99 bis”, and droughts were no longer considered a “force majeure condition”
and therefore exempt from the compensation of supply deficits. This new regulatory sce-
nario, coupled with low spot prices projected by the regulator (as a consequence of the
low price of Argentine natural gas, which was being imported progressively since 1997
through pipelines from the neighbor country) brought with it an increase of the perceived
risk by the generation companies. This resulted in a decrease in the generation investments
made in the system, favoring a progressive increase of distribution companies that were left
without supply contracts to supply their demand, whose prices were the consequence of a
regulatory determination instead of bilateral negotiations.
In other words, after this regulatory change, the price calculated by the regulator for
this type of contract, called “the nodal price”, failed to reflect the faced risk by generation
companies when maintaining a contract of that nature. This scenario pave the way to
the implementation of a new mechanism to replace the nodal price as the electricity price
for regulated customers, choosing to implement an auction scheme, which had already
been implemented with good results in Brazil, whose implementation was due to similar
problems to those faced by Chile.
Additionally, this type of auction presents challenges for renewable technologies in
the short term, since the inability to follow load given its variable and non-dispatchable
nature makes it difficult for them to deliver the committed energy on an hourly basis. In
the Chilean case, most of the auctions have treated these technologies in a similar way to
the conventional ones, having to fulfill their obligation to provide energy at an hourly level
according to the load profile. Nevertheless, a percentage of the energy in the last conducted
process has been auctioned in three time windows within the day, moving forward in this
work’s proposed direction.
1.3.2. Capacity: Capacity remuneration
The second mechanism is related to the capacity remuneration, that is, the mechanism
that tries to ensure the right amount of the capacity product in the system and to remunerate

11
it. Even though electricity markets try to shift demand away from peak demand hours,
pricing the electricity in them at a higher price according to the peak load pricing theory
(Boiteux, 1960), having an adequate installed capacity to face those hours is still a concern
in several systems. The consideration of a capacity component dates back to the beginning
of the deregulation process of the Chilean market in 1982, but it was not until 1985 that the
concept of “peak power transfers” was formally defined by Supreme Decree N�6 (SD).
Broadly speaking, every year the generators must ensure the demand for their cus-
tomers at the annual peak hours of the system, which is carried out by means of a power
balance in those hours, calculated ex ante to the period in question. This balance is sim-
ply the determination of the power, both provided by each generator and consumed by its
customers in those hours. And based on that calculate the commercial transfers that must
be made between them. These transfers are valued at a regulated price calculated by the
system regulator.
Although the spirit of the power balance was aligned with the installed capacity re-
muneration, in 1998 the norm was changed by means of the SD N�327, introducing the
concept of “firm power”. This new concept not only included elements of adequacy, but
also of “security”, considering characteristics of the plants such as startup time and ramp
rate.
Given the price at which to value the power transfers, it is the responsibility of the sys-
tem operator to determine how much firm power to allocate to each generation unit, which
is carried out through procedures that consider its unavailability given both operational
issues and systemic hydrological conditions.
Through SD N�62 of 2006, the norm which rules power balances is modified again,
where the so-called “sufficiency power” replaces the firm power concept, considering only
the elements related to adequacy. Everything that has to do with security is treated inde-
pendently under the concept of “ancillary services”, which are ruled by the SD N�130.

12
In addition, DS N�62 deals more explicitly with non-conventional renewable power
plants, assigning a sufficiency power given the worst average annual availability presented
by the plant in the last 5 years.
1.3.3. Security: Liquefied natural gas imports
In the Chilean context, the installed capacity of natural gas power plants is approx-
imately 4,750 MW (38% of the thermal capacity), whose access to fuel is indispensable
to have an acceptable level of flexibility and security under a significant inclusion of re-
newable energies. Due to this, the third mechanism is related to take or pay schemes for
the importation of liquefied natural gas (LNG) in the Chilean market. These schemes can
present storage characteristics, since after taking a position of purchase under take or pay,
the LNG plant will dispose a boat with storage capacity in the regasification terminal, be-
ing able to take advantage of the regulation capacity that the configuration presents for a
limited time. That is, the gas supply is delivered over time in a way that optimizes its use
in the system.
The use of LNG in the Chilean electricity market arises from a problem that Chile
had with Argentina. Starting in 1997, a cooperation agreement between the two countries
began in relation to natural gas. Specifically, through the construction of the gas pipelines
Del Pacfico, Gas Andes, Nor Andino and Atacama that united the two countries, an import
of such fuel into Chile started. Low fuel prices compared to those used by other thermal
technologies on the market led to a fast expansion of natural gas plants in the Chilean
power system. It was not until 2004 that due to internal problems, Argentina began to
restrict natural gas exports to Chile, a situation that became critical for the year 2008 when
in conjunction with periods of drought left the Chilean system with high spot prices given
by diesel and an unused natural gas generator park.
This is why the government, through its companies Codelco and ENAP, together with
the private sector, promoted the construction of two regasification terminals, Quinteros and
Mejillones. Through them, for the years 2009 and 2010 respectively, the possibility was
opened again of supplying that fuel to the installed capacity that requires. Because this

13
LNG scenario is relatively new in the Chilean electricity market, a norm and mechanisms
to regulate its use are currently being developed.
1.4. Objectives of the work
The objective of this research is to propose mechanisms to be used in the Chilean
electricity market to deal with the management of the variable generation that a renew-
able environment brings, so that the interests of the involved agents are represented more
reliably.
In particular, this work will develop and propose:
• A modification to the current mechanism of long-term energy auctions, so that
the short-term profile of the participants is represented in some way when allo-
cating the auctioned energy.
• An implementation of a capacity market, where the elaboration of the power de-
mand curve considers both the renewable power plants statistics and the demand
preferences.
• A mechanism in which the optimal amount of liquefied natural gas to be im-
ported is determined by risk hedging contracts between different electricity mar-
ket agents.
The implementations of the proposals will be simulated in the Chilean power system
with different levels of simplification.
1.5. Hypothesis
The development of this work’s hypothesis considers the following elements:
• The short term variability given by the inclusion of variable technologies in-
creases the risk perceived by the agents of the system.
• The short term variability is a factor considered by the agents of the generation
sector when making medium and long term decisions.
14
• Although an agent in the generation sector could search for risk in order to obtain
a higher profit, this work considers that they are risk averse and therefore they
minimize their exposure to risk.
• From the perspective of a generator the market cannot be influenced unilaterally,
therefore it is assumed that the generators behave competitively.
Considering these elements, we formulate the main hypothesis of the investigation:
Through the implementation of market mechanisms that better represent the prefer-
ences of agents in this new context given by the inclusion of variable technologies, it is
possible to reduce risk and improve the allocation of resources.
1.6. Methodology
For each of the problems addressed in this work, four stages are followed.
(i) In the first stage, the specific problem and the mechanism or mechanisms that
currently address the problem are reviewed.
(ii) In the second stage, a mechanism is proposed that in some dimension presents a
better representation of the involved agents.
(iii) In the third stage the preferences of the involved agents are modeled.
(iv) Finally, the fourth stage evaluates the proposed mechanism through simulations
in the Chilean market with different levels of simplification. For this, the results
obtained using the proposed mechanism are compared with those obtained using
an existent mechanism that has the same purpose.
In the following points there is a summary of the four aforementioned stages applied
to each area under analysis.
1.6.1. Energy:
• The First stage will address the specific problem in this area, which is is to have
and adequate energy supply in the long term, in order to prevent high prices and
undesired loss of load scenarios.

15
• In the Second stage an energy auction mechanism is proposed, where a modifi-
cation in the offer structure used in actual mechanisms, allowing the participants
to express their supply preferences in the short term.
• Within the Third stage, the participants whose preferences are modelled in this
chapter are the generator companies that participate in the auction, and the medium
by which them expose their preferences is the shape of their offers. In this sense,
different levels of risk aversion are considered in order to obtain different offer
shapes.
• In the Fourth stage, the results of using the mechanism are compared with a
traditional energy auction, where the short term is not represented in the auction.
1.6.2. Capacity:
• The First stage will address the problem of having an adequate installed capacity
in the system, in order to respond to peak demand scenarios.
• In the Second stage a capacity market mechanism is proposed, where a modifi-
cation in the demand curve used in actual mechanisms allows a better represen-
tation of the demand willingness to pay.
• Within the Third stage, in this chapter the preferences of the demand are mod-
elled, where a parametric function is derived that values the willingness to pay
for capacity that the consumers have, based in the expectation of loss load and
its value.
• In the Fourth stage, the results of using the mechanism are compared with a
capacity market that follows the design principles used in some North American
power systems.
1.6.3. Security:
• The First stage will address the problem of having an adequate amount of natural
gas in the system, in order for the gas plants to be available both for generation
and to provide the require fast response that they are capable of.

16
• In the Second stage an insurance market based on natural gas imports is pro-
posed, where an explicit value is defined and traded in a market setting.
• Related to the Third stage, in this chapter there are modelings for both the LNG
importers and the generators of the system. The import price of the importers
is represented through a random variable. On the other hand, the generators (or
insurance buyers) calculate their offer prices based on an expected spot price
value, considering for that a random risk aversion.
• Finally, in the Fourth stage, as there isn’t an implemented mechanism in this
sense, the results are compared with a centralised approach suggested in the
literature.
1.7. Work overview
The thesis has been organized in four chapters. The objective of each chapter is the
development and evaluation of a particular market mechanism, associated to a specific
area of the electricity market. Due to this, although the thesis encompasses the topic of
implementing market mechanisms that improve the representation of agents’ preferences
in a context of renewable energies inclusion, each chapter is complete and self-contained,
including an introduction and its own conclusions.
In this first chapter, the need to develop market mechanisms and regulatory measures
in order to move in the direction of an ideal electric market, in a future with an increasing
level of variable renewable energy is stated. The context of the research is introduced, con-
sidering only the energy generation sector. There is a description of 3 areas of the electric
market where generators can earn income and the difficulties that the incorporation of re-
newable energies poses to the system. Then the Chilean context is described in each one of
the 3 areas mentioned above and the mechanisms currently implemented in them are men-
tioned. Finally, the research objectives are proposed, a working hypothesis is formulated
and a study methodology is proposed and evaluated.

17
Chapter 2 discusses the topic of long-term energy auctions. The types of auction that
can be found in the electric sector are listed and the use of auctions as an object to support
the development of renewable energies described. Then, alternatives for the short-term
allocation at the hourly level in the long-term auction processes are described and a mech-
anism is proposed to include a representation of this short-term in the long-term allocation.
Both the system and the generators participating in the auction are modeled, with which 3
case studies are implemented considering different levels of risk aversion for the partici-
pants. The first and second only differ in the amount of energy auctioned, while the third
considers a supporting scheme for solar technology by the auctioneer. Finally, a discussion
section and the conclusions of the chapter are presented.
Chapter 3 develops the topic of capacity remuneration. It describes the problem that
results in the remuneration of capacity and the types of mechanisms that have been used
to do so. Additionally, the effects that renewable energies have in this area are described.
Then a methodology is proposed to implement a capacity market, where the variability
of renewable energies and load are considered explicitly. Additionally, the definition of an
arbitrary capacity target defined by the regulator is avoided, considering the modeling of the
capacity demand curve through a parametric function that only depends on the VOLL and
technical characteristics of the system. A case study is implemented in order to compare
the proposal with a capacity market similar to the one found in NYISO, with sensitivities
in the value of VOLL, renewable technological mix and level of inclusion of renewable
energies. Finally the conclusions of the chapter are presented.
Chapter 4 develops the issue of importing LNG. It describes the LNG characteristics
and its relationship with the electric sector, as well as its state in South America and the
dynamics of take or pay contracts for its importation. Then the insurer characteristic that
can be assumed by the power plants that import and use such fuel is described. Based
on this, a mechanism is proposed to decide in a decentralized way the optimal level of
LNG to be imported into the system, using a market scheme where there are insurance
trades between importers and generators with energy supply contracts. Both the system
and the generators participating in the market are modeled considering 3 systemic trends

18
of risk aversion, with 2 case studies being implemented with them. The first one applies
and evaluates the benefit of the proposed mechanism, while the second is a simplified use
of the mechanism to support renewable energy plants. Finally, a discussion section and the
conclusions of the chapter are presented.

192. A NOVEL INCLUSION OF INTERMITTENT GENERATION RESOURCES IN
LONG TERM ENERGY AUCTIONS
2.1. Background
2.1.1. Auctions
As mentioned in (Maurer & Barroso, 2011), an auction is a selection process designed
to distribute goods and services competitively; and in most of the cases in the electricity
market, generation companies offer their products because they are interested in selling
power contracts to large clients or distribution companies with a design that is focused on
obtaining the best price (this is the so-called reverse auction).
Within the auctions oriented to attract new capacity, we can find ones that (i) include
all types of technologies or technology neutral (direct competition among all technologies),
(ii) only renewable energies, (iii) specific renewable technologies, (iv) specific projects (for
example, to award a concession in a specific site) and (v) for demand resources.
Another distinction is the product that is auctioned as capacity per se (as in (Hobbs
et al., 2005), (Hobbs et al., 2007), (Cramton, 2006), (Cramton & Stoft, 2005)), which
normally correspond to short term auctions (annual, monthly) whose target is to keep the
system reliability within certain margins in peak hours, or if the auctioned product is energy
to be delivered within a certain period, which generally are long term contracts (up to
20 years) as in (Moreno et al., 2009), (Moreno et al., 2010) and (Chacon, 2013), among
others. These last types of auctions (where long term contracts for delivering energy are
the products) are the ones that we are going to be referring for the rest of the work.
2.1.2. Renewable technologies in auctions
In the context of renewable energy, several countries have decided to foster the de-
velopment of renewable technologies through exclusive auctions for one or more of those
technologies, which necessarily implies a regulatory decision about the quantity of the de-
mand intended for those kind of technologies. According to (Maurer & Barroso, 2011),

20
these types of auctions have proven to be a viable alternative to the more traditional ap-
proaches like feed-in-tariff to attract renewable energy into the system. As the traditional
auctions to attract new capacity, there are different combinations of target participants in
these renewable auctions, being some of them: a) all types of renewable technologies, b)
technology-specific or c) technology and site specific. In this context, (del Rıo & Linares,
2014) declare that there are mixed results in the implementations of such auctions, being
one positive aspect the low level of subsidies in general. On the contrary, some of the
negative elements include the low effectiveness to attract the expected renewable capacity,
the low technological diversity, low innovation and high transaction costs. On the other
hand, technology neutral auctions are those where there aren’t restrictions on the types of
technologies that can participate, being them renewables or conventionals.
2.1.3. Short term issue of hourly power obligation
Clearly the long term is the main focus of the energy auctions, but also there are short
terms issues involved, even at the hourly level. One of those issues is that the group of
auction winners has to supply the actual aggregated load of the demanding entity, indepen-
dent of the dispatch made by the ISO. The hourly power obligation will determine a short
term risk that every auction participant will have to face in the case of winning. This is-
sue becomes especially relevant as more renewable technologies enter the system, because
unlike conventional base load technologies it is common for some renewable technolo-
gies to present several hours without generation, which raises the question of who has the
obligation to supply the power on those hours.
2.1.3.1. Existing hourly assignments between auction winners
In most long term energy auctions, what has been done until now is to let the renew-
ables fulfill their awarded energy supply according to a production logic (whenever they
generate, their energy is recognized by the LSE until the awarded energy for the period is
reached). This clearly imposes different conditions on conventional and renewables tech-
nologies, transferring risk among them. On the other hand, the Chilean energy market
has been pioneer in implementing auctions where both kinds of technologies are treated
21
equally. However, the implementation does not acknowledge that the dynamics of the gen-
eration technologies are different.
Until 2014, the Chilean electric market supply auctions considered that each generation
company i that is awarded a supply contract must provide the awarded energy with a power
profile that is equal to the demand in question1. In other words, in every hour h of the day
it must provide P hi power equivalent to the Load Serving Entity demand at that time Dh
LSE
multiplied by the percentage that represents its Ei awarded energy with respect to the total
awarded ELSE , as seen in the following equation.
P hi = Dh
LSE · Ei
ELSE
(2.1)
Moreover, the power system’s economic dispatch is cost based (responds to the real
audited costs associated to the units’ generation, considering restrictions such as technical
minimums and reserves). As mentioned, such economic dispatch is carried out by the ISO,
independent from the commercial obligations that each generation company has acquired
beforehand. This implies the full separation of the system’s physical operation from the
contractual obligations between the generation companies and demand. Due to this, there
might be the case where a generation company has a contractual obligation to supply X
power at a specific hour of the day during which its generation units are not dispatched by
the ISO, in which case that company will have to buy that energy in the spot market. On
the other hand, if we assume that the same company has no surpluses or deficit (that is,
through its supply contracts it sells the total exact amount of energy it produces), it will
necessarily generate that X energy at another time of the day, which will have to be sold
in the spot market. This situation makes the generation company face a risk that involves
the spot market, with the need to cover with its own money the supply and generation time
differences (gspotsupply � gspotgen).
1The auction scheme was modified in 2014, allowing a small percentage of the energy to be auctioned atdifferent time windows during the day.

22
In the case of Chile, the situation described had not been a major issue with conven-
tional base load generation, because when spot prices are high, the base power plants (coal
and hydro in Chile) are usually running, mitigating in this way the spot price risk associ-
ated with their contracts. On the other hand, the NCRE power plants do not necessarily
have that characteristic, so their entry in the system starts questioning the logic behind such
hourly assignment.
2.1.3.2. Alternative hourly assignments between auction winners
In relation to the described hourly assignment scheme, two major features presented
by some NCRE which have an important impact when being considered in supply auctions
are the non-manageable intermittency and uncertainty of their generation. However, the
mechanism design will only consider the non-manageable intermittency issue in an explicit
way.
To illustrate this issue, we will use a simplified example in order to understand its
essence. Although demand in a distribution company is not usually flat, in this example we
will consider what could correspond to an industrial consumption, which is a flat demand.
On the other hand, we will assume that there are two participants in the auction, a coal and
a solar generation company, and both are necessary to satisfy the daily demand.
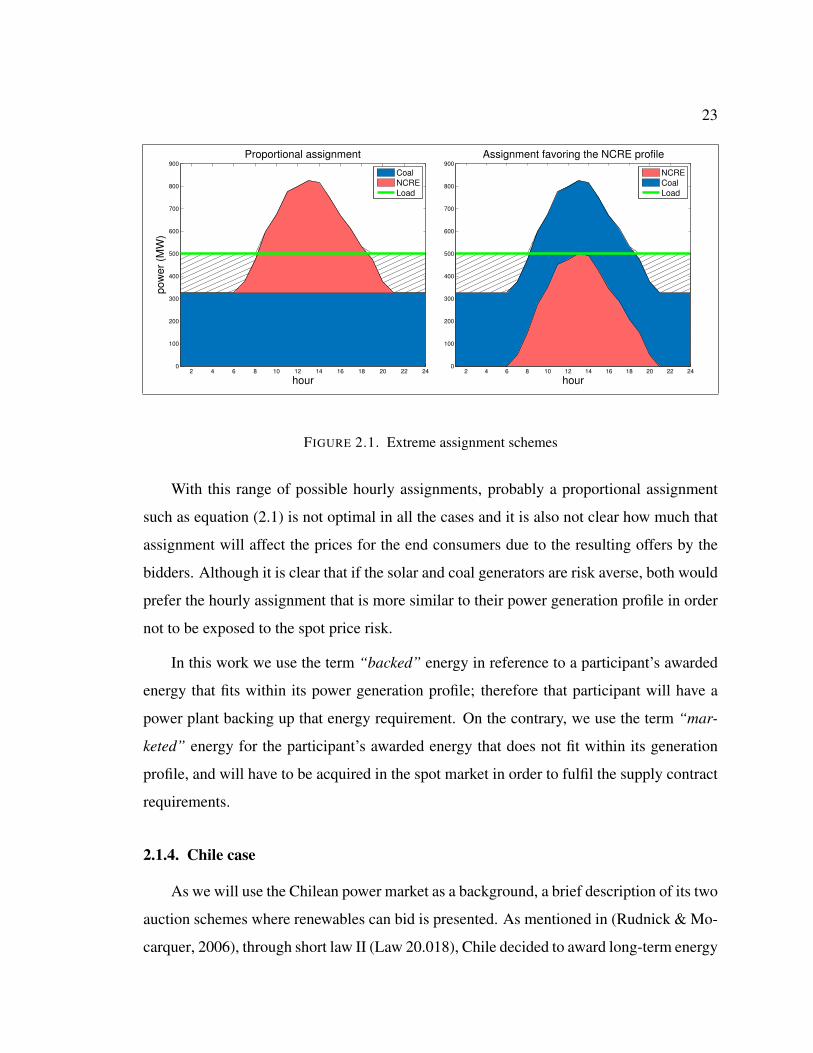
Figure 2.1 shows the two possibles assignments mentioned in the previous point. Due
to the solar generation characteristics there would be an area (hatched area) that, inde-
pendent from who is awarded, would have to be necessarily marketed (that is, supplied
without having own backup generation at that time). The figures show the two extremes in
the award, they are:
(i) The energy to be marketed is in charge of the NCRE (like in the Chilean scheme).
(ii) The energy to be marketed is in charge of the conventional generator (like in a
feed-in-tariff-like scheme).
In addition, there is a continuum of possible assignments between these two extremes,
where each one will imply a different distribution of the total risk faced by the generators.
23
2 4 6 8 10 12 14 16 18 20 22 240
100
200
300
400
500
600
700
800
900
Proportional assignment
hour
pow
er
(MW
)
CoalNCRELoad
2 4 6 8 10 12 14 16 18 20 22 240
100
200
300
400
500
600
700
800
900
Assignment favoring the NCRE profile
hour
NCRECoalLoad
FIGURE 2.1. Extreme assignment schemes
With this range of possible hourly assignments, probably a proportional assignment
such as equation (2.1) is not optimal in all the cases and it is also not clear how much that
assignment will affect the prices for the end consumers due to the resulting offers by the
bidders. Although it is clear that if the solar and coal generators are risk averse, both would
prefer the hourly assignment that is more similar to their power generation profile in order
not to be exposed to the spot price risk.
In this work we use the term “backed” energy in reference to a participant’s awarded
energy that fits within its power generation profile; therefore that participant will have a
power plant backing up that energy requirement. On the contrary, we use the term “mar-
keted” energy for the participant’s awarded energy that does not fit within its generation
profile, and will have to be acquired in the spot market in order to fulfil the supply contract
requirements.
2.1.4. Chile case
As we will use the Chilean power market as a background, a brief description of its two
auction schemes where renewables can bid is presented. As mentioned in (Rudnick & Mo-
carquer, 2006), through short law II (Law 20.018), Chile decided to award long-term energy

24
contracts to supply distribution companies through non-discriminatory, technologically-
neutral auctions where the winners correspond to those agents that offer the most economic
alternatives. Such auctions must be carried out at least three years in advance in order to
give time to the investors to obtain funding and building a project.
Another auction scheme was created in 2013, when the law on renewables incentive
was amended. This amendment authorised the government to carry out annual auctions
only for non-conventional renewable energy projects in case it is estimated that the renew-
able quota2 required by law will not be reached with the installed capacity. To partici-
pate, the bidders must: (i) have an Environmental Qualification Resolution accepted for the
project, (ii) have a capital equal or higher than 20% of the total required for the project,
(iii) give proof of the land ownership, (iv) provide a bid performance bond and (v) provide
a collateral for the project implementation. This auction considers a cap price for energy
equal to the mean cost for the long-term development of an efficient generation project in
the relevant system. This second scheme is oriented to attract new renewable technolo-
gies in a technology-specific manner (that can be oriented to attract more than one type of
renewable energy simultaneously). The winners of the auction are awarded a feed-in-tariff-
like product, essentially becoming a production contract. This scheme has not been used,
as the renewable quota has been reached without need for support. Thus, the following
analysis and proposals consider only the first scheme, technologically-neutral auctions.
Given the fact that the Chilean system is presenting new dynamics due to the growing
NCRE incorporation (partly due to the incentives mechanisms such as the RPS imple-
mented by the authority), there is the challenge to find new mechanisms that adapt to such
characteristics. The need is to obtain the best of each world, namely, allowing to obtain the
low prices and environmental benefits that the NCRE can provide, but without disregarding
the risk transfers toward conventional power stations that such incorporation could trigger,
effect that would finally cause an impact on the price paid by end consumers.
2Renewable Portfolio Standard (RPS) mechanism is actually implemented in the Chilean system, where in aprogressive way, 20% of the withdrawals have to come from NCRE sources by the year 2025.

25
2.2. Mechanism design
We believe that a methodology for optimal assignment should consider the hourly as-
signment issue when deciding the energy awarding among auction participants, to allow
the LSE (or distribution company in the Chilean case) to make a better decision, consid-
ering the different variables at stake. In this sense, we are proposing a framework for
energy auctions that considers the short term power profiles from the participants in or-
der for the LSE to obtain a lower purchase total cost through a contract allocation that is
more suitable to each generating technology. Like the existing long term energy auctions
schemes, the proposal follows the logic of a centralized clearing mechanism for the long
term contract market and is not a reliability auction per se. Moreover, it does not deal with
the problem of capacity adequacy and rather assumes that sufficient generation capacity
is always available in the electricity system via capacity mechanisms. To find the optimal
assignment considering the short term supply issue, we must consider both the generation
profiles of the participants and their risk management capability. The latter skill is required
when acting as a marketer. With this information, the LSE can make awarding decisions
for the energy to be bought and the hourly assignment for each participant, which includes
both elements through the co-optimization of both dimensions. The core of the proposed
mechanism is the bid structure of the generators’ offers, which are comprised by an offered
energy, a generation profile and a price indifference curve. The following nomenclature
will be used in the rest of the chapter.
Nomenclature
qBit backed energy awarded to generator i in hour t
qBit marketed energy awarded to generator i in hour t
xi binary variable representing if there is energy awarded to generator i
pbacki price offer for backed energy by generator i
pmarki price offer for marketed energy by generator i
kit percentage of the energy produced by generator i in hour t of the day
Dt LSE total load in hour t of the day

26
EOi annual energy offered by generator i
var costi variable production cost for generator i
AICi annualized investment cost for generator i
green taxesi cost or benefit for generator i related to environmental taxes
max energyi annual maximum energy produced by generator i
cfih capacity factor of generator i in hydrologic scenario hgspotsupply cost of buying 1 MWh in the spot market at a certain hourgspotgen income of selling 1 MWh in the spot market at a certain hour
2.2.1. Bidders offered energy
First, for a generator i the bid must include the energy available for awarding EOi . This
can be a monthly or annual quantity or the quantity for the entire horizon, among others,
but in this case we shall consider an annual resolution.
2.2.2. Bidders generation profile
In addition to the bid, there must be an hourly generation profile for an average day.
The idea of this profile is that it assumes that what has been assigned within it will have
dispatched generation backing up such assignment, hence eliminating the spot market ex-
posure risk.
In this work we consider an hourly resolution for a typical day of the year in the
assignment; therefore the profile submitted must be a 24-hour vector with the percentage
of the daily generation that will be produced on each hour of a regular day. The symbol kit
is used to represent the elements of this 24-hour profile vector presented in the auction by
generator i.
Figure 2.2 presents a sample profile for a solar generator in a graphical form.
It can be seen that in this particular case the solar generation company is providing
information that says that its generation is mostly between 8:00 and 17:00 hours, therefore

27
2 4 6 8 10 12 14 16 18 20 22 240
2
4
6
8
10
12
Sample generation profile
hour
% o
f d
aily
ge
ne
ratio
n
FIGURE 2.2. Sample generation profile
in case it supplies energy to the LSE, during such interval it will be backed up by its own
generation.
It is worth mentioning, that although we are considering one typical day as the bid-
ders provided profile, the implementation could equally consider several types of typical
days at once, like winter and summer days, which would further improve the mechanism
performance.
2.2.3. Bidders price indifference curve
For a generator, we are using the concept of price indifference curve as the function
that maps the possible combinations of awarded backed and marketed energies with an offer
price that varies in order to make the awarded combination indifferent for the generator. In
other words, if a quantity is awarded to a generator, it will be indifferent if all of its energy
is within or outside its generation profile, because the offer price function will reflect that
in the form of a risk premium.
28
Therefore, each participant must provide a price indifference curve with the detail of
the price offered in function of the total awarded energy that is assigned beyond the gener-
ation profile. It must be mentioned that although this curve can be complex for the genera-
tors to calculate, it is an exercise that at least the NCRE plants are already implicitly doing,
given that the current hourly assignment mechanism (equation 2.1) implies that a certain
amount of its awarded energy will have to be marketed. The proposed mechanism makes
explicit this process to all participants to allow the LSE to consider this additional informa-
tion at the moment of the award, hence resulting in a better solution. The price indifference
curves could be quadratic in order to reflect a cost that increases quadratically because of
higher exposition to spot prices. They can also be linear, similar to the indifference curves
used in the different duration contract auctions made by Electricite de France (Ausubel &
Cramton, 2010).
We will use the variables qBit and qMit to represent the backed and marketed energy
that is awarded to generator i in hour t of the day (ie. the assigned energy within and
outside its generation profile). Additionally, in order to obtain general conclusions without
overcomplicating the model, in this work we will limit our analysis to the linear case only.
Therefore the price function will be defined by only two values, joined by a straight line,
with the parameters pbacki and pmarki representing the price offers made by generator i
for a MWh of backed and marketed energy respectively.
The linear case serves well the purpose of this work, but it is worth noting that for
a more detailed implementation of a price indifference curve one can search in fields like
decision making in economic theory and finances (Glimcher & Fehr, 2013), where creating
profiles that trade off risk and return is a central issue.
2.2.4. Awarding
On the other hand, the LSE must award the following among the generation companies
that participate in the auction:
(i) The total amount of energy that will be purchased from each company.

29
(ii) The hourly assignment profile for the company, which will result on the pur-
chase price depending on the amount of energy assigned within and outside of
the generation profile provided by the company (backed and marketed energies,
respectively).
In this manner, the problem to be solved by the LSE will be the following:
minimizeqBit ,q
Mit ,xi
X
i
X
t
(pbacki · qBit + pmarki · qMit )
subject toX
i
(qBit + qMit ) = Dt ; 8t
X
t
(qBit + qMit ) = xi · EOi ; 8i
qBit kitEOi ; 8i, t
qBit , qMit � 0 ; 8i, t
xi 2 0, 1 ; 8i
(2.2)
It can be seen that the presented equations solve the problem in the case where a linear
objective function is considered, ensuring that the total demand is supplied at the least cost
for the LSE, caring not to assign to a participant more energy than what it is offering. It is
worth noting that the model works in our case because we will consider combinations of
offers that exactly match the demand in order to fulfil equation ??. The problem presented
here must be adjusted based on the particular characteristics of the price indifference curves
(eg., quadratic, exponential, linear, etc.) and the considered typical days (summer day,
winter day, etc.).
2.3. Modeling
We try to obtain an estimate of the impact of the supply cost of this new mechanism
in an auction process, and for this three participant technologies are considered; coal, solar
and win. These are technologies that can be competitive in the Levelized Cost of Energy,
but they have different production profiles. On the other hand, we consider two cases

30
in relation to the total amount of energy offered (including backed and marketed energy,
namely within and outside the generation profiles of the generation companies):
(i) The energy of three generation companies is required to satisfy the auctioned
demand.
(ii) The total energy auctioned can be satisfied by two of the generation companies
(namely, one is excluded).
Independent from the case, we assume that each generation company makes a competi-
tive bid, trying to offer the minimum price considering the expected return and their risk
aversion.
2.3.1. System modeling
The actual auction will be a process that occurs within the context of a physical power
system, with more generation units and demand that the ones present in the auction itself
(we will assume that the system is large enough so that not being able to buy energy in the
spot market will not be a concern for the participants).
Clearly, the participants’ perception about the spot market risk will depend on this sys-
tem configuration, both on the generation mix and the demand. Although we considered a
deterministic annual demand level, we considered 3 possible NCRE inclusion levels equiv-
alent to 20, 30 and 40% of the system’s total energy generated by generation units that fulfil
such characteristic, where for each level there is a corresponding complementary thermal
generation pool.
Using a demanded energy projection for the year 2030 by the Chilean National En-
ergy Commission, we present a brief summary of the methodology used for the installed
capacities calculation and the resulting spot prices.
First, the three NCRE inclusion levels were considered. In each level, approximately
10% of that energy comes from mini hydros, geothermal and biomass sources, while 47 and
43% come from solar and wind sources, respectively, keeping the projected percentages of
the Chilean National Energy Commission.

31
Considering these NCRE inclusion levels as a fact, we calculated the optimal thermal
mix in order to complement each level in particular. This is equivalent to assume that
each NCRE inclusion level results from the country’s energy policy decisions, while the
rest of the system adjusts itself accordingly (assuming a perfect competition, absence of
congestions in the transmission system and omitting technical constraints such as start-up
times and technical minima).
The calculation of the optimal installed capacity in each inclusion level was made
through the screening curves methodology seen in (Phillips et al., 1969) and (Baldick et al.,
2011). This methodology represents each generation technology through a linear function
based on its fixed and variable costs (including the annualised investment cost). With these
functions, the total cost of using each technology for a number of hours in the year can
be easily obtained. Using this information and the load duration curve, the methodology
calculates the optimal mix to serve the load on each hour of the year in order to have the
least total cost (fixed plus variable costs) in the whole year.
Through such methodology an optimal thermal mix is obtained in terms of investment
and operating costs, considering both the generation uncertainty given by the NCRE and
the hydrological uncertainty that highly impacts the hydraulic power stations’ generations.
Figure 2.3 presents the resulting installed capacity by technology for each NCRE level
considered.
As we need an estimate of the hourly spot price for the year in question, we simulated
the system’s daily operation in each case. In this manner, for each NCRE inclusion level,
the resulting installed capacity, the hydrological statistics available for the Chilean system
(56 annual hydrological scenarios) and the hourly statistics of solar and wind plants from
2013 were used. This allowed obtaining different dispatch scenarios for a typical day for
such year, and the hourly spot prices in each one of those scenarios were calculated. Figure
2.4 presents the average spot price for each hour and level of NCRE inclusion.
It can be observed that in all the cases there is a clear influence of the solar plants on the
system, resulting in lower spot prices between 8:00 and 17:00 hours due to the abundance

32
20% NCRE 30% NCRE 40% NCRE0
5
10
15
20
25
30
35
40
Installed capacity by type
Scenario
Inst
alle
d c
ap
aci
ty (
GW
)
hydroNCREcoalgasdiesel
FIGURE 2.3. Installed capacity by type
of economic generation at that time of the day. In addition, it must be taken into account
that although the figure shows an average, there is a variance associated to each hour of the
day, which will be different in each one of the NCRE inclusion cases.
On the other hand, the hourly distribution of the demand considered corresponds to
figure 2.5 that is the total demand profile of the Central Interconnected System (SIC) (main
Chilean system), where 64% of its demand is regulated or residential.
It can be observed that although the curve is not flat, most of its energy could be circum-
scribed in a rectangle, approximately matching the situation with the example presented in
figure 2.1.
2.3.2. Generators modeling
We consider that each participant can have a low, medium or high-risk aversion level,
which will be reflected in its bids. So in each simulated case we will try different combina-
tions of these risk aversions in order to obtain a broader view.

33
2 4 6 8 10 12 14 16 18 20 22 240
20
40
60
80
100
120
hour
Sys
tem
sp
ot
price
(U
S$
/MW
h)
System average spot price
20% NCRE30% NCRE40% NCRE
FIGURE 2.4. System average spot price for each hour and NCRE scenario
Additionally, as mentioned in section 2.2.3, there are several possibilities to represent
the bid or indifference curves. However, in our modelling we used linear functions for
such representation in order to prevent complicating the problem and centre ourselves in
its essence. With this, the bid is defined with the offered energy, the generation profile and
a price indifference function.
2.3.2.1. Generation profile
We assume the daily generation profile as the average profile for each technology, cal-
culated from the statistics used. Figure 2.6 shows the generation profile for each technology
participating in the auction.
It can be observed that the coal profile is modified as additional NCRE percentage is
considered in the system. This happens because the nil marginal cost of such technologies
displaces the generation of more expensive technologies such as coal. On the other hand,
the solar and wind technologies do not show any modification in their generation in the
different scenarios, because as they have nil generation prices, there is no technology that

34
2 4 6 8 10 12 14 16 18 20 22 240
1
2
3
4
5
6
Considered daily load profile
hour
% o
f d
aily
loa
d
FIGURE 2.5. SIC daily average load profile
displaces them (this would happen if at any hour there is more nil-price NCRE generation
than demand, something that does not happen in our scenarios).
It is necessary to take into account that we are not considering operational aspects such
as technical minima or start-up costs, which, albeit it is a simplification, it is not the essence
of the problem we are analysing.
2.3.2.2. Backed price
The backed price corresponds to the bid price that a generator is ready to offer provided
the hourly assignment of its energy matches with the generation profile included in the bid,
which we assume is known by the generator with a certain level of certainty.
We assume that the backed price will correspond to the minimum price to charge for
one MWh that guarantees the generator a predetermined profitability, considering both the
investment and operating costs and taxes or subsidies associated to environmental issues.
The revenues and costs values that influence the calculation of the backed price of the
participant technologies are shown in table 2.2.

35
2 4 6 8 10 12 14 16 18 20 22 240
5
10
15
hour
% o
f d
aily
ge
ne
ratio
n
Generation profile for each technology
coal 20%coal 30%coal 40%sunwind
FIGURE 2.6. Generation profile by technology
TABLE 2.2. Backed price calculation factors
Cost Coal Solar WindAnnualized investment cost 10% (US$/MW) 278,249 222,600 200,340Operation cost (US$/MWh) 40 0 0NCRE attribute (US$/MWh) 12 (%NCRE) -12 -12CO2 tax (US$/MWh) 4.7 0 0
Note that the NCRE attribute item corresponds to a cost for the coal generator (that
depends on the NCRE quota fixed by the authority) but it is considered as revenues for the
NCRE generators. The value considered for this attribute corresponds to an approximation
of the attribute’s average price for 2013. On the other hand, for the CO2 emissions tax of
US$ 5 per ton of CO2 emitted, an emission factor of 0.94 ton CO2/MWh was considered
for coal. Additionally we are considering a 10% rate of return for calculating the annualized
investment cost.
In addition, each generator will need an estimation of the amount of energy to be gen-
erated in the year in question. This estimate will depend on the generator’s risk aversion.

36
TABLE 2.3. Backed Price by risk aversion (US$/MWh)
Technology Low Medium HighCoal (20% NCRE) 84.57 86.14 88.42Coal (30% NCRE) 89.02 91.13 94.17Coal (40% NCRE) 95.61 98.64 103.02Solar 89.64 89.64 89.64Wind 64.23 64.23 64.23
As we are assuming that the annual NCRE production must correspond to an annual fixed
value (as percentage of the demand), such generation will not be displaced by large hydro
electric power stations, therefore we assume that both the solar and wind participant have
certainty about how much they will generate in the year independent of the present hydro-
logical scenario. However, this cannot be assumed for coal, because its annual generation
will indeed be displaced by hydraulic generation. Table 2.3 shows the backed prices for
the different participant technologies in function of their level of hydrological risk aversion
(note that offer prices for coal technology are higher as there are more NCRE in the system,
cause its capacity factor will be lower).
For a generator i, these prices were calculated as in the following equation:
pbacki = var costi +AICi
max energyi · CV aR(cfih)+ green taxesi (2.3)
where CVaR(cf) corresponds to the Conditional Value at Risk (CVaR) (Uryasev, 2000)
of the plant factor considering the 56 statistical hydrological scenarios, where the Low,
Medium and High aversions are equivalent to the production confidence levels of 5, 50 and
95%, respectively. On the other hand, green taxes correspond to the revenues or costs for
the generator given by the NCRE attribute and the CO2 tax.
2.3.2.3. Marketed price
As mentioned in section 2.1.3.1, the excess cost paid by a generation company when
supplying 1 MWh at an hour of the day different from the generation time is (gspotsupply �gspotgen). Therefore, the random variable that represents the price that a generator i will

37
TABLE 2.4. Marketed Price by risk aversion (US$/MWh)
Technology Low Medium HighCoal (20% NCRE) 90.75 106.81 222.51Coal (30% NCRE) 93.90 111.31 226.25Coal (40% NCRE) 97.18 117.60 226.32Solar (20% NCRE) 107.79 124.13 265.00Solar (30% NCRE) 111.37 130.92 282.77Solar (40% NCRE) 117.29 142.18 290.60Wind (20% NCRE) 68.70 83.17 190.63Wind (30% NCRE) 69.89 85.44 196.51Wind (40% NCRE) 70.47 89.07 199.28
charge to sell 1 MWh at a time different from the generation time (during the same day)
shall correspond to the following equation:
pmarki = pbacki + (
gspotsupply � gspotgen) (2.4)
As an approximation to the probability distribution given by (
gspotsupply� gspotgen), we
considered many daily scenarios based on the statistics generated before in section 2.3.1.
We assumed that for a specific day, a generator considers that the LSE can request the
MWh to be supplied in an equiprobable manner during each one of its 24 hours. However,
that same MWh will not be generated at any hour with the same probability (for example,
as seen in figure 2.2; for the solar generator such MWh will be generated in hour 4 with
0% probability, while there will be a 11.4% probability to generate it at hour 15). With
this information and the amount of days in the statistics, it is possible to obtain a discrete
estimation of the random variable (gspotsupply�gspotgen), which in turn allows us to calculate
an estimate of the pmark variable.
Table 2.4 shows the marketed prices for the different participating technologies in func-
tion of their risk aversion level.
As it happens with the backed prices, the marketed prices correspond to the CVaR of
the estimated distribution of pmark, where the Low, Medium and High levels correspond
to the confidence levels of the cost excess of 5, 50 and 95%, respectively.
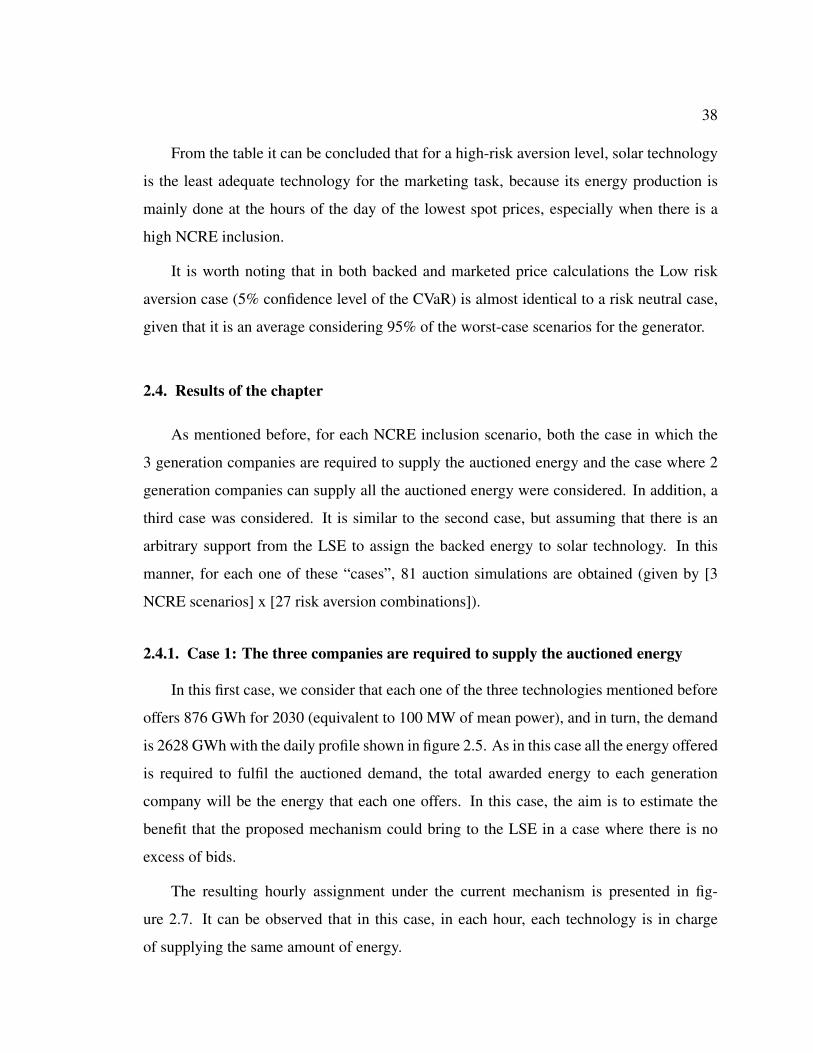
38
From the table it can be concluded that for a high-risk aversion level, solar technology
is the least adequate technology for the marketing task, because its energy production is
mainly done at the hours of the day of the lowest spot prices, especially when there is a
high NCRE inclusion.
It is worth noting that in both backed and marketed price calculations the Low risk
aversion case (5% confidence level of the CVaR) is almost identical to a risk neutral case,
given that it is an average considering 95% of the worst-case scenarios for the generator.
2.4. Results of the chapter
As mentioned before, for each NCRE inclusion scenario, both the case in which the
3 generation companies are required to supply the auctioned energy and the case where 2
generation companies can supply all the auctioned energy were considered. In addition, a
third case was considered. It is similar to the second case, but assuming that there is an
arbitrary support from the LSE to assign the backed energy to solar technology. In this
manner, for each one of these “cases”, 81 auction simulations are obtained (given by [3
NCRE scenarios] x [27 risk aversion combinations]).
2.4.1. Case 1: The three companies are required to supply the auctioned energy
In this first case, we consider that each one of the three technologies mentioned before
offers 876 GWh for 2030 (equivalent to 100 MW of mean power), and in turn, the demand
is 2628 GWh with the daily profile shown in figure 2.5. As in this case all the energy offered
is required to fulfil the auctioned demand, the total awarded energy to each generation
company will be the energy that each one offers. In this case, the aim is to estimate the
benefit that the proposed mechanism could bring to the LSE in a case where there is no
excess of bids.
The resulting hourly assignment under the current mechanism is presented in fig-
ure 2.7. It can be observed that in this case, in each hour, each technology is in charge
of supplying the same amount of energy.
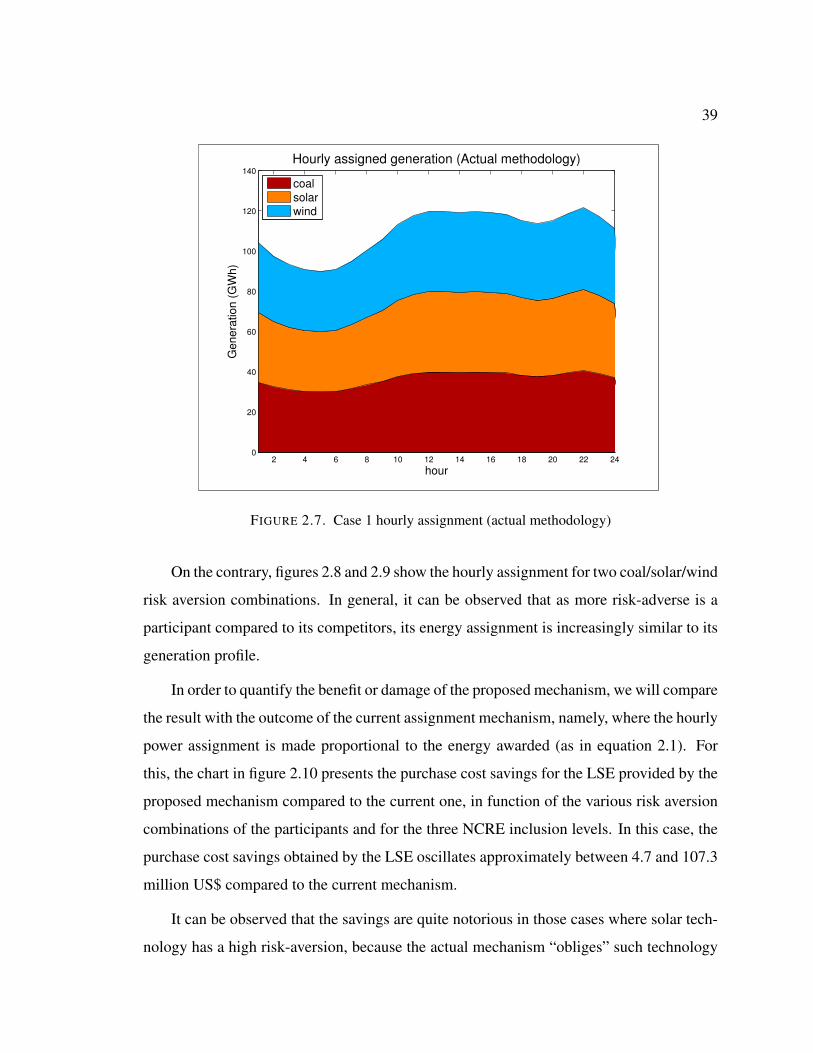
39
2 4 6 8 10 12 14 16 18 20 22 240
20
40
60
80
100
120
140
hour
Ge
ne
ratio
n (
GW
h)
Hourly assigned generation (Actual methodology)
coalsolarwind
FIGURE 2.7. Case 1 hourly assignment (actual methodology)
On the contrary, figures 2.8 and 2.9 show the hourly assignment for two coal/solar/wind
risk aversion combinations. In general, it can be observed that as more risk-adverse is a
participant compared to its competitors, its energy assignment is increasingly similar to its
generation profile.
In order to quantify the benefit or damage of the proposed mechanism, we will compare
the result with the outcome of the current assignment mechanism, namely, where the hourly
power assignment is made proportional to the energy awarded (as in equation 2.1). For
this, the chart in figure 2.10 presents the purchase cost savings for the LSE provided by the
proposed mechanism compared to the current one, in function of the various risk aversion
combinations of the participants and for the three NCRE inclusion levels. In this case, the
purchase cost savings obtained by the LSE oscillates approximately between 4.7 and 107.3
million US$ compared to the current mechanism.
It can be observed that the savings are quite notorious in those cases where solar tech-
nology has a high risk-aversion, because the actual mechanism “obliges” such technology
40
2 4 6 8 10 12 14 16 18 20 22 240
20
40
60
80
100
120
140
hour
Ge
ne
ratio
n (
GW
h)
Hourly assigned generation (Proposed methodology)
coalsolarwind
FIGURE 2.8. Case 1 hourly assignment (coal/solar/wind) = (low/high/medium)risk aversions
to market a large portion of its energy. Also due to its characteristics, it will generate dur-
ing the hours of the day in which the spot price is lower, resulting in a back up that is not
the most adequate one for the marketing task. It is worth noting that on each NCRE in-
clusion level there is a wide range of possible cost saving values, caused by a combination
of two characteristics. In the first place, the considered power system has a large hydro
share, which results in extreme opposite spot prices depending on hydrologic conditions.
On the other hand, regarding the auction participants, all the combinations of risk aversion
levels are being considered, giving place to extreme conditions such as where all the partic-
ipants present high-risk aversion (or low-risk aversion). These two characteristics coupled
together result in the mentioned wide ranges.
2.4.2. Case 2: Two companies can supply all the auctioned energy
This case considers that each company (represented by the coal, solar or wind tech-
nology) offers 1314 GWh for 2030; equivalent to a mean power of 150 MW, while the

41
2 4 6 8 10 12 14 16 18 20 22 240
20
40
60
80
100
120
140
hour
Ge
ne
ratio
n (
GW
h)
Hourly assigned generation (Proposed methodology)
coalsolarwind
FIGURE 2.9. Case 1 hourly assignment (coal/solar/wind) = (high/low/medium)risk aversions
auctioned demand that same year is 2628 GWh. In this manner, two generation compa-
nies could supply all the auctioned energy, considering that if a company is chosen for the
awarding, all its energy must be bought. The aim of this constraint is to create a more
realistic case, because if a generation company foresees that only part of its energy will be
auctioned, this would be expressed in its bid prices.
With the mentioned assumptions, there are only three possible award combinations in
terms of technology mix, being Coal/Solar, Coal/Wind and Solar/Wind. So, for each one
of the 27 possible risk aversion combinations (given by the 3 risk aversions of the 3 tech-
nologies) on each inclusion level of NCRE, the resulting awarded technology combination
will be one of the 3 mentioned before. Table 2.5 shows how many times each of the 3 tech-
nology combinations is awarded in the different scenarios, both for the actual and proposed
mechanism.
The table shows that while there are no significant differences between the two mech-
anisms in terms of technologies chosen (mainly being coal and wind the two awarded

42
0
20
40
60
80
100
120
Risk aversion (coal/solar/wind)
L/L
/LL
/L/M
L/L
/HL
/M/L
L/M
/ML
/M/H
L/H
/LL
/H/M
L/H
/HM
/L/L
M/L
/MM
/L/H
M/M
/LM
/M/M
M/M
/HM
/H/L
M/H
/MM
/H/H
H/L
/LH
/L/M
H/L
/HH
/M/L
H/M
/MH
/M/H
H/H
/LH
/H/M
H/H
/H
Annual savings for the LSE
An
nu
al s
avi
ng
s (m
illio
n U
S$
)
20% NCRE
30% NCRE
40% NCRE
FIGURE 2.10. Annual savings for the LSE (compared to actual mechanism), Case 1
TABLE 2.5. Awarded combinations out of the total number of risk scenarios
Actual mechanism Proposed mechanismTechnologies 20% 30% 40% 20% 30% 40%Coal / Solar 0 0 0 0 0 0Coal / Wind 27 24 21 26 25 20Solar / Wind 0 3 6 1 2 7# of scenarios 27 27 27 27 27 27
technologies), the slighter higher assignment that the solar generator has with the proposed
mechanism is exclusively due to the greater freedom the LSE has when distributing the
energies offered.
On the other hand, as there is more NCRE in the system, the coal generation dispatch
is considerably reduced. Anticipating this condition, the coal generator would bid higher
prices in the auction so that it can recover its investment costs, which in turn implies an
increase of competiveness for the solar generator and greater assignment to its offers under
both mechanisms.

43
Figure 2.11 shows for each risk aversion combination the savings in annual energy
purchase costs for the LSE involved in using the proposed mechanism instead of the current
mechanism.
0
5
10
15
20
25
30
35
Risk aversion (coal/solar/wind)
L/L
/LL
/L/M
L/L
/HL
/M/L
L/M
/ML
/M/H
L/H
/LL
/H/M
L/H
/HM
/L/L
M/L
/MM
/L/H
M/M
/LM
/M/M
M/M
/HM
/H/L
M/H
/MM
/H/H
H/L
/LH
/L/M
H/L
/HH
/M/L
H/M
/MH
/M/H
H/H
/LH
/H/M
H/H
/H
Annual savings for the LSE
An
nu
al s
avi
ng
s (m
ill U
S$
)
20% NCRE30% NCRE40% NCRE
FIGURE 2.11. Annual savings for the LSE (compared to actual mechanism), Case 2
It can be observed that the annual cost savings when using the proposed mechanism is
about 0.6 and 30.1 million US$ depending on the NCRE inclusion scenario and on the risk
aversion combination.
Additionally, considerable savings are obtained when the wind generator has a high-
risk aversion. This happens because the backed energy offered by such technology is very
economic compared to the marketing cost, therefore the freedom the LSE has of being
offered an assignment according to its generation profiles is of great benefit in this case.

44
2.4.3. Case 3: Two companies can supply the auctioned energy and the solar technol-
ogy has preference in the backed energy awarding
To be exact, this case is a sensitivity analysis of Case 2, because we assume that only
two generation companies are required to supply the entire auctioned demand. However,
we consider that there is a benefit given to solar technology, giving it priority in the award-
ing of its backed energy with respect to remaining participants. In addition, the assumption
that the companies do not know their competitors is relieved. However, we still consider
that each company attempts to make the most competitive bid under this new scheme. In
this manner, the companies calculate their bid prices without knowing the competitors’
bid prices, but they are aware of the benefit for the solar generator when it is awarded the
backed energy.
This could be similar to dedicate a special auction at the hours in which the solar
generator is generating, because in this manner such generator could offer all its energy
without marketing risks. Consequently, this would make the solar generator prices highly
competitive in those hours, making the rest of the technologies to somehow give up winning
in those hours, reflecting it in their prices.
To calculate the new bid prices we continue with the methodology described in 2.3.2.3.
However, instead of considering that the LSE can request for an equiprobable supply in the
24 hours, we adjust such probability to allow a very low or nil probability of assignment
during the hours in which the solar generator is producing, as applicable. These two prob-
abilistic profiles for the hourly assignment of supply for the 40% NCRE inclusion scenario
are presented in figure 2.12.
When observing this figure and comparing it with the generation profiles in figure 2.6,
it can be observed that when increasing the NCRE inclusion level, the coal generation
profile is more similar to the probability of assignment for Case 3, hence allowing to have a
larger proportion of the assignment of that technology being covered by its own generation.

45
2 4 6 8 10 12 14 16 18 20 22 240
0.01
0.02
0.03
0.04
0.05
0.06
0.07
hour
pro
babili
ty
Probability assignation profiles
Case 3Case 1
FIGURE 2.12. Hourly assignment probability, Cases 2 and 3
TABLE 2.6. Marketed price by risk aversion (US$/MWh), Case 3
Technology Low Medium HighCoal (20% NCRE) 97.34 114.78 257.84Coal (30% NCRE) 102.08 119.85 263.15Coal (40% NCRE) 107.58 125.68 260.00Solar 89.64 89.64 89.64Wind (20% NCRE) 75.09 90.56 223.07Wind (30% NCRE) 78.00 94.37 233.59Wind (40% NCRE) 81.08 99.37 238.35
In this manner, the bid prices for this case in particular are the ones presented in ta-
ble 2.6, where solar energy can present its most competitive bid in all the cases, namely, its
backed price.

46
It can be observed that there is an important increase in the bid prices both from the
coal and wind technologies, while the solar technology maintains the same bid price inde-
pendent of its risk aversion.
Figures 2.13 and 2.14 show the annual over cost that the solar technology support has
for the LSE under the actual and proposed mechanisms respectively.
−40
−20
0
20
40
60
80
Risk aversion (coal/solar/wind)
L/L
/LL/L
/ML/L
/HL/M
/LL/M
/ML/M
/HL/H
/LL/H
/ML/H
/HM
/L/L
M/L
/MM
/L/H
M/M
/LM
/M/M
M/M
/HM
/H/L
M/H
/MM
/H/H
H/L
/LH
/L/M
H/L
/HH
/M/L
H/M
/MH
/M/H
H/H
/LH
/H/M
H/H
/H
Annual overcost of solar preferences (Actual mechanism)
Annual o
verc
ost
(m
ill U
S$)
20% NCRE30% NCRE40% NCRE
FIGURE 2.13. Annual over cost of the solar supporting scheme for the LSE (Ac-tual mechanism)
In the case of the actual mechanism, it can be observed that there are some scenarios
where the solar technology preference brings savings for the LSE, although mainly there
are over costs. In general these savings are present in scenarios where the wind generator
has low risk aversion and the coal generator has high risk aversion, so coupled with a low
bidding price for the solar generator (which does not have marketing risk) allows the LSE

47
−40
−20
0
20
40
60
80
Risk aversion (coal/solar/wind)
L/L
/LL
/L/M
L/L
/HL
/M/L
L/M
/ML
/M/H
L/H
/LL
/H/M
L/H
/HM
/L/L
M/L
/MM
/L/H
M/M
/LM
/M/M
M/M
/HM
/H/L
M/H
/MM
/H/H
H/L
/LH
/L/M
H/L
/HH
/M/L
H/M
/MH
/M/H
H/H
/LH
/H/M
H/H
/H
Annual overcost of solar preferences (Proposed mechanism)A
nn
ua
l ove
rco
st (
mill
US
$)
20% NCRE30% NCRE40% NCRE
FIGURE 2.14. Annual over cost of the solar supporting scheme for the LSE (Pro-posed mechanism)
to award the auction to the solar and wind generators at a low clearing price. In the case
of favouring the solar technology while using the proposed mechanism, there are only over
costs, but in average they are lower than in the case of the actual mechanism. These over
costs are due to the solar technology preference removing flexibility from the proposed
mechanism, thus limiting its ability to find the best award. From the same figure we can
deduce that the over costs variance is greater in the actual mechanism scenario than in the
proposed one, making more difficult to predict the real effect that a transition to a solar
support scheme of this kind will have. Also, it is worth noting that in this case the over

48
costs or savings that resulted are independent from the solar generator risk aversion, as
from that generator’s perspective there is no marketing risk.
2.5. Discussion
At this point, it is worth mentioning that the developed work in this chapter gave rise
to the article (Marambio & Rudnick, 2017), where the information can be found in a more
concise way. In terms of discussion, this section review two important topics in relation
with the proposed auction.
2.5.1. Arbitrary technology support
In both the first and second simulated cases, the results show a decrease in purchasing
costs for the LSE when the risk aversion of the auction participants is explicitly considered
in the awarding mechanism, which puts in evidence the necessity to consider such variable
in the bidding rules definition for future auctions.
How to include this information in the auction mechanism may vary, but one must
be careful at the time of the design and implementation. For example, in recent energy
auctions conducted in the Chilean system, a portion (15%) of the total energy auctioned
was offered in 3 independent time blocks (hours 23:00 to 07:59, hours 08:00 to 17:59
and hours 18:00 to 22:59), thus allowing technologies whose production profile fit with
any of those blocks to only bid for the particular block, without acquiring the supply risk
of the other blocks. While this is an advance in the sense of giving more flexibility to
the bidders, in reality the situation is not very different from Case 3 of the simulations
presented, where certain technology is supported with a specific profile without worrying
about the increased risk that this decision brings to the rest of the bidders. As we have seen,
this is not necessarily a good decision, whose outcome will depend on the risk aversion of
the participants In this direction, an important policy implication from our work is the
importance to carefully consider all the participants of the auction when designing the
mechanism, because otherwise you can move one step forward and two steps back, getting
suboptimal results for the end consumers.

49
2.5.2. Strategic behavior of the generators
The exercise of market power or strategic behavior from the auction participants would
condition the application of the proposed methodology, and thus we make an analysis of
this issue. In the first place, it is important to notice that the bid structure of the proposed
mechanism allows us to obtain a single offer price for a generator i, as in the following
equation:
pofferi =
Pt pbacki · qBit + pmarki · qMit
qTotali
(2.5)
This price is a function of the backed and marketed price (pbacki and pmarki, offered
by the generator) and the backed and marketed quantities (qBit and qMit , assigned by the
auctioneer). With this in mind, a generator could try to exercise market power exaggerating
either its costs (represented by pbacki) or its risk aversion (represented by pmarki), both of
which would imply offering a greater offer price than its true value. The issue of strategic
behavior by generators has to be analyzed understanding that the proposed mechanism
is a long-term energy auction, where generators offer a quantity and a single price, thus
homologating it with existing long term energy auctions (moreover, being a simplification
of the auctions already present in Brazil and Chile, which are multi-product).
Different references indicate conditions that limit market power exercise in such auc-
tions and suggest approaches to tackle it. A good analysis is presented in the reference
(Arellano & Serra, 2010), where they use a simple model composed of two generation
firms with two available technologies, inserted in a 3 stages game. They tackle the problem
of market power exercised by distorting the choice of the generating technology, assum-
ing that the dispatch is cost based. The main conclusion from their work is that the larger
the proportion of the total demand is auctioned in advance, then the lower are both the
contract prices and the average spot price of energy. The reason for this is that the gen-
erator that wins the auction has an incentive to reduce its energy cost, therefore invest in
baseload capacity, reducing the average spot price. On the other hand, the lower average
spot price leads generators to bid lower prices in the forward auction. Their findings goes

50
with the recommendation to pay attention to the design of the specific auction in order to
mitigate market power and obtain good results, preferring a centralized process (simultane-
ous auctions for all consumers), offering long standing contracts and auction with enough
anticipation to allow for new investors to bid, therefore increasing competition.
Reference (Villar & Rudnick, 2003) makes an assessment of market power in a hy-
drothermal system, and concludes that market power exercise mitigates considerably when
there is an increase in the level of contracting. Further on, they argue that the need of
competing firms to develop long term contracts has an important mitigation effect on their
market power.
Related recommendations are given in (Moreno et al., 2009) where they remark the
importance of designing the auction process in order to lower the entry barriers, increasing
in this way the number of competitors. On the other hand, the awarding mechanism can
play an important role in order to avoid collusion and inefficient allocation. For example the
Brazilian process is a very interesting one, being a hybrid mechanism where a uniform price
first stage is followed by a pay-as-bid negotiation. Finally, from a concrete implementation,
observations of both (Moreno et al., 2009) and (de Souza & Legey, 2010) show that the
auction processes in Brazil have increased competition and lowered prices.
2.6. Conclusions of the chapter
• The increase of economic and variable energy technologies in modern power
systems modifies the electric market dynamics, increasing the level of uncer-
tainty for all the participants in it. Due to this, the decisions that support the
incorporation of such technologies must necessarily include changes in the auc-
tion methodologies used until today, because on the contrary, the costs benefits
from such technologies will not be fully transferred to the end consumers simply
due to a poor assignment process.
• In the case of the short term assigned hourly supply profile, it is necessary to
recognize the capacity of the participants to manage risk, which must be remu-
nerated in an efficient manner.

51
• A new auction mechanism is proposed to represent the short term hourly as-
signment issue in long-term energy auctions. It tries to clearly set out the short
term risk management that the participants must necessarily have to make, and
include that information in a market mechanism. In this sense, the mechanism
requires auction participants to take responsibility for their own profile. Thus,
risk transfers from the renewables to the conventional generators are avoided,
assuming that there is not an intention to subsidize renewables by this mean.
• In the first example for the Chilean system, where all the energy offered is re-
quired to fulfil the LSE requirements, the proposed mechanism could result in
cost savings in the ranges 4.7 80.9, 7.3 90.6 and 12.4 107.3 million US$ for
NCRE inclusion levels of 20, 30 and 40% respectively, compared to the base
mechanism. Likewise, in the case where not all the offered energy is required,
the mechanism could result in cost savings in the ranges 0.6 27.5, 0.8 29.5 and
1.3 30.1 million US$ for the same NCRE inclusion levels. On each one of
these ranges the only thing that varies is the risk aversion of the auction par-
ticipants, which highlights the importance of considering it explicitly as the pro-
posed mechanism does.
• As we mentioned in the Discussion section, in recent auctions of the Chilean
system, a portion of the energy has been auctioned in three different intraday
time windows, adding a level of flexibility to the process. For this reason, the
calculated benefits from the proposed mechanism will probably be less when
compared to this newly implemented method. Nevertheless, the detailed profile
and indifference curves in the proposed mechanism give more flexibility to the
LSE in order to optimize the total allocation.
• In the presented examples, explicitly supporting the solar technology, by favour-
ing its backed energy awarding, brings as a consequence an important increase in
the bid prices of the other technologies, although this does not necessarily imply
an over cost for the LSE. In the context of the actual award mechanism, there are

52
some risk scenarios with cost savings benefits for the LSE given by the solar sup-
porting scheme, but in average they are mainly over costs. On the other hand,
in the context of the proposed mechanism the solar supporting scheme brings
only over costs, although in average they are lower than in the actual mechanism
context.
• The auction cost effects of a transition to a solar technology supporting scheme
like the one considered in Case 3 are more predictable with the proposed award
mechanism, so it could be useful when defining that kind of support policies.
• Regarding the short term risk due to the hourly assignment problem, at the light
of the results it is convenient to explicitly consider the risk aversion of the partic-
ipants in the auction mechanism design without missing the global perspective,
that is to say, to carefully analyse the implications of favouring one technology
over the others.

533. NEW CAPACITY MECHANISM DESIGN TO INCLUDE RENEWABLE TECH-
NOLOGIES
3.1. Background
3.1.1. Adequacy
Inducing an appropriate level of installed capacity in power systems has been a major
issue in order to maintain reliability, specifically corresponding to the concept of “ade-
quacy,” which represents the ability of the system to meet the aggregate power and energy
requirement of all consumers at (essentially) all times (NERC, 2007). In theory, pricing the
energy at the marginal surplus (uniform price) results in investment incentives aligned with
the optimum installed capacity according to centralized planning. This also implies to pay
the VOLL (Value of Lost Load) at times when the load is greater than the installed capac-
ity, because this will be the only income perceived by the most expensive generators (even
though this ”scarcity rents” will also be important to the others generators as well). The
equilibrium in this market design will imply that the net income for all generators must be
zero (considering the annualized investment cost at a certain rate of return), cause if there
were a positive or negative net income in one or more technology, then there would be an
incentive for generators of that technology to enter or leave the market, respectively.
Of course in reality there will be more uncertainty involved in the decision, for exam-
ple the uncertain nature of the demand, but the design assumes that on average the signals
sent by spot pricing will generate the desired output. Even though in theory the market
can rely only on this mechanism to encourage an adequate amount of installed capacity
(ie. energy only markets), in practice in many markets it is insufficient, mainly due to poor
demand response and because concerns about market power induce the regulator to cap
the scarcity price (ie. the missing money problem). In order to overcome the problem,
a capacity complement has been implemented (moreover, additional mechanisms such as
energy auctions have been implemented in developing economies that present a higher per-
ceived risk, where even the above hasn’t worked as expected (Maurer & Barroso, 2011)).
The main mechanisms used as capacity complements roughly fit into two groups, capacity

54
payments (mainly used in Latin America and some European markets) and capacity mar-
kets (mainly used in United States and some European markets). In both groups a reserve
margin target for installed capacity have been traditionally set by the regulator defining an
acceptable numbers of hours of load shedding, without considering the actual value of lost
load (Stoft, 2002). The difference between them is that in the first group a price (payment)
is defined by the regulator in order to encourage a target margin, while in the latter the Load
Serving Entities (LSE) are required to secure the target margin, leaving the price determi-
nation to a market process. Among the two options, the capacity market is the preferred
way in order to achieve the desired target margin (Oren, 2000).
3.1.2. Renewables in adequacy
Another aspect is the increasing level of non-dispatchable technologies such as renew-
ables, that present variability as one of their characteristics. In this sense, traditionally the
concept of adequacy has been associated with the peak load hours of the system, that is to
say where the greatest load is presented. The reason for this is that if load in those hours
can be satisfied with a certain level of confidence, then there would be sufficient capacity
to meet the load for the rest of the hours, since by definition the demanded amount in these
times will be less than in peak hours. While this thought process works in a pure thermal
system, problems begin to arise in systems with high penetration of the aforementioned
technologies.
In this context, is important to reconsider the way that the capacity contribution of each
power plant is measured in relation to the adequacy of the power system. For example, a
power plant might not contribute capacity in peak hours, but that does not necessarily imply
that it will have a null contribution of capacity in the rest of the hours. On the other hand,
the plant could provide capacity in peak hours but not in the remaining hours. In this latter
case, if several plants are in this situation then the hour with the higher risk of load lost
could be different than the one that presents the peak load.

55
In this work we are proposing a capacity market design that considers the renewable
generation dynamics and a valuation of the expected unserved energy (EUE) in the calcu-
lation of the demand curve. The methodology is based on a reserve curve approach such
as the ones presented in (Hogan, 2013) and (MISO, 2005) but used ex ante, before the rel-
evant period (generally a year). It also considers an analytical derivation of the willingness
to pay, which present similarities with (Zhao et al., 2016), where they propose a framework
based on optimization to be used in a multi zonal analysis.
3.2. Mechanism design
We propose a methodology to implement a capacity market to be considered along the
spot price scheme, but unlike actual designs, the goal is to determine a capacity demand
curve that doesn’t rely on an arbitrary capacity requirement made by the regulator, but
instead on a correct valuation of the VOLL. On the other, the design considers the inclusion
of renewable generation at the time of building the curve, in order to intrinsically represent
the dynamics of those technologies in the willingness to pay valuation. The methodology
requires to aggregate the hours of the year in groups, in order to derive a demand bid curve
for each one of them. In this work we are considering 24 groups, representing each one of
them an hour of a representative day of the year (but this also can be done considering more
desagregations such as typical winter days, summer days, etc.). With the demand curve on
each hour of the typical day, a capacity clearing price can be determined as the intersection
of the offer and demand curves, which can be used to value the capacity contribution of
each generator in every hour. With this, the payment to a generator will be based both on
the capacity benefit that the generator contribute to the power system, and the price that the
demand is willing to pay for that contribution. The general methodology for a particular
year is presented in figure 3.1.
After defining the groups of hours, the next step in the methodology is a Monte Carlo
simulation, where a number of random daily scenarios are obtained for the particular year.
With that information we derive an expected capacity demand curve for each hour of the

56
Define groups of hours
Generate load and renew-able generation scenarios
Build capacity demand curves
Calculate clearing price andpayment for each generator
FIGURE 3.1. Methodology block diagram
representative day, meaning the aggregate willingness to pay that the demand would present
for capacity.
3.3. Modeling
3.3.1. System modeling
A key element in the implementation of the methodology refers to a successful mod-
eling of the probability distribution of both the system load and the generation of non-
dispatchable plants in order to obtain the net load, which is the load of the system minus
the production by the non-dispatchable plants.
The fact that renewable power plants are non-dispatchable makes it difficult to know
ex ante if they will be providing useful capacity at times when the system will need them,
however this does not mean that they do not contribute to the reliability of the system.
This issue brings a new challenge, which is to develop new techniques to better predict
their behavior, so that we can have higher levels of certainty as far as power output is
concerned. In order to consider such plants in the proposed methodology, we not only need
an estimate of the probability distribution function of the power plants in consideration,
but a joint probability distribution between that generation and the load. In our case we

57
carry out that task using copulas (Bouye et al., 2007), which correspond to multivariate
probability distributions that allow us to model the probability of the stochastic variable
pair (renewable generation, load) being consistent with historical data.
With this we can obtain a copula for each hour of the day, that describes the joint prob-
ability of load and renewable generation. Then an arbitrary number of scenarios can be
generated, in order to capture the regular scenarios as well as the extreme ones. Figure 3.2
shows a scatter plot between unitary load and renewable generation for historical and sim-
ulated data, both in hour 10 of the day. It can be seen that the simulated data replicated the
behaviour of the input series, presenting the denser area approximately at (0.9 , 0.45).
A similar approach have been used in (Munoz & Mills, 2015) and (Park & Baldick,
2013), where they derive an “empirical copula” through a clustering algorithm, in order
to obtain (wind, load) points to feed a generation and transmission expansion planning
problem respectively.
In order to obtain the different scenarios we are using some data from the Chilean
power system, and only solar and wind technologies are considered as renewables. That
system is extended through several geographic regions, but in our analysis we are con-
sidering that the wind and solar projects are concentrated in two places (SING and north
segment of SIC subsystems). Moreover, even though each wind and solar power plants
have their own hourly profile, for simplicity we will assume that they behave in a similar
way, given the aforementioned geographic concentration. So we’ll use a unique unitary
profile for each technology and scale it according to the renewable scenario. The consid-
ered solar generator is ”Maria Elena” while the wind generator is ”Valle de los Vientos”,
presenting a capacity factor of 31% and 30% respectively.
On the other hand, for the demand we are using the SIC and SING hourly power profile
for the year 2013, scaled up to represent an annual energy demand of 125,558 GWh, which
is a projected demand by the National Energy Comission (CNE) for the year 2030.

58
60 65 70 75 80 85 90 95 1000
10
20
30
40
50
60
70
80
90Load and renewables input data for hour 10
% o
f to
tal r
en
ew
able
pow
er
(MW
)
% of total load (MW)
60 65 70 75 80 85 90 95 1000
10
20
30
40
50
60
70
80
90Load and renewables simulated data for hour 10
% o
f to
tal r
enew
able
pow
er
(MW
)
% of total load (MW)
FIGURE 3.2. Net load histogram and distribution function
Considering that the load and renewable technologies are the elements in the method-
ology that provide the power profile to the system, table 3.1 presents their installed capacity
used in the simulation.
Figure 3.3 shows the daily average profile for both the renewable generators and the
load.

59
TABLE 3.1. Installed capacity by non dispatchable element
Element Installed capacity (MW)Load 17,092Wind 2,000Solar 2,000
2 4 6 8 10 12 14 16 18 20 22 240
0.1
0.2
0.3
0.4
0.5
0.6
0.7
0.8
0.9
1
Hour of the day
Pe
rce
nta
ge
of
ma
xim
um
po
we
r (%
)
Load, solar and wind daily average power profiles
load
solar
wind
FIGURE 3.3. Load, solar and wind daily profiles
It can be seen that the peak demands tend to concentrate towards the hour 22, while
the average peak generation of both renewable technologies presents earlier in the day.
With these time series one can proceed to find the distribution functions on each hour,
as required by the methodology. Even though a parametric function can be used (eg.
Weibull distribution), for this work we chose to fit the distributions with a non paramet-
ric technique, specifically by a Kernel density estimation (Hwang et al., 1994). This kind
of techniques tries to find a distribution only based on the observed data, unlike the para-
metric techniques which tries to estimate parameters for an assumed distribution. In this
work we are fitting a distribution function for the aggregated solar and wind generation,

60
obtaining a distribution representing the total renewable generation. The histograms and
resulting distributions for a specific hour are shown in figure 3.4.
0 10 20 30 40 50 60 70 80 90 1000
20
40
60
80
100
120
140
160
180Load histogram and fitted distribution for hour 10
frequency
% of total load (MW)
0 10 20 30 40 50 60 70 80 90 1000
10
20
30
40
50
60
70
80
90
100Renewable power histogram and fitted distribution for hour 10
frequency
% of total renewable power (MW)
FIGURE 3.4. Fitted distributions for hour 10
It can be seen that the most probable value for the load and renewable generation is
approximately 0.9 and 0.45 respectively for this specific hour, which is consistent with

61
figure 3.2 shown before. In this way, for every hour of the day, 1000 simulated points are
obtained through its fitted bivariate copula.
3.3.2. Demand modeling
The proposed approach tries to explicitly value the benefit that results from the exis-
tence of extra capacity in order to maintain a level of reliability in the system, but unlike
actual capacity market and payments designs, try to make no assumptions about the desires
of the consumers (like the reserve margin promulgated by the regulator). Instead, what it
tries to do is to reflect the benefit that the extra capacity induces in the consumer, so it can
take a decision aligned with the consumer desires. Nevertheless, for this to happen there
has to exist a good valuation of the demand’s VOLL, which in practice does make the ap-
proach somewhat dependent on administrative decisions if the value of VOLL is specified
by the regulator.
In the classic paper (Garver, 1966), a graphical way to get the Effective Load Carrying
Capability (ELCC) of a power plant is presented, which allows the calculation of the load
magnitude that can be added to the power system maintaining the same reliability level.
However, to achieve that, the author derives a number of very interesting mathematical
relationships, one of them being the system loss of load probability as a function of the
reserve capacity. The mentioned function is an exponential equation defined mainly by a
parameter M, which is specific to the analyzed power system.
Specifically, the article proposes the following equation, where P out is the outage ca-
pacity, a0 is the historic outages per hour and y is the amount of reserves that the system
has:
P (P out � y) = a0e�y/M , y > 0 (3.1)
Following this line, we present the development of a formula derived in (Baldick,
2015), and adjusted to be used in the present work. We are considering an hourly resolution,
and assuming that if a loss of load event is present, then it will be present in a fraction ⌧ of
the whole hour, representing the time for the Independent System Operator (ISO) to bring

62
the load online again, assuming that sufficient generation is available. Additionally, the
load loss expectation cannot be smaller than 0 or greater than the load D in the hour, and
will only occur if the outage exceeds the reserve capacity F in the system. With this and
acknowledging that the probability density function of P out is (a0/M) e(�y/M), the load
loss expectation in a a specific hour will be:
E⇥min(D,max(0, P out � F ))
⇤
= 0⇥ P (P out F ) +
Z D+F
F
(y � F ) (a0/M) e(�y/M)dy
+D ⇥ P (P out � D + F ),
=
⇥� (y � F ) a0e
(�y/M)⇤D+F
F+
Z D+F
F
a0e(�y/M)
dy
+
⇥Da0e
((�D�F )/M)⇤,
=
⇥�a0Me((�D�F )/M)
+ a0Me(�F/M)⇤
= M(1� e(�D/M))a0e
(�F/M)
(3.2)
where integration by parts was used in order to solve the integral. Considering this along
the VOLL we can deduce that the expected cost of curtailment on a given hour will be:
E [Cost] = V OLL⇥ ⌧M(1� e(�D/M))a0e
(�F/M) (3.3)
which is dependent on the amount of reserve capacity. We can interpret this expected
cost as minus the expected benefit function of the demand, from where we can obtain an
equivalent demand bid. This demand bid will be equal to the derivative of this benefit
function with respect to F, giving the following result:
demand bid(F ) = V OLL⇥ ⌧(1� e(�D/M))a0e
(�F/M) (3.4)
which is also dependent of the reserve capacity level F. The simulated scenarios will pro-
vide the netload which in conjunction with the assumed conventional installed capacity

63
allow us to obtain the willingness to pay for an extra MW of available capacity on each of
those scenarios.
We are defining the annual reserve margin as the one that is present in the hour of
the year where reserves’ conditions are tightest (ie. the maximum netload hour), and the
reserve curves will be build as a function of this annual reserve margin. Note that for each
assumed annual reserve margin, which is a unique value, there will be an associated profile
of reserve margins corresponding to every other hour of the year (different to that of the
maximum netload), which will be given exclusively by the load and renewable generation
profiles of the power system under analysis. Another aspect is that the formula has to reflect
the issue that load will have to be disconnected from the system in the case that operating
reserves go below a certain threshold (minimum level of operating reserves in order to
maintain security). So anytime the reserves fall below that threshold, the curve has to take
a value equal to the VOLL, which results in the following willingness to pay function:
wtp(F ) =
8><
>:
V OLL F Fmin
demand bid(F ) Fmin F(3.5)
The fixed parameter a0 correspond to the probability of ocurrence of an outage in the
hour, which may be obtained from statistical data and will depend on the power system
under analysis. The last value needed to make the calculation is the parameter M, which
is of great importance because it gives the shape to the function used for the valuation.
The parameter M is a specific feature of the analyzed power system, which in practice may
be determined by statistical or simulation data, the latter can be seen in (D’Annunzio &
Santoso, 2008) where to calculate the value of a slightly different M they used a series of
simulations to generate points in order to fit a curve with exponential relationship. In this
paper we use a rough approximation presented in the original paper (Garver, 1966), which
corresponds to the following equation:
M =
X
g
Pmaxg · routg (3.6)

64
where Pmaxg and routg are the maximum power and forced outage rate (FOR) for the power
plants of the system. At this point it is important to clarify that for the calculation of M
we consider only the thermal power plants, since we assume that renewable power plants
have a negligible rate of unavailability due to mechanical failures, and we consider instead
that their main unavailability source is the weather uncertainty. Moreover, as we consider
the generation from these plants as a negative load, the weather variability is directly rep-
resented in the generated scenarios.
If we define the netload in the maximum netload hour to be ˆD, the annual reserve
margin as ˆF and the netload in hour h of scenario s 2 S as Dsh, then we can obtain the
reserve margin on any hour and scenario F sh as a function of the annual reserve margin
with equation (3.7) using F sh as the independent variable..
F sh =
ˆF + (
ˆD �Dsh). (3.7)
Then we can use equation (3.5) to value the demand willingness to pay on every point
generated on the scenario simulation phase. Moreover, we can build a price curve for every
hour of the representative day through varying the annual reserve margin between 0 and an
arbitrary value. So, if each scenario s of the set S is equiprobable and the set corresponding
to the hour i of the representative day is Hi, then the curve to be used in the hour i of the
representative day as a function of ˆF is:
bidi( ˆF ) =
X
h2Hi
X
s2S
wtp(F sh)
|S| (3.8)
which in essence is the aggregated average willingness to pay of the hours in the group
considering all the scenarios. This will result in a price in [USD/MW-year] to pay for a
MW of available capacity in that hour of the representative day.
With the simulated points of load and renewables, we can obtain the capacity demand
curves for every hour using (3.8). The parameters for the curve are also taken from the
chilean system, having the VOLL and a0 values of 13,230 USD/MWh and 0.285 respec-
tively. As equation 3.6 suggest, the value of M will depend on both the installed capacity

65
and technology mix of the conventional generators present in the system, where the in-
stalled capacity will be equal to the peak net load plus the evaluated reserve margin (ie.
the x axis of the curve). On the other hand, in order to simplify the calculations, we are
assuming that all the conventional generators will have a FOR equal to 5%, sparing us the
need to estimate the technology mix. Additionally, we are assuming that if a lost of load
event occurs, the ISO (Independent System Operator) can bring the load back online in 30
minutes, so the value of ⌧ will be 0.5. Finally, we are considering a value of 500 MW as
the minimum level of operating reserves in order to maintain security. Figure 3.5 shows the
average ± 1 standard deviation of the obtained hourly prices for two reserve margins.
It can be seen that although the profile of both plots are similar, both the average
values and standard deviations are considerable higher when the reserve margin is tighter,
specially around the peak load hours. Applying equation 3.8 to the prices, results in the
curves presented in figure 3.6, where it can be seen that there are considerable differences
in the demand willingness to pay for capacity according to the specific hour of the day.
Also note that the left part of the curves present a non smooth behaviour, which is
exclusively due to the discontinuity introduced by considering a minimum security level
for operating reserves.
3.3.3. Generators modeling
The next step is to determine the capacity that a power plant can contribute to the
system on every hour of the day. For a conventional power plant, the most straightforward
way to do this is to consider the maximum power adjusted by its FOR, to account for the
times when the plant is unavailable to provide power. On the other hand, the capacity
contribution for a renewable plant in an hour could be the maximum power adjusted by its
corresponding capacity factor on that specific hour.
In order to obtain a clearing price on every hour, an offer price at which each generator
is willing to sell its capacity is needed, along the demand curve and the capacity that each
generator can contribute. In this work we are considering that a generator is fully price

66
0 5 10 15 20 25−20
0
20
40
60
80
100
120
140
160
180Average price and standard deviation (reserve level of 1000 MW)
Hour of the day
De
ma
nd
will
ing
ne
ss t
o p
ay
(US
D/M
W)
0 5 10 15 20 25−20
0
20
40
60
80
100
120
140
160
180Average price and standard deviation (reserve level of 4000 MW)
Hour of the day
De
ma
nd
will
ing
ne
ss t
o p
ay
(US
D/M
W)
FIGURE 3.5. Hourly average price
taker, so its offer price will be zero, implying that the market clearing price will only be
determined by the available capacity in the system.

67
0 500 1000 1500 2000 2500 3000 3500 4000 4500 50000
0.05
0.1
0.15
0.2
0.25
Annual demand curve for all hours of the day
Reserve level (MW over max netload)
De
ma
nd
will
ing
ne
ss t
o p
ay
(mill
US
D/M
Wy)
FIGURE 3.6. Capacity price curve for every hour of the day
3.4. Results of the chapter
3.4.1. Capacity valuation comparison
The contributed capacity of a conventional generator won’t be subjected to variability
through the hours, so its capacity offer will be equal in all the hours.
In order to compare the results of the proposed methodology with an existing design,
we defined the simple capacity demand curve shown in figure 3.7 which has been built
according to (FERC, 2013), following the design implemented in NYISO (within its New
York City zone).
In essence this curve has two sections, the first one is a constant value which serves
as a cap to the demand bid equal to 1.5 times the Cost of New Entry (CONE), which is
the annuity of a peaker plant. The second section is a decreasing line defined by its slope
and an arbitrary value at which it cross the x axis. One important issue is that the value of
the function at the target reserve margin (marked with the dotted line) must be equal to the

68
Target Max
1
1.5
Existing curve design
Reserve level (MW over max load)
Ca
pa
city
price
(tim
es
of
CO
NE
)
FIGURE 3.7. Existing curve design
CONE, in order to encourage that reserve margin in the equilibrium. For the comparison
we are assuming that both mechanisms work as intended, that is:
• The traditional curve successfully induces the target reserve margin.
• The proposed curves successfully estimate the demand willingness to pay.
With these assumptions, we will compare the differences in economic surplus of using
one mechanism instead of the other. This is done for different values of both the target mar-
gin and the CONE in the traditional curve, in order to have an idea of the influence of these
parameters. We are considering a CONE of 0.078 million USD/MW, which corresponds
to a diesel turbine in the Chilean system (annualised with a 10% rate of return), along with
the curves derived in the previous sections. For the considered CONE, figure 3.8 shows
the difference in both the producer and consumer surplus when using the traditional curve
instead of the proposed one.
It can be seen that there is a point where the difference in both surpluses is zero. This
point is where the induced target margin equals the consumers desired margin due to the

69
0.05 0.1 0.15 0.2 0.25 0.3−200
−150
−100
−50
0
50
100
150
200
Economic surplus difference (CONE = 0.078 million USD)
Traditional target margin (%)
Tra
diti
onal m
inus
Pro
pose
d s
urp
lus
(mill
ion U
SD
)
consumer surplusproducer surplus
FIGURE 3.8. Economic surplus of traditional curve minus proposed
particular CONE. At lower reserve margins, both the producer and consumer surpluses
are less than what they could have been (ie. less total surplus than the optimum), while
after that point there is an increase in producer surplus at expense of the consumer surplus.
Neither one of these situations is desirable from an economic viewpoint.
Figure 3.9 shows the same difference in consumer surplus for three different values of
CONE (0.5, 1 and 2 times the original value).
Besides that the consumers desired margin is different for the three values, it can be
seen that the greater the CONE value, the greater the surplus loss rate for consumers after
the desired margin, so a traditional curve with a high CONE coupled with a high target

70
0.05 0.1 0.15 0.2 0.25 0.3−350
−300
−250
−200
−150
−100
−50
0
50
Consumer surplus difference for different values of CONE
Traditional target margin (%)
Tra
diti
on
al m
inu
s P
rop
ose
d c
on
sum
er
surp
lus
(mill
ion
US
D)
CONE = 0.039 million USDCONE = 0.078 million USDCONE = 0.16 million USD
FIGURE 3.9. Consumer surplus of traditional curve minus proposed
margin is a bad combination for consumers. The next subsections will present some sensi-
tivities in different inputs of the curve.
3.4.2. VOLL sensitivity
As we mentioned before, a correct valuation of the VOLL is essential to the correct
functioning of the proposed mechanism. In order to measure how much influence this pa-
rameter has, figure 3.10 presents the annual revenue of 1 MW of capacity for three different
values of the VOLL.
The parameter has a considerable effect as expected, with the differences between the
curves decreasing as the reserve margin increases.

71
0 500 1000 1500 2000 2500 3000 3500 4000 4500 50000
0.1
0.2
0.3
0.4
0.5
0.6
0.7
0.8
Annual capacity revenue for 1 MW of capacity
Reserve level (MW over max netload)
De
ma
nd
will
ing
ne
ss t
o p
ay
(mill
ion
US
D/M
Wy)
voll = 9000 USD/MWhvoll = 13000 USD/MWhvoll = 17000 USD/MWh
FIGURE 3.10. Revenue for 1 MW under three VOLL scenarios
3.4.3. Renewable technology mix sensitivity
In order to assess the effect that the renewable technology mix has in the outcome,
we consider sensitivities varying the installed capacities of the solar and wind generators.
Figure 3.11 shows the capacity revenue of 1 MW of capacity both under a ”pure solar”
scenario (5000 MW of solar capacity and 0 MW of wind) and a ”pure wind” scenario (0
MW of solar capacity and 5000 MW of wind).
From the figure we can infer that the hours when the solar is not generating are very
costly for the system when the margin is tight. This is reflected in a higher willingness
to pay for 1 MW of wind capacity when the reserve margin falls below the security level
of operating reserves. On the other hand, compared to the solar generator, the wind peak
generation is nearer to the peak demand of the Chilean system.

72
0 500 1000 1500 2000 2500 3000 3500 4000 4500 50000
0.2
0.4
0.6
0.8
1
1.2
1.4
Annual capacity revenue for 1 MW of capacity
Reserve level (MW over max netload)
De
ma
nd
will
ing
ne
ss t
o p
ay
(mill
ion
US
D/M
Wy)
Solar scenarioWind scenario
FIGURE 3.11. Revenue for 1 MW under two renewable mix scenarios
3.4.4. Renewable technology level sensitivity
As more renewable (non-dispatchable) generation enters the system, the system net-
load will present a more different profile than the original load. To see the impact that this
has on the capacity value we ran two new scenarios, the first one is a ”Low renewable sce-
nario”, where 2000 MW of renewable capacity (half solar and half wind) is in the system.
The second is a ”High renewable scenario”, where a total of 10000 MW of renewable ca-
pacity is installed, in the same proportion as the low scenario. Figure 3.12 shows the result
of this sensitivity.
It can be seen that for the same reserve margin, the demand in the high renewable
scenario presents a lower willingness to pay for capacity. The reason for this is that we
are using the same renewable generation profile on both scenarios, and moreover, both
scenarios present the same maximum netload (equal to the maximum load). With this,
the assumed conventional installed capacity on every point of the curve will be equal on
both scenarios, so in the high renewable scenario we have a higher renewable installed

73
0 500 1000 1500 2000 2500 3000 3500 4000 4500 50000
0.2
0.4
0.6
0.8
1
1.2
1.4
Annual capacity revenue for 1 MW of capacity
Reserve level (MW over max netload)
De
ma
nd
will
ing
ne
ss t
o p
ay
(mill
ion
US
D/M
Wy)
Low renewable scenarioHigh renewable scenario
FIGURE 3.12. Revenue for 1 MW under two renewable level scenarios
capacity plus the same conventional capacity as in the low scenario, giving as a result
the considerable lower overall capacity value. This sensitivity shows the importance of
considering more hours than the peak hour in the process.
3.5. Conclusions of the chapter
• A capacity market design is presented, where the dynamic nature of renewable
technologies is included in the demand curve calculation, and an analytical ap-
proach to the expected unserved energy valuation is used. Additionally, the de-
mand curve derivation only relies on the value of lost load and system parame-
ters, unlike actual designs which depend on a pre determined capacity target.
• With renewables incorporation is important to consider more hours than the peak
one (as we saw in sensibility 3), which could lead to a curve that doesn’t give the
correct incentives.

74
• The proposed design provides a better representation of the demand preferences
than actual designs, and moreover, the representation will continue to improve
as more refined is the value of the VOLL.
• It is worth noting that the topic presented in this article is only one part of the
whole. Another extremely important aspect to consider is the ancillary services
remuneration, especially as more renewables enter into the power system.
• As a future work, it could be useful to differentiate types of offered capacity and
to represent multiple zones in the system.

754. MARKET MECHANISM TO DETERMINE LNG IMPORT VOLUME
4.1. Background
Natural gas has become the fuel of choice for many residential, commercial and indus-
trial applications, becoming an important factor in large economies today.
According to the data presented in (BP, 2014), as seen in figure 4.1, natural gas produc-
tion has increased significantly during the last two decades, reaching a global production
of 3370 billon cubic meters in 2013, with the largest natural gas conventional reserves in
Iran, Russia and Qatar, with a total of 55% of the total world’s reserves.
0
500
1000
1500
2000
2500
3000
3500
1990
1991
1992
1993
1994
1995
1996
1997
1998
1999
2000
2001
2002
2003
2004
2005
2006
2007
2008
2009
2010
2011
2012
2013
Year
Natural gas production by region
Pro
duct
ion (
mill
ion c
ubic
mete
rs)
North America
S. & Cent. America
Europe & Eurasia
Middle East
Africa
Asia Pacific
FIGURE 4.1. Natural gas production by region
On the other hand, as mentioned in (Calvo, 2011), there are also non-conventional
reserves which extraction is relatively new compared with traditional gas, among which
it is possible to find shale gas reserves (gas contained in porous rocks, with significant
amounts found in North America), tight sand gas (gas found in compacted sands, found in
high concentrations in United States, Russia and China), coal bed methane (methane gas

76
in coal beds, with high potential in Asia, Africa and Australia) and gas hydrates (found in
oceans).
Currently, the major natural gas producers correspond to the United States and Russia,
with approximately 20.6% and 17.9% of the global production each one. With equal rank-
ing, the major consumers are the United States and Russia, with 22.2% and 12.3% of the
total.
An important characteristic of this fuel is that due to a high gas production concentra-
tion together with a low importation percentage compared to the total production, there is
not a single global market for this fuel. Therefore, there are several regional and national
markets with different market structures, resulting in a lack of a common price.
4.1.1. Liquefied Natural Gas (LNG)
Liquefied natural gas is natural gas that has been converted into a liquid form after
cooling it up to its condensation point that is at approximately -162� C. In this manner its
volume is reduced approximately 600 times, hence facilitating its storage and transporta-
tion.
As mentioned in (USDOE, 2005), the LNG value chain is made up by four compo-
nents:
• Exploration and production: Natural gas exploration and production is a stage
of high risk and cost for companies, because only 60% of the wells explored
produce gas.
• Liquefaction: In this stage, LNG is subjected to cooling until reaching its liquid
form to later be stored in insulated tanks that are specially designed to maintain
their interior at extremely low temperatures.
• Transportation: During the following step, LNG is transported to different des-
tinations in the world. For such purpose, vessels with specially designed hulls
are used (fleet made up by approximately 362 vessels sailing around the world).
The current designs used are the membrane and spherical engineered vessels.

77
• Storage and Regasification: Then, LNG is subjected to a regasification process
at the destination point, later stored or injected in those market’s gas pipelines.
According to the (IGU, 2014), the international LNG exchange is centered in three
geographic basins:
• Atlantic-Mediterranean Basin: It includes all the countries bordering the Atlantic
and Mediterranean Oceans.
• Pacific Basin: It includes all the countries bordering the Pacific Ocean.
• Middle East Basin: It includes countries as: Bahrain, Iran, Iraq, Israel, Jordan,
Kuwait, Oman, Qatar, Arab Emirates and Yemen.
The global LNG exchange in 2014 amounted to 236.8 million tons and the Middle East
is the most important region in terms of supply with 42% of the total, followed by the Asia
Pacific region with 30% of the total. On the demand side, the Pacific Basin is the most
important one, with Japan and China being leaders in the list.
On the other hand, the LNG transaction prices have big fluctuations depending on the
region, with values that range from 4 US$/mmBtu established by the Henry Hub index and
the 15.3 US$/mmBtu experienced by transaction in Japan.
4.1.2. Natural Gas and LNG in the Electric Sector
The electric power sector is one of the largest natural gas consumers, becoming an
essential driver in the natural gas industry development. This is due to the high efficiency
in energy transformation, lower capital investment and shorter construction time for gas
turbines compared to other types of thermal power stations. In addition, it has benefits
as a low emission “clean energy”, followed by many electric markets around the world,
as mentioned in (Calvo, 2011), where natural gas is considered an important factor when
facing climate change. On one hand, it has lower carbon dioxide content compared to
other fuels such as oil and coal and in turn, there is less fuel required to generate the
same amount of energy. These factors place natural gas as a fuel to be promoted in urban

78
conglomerates and in the industry. In addition to the natural gas benefits per se, this fuel
gives time to allow other alternative energies and new technologies to mature. In this same
direction, gas turbines show high flexibility to accommodate their generation together with
variable technologies such as wind and solar energies, hence allowing complementing the
regulatory measures to drive those renewable technologies that are under way in different
electric markets.
4.1.3. South America Overview
As mentioned in (Barroso et al., 2008), in the 90’s there was a strong increase in
natural gas in the energy mix of different countries in Latin America and gas pipelines
were built between Bolivia and Brazil and between Chile and Argentina, among other
examples. However, during these last years, the strategy has focused more on LNG than
in imported natural gas through gas pipelines. The main reason for this phenomenon have
been (i) gas unbalance (countries with natural gas surplus and deficits have seen LNG
as an attractive manner to eliminate these unbalances), (ii) security (the exchange between
neighbour countries in the region has shown to be untrustworthy, therefore several countries
have seen LNG as a possible solution to diversify their energy dependence), (iii) flexibility
in gas supply (due to the stochastic nature of the large hydroelectric presence in some
countries in the region, flexibility is a valuable asset. In this direction, LNG imports are
deemed to provide more flexibility at a lower cost than building large pipelines, but that is
something that it remains to be seen). That is why since 2009, both Brazil and Chile have
started importing this fuel through the implementation of regasification plants.
4.1.4. Take-or-pay Contracts
Due to the logistic complexity involved in the LNG supply chain mentioned in sec-
tion “Liquefied Natural Gas (LNG)”, the long term sales contracts for that fuel are usually
under a “take-or-pay” mode that strictly implies paying for the entire cargo requested, in-
dependent if it is withdrawn or not. Besides, long term contracts permit to reach better
prices than spot sales. Nevertheless, flexibility can be added in each particular case, with
79
Make Up clauses (gas that is not used in the period can be used in later months), Carry For-
ward clauses (excess of gas consumed can be considered as a credit in future periods) and
Change of Destination clauses (the committed gas can be detoured to another destination),
among others. However, in this work we are considering the strict definition of the take-or-
pay mode, which does not change the core of the problem. The relationship between the
take-or-pay contracts and the power system is not easily established, as described below.
4.1.5. Take-or-pay contracts effect for the LNG importers in the electric system
The Chilean electric market has a central dispatch based on audited costs, where the
participant generators are to report their variable production cost. On the other hand, up
to date, the generation power stations that operate with LNG supplied through take-or-pay
contracts also must follow the norm; namely, they must declare a variable operating cost
that can be corroborated by the system operator. This implies certain inefficiencies in the
market, as presented in (Moreno et al., 2014). Conceptually, when considering a take-or-
pay contract (where it is necessary to pay for all the fuel agreed beforehand, independent
from its utilization), it is evident that once the decision to import is made, the best operation
solution from the systemic viewpoint will be to use all the fuel, because at that moment it
represents a sunk cost. From another viewpoint, at the moment of operation that fuel shows
a nil marginal cost (ie. its total value does not change if 1 MWh more is produced or not).
Additionally, it is possible to consider the storage available in the regasification termi-
nal as a reservoir, which can respond supplying LNG in the short term depending on the
requirements that arise through time.
Considering both the nil variable cost and the storage capacity, the right way to repre-
sent the LNG variable cost would be through a “strategic LNG value” that reflects the real
opportunity cost of using such fuel at any moment in particular.
In this work we will consider the form described above when calculating the electric
market spot prices, because independent from the fact that those elements are not consid-
ered in the Chilean market, we assume that this will change in the medium term.

80
In power systems with high installed hydroelectric capacity whose production presents
stochastic characteristics, an LNG importer is faced to important risks when deciding the
amount of fuel to import through a take-or-pay contract. As observed in figure 4.2, the
operational margin of a power station whose fuel is LNG shows a sudden drop if there is
a total amount of LNG in the system that fully replaces the power stations production that
present higher fuel unit costs.
0 0.1 0.2 0.3 0.4 0.5 0.6 0.7−60
−40
−20
0
20
40
60
80
100
120Aggregated LNG operational margin for two hydro scenarios
LNG capacity factor
Ma
rgin
(m
ill U
S$
)
hydro scenario 1hydro scenario 2
FIGURE 4.2. LNG plants operational margin
Although the magnitude of the values presented in the figure will change depending on
the LNG price or the particular system conditions of the example used, the characteristic
of a drop in the operational margin is maintained.
Conceptually, the drop happens because, as mentioned above, the system’s spot price
(the price that the generators receive for their generation) will be equal to the gas strategic
value, which in this case would be equivalent to a lower unit cost than the LNG cost (ie.
if there is 1 MWh less of electricity produced with LNG, it would be replaced by cheaper
energy).

81
As mentioned in (Moreno et al., 2014), this could be one of the causes for which the
Chilean system’s natural gas generation fleet is being underused, showing a drop of about
26% in its generation during the last 3 years, while on the other hand, the power stations
with higher variable costs are still generating.
To simplify the presentation of this work, we will only consider the uncertainty of the
hydrological variable, because the essence of the proposal presented here can be extended
to any type of uncertainty, such as the uncertainty in the demand and in renewable energy
production (leaving out large hydro), among others.
4.1.6. LNG Importers as insurers
LNG importers whose supply is contracted under the take-or-pay mode are faced with
the system’s uncertainty (in this case, hydrological uncertainty) at the moment in which the
LNG consignment is available for usage. In order to eliminate that uncertainty from the
system, they would be happy if somebody commits to buy their gas at the cost price plus a
delta that reflects their required profitability.
On the other hand, the economic dispatch considers the management of the LNG vol-
ume considering the LNG’s strategic value at the moment of calculating the spot price,
resulting in LNG dispatches always made during the hours with the highest prices (or in
other words, LNG will have a peak shaving function). This implies the following corollary
(if the dispatch is done correctly):
Corollary 4.1. Independent from the system’s operation, 1 MWh produced with LNG
in an hour h receives a spot price that is at least equal to any other MWh produced in
another hour of the period.
This corollary suggests that a generator operating with LNG can provide a service
that supplies the deficits of the generators with supply contracts without risks, and it is the
essence of the mechanism proposals that we are presenting.
Although this is an ideal case, where the economic dispatch will show no uncertainties
within the period, we assume that these uncertainties are reasonable predicted by the ISO.

82
4.1.7. Generators with supply contracts as insureds
Demand in the Chilean market does not have access to the spot market, only gener-
ators have access to it. Therefore, 100% of the demand must have a supply contract. If
we assume that the amount demanded is under contract at a previously defined price, the
system’s short-term operation would only affect the generators in a direct manner, and they
are faced to the spot market movements when complying with their supply contracts.
Under this assumption and considering that LNG can only decrease or maintain the
spot prices, the benefit on deciding for LNG imports will be perceived by all the generators
with supply contracts, while the decision’s cost will impact either the LNG generators if
the imports risk was accepted by them, or by all the generators if a mechanism to socialize
the imports’ cost was used.
Given the fact that all the demand is under contract, generators that have the supply
contracts must provide the consumed energy independent if they are generating at the mo-
ment of consumption or not. For simplicity purposes, we are assuming that all the demand
has a single hourly consumption profile similar to the aggregated demand, therefore a gen-
erator that has the obligation to supply a certain amount of MWh per day could be faced to
the situation that is presented in figure 4.3, where in this case in particular a solar generator
has a “deficit” status between 17:00 and 09:00 hours of the following day, namely, during
these hours, it will have to buy the energy consumed for its contracted demand in the spot
market.
If we assume that they are risk averse, then they would be happy to pay a fair price to
mitigate the spot risk in the hours with deficit.
4.2. Mechanism design
In face of the possibility that the LNG import is being less than desirable from the sys-
temic viewpoint, this work attempts to present a systemic alternative to face the challenge
that it implies to import LNG supply through take-or-pay contracts that present an inherent

83
2 4 6 8 10 12 14 16 18 20 22 240
50
100
150
200
250
300
350
400
450
hour
po
we
r (M
W)
Solar generation an contracted energy profiles for day 1
loadgeneration
FIGURE 4.3. Solar daily generation and supply contract profiles
lack of flexibility, which becomes increasingly more relevant in the absence of developed
secondary markets.
It must be mentioned that although the change in the operation and pricing of the
Chilean electricity market (incorporating the LNG volume management and the price re-
flecting the opportunity cost) could be enough to have an increase in the imported LNG
volume, the spot price could be excessively volatile (depending on the total imported vol-
ume) for an optimal imported amount that is stable through time.
4.2.1. System optimal amount to import
The first question we must ask is which is the optimal amount of LNG to import. In
general terms, the answer would be:
• If the hydrological conditions are favourable for the system (ie. wet hydrology),
then the optimal amount to import would be low, because on the contrary, there
could be a displacement of cheap energy by the LNG.

84
• If the hydrological conditions are unfavourable for the system (ie. dry hydrol-
ogy), then the optimal amount to import would be high in order to replace the
generation from more expensive power stations.
The problem with the former answers is that the realization of the hydrological scenario
is after the imports’ scheduling and decision; therefore such scheduling has a substantial
element of uncertainty.
Defined who assumes the consequences for the LNG imported volume, the next ques-
tion that arises is how is the decision made regarding the magnitude of that volume. In this
sense, according to our judgement, the options are to decide in a centralized manner (deci-
sion made by the regulator or the System Operator), or in a decentralized manner (decision
made by generators, the demand or all the system’s participants), and independent from the
decision maker, such decision should consider the risk aversion of the affected parties (ie.
the generators in this case).
In this work we propose a decentralized but coordinated alternative to make the deci-
sion about how much LNG must be imported.
4.2.2. LNG insurance market
The basis for the proposed mechanism is a market where the LNG importers and gener-
ators with supply contracts trade insurances for the energy that they have to supply without
own generation backing up the commercial transaction. This is based in the corollary 4.1
and prevents the generator with contract to face the spot risk.
In principle this market would require each buyer and seller (ie. generator and LNG
importer) to submit a price and a quantity in order to let the market be cleared in the
point where the total surplus is maximized. However, the offers and thus the outcome of
this market will be heavily influenced by the total amount of LNG present in the system,
because for example, a higher amount will imply lower spot prices, so the generators will
be reluctant to offer high prices for the insurance. For this reason, we are proposing that
instead of offering a quantity and a price, each participant offers quantity and price curves

85
as functions of total imported LNG. With this information, the total LNG quantity to import
and its price will be added as a variable in the problem which maximises the total surplus.
For the rest of the work we are considering that the LNG volume that is traded refers
to LNG already produced as energy, so it unit will be MWh.
4.2.3. Bids structure
The mechanism proposed requires the generators and LNG importers to submit pur-
chase and sale bids respectively in order to have information about all the stakeholders at
the moment of making a decision.
The LNG importers (insurers) bids will be made up by the following elements:
• Price of the LNG to be imported.
• Volume of LNG available for import.
where the offered price will depend both on the real cost of the fuel and on the importer’s
profitability expectations.
On the other hand, the generators (insureds) bids will be made up by the following
elements:
• Offer price curve as a function of the total imported LNG volume
• Offer volume curve as a function of the total imported LNG volume
In this case, the prices and volumes offered will depend both on the generator’s expec-
tation regarding the system’s operation and on its risk aversion. The fact that the generators’
bids are in function of the total imported LNG volume avoids any speculation by the partic-
ipants in this regard, allowing the participants to make their best bids, being more beneficial
for the system.
4.2.4. Awarding of the auction
The auction coordinator must award the following:
• Total volume of LNG to be imported

86
• Uniform transaction price of the unitary insurance
• Awarding of the imported LNG volume among the participants to be used as
insurance
in order to maximize the total surplus, where the problem to be solved will be the
following:
max
Q,qs,qd
X
d
pd(Q) · qd �X
s
ps · qsX
s
qs = Q
0 qs qmaxs 8s 2 S
0 qd qmaxd 8d 2 D
(4.1)
where
Q total volume of LNG to import
qs importer s awarded LNG volume to import
qd generator d awarded LNG volume to use as insurance
ps importer s ask price
pd generator d bid price
Note that the problem presented corresponds to a general formula that does not exactly
detail the bid functions. It can be seen that the objective function contains a non-linear
term, however, the level of difficulty in the problem solution will be given by the detail of
the functions requested from the participants.
4.3. Modeling
We attempted to make an estimate of the impact that this proposed mechanism could
have compared to a centralized decision on the volume of LNG to be imported, which does
not adequately consider the system’s participants risk aversion.

87
4.3.1. System modeling
Clearly, the participants’ perception of the spot market risk will depend on the system’s
configuration in the period in question, both in terms of the generation technologies mix
and the demand. Although we assume a deterministic demand, we considered a set of 57
possible hydrological scenarios, which are considered as the only source of uncertainties in
our simulations. We try to reproduce a system with the Chilean electric system character-
istics; therefore we considered the information contained in the October 2014 Government
Nodal Price Report. This is a biannual report prepared by the Chilean Energy Commission,
which presents various estimates of the level of demand, fuel prices and expansion of the
generation infrastructure and the transmission system, and simulations are made to obtain
an estimate of the expected spot prices. Using this information, we considered a simplified
version of the Central Interconnected System (SIC), one of the two major systems in Chile,
and it is precisely the one that is affected by the hydrological variable. In particular, we are
using the information estimated for the month of August of 2018. In relation to the physical
configuration of the system, we are making the following assumptions and simplifications:
• All the hydraulic power stations are considered as run-of-river power stations
(in the Discussions section we explain the effects of considering reservoir power
stations).
• The aggregated installed power was maintained for each technology, however,
the number of power stations was modified in order to homogenise the maximum
power of the stations belonging to each technology.
• A deterministic demand is considered.
• A hydrological uncertainty represented by 57 possible hydrological scenarios is
considered.
On the other hand, in relation to the commercial configuration of the system, we are
considering the following assumptions and simplifications:
• We assume that each power station belongs to an independent generation com-
pany.

88
TABLE 4.1. Installed capacity by technology
Technology # of generators Installed capacity (MW)LNG 10 2760Coal 10 2299Diesel 25 2544Biomass 3 222Other thermal 5 362Hydro 12 4131Solar 4 818Wind 4 777
• The supply contracts with the demand were assigned to each generation company
according to the energy generated by each one of them in the average hydrolog-
ical scenario.
• It was considered that all supply contracts have the same hourly profile corre-
sponding to the actual SIC demand during the month of August of 2013.
• We assume that no generator by itself can influence the total LNG volume to be
imported, therefore they behave as “volume takers” when calculating their bids
(the relaxation of this assumption will be reviewed in the Discussion section).
In this manner, the generation capacity in the system is defined as observed in table 4.1,
while figure 4.4 shows the duration curve for the period’s demand, which amounts to 59,878
GWh.
From the table, it is concluded that the total installed capacity of the system is 13,913
MW, which involves a surplus capacity of approximately 62% with respect to the maximum
demand that we assume in 8,564 MW. However, we must consider that the installed capac-
ity corresponds to the maximum and does not consider the specific hydrological scenario
that could take place.
4.3.2. LNG Importers modeling
For our simulations we assume that the LNG importers are generation power plants
that operate with that fuel in order to focus on the core of the problem and prevent entering
into the problem caused by a negotiation between an LNG importer and an LNG power

89
0
1000
2000
3000
4000
5000
6000
7000
8000
9000
Sys
tem
load (
MW
)
hours
System load duration curve
FIGURE 4.4. System load duration curve
station, something that is briefly mentioned in the Discussion section. Moreover, the LNG
importers offers doesn’t depend on system conditions, and will be based only in the cost of
the fuel and a profitability expectation. Given the fact that an LNG importer i will charge a
unit price that returns its purchase cost plus a delta ⇡ that reflects its required profitability,
it will have a bid price as shown in the next equation:
pi(qLNG) = costi(qLNG) + ⇡i (4.2)
We assume that the cost has a linear relationship with respect to the imported amount
qLNG. This corresponds to a simplification, because probably the LNG importer will have
access to better supply prices if the imported volume is higher, however that assumption
does not change the conclusions of this work.
In this manner, the bid will consist of a maximum LNG volume to be imported and a
sale price.
90
• Volume to be imported: We assume that each LNG power plant offers a maxi-
mum volume equivalent to the maximum production that its power station could
generate (which in total corresponds to the 2760 MW mentioned in table 4.1).
• Sale price: To represent the differences that could exist in import prices, either
due to the access to different conditions in the LNG contracts or due to various
profitability expectation, we considered a random price from a uniform distribu-
tion in the range of [60, 150] US$/MWh.
Note that we are assuming that importers are not faced to any risk because they sell
their production in an anticipated manner, knowing that as the LNG volume is imported, a
sunk cost of its energy will be definitely generated.
4.3.3. Generators modeling
The offers of the generators will depend on the system conditions, because the value
of the insurance for which they are offering will reflect depend on the spot price. In this
case, the bid will consist on an insurance price and a volume curve, both in function of the
total volume of LNG to be imported.
Given an insured quantity q, and considering a set of hydrological scenarios S and a
total LNG volume QLNG in the system, the price that a generator with contract would be
indifferent to pay for a unitary insurance (and thus any price below that will imply a benefit
for the generator) will be:
pI(QLNG) =
Ps2S probs[ p
spots ·min(qDEF
s , q)]
q(4.3)
Which depends on the expected spot price pspots and the contracted quantity qDEFs that
the generator will have to buy in the spot market. For this work we consider an approach
similar to that of the Conditional Value at Risk (Uryasev, 2000) for every generator, de-
termining the offered quantity q as the average value of the worst case scenarios given the
generator risk aversion. Moreover, this same approach is used to obtain the probability
probs of each hydrologic scenario.

91
In the simulations, three systemic risk aversion trends are considered. These trends
direct the expected value of the generators’ risk aversions, but we allow a spread to reflect
the resulting natural diversity in a more realistic manner.
These trends are low, medium and high, and for each one of them we prepared 100 real-
izations for the set of generators that make up the system. The generated random numbers
come from a Beta distribution with parameters A and B of (2.8), (2.2) and (8.2) respec-
tively, with which we obtained a representative spectrum for each systemic trend as shown
in figure 4.5.
Generators risk aversion histogram (3 cases)
0 0.2 0.4 0.6 0.8 10
20
40
60
80
100
120
140
160
180
Risk aversion (high)0 0.2 0.4 0.6 0.8 1
0
20
40
60
80
100
120
Risk aversion (medium)0 0.2 0.4 0.6 0.8 1
0
20
40
60
80
100
120
140
160
180
200
Risk aversion (low)
FIGURE 4.5. Generators risk aversion histogram
From the figure it can be concluded that in each case the trend is represented without
sacrificing the spread that could be obtained in reality. With this information, the price bid
and quantity curves are obtained as seen in figure 4.6 and figure 4.7 for coal-fired generators
in the case of medium systemic trend. In the case of the price curves it is possible to note
that after a certain volume of imported LNG the prices tend to be low and uniform, which
is due to the strategic price of the LNG reflecting the spot prices given by baseload power
plants. The exact point at which this happens will depend on the risk aversion of the
particular generator.
On the other hand, it is observed that the energy requested by coal-fired power stations
increases as there is more LNG in the system, because there will be scenarios where the
LNG generation will displace the coal generation, but still those generators will need to

92
0 0.1 0.2 0.3 0.4 0.5 0.6 0.730
40
50
60
70
80
90
100
110Price curves of the coal generators
Off
er
price
(U
S$
/MW
h)
LNG capacity factor
FIGURE 4.6. Price curves of the coal generators
fulfill their supply contracts. Again, the magnitude of that amount will depend on the risk
aversion of the specific generator.
4.4. Results of the chapter
Two simulations were done. The first one is an implementation of the full mecha-
nism presented before, that is using the insurance market to determine the total volume
of LNG to import. The second simulation corresponds to a special implementation where
the insurance market is used as a support mechanism for Non Conventional Renewable
technologies.
4.4.1. System total amount to import
Figure 4.8 presents the total surplus for every simulation in the medium risk aversion
trend, as a function of the imported LNG level. Note that in the chart the total volume of

93
0 0.1 0.2 0.3 0.4 0.5 0.6 0.70
20
40
60
80
100
120
140
160
Quantity curves of the coal generators
Off
er
qu
an
tity
(GW
h)
LNG capacity factor
FIGURE 4.7. Quantity curves of the coal generators
imported LNG is expressed as the capacity factor of the installed capacity of LNG power
stations.
In this direction, figure 4.9 presents the obtained total surplus from each systemic trend
as a function of the imported LNG level. First, it can be observed that for each systemic
trend a different LNG volume that maximizes the total surplus is obtained. Specifically, the
maximum expected value of the total surpluses is obtained when in the system there is an
LNG volume that is equivalent to a capacity factor of 24, 38 and 44% for the low, medium
and high risk aversion trends, respectively.
It must be mentioned that although the charts emphasize the averages, actually the
mechanism will make the decision based on the exact realization, ensuring that the decision
is the optimal one according to the actual risk aversion of the participants.
Figure 4.10 shows the average “excessive cost” that it would imply for the participants
to make a centralized decision without correctly considering their risk aversion in each
case.

94
0 0.1 0.2 0.3 0.4 0.5 0.6 0.70
50
100
150Total surplus for 100 simulations (Case 2)
To
tal s
urp
lus
(mill
US
$)
LNG capacity factor
average total surplus
FIGURE 4.8. Total surplus as a function of imported LNG volume (medium riskaversion case)
It can be observed that for all the cases of systemic trends, small deviations in the
capacity to import create considerable excessive costs for the system, especially in the case
where the participants show higher risk aversion, where in extreme cases they can reach
expected values in the order of 146 million US$.
4.4.2. Special case as renewables support
The idea behind this simulation is to show a simplification of the mechanism that can
be used to support some kind of technology, in this case the non conventional renewable
ones. In this particular example we are assuming that the implementation of the insurance
market is small in comparison with the whole system, so the imported LNG volume will
not affect the system total quantity (fixed as a capacity factor of 30%) in a significant
manner. Moreover, the only generators participating as buyers (or insureds) are wind and
solar power plants (5 of each technology, each one with a capacity of approximately 150
MW).

95
0 0.1 0.2 0.3 0.4 0.5 0.6 0.70
50
100
150Average total surplus for the 3 cases
To
tal s
urp
lus
(mill
US
$)
LNG capacity factor
low risk aversionmedium risk aversionhigh risk aversion
FIGURE 4.9. Average total surplus as a function of imported LNG volume
On the other hand, the LNG importer is only one power plant of 500 MW, with an
offer price of 97 US$/MWh. Figure 4.11 shows the resulting offer prices for the three risk
trends.
On the other hand we are assuming that the NCRE power plants have priority in the
dispatch independent of the hydrologic scenario, so the risk aversion doesn’t influence the
offered quantity which are approximately 15 and 11 GWh for each wind and solar plant
respectively.
Figure 4.12 presents the total surplus of the example.
It can be seen that the expected total surplus vary approximately between 9 and 22
million US$ depending of the risk trend, which could be a significant help for these kind
of technologies.

96
0 0.1 0.2 0.3 0.4 0.5 0.6 0.70
50
100
150Centralized decision overcost for the 3 cases
Ove
rco
st (
mill
US
$)
LNG capacity factor
low risk aversionmedium risk aversionhigh risk aversion
FIGURE 4.10. Centralized imported volume decision over cost
NCRE offer price histogram (3 cases)
100 150 200 250 3000
100
200
300
400
500
600
700
800
offer price [US$/MWh] (high)100 150 200 250 3000
50
100
150
200
250
300
offer price [US$/MWh] (medium)100 150 200 250 3000
50
100
150
200
250
300
offer price [US$/MWh] (low)
FIGURE 4.11. Offer prices in the NCRE market
4.5. Discussion
In this section we offer a qualitative analysis about some issues that influence the mech-
anism and that are relevant to comment.

97
NCRE surplus histogram (3 cases)
0 5 10 15 20 250
5
10
15
20
25
30
35
40
45
surplus [mill US$] (high)0 5 10 15 20 25
0
5
10
15
20
25
30
35
40
surplus [mill US$] (medium)0 5 10 15 20 25
0
10
20
30
40
50
60
surplus [mill US$] (low)
FIGURE 4.12. Total surplus in the NCRE market
• Centralized v/s decentralized: The essence of the problem we are trying to solve
is the decision to centralize or decentralize, or simply said, up to what point we
decentralize. This is a very broad and influencing issue, even becoming the issue
that is behind the electric markets’ liberalization. In the area of the LNG volume
to be imported, it is important to consider which is the objective we are trying to
achieve. In principle, such objective should be to allow the system to operate at
a minimum total cost. However, given the uncertainty, it is not possible to make
an ex ante decision of that type in a definite manner. Given this, the objective
should be to allow the system to operate at a minimum total cost considering
that there is a set of beliefs with respect to the future. However, there is the key
question, which is the set of beliefs that best represents the system’s participants
(assuming that is what we want to represent). The mechanism proposed in this
work tries to directly represent the system’s participants. However, a centralized
mechanism as the one by (Moreno et al., 2014), that tries to represent the partic-
ipants is also a valid mechanism that can even be preferred in cases where there
are difficulties to coordinate the participants or in the presence of strong mar-
ket power among others. Of course, such centralized mechanism can be used as
an intermediate step to reach the decentralized mechanism, or rather, a mix of
both. In case a decentralized alternative is chosen, special consideration must be
given when choosing the decision criteria to make these criteria transparent and

98
open for the entire system. Finally, regardless if the mechanism is centralized or
decentralized, if it is recognized that the LNG import can bring benefits for the
system, it can be convenient to have an explicit support from the authority in the
steps required for the importation itself, such as the formalities required, taxes
and coordination, among others.
• Market power: In this work we are considering the assumption that no genera-
tor by itself can influence the total volume of LNG to import, behaving in this
manner as a “total volume taker”. This premise of perfect market is necessary to
align the individual incentives of the participants with the system’s benefits max-
imization. However, actually it might happen that this assumption is not fulfilled
100%, even more considering that several power stations can belong to a same
generation company. Although this is beyond the scope of this work, we must
mention that this is not a minor issue that must be specially considered when
implementing the mechanism, either adopting measures to promote competition
and also initially to somehow intervene the generation companies’ bids that are
misusing the proposed mechanism. On the other hand, not only the demand
(ie. the generation companies) could be exerting some market power, because it
might also be exerted both by the LNG importers and by the owners of infras-
tructure required for the import of LNG. As a future task, it would be interesting
to understand to what extent the existence of market power could affect volumes
and prices and which concrete measures could be used to prevent the application
of that power.
• LNG economic dispatch: In practice, the economic dispatch within a period can-
not manage the LNG volume in a 100% optimal manner, because there will be
some differences with the optimal given by uncertain events such as failures, pro-
jected demand variation and weather events, among others. Among the effects
of this, there could be an hour within the period with absence of LNG genera-
tion, but with prices higher than when there is LNG generation (in this manner
not fulfilling corollary 4.1), resulting in losses for the LNG importer. However,

99
if most of the volume management and spot price fixation by the system opera-
tor is correct, the mechanism should work, because those differences would be
minor with respect to the total.
• Ownership of the LNG power stations: In the simulations of this work we are
assuming that the owners of the LNG power stations are the ones that act as
LNG importers. In case that is not the fact, it would be necessary to make both
parties reach a previous agreement to allow the mechanism to work, something
that could be carried out through another mechanism similar to the one proposed.
• Hydro reservoirs: In this work reservoir power stations are represented as run-
of-river power stations. Despite this is a simplification, it does not affect the
conclusions of the work. In essence, there is no difference between the dispatch
of a water reservoir and an LNG power station with a take-or-pay contract, ex-
cept that in general a large reservoir will have an enhanced regulation capacity,
allowing displacing its generation to later periods, while the LNG “reservoir”
has the restriction of using all of its fuel within the period. For this reason, if
you look at the period as a whole, the LNG power station will have priority in
the dispatch before the water reservoir (not valid in the cases where there is an
exceptional abundance of water resources). Additionally, this could give rise to
ingenious mechanisms such as the Virtual Storage used in Brazil, described in
(Barroso et al., 2008) and (Rudnick et al., 2014), that, briefly explained, implies
using large water reservoirs as means to keep an “energy credit” from one period
to the next one by LNG power stations with take-or-pay contracts.
• NCRE support: As stated in the special implementation for supporting NCRE
technologies, the essence of the mechanism can be used as an alternative way to
support specifics technologies. In this case, it could be useful for the regulator to
assume a leading role, providing facilities for the LNG importers or even more
using state owned power plants as LNG importers.

100
4.6. Conclusions of the chapter
• The incorporation of LNG contracts under the take-or-pay mode in the power
system results in the need to modify the methodologies to carry out the economic
dispatch and also the position to be adopted in face of the volume of LNG to be
imported in order to bring benefits for the entire system.
• In the case of the decision about how much volume of LNG to import, it must be
recognized that due to the inherent uncertainty of the process, the optimal will
depend on the risk aversions of the system’s participants, therefore it is important
to somehow incorporate that variable in the decision methodology.
• A decentralized but coordinated mechanism was proposed to decide the mag-
nitude of the LNG volume to be imported. In essence, the mechanism tries to
reveal the participants’ risk aversions for the different levels of possible imports
and includes that information in a market structure to maximize the total surplus.
• Simulations were made under the context of the Chilean electric market assum-
ing three systemic risk aversion trends among the participants. It can be observed
that the optimal amount to be imported strongly depends on the participants’ risk
aversions and that the mechanism is more valuable for the system as more risk
averse are the participants.
• From the simulations it can be concluded that arbitrarily fixing an LNG volume
to be imported without correctly considering the participants’ risk aversions can
result in excessive costs, and that depends on how far the fixed volume is from
the optimum and on the risk aversion level of the participants.
• When doing the specific implementation of the mechanism, apart from deciding
the level of decentralization looked for, special care must be placed on imple-
menting a correct methodology for the economic dispatch of the LNG power
stations with take-or-pay contracts and also the possibility to exert market power
by any of the participants must be considered. The idea is to take advantage of
the benefit of this market mechanism preventing potential implementation fail-
ures.
101
• A special implementation of the mechanism was suggested as a mean to support
NCRE technologies, where the total surplus for the participant NCRE generators
range approximately between 9 and 22 million US$.

1025. CONCLUSIONS
This thesis has developed market mechanisms in three areas of the generator sector, in
order to better cope with the new challenges that the large scale inclusion of variable tech-
nologies brings to the system. Within chapters 2, 3 and 4, this work designs, implements
and models market mechanisms for the areas of Energy, Capacity and Security within the
generator sector in order to measure and compare the results of their application with re-
spect to other mechanisms that have the same purpose. Those chapters also presented
detailed conclusions and future work related with the content within each chapter.
The findings of this dissertation can be summarized in 3 points:
(i) A better allocation of risk between the participants of the long term energy auc-
tion allows the demand to obtain a lower purchase cost
(ii) A better representation of the demand in the capacity market creates incentives
for an installed capacity in line with demand preferences, allowing higher levels
of total surplus
(iii) To consider the risk coverage capability that the LNG has for market participants,
allows the import of a LNG volume that maximizes the total surplus
Considering these points, we can state the main conclusion of the research: Within a
renewable environment, improving the agents preferences representation in market mech-
anisms, for the generation sector, allows the system to obtains better performances in the
areas of Energy, Capacity and Security.
It is worth mentioning that the work considered the implementation of each mech-
anism alone, that is, without considering the interaction with the other two mechanisms
at the same time. For example, the capacity mechanism could have an effect on the per-
ceived risk by the generators, what in turns could affect their offer prices in the energy
auction mechanism. Nevertheless, each mechanism on its own has a positive effect in the
total surplus of the market, so we can infer that the aggregated effect of implementing the
three mechanisms at the same time will also be positive in terms of total surplus, although

103
possibly at a different level and considering a different surplus distribution between the
consumers an producers.

104
REFERENCES
Arellano, S., & Serra, P. (2010). Long-term contract auctions and market power in
regulated power industries. Energy Policy, 38(4), 1759-1763.
Ausubel, L. M., & Cramton, P. (2010). Virtual power plant auctions. Utilities Pol-
icy, 18, 201-208.
Baldick, R. (2015). Restructured electricity markets: Locational marginal pricing.
Retrieved from http://users.ece.utexas.edu/
˜
baldick/classes/
394V/EE394V.html
Baldick, R., Park, H., & Lee, D. (2011). Augmented screening curve analysis of
thermal generation capacity additions with increased renewables, ancillary services,
and carbon prices. Carbon Prices, Univ. Texas.
Barroso, L. A., Rudnick, H., Mocarquer, S., Kelman, R., & Bezerra, B. (2008). Lng
in south america: the markets, the prices and the security of supply. In Power and
energy society general meeting - conversion and delivery of electrical energy in the
21st century (pp. 1–6).
Boiteux, M. (1960). Peak-load pricing. The Journal of Business, 33(2), 157–179.
Bouye, E., Durrleman, V., Nikeghbali, A., Riboulet, G., & Roncalli, T. (2007, No-
vember 26). Copulas for Finance - A Reading Guide and Some Applications. So-
cial Science Research Network Working Paper Series. Retrieved from http://
ssrn.com/abstract=1032533
BP. (2014). Statistical review of world energy (Tech. Rep. No. 63 Edition).
Calvo, E. (2011, February). El gas natural, un puente hacia 2030 para frenar el
cambio climatico. Petrotecnia, 53(1).

105
Chacon, L. (2013). Long-term contracting the way to renewable energy investment:
Lessons from brazil applied to the united states. Emory Law Journal, 62(6), 1563-
1612.
Chen, H. (2016). Power grid operation in a market environment: Economic effi-
ciency and risk mitigation. John Wiley & Sons.
Chilean Senate. (2010). Propicia la ampliacion de la matriz energetica, mediante
fuentes renovables no convencionales - proyecto de ley 7201-08.
Ciarreta, A., & Espinosa, M. P. (2012). The impact of regulation on pricing behav-
ior in the spanish electricity market (2002–2005). Energy Economics, 34(6), 2039–
2045.
CNE. (2016). Energıa 2050, polıtica energetica de chile (Tech. Rep.). Comision
Nacional de Energıa.
Cramton, P. (2006). New englands forward capacity auction. In Working paper.
Cramton, P., & Stoft, S. (2005). A capacity market that makes sense. The Electricity
Journal, 18(7), 43–54.
D’Annunzio, C., & Santoso, S. (2008, June). Noniterative method to approximate
the effective load carrying capability of a wind plant. Energy Conversion, IEEE
Transactions on, 23(2), 544-550. doi: 10.1109/TEC.2008.918597
del Rıo, P., & Linares, P. (2014). Back to the future? rethinking auctions for renew-
able electricity support. Renewable and Sustainable Energy Reviews, 35, 42–56.
de Souza, F. C., & Legey, L. F. L. (2010). Dynamics of risk management tools and
auctions in the second phase of the brazilian electricity market reform. Energy Policy,
38(4), 1715-1733.
106
FERC. (2013). Centralized capacity market design elements (Tech. Rep.). Federal
Energy Regulatory Comission.
Garver, L. (1966, Aug). Effective load carrying capability of generating units.
Power Apparatus and Systems, IEEE Transactions on, PAS-85(8), 910-919.
Glimcher, P. W., & Fehr, E. (2013). Neuroeconomics: Decision making and the
brain. Academic Press.
Hobbs, B., Hu, M.-C., Inon, J., Stoft, S., & Bhavaraju, M. (2007). A dynamic anal-
ysis of a demand curve-based capacity market proposal: the pjm reliability pricing
model. IEEE Transactions on Power Systems, 22(1), 3–14.
Hobbs, B., Inon, J., Hu, M.-C., & Stoft, S. (2005). Capacity markets: review and a
dynamic assessment of demand-curve approaches. In Ieee power engineering society
general meeting, 2005 (pp. 514–522).
Hogan, W. (2013). Electricity scarcity pricing through operating reserves. Econom-
ics of Energy & Environmental Policy, Volume 2(Number 2).
Hogan, W., et al. (2012). Electricity scarcity pricing through operating reserves: An
ercot window of opportunity. Harvard University. Cambridge (MA).
Hwang, J.-N., Lay, S.-R., & Lippman, A. (1994, October). Nonparametric multivari-
ate density estimation: A comparative study. Trans. Sig. Proc., 42(10), 2795–2810.
doi: 10.1109/78.324744
IEA. (2016). World energy outlook 2016 (Tech. Rep.). International Energy
Agency.
IGU. (2014). World lng report (Tech. Rep. No. 2014 Edition). International Gas
Union.
107
Joskow, P. (2013). Symposium on “capacity markets”. Economics of Energy and
Environmental Policy, 2(2).
Linklaters. (2014). Capacity mechanisms. reigniting europe’s energy markets (Tech.
Rep.). Linklaters LLP.
Marambio, R., & Rudnick, H. (2017). A novel inclusion of intermittent generation
resources in long term energy auctions. Energy Policy, 100, 29-40.
Maurer, L. T., & Barroso, L. A. (2011). Electricity auctions, an overview of efficient
practices (Tech. Rep.). The World Bank.
MISO. (2005, November). An energy-only market for resource adequacy in the mid-
west iso region (Tech. Rep.). Midwest Independent System Operator.
Moreno, R., Barroso, L. A., Rudnick, H., Mocarquer, S., & Bezerra, B. (2010). Auc-
tion approaches of long-term contracts to ensure generation investment in electricity
markets: Lessons from the brazilian and chilean experiences. Energy Policy, 38(10),
5758–5769.
Moreno, R., Bezerra, B., Barroso, L. A., Mocarquer, S., & Rudnick, H. (2009).
Auctioning adequacy in south america through long-term contracts and options: from
classic pay-as-bid to multi-item dynamic auctions. In 2009 ieee power & energy
society general meeting (pp. 1–8).
Moreno, R., Matus, M., Flores, A., & Puschel, S. (2014, December). Analisis eco-
nomico del despacho electrico con contratos de suministro de combustible gnl take
or pay (Tech. Rep. No. 1). Centro de Energia - Universidad de Chile.
Munoz, F. D., & Mills, A. D. (2015). Endogenous assessment of the capacity value
of solar pv in generation investment planning studies. Sustainable Energy, IEEE
Transactions on, 6(4), 1574–1585.

108
Nelson, T., Reid, C., & McNeill, J. (2015). Energy-only markets and renewable
energy targets: Complementary policy or policy collision? Economic Analysis and
Policy, 46, 25–42.
NERC. (2007). Definition of adequate level of reliability (Tech. Rep.). North Amer-
ican Electric Reliability Corporation.
NYISO. (2016). Installed capacity manual (Tech. Rep.). NYISO Capacity Market
Products.
Oren, S. (2000). Capacity payments and supply adequacy in competitive electricity
markets. Sepope, May.
Park, H., & Baldick, R. (2013, Aug). Transmission planning under uncertainties of
wind and load: Sequential approximation approach. Power Systems, IEEE Transac-
tions on, 28(3), 2395-2402.
Phillips, D., Jenkin, F., Pritchard, J., & Rybicki, K. (1969). A mathematical model
for determining generating plant mix. Proceedings of the Third IEEE PSCC.
PJM. (2016). Pjm capacity market (Tech. Rep.). PJM Capacity Market Operations.
Porrua, F., Schuch, G., Barroso, L., Street, A., Junqueira, M., & Granville, S. (2005).
Assessment of transmission congestion price risk and hedging in the brazilian elec-
tricity market. In International symposium cigre/ieee pes, 2005. (pp. 69–76).
REN21. (2014). The first decade: 2004-2014 (Tech. Rep.).
Rudnick, H., Barroso, L., Cunha, G., & Mocarquer, S. (2014). A natural fit. IEEE
Power & Energy Magazine, 12(6), 29 - 39.
Rudnick, H., & Mocarquer, S. (2006). Contract auctions to assure supply adequacy
in an uncertain energy environment. In 2006 ieee power engineering society general
meeting (pp. 4–pp).

109
Sensfuss, F., Ragwitz, M., & Genoese, M. (2008). The merit-order effect: A detailed
analysis of the price effect of renewable electricity generation on spot market prices
in germany. Energy policy, 36(8), 3086–3094.
Stoft, S. (2002). Power system economics. Wiley-IEEE Press.
Tong, J. (2004). Overview of pjm energy market design, operation and experience.
In Electric utility deregulation, restructuring and power technologies, 2004.(drpt
2004). proceedings of the 2004 ieee international conference on (Vol. 1, pp. 24–27).
Uryasev, S. (2000). Conditional value-at-risk: Optimization algorithms and applica-
tions. In Computational intelligence for financial engineering, 2000.(cifer) proceed-
ings of the ieee/iafe/informs 2000 conference on (pp. 49–57).
USDOE. (2005). Liquefied natural gas: Understanding the basic facts (Tech. Rep.
No. FE-0489). U.S. Department of Energy.
Villar, J., & Rudnick, H. (2003). Hydrothermal market simulator using game theory:
assessment of market power. IEEE Transactions on Power Systems, 18(1), 91–98.
Zhao, F., & Litvinov, E. (2010). Defining and pricing capacity product in capacity
markets. In Power and energy society general meeting, 2010 ieee (pp. 1–6).
Zhao, F., Zheng, T., & Litvinov, E. (2016). Decomposition and optimization in con-
structing forward capacity market demand curves (Tech. Rep.). ISO New England.
Zhou, Z., Levin, T., & Conzelmann, G. (2016). Survey of us ancillary services mar-
kets (Tech. Rep.). Argonne National Laboratory (ANL).