improved management of rcc pavement technology - university
TRANSCRIPT

Improved Management of RCC Pavement Technology
By
Norbert Delatte, Nader Amer, and Chris Storey Department of Civil and Environmental Engineering
The University of Alabama at Birmingham Birmingham, Alabama
Prepared by
UTCA
University Transportation Center for Alabama The University of Alabama, The University of Alabama at Birmingham,
and The University of Alabama in Huntsville
UTCA Report 01231 January 2003

ii
Technical Report Documentation Page
1. Report No. FHWA/CA/OR-
2. Government Accession No. 3. Recipient Catalog No.
5. Report Date January 2003
4. Title and Subtitle Improved Management of RCC Pavement Technology
6. Performing Organization Code
7. Authors Norbert Delatte, Nader Amer, and Chris Storey
8. Performing Organization Report No. UTCA Report 01231 10. Work Unit No.
9. Performing Organization Name and Address The University of Alabama at Birmingham Department of Civil and Environmental Engineering 1075 13th Street South (Hoehn Building), Suite 120 Birmingham, A L 35294-4440
11. Contract or Grant No. DTRS98-G-0028
13. Type of Report and Period Covered Final Report: Sept/1/01-Jan/31/03
12. Sponsoring Agency Name and Address University Transportation Center for Alabama Box 870205, 271 H M Comer Mineral Industries Building Tuscaloosa, Alabama 35487-0205
14. Sponsoring Agency Code
15. Supplementary Notes 16. Abstract Roller compacted concrete (RCC) is a durable, economical, low-maintenance material for low speed heavy duty paving applications, including industrial and multimodal pavements. Use of RCC in the United States and Canada has shown the potential for long life and low maintenance costs. In Alabama, RCC pavements are applicable to industrial facilities, highway rest areas and weigh stations, aircraft parking aprons, and multimodal facilities (including state dock renovation and expansion). However, a significant obstacle to the expanded use of this technology is the lack of a simple, reliable method for preparing laboratory specimens to predict field performance. Many of the current methods of preparing laboratory specimens are difficult, require proprietary equipment, or do not correlate well with field observations. Application of gyratory compactor technology to RCC offers the potential for rapid, reliable preparation of specimens. Materials and mix designs from two industrial paving projects were used to investigate mechanical properties. Field results indicated that the gyratory compactor produced specimens with mechanical properties consistent with those achieved in the field. Specimens had high strength and consistent density, with low variability. The effects of density and specimen aspect ratio on compressive and splitting tensile strength were investigated. The number of gyrations applied to the specimen was varied to duplicate the desired field density. A large number of cores were obtained from a field test strip for comparisons. For the industrial pavements investigated, approximately 60 to 75 gyrations accurately replicated field conditions. 17. Key Words Roller compacted concrete pavements, volumetric analysis, concrete aggregates, concrete construction, concrete tests, durability, test methods, compaction
18. Distribution Statement
19. Security Classif (of this report)
20. Security Classif. (of this page) 21. No of Pages 46
22. Price
Form DOT F 1700.7 (8-72)

iii
Contents Contents……………………………………………….......……………………………….. iii Tables …………………………………………………...……………………………….... v Figures ……………………………………………………..……...…………………….… vi Executive Summary……….……………………………....…..…………………………... vii 1.0 Introduction …………………………………………..…………………………….… 1 Project Objectives .……………………………………...…...……… ………………... 1 Approach and Work Plan ………...………….…………...……..…………………….. 2 Organization of This Report ……………………………….…………………………... 2 2.0 Background and Literature Review…...…………………………………...…………... 3 Previous Use and the Development of RCC....…………………………………...……. 3 Application of RCC for Pavements ..………..…………………...…………………….. 4 Initial Cost of RCC ………………………………………... ………………………...... 4 Comparison with Conventional PCC ………………………………………... ……….. 4 Durability Concerns ………………………………………... ………………………..... 5 Regional RCC Pavement Projects ………………...…………………….……………... 5 Surface Properties of RCC ……………………………..………...…..………………... 6 Material Selection …………………………..………………………...………...……… 7 Joints in RCC Pavements ………………………………………………………...….… 9 RCC Pavement Construction Process …………………………….…………………… 9 Freeze/Thaw and Deicer Scaling Resistance ……………………………..…………… 11 Testing RCC for Strength ……………………………………………………………… 11 RCC Test Sections ……..………………………………………………………………. 11 3.0 Preparation of Test Specimens …………………………………………...………….... 14 The Vibrating Hammer………..………………………………………………………... 14 Vebe Apparatus……………………………………………………………….………... 16 Gyratory Compactor…….....……………………………………………………….…... 16 4.0 Research Plan …………………………………………...…………...…….………..… 20 5.0 Proof of Concept Test and Results .…………………………………………………… 22 6.0 Material Testing and Results………………….. ……………………….………...…… 26 Test Series A: The Honda Plant Case Study …...……………………………………… 26 Test Series B: The Mercedes Plant Case Study …...…………………………………… 31 Influence of Compaction and Aspect Ratio on Mechanical Properties …...…………… 32 Test Series C: RCC for Dams, Georgia Project Case Study …………………………... 35

iv
7.0 Comparison with Field Specimens ……………………………………………………. 36 8.0 Discussion of Results ……..…………………………………………………………... 38 Consistency of Results………………………………………………………………….. 38 Effect of Aspect Ratio on Strength……………………………………………………... 38 Splitting Tensile to Compressive Strength Ratio………………………………………. 39 Comparison of Strength Results for Different Mixes………………...………………… 39 Feasibility of Using the Gyratory Compactor for RCC………………………………… 40 Proper Number of Gyrations…………………………………………………………… 40 9.0 Summary and Conclusions ………………………….………………………………… 41 10.0 Future Research …………………………………………………………………..….. 42 11.0 References ……………………..………………………………….…………………. 43 12.0 Acknowledgements ………………………..……………………..………………….. 45 13.0 Appendix A – List of Abbreviations ………………………..……………………….. 46

v
List of Tables Number Page 2-1 Comparison between conventional concrete and RCC pavements……..……. 4 2-2 Examples of RCC mix designs……....……………………… ………….…… 5 3-1 RCC quality control tests…………………………………………......…...….. 14 4-1 Mix designs used in the research ……………………………………..…...…. 21 4-2 Summary of test specimens produced………………………………....……... 21 5-1 Specimen height change with increasing number of gyrations……...……...... 23 5-2 Unit weight values compared to the theoretical maximum density....………... 25 6-1 Aggregate gradation and maximum density for the test series A ……………. 26 6-2 Compressive strength results for 75 gyrations – test series A…….....……….. 28 6-3 Compressive strength results for 100 gyrations – test series A....……………. 29 6-4 Splitting tensile results for 75 gyrations – test series A....……………………. 29 6-5 Splitting tensile results for 100 gyrations – test series A....…………………... 30 6-6 Aggregate gradation and maximum density – test series B ………………….. 32 6-7 Compressive strength results for 75 gyrations – test series B ……………….. 33 6-8 Splitting tensile results for 75 gyrations – test series B ……………………… 33 6-9 Compressive strength with different number of gyrations…………………… 33 6-10 Splitting tensile strength with different number of gyrations………………… 34 8-1 Compaction percentage at 75 and 100 gyrations …………………………….. 38

vi
List of Figures Number Page 2-1 Top view of a compacted RCC specimen ………………………………..…… 6 2-2 RCC gradation limits ...…………………………………………………...…… 8 2-3 Extracting beam specimens from a RCC test section ……………………...…. 12 2-4 RCC test cylinder with two layers ………………………………………….…. 12 3-1 A vibrating hammer ………..…………………………………………………. 15 3-2 The use of the vibrating hammer in the field ………………...……………...... 15 3-3 Vebe consistency apparatus and modified Vebe apparatus ………………….. 16 3-4 Brovold gyratory compactor used at UAB laboratory ……………………....... 17 3-5 Measurement of the angle of gyration …………..…………………………….. 18 3-6 Stages of compaction in the gyratory compactor ……………………………... 19 5-1 Removing RCC specimen from a gyratory compactor at Vulcan Materials ...... 22 5-2 Surface difference with 100 and 75 gyrations ……………..………………….. 23 5-3 Splitting tensile test on RCC samples ………………………………………… 24 5-4 Unit weight versus number of gyrations ……………………………………… 25 6-1 Gradation for aggregates used for test series A ……………………………….. 27 6-2 Different surface textures for different number of gyrations …………………. 28 6-3 Failure modes for specimens tested for compressive strength ……………....... 30 6-4 Failure mode for specimens tested in splitting tension………..………………. 31 6-5 Unit weight versus number of gyrations – test series A ………………………. 32 6-6 Compressive strength development with increasing number of gyrations ........ 34 6-7 Splitting tensile development with increasing number of gyrations ………….. 35 7-1 Compressive strength versus density………………………………………….. 37 7-2 Splitting tensile strength versus density…..…………………………………… 37 8-1 Splitting tensile versus square root of compressive strength …………………. 39

vii
Executive Summary
Roller compacted concrete (RCC) is a durable, economical, low-maintenance material for low speed heavy duty paving applications, including industrial and multimodal pavements. Use of RCC in the United States and Canada has shown the potential for long life and low maintenance costs. A public roadway test section in South Carolina has recently expanded use of RCC to highway construction. In Alabama, RCC pavements are applicable to industrial facilities, highway rest areas and weigh stations, aircraft parking aprons, and multimodal facilities (including state dock renovation and expansion). One important obstacle to increased use of RCC has been the difficulty of fabricating laboratory specimens to accurately replicate field mechanical properties. In the past, it was difficult to predict the mechanical properties and performance of a given RCC mixture. A possible way to overcome this impediment to the further development of RCC was investigated in this project, using a gyratory compactor to fabricate specimens to a desired density. This research found that strength and density results for RCC specimens fabricated using the gyratory compactor were consistent. Satisfactory agreement with field results was obtained. Therefore, the feasibility of using the gyratory compactor for RCC was demonstrated. This method has advantages over the other methods presently used to compact laboratory specimens. The results presented in this report support the following findings, for the range of mixtures and densities considered: • Compressive strength increases with increasing density. • Splitting tensile strength increases with increasing density. • The specimen height correction factors used with the American Society for Testing and Materials ASTM C 39 specification for concrete cylinders are appropriate for use with RCC specimens made using the gyratory compactor. • Splitting tensile strength is strongly correlated with compressive strength. The appropriate number of gyrations for test specimens will depend on the degree of field compaction obtained with the placement and compaction equipment used for the project, but will probably be in the range of 50 to 75 to replicate fair and excellent compaction, respectively. Because the mechanical properties of RCC vary considerably with the degree of compaction, the use of the gyratory compactor makes it possible to predict strength through a range of field densities, and also to quantify the benefits of improved compaction methods.

1
Section 1 Introduction
Roller compacted concrete (RCC) has proved to be a reliable material for low speed, heavy-duty pavements. Advantages include low cost, high durability and good performance with minimum maintenance. The latest development in RCC is the use of a gyratory compactor for preparing sample mixes. This device was developed by the Strategic Highway Research Program (SHRP) to compact specimens for asphalt pavements. The reason for using a gyratory compactor is to develop a procedure that can more accurately match laboratory and field test results, producing improved economy and performance. Other existing methods that produce RCC specimens experience problems such as variability in quality, difficulty in preparing samples, and difficulty in meeting requirements. With the gyratory compactor it is much easier to produce consistent and reliable results. There is increasing interest from companies and corporations in developing industrial facilities in Alabama. Huge industrial sites with wide paved areas require a reliable and rapid paving method. With its low initial cost and minimal maintenance, RCC is a competitive choice as a paving method for these industrial sites. Historically, RCC has also been an excellent alternative for large dock facilities. Recently, there has been increasing interest in use of RCC for public roadways. The South Carolina Department of Transportation recently developed a specification and paved a test section on a public roadway near Aiken, South Carolina. Research Objectives A gyratory compactor was used to duplicate field compaction, using the material and mix designs from industrial paving projects. The following objectives were established to provide a framework for the development of a testing procedure: • Determine how compressive strength changes with specimen density (degree of compaction) • Determine how splitting tensile strength changes with specimen density (degree of
compaction) • Determine how specimen aspect ratio affects compressive strength • Determine how RCC strength develops with specimen age • Validate that laboratory specimens have density and strength consistent with field specimens • Determine the number of gyrations to select in order to match field density The first four objectives were achieved through a laboratory study, and the last two were achieved by comparing the strength results of field cores with specimens made in the lab with the same materials.

2
Approach and Work Plan To develop a comparison between field and laboratory results, different mix designs were used from three ongoing construction projects. The first project was the Honda plant in Lincoln, Alabama, and will be referred to as test series A. The second project was the Mercedes plant in Vance, Alabama, and will be referred to as test series B. The final one was a dam in Georgia and will be referred to as test series C. It was important to have enough specimens to demonstrate the accuracy and repeatability of the method. Therefore, two large scale test series (A and B) were undertaken, along with one smaller test series (C). A large number of field cores were also obtained for comparison. In test series A, forty specimens were made for strength testing using a mix design similar to that used in the Honda Plant project. Aggregates were provided by the Vulcan Materials Company. This phase of the research was initiated before the final mix design for the Honda Plant was selected. Specimens with 75 gyrations were tested for compressive and tensile strength (two of each). A second set was compacted with 100 gyrations and was tested in the same manner. An increasing number of gyrations indicates a higher degree of compaction, and a lower percentage of air voids. Another 20 specimens were prepared to study the effect of compaction on strength by comparing specimens compacted with 60, 75, 80, 90, and 100 gyrations. Each compaction condition had four specimens tested for both compressive and tensile strength. The results from this part of the research were used to determine the proper number of gyrations, to investigate repeatability, to compare field and lab strength results, to determine the effect of compaction on strength, and to observe strength development. Test series B had only 20 specimens because test series A was used to determine the appropriate number of gyrations to replicate field conditions. In test series B, the specimens were compacted at only the 75 gyration level rather than both 75 and 100, and the specimens were tested for compressive and tensile strength. Test series C investigated the mix design and material used for a dam in Georgia. This mix had much higher fine aggregate proportion compared to cementitious materials. The water-to-cement ratio was also higher than mixes A and B, 0.60 compared to 0.40. Organization of This Report Section 2 of this report presents the literature review and theoretical background of this research. Section 3 reviews the preparation of test specimens. Next, Section 4 provides a detailed discussion of the research plan. The proof of concept testing and results are described in Section 5. Section 6 reviews the results of the complete laboratory testing program, which are later compared to the field results in Section 7. Results are discussed in Section 8. The technology transfer package is described in Section 9, and suggestions are made for future research in Section 10. The summary and conclusions are provided in Section 11.

3
Section 2 Background and Literature Review
When use of roller compacted concrete (RCC) for pavements started 30 years ago, the new paving method was intended to be cost effective and durable. In Canada it was used in heavy industrial areas under severe frost conditions, and proved to be successful for carrying heavy loads with low construction cost. Over the years, several advances were introduced to RCC. Most were directed towards improving quality, including smoothness and durability. An improvement in rideability came when asphalt pavers were used to place RCC. With this procedure, RCC now combines the performance of concrete and the low cost of asphalt (Piggott 1999). For many years RCC has been used successfully for dam construction. This report will concentrate on RCC for pavements. The differences between the two applications are aggregate sizes, gradations, water and cementitious materials ratios, and methods of placement. Typically, RCC for pavements uses smaller aggregates and lower water-cementitious material ratios, and is placed in single rather than multiple lifts. RCC for pavements was developed to meet the need for pavements that can take heavy loads under extreme temperature conditions. RCC has been a good replacement for asphalt under conditions where rideability and smoothness are not a necessity. It has performed well in both freezing conditions, such as in Canada, and in hot conditions such as in the southern United States. Previous Use and the Development of RCC Some industrial projects have required heavy load capacity that could not be achieved by other paving materials with a reasonable initial cost. This led to the search for a new paving material. RCC has proven to provide these needs effectively (Piggott 1999). Two of the important RCC characteristic s are durability and low maintenance requirements. With RCC, paving is rapid and does not require forms, dowels or reinforcing steel. This saves at least 15 to 30 percent of the cost versus slip formed or fixed formed concrete pavements. The lower cement content in RCC provides additional savings. RCC has a long history of use with a variety of applications. A form of RCC pavement was built in Sweden in the 1930s. The U.S. Army Corps of Engineers (USACE) built an RCC runway in Yakima, Washington in 1942. By the 1960s, cement-treated base (CTB) was used in the Oregon logging industry. In Vancouver it was used for a log-sorting yard in 1976. The CTB was improved in this case by increasing the cement content of the soil-cement mixture from 6 to 12%. This cement base gave good performance even without the asphalt overlay, which led to further development of RCC. This improved CTB was stronger and more resistant to freeze-thaw damage, could resist petroleum spillage attacks, allowed faster vehicle speeds, and required

4
less maintenance than gravel surfaces. USACE started to investigate using RCC pavements in the 1980’s and has since become a strong advocate for RCC pavements (Piggott 1999). Applications of RCC for Pavements RCC is best used in applications with low speeds and heavy loads, such as intermodal pavements and heavy industrial plants with low speed vehicles. Examples of such pavements are highway weigh stations, airport aprons, docks and container ports, multimodal facilities, and heavy industrial sites such as logging and automobile manufacturing facilities. RCC may also be used for high speed traffic if it is smooth enough, or if an asphalt overlay is provided. Initial Cost of RCC RCC is less costly than conventional Portland cement concrete (PCC) pavement. USACE compared costs of RCC and PCC in 1995. The study analyzed 49 different USACE projects where RCC had been used for tank hardstands, tank trails, shipping yards, port facilities, maintenance yards, municipal streets, roads, parking areas, and other applications. Savings ranged from 14 to 58 percent (USACE 1995). USACE specifications are very strict, so the cost of RCC for USACE projects might be higher than for a less conservative specification. Comparison with Conventional PCC
Conventional paving concrete and RCC are compared in Table 2-1. As shown, cement and water amounts are considerably higher in conventional concrete than in RCC. There is also an increased percentage of fine aggregate in RCC (Rapid to Construct, 2001). RCC has zero slump because there is so much less water in RCC mixes than in conventional concrete.
Table 2-1. Comparison between conventional concrete and RCC pavements (Rapid to Construct, 2001)
Unit Weight lb/yd3
Pavement Type
Max. Aggregate Size (in)
Fine Aggregate Ratio % W
ater
Cem
ent
Fine
A
ggre
gate
Coa
rse
Agg
rega
te
Add
itive
Weight Ratio of Cement%
Water Content %
RCC ¾ 44 175 431 1577 2091 1.08 10.6 5.4
Conventional 1 ½ 33 233 548 1010 2260 1.37 14.5 7.8
The USACE report provided the mix designs for a number of projects, as shown in Table 2-2. One common feature is a low cement percentage (between 9 to 12 % by weight of the mixture). That is a smaller percentage than found in conventional concrete as seen in Table 2-1. The aggregate size is almost always ¾ inch. There are differences in the mixture proportioning procedures used for RCC in comparison with conventional concrete. The first difference is that fresh RCC has a relatively dry consistency.

5
RCC is not air entrained, has lower water content, has lower paste content, requires a higher fine aggregate content, and the nominal maximum size aggregate (NMSA) is usually not greater than ¾ inch (American Concrete Institute (ACI) Committee 325, 1995). The NSMA is defined as the smallest sieve opening that retains between 0 and 5 percent of a sample (Mindess et al., 2003), and characterizes the largest size stone in the aggregate blend.
Table 2-2. Examples of RCC mix designs (USACE 1995)
Cement
(Type I) Fly ash Coarse
Aggregate Fine
Aggregate Location
Weight Class Weight
Water Weight W/Cm ratio
Max Size Weight Weight
Weight Ratio of Cement
%
Water Content
%
Austin, TX 260 C 260 182 0.35 3/4 in 1610 1610 6.6 4.6
Ft. Campbell, KY 400 F 212 205 0.34 3/4 in 1785 1465 9.8 5.0
Ft. Drum, NY 450 F 150 210 0.35 3/4 in 2321 988 10.9 5.1
Spring Hill, TN 400 F 150 192 0.35 3/4 in 1890 1550 9.6 4.6
Ft. Hood, TX 293 F 146 176 0.4 7/8 in 2006 1669 6.8 4.1
Weight is in pounds per cubic yard, Maximum fine aggregate siz e in No. 4.
Durability Concerns A continuing concern for RCC in comparison with conventional concrete has been durability. Conventional concrete requires air entrainment for durability, but RCC cannot be air entrained, because the introduction of air entraining admixture requires a fluid paste. As a result, a recent American Concrete Institute document on proportioning no-slump concrete (ACI Committee 211, 2002) states that the freeze-thaw durability of RCC has not been demonstrated, despite the long history of satisfactory service in Canada and other northern regions. Regional RCC Pavement Projects The use of RCC for pavements has been increasing in many parts of the country. An example of a local project in the southeast is the Saturn Manufacturing Plant in Spring Hill, Tennessee. It has the largest RCC pavement ever placed, consisting of 134 acres of roads, storage yards, and delivery areas (PCA 2001). Other regional RCC projects include the Super-Rock Block Marshalling Yard – Birmingham, Alabama, the Vulcan Materials Cherokee Quarry Entrance Road – Cumming Georgia, the New South Express Distribution Center – Talladega, Alabama, and the Knox County Solid Recycling Center, Phase 1 – Oak Ridge, Tennessee.

6
Surface Properties of RCC One limitation of RCC as a paving material is the quality of the finished surface. RCC is characterized by the rough surface texture seen in Figure 2-1. Surface properties of interest include surface texture, surface smoothness and water permeability.
Figure 2-1. Top view of a compacted RCC specimen Surface Texture Aggregate size and type play a major role in the surface texture appearance. A smaller maximum size coarse aggregate may produce a finer pavement texture. Some pavements after two to four years of use will experience abrasion, typically a dusting of the top surface paste. Even with an eroded surface, RCC pavements continue to carry heavy loads and have good traction (Piggott 1999). Surface Smoothness The use of high-density asphalt paving machines has helped produce smoother RCC pavements. RCC pavements may carry any type of traffic except for the highest-class multi- lane highways. On RCC, speed limits are normally kept below 35 to 40 miles per hour. Asphalt overlays have been used over a RCC pavement to provide a smooth riding surface – with asphalt overlays, higher speeds may be allowed (USACE 1995, Piggott 1999).

7
Water Permeability The rough surface of RCC pavements has raised questions about water seepage into the pavement. Water seepage initiates freeze/thaw and other water related damage mechanisms. Some studies have been made to measure water-permeability in RCC pavements using test specimens. Results showed that permeability is often higher in RCC than in conventional concrete pavements (Banthia 1992). Tests also indicated that the use of finer cement and products like silica fume would reduce the permeability. However, this higher permeability does not seem to be of concern, especially since RCC pavements have had no documented problems with freeze/thaw deterioration even after decades of service in freezing climates, such as in Canada (ACI Committee 325, 1995). Material Selection Material selection depends mainly on required design strength, durability, and intended application. Materials used for RCC are water, cementitious materials (cement and fly ash), and fine and coarse aggregates. Typically, no admixtures are used, although set retarders may be used if the concrete must be transported a long way (Halstead, 2003). Aggregate Selection RCC mixtures typically consist of 75 to 85 percent aggregates. Therefore, it is helpful to select aggregates to provide economy and longer serviceability. Aggregates have a great effect on many properties, including compactibility, consolidation, strength, modulus of elasticity, thermal properties, and durability of hardened concrete. RCC has less paste than conventional concrete. Therefore, a proper NMSA must be chosen. This is because increasing the NMSA reduces the void content, and there will be reduced need for paste to fill the smaller voids (ACI Committee 325, 1995). A well-graded aggregate mix also reduces surface voids. One recent RCC gradation specification can be found in the 2001 draft of the South Carolina Department of Transportation (SCDOT) supplemental specification (SCDOT, 2001). This specification requires a well-graded blend as seen in Figure 2-2. The specification requires that the plasticity index not exceed five, which categorizes the aggregate as non-plastic or slightly plastic (Atkins 1997). The way that the aggregate structure interacts with water is important because of the small amount of water used in RCC mixes. For example, RCC with uncrushed gravel has been shown to need less water for a given consistency than if crushed gravel or stone is used (SCDOT, 2001). It is important to take good care when stockpiling and handling aggregates, to avoid segregation. General specifications for RCC aggregates recommended by the American Concrete Institute (ACI) Committee 325 are as follows (ACI Committee 325, 1995): 1. The blend should have 90 percent by weight of coarse aggregate retained on the No. 4 sieve. 2. Coarse aggregates may have crushed or uncrushed gravel.

8
3. The grading of the aggregates must be consistent to control compatibility. 4. NMSA should not exceed ¾ inch to limit segregation. 5. Fine aggregates may be natural sand, manufactured sand, or a combination. 6. Sand with non-plastic silt is recommended as a mineral filler to reduce the amount of cement used.
0
10
20
30
40
50
60
70
80
90
100
0.001 0.01 0.1 1
Sieve size, inches
Per
cent
pas
sing
Max LimitMin. Limit
Figure 2-2. RCC gradation limits (SCDOT, 2001)
RCC aggregates should be tested and evaluated according to American Society for Testing and Materials (ASTM) standards for concrete. Applicable standards include the specific gravity and absorption using ASTM C 127 (ASTM C 127, 2002). Recommended grading limits are provided in ACI 325.10R (ACI Committee 325, 1995). Aggregates selection, types, and tests, should follow ASTM C 33 (ASTM C 33, 2002). Cementitious Materials Most RCC mixtures use Portland cement Types I or II with fly ash of Class F or C. Cement specifications follow ASTM C 150 (ASTM C 150, 2002). The fly ash is used to add fine material to the mix to provide better compaction by filling the voids. It also improves placement of RCC. Furthermore, having fly ash in the mix provides pozzolanic properties that improve strength and durability. RCC mixes usually have 15 to 20 percent fly ash of the total volume of the cementitious material (ACI Committee 325, 1995).

9
Admixtures in RCC Pavements Proper compaction with a low water-cement ratio is recommended as a frost resistance procedure, rather than air entrainment. Because of the absence of fluid paste, it is very hard to entrain air in RCC, but by reducing the amount of water penetrating RCC pavements, and in some cases, using a free-draining base, the damaging effects of freeze-thaw may be eliminated. Other admixtures, such as water reducing admixtures, are generally not used. Joints in RCC Pavements RCC pavement typically cracks at 15 to 65 foot intervals. Cracks in RCC affect pavement appearance, but not performance. The cracks in RCC are fine and do not widen with time, and do not open significantly with temperature changes. Furthermore, debris such as fine aggregates, wood debris and other types of dust will fill the cracks that are usually only about 1/16 inch wide. Therefore, edge chipping is not likely to occur with such narrow cracks. If sealing is desired then a hot poured asphaltic sealant may be used (Piggott 1999). RCC pavements are frequently constructed without transverse joints. In that event, shrinkage cracks appear transverse to the direction of paving. They occur in the first weeks after construction, and may continue to develop, but in a slower fashion for many years. If sawn joints are desired, sawing is done within 12 hours after placing the RCC to avoid uncontrolled cracks. Factors controlling crack spacing are not well understood. Longitudinal joints are 12 to 16 feet apart between the strips laid by the paving machine. When paving in multiple lifts, a reflection crack forms when the original shrinkage crack in a lower layer of RCC reflects through the overlay on top. Construction joints are formed as a vertical face at the edge of the paving strip at the end of a working day. Joints in RCC pavements typically do not cause maintenance concerns as they do for other types of pavements. RCC Pavement Construction Process Steps to construct a RCC pavement can be summarized as follows (ACI Committee 325, 1995, USACE 1995): 1. Compact and grade the base course material at the paving site to have a smooth and firm platform. Subgrade and base preparation are done in the same manner used for conventional concrete. It is important to have adequate support to uniformly consolidate the full thickness of RCC pavement during compaction. 2. Moisten the base course with water just before placing the RCC. 3. Use string lines along the lanes to control the height of the screed during placement. 4. Mix the RCC continuously in a pug mill plant near the site.
a. Weigh aggregates, cement, and fly ash using belt scales. b. Use conveyer belts to dump dry materials in the pug mill, and add water. c. Use dump trucks to haul the RCC to the paving site.
5. Use an asphalt or similar type paving machine to place the RCC, making sure to have uniform density and smoothness.

10
6. Compact the RCC to the specified density by using dual-drum vibratory rollers immediately after placing. 7. Use a rubber-tired roller passing several times after compaction to tighten the surface texture. Following that, steel drum rollers may be used to remove tire marks. 8. Use fogger-spray water trucks to keep the RCC surface moist until irrigation sprinklers are set up. They are used for 7 to 14 days for curing purposes. Other curing methods that can be used are membrane-forming curing compounds and asphalt emulsions 9. Cold joints are formed when there is at least an hour difference between placements. 10. Transverse joints are sawn four to 20 hours after placing and compacting the RCC. Typically, 12 hours is the best time to saw joints to avoid uncontrolled cracks. Sawing joints improves aesthetics and maintenance of joint sealants. Batching and Placing A twin-shaft pug mill mixer is often used to mix the RCC because of the low water content. This type of plant may be set up rapidly on the site. It is preferred over a batch-type plant due to its larger capacity; continuous-mixing can produce up to 250 tons per hour. Dump trucks are used to transport the batch to the paver. The continuous production capacity of the plant must be matched to the paver and rollers, so that the construction will be continuous and will produce a smooth pavement. The RCC should be placed within 45 minutes after adding the water. The paving machine hopper should not be allowed to be empty at any time, to avoid creating gaps. To make a fresh joint with two lanes, the second lane must be placed within 60 minutes of placing the first lane or a cold joint will be formed. It is important to place a layer of RCC 10 to 25 percent thicker than designed to obtain the desired pavement thickness after compaction. The amount of excess thickness depends on the type of paver used. Modifications that may be applied to asphalt pavers include adding a vibratory screed and tamping bars to achieve a higher degree of consolidation. This will reduce surface waving problems during compaction operations. Another modification involves enlarging the feeding gates close to the hopper to admit the large volume of material used. Also, the spreading screws are adjustable to spread the RCC uniformly across the lane.
Compaction of RCC Pavements Compaction is considered the most crucial step in RCC construction. According to the USACE, rolling must start within 10 minutes after placing, and should end within 45 minutes after adding the water at the plant. The displacement of the surface should be observed after two static passes using a 10-ton vibratory roller. If the mixture is too wet, it will give a deeply rutted surface. If it is too dry, then the mixture will not consolidate easily (USACE, 1995).

11
Curing of RCC Pavements RCC pavements have rough and open textured surfaces and may dry quickly. Moist curing may be applied using water spray trucks, sprinkler systems, wet burlap, or cotton mats covering the pavement for seven days after the final rolling. If curing compound is used, applying it in two directions helps in limiting the loss of moisture. Using double the amount of curing compounds recommended by the manufacturer can help ensure proper curing. Water curing may cause erosion or subgrade saturation, so it should be used with caution. Freeze/Thaw and Deicer Scaling Resistance To resist freeze/thaw damaging effects, the RCC must be well mixed. Also, the mixture should be placed to the specified density and cured properly. It does not appear to be possible to entrain air into the RCC mix. One researcher confirmed this by using microscopic examinations in an attempt to detect the spherical air entrained bubbles. Different quantities of air entraining were used, but the investigators could not detect entrained air after testing (Banthia 1997). Thus, durability is typically ensured by using materials that have previously performed well.
Testing RCC for Strength Strength is an important factor that defines hardened concrete quality and performance. In this research both compressive and splitting tensile strength tests were used for RCC specimens. Compressive strength is often used to represent the quality of hardened concrete, but splitting tensile strength is also important for strength testing of pavements. Strength results are affected by constituent materials, preparation of specimens, and curing (Mindess et al, 2003). RCC Test Sections Because of the difficulty of relating RCC laboratory specimens to field performance, test sections are often used for RCC projects. The test section is built near the job site eight to 12 days before the start of the actual project with the equipment to be used for the project. The test section is used to determine the best ways to mix, place, compact, and cure the RCC pavement. The test section should be large enough to test different rollers. A sufficiently large test section will also improve the correlation process between laboratory results and field tests; for example, the relationship between the nuclear gage densities and relative densities. A test section composed of two lanes, each 12 to 14 feet wide, is recommended. In some applications, a section up to 350 feet long was constructed with one and a half lanes on one day and the other half lane on the next day. This allowed the study of cold joint construction. To have the full benefit of a test section, longitudinal, transverse, cold, and fresh joints should be investigated (USACE, 1995). Smaller test sections can be constructed to obtain cores and beams for strength testing purposes. Figures 2-3 and 2-4 show beams and cores extracted from a test section.

12
Figure 2-3. Extracting beam specimens from a RCC test section.
Figure 2-4. RCC test cylinder with two layers

13
Density Determination with Nuclear Gage A double-probe nuclear density gage is considered the most suitable device to test wet density of RCC. Other methods are not recommended for RCC. The sand cone and balloon methods take a long time, and it is hard to achieve undisturbed sides for excavated holes. The double-probe nuclear density gage is preferred over the single-probe to measure density for RCC (ACI Committee 207, 1999). Using the nuclear gage in the direct transmission mode may help in determining the optimum number of passes applied by a vibratory roller to reach maximum density. Density is measured after each pass by inserting the nuclear gage probe into a hole of specific characteristics designed for this operation.
14
Section 3 Preparation of Test Specimens
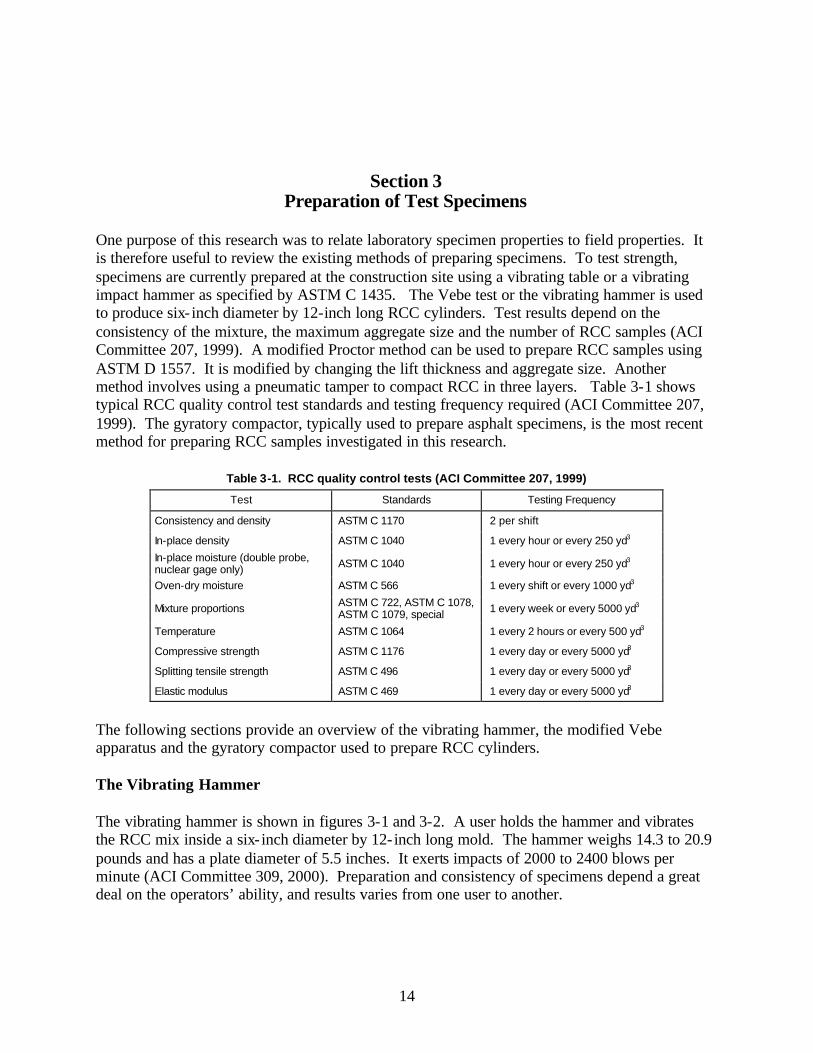
One purpose of this research was to relate laboratory specimen properties to field properties. It is therefore useful to review the existing methods of preparing specimens. To test strength, specimens are currently prepared at the construction site using a vibrating table or a vibrating impact hammer as specified by ASTM C 1435. The Vebe test or the vibrating hammer is used to produce six- inch diameter by 12-inch long RCC cylinders. Test results depend on the consistency of the mixture, the maximum aggregate size and the number of RCC samples (ACI Committee 207, 1999). A modified Proctor method can be used to prepare RCC samples using ASTM D 1557. It is modified by changing the lift thickness and aggregate size. Another method involves using a pneumatic tamper to compact RCC in three layers. Table 3-1 shows typical RCC quality control test standards and testing frequency required (ACI Committee 207, 1999). The gyratory compactor, typically used to prepare asphalt specimens, is the most recent method for preparing RCC samples investigated in this research.
Table 3-1. RCC quality control tests (ACI Committee 207, 1999) Test Standards Testing Frequency
Consistency and density ASTM C 1170 2 per shift
In-place density ASTM C 1040 1 every hour or every 250 yd3
In-place moisture (double probe, nuclear gage only) ASTM C 1040 1 every hour or every 250 yd3
Oven-dry moisture ASTM C 566 1 every shift or every 1000 yd3
Mixture proportions ASTM C 722, ASTM C 1078, ASTM C 1079, special 1 every week or every 5000 yd3
Temperature ASTM C 1064 1 every 2 hours or every 500 yd3
Compressive strength ASTM C 1176 1 every day or every 5000 yd3
Splitting tensile strength ASTM C 496 1 every day or every 5000 yd3
Elastic modulus ASTM C 469 1 every day or every 5000 yd3
The following sections provide an overview of the vibrating hammer, the modified Vebe apparatus and the gyratory compactor used to prepare RCC cylinders. The Vibrating Hammer The vibrating hammer is shown in figures 3-1 and 3-2. A user holds the hammer and vibrates the RCC mix inside a six- inch diameter by 12- inch long mold. The hammer weighs 14.3 to 20.9 pounds and has a plate diameter of 5.5 inches. It exerts impacts of 2000 to 2400 blows per minute (ACI Committee 309, 2000). Preparation and consistency of specimens depend a great deal on the operators’ ability, and results varies from one user to another.

15
Figure 3-1. Vibrating hammer (photo provided by PCA)
Figure 3-2. The use of the vibrating hammer in the field (photo provided by PCA)

16
Vebe Apparatus The Vebe apparatus, shown in figure 3-3, is used to determine the consistency of dry mixes. This apparatus is specified for mixes with a maximum aggregate size of 1½ inch. A standard slump cone specimen is placed on a vibrating table and a transparent disk is placed on top of it. The table vibrates with a specified frequency until the transparent disk is covered with grout. The time required to cover the disk is measured, and the overall time in seconds is reported as the Vebe time. This value is typically between 5 and 30 seconds. Problems occur with this test if there is not a uniform wetting of the disk with grout or if the end point cannot be easily observed (Mindess et al., 2003). The vibratory table developed for this test may be used to compact RCC cylinders.
Figure 3-3. Vebe consistency apparatus and modified Vebe apparatus. Gyratory Compactor This research project investigated whether a gyratory compactor could be used to prepare test RCC test specimens in place of the vibrating hammer or Vebe table procedure. Following the proof-of-concept test discussed in section 5, a portable compactor was obtained.

17
The AFGB1A Brovold gyratory compactor is typically used for hot mixed asphalt, but it was used to prepare RCC specimens for this project. This model is a lightweight, portable version that meets all Superpave requirements. The compactor has features that allow adjusting the number of gyrations applied, controlling the consolidation pressure, and specifying the final height of the specimen. The machine provides all necessary information to the user after each operation, such as the specimen height, ram pressure, and the external angle of gyration. The gyratory compactor used for this research is shown in Figure 3-4 and has the following characteristics:
Specimen Height: 10 to 200 mm (0.4 to 7.8 in.) Number of Gyrations: 0 to 299 Angle of Gyration: 1.25o +/- 0.02o Consolidation Pressure: 200 to 1000 kPa (29 to 145 psi) Compactor’s Weight: 350 pounds Compactor’s Dimensions: 21.3 x 30 inch, and 55.4 inch high
Figure 3-4. Brovold gyratory compactor used at UAB laboratory. Brovold Gyratory Compactor Operation The reason for using the gyratory compactor with RCC mixtures is that it provides compaction forces to the material in the mold similar to those applied by rollers in the field. It applies

18
vertical compaction and horizontal shear stresses by exerting an angle to the mold while the material is being compacted. The angle is created by the movement of the gyratory head at top. Angle of Gyration The purpose of specimen compaction is to replicate field density and mechanical properties. The mold that holds the mixture is tilted to an angle of 1.25 degrees while being compacted, to provide a kneading compacting action to replicate field conditions. Compaction is applied at the bottom through a moving ram with a 0.5 horsepower pump. While compacting, a head at the top rotates the mold and moves it in and out while the bottom of the mold remains in place moving around a pivot point as seen in figure 3-5. The angle of gyration can be calculated.
tan (α) = d / h
Figure 3-5. Measurement of the angle of gyration (drawn using information from Pine, 2000) Compacting Action During Operation As the specimen in the compactor is rotated, a tilted plate within the mold compacts it. Simultaneously, the compactor records the current specimen height in millimeters. As a result, the volume of the specimen is recorded after every gyration, and density may be determined. Compaction proceeds rapidly with the first few gyrations, but the rate of compaction decreases as the specimen becomes denser. Figure 3-6 shows how the bearing head causes the mold to rotate while applying vertical pressure to compact the specimen. It also summarizes the gyratory operation from position A through C to the final position.

19
Figure 3-6. Stages of compaction
Squaring the Specimen and Number of Dwells After compaction is complete, the specimen and mold are still tilted at an angle. To remove this angle, the specimen must be squared, which means releasing this angle and preparing to eject the specimen after the last gyration. As specified in the Brovold gyratory compactor manual prepared by the Pine Company, squaring is achieved by reversing the direction in which the motor rotates and applying a number of dwell gyrations (Pine 2000).

20
Section 4 Research Plan
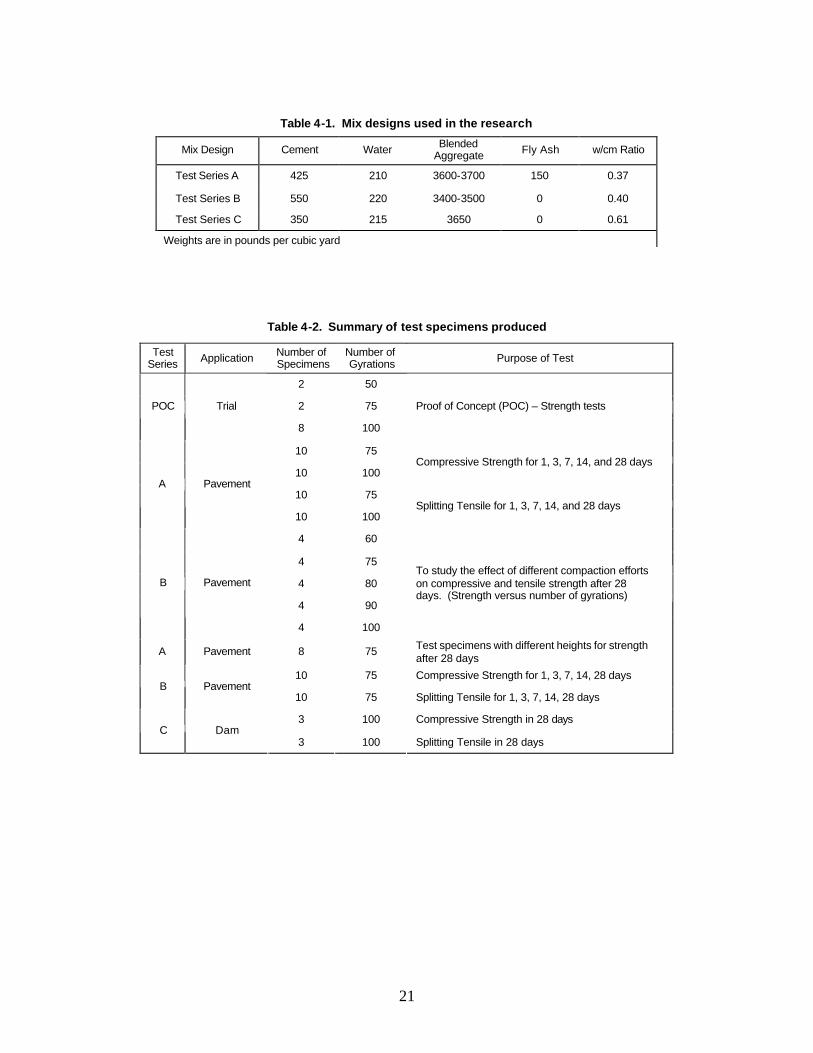
Using the gyratory compactor to prepare RCC specimens for pavements is a new concept. Validation of this concept required extensive laboratory testing. During this research, different mix designs and different specimen heights were studied to determine the best way to duplicate field properties. A proof-of-concept test was performed to see if the gyratory compacter from the asphalt industry could be used to fabricate RCC samples. This test took place using the Pine gyratory compactor at Vulcan Materials Laboratory. The mix design adopted for this stage was similar to that used in actual projects such as in the Honda plant project in Alabama. Nine specimens were tested for compressive and splitting tensile strength, and the densities of the specimens were measured. Densities were obtained by weighing the samples in air and water just before strength testing. Results of these tests are presented in Section 5. The next step involved using mix designs from the Honda and Mercedes plants in Alabama to produce specimens for strength testing purposes. The Honda and Mercedes test series were termed test series A and B, respectively. From those specimens, 20 were compacted with 75 gyrations and another 20 were compacted with 100 gyrations. Those were tested for strength at ages of one to 28 days. Then, using the same mix design, 20 specimens were compacted with different numbers of gyrations: 60, 75, 80, 90, and 100. Those specimens were used to study the effect of the degree of compaction on strength at 28 days. For test series B, which used a different mix design, another 20 specimens were compacted with 75 gyrations to ensure applicability to a range of RCC mixtures. Results of these tests are presented in Section 6. The final testing session used a mix design from a dam in Georgia. This was designated test series C. The intent was to determine if the gyratory compactor could produce specimens from the mixture for the dam, and to see if it would reach 2500 to 3000 psi of compressive strength in 28 days, which is required for the dam project. For this purpose, six specimens were produced for both compressive strength and splitting tensile strength tests at 28 days. The results of these tests are shown in Section 6. Table 4-1 provides mix proportions for test series A, B, and C. The blended aggregate weights are presented as a range. Weights of the constituent materials (cement, water, blended aggregate, and fly ash) are in pounds per cubic yard. Table 4-2 summarizes the tests represented in this research. The tests investigated the effect of specimen age, degree of compaction, and specimen aspect ratio on strength.
21
Table 4-1. Mix designs used in the research
Mix Design Cement Water Blended Aggregate Fly Ash w/cm Ratio
Test Series A 425 210 3600-3700 150 0.37
Test Series B 550 220 3400-3500 0 0.40
Test Series C 350 215 3650 0 0.61
Weights are in pounds per cubic yard
Table 4-2. Summary of test specimens produced
Test Series Application Number of
Specimens Number of Gyrations Purpose of Test
2 50
2 75 POC Trial
8 100
Proof of Concept (POC) – Strength tests
10 75
10 100 Compressive Strength for 1, 3, 7, 14, and 28 days
10 75 A Pavement
10 100 Splitting Tensile for 1, 3, 7, 14, and 28 days
4 60
4 75
4 80
4 90
B Pavement
4 100
To study the effect of different compaction efforts on compressive and tensile strength after 28 days. (Strength versus number of gyrations)
A Pavement 8 75 Test specimens with different heights for strength after 28 days
10 75 Compressive Strength for 1, 3, 7, 14, 28 days B Pavement
10 75 Splitting Tensile for 1, 3, 7, 14, 28 days
3 100 Compressive Strength in 28 days C Dam
3 100 Splitting Tensile in 28 days

22
Section 5 Proof of Concept Test and Results
The first trial of the gyratory compactor took place at Vulcan Materials using one of the preliminary mixes designed for the Honda plant in Alabama. One of the original specimens being removed from the mold is shown in Figure 5-1. If the specimen is not sufficiently compacted at this point, it cannot be removed from the machine intact. Specimens differed in surface smoothness around the sample sides, as indicated in Figure 5-2.
Figure 5-1. Removing RCC specimen from a gyratory compactor at Vulcan
At Vulcan Materials Laboratories, 10 specimens were made with different numbers of gyrations, as shown in the first two columns in table 5-1. Specimens with higher compaction had smoother sides because more paste flowed to the sides. The specimens with 50 gyrations were very rough and had some edge chipping. In comparison, the specimens with 75 and 100 gyrations had smoother surfaces and proved to be much stronger. The surface texture or smoothness, along with strength results, may be used to determine the proper number of gyrations. The results in Table 5-1 show how the last four height readings for a specimen with 50 gyrations were still rapidly decreasing, which explains the rough surface that needs more compaction. The other specimens, with an increased number of gyrations, have nearly constant last four readings, indicating sufficient compaction.

23
Figure 5-2. Surface difference with 100 and 75 gyrations
Table 5-1. Specimen height change with increasing number of gyrations
Sample No. of gyrations
Starting Height (mm)
Last Four Height Readings (mm) Comments
1 50 148.0 116.5 116.4 116.3 116.2
2 50 147.9 115.7 115.6 115.5 115.4
Could be compressed more and the surface is not dense enough
3 75 147.4 113.3 113.2 113.2 113.1
4 75 148.1 113.5 113.5 113.4 113.3 Denser surface, but final heights are not uniform
5 100 146.8 111.3 111.3 111.2 111.2
6 100 144.5 110.2 110.2 110.2 110.1
7 100 144.7 110.3 110.3 110.2 110.2
8 100 146.5 111.1 111.1 111.0 111.0
9 100 144.9 110.1 110.1 110.0 110.0
10 100 146.9 111.3 111.3 111.2 111.1
Very dense surface. No chipped edges like in previous samples. Uniform heights at the end.

24
Strength results were reasonably high and consistent with those of field samples. The results for seven-day splitting tensile strength were as follows:
o One sample with 50 gyrations: 506 psi o Two samples with 70 gyrations: 656 psi o Two samples with 100 gyrations: 634 psi
The standard deviation for the last 4 samples was 19.8 for a 3.1 percent coefficient of variation. The splitting tensile test is shown in Figure 5-3. After 14 days, two 100 gyration samples were tested for compressive strength, with an average strength of 8,175 psi. This result is for a low aspect ratio; height corrections were applied according to ASTM C 39 – 93a (ASTM C 39 2000).
Figure 5-3. Splitting tensile test on RCC samples.
Figure 5-4 shows the increase in the specimen’s unit weight with compaction. With increasing compaction, unit weight approaches the theoretical maximum that is calculated by using the following equation (adapted from Atkins 1997),
ww
fafa
caca
ff
cc
wfacafc
RD
P
RD
P
RD
P
RD
P
RD
P
PPPPP
TM
CD
++++
++++=
In this formula, P stands for percentage of the total weight of materials used in the mix, RD is the relative density of each constituent, and TMCD is the theoretical constituent maximum density. The rest of the symbols, c, f, ca, fa, and w, represent cement, fly ash, coarse aggregate, fine

25
aggregate, and water respectively. This equation was adapted from hot mix asphalt volumetric mix design.
125
130
135
140
145
150
155
160
165
170
0 10 20 30 40 50 60 70 80 90 100
Number of Gyrations
Uni
t W
eigh
t (p
cf)
Unit Weight
Theoretical Maximum
Figure 5-4. Unit weight versus number of gyrations
It is possible for TMCD to exceed 100 percent due to concrete shrinkage during the curing process. The theoretical maximum unit weight in pounds per cubic foot is calculated using:
γ = TMCD x γw where γ is the maximum density, and γw is the density of water which is equal to 62.4 lb/ft3. It is possible to determine a density after every gyration, as noted in section 3, because density is inversely proportional to height, and the compactor records the specimen height after every gyration. The theoretical maximum density calculated from the previous equations for TMCD and γ gave a value of 162.9 lb/ft3. The unit weights for the specimens that were compacted in the gyratory compactor were then compared to this value and gave the results found in Table 5-2. For RCC, it is possible to achieve 90 to 98 percent density in the field.
Table 5-2. Unit weight values compared to the theoretical maximum density
Number of gyrations Unit Weight (lb/ft3)
Theoretical Maximum (lb/ft3) Percentage Compaction
50 gyrations 159.4 162.9 97.9 75 gyrations 160.3 162.9 98.4 100 gyrations 162.1 162.9 99.5
26
Section 6 Material Testing and Results
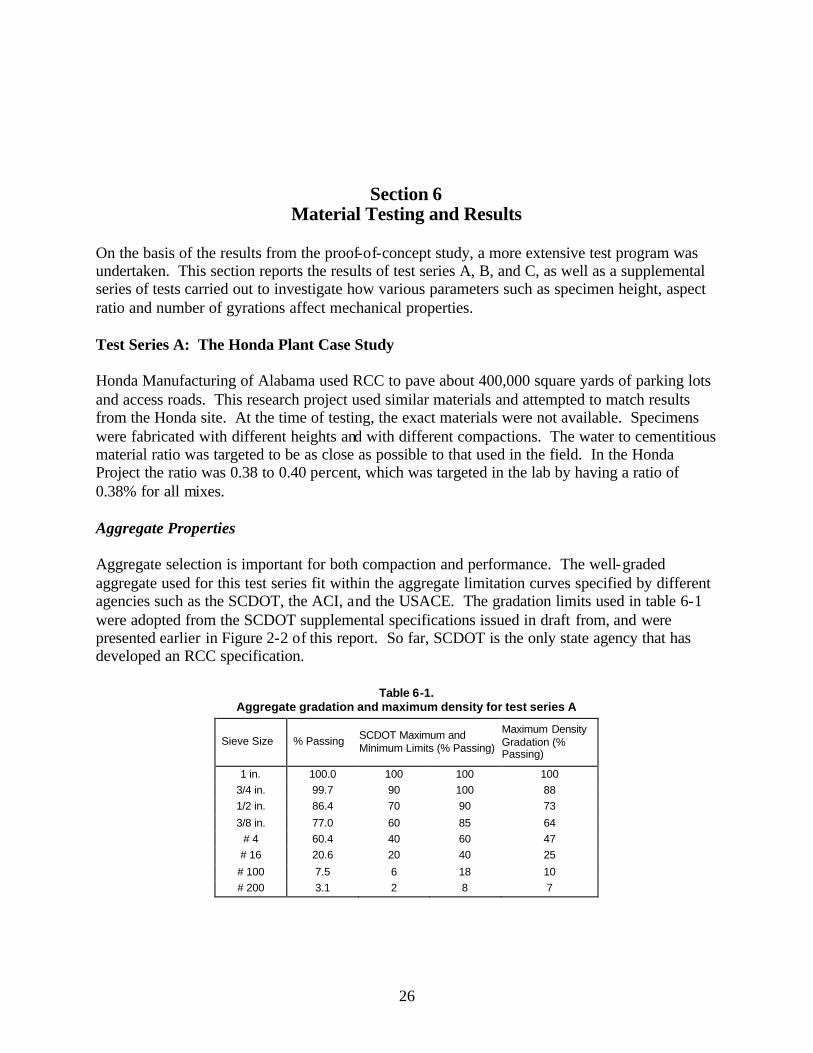
On the basis of the results from the proof-of-concept study, a more extensive test program was undertaken. This section reports the results of test series A, B, and C, as well as a supplemental series of tests carried out to investigate how various parameters such as specimen height, aspect ratio and number of gyrations affect mechanical properties. Test Series A: The Honda Plant Case Study Honda Manufacturing of Alabama used RCC to pave about 400,000 square yards of parking lots and access roads. This research project used similar materials and attempted to match results from the Honda site. At the time of testing, the exact materials were not available. Specimens were fabricated with different heights and with different compactions. The water to cementitious material ratio was targeted to be as close as possible to that used in the field. In the Honda Project the ratio was 0.38 to 0.40 percent, which was targeted in the lab by having a ratio of 0.38% for all mixes. Aggregate Properties Aggregate selection is important for both compaction and performance. The well-graded aggregate used for this test series fit within the aggregate limitation curves specified by different agencies such as the SCDOT, the ACI, and the USACE. The gradation limits used in table 6-1 were adopted from the SCDOT supplemental specifications issued in draft from, and were presented earlier in Figure 2-2 of this report. So far, SCDOT is the only state agency that has developed an RCC specification.
Table 6-1. Aggregate gradation and maximum density for test series A
Sieve Size % Passing SCDOT Maximum and Minimum Limits (% Passing)
Maximum Density Gradation (% Passing)
1 in. 100.0 100 100 100 3/4 in. 99.7 90 100 88 1/2 in. 86.4 70 90 73
3/8 in. 77.0 60 85 64 # 4 60.4 40 60 47 # 16 20.6 20 40 25
# 100 7.5 6 18 10 # 200 3.1 2 8 7

27
Table 6-1 and Figure 6-1 relate the aggregates used for test series A to approved gradation limits. The maximum and minimum limitations were taken from the SCDOT specifications. The maximum density curve in Figure 6-1 was calculated using the following equation.
P = (d/D)0.45 x 100
Where P is % passing, d is the sieve opening, and D is the maximum size of the aggregate (Malhotra, 1997). The maximum aggregate size was one inch, and the aggregate nominal size was ¾ inch .
0
10
20
30
40
50
60
70
80
90
100
0.001 0.01 0.1 1Sieve size, inches
CombinedMax LimitMin. LimitMaximum Density
Figure 6-1. Gradation for aggregates used for test series A
Test Specimens Specimens from the proof-of-concept testing in Section 5 indicated similar surface texture and strength results for 75 and 100 gyrations. Therefore, specimens with 75 and 100 gyrations were produced to see if there were any differences in terms of strength. The proof-of-concept testing had suggested that 50 gyrations would not give a well-compacted specimen. Compressive strength and splitting tensile results were obtained at one, three, seven, fourteen, and twenty eight days. A total of 40 specimens were fabricated for this purpose, as shown earlier in Table 4-2. Figure 6-2 shows the specimen surfaces with different numbers of gyrations. Strength Results and Comparison with the Honda Project Tables 6-2 and 6-3 summarize the compressive strength results with 75 and 100 gyrations, respectively. The tables present strength and density results for each specimen. Densities were

28
very consistent. This is of particular interest since the 40 specimens were produced on different days.
Figure 6-2. Different surface textures with different number of gyrations
Table 6-2. Compressive strength results for 75 gyrations – test series A
Sample ID Age (Days) Unit Weight (lb/ft3) Strength, psi
1 1 161.2 2,800
2 1 158.8 2,680
3 3 162.3 4,250
4 3 162.1 4,620
5 7 162.1 6,050
6 7 161.0 6,120
7 14 161.7 6,620
8 14 162.4 6,600
9 28 162.7 7,740
10 28 162.0 7,110

29
Table 6-3. Compressive strength results for 100 gyrations – test series A
Sample ID Age (days) Unit Weight (lb/ft3) Strength, psi
1 1 161.9 3,240
2 1 161.9 3,360
3 3 162.4 4,480
4 3 161.9 5,090
5 7 163.7 6,210
6 14 163.2 6,920
7 14 162.3 6,900
8 28 163.5 8,280
9 28 164.5 8,110
The compressive strength development shows a one-day strength average of 3,000 psi and an average strength of 8,100 psi after 28 days. These results are very close to the RCC strength result range in general, and the Honda plant strength results in particular. According to the Portland Cement Association (PCA), strength results range from 4,000 to 10,000 psi, between three and 28 days (Piggott 1999). Results are similar for 75 and 100 gyration specimens. Splitting tensile tests were performed according to ASTM C 496, and the results are shown in tables 6-4 and 6-5 for 75 and 100 gyrations, respectively. Pavements fail in flexure or tension, not in compression. Therefore, splitting tensile strength is an important pavement design parameter.
Table 6-4. Splitting tensile results for 75 gyrations – test series A
Sample ID Age (days) Unit Weight (lb/ft3) Strength, psi
1 1 159.1 327
2 1 161.0 365
3 3 160.1 526
4 3 161.5 483
5 7 162.1 625
6 7 162.9 639
7 14 161.7 748
8 14 161.6 754
9 28 161.9 770
10 28 163.2 823 The PCA reported ranges for splitting tensile strength are between 500 and 1000 psi (PCA 2001). The ACI reported ranges for RCC splitting tensile strength are between 400 and 600 psi at 28 days, and could exceed 600 psi (ACI Committee 325, 1995). Results of these tests performed in this research project fit within these ranges. Again there was little difference between 75 and 100 gyration specimens. Therefore, only 75 gyrations were applied for the Series B tests.

30
Table 6-5. Splitting tensile results for 100 gyrations – test series A
Sample ID Age (days) Unit Weight (lb/ft3) Strength, psi
1 1 161.9 367
2 1 162.2 343
3 3 163.2 481
4 3 162.1 539
5 7 163.0 685
6 7 162.3 632
7 14 161.6 792
8 14 163.0 756
9 28 161.5 816
10 28 164.1 791
Almost all the specimens tested for compressive strength had a cone break mode, particularly when the specimens were more than three days old. Failure modes are shown in Figure 6-3. In splitting tensile tests, all specimens had the type of failure shown in Figure 6-4.
Figure 6-3. Failure modes for specimens tested for compressive strength

31
Figure 6-4. Failure mode for specimens tested in splitting tension
Consistency of Unit Weight The samples gave consistent results for unit weight. Using the theoretical maximum density of 162.9 pcf and the actual unit weight of the specimens, the percentage compaction obtained using the gyratory compactor was calculated for each specimen before strength testing. Results were highly consistent. Out of 40 RCC specimens, the average compaction for those with 75 gyrations was 98.8 percent and for those with 100 gyrations was 99.5 percent. Figure 6-5 shows the relationship between unit weight increase and density with an increasing number of gyrations. Test Series B: The Mercedes Plant Case Study Test series B used different materials and proportions, and was limited to 20 specimens compacted to 75 gyrations. The materials were provided by A.G. Peltz Company. A different aggregate gradation was investigated, and a different cement type was used. Test series A used type I/II, while cement type I was used for this series. The aggregate gradation for test series B is shown in table 6-6. Compressive strength results for test series B are shown in Table 6-7. The compressive strength development shows a one-day average of 2,050 psi and a 28-day average strength of 7,010 psi. They are very close to the results obtained from test series A, but are a little lower. Splitting tensile strength results for test series B are shown in table 6-8. These results are also similar to those obtained from test series A, but a little lower.

32
130
135
140
145
150
155
160
165
0 10 20 30 40 50 60 70
Number of Gyrations
Uni
t Wei
ght (
pcf)
75 Gyrations
100 GyrationsTheoretical Maximum
Figure 6-5. Unit weight versus number of gyrations – test series A
Table 6-6. Aggregate gradation and maximum density for test series B
Sieve Size % Passing % Maximum and Minimum Limits
Maximum Density %
1 in. 100 100 100 100
3/4 in. 100 90 100 88
1/2 in. 95 70 90 73
3/8 in. 79 60 85 64
# 4 55 40 60 47
# 16 23 20 40 25
# 100 4 6 18 10
# 200 2 2 8 7
Influence of Compaction and Aspect Ratio on Mechanical Properties Tests were carried out to investigate the influence of several parameters on strength. The results are reported below.

33
Table 6-7.
Compressive strength results for 75 gyrations – test series B
Sample ID Age (days) Unit Weight (lb/ft3) Strength, psi
1 1 158.2 2020 2 1 159.2 2070 3 3 157.5 3750 4 3 157.6 3960 5 7 158.3 5290 6 7 158.3 5440 7 14 157.8 6030 8 14 157.6 5800 9 28 157.1 7030 10 28 158.6 6990
Table 6-8. Splitting tensile results for 75 gyrations – test series B
Sample ID Age (days) Unit Weight (lb/ft3) Strength, psi
1 1 157.6 340 2 1 158.6 354 3 3 159.4 440 4 3 157.0 476 5 7 158.2 544 6 7 157.0 560 7 14 157.6 610 8 14 157.5 648 9 28 157.9 688 10 28 158.8 705
Strength Development with a Different Number of Gyrations This investigation used the mix design from test series B with some modifications, because it was not possible to obtain the materials that had been used previously. Strength results after 28 days were nine percent lower due to a change in the aggregate gradation and moisture content. Results are shown in Table 6-9 and Figure 6-6. There is an increase in compressive strength with an increasing number of gyrations, a gain of 6.7 percent between 60 and 100 gyrations.
Table 6-9. Compressive strength with different number of gyrations
Sample Number of Gyrations
Age (days) Unit Weight (lb/ft3)
Compressive Strength (psi)
1 60 28 158.3 6740 2 60 28 158.5 6680 1 75 28 158.5 6950 2 75 28 159.9 7010 1 80 28 159.6 6820 2 80 28 160.3 7120 1 90 28 159.8 7000 2 90 28 160.4 6700 1 100 28 160.7 7120 2 100 28 160.0 7200

34
y = 10.865x + 6099.4R2 = 0.7413
6600
6700
6800
6900
7000
7100
7200
7300
55 60 65 70 75 80 85 90 95 100 105 110
Number of Gyrations
Com
pres
sive
Stre
ngth
(psi
)
Figure 6-6. Compressive strength development with increasing number of gyrations
Using a lower number of gyrations may more accurately duplicate field conditions, if the field compaction methods cannot produce the same density as a 75 gyration sample. The trends observed for splitting tensile strength are shown in Table 6-10 and Figure 6-7. Between 60 and 100 gyrations, splitting tensile strength increases about 6.9 percent.
Table 6-10.
Splitting tensile strength with different number of gyrations
Sample Number of Gyrations
Age (days) Unit Weight (lb/ft3)
Splitting Tensile (psi)
1 60 28 158.9 794
2 60 28 159.5 789
1 75 28 160.8 809
2 75 28 159.6 811
1 80 28 158.0 844
2 80 28 159.2 826
1 90 28 160.1 851
2 90 28 160.3 845
1 100 28 159.9 846
2 100 28 159.7 838

35
y = 1.3955x + 711.94R2 = 0.8211
780
790
800
810
820
830
840
850
860
55 60 65 70 75 80 85 90 95 100 105 110
Number of Gyrations
Ten
sile
Spl
ittin
g (p
si)
Figure 6-7. Splitting tensile development with increasing number of gyrations
Effect of Specimen Height on Strength As part of Test Series A, several specimens were made with different heights. Those specimens were tested to determine the effect of height and aspect ratio on strength. It was apparent that shorter specimens produced higher strengths. The results obtained from these tests are discussed by Amer (2002). As expected, this project found that the aspect ratio correction factors in ASTM C 39 were appropriate. Aspect ratio had virtually no effect on splitting tensile strength. Test Series C: RCC for Dams, Georgia Project Case Study A short test series was carried out to investigate whether the gyratory compactor specimens would also be representative of RCC for dams. Usually the maximum aggregate size for dams is between 1.5 and 3 inches. Compressive strength is lower for dams than for pavements, usually in the range of 2000 to 3000 psi after 28 days. As noted in Table 4-1, this test series consisted of only three compressive strength and three splitting tensile strength specimens.
Compressive strength was 2,270 to 2,450 psi, within the accepted range for dam projects. Splitting tensile strengths were 370 to 390 psi. This is much lower than the values obtained in test series A and B for pavements. The average unit weight for all specimens was 152.6 lb/ft3. The dam test series illustrates the applicability of gyratory compaction to a wide range of RCC mixtures, including dams.

36
Section 7 Comparison with Field Specimens
As noted in Section 1, one of the objectives of this research program was to validate that laboratory specimens have density and strength consistent with field specimens. Two methods were used to obtain field specimen properties. First, unpublished laboratory reports documenting the strength of the Honda and Mercedes plants were obtained. Second, a large number of test specimens were obtained from a test strip at the Mercedes plant. The Honda plant reported test results were compared to Test Series A. For this comparison, the results of the 75 and 100 gyration specimens were averaged. Test Series A compressive strength results were about 1.5 percent higher in the field at 28 days. The splitting tensile strength was only 0.04 percent higher. The Mercedes plant field test results were compared to Test Series B. For this comparison, the field compressive strength was 4.7 percent higher than the lab strength, but splitting tensile difference was less than 2.0 percent. The average Proctor dry density achieved in the field was145.6 pcf. The Proctor dry density may be compared with the laboratory measured density, which included the weight of the water, using the following relation (Atkins, 1997, Barksdale, 1991):
γd = γw / (1 + w)
where γd is the dry density, γw is the wet density, and w is the water content. For laboratory specimens, the wet density average for the same test series was 157.4 pcf. The dry density of the laboratory specimens was 147.5 lb/ft3, which was only 1.3 percent higher than the field density. For the project represented by test series B, a large number of broken flexural strength test beams were obtained from the testing laboratory. The beams were taken from six locations in the test strip, representing different compaction procedures. Some had been sawn from a test strip and some had been fabricated onsite during test strip construction using an impact hammer. These were drilled with a 3.75- inch core bit, and more than 50 cores were obtained. They were tested for density and either compressive or splitting tensile strength. Results are shown in Figures 7-1 and 7-2, along with best-fit lines. The 28-day, 75-gyration specimens from test series B are also shown on the figure. The laboratory specimens were consistent with the densest and strongest specimens. However, it seems clear that specimens in the 50 to 60 gyration range would provide a better approximation of field properties from this test strip. Unfortunately, the field specimens were obtained late in the project and it was not possible to test additional specimens in the 50 to 60 gyration range to verify this.

37
Figure 7-1. Compressive strength versus density, Test Series B
R2 = 0.5353
0
1000
2000
3000
4000
5000
6000
7000
8000
9000
10000
148 150 152 154 156 158 160
Density, pcf
Com
pres
sive
Str
engt
h, p
si
Core DataLaboratory SpecimensLinear (Core Data)
R2 = 0.5006
0
200
400
600
800
1000
1200
140 145 150 155 160
Density, pcf
Spl
ittin
g T
ensi
le S
tren
gth,
psi
Core DataLaboratory SpecimensLinear (Core Data)

38
Figure 7-2. Splitting tensile strength versus density, Test Series B

39
Section 8 Discussion of Results
Consistency of Results An important concern in the RCC industry has been the variability of results for fabricated test specimens. This is probably because different fabrication methods are used by various companies and agencies. Some of these methods give inconsistent results with different operators. Also, tests performed with the Vebe apparatus and the vibrating hammer are dependent on field and other conditions. The Vebe test does not always give reliable results, and therefore the vibrating hammer is more widely used. This project has shown that the gyratory compactor is better than either, and gives consistent results that may be calibrated to field test outcomes. The major difference between samples produced by the gyratory compactor and other machines is the consistency of the unit weight of the samples. Table 8-1 shows the compaction percentage of the specimens for the three test specimens, and shows a very low coefficient of variation for gyratory compactor specimens.
Table 8-1. Compaction percentage at 75 and 100 gyrations
Test Series Samples Tested Average Unit
Weight (lb/ft3) Standard Deviation
Coefficient of Variation (COV) TMCD Average
Compaction %
A 40 162.3 1.08 0.66 162.9 99.6%
B 20 156.65 1.54 0.99 157.4 99.5%
C 6 152.7 1.79 1.19 154.8 98.6%
Effect of Aspect Ratio on Strength For compressive strength testing, concrete cylinders typically have an aspect ratio of 2. ASTM C 39 provides reduction factors for aspect ratios between 1 and 1.8 (ASTM C39, 2000). The gyratory compactor is normally used to produce hot mix asphalt specimens with an aspect ratio of less than 1, but the aspect ratio is of no consequence since the asphalt specimens are not tested for strength. With the compactor used in this research, the maximum practical aspect ratio was approximately 1.17, unless the specimen was made in two layers. Therefore, specimens with varying aspect ratios were fabricated to investigate the appropriateness of the ASTM C 39 reduction factors. Strength and density results for RCC specimens with different aspect ratios, with and without applying the correction factors, are shown in Amer (2002). The ASTM C 39 correction factors are appropriate, and specimens with a minimum aspect ratio of 1.0 should be used for RCC compression testing, with the correction factor of 0.87.
40
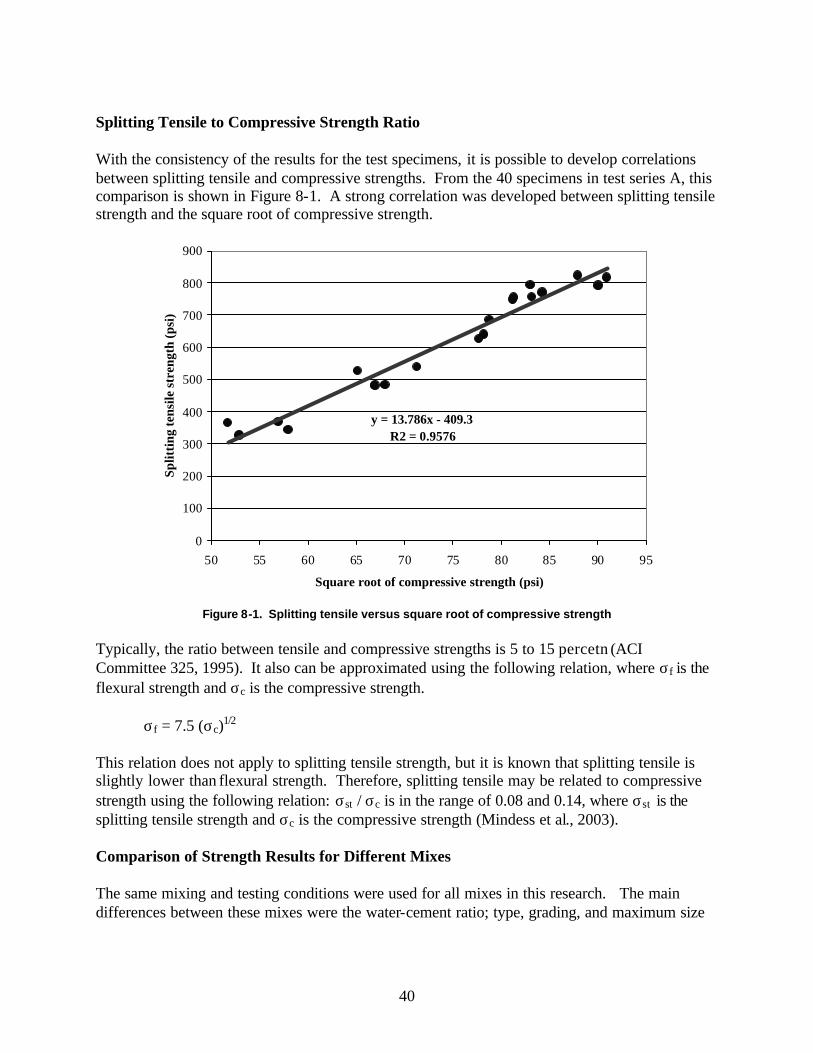
Splitting Tensile to Compressive Strength Ratio With the consistency of the results for the test specimens, it is possible to develop correlations between splitting tensile and compressive strengths. From the 40 specimens in test series A, this comparison is shown in Figure 8-1. A strong correlation was developed between splitting tensile strength and the square root of compressive strength.
y = 13.786x - 409.3R2 = 0.9576
0
100
200
300
400
500
600
700
800
900
50 55 60 65 70 75 80 85 90 95
Square root of compressive strength (psi)
Split
ting
tens
ile s
tren
gth
(psi
)
Figure 8-1. Splitting tensile versus square root of compressive strength
Typically, the ratio between tensile and compressive strengths is 5 to 15 percetn (ACI Committee 325, 1995). It also can be approximated using the following relation, where σf is the flexural strength and σc is the compressive strength.
σf = 7.5 (σc)1/2 This relation does not apply to splitting tensile strength, but it is known that splitting tensile is slightly lower than flexural strength. Therefore, splitting tensile may be related to compressive strength using the following relation: σst / σc is in the range of 0.08 and 0.14, where σst is the
splitting tensile strength and σc is the compressive strength (Mindess et al., 2003). Comparison of Strength Results for Different Mixes The same mixing and testing conditions were used for all mixes in this research. The main differences between these mixes were the water-cement ratio; type, grading, and maximum size

41
of aggregates; ratio of cement to the aggregates; and ratio of fine aggregates to the mix. The mix design of RCC for dams had a much higher water-cement ratio and a higher fine aggregate content than pavement test series A and B. Consequently, the strength results were much lower and did not exceed 2500 psi after 28 days; whereas this value was reached after one day with mixes A and B. This is consistent with field experience. Feasibility of Using the Gyratory Compactor for RCC Strength and density results for RCC specimens fabricated by the gyratory compactor were consistent. Over the course of seven months 90 specimens were produced with several mixtures over a range of densities. Unfortunately, the laboratory program was essentially completed before field specimens were obtained, but satisfactory agreement was obtained between the laboratory specimens and the denser and stronger field specimens. Although more work remains to be done, the results indicate that it is possible to replicate field properties in the laboratory using the gyratory compactor.
Proper Number of Gyrations Close to 90 specimens were used for testing in this research. Before performing any of the tests, trials were conducted to estimate the suitable number of gyrations. One group of specimens was compacted to 40 gyrations. These suffered from edge chipping and breakage when the specimens were removed from the mold. Others broke apart in the water tank due to inadequate compaction. Specimens compacted with 50 gyrations were dense enough to avoid chipping and breakage, but had a rough surface. Therefore, it can be concluded that 45 to 50 gyrations are the minimum to make sure the specimens are not damaged during removal from the compactor. Compacting the RCC specimens to 50 through 100 gyrations gave consistent results for density. With the gyratory compactor, it is possible to produce specimens with densities approximately 96 to 100% of the theoretical maximum constituent density (TMCD). However, since this degree of compaction may not be practical in the field, the proper number of gyrations is probably between 50 and 75. As shown in figures 7-1 and 7-2, the strength and density of the 75 gyration specimens are higher than most field cores.
42
Section 9 Summary and Conclusions
One important obstacle to increased use of RCC has been the difficulty of fabricating laboratory specimens to accurately replicate field mechanical properties. In the past, it was difficult to predict the mechanical properties and performance of a given RCC mixture. A possible way to overcome this impediment to the further development of RCC was investigated in this project, using a gyratory compactor to fabricate specimens to a desired density. This research found that strength and density results for RCC specimens fabricated using the gyratory compactor were consistent. Satisfactory agreement with field results was obtained. Therefore, the feasibility of using the gyratory compactor for RCC has been demonstrated. This method has advantages over the other methods presently used to compact laboratory specimens. The results presented support the following findings, for the range of mixtures and densities considered: • Compressive strength increases with increasing density. • Splitting tensile strength increases with increasing density. • The specimen height correction factors used with ASTM C 39 for concrete cylinders are appropriate for use with RCC specimens made using the gyratory compactor. • Splitting tensile strength is strongly correlated with compressive strength. The appropriate number of gyrations will depend on the degree of compaction obtained with the placement and compaction equipment used for the project, but will probably be in the range of 50 to 75 to replicate fair and excellent compaction, respectively. Because the mechanical properties of RCC vary considerably with the degree of compaction, the use of the gyratory compactor makes it possible to predict strength through a range of field densities, and also to quantify the benefits of improved compaction methods. For the immediate future, the gyratory compactor will probably be more useful as a research tool for RCC, and for optimizing mixture proportions for large projects. In the long term, gyratory compaction can be adopted for quality control and quality assurance of RCC construction.

43
Section 10
Future Research The consistency of testing and agreement with field results suggest a number of promising areas for future research to improve the performance and reduce the cost of RCC. In the past, the need to investigate project mixtures through test strips made it difficult to find optimum aggregate gradations and binder contents. A promising area is the use of supplementary cementitious materials in RCC. Different volumes of fly ash and slag (replacing cement) may be investigated. Other materials such as bottom ash, fly ash that does not meet ASTM C or F specification, or crusher fines may prove acceptable as RCC constituents. Malhotra (2002) has suggested the use of concrete pavement with a high volume of fly ash in developing countries, both to reduce life cycle costs and to use the abundance of fly ash in those countries. High-volume fly ash RCC can address this need even more economically. The test strips and laboratory test series investigated during this project produced specimens with higher density than required by typical specifications. The SCDOT specification requires a compressive strength of 2,000 psi at three days and 5,000 psi at 28 days (SCDOT, 2002). The Canadian Portland Cement Association recommends a 28 day compressive strength of 4,400 psi and a 90 day flexural strength of 580 psi (CPCA, 1995). The test results obtained during this research show that these values may be easily exceeded. Another area of research is freeze-thaw durability of RCC. Typically freeze-thaw resistance of concrete is obtained through air entrainment, but it is difficult to entrain air in RCC. Nevertheless, RCC has been durable in harsh environments. The gyratory compactor may be used to fabricate specimens to investigate the effect of density on freeze-thaw resistance of RCC. Recently the South Carolina Department of Transportation placed an 8- inch thick 1,000-foot RCC public roadway test section near Aiken, S.C. This pavement has no asphalt overlay, and the performance has been good so far. Rideability is still a problem, and it is possible that further research will produce RCC mixtures that can be built more smoothly. Further tests may be carried out on different mix designs and materials to improve the performance of RCC pavements. The following are some of points that could be studied:
• Investigate slag-based RCC for possible improved durability; • Examine by-products in general (e.g. bottom ash) for possible lower cost mix designs; • Develop a standardized procedure for the use of the gyratory compactor for RCC mixes;
and • Investigate freeze/thaw durability of RCC specimens.

44
Section 11 References
ACI Committee 325 (1995). “State-of-the-Art Report on Roller-Compacted Concrete
Pavements.” Committee 325.10R-95, Farmington Hills, MI. ACI Committee 207 (1999). “Roller-Compacted Mass Concrete.” Committee 207.5R-99,
Farmington Hills, MI. ACI Committee 309 (2000). “Compaction of Roller Compacted Concrete.” Committee 309.5R-
00, Farmington Hills, MI. ACI Committee 211 (2002). “Guide for Selecting Proportions for No-Slump Concrete,” ACI
211.3R-02, Farmington Hills, MI. Amer, Nader, Development and Validations of a New Test Method for Fabricating RCC
Specimens, MSCE Thesis, The University of Alabama at Birmingham, August 2002. ASTM C 39. (2002). “Standard Test Method for Compressive Strength of Cylindrical Concrete
Specimens.” C39–93a, Philadelphia, PA. ASTM C 127. (2002). “Standard Test Method for Specific Gravity and Absorption of Coarse
Aggregate.” C 127-88, Philadelphia, PA. ASTM C 136. (2002). “Standard Test Method for Sieve Analysis of Fine and Coarse
Aggregates.” C 136-95a, Philadelphia, PA. ASTM C 143. (2002). “Standard Test Method for Slump of Hydraulic Cement Concrete.” C
143-90a, Philadelphia, Pa. ASTM C 150 (2002). “Standard Specification for Portland Cement,” C 150-90a, Philadelphia,
PA. ASTM C 496. (2002). “Standard Test Method for Splitting Tensile Strength of Cylindrical
Concrete Specimens.” C 496-90, Philadelphia, PA. ASTM C 1170. (2002). “Standard Test Method for Determining Consistency and Density of
Roller-Compacted Concrete Using a Vibrating Table.” C 1170-91, Philadelphia, PA. ASTM C 1176. (2002). “Making Roller-Compacted Concrete in Cylinder Molds Using a
Vibrating Table.” C 1176-92, Philadelphia, PA. ASTM D 4013. (2002). “Standard Practice for Preparation of Test Specimens of Bituminous
Mixtures by Means of Gyratory Shear Compactor.” D 4013-81, Philadelphia, PA. Atkins, Harold N. (1997). “Highway Materials, Soils, and Concretes.” Prentice Hall, Inc.,
Upper Saddle River, N.J. Banthia, N., Pigeon, M., Marchand, J., and Boisvert, J. (1992). “Permeability of Roller
Compacted Concrete.” Journal of Materials in Civil Engineering. Vol. 4, p. 27-40. Barksdale, R. D. (1991). “The Aggregate Handbook.” National Stone Association, Washington,
D.C. Barksdale, R. D. (1998). “The Aggregate Handbook Supplement.” National Stone Association,
Washington, D.C.

45
Canadian Portland Cement Association (CPCA), Suggested Specification for Roller Compacted Concrete Paving for Municipal and Industrial Applications, CP014.01P, 1995.05.26.
Delagrave, A., Marchand, J., Pigeon, M., and Boisvert, J. (1997). “Deicer Salt Scaling Resistance of Roller Compacted Concrete Pavement.” ACI Materials Journal, v 94, Farmington Hills, MI, p 164-169.
Garrett, R. (2002). “Roller-Compacted Concrete Beats Out Asphalt.” Construction Equipment, Mar., pp. 44-48.
Halstead, G. E. (2003) “RCC and Producers: The Right Mix,” The Concrete Producer,” January 2003.
Malhotra, V. M. (1997). “Roller Compacted Concrete.” Advances in Concrete Technology, ACI SP - 171. Auckland, New Zealand.
Malhotra, V. M. (2002). High-Performance High-Volume Fly Ash Concrete. Concrete International, V. 24, No. 7. July.
Marchand, J., and Reid E. (1997). “High-Performance Roller-Compacted Concrete Used to Pave an Area the Size of 25 Football Fields.” www.usherb.ca. Accessed 7/9/2001.
Mindess, S., Young, J. F., and Darwin, D. (2003). “Concrete.” 2nd Edition, Prentice Hall, Inc., Englewood Cliffs, N.J.
Moore, W. (2002). “RCC Edges its Way Into New Markets,” Construction Equipment: Paving Report, Feb., pp. 48-50.
PCA (2001). “Honda Makes it Simple with RCC Pavement.” RCC Newsletter. Vol. 17, No. 1. Portland Cement Association, Skokie, IL.
Piggott, Robert W. (1999). “Roller Compacted Concrete Pavements – A Study of Long Term Performance”, Portland Cement Concrete – “Research & Development” RP366.01P.
Pine Instrument Company (PIN). (2000). AFGB1A Brovold Gyratory Compactor Operation Manual. (2000). Grove City, PA
Rapid to Construct, Rapid to Open for Traffic, Concrete Pavement, RCCP, http://www.watanabegumi.co.jp/pavements/concretes/rccpe.html, accessed January 23, 2003.
South Carolina Department of Transportation (SCDOT). (2001). Supplemental Specifications: Roller Compacted Concrete Pavement, Draft.
U.S. Army Corps of Engineers (USACE). (1995). “Roller Compacted Concrete Pavement Design and Construction,” Engineer Technical Letter 1110-3-475, Department of the Army, Washington, D.C.

46
Section 12
Acknowledgements
This research is sponsored by the University Transportation Center for Alabama (UTCA) as project 01231 “Improved Management of RCC Pavement Technology.” Special thanks are due to the steering committee consisting of Fares Abdo (Law-Gibb), Will Gray (A. G. Peltz), Stuart Malley (Vulcan Materials), and Robert Taylor (Southeast Chapter American Concrete Pavement Association). Andrew M. Johnson of the South Carolina Department of Transportation provided valuable information about a recent highway project. The assistance of Richard Hawkins (UAB), Jan Prusinski, David Luhr (PCA), David Smith, and James Utter (Vulcan Materials) is gratefully acknowledged. Materials were provided by Vulcan Materials Company, Lehigh Cement, and Holcim. Helpful technical assistance was provided by Vulcan Materials Company, A.G. Peltz Group LLC, and LawGibb Group. The views in this report reflect those of the authors, and do not necessarily represent the sponsors’ views.

47
Section 13 Appendix A – List of Abbreviations
ACI American Concrete Institute ASTM American Society for Testing and Materials CTB Cement Treated Base ESAL Equivalent FHWA Federal Highway Administration NMSA Nominal Maximum Size Aggregate PCA Portland Cement Association PCC Portland Cement Concrete RCC Roller Compacted Concrete SCDOT South Carolina Department of Transportation SHRP Strategic Highway Research Program TMCD Theoretical Maximum Constituent Density UAB University of Alabama at Birmingham UTCA University Transportation Center for Alabama USACE United States Army Corps of Engineers