improved hazard assessment, effect of water table height on displacement rate, and failure plane...
TRANSCRIPT

Improved Hazard Assessment, Effect of Improved Hazard Assessment, Effect of Water Table Height on Displacement Rate, Water Table Height on Displacement Rate,
and Failure Plane Rheology from Nine Years and Failure Plane Rheology from Nine Years of Monitoring of the Sherwood Hills Slump, of Monitoring of the Sherwood Hills Slump,
Provo, UtahProvo, Utah
Michael P. Bunds, Daniel Horns, Brittany UngermanMichael P. Bunds, Daniel Horns, Brittany UngermanDepartment of Earth Science, Utah Valley UniversityDepartment of Earth Science, Utah Valley University
[email protected]@uvu.edu

• Overview of landslideOverview of landslide• Objectives & methodsObjectives & methods• ResultsResults• Interpretations and ImplicationsInterpretations and Implications
Talk OutlineTalk Outline

Sherwood Hills Landslide Sherwood Hills Landslide LocationLocation
N
500 m
Wasatch fault
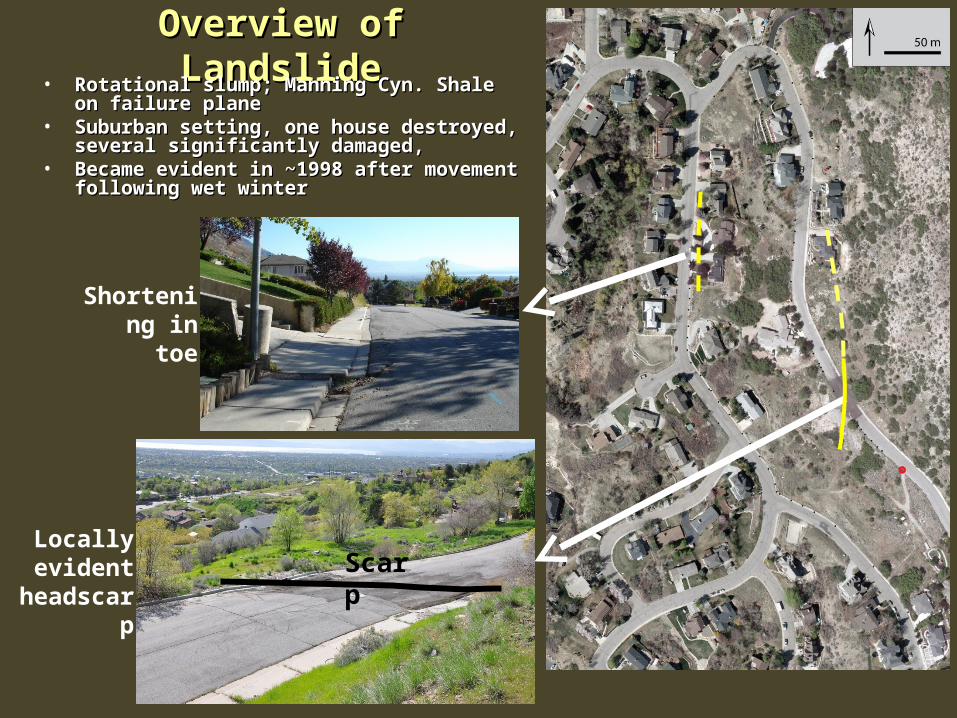
Overview of LandslideOverview of Landslide• Rotational slump; Manning Cyn. Shale on Rotational slump; Manning Cyn. Shale on
failure planefailure plane• Suburban setting, one house destroyed, Suburban setting, one house destroyed,
several significantly damaged,several significantly damaged,• Became evident in ~1998 after movement Became evident in ~1998 after movement
following wet winter following wet winter
Scarp
Shortening in toe
Locally evident
headscarp

• Undergraduate student-driven researchUndergraduate student-driven research• Long term (since 2004): track movement of the slumpLong term (since 2004): track movement of the slump• Delineate extent of slumpDelineate extent of slump• Compare sensitivity of measured displacement to other Compare sensitivity of measured displacement to other
movement indicatorsmovement indicators• Track WT height, relate it to displacementsTrack WT height, relate it to displacements
Study ObjectivesStudy Objectives

MethodsMethods
• Displacements measured using RTK GPS; referenced to off-Displacements measured using RTK GPS; referenced to off-slump stable markersslump stable markers
• ~1 cm precision on bulk slump movement referenced to stable ~1 cm precision on bulk slump movement referenced to stable off-slump markersoff-slump markers
• ~2 to 5 surveys per year since 2004~2 to 5 surveys per year since 2004• Water table heights measured by UGS and usWater table heights measured by UGS and us

Landslide Landslide DisplacementsDisplacements
• Max 65.8 cm motion since Max 65.8 cm motion since March 2004March 2004
• Yellow/Yellow/greengreen vectors are total vectors are total accumulated displacement accumulated displacement from March 2004 to May 2013from March 2004 to May 2013
• RedRed vectors are displacement vectors are displacement from September 2006 to May from September 2006 to May 20132013
Well SH1Well SH1 ~X-section lin
e
~X-section lin
e
Modified from Ashland, 2006

Slump Displacement and Water Slump Displacement and Water Table HeightTable Height
• Displacement increases during wet, high WT Displacement increases during wet, high WT yearsyears
• Slump moves during dry (& wet) yearsSlump moves during dry (& wet) years• Slow movement during dry years does not Slow movement during dry years does not
produce features that record movementproduce features that record movement• Slump may have been active when decision to Slump may have been active when decision to
develop was madedevelop was made
Slum
p D
ispl
acem
ent (
dm)
Wat
er T
able
Hei
ght (
m)
Date
slump
displac
emen
t
wat
er ta
ble
Well SH1Well SH1

Implications: Landslide Implications: Landslide BoundariesBoundaries
• Larger & more consistent Larger & more consistent movement to north than expectedmovement to north than expected
• Diffuse and/or complicated Diffuse and/or complicated boundariesboundaries
• Where is the toe?Where is the toe?
?
?
Modified from Ashland, 2006

Water Table and Displacement RateWater Table and Displacement RateM
inim
um D
ispl
acem
ent R
ate,
mm
/yr
Water Table Height, m
• Displacement rates are Displacement rates are minimums for time periods minimums for time periods between surveysbetween surveys
• Water table heights are Water table heights are average of measurements average of measurements over 1 month prior to surveyover 1 month prior to survey
• Best-fit model is exponential, Best-fit model is exponential, • DR = 1.49 *eDR = 1.49 *e(1.05*WT) (1.05*WT) + 19.6+ 19.6• RR22 = 0.78 = 0.78
• Implies maximum DR ~ 7 m/yr if Implies maximum DR ~ 7 m/yr if WT were to reach ground WT were to reach ground surface, surface, but this is sensitive to but this is sensitive to data and model fitdata and model fit
grou
nd s
urfa
ce
DR = 1.49*e(1.05*WT) + 19.66R2 = 0.78
Slum
p D
ispl
acem
ent (
dm)
Wat
er T
able
Hei
ght (
m)
Date
slump
displac
emen
t
wat
er ta
ble

Rheological ModelRheological Model
• Assumes Mohr-Coulomb rheologyAssumes Mohr-Coulomb rheology• Equate effect frictional state at elevated WT (& Pf) to an equivalent effective Equate effect frictional state at elevated WT (& Pf) to an equivalent effective
shear stress (at 0 Pf)shear stress (at 0 Pf)• 0.21 friction coefficient (0.21 friction coefficient (φφ = 12 = 12oo) [Derived from method of slices FoS=1.01]) [Derived from method of slices FoS=1.01]• Two geometriesTwo geometries
initial state of stress
Effect of WT on state of stress
= 0.21
state of stress at elevated WTeffect of Pf (WT)
= 0.21
Equivalent shear stress
initial state of stressshear stress equivalent
to Pf (WT) change
Min
imum
Dis
plac
emen
t Rat
e, m
m/y
r
Water Table Height, m
Stra
in ra
te, 1
/s
Effective shear stress, kPa

Rheological Model GeometriesRheological Model Geometries
22.7o Glide Plane
10o Glide Plane
Modified from Ashland, 2006

Rheological Model DerivationRheological Model Derivation• Relates ‘effective shear stress’ on glide plane to shear strain rate (de/dt)Relates ‘effective shear stress’ on glide plane to shear strain rate (de/dt)• Strain rate derived directly from displacement rate: Strain rate derived directly from displacement rate: de/dt = DR/(glide plane thickness) = DR/0.5 mde/dt = DR/(glide plane thickness) = DR/0.5 m
• Effective shear stress is change in shear stress that produces same change in Effective shear stress is change in shear stress that produces same change in frictional stability as increase in pore fluid pressure from a rise in WTfrictional stability as increase in pore fluid pressure from a rise in WT
• Shear stress, Shear stress, ss • Magnitude in absence of PMagnitude in absence of P ff calc’d using calc’d using =2000kg/m=2000kg/m33, 8.2m depth, glide plane dip, fundamental eqn’s of , 8.2m depth, glide plane dip, fundamental eqn’s of
stress, assume stress, assume horizontalhorizontal=0=0• 57.4 & 27.6 kPa for 22.7 & 1057.4 & 27.6 kPa for 22.7 & 10oo dips dips
• Effect of WT change (‘effective shear stress’)Effect of WT change (‘effective shear stress’)• Calculate change inCalculate change in ss equivalent to change in effectiveequivalent to change in effective nn caused by WT rise using, caused by WT rise using, ss==**nn – P – Pff) + C) + Coo: :
ss= = * P* Pf f
• For 1 m rise in WT PFor 1 m rise in WT Pff increases ~9.8kPa, increases ~9.8kPa, ss= 0.227*9.8kPa = 2.1 kPa= 0.227*9.8kPa = 2.1 kPa

Effective shear stress, kPa
Rheological Model ResultsRheological Model Results• Like WT vs DR, highly nonlinear; exponentials provide best-fit curvesLike WT vs DR, highly nonlinear; exponentials provide best-fit curves• Closer to brittle behavior than more linear response (e.g., power-law)Closer to brittle behavior than more linear response (e.g., power-law)• 22.722.7oo dip: de/dt = 6.5E-23 dip: de/dt = 6.5E-23*e(0.48*s) + 1.25E-9+ 1.25E-9• 1010oo dip: de/dt = 1.3E-16* dip: de/dt = 1.3E-16*ee(0.48*(0.48*s) s) + 1.25E-9+ 1.25E-9• RR22 = 0.78 = 0.78
Stra
in ra
te, 1
/s
22.7o dip10o dip

ConclusionsConclusions• Slump most likely was active prior when decision to develop Slump most likely was active prior when decision to develop
neighborhood was madeneighborhood was made
• Slump moves every year but only produces obvious Slump moves every year but only produces obvious geomorphic evidence during wet, large displacement yearsgeomorphic evidence during wet, large displacement years
• Slump boundaries are complicated/diffuseSlump boundaries are complicated/diffuse
• Slump displacement is highly dependent on water tableSlump displacement is highly dependent on water table
• Data suggest ~7m/yr displacement rate is possible result in Data suggest ~7m/yr displacement rate is possible result in the unlikely event WT were to reach ground surface, but this the unlikely event WT were to reach ground surface, but this is sensitive to data and model fitis sensitive to data and model fit
• Strain rate in glide plane as a function of effective stress is Strain rate in glide plane as a function of effective stress is well modeled by exponential functionwell modeled by exponential function


EXTRAS

Some Student Participants in this Work Some Student Participants in this Work

Survey Reference Survey Reference Point StabilityPoint Stability
• Position since 2006 determined Position since 2006 determined using NGS OPUS system – using NGS OPUS system – regional frameworkregional framework
• Within error, reference point has Within error, reference point has not movednot moved

Landslide Landslide DisplacementsDisplacements
Motion (cm)Surveymarker Total azimuth plunge
mhd13 65.1 229.9 23.1
mhd15 65.8 230.2 24.8
mhd20 55.0 234.2 20.1
Average 62.0 231.4 22.7average

House damage
near head scarp

Slump Motion

GPS base set-up

RTK rover with bipod and Zephyr
Geodetic antenna
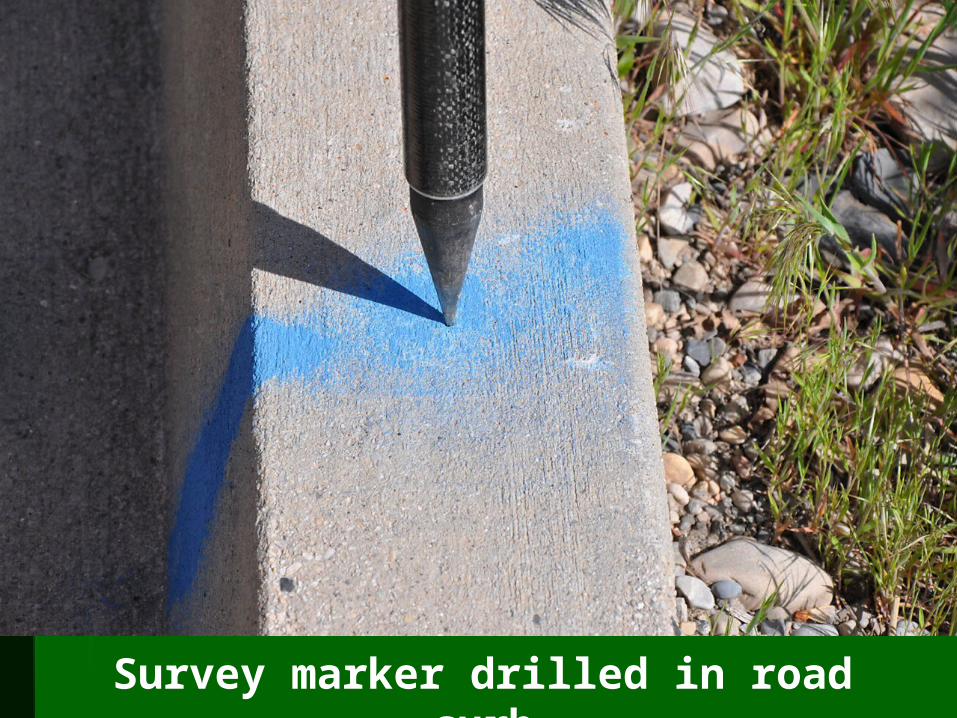
Survey marker drilled in road curb

Horizontal Error
RTK Rapid Point Method using bipod
set-up, Zephyr Geodetic antenna
Single measurement + 1.33 cm, 95% c.i.
Four measurements+ 0.55 cm, 90% c.i.

36.7
37.631.932.333.440.540.838.336.7
34.1
29.1
13.39.29.4
11.613.311.039.936.524.015.5
6.10.82.20.7
Near headscarp
north end toe