improved dissolution and bioavailability of silymarin ... · improved dissolution and...
TRANSCRIPT

w.sciencedirect.com
a s i a n j o u r n a l o f p h a rma c e u t i c a l s c i e n c e s 1 0 ( 2 0 1 5 ) 1 9 4e2 0 2
HOSTED BY Available online at ww
ScienceDirect
journal homepage: ht tp: / /ees.e lsevier .com/ajps/defaul t .asp
Original Research Paper
Improved dissolution and bioavailabilityof silymarin delivered by a solid dispersionprepared using supercritical fluids
Gang Yang a, Yaping Zhao b, Nianping Feng a,*, Yongtai Zhang a,Ying Liu a, Beilei Dang a
a School of Pharmacy, Shanghai University of Traditional Chinese Medicine, Shanghai 201203, Chinab School of Chemistry and Chemical Engineering, Shanghai Jiao Tong University, Shanghai 200240, China
a r t i c l e i n f o
Article history:
Received 8 October 2014
Received in revised form
8 December 2014
Accepted 13 December 2014
Available online 26 December 2014
Keywords:
Silymarin
Solution-enhanced dispersion by
supercritical fluids
Solid dispersion
Dissolution
Bioavailability
Abbreviations: HPMC, hydroxypropyl methsolution-enhanced dispersion by supercritic* Corresponding author. School of Pharmacy201203, China. Tel./fax: þ86 21 51322198.E-mail addresses: [email protected], npf
Peer review under responsibility of Shenyanhttp://dx.doi.org/10.1016/j.ajps.2014.12.0011818-0876/© 2014 Shenyang PharmaceuticalCC BY-NC-ND license (http://creativecommo
a b s t r a c t
The objective of this study was to improve the dissolution and bioavailability of silymarin
(SM). Solid dispersions (SDs) were prepared using solution-enhanced dispersion by su-
percritical fluids (SEDS) and evaluated in vitro and in vivo, compared with pure SM powder.
The particle sizes, stability, and contents of residual solvent of the prepared SM-SDs with
SEDS and solvent evaporation (SE) were investigated. Four polymer matrix materials were
evaluated for the preparation of SM-SD-SEDS, and the hydrophilic polymer, polyvinyl
pyrrolidone K17, was selected with a ratio of 1:5 between SM and the polymer. Physico-
chemical analyses using X-ray diffraction and differential scanning calorimetry indicated
that SM was dispersed in SD in an amorphous state. The optimized SM-SD-SEDS showed
no loss of SM after storage for 6 months and negligible residual solvent (ethanol) was
detected using gas chromatography. In vitro drug release was increased from the SM-SD-
SEDS, as compared with pure SM powder or SM-SD-SE. In vivo, the area under the rat
plasma SM concentration-time curve and the maximum plasma SM concentration were
2.4-fold and 1.9-fold higher, respectively, after oral administration of SM-SD-SEDS as
compared with an aqueous SM suspension. These results illustrated the potential of using
SEDS to prepare SM-SD, further improving the biopharmaceutical properties of this
compound.
© 2014 Shenyang Pharmaceutical University. Production and hosting by Elsevier B.V. This is
an open access article under the CC BY-NC-ND license (http://creativecommons.org/
licenses/by-nc-nd/4.0/).
ylcellulose; PVP, polyvinyl pyrrolidone; SD, solid dispersion; SE, solution evaporation; SEDS,al fluids; SM, silymarin., Shanghai University of Traditional Chinese Medicine, No. 1200, Cailun Road, Shanghai
[email protected] (N. Feng).
g Pharmaceutical University.
University. Production and hosting by Elsevier B.V. This is an open access article under thens.org/licenses/by-nc-nd/4.0/).

a s i a n j o u rn a l o f p h a rma c e u t i c a l s c i e n c e s 1 0 ( 2 0 1 5 ) 1 9 4e2 0 2 195
1. Introduction
Silymarin (SM), an extract of Silybum marianum (L.), contains a
mixture of four flavonolignan isomers: silibinin (70e80%),
silycristin (20%), silydianin (10%), and isosilybin (0.5%) [1,2].
Silybin is therefore the major component of SM and is
responsible for its pharmacological activity. SM has tradi-
tionally been self-administered for the treatment of liver
disorders [3,4]. The effects of SM on the liver have been
attributed to its inhibition of hepatotoxin binding to receptor
sites on the hepatocyte membrane; inhibition of glutathione
oxidation, increasing its levels in the liver and intestine;
antioxidant activity; and stimulation of ribosomal RNA poly-
merase and subsequent protein synthesis, leading to
enhanced hepatocyte regeneration [5]. However, the effec-
tiveness of SM as a liver disease remedy is limited by its poor
aqueous solubility, resulting in low oral bioavailability due to
poor enteral absorption [6]. Recently, various vehicles have
been employed to improve the solubility and bioavailability of
SM, such as solid lipid nanoparticles, microemulsion systems,
liposomes, and solid dispersions (SDs) [7e10].
SDs have been used widely to enhance the dissolution rate
of drugs with low aqueous solubility. In SD systems, a drug
may exist as an amorphous form within a polymeric carrier.
This may result in an increased drug dissolution rate, as
comparedwith its crystalline form. Themechanisms involved
in this SD-mediated enhancement of drug dissolution have
been proposed by several investigators [11,12].
SDs can be prepared using a range of methods, such as
melting, solvent evaporation, solvent melting, spray-drying,
and supercritical fluid techniques. Supercritical fluid ap-
proaches have several advantages over more conventional
preparation methods, including the ability to reduce residual
organic solvent levels and to produce SDs with smaller particle
sizes and better flowability [13]. There are several variants of
supercritical fluid techniques, including rapid expansion of su-
percritical solutions, particles fromgas-saturated solutions, gas
antisolvent process, supercritical anti-solvent process, precipi-
tation fromcompressedanti-solvent, aerosol solvent extraction
system, and solution-enhanced dispersion by supercritical
fluids (SEDS). SEDSprovides themost promisingmethod for the
preparation of SD [14]. It uses semi-continuous processes to
atomize the solution into a supercritical atmosphere. Provided
that thedrug issparingly soluble in thesupercriticalfluid,which
is highly soluble in the solvent, the supercritical fluid in the
solvent droplets canproduce anantisolvent effect. This process
produces super-saturated solutions, facilitating precipitation of
the solid in the form of small particles [15].
In the current study, SEDS was used to establish an SD
delivery system for oral administration of SM, with the aim of
enhancing drug dissolution and bioavailability. The physico-
chemical properties of SD prepared using several polymer
materials were investigated, including polyvinyl pyrrolidone
(PVP) K17, PVP K30, hydroxypropyl methylcellulose (HPMC)
K4M, and HPMC K15M. In addition, analyses of stability and
residual solvent were performed to compare SM-SD prepared
by SEDS and by solvent evaporation (SE). In vitro dissolution
and in vivo pharmacokinetics were analyzed to assess the SM-
SD-SEDS.
2. Materials and methods
2.1. Materials
SM (purity >80%) and PVP K17 were purchased from Dalian
Meilun Biotech Co., Ltd. (Dalian, China). PVP K30 was obtained
from Sinopharm Chemical Reagent Co., Ltd. (Shanghai,
China). HPMC K4M and HPMC K15M were supplied from Col-
orcon (USA). Carbon dioxide (CO2) with a purity of 99.99% was
obtained from Shanghai Jiao Tong University (Shanghai,
China). All other chemicals were reagent grade and used as
received.
2.2. Animals
Animal studies of male Wistar rats weighing 250 ± 10 g were
conducted with the approval of the Animal Ethical Commit-
tee, Shanghai University of Traditional Chinese Medicine. The
animals were kept in an agreeable environment with free
access to a rodent diet and water and were acclimatized for at
least 1 week before the start of the study.
2.3. Preparation of SM-SD
The supercritical pilot plant at Nantong Huaxing Petroleum
Devices Co., Ltd. (Nantong, China), shown in a schematic di-
agram in Fig. 1A, was employed in this study. Briefly, this
apparatus included three major components: a CO2 delivery
system, an organic solution delivery system, and a precipita-
tion system. The supercritical CO2 and the organic solution
were separately pumped into the high pressure vessel through
different inlets of the coaxial nozzle (the diameter of inner
tubule was 0.2 mm and diameter of outside part was 1 mm)
and continuously discharged from the bottom. The inner
structure of the nozzle is shown in Fig. 1B. For preparation of
SM-SD, CO2 from the cylinder (Fig. 1A, 1) was refrigerated (2)
and compressed to 15 MPa by the high-pressure pump (3)
before the temperature controlling system (6) was activated to
increase the temperature to 50 �C. The pressure of the pre-
cipitation system was increased by injection of CO2 until the
pressure reached 15 MPa. After the pressure and temperature
of the view vessel (9) reached the required values, valve C was
adjusted tomaintain constant pressure in the vessel. Then SM
and the excipients with the weight ratio of 1:5 (based on the
results of preliminary experiment) were separately dissolved
or dispersed in ethanol and amixture of dichloromethane and
ethanol (3/2, v/v). The solution was aspirated by a high pres-
sure constant flow pump (11) (LC100, Nantong, China) at a flow
rate of 1 ml/min. Supercritical CO2 and the organic solution
mixed and diffused rapidly. Solutes originally dissolved in the
organic solvent rapidly reached super-saturation, resulting in
the precipitation of SM-SD-SEDS in the vessel. Once the so-
lution was exhausted, valve B was closed, and supercritical
CO2 was continuously pumped for about 40 min in order to
remove residual organic solvent from the SM-SD. After that,
valve Awas closedwhile valve C remained open. The pressure
of the precipitation vessel was slowly reduced and the product
in the vessel was collected for further use.

Fig. 1 e Schematic diagram of the apparatus used for solution-enhanced dispersion by supercritical fluids. (A) (1) CO2
cylinder, (2) refrigerator, (3) high-pressure pump, (4) stabilization tank, (5) pressure sensor, (6) temperature sensor, (7)
nozzle, (8) filter, (9) view vessel, (10) air bath, (11) high pressure constant flow pump, (12) graduated flask, (13) separator, (14)
wet gas meter. (B) The structure of the nozzle.
Fig. 2 e In vitro dissolution profiles. The cumulative release
of silymarin (SM) in phosphate buffer solution (pH ¼ 6.8) is
shown from SM powder and SM solid dispersions (SDs)
prepared by solution-enhanced dispersion by supercritical
fluids (SEDS) using the indicated carriers (n ¼ 3). PVP,
polyvinyl pyrrolidone; HPMC, hydroxypropyl
methylcellulose.
a s i a n j o u r n a l o f p h a rma c e u t i c a l s c i e n c e s 1 0 ( 2 0 1 5 ) 1 9 4e2 0 2196
SM-SDs were also prepared using the SE method, whereby
the drug and matrix were both dissolved in ethanol, and the
solvent was removed under vacuum in a rotary evaporator (R-
205, Shanghai, China). The resultant SM-SD-SEwas placed in a
vacuum drying oven (DHG-9070A, Shanghai, China) to harden
prior to pulverization, sieving through a 250-mm sieve, and
storage in a desiccator.
2.4. High-performance liquid chromatography (HPLC)analysis
The content of SMwas determined using an HPLC system (LC-
2010A HT, Shimadzu, Japan) with an Agilent Eclipse XDB-C18
column (5 mm, 4.6 � 250 mm) (Agilent, Shanghai, China). The
mobile phase consisted of methanol and pure water (46:54, v/
v) at a flow rate of 0.8 ml/min. The effluent was monitored at
288 nm.
2.5. In vitro dissolution
The rate of dissolution of SM from the indicated preparations
was evaluated using the small vessel method. The dissolution
medium was phosphate buffer solution (pH 6.8) containing
0.3% (w/v) sodium dodecyl sulfate and maintained at
37 ± 0.5 �C stirring at 100 rpm. Samples of 2.0 ml were with-
drawn after 5, 10, 15, 20, 30, 60, 90, 120 min, and replaced by
the same volume of fresh medium at 37 ± 0.5 �C. The samples
were filtered through a 0.45-mm membrane, and the SM con-
tentwas determined byHPLC, as described in Section 2.4. Each
experiment was carried out in triplicate.
2.6. Scanning electron microscopy (SEM)
The SD surface morphology was observed by SEM (NOVA
NanoSEM 250, Shanghai, China). Samples were sprayed with
gold before examination. Microphotographs were obtained
using an accelerating voltage of 5 kV at 1000e25,000 �magnification.
2.7. X-ray diffraction (XRD)
Samples were analyzed using an X-ray polycrystalline
diffractometer (D8 ADVANCE, Bruker, Germany). Cu Ka radi-
ation was used as the X-ray source. Samples were scanned
over the range of 50�e70� 2q at a scanning speed of 6�/min and
a step size of 0.02�. The voltage was set at 40 kV and the cur-
rent was 40 mA.
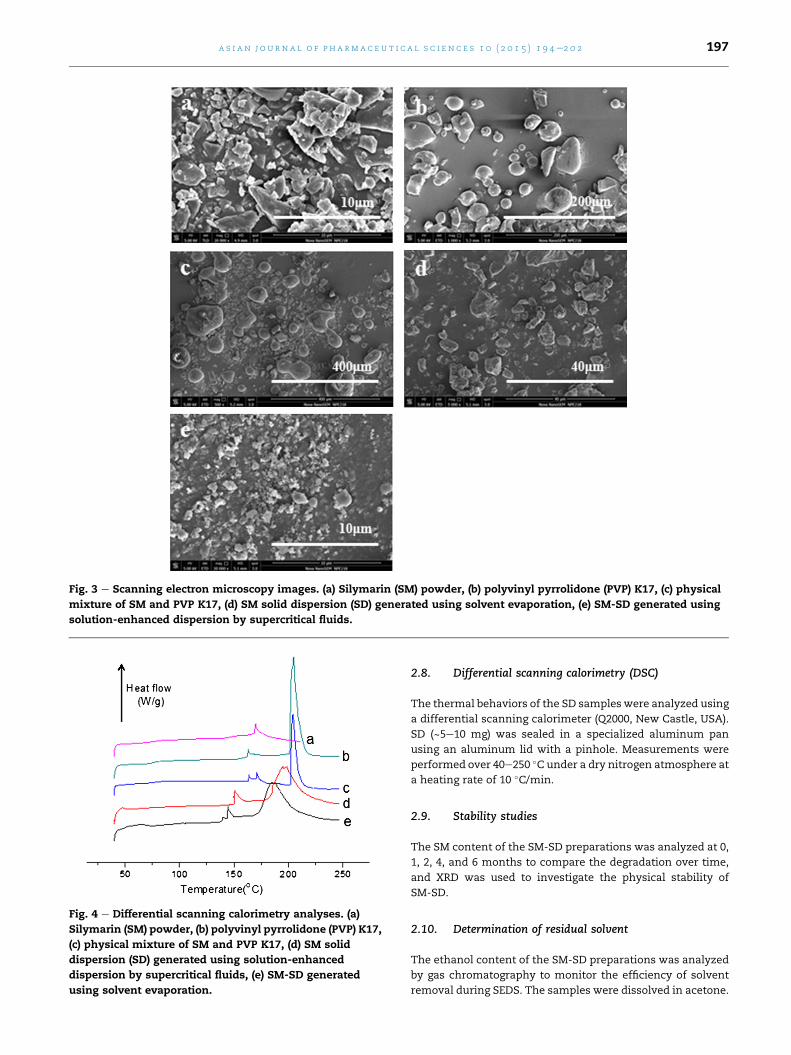
Fig. 3 e Scanning electron microscopy images. (a) Silymarin (SM) powder, (b) polyvinyl pyrrolidone (PVP) K17, (c) physical
mixture of SM and PVP K17, (d) SM solid dispersion (SD) generated using solvent evaporation, (e) SM-SD generated using
solution-enhanced dispersion by supercritical fluids.
Fig. 4 e Differential scanning calorimetry analyses. (a)
Silymarin (SM) powder, (b) polyvinyl pyrrolidone (PVP) K17,
(c) physical mixture of SM and PVP K17, (d) SM solid
dispersion (SD) generated using solution-enhanced
dispersion by supercritical fluids, (e) SM-SD generated
using solvent evaporation.
a s i a n j o u rn a l o f p h a rma c e u t i c a l s c i e n c e s 1 0 ( 2 0 1 5 ) 1 9 4e2 0 2 197
2.8. Differential scanning calorimetry (DSC)
The thermal behaviors of the SD sampleswere analyzed using
a differential scanning calorimeter (Q2000, New Castle, USA).
SD (~5e10 mg) was sealed in a specialized aluminum pan
using an aluminum lid with a pinhole. Measurements were
performed over 40e250 �C under a dry nitrogen atmosphere at
a heating rate of 10 �C/min.
2.9. Stability studies
The SM content of the SM-SD preparations was analyzed at 0,
1, 2, 4, and 6 months to compare the degradation over time,
and XRD was used to investigate the physical stability of
SM-SD.
2.10. Determination of residual solvent
The ethanol content of the SM-SD preparations was analyzed
by gas chromatography to monitor the efficiency of solvent
removal during SEDS. The samples were dissolved in acetone.
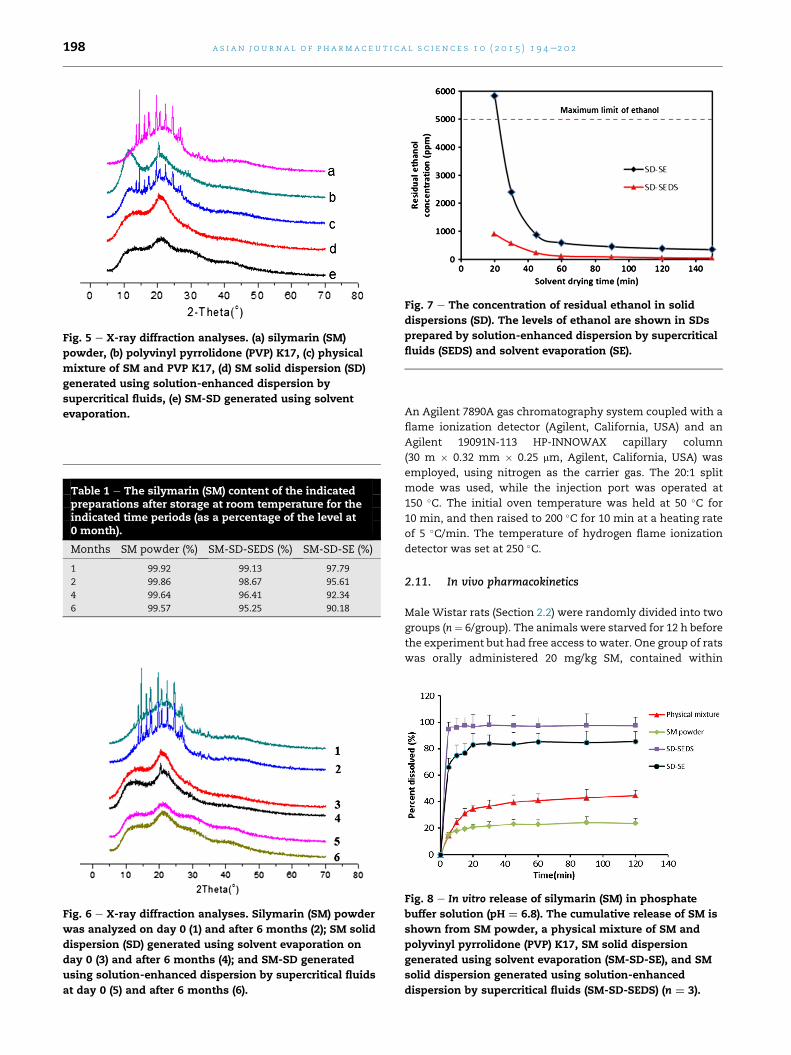
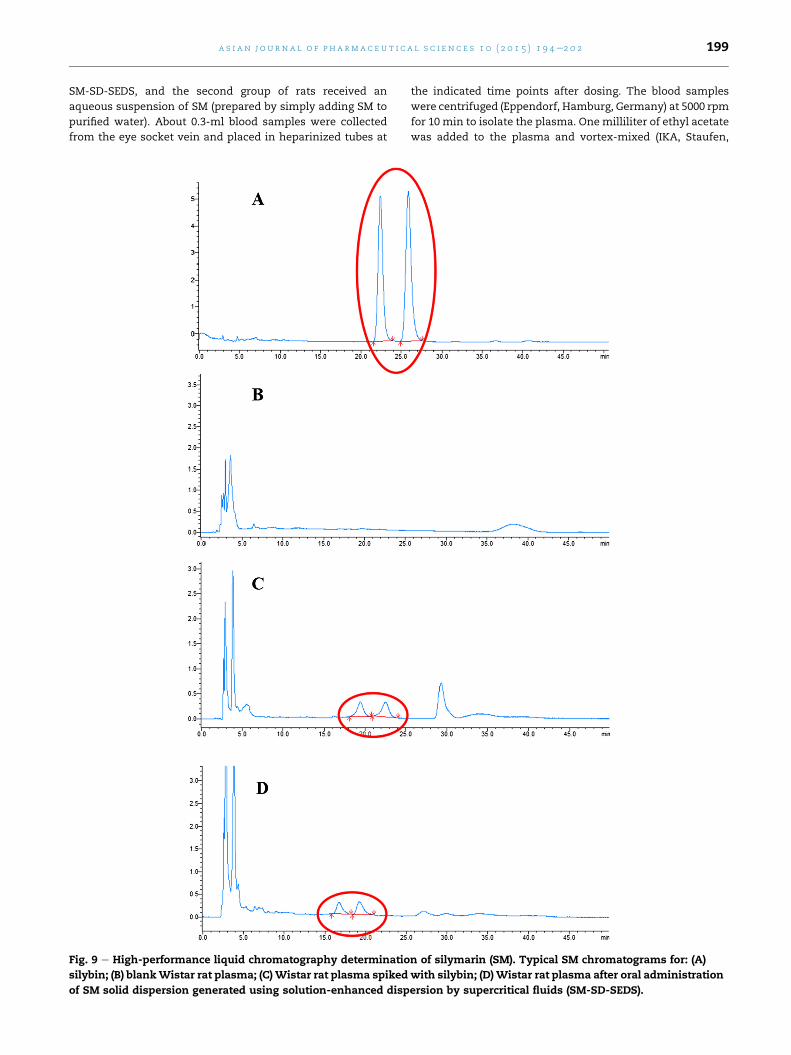
Fig. 5 e X-ray diffraction analyses. (a) silymarin (SM)
powder, (b) polyvinyl pyrrolidone (PVP) K17, (c) physical
mixture of SM and PVP K17, (d) SM solid dispersion (SD)
generated using solution-enhanced dispersion by
supercritical fluids, (e) SM-SD generated using solvent
evaporation.
Table 1 e The silymarin (SM) content of the indicatedpreparations after storage at room temperature for theindicated time periods (as a percentage of the level at0 month).
Months SM powder (%) SM-SD-SEDS (%) SM-SD-SE (%)
1 99.92 99.13 97.79
2 99.86 98.67 95.61
4 99.64 96.41 92.34
6 99.57 95.25 90.18
Fig. 7 e The concentration of residual ethanol in solid
dispersions (SD). The levels of ethanol are shown in SDs
prepared by solution-enhanced dispersion by supercritical
fluids (SEDS) and solvent evaporation (SE).
Fig. 6 e X-ray diffraction analyses. Silymarin (SM) powder
was analyzed on day 0 (1) and after 6 months (2); SM solid
dispersion (SD) generated using solvent evaporation on
day 0 (3) and after 6 months (4); and SM-SD generated
using solution-enhanced dispersion by supercritical fluids
at day 0 (5) and after 6 months (6).
a s i a n j o u r n a l o f p h a rma c e u t i c a l s c i e n c e s 1 0 ( 2 0 1 5 ) 1 9 4e2 0 2198
An Agilent 7890A gas chromatography system coupled with a
flame ionization detector (Agilent, California, USA) and an
Agilent 19091N-113 HP-INNOWAX capillary column
(30 m � 0.32 mm � 0.25 mm, Agilent, California, USA) was
employed, using nitrogen as the carrier gas. The 20:1 split
mode was used, while the injection port was operated at
150 �C. The initial oven temperature was held at 50 �C for
10 min, and then raised to 200 �C for 10 min at a heating rate
of 5 �C/min. The temperature of hydrogen flame ionization
detector was set at 250 �C.
2.11. In vivo pharmacokinetics
Male Wistar rats (Section 2.2) were randomly divided into two
groups (n ¼ 6/group). The animals were starved for 12 h before
the experiment but had free access to water. One group of rats
was orally administered 20 mg/kg SM, contained within
Fig. 8 e In vitro release of silymarin (SM) in phosphate
buffer solution (pH ¼ 6.8). The cumulative release of SM is
shown from SM powder, a physical mixture of SM and
polyvinyl pyrrolidone (PVP) K17, SM solid dispersion
generated using solvent evaporation (SM-SD-SE), and SM
solid dispersion generated using solution-enhanced
dispersion by supercritical fluids (SM-SD-SEDS) (n ¼ 3).
a s i a n j o u rn a l o f p h a rma c e u t i c a l s c i e n c e s 1 0 ( 2 0 1 5 ) 1 9 4e2 0 2 199
SM-SD-SEDS, and the second group of rats received an
aqueous suspension of SM (prepared by simply adding SM to
purified water). About 0.3-ml blood samples were collected
from the eye socket vein and placed in heparinized tubes at
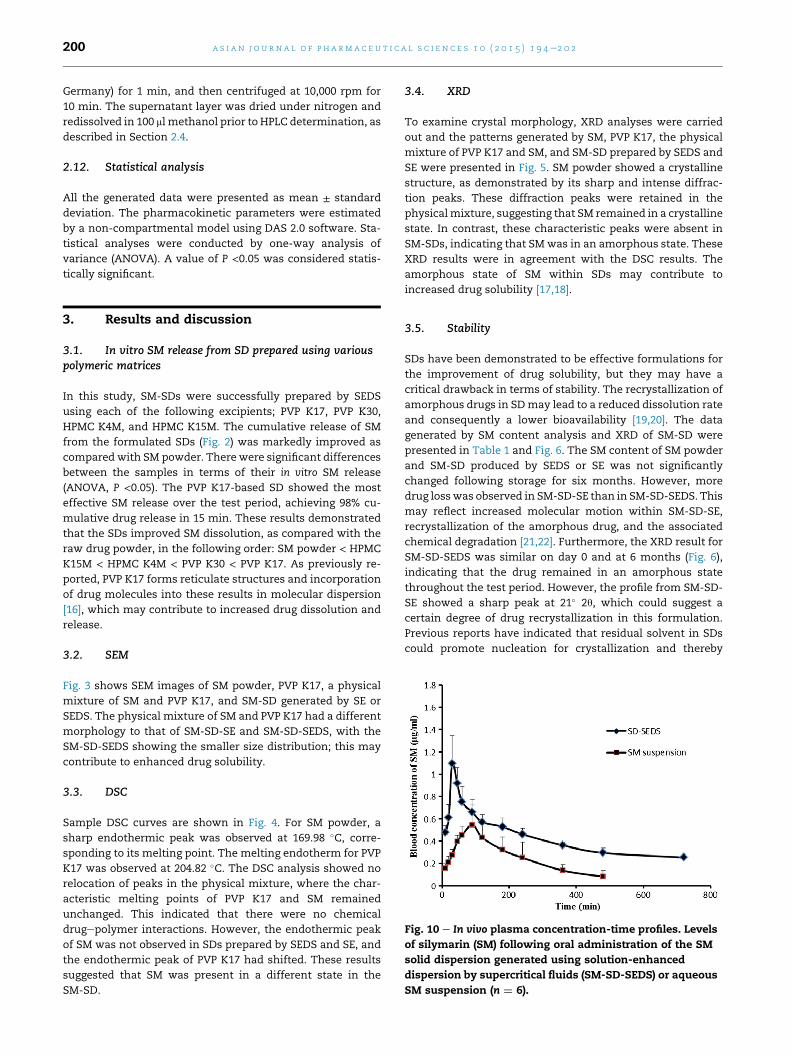
Fig. 9 e High-performance liquid chromatography determinatio
silybin; (B) blankWistar rat plasma; (C) Wistar rat plasma spiked
of SM solid dispersion generated using solution-enhanced disp
the indicated time points after dosing. The blood samples
were centrifuged (Eppendorf, Hamburg, Germany) at 5000 rpm
for 10 min to isolate the plasma. One milliliter of ethyl acetate
was added to the plasma and vortex-mixed (IKA, Staufen,
n of silymarin (SM). Typical SM chromatograms for: (A)
with silybin; (D)Wistar rat plasma after oral administration
ersion by supercritical fluids (SM-SD-SEDS).
a s i a n j o u r n a l o f p h a rma c e u t i c a l s c i e n c e s 1 0 ( 2 0 1 5 ) 1 9 4e2 0 2200
Germany) for 1 min, and then centrifuged at 10,000 rpm for
10 min. The supernatant layer was dried under nitrogen and
redissolved in 100 ml methanol prior to HPLC determination, as
described in Section 2.4.
2.12. Statistical analysis
All the generated data were presented as mean ± standard
deviation. The pharmacokinetic parameters were estimated
by a non-compartmental model using DAS 2.0 software. Sta-
tistical analyses were conducted by one-way analysis of
variance (ANOVA). A value of P <0.05 was considered statis-
tically significant.
Fig. 10 e In vivo plasma concentration-time profiles. Levels
of silymarin (SM) following oral administration of the SM
solid dispersion generated using solution-enhanced
dispersion by supercritical fluids (SM-SD-SEDS) or aqueous
SM suspension (n ¼ 6).
3. Results and discussion
3.1. In vitro SM release from SD prepared using variouspolymeric matrices
In this study, SM-SDs were successfully prepared by SEDS
using each of the following excipients; PVP K17, PVP K30,
HPMC K4M, and HPMC K15M. The cumulative release of SM
from the formulated SDs (Fig. 2) was markedly improved as
compared with SM powder. There were significant differences
between the samples in terms of their in vitro SM release
(ANOVA, P <0.05). The PVP K17-based SD showed the most
effective SM release over the test period, achieving 98% cu-
mulative drug release in 15 min. These results demonstrated
that the SDs improved SM dissolution, as compared with the
raw drug powder, in the following order: SM powder < HPMC
K15M < HPMC K4M < PVP K30 < PVP K17. As previously re-
ported, PVP K17 forms reticulate structures and incorporation
of drug molecules into these results in molecular dispersion
[16], which may contribute to increased drug dissolution and
release.
3.2. SEM
Fig. 3 shows SEM images of SM powder, PVP K17, a physical
mixture of SM and PVP K17, and SM-SD generated by SE or
SEDS. The physical mixture of SM and PVP K17 had a different
morphology to that of SM-SD-SE and SM-SD-SEDS, with the
SM-SD-SEDS showing the smaller size distribution; this may
contribute to enhanced drug solubility.
3.3. DSC
Sample DSC curves are shown in Fig. 4. For SM powder, a
sharp endothermic peak was observed at 169.98 �C, corre-
sponding to its melting point. The melting endotherm for PVP
K17 was observed at 204.82 �C. The DSC analysis showed no
relocation of peaks in the physical mixture, where the char-
acteristic melting points of PVP K17 and SM remained
unchanged. This indicated that there were no chemical
drugepolymer interactions. However, the endothermic peak
of SM was not observed in SDs prepared by SEDS and SE, and
the endothermic peak of PVP K17 had shifted. These results
suggested that SM was present in a different state in the
SM-SD.
3.4. XRD
To examine crystal morphology, XRD analyses were carried
out and the patterns generated by SM, PVP K17, the physical
mixture of PVP K17 and SM, and SM-SD prepared by SEDS and
SE were presented in Fig. 5. SM powder showed a crystalline
structure, as demonstrated by its sharp and intense diffrac-
tion peaks. These diffraction peaks were retained in the
physicalmixture, suggesting that SM remained in a crystalline
state. In contrast, these characteristic peaks were absent in
SM-SDs, indicating that SMwas in an amorphous state. These
XRD results were in agreement with the DSC results. The
amorphous state of SM within SDs may contribute to
increased drug solubility [17,18].
3.5. Stability
SDs have been demonstrated to be effective formulations for
the improvement of drug solubility, but they may have a
critical drawback in terms of stability. The recrystallization of
amorphous drugs in SDmay lead to a reduced dissolution rate
and consequently a lower bioavailability [19,20]. The data
generated by SM content analysis and XRD of SM-SD were
presented in Table 1 and Fig. 6. The SM content of SM powder
and SM-SD produced by SEDS or SE was not significantly
changed following storage for six months. However, more
drug losswas observed in SM-SD-SE than in SM-SD-SEDS. This
may reflect increased molecular motion within SM-SD-SE,
recrystallization of the amorphous drug, and the associated
chemical degradation [21,22]. Furthermore, the XRD result for
SM-SD-SEDS was similar on day 0 and at 6 months (Fig. 6),
indicating that the drug remained in an amorphous state
throughout the test period. However, the profile from SM-SD-
SE showed a sharp peak at 21� 2q, which could suggest a
certain degree of drug recrystallization in this formulation.
Previous reports have indicated that residual solvent in SDs
could promote nucleation for crystallization and thereby
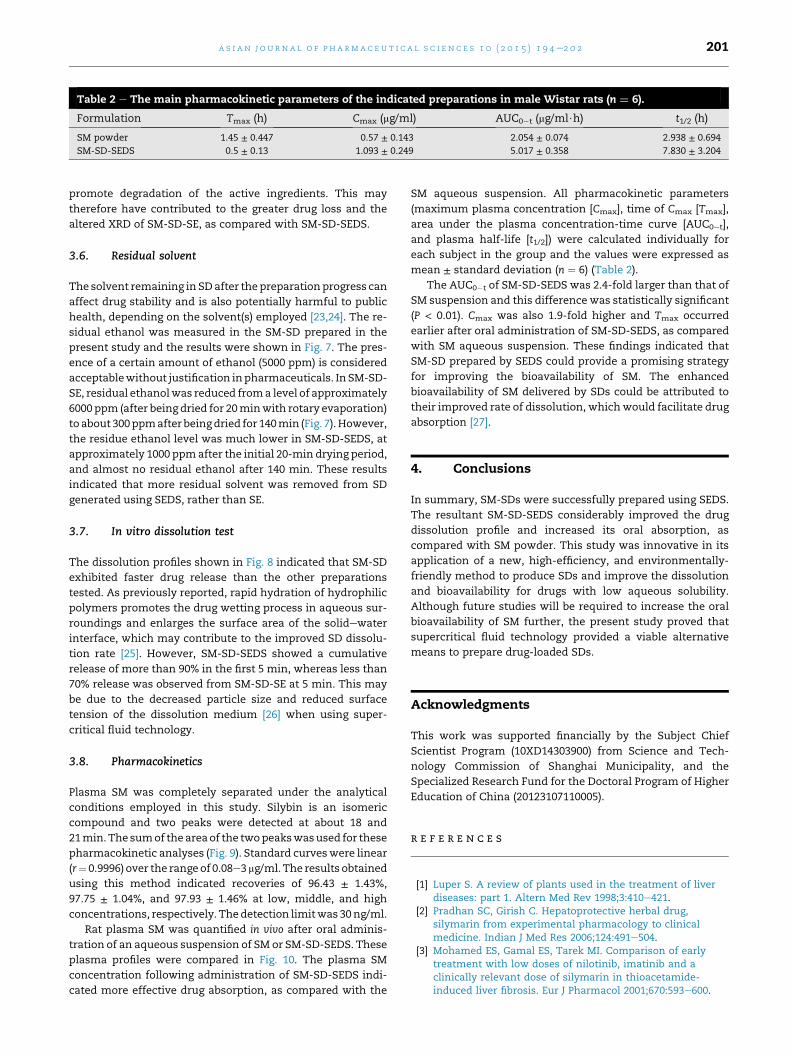
Table 2 e The main pharmacokinetic parameters of the indicated preparations in male Wistar rats (n ¼ 6).
Formulation Tmax (h) Cmax (mg/ml) AUC0�t (mg/ml$h) t1/2 (h)
SM powder 1.45 ± 0.447 0.57 ± 0.143 2.054 ± 0.074 2.938 ± 0.694
SM-SD-SEDS 0.5 ± 0.13 1.093 ± 0.249 5.017 ± 0.358 7.830 ± 3.204
a s i a n j o u rn a l o f p h a rma c e u t i c a l s c i e n c e s 1 0 ( 2 0 1 5 ) 1 9 4e2 0 2 201
promote degradation of the active ingredients. This may
therefore have contributed to the greater drug loss and the
altered XRD of SM-SD-SE, as compared with SM-SD-SEDS.
3.6. Residual solvent
The solvent remaining in SDafter thepreparationprogress can
affect drug stability and is also potentially harmful to public
health, depending on the solvent(s) employed [23,24]. The re-
sidual ethanol was measured in the SM-SD prepared in the
present study and the results were shown in Fig. 7. The pres-
ence of a certain amount of ethanol (5000 ppm) is considered
acceptablewithout justification inpharmaceuticals. In SM-SD-
SE, residual ethanolwas reduced froma level of approximately
6000 ppm (after being dried for 20minwith rotary evaporation)
to about 300ppmafter beingdried for 140min (Fig. 7). However,
the residue ethanol level was much lower in SM-SD-SEDS, at
approximately 1000 ppmafter the initial 20-min drying period,
and almost no residual ethanol after 140 min. These results
indicated that more residual solvent was removed from SD
generated using SEDS, rather than SE.
3.7. In vitro dissolution test
The dissolution profiles shown in Fig. 8 indicated that SM-SD
exhibited faster drug release than the other preparations
tested. As previously reported, rapid hydration of hydrophilic
polymers promotes the drug wetting process in aqueous sur-
roundings and enlarges the surface area of the solidewater
interface, which may contribute to the improved SD dissolu-
tion rate [25]. However, SM-SD-SEDS showed a cumulative
release of more than 90% in the first 5 min, whereas less than
70% release was observed from SM-SD-SE at 5 min. This may
be due to the decreased particle size and reduced surface
tension of the dissolution medium [26] when using super-
critical fluid technology.
3.8. Pharmacokinetics
Plasma SM was completely separated under the analytical
conditions employed in this study. Silybin is an isomeric
compound and two peaks were detected at about 18 and
21min.The sumof theareaof the twopeakswasused for these
pharmacokinetic analyses (Fig. 9). Standard curveswere linear
(r¼ 0.9996) over the rangeof 0.08e3 mg/ml. The results obtained
using this method indicated recoveries of 96.43 ± 1.43%,
97.75 ± 1.04%, and 97.93 ± 1.46% at low, middle, and high
concentrations, respectively. Thedetection limitwas30ng/ml.
Rat plasma SM was quantified in vivo after oral adminis-
tration of an aqueous suspension of SM or SM-SD-SEDS. These
plasma profiles were compared in Fig. 10. The plasma SM
concentration following administration of SM-SD-SEDS indi-
cated more effective drug absorption, as compared with the
SM aqueous suspension. All pharmacokinetic parameters
(maximum plasma concentration [Cmax], time of Cmax [Tmax],
area under the plasma concentration-time curve [AUC0et],
and plasma half-life [t1/2]) were calculated individually for
each subject in the group and the values were expressed as
mean ± standard deviation (n ¼ 6) (Table 2).
The AUC0�t of SM-SD-SEDS was 2.4-fold larger than that of
SM suspension and this difference was statistically significant
(P < 0.01). Cmax was also 1.9-fold higher and Tmax occurred
earlier after oral administration of SM-SD-SEDS, as compared
with SM aqueous suspension. These findings indicated that
SM-SD prepared by SEDS could provide a promising strategy
for improving the bioavailability of SM. The enhanced
bioavailability of SM delivered by SDs could be attributed to
their improved rate of dissolution, whichwould facilitate drug
absorption [27].
4. Conclusions
In summary, SM-SDs were successfully prepared using SEDS.
The resultant SM-SD-SEDS considerably improved the drug
dissolution profile and increased its oral absorption, as
compared with SM powder. This study was innovative in its
application of a new, high-efficiency, and environmentally-
friendly method to produce SDs and improve the dissolution
and bioavailability for drugs with low aqueous solubility.
Although future studies will be required to increase the oral
bioavailability of SM further, the present study proved that
supercritical fluid technology provided a viable alternative
means to prepare drug-loaded SDs.
Acknowledgments
This work was supported financially by the Subject Chief
Scientist Program (10XD14303900) from Science and Tech-
nology Commission of Shanghai Municipality, and the
Specialized Research Fund for the Doctoral Program of Higher
Education of China (20123107110005).
r e f e r e n c e s
[1] Luper S. A review of plants used in the treatment of liverdiseases: part 1. Altern Med Rev 1998;3:410e421.
[2] Pradhan SC, Girish C. Hepatoprotective herbal drug,silymarin from experimental pharmacology to clinicalmedicine. Indian J Med Res 2006;124:491e504.
[3] Mohamed ES, Gamal ES, Tarek MI. Comparison of earlytreatment with low doses of nilotinib, imatinib and aclinically relevant dose of silymarin in thioacetamide-induced liver fibrosis. Eur J Pharmacol 2001;670:593e600.

a s i a n j o u r n a l o f p h a rma c e u t i c a l s c i e n c e s 1 0 ( 2 0 1 5 ) 1 9 4e2 0 2202
[4] Freedman ND, Curto TM, Morishima C. Silymarin use andliver disease progression in the hepatitis C antiviral long-term treatment against cirrhosis trial. Aliment Pharm Ther2010;33:127e137.
[5] Dixit N, Baboota S, Kohli K, et al. Silymarin: a review ofpharmacological aspects and bioavailability enhancementapproaches. Indian J Pharmacol 2007;39:171e179.
[6] Giacomelli S, Gallo D, Apollonio P, et al. Silybin and itsbioavailable phospholipid complex (IdB1016) potentiatein-vitro and in-vivo activity of cisplatin. Life Sci2003;70:1447e1459.
[7] Shangguan MZ, Yi Lu, Qi JP, et al. Binary lipids-basednanostructured lipid carriers for improved oralbioavailability of silymarin. J Biomater Appl 2014;28:887e896.
[8] Panapisal V, Charoensri S, Tantituvanont A. Formulation ofmicroemulsion systems for dermal delivery of silymarin.PharmSciTech 2012;13:389e399.
[9] Ahmed S, Mohammed E, Mohammad A. Complementactivation assay and in vivo evaluation of silymarin loadedliver targeting liposome. J Life Med 2014;2:15e24.
[10] Sonali D, Tejal S, Vaishali T, et al. Silymarin-soliddispersions: characterization and influence of preparationmethods on dissolution. Acta Pharm 2010;60:427e443.
[11] Bobe K, Bobe CR, Suresh S. Formulation and evalution ofsolid dispersion of atorvastatin with various carriers.Pharmacie Globale (IJCP) 2011;1:1e6.
[12] Das SK, Roy S, Kalimuthu Y. Solid dispersions: an approachto enhance the bioavailability of poorly water-soluble drugs.Int J Pharmacol Pharm Technol 2014;1:2277e3436.
[13] Won DH, Kim MS, Lee S, et al. Improved physicochemicalcharacteristics of felodipine solid dispersion particles bysupercritical anti-solvent precipitation process. Int J Pharm2005;301:199e208.
[14] Juppo AM, Boissier C, Khoo C. Evaluation of solid dispersionparticles prepared with SEDS. Int J Pharm 2003;250:385e401.
[15] Antonio T, Eva M, Miguel A. Precipitation of tretinoin andacetaminophen with solution enhanced dispersion bysupercritical fluids (SEDS). Powder Technol2012;217:177e188.
[16] Chen ZQ, Liu Y, Zhao JH, et al. Improved oral bioavailabilityof poorly water-soluble indirubin by a supersaturatable self-
microemulsifying drug delivery system. Int J Nanomedicine2012;7:1115e1125.
[17] Kim MS, Jin SJ, Kim JS. Preparation, characterization andin vivo evaluation of amorphous atorvastatin calciumnanoparticles using supercritical antisolvent (SAS) process.Eur J Pharm Biopharm 2008;69:454e465.
[18] Juan J, Garcia R, Paloma M, et al. Changed crystallinity ofmebendazole solid dispersion: improved anthelminticactivity. Int J Pharm 2011;403:23e28.
[19] Han HK, Lee BJ, Lee HK. Enhanced dissolution andbioavailability of biochanin A via the preparation of soliddispersion: in vitro and in vivo evaluation. Int J Pharm2011;415:89e94.
[20] Guo YS, Shalaev E, Scott S. Physical stability ofpharmaceutical formulations: solid-state characterization ofamorphous dispersions. TRAC-Trend Anal Chem2013;49:137e144.
[21] Patrick JM, Alfred CFR, David EN, et al. Effect of temperatureand moisture on the miscibility of amorphous dispersions offelodipine and poly (vinyl pyrrolidone). J Pharm Sci2009;99:169e185.
[22] Sarode AL, Sandhu H, Shah N, et al. Hot melt extrusion foramorphous solid dispersions: temperature and moistureactivated drug-polymer interactions for enhanced stability.Mol Pharmaceut 2013;10:3665.
[23] Deconinck E, Canfyn M, Sacre PY, et al. Evaluation of theresidual solvent content of counterfeit tablets and capsules.J Pharmaceut Biomed 2013;81:80e88.
[24] Ke K, Wei XF, Bao RY, et al. Contribution of residual solventto the nucleation and reinforcement of poly (vinylidenefluoride). Polym Test 2014;34:78e84.
[25] Park YJ, Xuan JJ, Oh DH, et al. Development of novelitraconazole-loaded solid dispersion without crystallinechange with improved bioavailability. Arch Pharm Res2010;33:1217e1225.
[26] Park J, Cho W, Cha KH. Solubilization of the poorly watersoluble drug, telmisartan, using supercritical anti-solvent(SAS) process. Int J Pharm 2013;441:50e55.
[27] Li SM, Liu Y, Liu T, et al. Development and in-vivo assessmentof the bioavailability of oridonin solid dispersions by the gasanti-solvent technique. Int J Pharm 2011;411:172e177.