imprint - schaeffler.com · 2 fag industrial services gmbh kaiserstraße 100 52134 herzogenrath...
TRANSCRIPT

1

2
FAG Industrial Services GmbHKaiserstraße 10052134 HerzogenrathGermanyTelephone: +49 (0) 2407 9149 66Fax: +49 (0) 2407 9149 59Email: [email protected] Website: www.schaeffler.com/services
All rights reserved.No part of the documentation or software may be reproduced in any form or processed, duplicated or distributed usingelectronic systems without our written consent. We would like to point out that the designations and brand names of the variouscompanies used in the documentation are generally protected by trademark, brand and patent laws.
Microsoft, Windows and Internet Explorer are brands or registered trademarks of the Microsoft Corporation in the USA and/orin other countries. Firefox is a trademark of the Mozilla Foundation.
The software uses the following third-party provider libraries under their respective licences:Ionic.Tar, Ionic.Zip, Log4Net, Microsoft Windows API Code Pack, MongoDB, Nhibernate, NLog, Nprotobuf, Renci SSH,SharpDX, SharpSSH, Extended WPF Toolkit, ZLIB.NETFull licence conditions for the respective libraries can be found in the software's program directory.
Version 1.10.0Original user guide.© 25/05/2016 - FAG Industrial Services GmbH
Imprint

3
Contents
Contents
..................................................................................................................................... 51 General.............................................................................................................................................................................................. 61.1 About this guide
..................................................................................................................................... 72 About this software.............................................................................................................................................................................................. 72.1 User rights and write access
.............................................................................................................................................................................................. 82.2 System requirements
.............................................................................................................................................................................................. 92.3 Installing the software
..................................................................................................................................... 103 First start-up
..................................................................................................................................... 114 The user interface at a glance
..................................................................................................................................... 125 Wizards and functions.............................................................................................................................................................................................. 155.1 Open devices
.............................................................................................................................................................................................. 165.2 Download data
.............................................................................................................................................................................................. 195.3 Analyse data
........................................................................................................................................................................................... 21User interface overview 5.3.1
........................................................................................................................................................................................... 22Device overview 5.3.2
........................................................................................................................................................................................... 26Time signals for the selected characteristic value 5.3.3
........................................................................................................................................................................................... 29Viewer and diagram 5.3.4
....................................................................................................................................................................... 34Opening and removing data5.3.4.1
....................................................................................................................................................................... 41Show signal properties5.3.4.2
....................................................................................................................................................................... 41Adding/editing comments5.3.4.3
....................................................................................................................................................................... 43Show highest peaks5.3.4.4
....................................................................................................................................................................... 44Show frequency bands (Spectrum only)5.3.4.5
....................................................................................................................................................................... 51Set speed/frequency5.3.4.6
....................................................................................................................................................................... 51Cursor setting5.3.4.7
5.3.4.7.1 Basis analysis.................................................................................................................................................. 53
5.3.4.7.2 Gear mesh (Spectrum only).................................................................................................................................................. 54
5.3.4.7.3 Harmonics.................................................................................................................................................. 55
5.3.4.7.4 Sidebands (Spectrum only).................................................................................................................................................. 56
5.3.4.7.5 Harmonics with sidebands (Spectrum only).................................................................................................................................................. 56
5.3.4.7.6 Speed.................................................................................................................................................. 57
....................................................................................................................................................................... 58Position cursor5.3.4.8
....................................................................................................................................................................... 59Select diagram view5.3.4.9
5.3.4.9.1 Overlapping.................................................................................................................................................. 59
5.3.4.9.2 Stack.................................................................................................................................................. 59
5.3.4.9.3 Matrix.................................................................................................................................................. 60
5.3.4.9.4 Wireframe (Spectrum only).................................................................................................................................................. 60
5.3.4.9.5 Waterfall (Spectrum only).................................................................................................................................................. 61
5.3.4.9.6 2D spectrogram (Spectrum only).................................................................................................................................................. 61
5.3.4.9.7 3D spectrogram (Spectrum only).................................................................................................................................................. 61
....................................................................................................................................................................... 62Edit axes settings5.3.4.10
....................................................................................................................................................................... 63Modify camera settings (Spectrum only)5.3.4.11
....................................................................................................................................................................... 63Change spectrogram settings (Spectrum only)5.3.4.12
....................................................................................................................................................................... 64Integrate signals (spectrum)5.3.4.13
....................................................................................................................................................................... 66Calculate Spectrum (time signal only)5.3.4.14
....................................................................................................................................................................... 67Calculate order spectrum (Spectrum only)5.3.4.15
....................................................................................................................................................................... 68Exporting diagrams5.3.4.16
........................................................................................................................................................................................... 72Change program settings 5.3.5
....................................................................................................................................................................... 73Viewer settings5.3.5.1
....................................................................................................................................................................... 74Signal settings5.3.5.2
....................................................................................................................................................................... 75Symbol settings5.3.5.3
....................................................................................................................................................................... 76Unit profiles5.3.5.4
....................................................................................................................................................................... 77Reset5.3.5.5

4
........................................................................................................................................................................................... 78Appendix I: working with the keyboard and mouse 5.3.6
....................................................................................................................................................................... 78Zooming in a diagram5.3.6.1
....................................................................................................................................................................... 79Scrolling and moving in a diagram5.3.6.2
....................................................................................................................................................................... 80Other functions5.3.6.3
........................................................................................................................................................................................... 81Appendix II: basic units 5.3.7
.............................................................................................................................................................................................. 815.4 Create report
.............................................................................................................................................................................................. 865.5 Edit device settings
.............................................................................................................................................................................................. 885.6 Downloading the configuration
.............................................................................................................................................................................................. 895.7 Sending the configuration
.............................................................................................................................................................................................. 915.8 Updating the firmware
.............................................................................................................................................................................................. 945.9 Opening the log file directory
.............................................................................................................................................................................................. 945.10 Opening the default directories
.............................................................................................................................................................................................. 945.11 Manage report templates
........................................................................................................................................................................................... 96Creating and editing report templates 5.11.1
........................................................................................................................................................................................... 100Using tags in report templates 5.11.2
.............................................................................................................................................................................................. 1045.12 Rescan data directory
.............................................................................................................................................................................................. 1055.13 Export data
.............................................................................................................................................................................................. 1065.14 Import SmartWeb data
..................................................................................................................................... 1086 Settings
..................................................................................................................................... 1147 Further information
..................................................................................................................................... 1158 Manufacturer/support
5
General
1 General
The FAG SmartUtility software assists you with the management functions of the FAG SmartCheck device. With thissoftware, you perform the basic configuration of the device, load and save configurations and update the firmware. Inaddition, you can open the devices directly in the FAG SmartWeb software and download measurement data from thedevice.
You can use the FAG SmartUtility Viewer software to analyse measurement data you have downloaded from the FAGSmartCheck device. The characteristic values are shown in the user interface in a clear tree structure, the Deviceoverview. You can select characteristic values from the tree structure; the corresponding data is displayed automaticallyas a trend in a viewer. You can check specific time signals or spectrums for this trend in two other viewers. Acomprehensive range of cursor functions and settings options offer help and support.
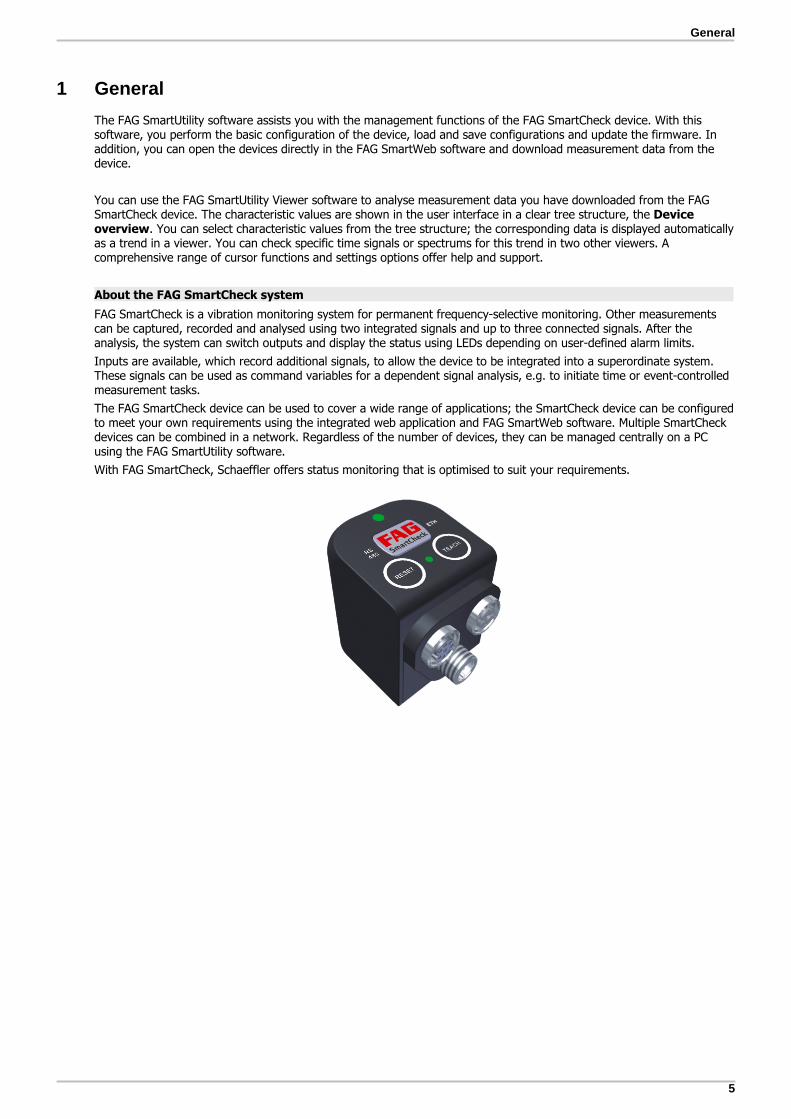
About the FAG SmartCheck system
FAG SmartCheck is a vibration monitoring system for permanent frequency-selective monitoring. Other measurementscan be captured, recorded and analysed using two integrated signals and up to three connected signals. After theanalysis, the system can switch outputs and display the status using LEDs depending on user-defined alarm limits.
Inputs are available, which record additional signals, to allow the device to be integrated into a superordinate system.These signals can be used as command variables for a dependent signal analysis, e.g. to initiate time or event-controlledmeasurement tasks.
The FAG SmartCheck device can be used to cover a wide range of applications; the SmartCheck device can be configuredto meet your own requirements using the integrated web application and FAG SmartWeb software. Multiple SmartCheckdevices can be combined in a network. Regardless of the number of devices, they can be managed centrally on a PCusing the FAG SmartUtility software.
With FAG SmartCheck, Schaeffler offers status monitoring that is optimised to suit your requirements.

6
1.1 About this guide
This guide describes how to use the FAG SmartUtility software. Read this guide carefully before using the software, andstore it in a safe place.
Make sure that
This guide is available to all users
if the product is passed on to other users, this guide is passed on with it;
Additions and amendments provided by the manufacturer are always attached to this guide.
Further information
This software is required for the operation of the FAG SmartCheck vibration monitoring system. This system also includesthe FAG SmartCheck device and the web interface and FAG SmartWeb software integrated in it, which are described intheir respective manuals.
Definitions
Product: the FAG SmartUtility software described in this manual.
User: person or organisation with the ability to use the product
Symbols used
This symbol indicates
Helpful additional information and
Device settings or practical tips that will help you to perform activities more efficiently.
CAUTION The damage that can occur is described here
Measures to prevent the damage are explained here.
Cross-reference symbol : This symbol refers to a page in the manual that provides further information. If you arereading the manual in PDF format on a screen, clicking the word to the left of the cross-reference symbol will take youstraight to the section in question.
115
6

7
About this software
2 About this software
The FAG SmartUtility software is provided to you as a setup version that you need to install. You can find this version inthe "FAG SmartUtility" program directory on the supplied CD-ROM. It automatically checks for the SmartUtility softwarerequirements, such as Microsoft .NET Framework, and installs them if necessary.
Perform a software and firmware update before commissioning. You can download the latestversion via the SmartUtility software or from the the downloads area of the SmartCheckmicrosite www.fag-smartcheck.com.
Functionality of the FAG SmartUtility software or FAG SmartUtility Light software
The following overview displays the functionality of the SmartUtility software or the SmartUtility Light software:
Wizards and functions FAG SmartWeb FAG SmartUtility FAG SmartUtilityLight
Status overview * -
Measurement data viewer * -
Real-time display * -
Configuration * -
User management(User name, password)
-
Opening devices - -
Download data
Analyse data - -
Create report - -
Edit device settings -
Downloading the configuration - -
Sending the configuration - -
Updating the firmware -
Opening the log file directory -
Opening the default directories -
Manage report templates - -
Rescan data directory - -
Export data - -
Import SmartWeb data - -
* This function can be accessed via the FAG SmartUtility software.
2.1 User rights and write access
To install and operate the SmartUtility software, you require special access rights. Please contact your systemadministrator if you experience problems with the security requirements of your system.
User rights
To install the FAG SmartUtility software, you require administrator rights on your system.
Tip: Install the software with administrator rights and then switch back to a normal user.
8
Write access
The software saves settings data and log data during operation. For this reason, you require write access for thefollowing directories for the setup version of the SmartUtility software:
Default directories
Windows 7:C:\dataC:\configurationC:\reportsC:\report templates
Log file directory
Windows 7:
C:\Users\[User name]\AppData\Roaming\Condition Monitoring
2.2 System requirements
Your system needs to meet the following requirements for you to get the most from your FAG SmartUtility software:
General system requirements
Windows 7 (32/64 Bit) Service Pack 1
The system requirements recommended by Microsoft must be met as a minimum:
Dual-core processor
2 GB RAM (recommended: 4 GB RAM)
16 GB of hard disc space available
DirectX 9 graphics device with WDDM 1.0 driver or higher
In addition:
Screen resolution: 1024x768 (pixels) at 96 dpi and normal font size (recommended: 1280x800 or higher)
Disk space for software: at least 40 MB free disk space
Mouse: three-button mouse recommended
In addition, you require disk space for the data downloaded from the SmartCheck device. Thiscan vary considerably according to the application type and depending on your measurementtasks.
Other requirements
Microsoft .NET Framework 4.6.1
DirectX 9
VC++ Runtime 2010 and 2012
Standard browser: Mozilla Firefox ESR 38 (recommended), Internet Explorer 11 (Internet Explorer 9 is notrecommended for performance reasons)
The SmartUtility software checks whether the Microsoft .Net Framework component is on thecomputer and installs it automatically if necessary. If you run the installation without an Internetconnection, the components are set up in English by default. The SmartUtility software is alsothen fully functional.
Requirements for connection to the computer
The UDP communication protocol must be enabled on ports 19000 and 19001 in existing firewalls in your network
The ports must also be enabled for UDP broadcasts. This can be done in the Windows 7 firewall via Allow unicastresponse.
If the SmartCheck device has not been assigned an address via DHCP, it will have the IP address 192.168.1.100 bydefault. In this case, the IP address of your computer must be within the 192.168.1.x range.

9
About this software
Please contact your system administrator if you experience problems with the network settings.
If an SmartCheck device cannot be opened in the browser, clear the browser cache and tryagain.
If you receive a message stating that cookies are not accepted, please allow the use ofcookies or enter the IP address of the SmartCheck device as an exception.For further information, please see the "Introduction to network basics" section in the manual.
2.3 Installing the software
Open the FAG SmartUtility program directory on the supplied CD-ROM. Double-click the following file: SmartUtility.exe. This starts a wizard, which will guide you through the individual installation steps:
This includes—depending on your system configuration—the following steps:
Select installation language: Here you can select the language to be used during the installation of theSmartUtility software.
Install Microsoft .NET Framework: If the wizard does not find these components on your computer, it will startinstalling them after confirmation.
Select target directory: You can either accept the suggested directory or enter a different directory. The FAGSmartUtility software is saved in the following directory by default:C:\Programs\FAGSmartUtility.
Select folder in Start menu: Here you have the option to change the SmartUtility entry in the Start menu to suityour requirements.
Restart computer: In the final step of the wizard, you have the option to restart the computer immediately or tocarry out the restart at another time. We recommend always restarting the computer if the DirectX or Microsoft .NETcomponents have been installed.
Links are created in the start menu and on the desktop during the installation; these links can be used to start the FAGSmartUtility software. When you start the software for the first time after installation, the Basic settings wizard opensand guides you through the most important configurations in three steps. Details on this can be found under Firststart-up .10
10
3 First start-up
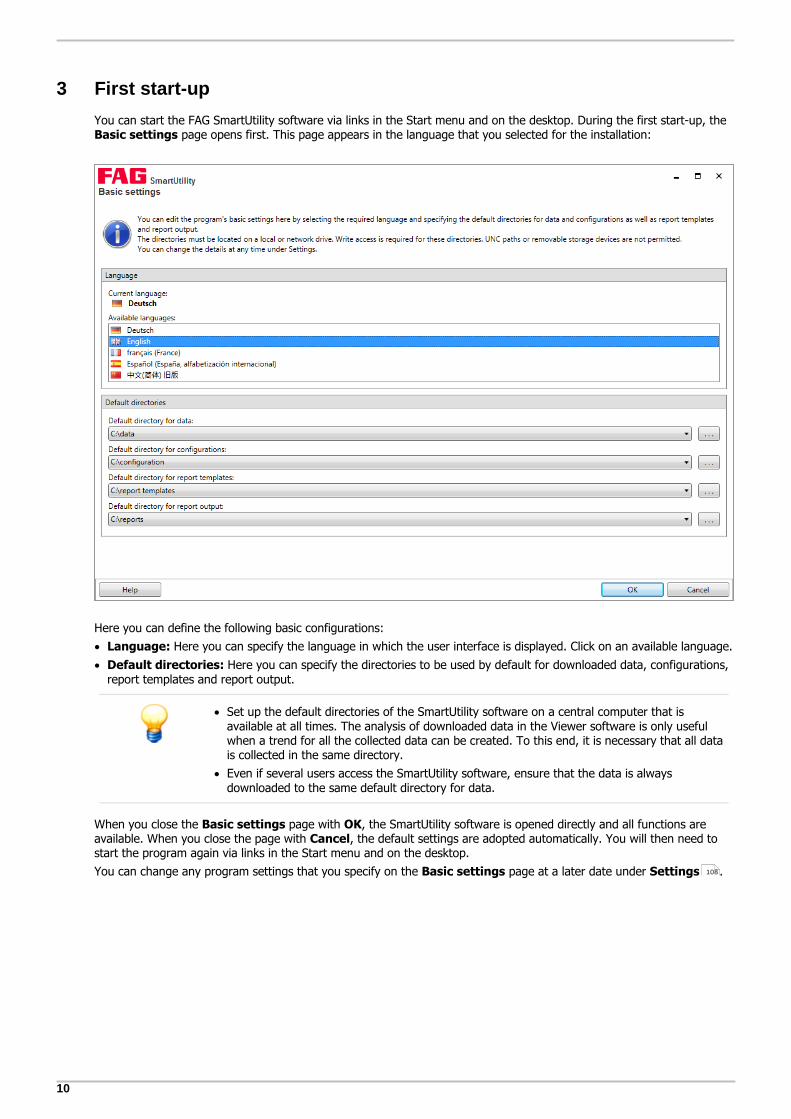
You can start the FAG SmartUtility software via links in the Start menu and on the desktop. During the first start-up, the Basic settings page opens first. This page appears in the language that you selected for the installation:
Here you can define the following basic configurations:
Language: Here you can specify the language in which the user interface is displayed. Click on an available language.
Default directories: Here you can specify the directories to be used by default for downloaded data, configurations,report templates and report output.
Set up the default directories of the SmartUtility software on a central computer that isavailable at all times. The analysis of downloaded data in the Viewer software is only usefulwhen a trend for all the collected data can be created. To this end, it is necessary that all datais collected in the same directory.
Even if several users access the SmartUtility software, ensure that the data is alwaysdownloaded to the same default directory for data.
When you close the Basic settings page with OK, the SmartUtility software is opened directly and all functions areavailable. When you close the page with Cancel, the default settings are adopted automatically. You will then need tostart the program again via links in the Start menu and on the desktop.
You can change any program settings that you specify on the Basic settings page at a later date under Settings . 108

11
The user interface at a glance
4 The user interface at a glance
The SmartUtility software user interface consists of buttons that are used to open the wizards for the most importantactions. In addition, you can find the More actions list box here, which includes additional functions and the settingsfor the SmartUtility software:
The wizards guide you through the individual steps with the aid of detailed instructions. For this reason, you will only findgeneral information and important additional information regarding the wizards under Wizards and functions . Theadditional Settings , which are not wizard-supported, are described in more detail. Here you can specify importantsettings for SmartUtility.
The button minimises the SmartUtility window. To exit the software, click on . Only exit thesoftware after a process has been fully completed; otherwise, measurement data could be lost.
12
108

12
5 Wizards and functions
If you want to use the FAG SmartUtility software to access the FAG SmartCheck device, the following requirements mustbe met:
The SmartCheck device must be started and must be in measuring mode.
The SmartCheck device must be on the network or directly connected to your computer via Ethernet cable.
The UDP communication protocol must be enabled on ports 19000 and 19001 in existing firewalls in your network
If the SmartCheck device has not been assigned an address via DHCP, it will have the IP address 192.168.1.100 bydefault. In this case, the IP address of your computer must be within the 192.168.1.x range.
Further information can be found in the FAG SmartCheck user documentation. This documentation can be found on thesupplied CD ROM.
Please contact your system administrator if you experience problems with the network settings.
Accessing the SmartCheck devices in the wizards
The name of every SmartCheck device is FAG SmartCheck by default. If you want to integrate multiple SmartCheckdevices into your system, it is important that you give each device a unique name. You can only identify devices withouta unique name in the Wizard device list via the IP address.
Configure the name using the Edit device settings wizard. Within the wizard, you can find your system'sSmartCheck devices either in the automatically generated list or by manually entering the network parameters ofthe corresponding SmartCheck device.
If you have activated user management in the FAG SmartWeb software, you also have to specify the user name andpassword for each SmartCheck device in the Settings . You can find further information on user management inthe FAG SmartWeb user documentation on the supplied CD-ROM.
If a device is started via the FAG SmartWeb software in the Maintenance System, you will be unable toopen it using SmartUtility, download data or update the firmware. Devices that have been started in the
Maintenance System are marked with the alarm symbol in the SmartUtility wizards. You will alsoreceive an error message: "A communication error occurred: The operation could not be executed.Check whether the device's Maintenance System has started."
List of FAG SmartCheck devices
In the first step - the Select devices step - all SmartUtility software wizards display the SmartCheck devices found onthe network:
The following information and functions are to be found here:
The list columns provide information on the alarm status, name, IP address, serial number and firmware version of theindividual SmartCheck devices.
12
86
12 14
111 108

13
Wizards and functions
The alarm symbols show you at a glance:
Green: There is no alarm
Yellow: One or several characteristic values have triggered a pre-alarm
Red: One or several characteristic values have triggered a main alarm
White: The alarm status is still unknown, e.g. because the SmartCheck device has not yet carried out anymeasurements.
: The device is in the Maintenance System (maintenance mode).
The alarm symbols are updated on a regular basis.
You can set any column of the list as a sort criterion by clicking in the column title. Click a second time to change thesort order, i.e. from ascending to descending or vice-versa. The current sort order is displayed by the symbols forascending and for descending.
Sorting by column is retained, even if you close the wizard and re-open it.
You can adjust the column width.
If the list does not contain any entries or a device is missing, you can update the list. To doso, press the F5 key or add the device manually (see below). If there are still no devicesdisplayed, make sure:
that the device is in measuring mode and connected to the network;
that you are connected to the network;
that the settings in the SmartUtility software are correct.
Manually added devices are then displayed even when unavailable. They are then highlighted inlight grey.
Select FAG SmartCheck devices
In the wizards, you can select one or more SmartCheck devices for each action. To do so, activate the tick in front ofthe respective device name in the list.
Below the list, you will also find symbols to filter the selection:
Symbol Explanation
Here you can select all the devices.
Here you can deselect all the devices.
Here you can invert the selection of the devices.
Here you can select all the devices for which a pre or main alarm has been triggered.This option is only available for functions that work with files on the hard drive, such as Analyse data andCreate report.
Here you can select all the devices for which a main alarm has been triggered.This option is only available for functions that work with files on the hard drive, such as Analyse data andCreate report.
Here you can manually add a device via the TCP/IP address or via a UNC path.
Context menu Right-click in the area of the device list to use the options described above via the context menu: Select alldevices, Deselect all devices, Invert device selection and Add device manually. There, you will alsofind the command Scan for new devices, with which you can update the device list:
14
Symbol Explanation
The following hotkeys can also be used for the options described above:
Ctrl+A Select all devices
Ctrl+D Deselect all devices
Ctrl+I Invert device selection
Ctrl+S Add device manually
F5 Scan for new devices
Updating the device list
The list of SmartCheck devices is updated automatically within a specified search interval. You can adjust this in the Settings . You can also update the list by pressing the F5 key.
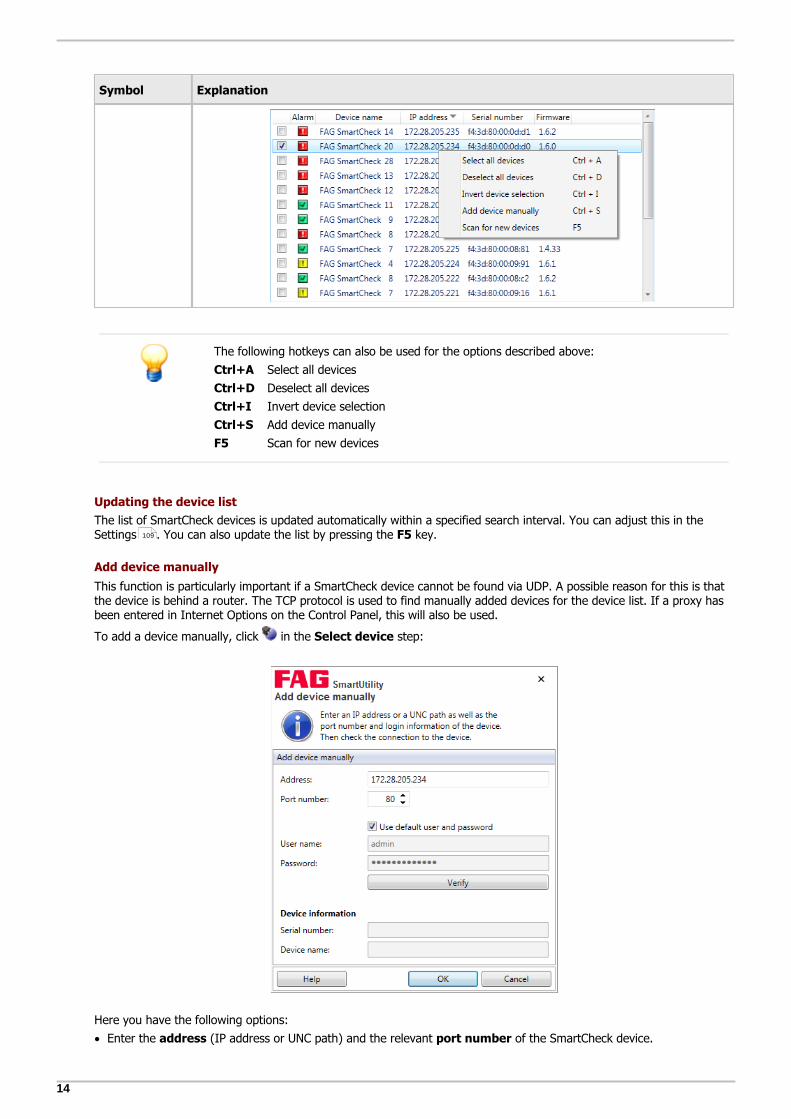
Add device manually
This function is particularly important if a SmartCheck device cannot be found via UDP. A possible reason for this is thatthe device is behind a router. The TCP protocol is used to find manually added devices for the device list. If a proxy hasbeen entered in Internet Options on the Control Panel, this will also be used.
To add a device manually, click in the Select device step:
Here you have the following options:
Enter the address (IP address or UNC path) and the relevant port number of the SmartCheck device.
109
15
Wizards and functions
If the device is password-protected, specify the user name and password.
You can also activate the Use default user and password option to log on with your user data.
Click Verify to test the connection to the SmartCheck device.
As soon as the connection to the device has been established, the serial number and device name are displayed.
Manually input devices are retained in the SmartUtility software and are also available in the other wizards of the samesoftware.
If you no longer need to use a device, you can remove it from the device list. Further information on this can be found inthe Settings section.
Further information on the password protection of SmartCheck devices can be found in the Usermanagement chapter in the FAG SmartWeb user documentation.
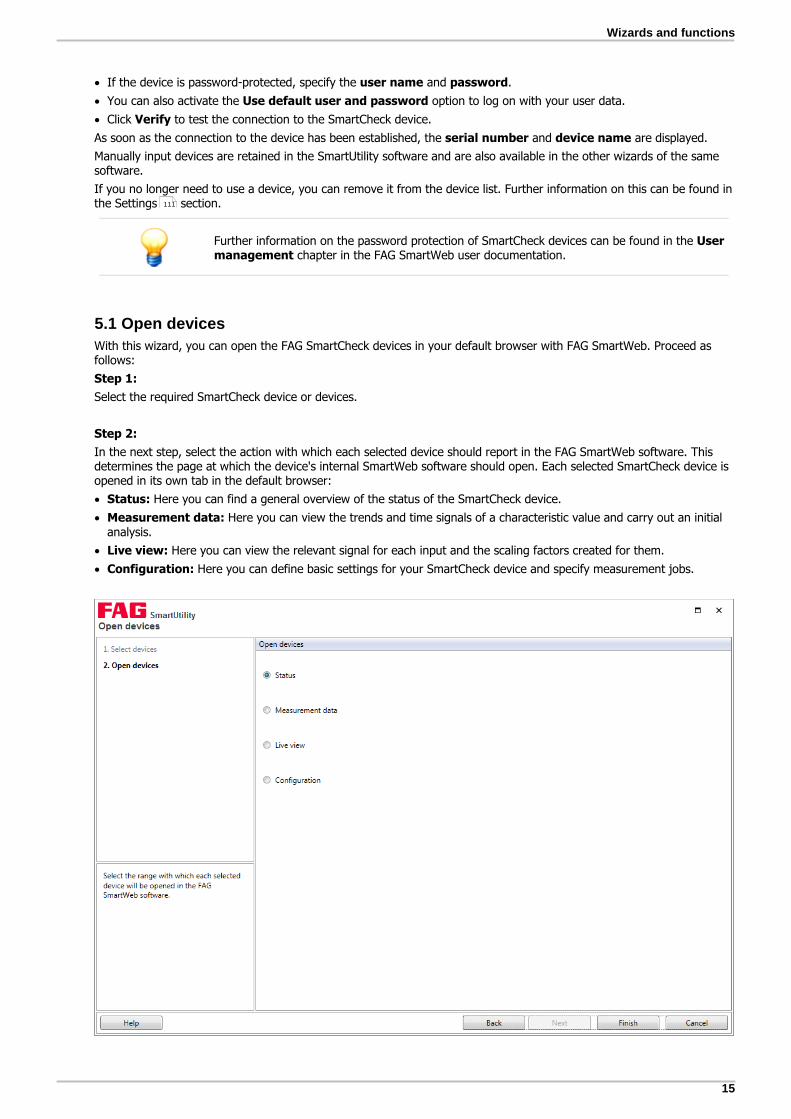
5.1 Open devices
With this wizard, you can open the FAG SmartCheck devices in your default browser with FAG SmartWeb. Proceed asfollows:
Step 1:
Select the required SmartCheck device or devices.
Step 2:
In the next step, select the action with which each selected device should report in the FAG SmartWeb software. Thisdetermines the page at which the device's internal SmartWeb software should open. Each selected SmartCheck device isopened in its own tab in the default browser:
Status: Here you can find a general overview of the status of the SmartCheck device.
Measurement data: Here you can view the trends and time signals of a characteristic value and carry out an initialanalysis.
Live view: Here you can view the relevant signal for each input and the scaling factors created for them.
Configuration: Here you can define basic settings for your SmartCheck device and specify measurement jobs.
111

16
If you cannot access the SmartWeb software, please check whether all requirements for startingup the software have been met. For more information, please see the section entitled Firststart-up in the handbook for the SmartWeb software.
Result:
The following screenshot shows a sample status page of a SmartCheck device in the SmartWeb software:
Further information on the application of the FAG SmartWeb software can be found in the FAG SmartWeb userdocumentation. This is available as a PDF on the supplied CD-ROM.
If you are working on a computer with several SmartCheck devices, these devices should haveidentical firmware versions installed. If different firmware versions are installed, this can haveundesired effects within the browser.
5.2 Download data
With this wizard, you can download the measurement data from the FAG SmartCheck devices. Proceed as follows:
Step 1:
Select the required SmartCheck device or devices from which you want to download the data.
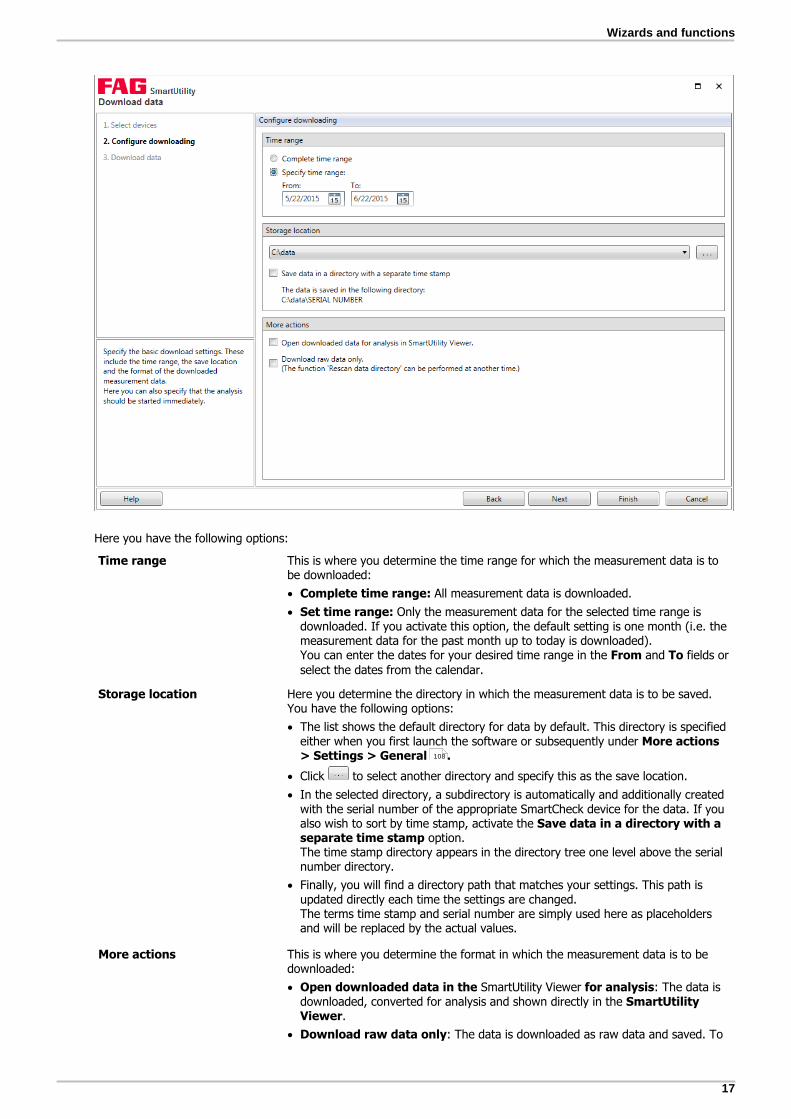
Step 2:
Next, determine the time range for which the data is to be downloaded. Also specify the save location and format for thedata:
17
Wizards and functions
Here you have the following options:
Time range This is where you determine the time range for which the measurement data is tobe downloaded:
Complete time range: All measurement data is downloaded.
Set time range: Only the measurement data for the selected time range isdownloaded. If you activate this option, the default setting is one month (i.e. themeasurement data for the past month up to today is downloaded).You can enter the dates for your desired time range in the From and To fields orselect the dates from the calendar.
Storage location Here you determine the directory in which the measurement data is to be saved.You have the following options:
The list shows the default directory for data by default. This directory is specifiedeither when you first launch the software or subsequently under More actions> Settings > General .
Click to select another directory and specify this as the save location.
In the selected directory, a subdirectory is automatically and additionally createdwith the serial number of the appropriate SmartCheck device for the data. If youalso wish to sort by time stamp, activate the Save data in a directory with aseparate time stamp option.The time stamp directory appears in the directory tree one level above the serialnumber directory.
Finally, you will find a directory path that matches your settings. This path isupdated directly each time the settings are changed.The terms time stamp and serial number are simply used here as placeholdersand will be replaced by the actual values.
More actions This is where you determine the format in which the measurement data is to bedownloaded:
Open downloaded data in the SmartUtility Viewer for analysis: The data isdownloaded, converted for analysis and shown directly in the SmartUtilityViewer.
Download raw data only: The data is downloaded as raw data and saved. To
108
18
analyse this data, you need to convert it in a subsequent step using the Moreactions > Rescan data directory wizard.This option is provided in case you wish to speed up the download.
If both options are deactivated, the measurement data is downloaded, convertedand saved in the specified directory. It is not opened in SmartUtility Viewer foranalysis.
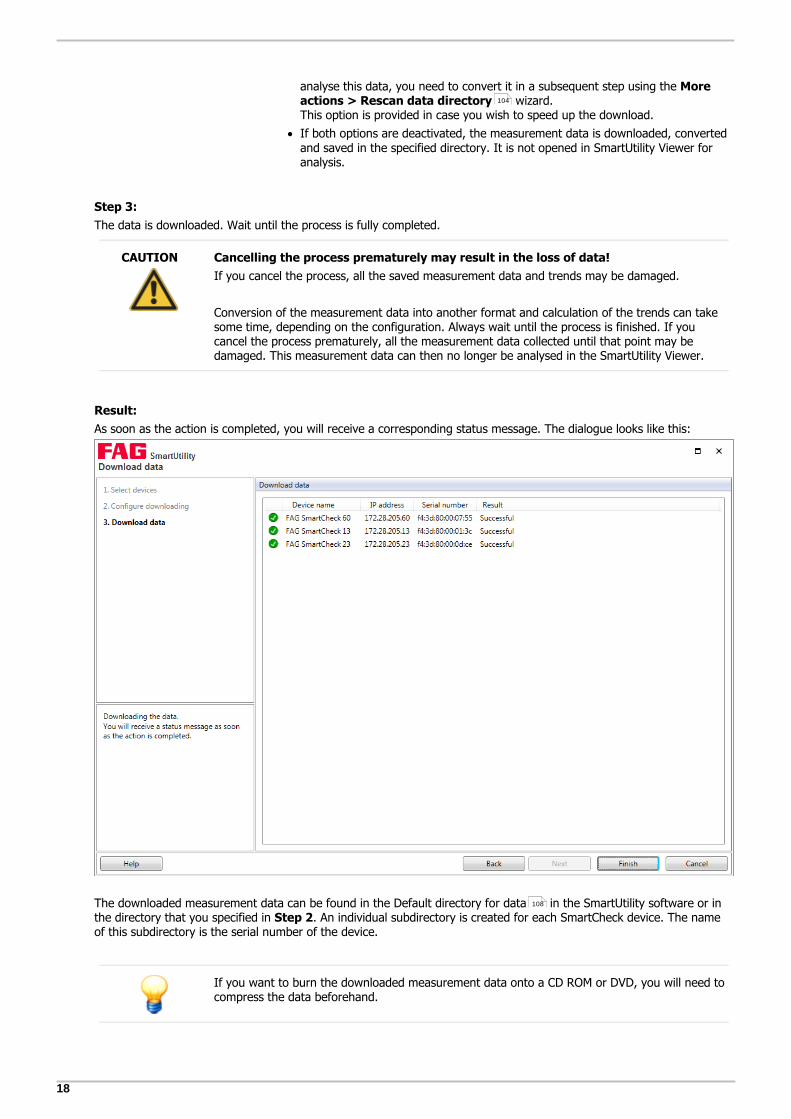
Step 3:
The data is downloaded. Wait until the process is fully completed.
CAUTION Cancelling the process prematurely may result in the loss of data!
If you cancel the process, all the saved measurement data and trends may be damaged.
Conversion of the measurement data into another format and calculation of the trends can takesome time, depending on the configuration. Always wait until the process is finished. If youcancel the process prematurely, all the measurement data collected until that point may bedamaged. This measurement data can then no longer be analysed in the SmartUtility Viewer.
Result:
As soon as the action is completed, you will receive a corresponding status message. The dialogue looks like this:
The downloaded measurement data can be found in the Default directory for data in the SmartUtility software or inthe directory that you specified in Step 2. An individual subdirectory is created for each SmartCheck device. The nameof this subdirectory is the serial number of the device.
If you want to burn the downloaded measurement data onto a CD ROM or DVD, you will need tocompress the data beforehand.
104
108

19
Wizards and functions
5.3 Analyse data
With this wizard, you can open the measurement data you have downloaded from SmartCheck devices in order toanalyse it in the SmartUtility Viewer software.
This version of the FAG SmartUtility Viewer software includes the introduction of a new fileformat. Data in the previous file format can no longer be loaded.
You have the following options to continue working with this data:
Open the FAG SmartUtility software and perform the action Rescan data directory; thisaction converts data that has already been downloaded into the new file format, withoutdownloading new data from the FAG SmartCheck device. Details on this can be found in the"Rescan data directory" section in the manual for the FAG SmartUtility software.
Reimport the required data from the SmartCheck device.
Proceed as follows:
Step:
1. Select the directory in which the data is located. This may be the default directory or a directory you have selectedyourself.
2. Select the SmartCheck device that contains the data you want to analyse. You can also select multiple devices:
In the Status column you will find one of several possible data status symbols. If you move the mouse over it, you willobtain information about the status of the data. The following status messages are possible:
Symbol Tooltip text Description
Data not yet converted to the new format. The data comes from a device with firmware version1.0.x or 1.4.x. The SmartUtility Viewer softwarecannot be opened with this data.
In this directory there is data that has not yet been The directory contains a database of version 1.6.x,
108

20
converted to the new format. To ensure that thedata can be shown in the Viewer, please performthe "Rescan data directory" action under "Moreactions".
the data from which can be shown without issue inthe SmartUtility Viewer software.
In addition, the directory also contains *.scd1 filesand/or data from a device with the firmware version1.0.x or 1.4.x . This data is not included in the 1.6.xdatabase. You must convert this data to open it withthe SmartUtility Viewer software.
Data not yet converted to the new format. As thealarm information is no longer available, the alarmstatus is reset upon conversion.
The directory contains *.scd1 files or data from adevice with firmware version 1.0.x or 1.4.x . The SmartUtility Viewer software cannot be opened withthis data. The alarm status is lost during conversion.
The data has already been converted to the newformat without the alarm status. The alarm statuscannot be adopted, as the original data is no longeravailable. The alarm status has been resetautomatically. A repeat conversion is not possible.
The data comes from a device with the firmwareversion 1.0.x or 1.4.x and has already beenconverted. A VHF folder does not exist, so there isno information about the alarm status. However, adatabase for version 1.6.x is available, meaning thatthe data can be opened in the SmartUtility Viewersoftware.
The data has already been converted to the newformat, but the alarm status was not adopted.
A repeat conversion is possible, during which thealarm status would be adopted.
The data comes from a device with the firmwareversion 1.0.x or 1.4.x and has already beenconverted. The VHF folder is available, so there isinformation about the alarm status. A database forversion 1.6.x is also available, meaning that the datacan be opened in the SmartUtility Viewer software.During a conversion, the alarm status is alsoupdated.
The data has been successfully converted to thenew format. A repeat conversion is not necessary.
The data can be opened without issue and includingthe alarm status in the SmartUtility Viewer software.
Result:
After you have clicked on Finish the data is opened directly in the SmartUtility Viewer software and is available foranalysis.
21
Wizards and functions
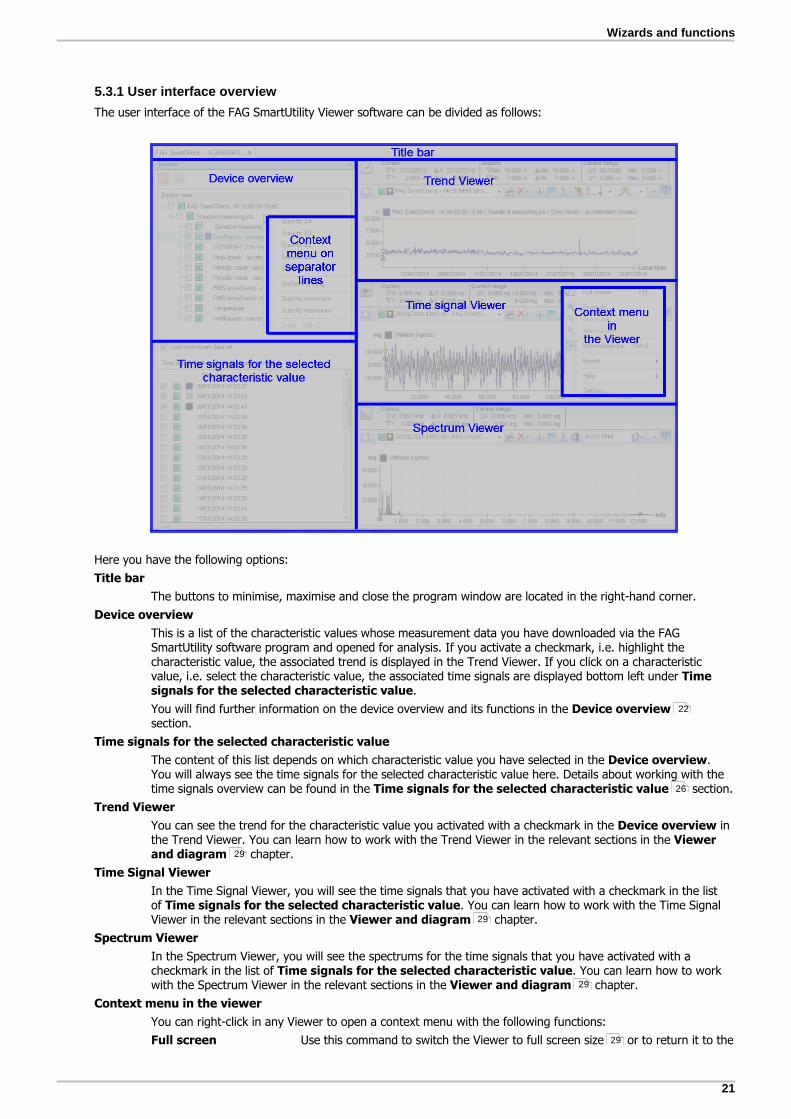
5.3.1 User interface overview
The user interface of the FAG SmartUtility Viewer software can be divided as follows:
Here you have the following options:
Title bar
The buttons to minimise, maximise and close the program window are located in the right-hand corner.
Device overview
This is a list of the characteristic values whose measurement data you have downloaded via the FAGSmartUtility software program and opened for analysis. If you activate a checkmark, i.e. highlight thecharacteristic value, the associated trend is displayed in the Trend Viewer. If you click on a characteristicvalue, i.e. select the characteristic value, the associated time signals are displayed bottom left under Timesignals for the selected characteristic value.
You will find further information on the device overview and its functions in the Device overviewsection.
Time signals for the selected characteristic value
The content of this list depends on which characteristic value you have selected in the Device overview.You will always see the time signals for the selected characteristic value here. Details about working with thetime signals overview can be found in the Time signals for the selected characteristic value section.
Trend Viewer
You can see the trend for the characteristic value you activated with a checkmark in the Device overview inthe Trend Viewer. You can learn how to work with the Trend Viewer in the relevant sections in the Viewerand diagram chapter.
Time Signal Viewer
In the Time Signal Viewer, you will see the time signals that you have activated with a checkmark in the listof Time signals for the selected characteristic value. You can learn how to work with the Time SignalViewer in the relevant sections in the Viewer and diagram chapter.
Spectrum Viewer
In the Spectrum Viewer, you will see the spectrums for the time signals that you have activated with acheckmark in the list of Time signals for the selected characteristic value. You can learn how to workwith the Spectrum Viewer in the relevant sections in the Viewer and diagram chapter.
Context menu in the viewer
You can right-click in any Viewer to open a context menu with the following functions:
Full screen Use this command to switch the Viewer to full screen size or to return it to the
22
26
29
29
29
29

22
FAG SmartUtility Viewer software interface.
Zoom in Use this command to zoom gradually into the diagram for the active Viewer.
Zoom out This command undoes the last zoom step in the diagram for the activeViewer.
Normal view This command undoes all of the zoom steps in the diagram for the activeViewer.
Information bar Use this command to hide or show the viewer's information bar.
Help This is where you can find SmartUtility Viewer Help; the About command alsooffers detailed information on the version of the FAG SmartUtility Viewersoftware.
Export Use these commands to save or copy a diagram in different formats. You will findfurther information on these commands in the Exporting diagrams section.
Settings This command opens a dialogue box with numerous settings options. You can usethese to adjust the FAG SmartUtility Viewer software to suit your needs. You willfind further information in the Change program settings section.
Context menu on separator lines
Right-click on the line separating two areas from each other to call up a context menu. This contains functionsthat allow you to define the size of each area and their relation to each other. The functions relate to the areaabove a horizontal separator line, or the area to the left of a vertical separator line. The only exception to thisrule is the function Apply uniform scaling: if you use this function on a horizontal separator line betweenviewers, it will apply to all three viewers, i.e. display all three with the same size.
The following functions are available to you:
Scale to 3:4: This scales the area to 3/4 of the available space.
Scale to 2:3: This scales the area to 2/3 of the available space.
Scale to 1:2: This scales the area to 1/2 of the available space.
Scale to 1:3: This scales the area to 1/3 of the available space.
Scale to 1:4: This scales the area to 1/4 of the available space.
Scale equally: This scales neighbouring areas to equal sizes.
Scale to maximum/minimum: This scales the area to the maximum possible size.
Undo (CTRL+Z): This key combination undoes the last change.
You can also scale the areas manually:
1. Move the mouse over the separator line that you want to move.
2. Once the mouse pointer changes into a double-headed arrow , click and holdthe left mouse button and pull the line to the new position.
5.3.2 Device overview
Once you have started the FAG SmartUtility Viewer software from within the FAG SmartUtility software, you will find the device overview with characteristic values at the top left. Both the list of Time signals for the selectedcharacteristic value and the viewers are empty. If you activate a checkbox in front of a characteristic value, the trendis loaded in the Trend Viewer. In addition, the list of Time signals for the selected characteristic value fills up. Thelatest time signal is shown in the Time Signal and Spectrum Viewer, if the option Load most recent data set has beenactivated:
29
29
29
68
72

23
Wizards and functions
You will find the following functions and information in the device overview:
Measurement value details:
The individual device overview levels offer detailed information on the measurement values in question:
Top level: Contains the name and serial number of the FAG SmartCheck device that provided the data.
Middle level:Contains the name of the measurement jobs, which have saved the data.
On this level you will also find the section Measurement triggers and conditions, if data has beensaved for this.
Last level:In the first instance, you will find the alarm characteristic value under Measurement jobs that you havedefined in your measurement job. This is followed by the characteristic values of your measurement job,i.e. the characteristic values that were used to calculate the overriding alarm characteristic values.
You will find the individual triggers and conditions under Measurement triggers and conditions.
Select characteristic value
Select a characteristic value by clicking on the characteristic value in the Device overview. Thecharacteristic value is then highlighted in colour:
24
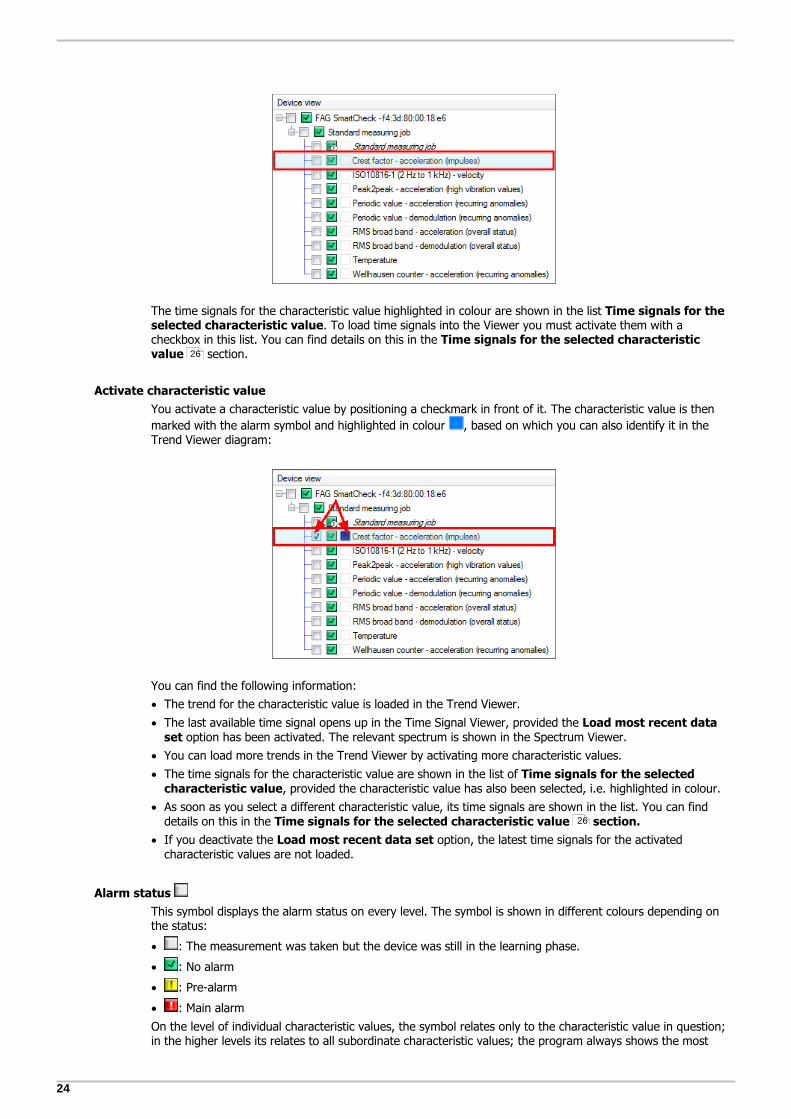
The time signals for the characteristic value highlighted in colour are shown in the list Time signals for theselected characteristic value. To load time signals into the Viewer you must activate them with acheckbox in this list. You can find details on this in the Time signals for the selected characteristicvalue section.
Activate characteristic value
You activate a characteristic value by positioning a checkmark in front of it. The characteristic value is then
marked with the alarm symbol and highlighted in colour , based on which you can also identify it in theTrend Viewer diagram:
You can find the following information:
The trend for the characteristic value is loaded in the Trend Viewer.
The last available time signal opens up in the Time Signal Viewer, provided the Load most recent dataset option has been activated. The relevant spectrum is shown in the Spectrum Viewer.
You can load more trends in the Trend Viewer by activating more characteristic values.
The time signals for the characteristic value are shown in the list of Time signals for the selectedcharacteristic value, provided the characteristic value has also been selected, i.e. highlighted in colour.
As soon as you select a different characteristic value, its time signals are shown in the list. You can finddetails on this in the Time signals for the selected characteristic value section.
If you deactivate the Load most recent data set option, the latest time signals for the activatedcharacteristic values are not loaded.
Alarm status
This symbol displays the alarm status on every level. The symbol is shown in different colours depending onthe status:
: The measurement was taken but the device was still in the learning phase.
: No alarm
: Pre-alarm
: Main alarm
On the level of individual characteristic values, the symbol relates only to the characteristic value in question;in the higher levels its relates to all subordinate characteristic values; the program always shows the most
26
26

25
Wizards and functions
critical alarm status. For instance, if there is a characteristic value with a main alarm, then the main alarmstatus is set for the entire measurement job.
If you move the mouse over the symbol, you will see a preview of the trend and of the last available timesignal and spectrum. You will also find brief information here, such as the time stamp or the minimum andmaximum values for the Y-axis:
Colour identification
The colour box shows you the colour used to identify the trend in the Trend Viewer. This allows you todifferentiate between several loaded trends.
If you move the mouse over the coloured box, the associated trend is highlighted in the Trend Viewer, whilethe other trends are greyed out:
Button
Click this button to open further measurement data in *.SUVINFO format or *.DB format from another FAGSmartCheck device. This function automatically opens the directory from where the last device was opened;you can search for another directory if your data is not located here.
Button
Click this button to remove the FAG SmartCheck device selected in the device overview, together with all themeasurement data, from the overview. This function is only available if you have selected the top level, i.e.the name and serial number of the FAG SmartCheck device:
26
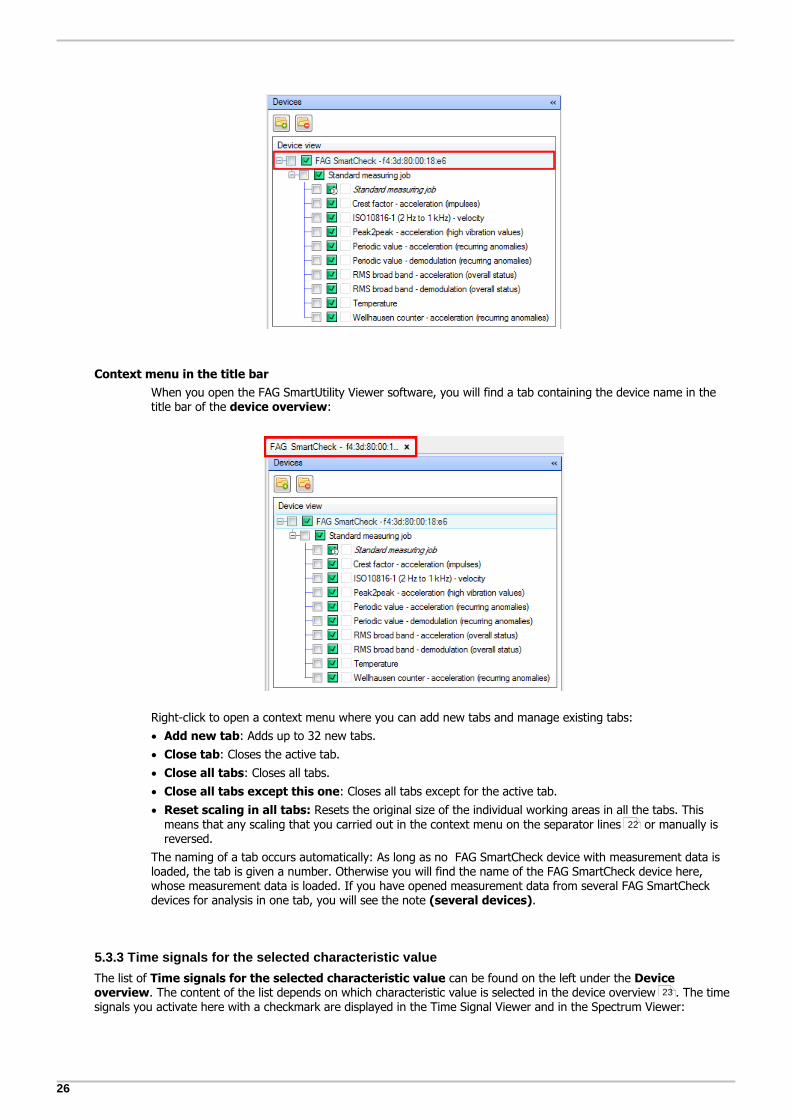
Context menu in the title bar
When you open the FAG SmartUtility Viewer software, you will find a tab containing the device name in thetitle bar of the device overview:
Right-click to open a context menu where you can add new tabs and manage existing tabs:
Add new tab: Adds up to 32 new tabs.
Close tab: Closes the active tab.
Close all tabs: Closes all tabs.
Close all tabs except this one: Closes all tabs except for the active tab.
Reset scaling in all tabs: Resets the original size of the individual working areas in all the tabs. Thismeans that any scaling that you carried out in the context menu on the separator lines or manually isreversed.
The naming of a tab occurs automatically: As long as no FAG SmartCheck device with measurement data isloaded, the tab is given a number. Otherwise you will find the name of the FAG SmartCheck device here,whose measurement data is loaded. If you have opened measurement data from several FAG SmartCheckdevices for analysis in one tab, you will see the note (several devices).
5.3.3 Time signals for the selected characteristic value
The list of Time signals for the selected characteristic value can be found on the left under the Deviceoverview. The content of the list depends on which characteristic value is selected in the device overview . The timesignals you activate here with a checkmark are displayed in the Time Signal Viewer and in the Spectrum Viewer:
22
23

27
Wizards and functions
You have access to the following information and functions:
Speed source
Here, you can select the appropriate speed source from all speed sources defined in the measurementconfiguration. For gearboxes with a transmission, for example, you can select a second speed source here.The relevant speed and rotational frequency are displayed in the list of time signals.
Selecting a time signal
You select a time signal by activating a checkbox at the start of the line. The activated time signal is thendisplayed in the Time Signal Viewer and in the Spectrum Viewer.
Selecting multiple time signals
To select several time signals at the same time, perform the two steps described below:
Step 1: Click to select the required time signals
You have the following options for selecting the required time signals:
Hold down CTRL and click on the required lines.
To select a consecutive range of time signals, click on the first time signal in the desired range, hold theSHIFT key and then click on the last time signal in the desired range.
Selected time signals are highlighted in colour.
Step 2: Use the check box to select time signals
Select one of the lines highlighted in colour with a checkmark. All the other lines highlighted in colour willalso be selected.
You can use the same method to remove a multiple selection.
Alarm status
This symbol indicates the alarm status for the data:
: The measurement was taken but the device was still in the learning phase.
: No alarm
: Pre-alarm
: Main alarm
If you move the mouse over a symbol, you will see a preview of the time signal and the spectrum:

28
Colour identification
The coloured box indicates the colour used to display the data in the diagram. In this way you candifferentiate between several loaded time signals or spectrums.
If you move the mouse over the coloured box, the associated signal is highlighted in the Time Signal andSpectrum Viewer, while the other signals are greyed out:
Time stamp
This is where you will find detailed information about when the time signal was saved.

29
Wizards and functions
In the list of Time signals for the selected characteristic value you can use the columnsas a sort criterion:
Set any column as a sort criterion by clicking in the column title. Click a second time to changethe sort order, i.e. from ascending to descending or vice-versa. The current sort order isdisplayed by the symbols for ascending and for descending.
5.3.4 Viewer and diagram
All of the FAG SmartUtility Viewer software viewers are identical in design and offer you the same basic functions andadjustment options, with a few exceptions. Each viewer consists of the information bar , toolbar and diagramareas:
You can find information on each area of the viewer in the following sections.
Information bar
The upper area of the Viewer contains basic information on the position of the base cursor and measure cursor ,and on the values of the cursor range.
You can access the following information and functions via the information bar:
This symbol indicates a time signal.
This symbol indicates a spectrum.
This symbol indicates a trend.
Cursor The Cursor range contains the X and Y positions for both the base cursor and the measure cursor.You can also see the corresponding symbols for both cursors that are used to indicate them in thediagram.
The X and Y values are adjusted automatically when you change the position of the cursor in thediagram.
Alarms Trend Viewer only
Here you will find the alarm limits for the main alarm and pre-alarm.
Cursor range This shows you the difference between the base cursor and measure cursor, together with thesmallest (min.) and largest (max.) values in the cursor range.
The difference values are adjusted automatically when you change the position of the cursor in thediagram.
29 30 32
51 51

30
If you do not need the information bar or need more space to display the diagram, you can hideit using one of the following methods:
Right-click to open the context menu for the Viewer and select the Information bar. Youcan also use this function to display the information bar again.
If you want to hide the information bars for all Viewers when you start the FAG SmartUtilityViewer software, you will need to adjust the Viewer program settings:
1. Right-click to open the context menu for the Viewer and select Settings.
2. Click on Viewer in the left-hand area.
3. In the Visible elements on startup section, uncheck the Information bar option. Theinformation bar will not appear in any of the viewers when the program is next started.
Toolbar
You can gain access to all the functions for data analysis and working on the diagram in the toolbar. The followingoverview shows you which functions you can call up via the selection lists and symbols. If a function is not available forall the viewers, you will find a note to this effect.
If not all of the symbols on the toolbar can be displayed, for example if the Viewer is too narrow,you will find the symbol on the right edge of the toolbar. Click on this to show the hiddentoolbar functions:
Click this symbol to show the viewer in full screen mode.
To reintegrate the Viewer into the FAG SmartUtility Viewer software interface, click on the
symbol.
Alternatively, you can access both commands by right-clicking in the context menu for theViewer .
Use this list to determine the active signal, which is influenced by cursor functions, forinstance. In each list entry you can find the following information:
: The coloured box identifies the loaded trend or the loaded signal. You will find thesame colour identification on the left in the device overview or in the list of Timesignals for the selected characteristic value.
: The yellow triangle identifies the currently active trend, the active time signal or theactive spectrum.
: This symbol indicates the alarm status of the data:
: The measurement was taken but the device was still in the learning phase.
: No alarm
: Pre-alarm
: Main alarm
More details give you information about the time stamp, the name of the measurementconfiguration and the speed or frequency.
Click here to display just the active signal. Clicking again shows all the loaded signals.
21
21
73
21
31
Wizards and functions
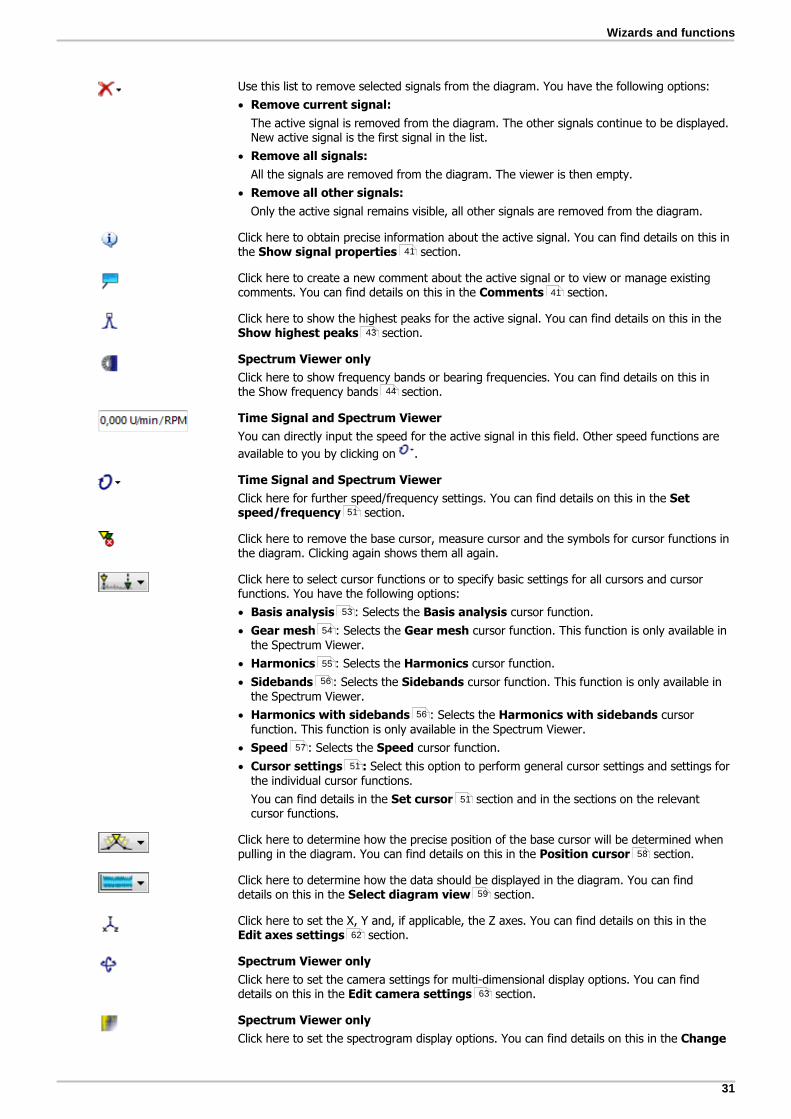
Use this list to remove selected signals from the diagram. You have the following options:
Remove current signal:
The active signal is removed from the diagram. The other signals continue to be displayed.New active signal is the first signal in the list.
Remove all signals:
All the signals are removed from the diagram. The viewer is then empty.
Remove all other signals:
Only the active signal remains visible, all other signals are removed from the diagram.
Click here to obtain precise information about the active signal. You can find details on this inthe Show signal properties section.
Click here to create a new comment about the active signal or to view or manage existingcomments. You can find details on this in the Comments section.
Click here to show the highest peaks for the active signal. You can find details on this in the Show highest peaks section.
Spectrum Viewer only
Click here to show frequency bands or bearing frequencies. You can find details on this inthe Show frequency bands section.
Time Signal and Spectrum Viewer
You can directly input the speed for the active signal in this field. Other speed functions are
available to you by clicking on .
Time Signal and Spectrum Viewer
Click here for further speed/frequency settings. You can find details on this in the Setspeed/frequency section.
Click here to remove the base cursor, measure cursor and the symbols for cursor functions inthe diagram. Clicking again shows them all again.
Click here to select cursor functions or to specify basic settings for all cursors and cursorfunctions. You have the following options:
Basis analysis : Selects the Basis analysis cursor function.
Gear mesh : Selects the Gear mesh cursor function. This function is only available inthe Spectrum Viewer.
Harmonics : Selects the Harmonics cursor function.
Sidebands : Selects the Sidebands cursor function. This function is only available inthe Spectrum Viewer.
Harmonics with sidebands : Selects the Harmonics with sidebands cursorfunction. This function is only available in the Spectrum Viewer.
Speed : Selects the Speed cursor function.
Cursor settings : Select this option to perform general cursor settings and settings forthe individual cursor functions.
You can find details in the Set cursor section and in the sections on the relevantcursor functions.
Click here to determine how the precise position of the base cursor will be determined whenpulling in the diagram. You can find details on this in the Position cursor section.
Click here to determine how the data should be displayed in the diagram. You can finddetails on this in the Select diagram view section.
Click here to set the X, Y and, if applicable, the Z axes. You can find details on this in the Edit axes settings section.
Spectrum Viewer only
Click here to set the camera settings for multi-dimensional display options. You can finddetails on this in the Edit camera settings section.
Spectrum Viewer only
Click here to set the spectrogram display options. You can find details on this in the Change
41
41
43
44
51
53
54
55
56
56
57
51
51
58
59
62
63
32
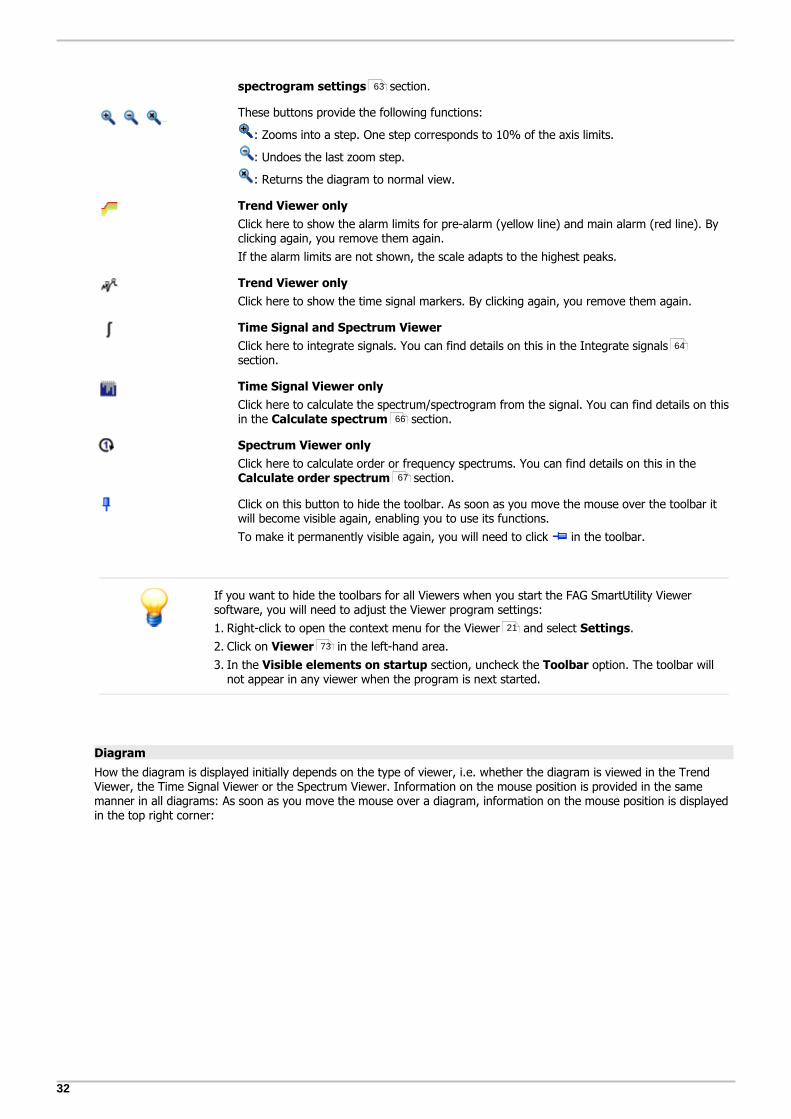
spectrogram settings section.
These buttons provide the following functions:
: Zooms into a step. One step corresponds to 10% of the axis limits.
: Undoes the last zoom step.
: Returns the diagram to normal view.
Trend Viewer only
Click here to show the alarm limits for pre-alarm (yellow line) and main alarm (red line). Byclicking again, you remove them again.
If the alarm limits are not shown, the scale adapts to the highest peaks.
Trend Viewer only
Click here to show the time signal markers. By clicking again, you remove them again.
Time Signal and Spectrum Viewer
Click here to integrate signals. You can find details on this in the Integrate signalssection.
Time Signal Viewer only
Click here to calculate the spectrum/spectrogram from the signal. You can find details on thisin the Calculate spectrum section.
Spectrum Viewer only
Click here to calculate order or frequency spectrums. You can find details on this in the Calculate order spectrum section.
Click on this button to hide the toolbar. As soon as you move the mouse over the toolbar itwill become visible again, enabling you to use its functions.
To make it permanently visible again, you will need to click in the toolbar.
If you want to hide the toolbars for all Viewers when you start the FAG SmartUtility Viewersoftware, you will need to adjust the Viewer program settings:
1. Right-click to open the context menu for the Viewer and select Settings.
2. Click on Viewer in the left-hand area.
3. In the Visible elements on startup section, uncheck the Toolbar option. The toolbar willnot appear in any viewer when the program is next started.
Diagram
How the diagram is displayed initially depends on the type of viewer, i.e. whether the diagram is viewed in the TrendViewer, the Time Signal Viewer or the Spectrum Viewer. Information on the mouse position is provided in the samemanner in all diagrams: As soon as you move the mouse over a diagram, information on the mouse position is displayedin the top right corner:
63
64
66
67
21
73
33
Wizards and functions
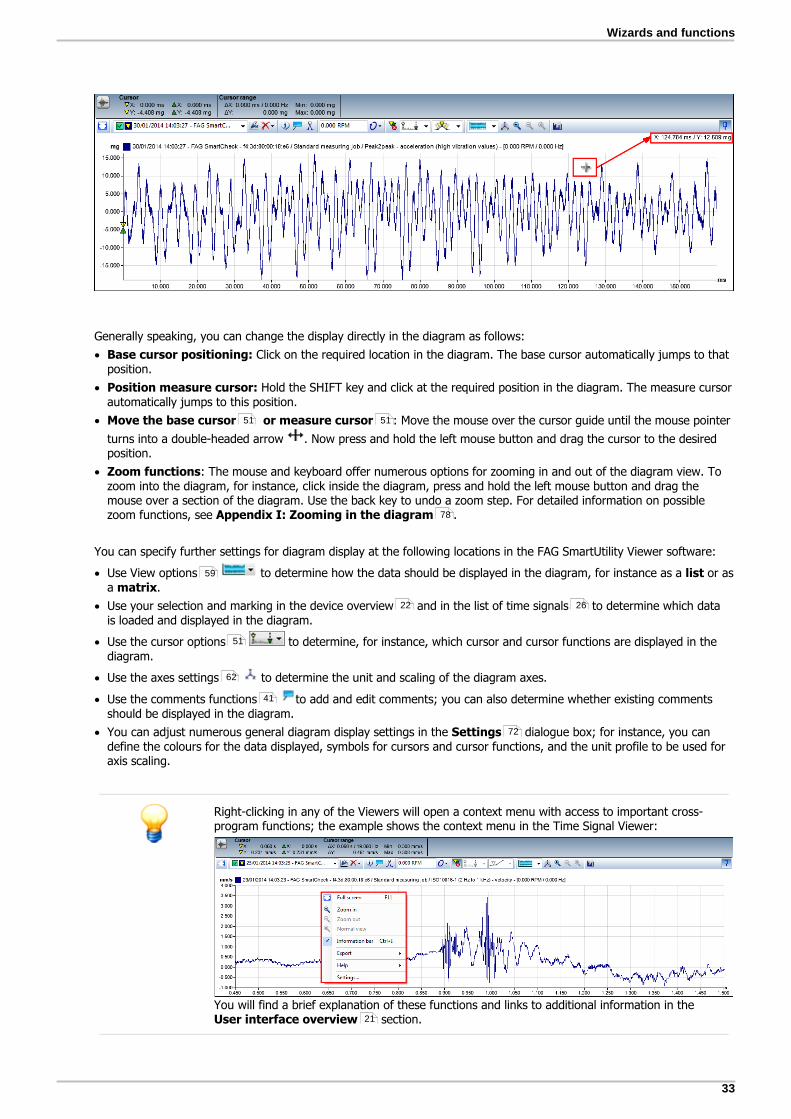
Generally speaking, you can change the display directly in the diagram as follows:
Base cursor positioning: Click on the required location in the diagram. The base cursor automatically jumps to thatposition.
Position measure cursor: Hold the SHIFT key and click at the required position in the diagram. The measure cursorautomatically jumps to this position.
Move the base cursor or measure cursor : Move the mouse over the cursor guide until the mouse pointer
turns into a double-headed arrow . Now press and hold the left mouse button and drag the cursor to the desiredposition.
Zoom functions: The mouse and keyboard offer numerous options for zooming in and out of the diagram view. Tozoom into the diagram, for instance, click inside the diagram, press and hold the left mouse button and drag themouse over a section of the diagram. Use the back key to undo a zoom step. For detailed information on possiblezoom functions, see Appendix I: Zooming in the diagram .
You can specify further settings for diagram display at the following locations in the FAG SmartUtility Viewer software:
Use View options to determine how the data should be displayed in the diagram, for instance as a list or asa matrix.
Use your selection and marking in the device overview and in the list of time signals to determine which datais loaded and displayed in the diagram.
Use the cursor options to determine, for instance, which cursor and cursor functions are displayed in thediagram.
Use the axes settings to determine the unit and scaling of the diagram axes.
Use the comments functions to add and edit comments; you can also determine whether existing commentsshould be displayed in the diagram.
You can adjust numerous general diagram display settings in the Settings dialogue box; for instance, you candefine the colours for the data displayed, symbols for cursors and cursor functions, and the unit profile to be used foraxis scaling.
Right-clicking in any of the Viewers will open a context menu with access to important cross-program functions; the example shows the context menu in the Time Signal Viewer:
You will find a brief explanation of these functions and links to additional information in the User interface overview section.
51 51
78
59
22 26
51
62
41
72
21
34
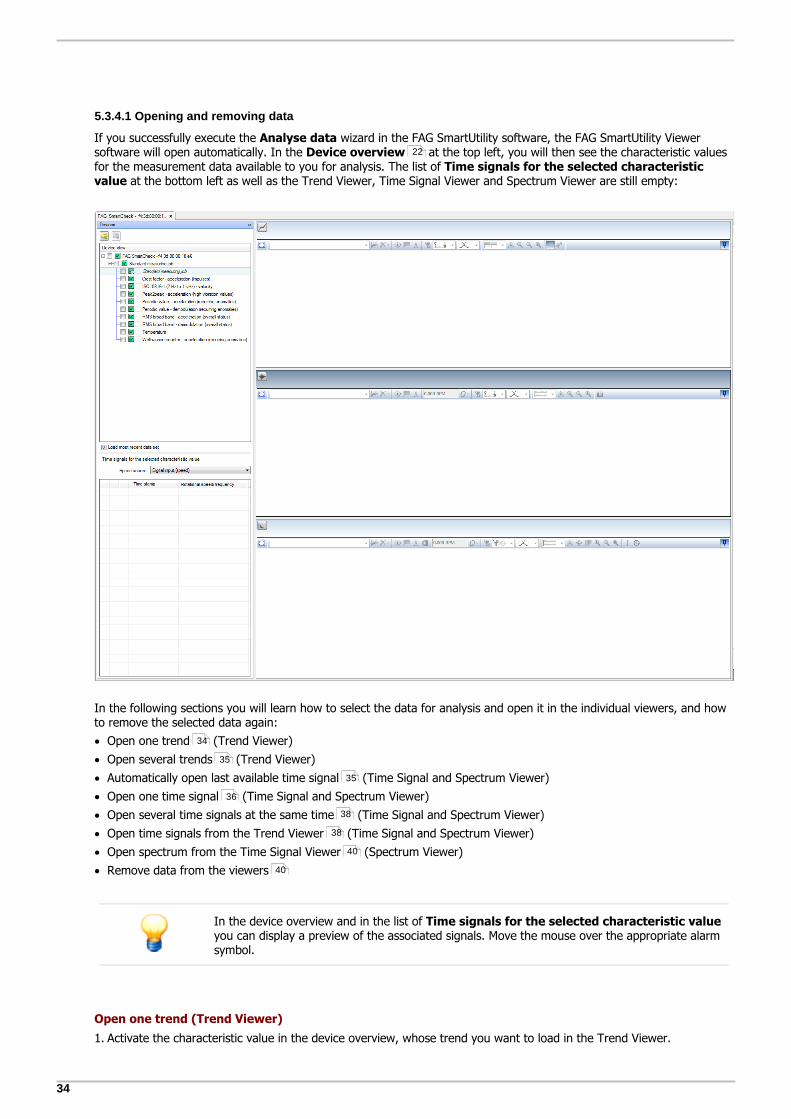
5.3.4.1 Opening and removing data
If you successfully execute the Analyse data wizard in the FAG SmartUtility software, the FAG SmartUtility Viewersoftware will open automatically. In the Device overview at the top left, you will then see the characteristic valuesfor the measurement data available to you for analysis. The list of Time signals for the selected characteristicvalue at the bottom left as well as the Trend Viewer, Time Signal Viewer and Spectrum Viewer are still empty:
In the following sections you will learn how to select the data for analysis and open it in the individual viewers, and howto remove the selected data again:
Open one trend (Trend Viewer)
Open several trends (Trend Viewer)
Automatically open last available time signal (Time Signal and Spectrum Viewer)
Open one time signal (Time Signal and Spectrum Viewer)
Open several time signals at the same time (Time Signal and Spectrum Viewer)
Open time signals from the Trend Viewer (Time Signal and Spectrum Viewer)
Open spectrum from the Time Signal Viewer (Spectrum Viewer)
Remove data from the viewers
In the device overview and in the list of Time signals for the selected characteristic valueyou can display a preview of the associated signals. Move the mouse over the appropriate alarmsymbol.
Open one trend (Trend Viewer)
1. Activate the characteristic value in the device overview, whose trend you want to load in the Trend Viewer.
22
34
35
35
36
38
38
40
40

35
Wizards and functions
2. The trend is loaded in the Trend Viewer:
The list of Time signals for the selected characteristic value is also displayed. If the option Load most recentdata set has been activated, the last available time signal will also be loaded in the Time Signal/Spectrum Viewer.
Open several trends (Trend Viewer)
You can compare the trends of several characteristic values with each other by going to the device overview andactivating characteristic values several times. The associated trends will then all be displayed in the Trend Viewer.The type of display depends on which diagram view you have selected :
With each additional open trend, the Time Signal and Spectrum Viewer are also adjusted: If the Load most recentdata set option has been activated, the last available time signal will be loaded in the Time Signal and Spectrum Viewerfor each loaded trend.
Automatically open the most recent data set (Time Signal and Spectrum Viewer)
Activate the option Load most recent data set. Then activate the characteristic value in the device overview, forwhich you want to load the most recent data set in the Time Signal and Spectrum Viewer:
24
59

36
The latest time signal is automatically activated in the list of Time signals for the selected characteristic value.
The latest time signal is loaded in the Time Signal/Spectrum Viewer.
In addition, the associated trend is loaded in the Trend Viewer and the list of time signals for the characteristic value isdisplayed.
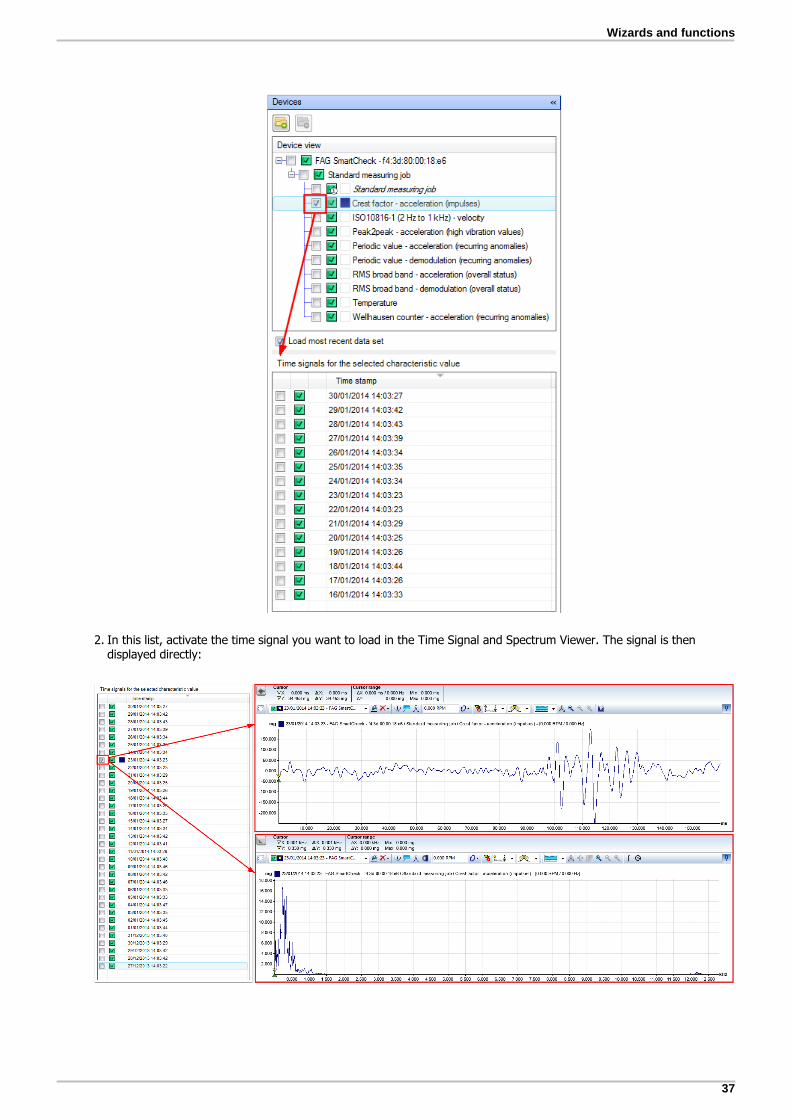
Open one time signal (Time Signal and Spectrum Viewer)
1. Select the characteristic value for which you want to load a time signal. The list of Time signals for the selectedcharacteristic value fills up:
37
Wizards and functions
2. In this list, activate the time signal you want to load in the Time Signal and Spectrum Viewer. The signal is thendisplayed directly:
38
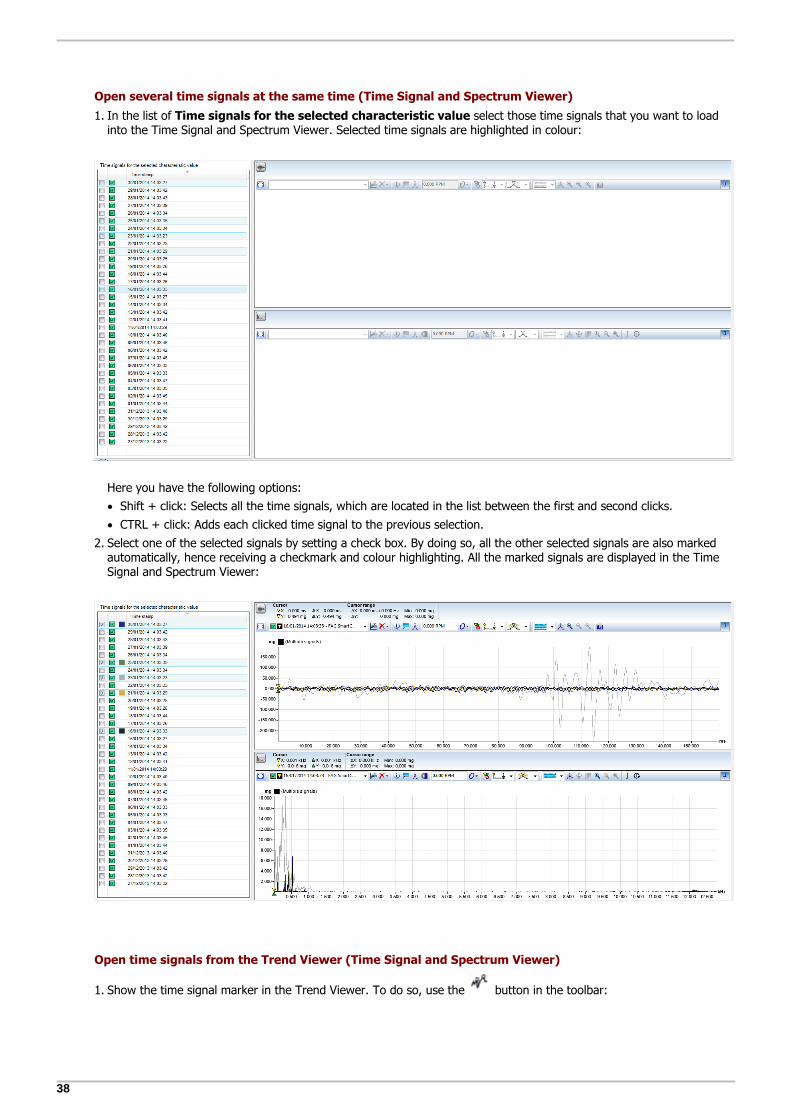
Open several time signals at the same time (Time Signal and Spectrum Viewer)
1. In the list of Time signals for the selected characteristic value select those time signals that you want to loadinto the Time Signal and Spectrum Viewer. Selected time signals are highlighted in colour:
Here you have the following options:
Shift + click: Selects all the time signals, which are located in the list between the first and second clicks.
CTRL + click: Adds each clicked time signal to the previous selection.
2. Select one of the selected signals by setting a check box. By doing so, all the other selected signals are also markedautomatically, hence receiving a checkmark and colour highlighting. All the marked signals are displayed in the TimeSignal and Spectrum Viewer:
Open time signals from the Trend Viewer (Time Signal and Spectrum Viewer)
1. Show the time signal marker in the Trend Viewer. To do so, use the button in the toolbar:
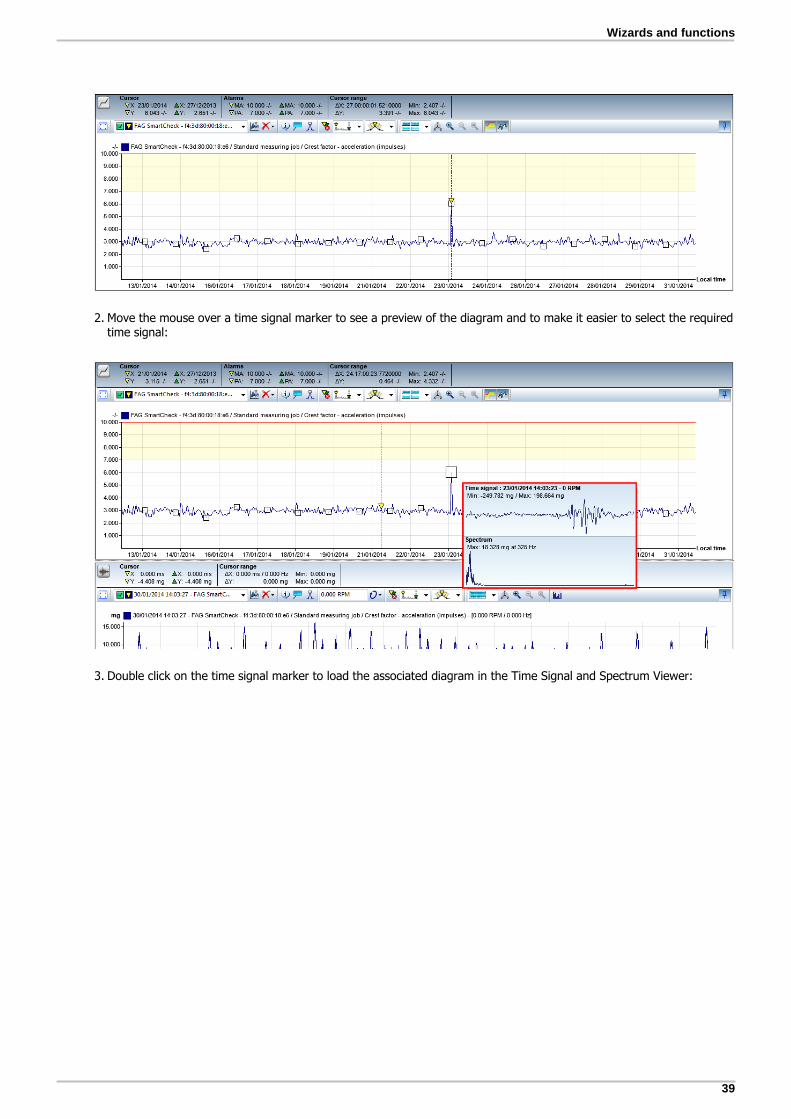
39
Wizards and functions
2. Move the mouse over a time signal marker to see a preview of the diagram and to make it easier to select the requiredtime signal:
3. Double click on the time signal marker to load the associated diagram in the Time Signal and Spectrum Viewer:

40
When you double-click to open a time signal, it may take a while depending on the length ofthe time signal: the more measurement values a time signal contains, the longer it will take tocalculate the spectrum.
The default symbol for the time signal marker is a box; however you can define a differentsymbol under Settings > Symbol in the context menu for the Viewer.
Open spectrum from the Time Signal Viewer (Spectrum Viewer)
You can create a spectrum in the Spectrum Viewer directly from within the Time Signal Viewer and specify your own
settings, e.g. for windowing. To do so, use the function Calculate spectrum in the toolbar for the TimeSignal Viewer.
Remove data from the viewers
You have several options to remove data from the viewers:
You can remove the marking for a characteristic value in the device overview. As a result, the associated trend will beremoved from the Trend Viewer.
75
66
41
Wizards and functions
You can remove the marking for a time signal in the list of time signals for the selected characteristic value. As aresult, the associated signals will be removed from the Time Signal Viewer and the Spectrum Viewer.
In the toolbar for each viewer, using the button you will find functions which you can use to remove certainsignals from the diagram. More details on this can be found in the Viewer and diagram section.
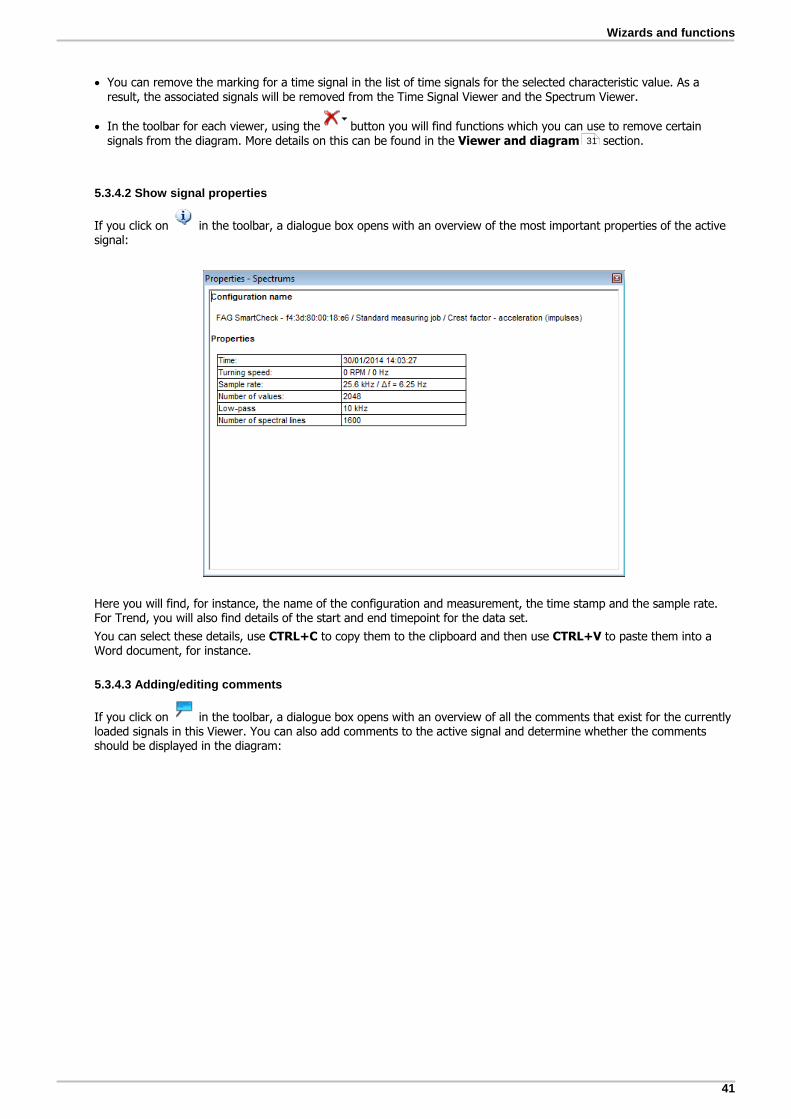
5.3.4.2 Show signal properties
If you click on in the toolbar, a dialogue box opens with an overview of the most important properties of the activesignal:
Here you will find, for instance, the name of the configuration and measurement, the time stamp and the sample rate. For Trend, you will also find details of the start and end timepoint for the data set.
You can select these details, use CTRL+C to copy them to the clipboard and then use CTRL+V to paste them into aWord document, for instance.
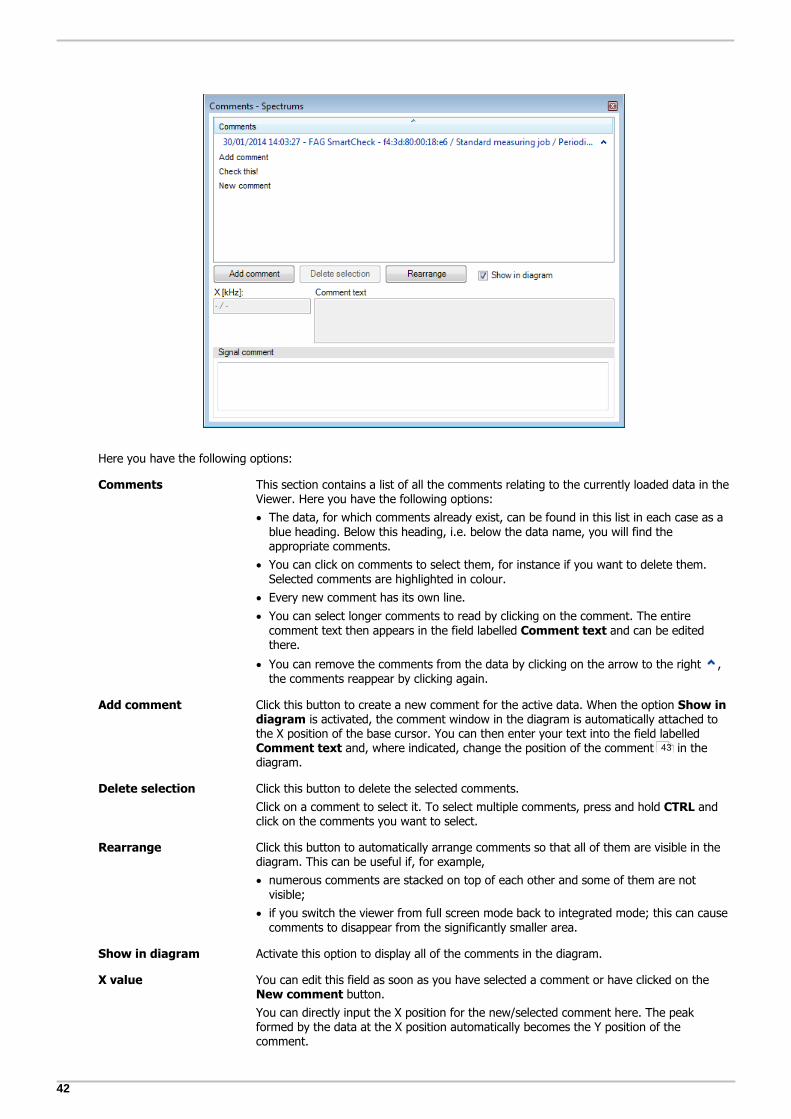
5.3.4.3 Adding/editing comments
If you click on in the toolbar, a dialogue box opens with an overview of all the comments that exist for the currentlyloaded signals in this Viewer. You can also add comments to the active signal and determine whether the commentsshould be displayed in the diagram:
31
42
Here you have the following options:
Comments This section contains a list of all the comments relating to the currently loaded data in theViewer. Here you have the following options:
The data, for which comments already exist, can be found in this list in each case as ablue heading. Below this heading, i.e. below the data name, you will find theappropriate comments.
You can click on comments to select them, for instance if you want to delete them.Selected comments are highlighted in colour.
Every new comment has its own line.
You can select longer comments to read by clicking on the comment. The entirecomment text then appears in the field labelled Comment text and can be editedthere.
You can remove the comments from the data by clicking on the arrow to the right ,the comments reappear by clicking again.
Add comment Click this button to create a new comment for the active data. When the option Show indiagram is activated, the comment window in the diagram is automatically attached tothe X position of the base cursor. You can then enter your text into the field labelled Comment text and, where indicated, change the position of the comment in thediagram.
Delete selection Click this button to delete the selected comments.
Click on a comment to select it. To select multiple comments, press and hold CTRL andclick on the comments you want to select.
Rearrange Click this button to automatically arrange comments so that all of them are visible in thediagram. This can be useful if, for example,
numerous comments are stacked on top of each other and some of them are notvisible;
if you switch the viewer from full screen mode back to integrated mode; this can causecomments to disappear from the significantly smaller area.
Show in diagram Activate this option to display all of the comments in the diagram.
X value You can edit this field as soon as you have selected a comment or have clicked on the New comment button.
You can directly input the X position for the new/selected comment here. The peakformed by the data at the X position automatically becomes the Y position of thecomment.
43
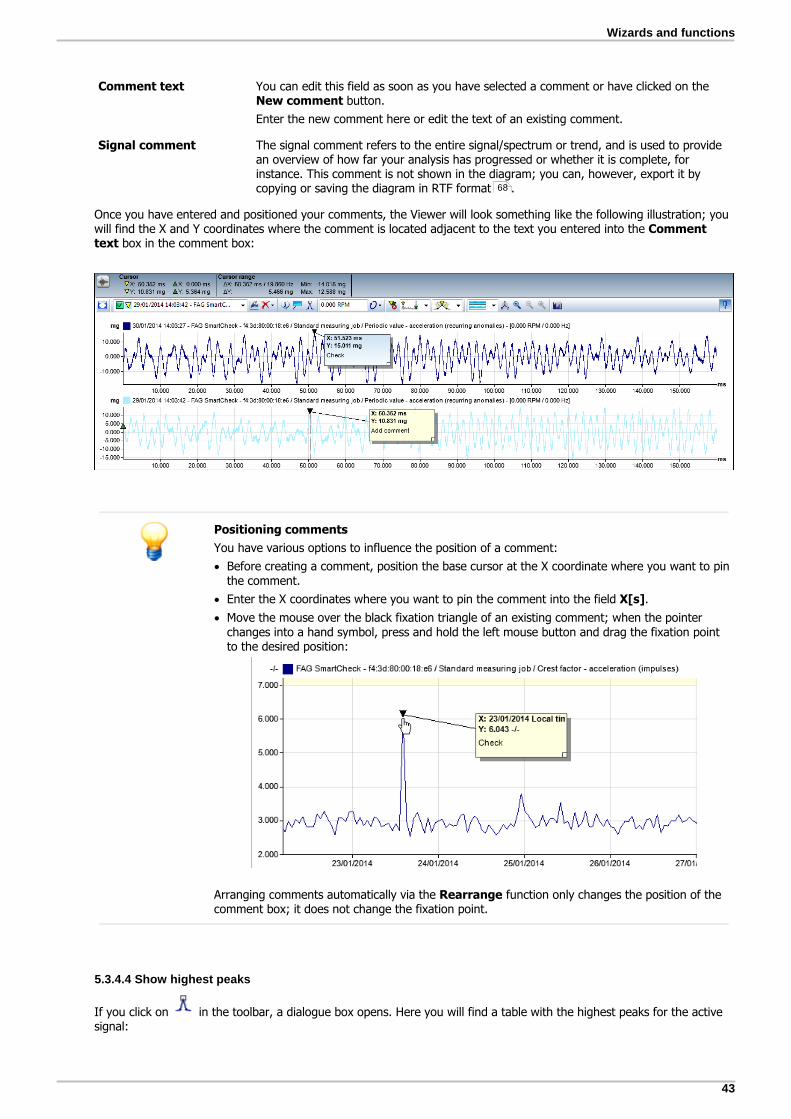
43
Wizards and functions
Comment text You can edit this field as soon as you have selected a comment or have clicked on the New comment button.
Enter the new comment here or edit the text of an existing comment.
Signal comment The signal comment refers to the entire signal/spectrum or trend, and is used to providean overview of how far your analysis has progressed or whether it is complete, forinstance. This comment is not shown in the diagram; you can, however, export it by copying or saving the diagram in RTF format .
Once you have entered and positioned your comments, the Viewer will look something like the following illustration; youwill find the X and Y coordinates where the comment is located adjacent to the text you entered into the Commenttext box in the comment box:
Positioning comments
You have various options to influence the position of a comment:
Before creating a comment, position the base cursor at the X coordinate where you want to pinthe comment.
Enter the X coordinates where you want to pin the comment into the field X[s].
Move the mouse over the black fixation triangle of an existing comment; when the pointerchanges into a hand symbol, press and hold the left mouse button and drag the fixation pointto the desired position:
Arranging comments automatically via the Rearrange function only changes the position of thecomment box; it does not change the fixation point.
5.3.4.4 Show highest peaks
If you click on in the toolbar, a dialogue box opens. Here you will find a table with the highest peaks for the activesignal:
68

44
Here you have the following options:
Highest peaks: Determine how many peaks in total should be calculated.
Mark peaks: Activate this option to show the peaks in the diagram. If you do not activate this checkbox, the peakswill only be listed in tabular form.
Determine peaks from all visible signals: Activate this option to determine the peaks not only for the activesignal/spectrum, but for all of the signals/spectrums that are marked in the Time signals for the selectedcharacteristic value list. The peaks are then listed in tables; the name of the corresponding signal or spectrumis shown in the header of each table. If you have activated the Mark peaks option, you will also see all of the peaksdisplayed in the diagram.
You can select the table(s), use CTRL+C to copy them to the clipboard and then use CTRL+V to paste them into aWord document, for instance.
You can define the symbol by which the peaks are denoted in the diagram under Symbolsettings . To do so, open the context menu for the Viewer and select the Settingscommand. In the Settings dialogue box, under Cursor you can use the Other option tochange the shape and colour. Whatever you create here will appear as the symbol for peaksin the diagram.
5.3.4.5 Show frequency bands (Spectrum only)
The function Show frequency bands is only available in the toolbar for the spectrum viewer. It opens a dialoguebox, in which you will find information about frequency bands and bearings of the loaded spectrums:
26
75 21
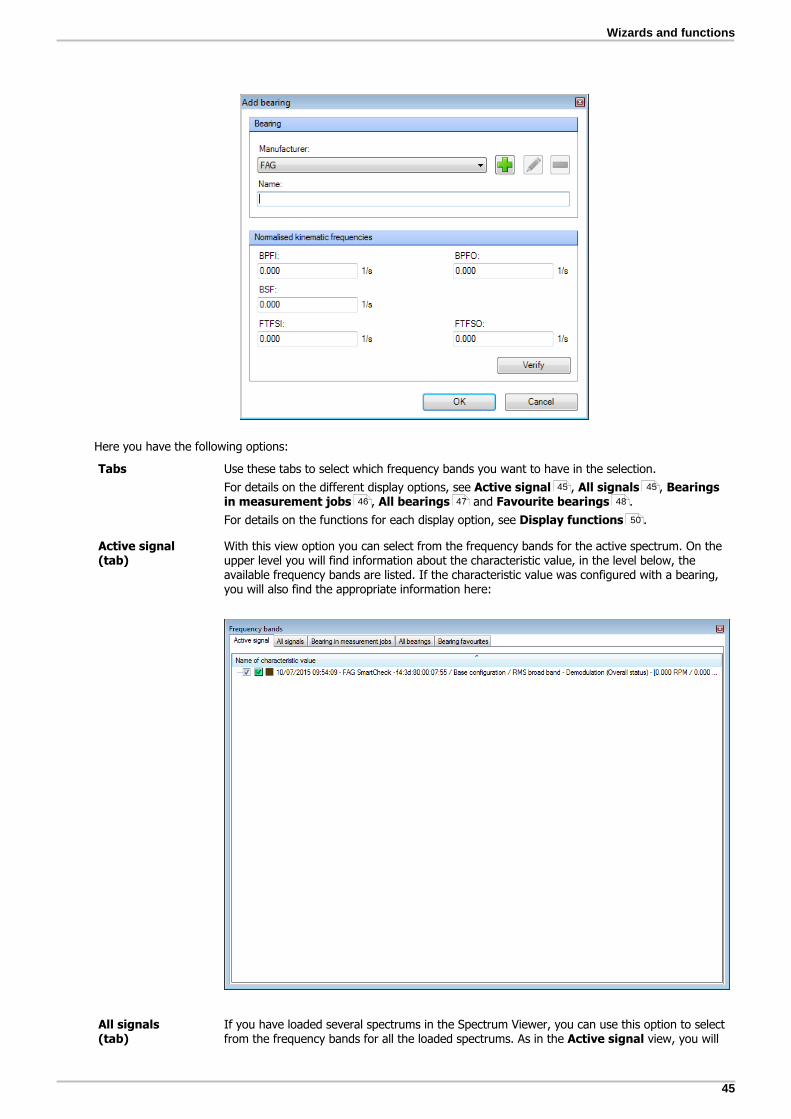
45
Wizards and functions
Here you have the following options:
Tabs Use these tabs to select which frequency bands you want to have in the selection.
For details on the different display options, see Active signal , All signals , Bearingsin measurement jobs , All bearings and Favourite bearings .
For details on the functions for each display option, see Display functions .
Active signal(tab)
With this view option you can select from the frequency bands for the active spectrum. On theupper level you will find information about the characteristic value, in the level below, theavailable frequency bands are listed. If the characteristic value was configured with a bearing,you will also find the appropriate information here:
All signals(tab)
If you have loaded several spectrums in the Spectrum Viewer, you can use this option to selectfrom the frequency bands for all the loaded spectrums. As in the Active signal view, you will
45 45
46 47 48
50

46
see the characteristic values on the upper level, and on the level below you will find theappropriate available frequency bands. You will also find bearing information here, if one of thecharacteristic values was configured with a bearing:
In the Active signal and All signals tabs, all characteristic values calculated fromthe selected signal are displayed. This also applies if you have opened the signal for aparticular characteristic value.
For example, if you open the trend for one of the envelope characteristic values (e.g.inner ring) for a bearing, then all 3 envelope characteristic values are displayed here,i.e. roller element, inner ring, and outer ring:
Bearings inmeasurement jobs(tab)
This view option is independent from the currently active and loaded spectrums. It is alwaysavailable if one of the loaded FAG SmartCheck devices was configured with a bearing from thebearing database.
If the speed is known, you have the following additional option: The standardised cyclingfrequencies of the bearing are multiplied by the speed frequency. This results in cyclingfrequencies in Hertz, which are displayed in the spectrum.
If you select this option and bearings from the database have been configured, you will see the
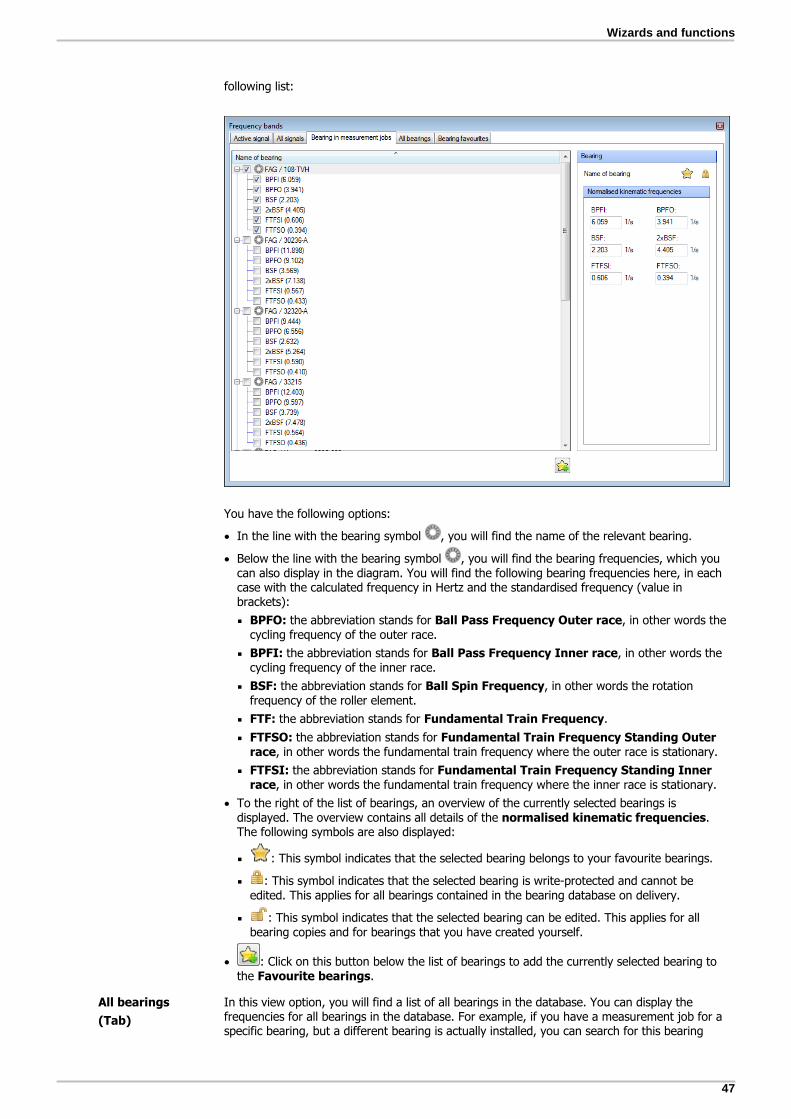
47
Wizards and functions
following list:
You have the following options:
In the line with the bearing symbol , you will find the name of the relevant bearing.
Below the line with the bearing symbol , you will find the bearing frequencies, which youcan also display in the diagram. You will find the following bearing frequencies here, in eachcase with the calculated frequency in Hertz and the standardised frequency (value inbrackets):
BPFO: the abbreviation stands for Ball Pass Frequency Outer race, in other words thecycling frequency of the outer race.
BPFI: the abbreviation stands for Ball Pass Frequency Inner race, in other words thecycling frequency of the inner race.
BSF: the abbreviation stands for Ball Spin Frequency, in other words the rotationfrequency of the roller element.
FTF: the abbreviation stands for Fundamental Train Frequency.
FTFSO: the abbreviation stands for Fundamental Train Frequency Standing Outerrace, in other words the fundamental train frequency where the outer race is stationary.
FTFSI: the abbreviation stands for Fundamental Train Frequency Standing Innerrace, in other words the fundamental train frequency where the inner race is stationary.
To the right of the list of bearings, an overview of the currently selected bearings isdisplayed. The overview contains all details of the normalised kinematic frequencies.The following symbols are also displayed:
: This symbol indicates that the selected bearing belongs to your favourite bearings.
: This symbol indicates that the selected bearing is write-protected and cannot beedited. This applies for all bearings contained in the bearing database on delivery.
: This symbol indicates that the selected bearing can be edited. This applies for allbearing copies and for bearings that you have created yourself.
: Click on this button below the list of bearings to add the currently selected bearing tothe Favourite bearings.
All bearings
(Tab)
In this view option, you will find a list of all bearings in the database. You can display thefrequencies for all bearings in the database. For example, if you have a measurement job for aspecific bearing, but a different bearing is actually installed, you can search for this bearing

48
here and select it.
You have the following options:
Manufacturer: Select the manufacturer of the required bearing to filter the list of allbearings by manufacturer.
Search criteria for bearings: You can search for bearings by name in the database. To doso, enter the name in this field. Here you have the following options:
Search criteria that you have previously used are available in the selection box.
The placeholder * stands for any character string.
The placeholder ? stands for any single character.
Upper/lower case must be observed.
: Click on this button or use the input key to filter by Manufacturer and Searchcriteria for warehouse .
As with the Bearings in measurement jobs view, the list of bearings contains the namesof the relevant bearings on the top level, and the level below shows the bearing frequenciesthat you can display in the diagram. Select the frequencies that you want to display with acheck box.
: Click on this button below the list of bearings to add the currently selected bearing tothe favourite bearings.
As with the view Bearings in measurement jobs , to the right of the list, an overview ofcurrently selected bearings is displayed.
Use the buttons below the bearing overview for your bearing management .
Bearing favourites
(Tab)In this view option, you can see all bearings that you have marked as favourites using the button. This list provides you with quick access to frequently used bearings.
44
49

49
Wizards and functions
You have the following options:
Display bearing frequencies: As with the Bearings in measurement jobs view, thislist contains the names of the relevant bearings on the top level, and the level below showsthe bearing frequencies that you can display in the diagram. Select the frequencies that youwant to display with a check box.
: Click on this button below the list of bearings to delete the currently selected bearingfrom the list of favourites.
As with the view Bearings in measurement jobs , to the right of the list, an overview ofcurrently selected bearings is displayed.
Use the buttons below the bearing overview for your bearing management .
Bearingmanagement
On the All bearings and Favourite bearings tabs, the functions that you can use to manageyour bearings are shown below the bearing overview:
Add bearing
Click on to add a new bearing for analysis in the Viewer software. The Add bearingdialogue is displayed:
47
49

50
In this dialog, enter the Manufacturer and Name of the bearing. You can change the list ofmanufacturers with the following buttons:
: Click on this button to add a new manufacturer name to the list.
: Click on this button to edit the currently selected manufacturer name. You can onlyedit manufacturer names that you have added yourself, and for which you have not yetcreated a bearing.
: Click on this button to delete the selected manufacturer name. You can only deletemanufacturer names that you have added yourself and for which you have not yet createdany bearings.
The specifications for the normalised kinematic frequencies are important for the correctcalculation of bearing damage frequencies and thus for the reliable monitoring of thiscomponent. You can find the corresponding information on BPFI, BPFO, BSF and FTF in thetechnical data of the bearing. Click on the Check button to check your specifications againstthe minimum requirements.
Copy bearing
Click on to create a copy of the selected bearing. You can edit and delete copies ofbearings.
Edit bearing
Click on to edit the currently selected bearing. The Edit bearing dialogue is displayed. Thesame options are available here as in the Add bearing dialogue.
Delete bearing
Click on to delete the selected bearing. You can only delete bearings that you have addedor created as a copy yourself.
Display functions Irrespective of the current display option, you have the following editing options:
Sort list:
Click on the column header of the list, for example, Name of bearing to reverse the sortorder.
Show preview:

51
Wizards and functions
If you move the mouse over an entry in the list, the associated frequency band or the bearingfrequency is displayed as a preview in the diagram.
Show frequency band/bearing frequency:
Activate a characteristic value or a bearing, in order to show all the associated frequencybands or bearing frequencies.
You can also add or remove a checkmark against individual frequency bands or bearingfrequencies to show them or remove them again.
Frequency bands or bearing frequencies are highlighted in colour in the diagram:
A maximum of 10 bearing frequencies can be displayed.
If you remove a device with bearing configuration in the Viewer software from the deviceoverview, the associated bearing information remains in the software. It is therefore possiblethat bearing frequencies are displayed for a device that is no longer loaded.
Expert knowledge is required to use the Bearings view correctly.
5.3.4.6 Set speed/frequency
If you click in the toolbar, a menu opens with the following options:
Apply current value to selected signals: The speed value of the active signal (identified with yellow triangle) isapplied to all the signals currently loaded in the Viewer.
Reset value: This command resets the speed/frequency for the active signal to the original value.
Reset value for all signals: This command resets the speed/frequency for all signals loaded in the Viewer to theoriginal value.
RPM: Activate this option if you want to specify the speed in rpm.
Hz: Activate this option if you want to specify the rotational frequency in Hz.
5.3.4.7 Cursor setting
If you click on in the toolbar, a menu opens, in which you can selected the required cursor function . Inaddition, you can open the Cursor settings dialogue box from this menu. The Cursor settings dialogue box has manyoptions designed to help you use the base and measure cursors and the associated cursor functions .
Use the base cursor to define the base value for your analysis. In the Spectrum Viewer, for instance, this would be thebase frequency you want to determine the harmonics for; you can set the base cursor to a specific time point in the timesignal and apply the desired cursor function from then on.
The measure cursor is used together with the base cursor to measure and define areas in which the specific cursorfunctions are then carried out.
The dialogue box is split into two areas:
In the upper section you will find general settings, which apply for each selected cursor function.
In the lower section Select cursor function you will find the tabs for the individual cursor functions and can makeadditional settings for each function. By default, you will see the cursor function that is currently selected here:
52
52
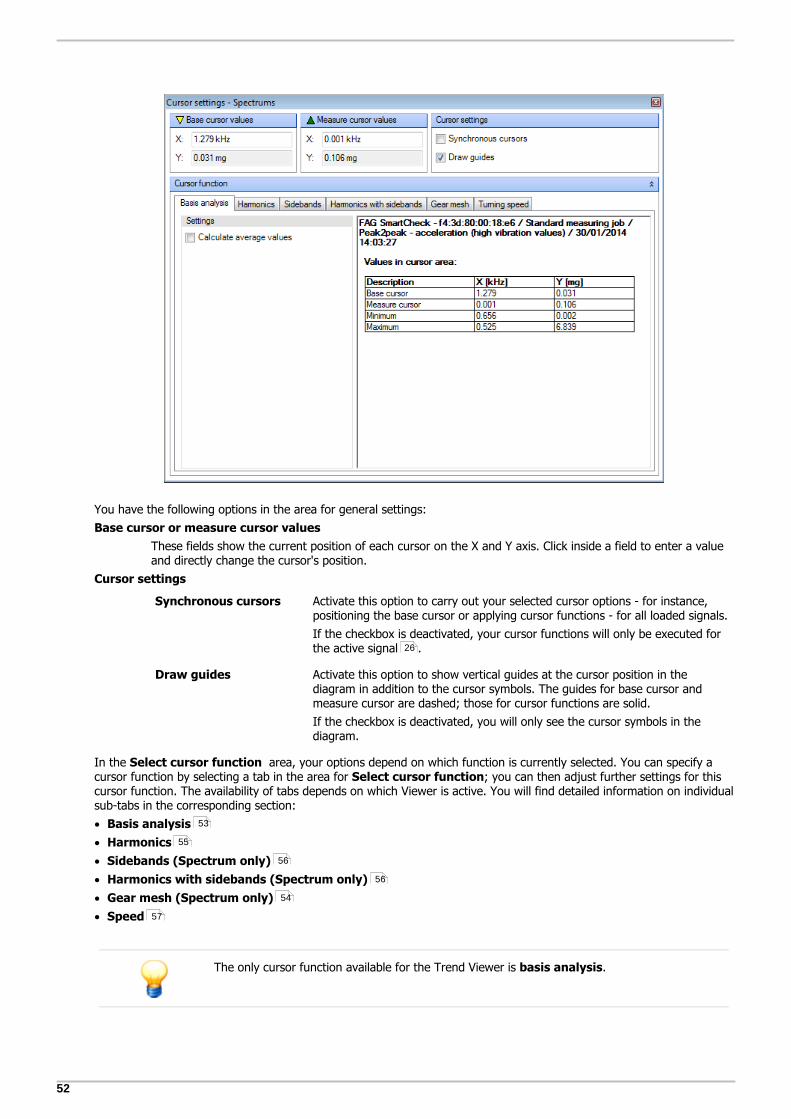
52
You have the following options in the area for general settings:
Base cursor or measure cursor values
These fields show the current position of each cursor on the X and Y axis. Click inside a field to enter a valueand directly change the cursor's position.
Cursor settings
Synchronous cursors Activate this option to carry out your selected cursor options - for instance,positioning the base cursor or applying cursor functions - for all loaded signals.
If the checkbox is deactivated, your cursor functions will only be executed forthe active signal .
Draw guides Activate this option to show vertical guides at the cursor position in thediagram in addition to the cursor symbols. The guides for base cursor andmeasure cursor are dashed; those for cursor functions are solid.
If the checkbox is deactivated, you will only see the cursor symbols in thediagram.
In the Select cursor function area, your options depend on which function is currently selected. You can specify acursor function by selecting a tab in the area for Select cursor function; you can then adjust further settings for thiscursor function. The availability of tabs depends on which Viewer is active. You will find detailed information on individualsub-tabs in the corresponding section:
Basis analysis
Harmonics
Sidebands (Spectrum only)
Harmonics with sidebands (Spectrum only)
Gear mesh (Spectrum only)
Speed
The only cursor function available for the Trend Viewer is basis analysis.
26
53
55
56
56
54
57

53
Wizards and functions
5.3.4.7.1 Basis analysis
The basis analysis is the basic cursor function set by default when the program starts. The scope of this function allowsyou to view the position values for the base cursor and measure cursor , as well as the minimum and maximummeasurement values of the difference range. In the Trend Viewer, for instance, the delta of the Y values and the scatterof minimum and maximum values are used as an initial interference diagnosis.
You can also activate the calculation of average values; this is of particular interest with regard to the manual calculationof characteristic values in the Spectrum Viewer.
Basis analysis tab
You will find the Basis analysis tab in the Cursor settings dialogue box under Select cursor function:
Here you have the following options:
Calculate averagevalues
If you activate the Calculate average valuesoption, the table will be adjustedautomatically and the values calculated for the average value, RMS (root mean square) and RMS (no offset) will be added to the table:
This option is deactivated by default, as calculating average values can slow down thedisplay in conjunction with extensive measurements.
Table with values You can find all the results of the basis analysis in the table. They include:
Name of the configuration and signal
Position value of the base cursor
Position value of the measure cursor
51 51
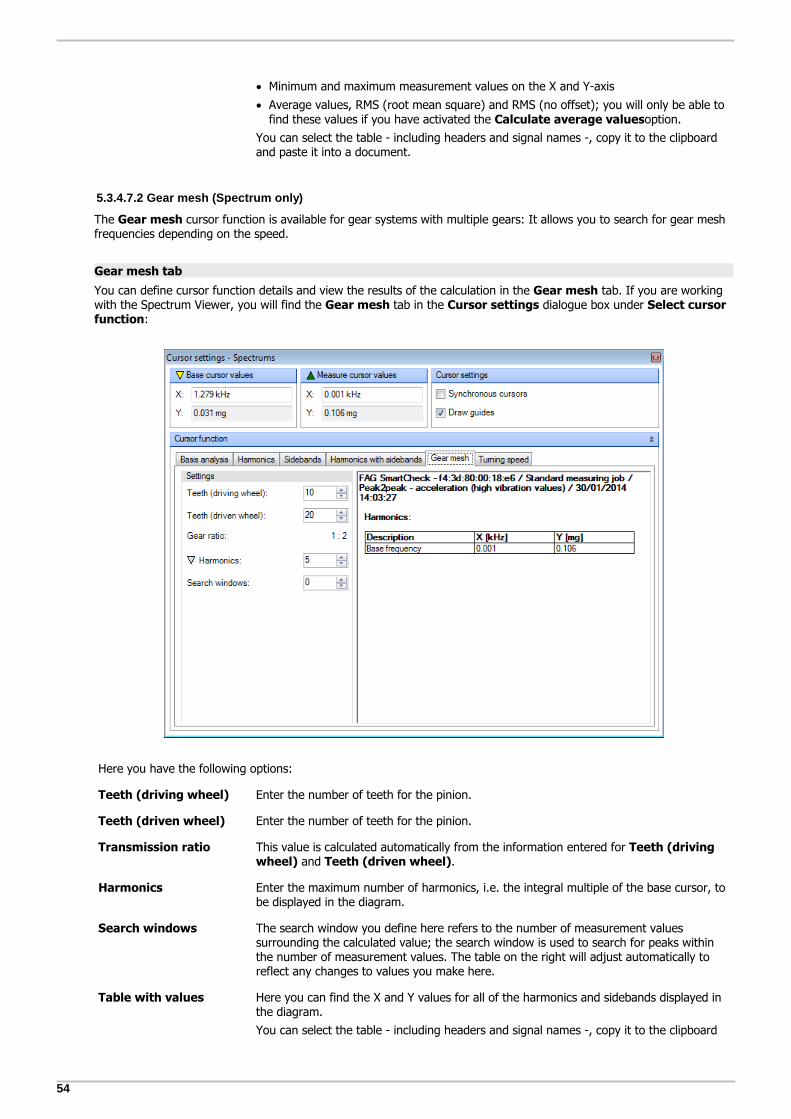
54
Minimum and maximum measurement values on the X and Y-axis
Average values, RMS (root mean square) and RMS (no offset); you will only be able tofind these values if you have activated the Calculate average valuesoption.
You can select the table - including headers and signal names -, copy it to the clipboardand paste it into a document.
5.3.4.7.2 Gear mesh (Spectrum only)
The Gear mesh cursor function is available for gear systems with multiple gears: It allows you to search for gear meshfrequencies depending on the speed.
Gear mesh tab
You can define cursor function details and view the results of the calculation in the Gear mesh tab. If you are workingwith the Spectrum Viewer, you will find the Gear mesh tab in the Cursor settings dialogue box under Select cursorfunction:
Here you have the following options:
Teeth (driving wheel) Enter the number of teeth for the pinion.
Teeth (driven wheel) Enter the number of teeth for the pinion.
Transmission ratio This value is calculated automatically from the information entered for Teeth (drivingwheel) and Teeth (driven wheel).
Harmonics Enter the maximum number of harmonics, i.e. the integral multiple of the base cursor, tobe displayed in the diagram.
Search windows The search window you define here refers to the number of measurement valuessurrounding the calculated value; the search window is used to search for peaks withinthe number of measurement values. The table on the right will adjust automatically toreflect any changes to values you make here.
Table with values Here you can find the X and Y values for all of the harmonics and sidebands displayed inthe diagram.
You can select the table - including headers and signal names -, copy it to the clipboard
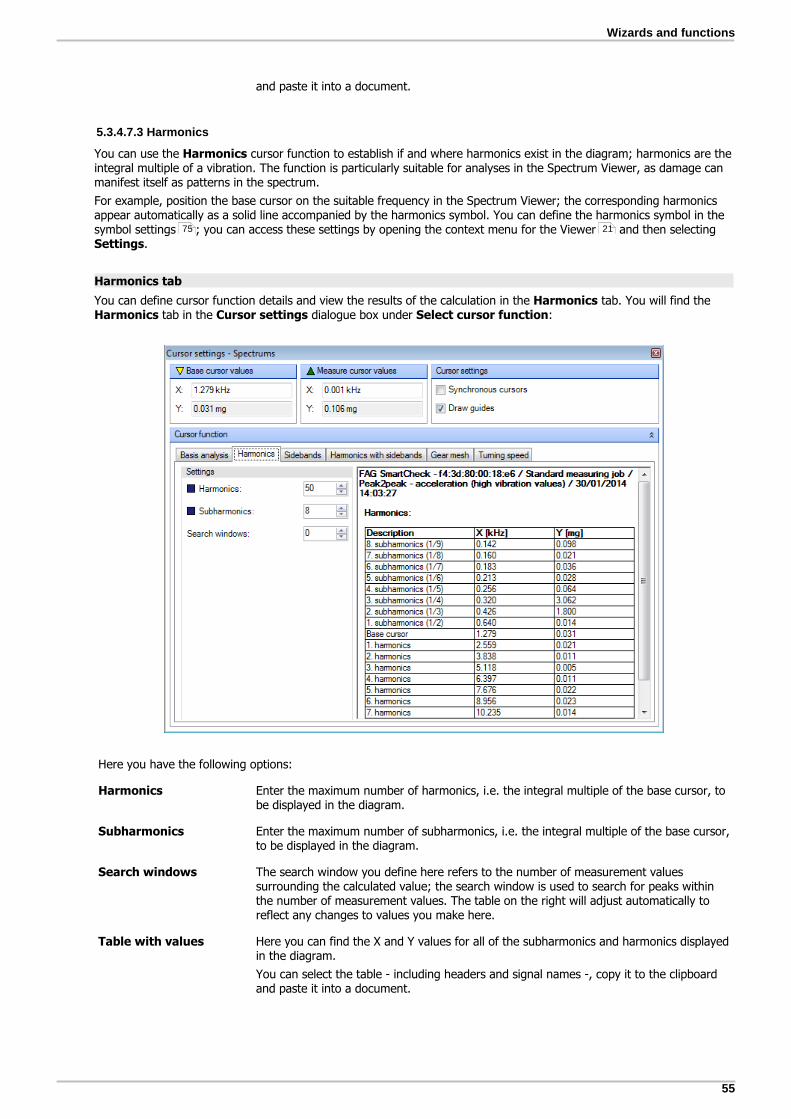
55
Wizards and functions
and paste it into a document.
5.3.4.7.3 Harmonics
You can use the Harmonics cursor function to establish if and where harmonics exist in the diagram; harmonics are theintegral multiple of a vibration. The function is particularly suitable for analyses in the Spectrum Viewer, as damage canmanifest itself as patterns in the spectrum.
For example, position the base cursor on the suitable frequency in the Spectrum Viewer; the corresponding harmonicsappear automatically as a solid line accompanied by the harmonics symbol. You can define the harmonics symbol in the symbol settings ; you can access these settings by opening the context menu for the Viewer and then selectingSettings.
Harmonics tab
You can define cursor function details and view the results of the calculation in the Harmonics tab. You will find theHarmonics tab in the Cursor settings dialogue box under Select cursor function:
Here you have the following options:
Harmonics Enter the maximum number of harmonics, i.e. the integral multiple of the base cursor, tobe displayed in the diagram.
Subharmonics Enter the maximum number of subharmonics, i.e. the integral multiple of the base cursor,to be displayed in the diagram.
Search windows The search window you define here refers to the number of measurement valuessurrounding the calculated value; the search window is used to search for peaks withinthe number of measurement values. The table on the right will adjust automatically toreflect any changes to values you make here.
Table with values Here you can find the X and Y values for all of the subharmonics and harmonics displayedin the diagram.
You can select the table - including headers and signal names -, copy it to the clipboardand paste it into a document.
75 21

56
5.3.4.7.4 Sidebands (Spectrum only)
You can use the Sidebands cursor function to ascertain other measurement values in sidebands. Sidebands are used, inparticular, to detect any damage to the outer race.
Set the base cursor at the desired position in the diagram; the corresponding sidebands are automatically displayed assideband symbols. You can define the sideband symbol in the symbol settings ; you can access these settings byopening the context menu for the Viewer and then selecting Settings.
Sidebands tab
You can define cursor function details and view the results of the calculation in the Sidebands tab. If you are workingwith the Spectrum Viewer, you will find the Sidebands tab in the Cursor settings dialogue box under Select cursorfunction:
Here you have the following options:
Sidebands Determine the number of sidebands to be calculated for the current base cursor position.The table on the right will adjust automatically to reflect any changes to values you makehere.
Search windows The search window you define here refers to the number of measurement valuessurrounding the calculated value; the search window is used to search for peaks withinthe number of measurement values. The table on the right will adjust automatically toreflect any changes to values you make here.
Table with values Here you can find the X and Y values for all of the sidebands displayed in the diagram.
You can select the table - including headers and signal names -, copy it to the clipboardand paste it into a document.
5.3.4.7.5 Harmonics with sidebands (Spectrum only)
The cursor function Harmonics with sidebands combines the two cursor functions Harmonics and Sidebands. Youcan therefore ascertain the harmonics and sidebands simultaneously for the position of the base cursor.
To do so, position the base cursor at the desired location in the diagram; the corresponding harmonics and sidebandsare automatically displayed as a solid line and appear together with the corresponding cursor symbols. You can definethe cursor symbols in symbol settings ; to access these settings, open the context menu for the Viewer and selectSettings.
75
21
75 21

57
Wizards and functions
Harmonics with sidebands tab
You can define cursor function details and view the results of the calculation in the Harmonics with sidebands tab. Ifyou are working with the Spectrum Viewer, you will find the Harmonics with sidebands tab in the Cursor settingsdialogue box under Select cursor function:
Here you have the following options:
Harmonics Enter the maximum number of harmonics, i.e. the integral multiple of the base cursor, tobe displayed in the diagram.
Sidebands Determine the number of sidebands to be calculated for the current base cursor position.The table on the right will adjust automatically to reflect any changes to values you makehere.
Search windows The search window you define here refers to the number of measurement valuessurrounding the calculated value; the search window is used to search for peaks withinthe number of measurement values. The table on the right will adjust automatically toreflect any changes to values you make here.
Table with values Here you can find the X and Y values for all of the harmonics and sidebands displayed inthe diagram.
You can select the table - including headers and signal names -, copy it to the clipboardand paste it into a document.
5.3.4.7.6 Speed
You can establish harmonics depending on speed using the cursor function Speed. The speed is automatically used as abasis when working with the Spectrum Viewer. When working with the Time Signal Viewer, you will need to select aspeed range using the base and measure cursors.
Speed tab
You can define cursor function details and view the results of the calculation in the Speed tab. You will find the Speedtab in the Cursor settings dialogue box under Select cursor function:

58
Here you have the following options:
Harmonics Enter the maximum number of harmonics, i.e. the integral multiple of the base cursor, to bedisplayed in the diagram.
Searchwindows
The search window you define here refers to the number of measurement values surrounding thecalculated value; the search window is used to search for peaks within the number of measurementvalues. The table on the right will adjust automatically to reflect any changes to values you makehere.
Table withvalues
Here you can find the X and Y values for all of the harmonics displayed in the diagram.
You can select the table - including headers and signal names -, copy it to the clipboard and paste itinto a document.
5.3.4.8 Position cursor
If you click on in the toolbar, a list will open, from which you can select a positioning option for the cursor.These options assist you in positioning the base cursor in the diagram precisely. Here you have the following options:
Free: The cursor position is determined based on pixel values and is freely selectable, even between twomeasurement values.
Next sample: The base cursor is set to the next measurement value.
Nearest peak: The base cursor is set to the nearest peak.
Tenths: The area between two measurement values on the X-axis is divided into tenths; the base cursor is set to thenearest tenth.
Hundredths: The area between two measurement values on the X-axis is divided into hundredths; the base cursor isset to the nearest hundredth.
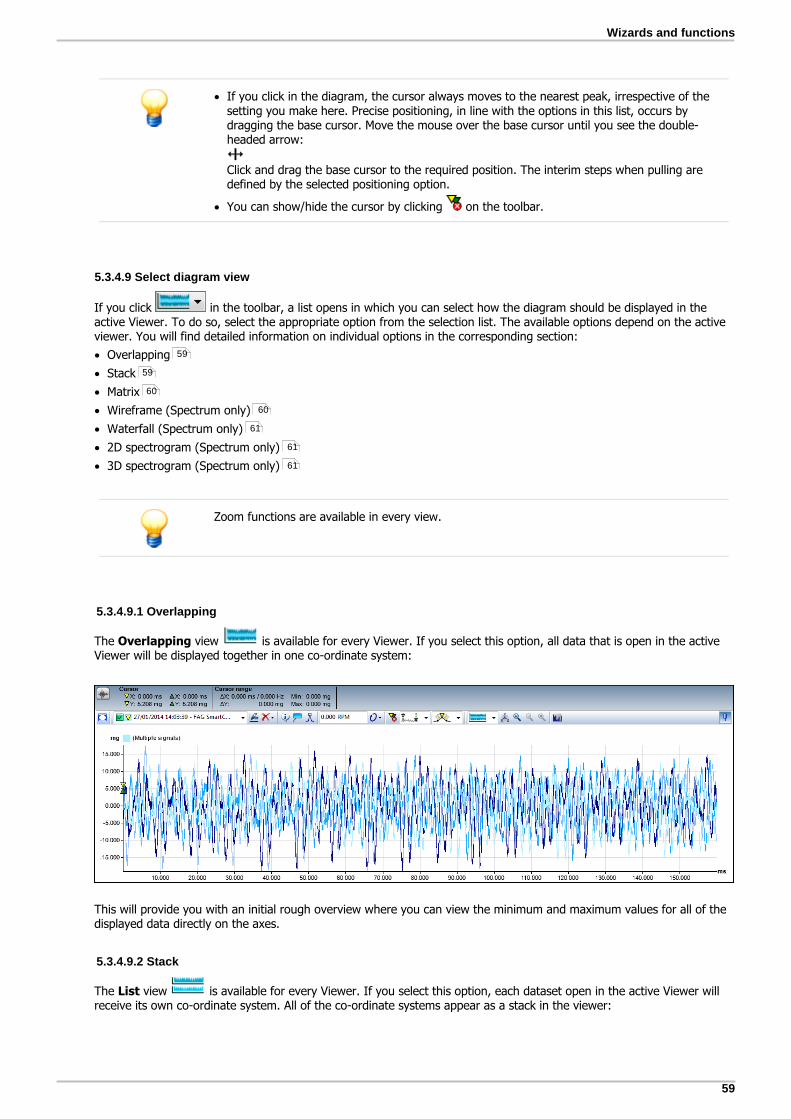
59
Wizards and functions
If you click in the diagram, the cursor always moves to the nearest peak, irrespective of thesetting you make here. Precise positioning, in line with the options in this list, occurs bydragging the base cursor. Move the mouse over the base cursor until you see the double-headed arrow:
Click and drag the base cursor to the required position. The interim steps when pulling aredefined by the selected positioning option.
You can show/hide the cursor by clicking on the toolbar.
5.3.4.9 Select diagram view
If you click in the toolbar, a list opens in which you can select how the diagram should be displayed in theactive Viewer. To do so, select the appropriate option from the selection list. The available options depend on the activeviewer. You will find detailed information on individual options in the corresponding section:
Overlapping
Stack
Matrix
Wireframe (Spectrum only)
Waterfall (Spectrum only)
2D spectrogram (Spectrum only)
3D spectrogram (Spectrum only)
Zoom functions are available in every view.
5.3.4.9.1 Overlapping
The Overlapping view is available for every Viewer. If you select this option, all data that is open in the activeViewer will be displayed together in one co-ordinate system:
This will provide you with an initial rough overview where you can view the minimum and maximum values for all of thedisplayed data directly on the axes.
5.3.4.9.2 Stack
The List view is available for every Viewer. If you select this option, each dataset open in the active Viewer willreceive its own co-ordinate system. All of the co-ordinate systems appear as a stack in the viewer:
59
59
60
60
61
61
61

60
5.3.4.9.3 Matrix
The Matrix view is available for every Viewer. If you select this option, each dataset open in the Viewer willreceive its own co-ordinate system. Up to three co-ordinate systems are displayed as a stack; four or more are displayedin the viewer as a multi-column matrix:
5.3.4.9.4 Wireframe (Spectrum only)
The Wireframe view is only available in the Spectrum Viewer. If you select this option, all of the spectrums thatare open in the active Viewer will be displayed on one wireframe:
You can amend the view options for your application by modifying the camera settings and spectrogram settings .63 63

61
Wizards and functions
5.3.4.9.5 Waterfall (Spectrum only)
The Waterfall view is only available in the Spectrum Viewer. If you select and set this option, all of thespectrums that are open in the active Viewer will be displayed as a waterfall:
You can amend the view options for your application by modifying the camera settings and spectrogram settings .
5.3.4.9.6 2D spectrogram (Spectrum only)
The 2D spectrogram view is only available in the Spectrum Viewer. If you select and set this option, all of thespectrums that are open in the active Viewer will be displayed as a two-dimensional spectrogram:
You can amend the view options for your application by modifying the camera settings and spectrogram settings .
5.3.4.9.7 3D spectrogram (Spectrum only)
The 3D spectrogram view is only available in the Spectrum Viewer. If you select this option, all of thespectrums that are open in the active Viewer will be displayed as a three-dimensional spectrogram:
63 63
63 63

62
You can amend the view options for your application by modifying the camera settings and spectrogram settings .
5.3.4.10 Edit axes settings
If you click in the toolbar, a dialogue box opens in which you can specify details for the X and Y axes. Your settingsalways apply to the axes of the active viewer.
You can specify and change standard settings, e.g. in the Unit or Scaling area under Viewer settings ; to do so,open the context menu for the Viewer and go to Settings.
You can specify the following settings for the axes:
Unit Here you can determine the unit used to display the axis. You have the following options:
Auto: Activate this field to prompt the FAG SmartUtility Viewer software to use the unit best suitedto displaying the current signal types. The FAG SmartUtility Viewer software automatically decideswhich unit prefix provides the best, i.e. the shortest possible, representation in the diagram.
Selection list: You can choose a unit for the axis display from the list. The availability of unitsdepends on the unit profile . To change or view unit profiles, open the context menu for theViewer and select the Settings command.
63 63
73
21
76
21
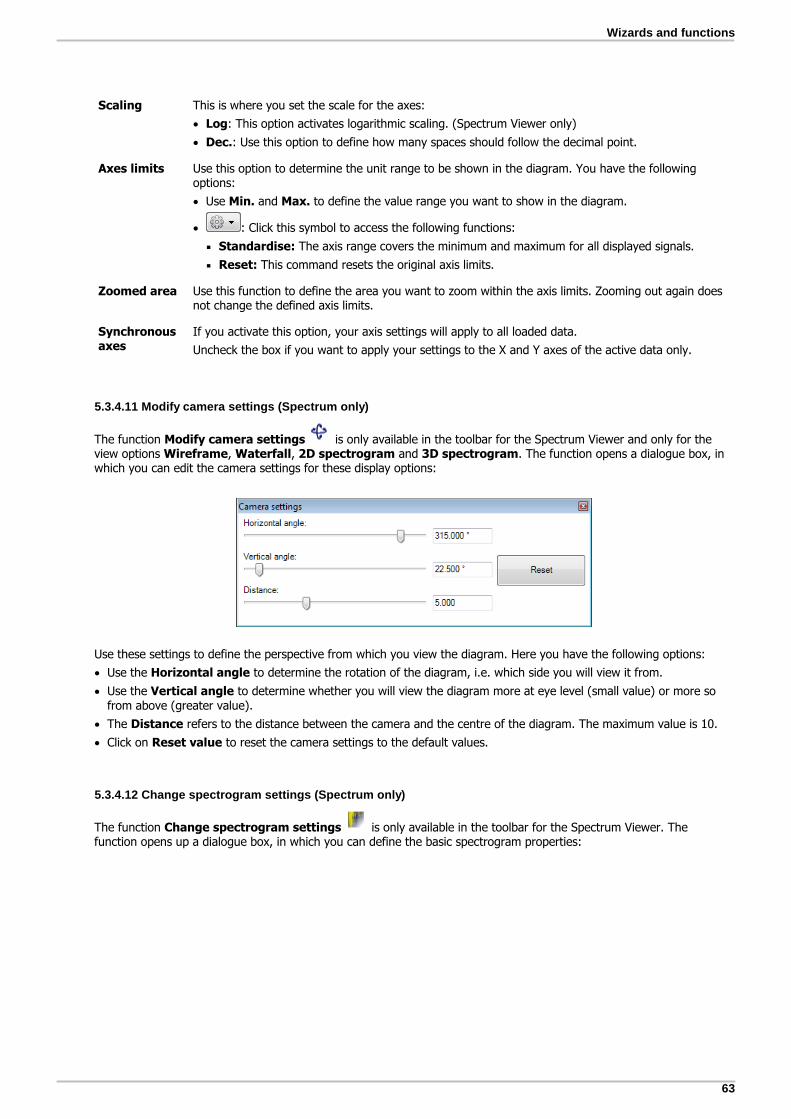
63
Wizards and functions
Scaling This is where you set the scale for the axes:
Log: This option activates logarithmic scaling. (Spectrum Viewer only)
Dec.: Use this option to define how many spaces should follow the decimal point.
Axes limits Use this option to determine the unit range to be shown in the diagram. You have the followingoptions:
Use Min. and Max. to define the value range you want to show in the diagram.
: Click this symbol to access the following functions:
Standardise: The axis range covers the minimum and maximum for all displayed signals.
Reset: This command resets the original axis limits.
Zoomed area Use this function to define the area you want to zoom within the axis limits. Zooming out again doesnot change the defined axis limits.
Synchronousaxes
If you activate this option, your axis settings will apply to all loaded data.
Uncheck the box if you want to apply your settings to the X and Y axes of the active data only.
5.3.4.11 Modify camera settings (Spectrum only)
The function Modify camera settings is only available in the toolbar for the Spectrum Viewer and only for theview options Wireframe, Waterfall, 2D spectrogram and 3D spectrogram. The function opens a dialogue box, inwhich you can edit the camera settings for these display options:
Use these settings to define the perspective from which you view the diagram. Here you have the following options:
Use the Horizontal angle to determine the rotation of the diagram, i.e. which side you will view it from.
Use the Vertical angle to determine whether you will view the diagram more at eye level (small value) or more sofrom above (greater value).
The Distance refers to the distance between the camera and the centre of the diagram. The maximum value is 10.
Click on Reset value to reset the camera settings to the default values.
5.3.4.12 Change spectrogram settings (Spectrum only)
The function Change spectrogram settings is only available in the toolbar for the Spectrum Viewer. Thefunction opens up a dialogue box, in which you can define the basic spectrogram properties:

64
Here you have the following options:
Bandwidth Your graphics board would need a lot of disk space if you were to display every dot whenworking with many signals. This is avoided by dividing the spectrogram into sections anddisplaying the maximum value for each one.
If you decrease the value for bandwidth, you increase the number of sections; this inturn increases the number of displayed values and improves the accuracy of the display.With regard to weaker graphics boards, you can raise the bandwidth to achieve a balancebetween accurate display and required disk space.
Spectrogram properties Gradient: You can use the value for the upper limit to define the maximum value atwhich the displayed range of the Y-axis should end. Additionally, the dashed line tellsyou at a glance where your values for Upper, Middle and Lower are positioned onthe Y-axis.
For instance, you can set the values for Upper and Lower at your alarm limits.
The options Remove upper range and Remove lower range allow you to removethese ranges from the diagram and concentrate on analysing the middle range.
Clicking on the colour symbols for Upper, Middle and Loweropens the standardcolour dialogue box . You can amend the colour of the relevant area here, forexample to achieve a better contrast.
5.3.4.13 Integrate signals (spectrum)
The function Integrate signals is available in the toolbars for the Time Signal Viewer and the Spectrum Viewer. Thefunction opens a dialogue box, in which you can integrate time signals:
73

65
Wizards and functions
Here you have the following options:
Integrateonce
Activate this option to view all the time signals in the list that can be integrated once.
Integratetwice
Activate this option to view all the time signals in the list that can be integrated twice.
Time signals In this list you will see the time signals that are available for the integration option selected above.Use the checkbox to activate the required time signals for the integration.
Show in You have the following options to show the integrated time signals:
Time signals: Use this option to show the integrated time signals with all the other loaded timesignals in the Time Signal Viewer.
Own tab: You can activate the option Time signals and overwrite it with its own name:
The integrated time signals will then be displayed in the Time Signal Viewer on their own tab:
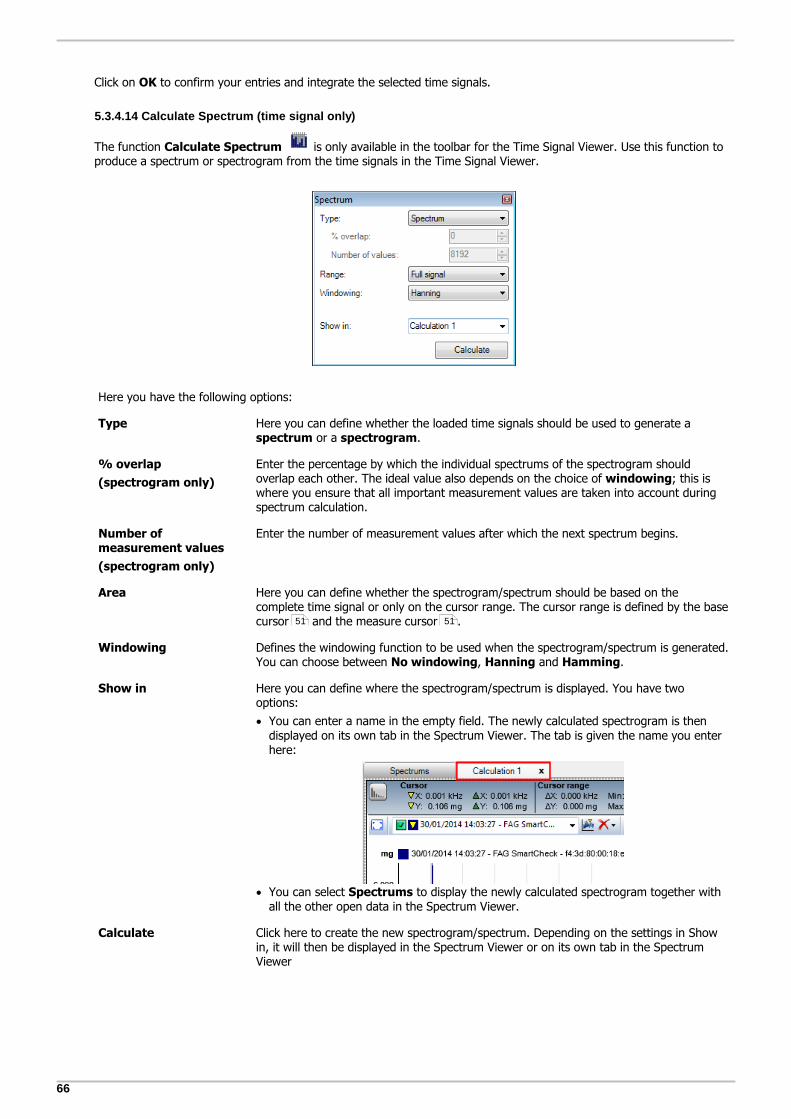
66
Click on OK to confirm your entries and integrate the selected time signals.
5.3.4.14 Calculate Spectrum (time signal only)
The function Calculate Spectrum is only available in the toolbar for the Time Signal Viewer. Use this function toproduce a spectrum or spectrogram from the time signals in the Time Signal Viewer.
Here you have the following options:
Type Here you can define whether the loaded time signals should be used to generate a spectrum or a spectrogram.
% overlap
(spectrogram only)
Enter the percentage by which the individual spectrums of the spectrogram shouldoverlap each other. The ideal value also depends on the choice of windowing; this iswhere you ensure that all important measurement values are taken into account duringspectrum calculation.
Number ofmeasurement values
(spectrogram only)
Enter the number of measurement values after which the next spectrum begins.
Area Here you can define whether the spectrogram/spectrum should be based on thecomplete time signal or only on the cursor range. The cursor range is defined by the basecursor and the measure cursor .
Windowing Defines the windowing function to be used when the spectrogram/spectrum is generated.You can choose between No windowing, Hanning and Hamming.
Show in Here you can define where the spectrogram/spectrum is displayed. You have twooptions:
You can enter a name in the empty field. The newly calculated spectrogram is thendisplayed on its own tab in the Spectrum Viewer. The tab is given the name you enterhere:
You can select Spectrums to display the newly calculated spectrogram together withall the other open data in the Spectrum Viewer.
Calculate Click here to create the new spectrogram/spectrum. Depending on the settings in Showin, it will then be displayed in the Spectrum Viewer or on its own tab in the SpectrumViewer
51 51

67
Wizards and functions
5.3.4.15 Calculate order spectrum (Spectrum only)
The function Calculate order spectrum is only available in the toolbar for the Spectrum Viewer. The functionopens a dialogue box, in which you can calculate the order spectrums and the frequency spectrums:
Here you have the following options:
Generateorder spectrums
Activate this option to see all the spectrums in the list from which an order spectrum can begenerated.
Generatefrequencyspectrums
Activate this option to see all the spectrums in the list from which a frequency spectrum canbe generated.
Spectrums In this list you will see the spectrums that are available for the option selected above. Use thecheckbox to activate the required spectrums for the operation.
Show in You have the following options to display the generated spectrums:
Spectrums: Use this option to display the generated spectrums with all other loadedspectrums in the Spectrum Viewer.
Own tab: You can activate the option Spectrums and overwrite it with its own name:
The integrated time signals will then be displayed in the Time Signal Viewer on their own tab:

68
Click on OK to confirm your entries and generate the required spectrums.
5.3.4.16 Exporting diagrams
Each viewer allows you to export the diagram and its associated information. You can export the diagram in RTF format,image format and CSV format; you can also choose to save it as a file or copy it to the clipboard. The correspondingcommands are called up by right-clicking in the context menu for the viewer:
You will find detailed information on exporting different formats in the following sections. We have described the Saveoptions in each case to give the explanations a clearer layout. Copying will remove the file settings from the dialogue.
Export diagram in RTF format
When you save or copy a diagram in RTF format, you can subsequently open it in Office applications or paste it into anOffice file. To export, select Export > Save diagram (RTF format) or Export > Copy diagram (RTF format) fromthe context menu for the Viewer. This opens the corresponding dialogue box:
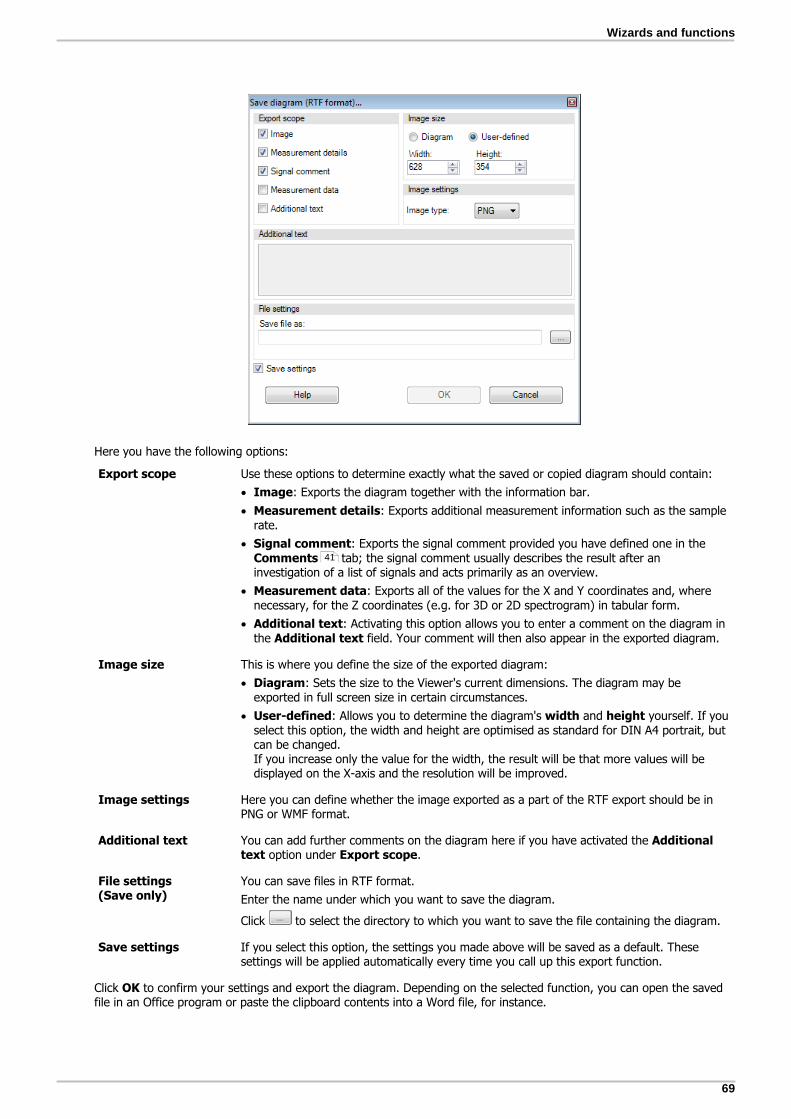
69
Wizards and functions
Here you have the following options:
Export scope Use these options to determine exactly what the saved or copied diagram should contain:
Image: Exports the diagram together with the information bar.
Measurement details: Exports additional measurement information such as the samplerate.
Signal comment: Exports the signal comment provided you have defined one in theComments tab; the signal comment usually describes the result after aninvestigation of a list of signals and acts primarily as an overview.
Measurement data: Exports all of the values for the X and Y coordinates and, wherenecessary, for the Z coordinates (e.g. for 3D or 2D spectrogram) in tabular form.
Additional text: Activating this option allows you to enter a comment on the diagram inthe Additional text field. Your comment will then also appear in the exported diagram.
Image size This is where you define the size of the exported diagram:
Diagram: Sets the size to the Viewer's current dimensions. The diagram may beexported in full screen size in certain circumstances.
User-defined: Allows you to determine the diagram's width and height yourself. If youselect this option, the width and height are optimised as standard for DIN A4 portrait, butcan be changed.If you increase only the value for the width, the result will be that more values will bedisplayed on the X-axis and the resolution will be improved.
Image settings Here you can define whether the image exported as a part of the RTF export should be inPNG or WMF format.
Additional text You can add further comments on the diagram here if you have activated the Additionaltext option under Export scope.
File settings(Save only)
You can save files in RTF format.
Enter the name under which you want to save the diagram.
Click to select the directory to which you want to save the file containing the diagram.
Save settings If you select this option, the settings you made above will be saved as a default. Thesesettings will be applied automatically every time you call up this export function.
Click OK to confirm your settings and export the diagram. Depending on the selected function, you can open the savedfile in an Office program or paste the clipboard contents into a Word file, for instance.
41

70
Export diagram as an image
If you save or copy the diagram as an image, you will be able to open it in an image editing program or paste it into filesthat support images. To export, select Export > Save diagram (image) or Export > Copy diagram (image) fromthe context menu for the Viewer. This opens the corresponding dialogue box:
Here you have the following options:
Image size This is where you define the size of the exported diagram:
Diagram: Sets the size to the Viewer's current dimensions. The diagram may beexported in full screen size in certain circumstances.
User-defined: Allows you to determine the diagram's width and height yourself. If youselect this option, the width and height are optimised as standard for DIN A4 portrait, butcan be changed.If you increase only the value for the width, the result will be that more values will bedisplayed on the X-axis and the resolution will be improved.
File settings You can save files in PNG format.
Enter the name under which you want to save the diagram.
Click to select the directory to which you want to save the file containing the diagram.
Save settings If you select this option, the settings you made above will be saved as a default. Thesesettings will be applied automatically every time you call up this export function.
Click OK to confirm your settings and export the diagram. Depending on the selected function, you can open the savedfile in an image editing program or paste the clipboard contents into a Word file, for instance.
Export diagram in CSV format
Saving or copying the diagram in CSV format will export all of the X and Y coordinates and, where indicated, the Zcoordinates. You can then open them as a table, for instance in MS Excel, or paste them into an appropriate file. Toexport, select Export > Save diagram (CSV format) or Export > Copy diagram (CSV format) from the contextmenu for the Viewer. This opens the corresponding dialogue box:

71
Wizards and functions
Here you have the following options:
Signal settings Here you can determine the signal types you want to export the diagram for:
Active signal : You will find the active signal in the signal selection list for the Viewerwhere it is marked with a yellow triangle.
Selection: Activate this option if you want to select specific signals for export. You canchoose from all of the currently loaded signals. Make your selection by activating thecheckbox for each signal you want to export. You can also make use of the quickselection options offered by the buttons below the list:
: Selects all of the signals for export.
: Selects none of the signals for export.
: Inverts the current selection, i.e. checks unchecked boxes and unchecks checkedboxes.
Use the Delimiter option to determine how coordinate values should be separated in theexported format. You can choose between the options TAB, comma , and semicolon ;.
File settings You can save files in CSV format.
Enter the name under which you want to save the diagram.
Click to select the directory to which you want to save the file containing the diagram.
Save settings If you select this option, the settings you made above will be saved as a default. Thesesettings will be applied automatically every time you call up this export function.
30

72
For the CSV export of the trend, the data for the X axis is transferred as numbers in a timestamp column.
Example: 41884,4173678241
These values correspond to an EXCEL-specific date and time format:
Number before the comma: number of days since 01/01/1900
Number after the comma: time
To convert this format to the normal date and time format, proceed as follows:
1. Highlight the time stamp column.
2. Right-click and select Format cells.
3. On the Numbers tab, select the User-defined category and then on the right-hand sideselect the required Type, i.e. DD/MM/YYYY hh:mm:ss. The example above would then beconverted as follows: 09/02/2014 10:01:01.
5.3.5 Change program settings
You can find the program settings for the FAG SmartUtility Viewer software in the context menu, which you can accessby right-clicking in any Viewer. In the context menu, select the Settings command to open the following dialogue box:
You can select the area for which you want to view or change settings from the list on the left. You will then see thesettings you can change for the area in question on the right. You can change the settings for the following areas:
Viewer
Signals
Symbols
Unit profiles
Reset
You will find detailed information on settings options in the following sections.
73
74
75
76
77
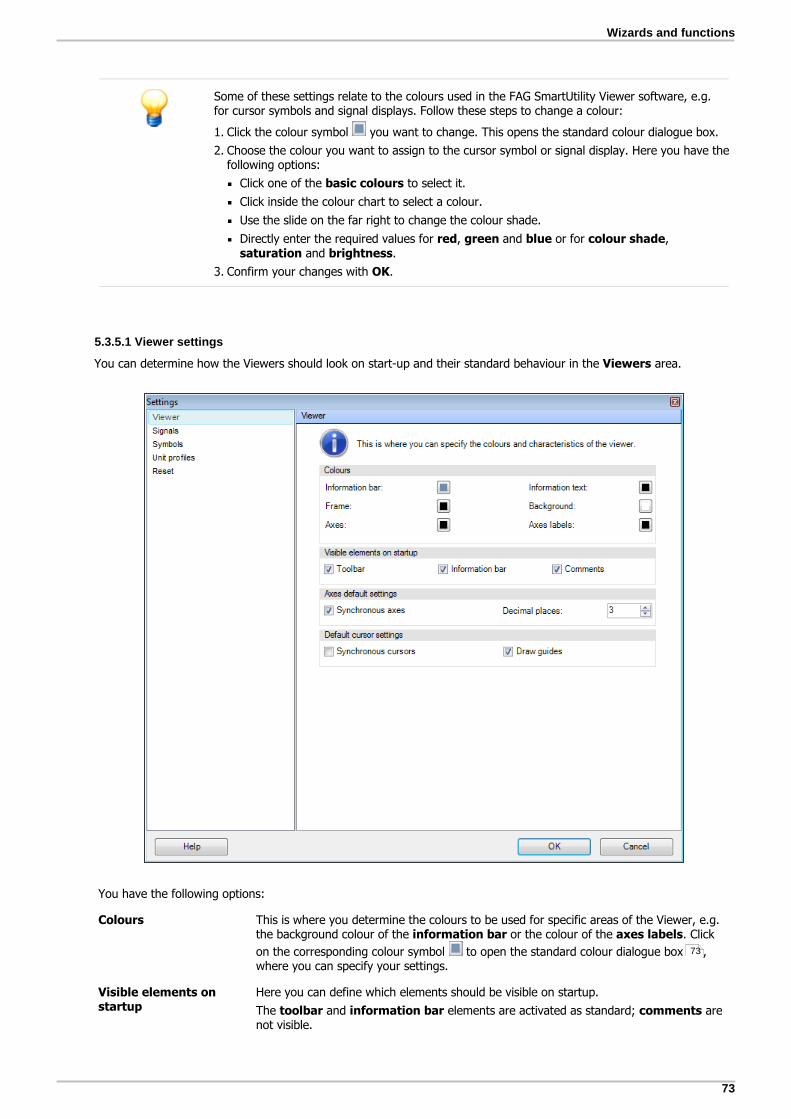
73
Wizards and functions
Some of these settings relate to the colours used in the FAG SmartUtility Viewer software, e.g.for cursor symbols and signal displays. Follow these steps to change a colour:
1. Click the colour symbol you want to change. This opens the standard colour dialogue box.
2. Choose the colour you want to assign to the cursor symbol or signal display. Here you have thefollowing options:
Click one of the basic colours to select it.
Click inside the colour chart to select a colour.
Use the slide on the far right to change the colour shade.
Directly enter the required values for red, green and blue or for colour shade,saturation and brightness.
3. Confirm your changes with OK.
5.3.5.1 Viewer settings
You can determine how the Viewers should look on start-up and their standard behaviour in the Viewers area.
You have the following options:
Colours This is where you determine the colours to be used for specific areas of the Viewer, e.g.the background colour of the information bar or the colour of the axes labels. Click
on the corresponding colour symbol to open the standard colour dialogue box ,where you can specify your settings.
Visible elements onstartup
Here you can define which elements should be visible on startup.
The toolbar and information bar elements are activated as standard; comments arenot visible.
73

74
Axes default settings Here you can define the appearance of the X and Y axes on startup:
Synchronous axes: When this option is activated, any changes made in the Axes tab will always apply to the axes of every diagram in the active Viewer. If you
deactivate the checkbox, any changes made in the Axes tab will only apply to thediagram for the active signal or spectrum.
Decimal places: Here you can define how many decimal places the values for the Xand Y axes should have.
The option Synchronous axes is activated as standard; 3 decimal places are displayed.
Default cursor settings Here you can define basic cursor behaviour:
Synchronous cursors: If you select this option, the measure cursor and base cursorwill be displayed simultaneously for all data on the display. Any changes to the cursorposition for the active data will apply to the cursor positions for all of the data.
If the checkbox is deactivated, any cursor action will apply to the active data only.
Draw guides: If you activate this option, the program will not only display the cursorsymbols in the diagram, but will also draw a line at the corresponding position.
If the checkbox is deactivated, you will only see the cursor symbols without anyguides.
Both options are deactivated as standard.
5.3.5.2 Signal settings
You can define the colours to be used to display signals, spectrums and spectrograms in the Signals area.
You have the following options:
Signal colours Here you can define the colours to be used to display signals, spectrums and
spectrograms in the viewers. Click on the corresponding colour symbol to open the
62
62

75
Wizards and functions
standard colour dialogue box , where you can specify your settings.
Preset spectrogramcolours
Here you can define the colours to be used for the 2D spectrogram and 3D
spectrogram view options. Click on the corresponding colour symbol to open thestandard colour dialogue box, where you can specify your settings.
Signal settings Draw dots at less than the set number of visible values: If this option isactivated, signals are shown as dots, as soon as less than 50 values lie in the visiblearea of the diagram. If you deactivate the checkbox, the program will also display 50values and fewer as a solid line. This option is activated by default.
Visible values: Here you can define how many values lie in the visible area of thediagram. This are 50 values by default.
5.3.5.3 Symbol settings
You can determine how the cursor and the symbols for cursor functions should looks, as well as their standardbehaviour, in the Symbols area.
You have the following options:
Colour and shape You can define the shapes and colours to be used for the measure and base cursors andfor cursor functions. To do this, proceed as follows:
1. Click on the symbol you want to change in the list on the left. This automaticallyupdates the fields on the right; they show you the current settings for the symbol.
2. In the selection list labelled Shape, select the shape you want to use to symbolise thecursor or cursor function in the diagram, e.g. box or diamond.
3. Define the shape colour for the shape, as well as the colours for its outline and
guides. Click on the corresponding colour symbol to open the standard colourdialogue box , where you can specify your settings.
73
61
61
73

76
5.3.5.4 Unit profiles
You can define the unit profile to be used to display the X and Y axes in the diagrams under Unit profiles. Unit profilesdetermine the unit types, units and scaling for X and Y axes.
You have the following options:
Selected profile You have the following choice:
EU profile: This profile defines the units commonly used in the European region asthe preferred unit; auto-scaling is activated for all unit types. You cannot editthis profile.
US profile: This profile defines the units commonly used in the US region as thepreferred unit; auto-scaling is activated for all unit types. You cannot edit thisprofile.
Own profile: This profile allows you to specify your own settings for the preferredunit as well as for auto-scaling . When you open the profile for the first time, youwill be prompted to select one of the two other profiles based on the language of youroperating system. You can, however, change all of the values via the profile table.
Profile table If you have selected EU profile or US profile, this table will be used for informationalpurposes only, i.e. it will show you which unit is preferred for each unit type and whetherauto-scaling is activated.
If you have selected Own profile, you will have the following options:
Preferred unit: This option allows you to determine the unit to be used as standardfor each unit type in every diagram. This unit will always be used to display the axesfor this unit type.
Auto-scaling: If this option is activated, the FAG SmartUtility Viewer software willautomatically decide which unit is best for the diagram display, i.e. provides a clear andshort display. This unit may differ from the preferred unit under certain
76
76
76

77
Wizards and functions
circumstances.
A list of the underlying base units for the EU profile and the US profile can be found inAppendix II: Base units .
5.3.5.5 Reset
You can reset the Viewer program settings to the factory default setting in the Reset area. To do so, click on the Resetprogram settings button.
81
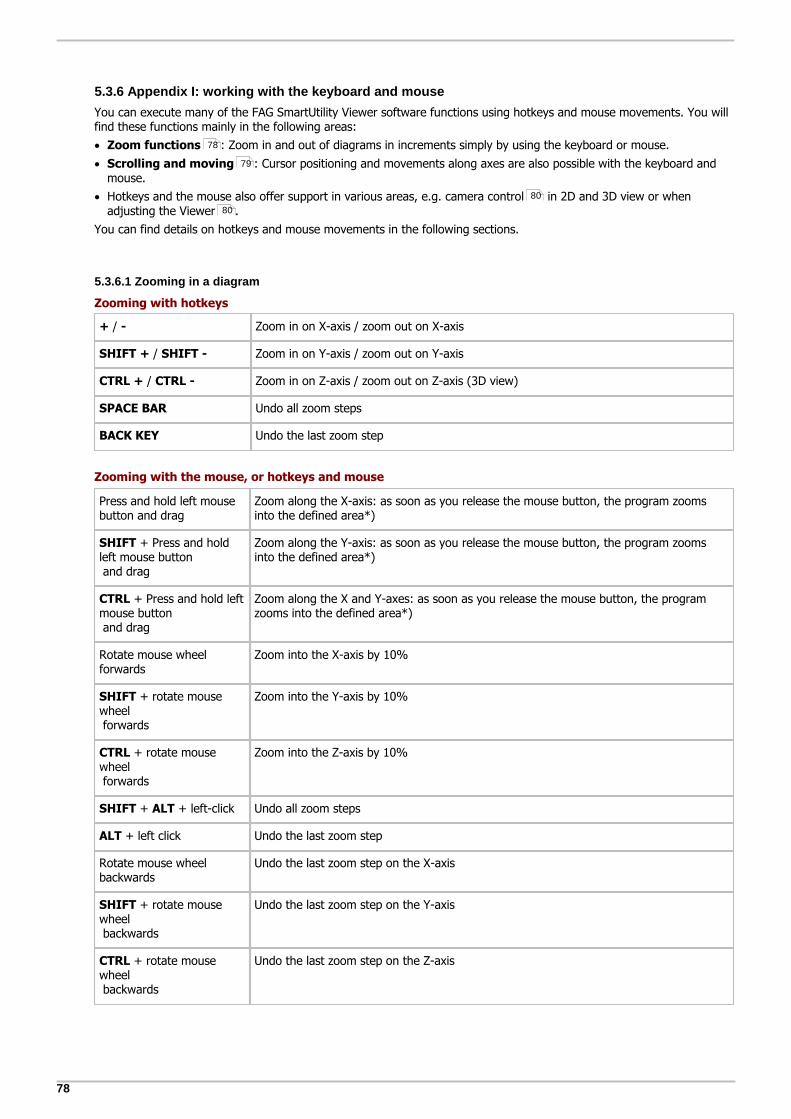
78
5.3.6 Appendix I: working with the keyboard and mouse
You can execute many of the FAG SmartUtility Viewer software functions using hotkeys and mouse movements. You willfind these functions mainly in the following areas:
Zoom functions : Zoom in and out of diagrams in increments simply by using the keyboard or mouse.
Scrolling and moving : Cursor positioning and movements along axes are also possible with the keyboard andmouse.
Hotkeys and the mouse also offer support in various areas, e.g. camera control in 2D and 3D view or whenadjusting the Viewer .
You can find details on hotkeys and mouse movements in the following sections.
5.3.6.1 Zooming in a diagram
Zooming with hotkeys
+ / - Zoom in on X-axis / zoom out on X-axis
SHIFT + / SHIFT - Zoom in on Y-axis / zoom out on Y-axis
CTRL + / CTRL - Zoom in on Z-axis / zoom out on Z-axis (3D view)
SPACE BAR Undo all zoom steps
BACK KEY Undo the last zoom step
Zooming with the mouse, or hotkeys and mouse
Press and hold left mousebutton and drag
Zoom along the X-axis: as soon as you release the mouse button, the program zoomsinto the defined area*)
SHIFT + Press and holdleft mouse button and drag
Zoom along the Y-axis: as soon as you release the mouse button, the program zoomsinto the defined area*)
CTRL + Press and hold leftmouse button and drag
Zoom along the X and Y-axes: as soon as you release the mouse button, the programzooms into the defined area*)
Rotate mouse wheelforwards
Zoom into the X-axis by 10%
SHIFT + rotate mousewheel forwards
Zoom into the Y-axis by 10%
CTRL + rotate mousewheel forwards
Zoom into the Z-axis by 10%
SHIFT + ALT + left-click Undo all zoom steps
ALT + left click Undo the last zoom step
Rotate mouse wheelbackwards
Undo the last zoom step on the X-axis
SHIFT + rotate mousewheel backwards
Undo the last zoom step on the Y-axis
CTRL + rotate mousewheel backwards
Undo the last zoom step on the Z-axis
78
79
80
80
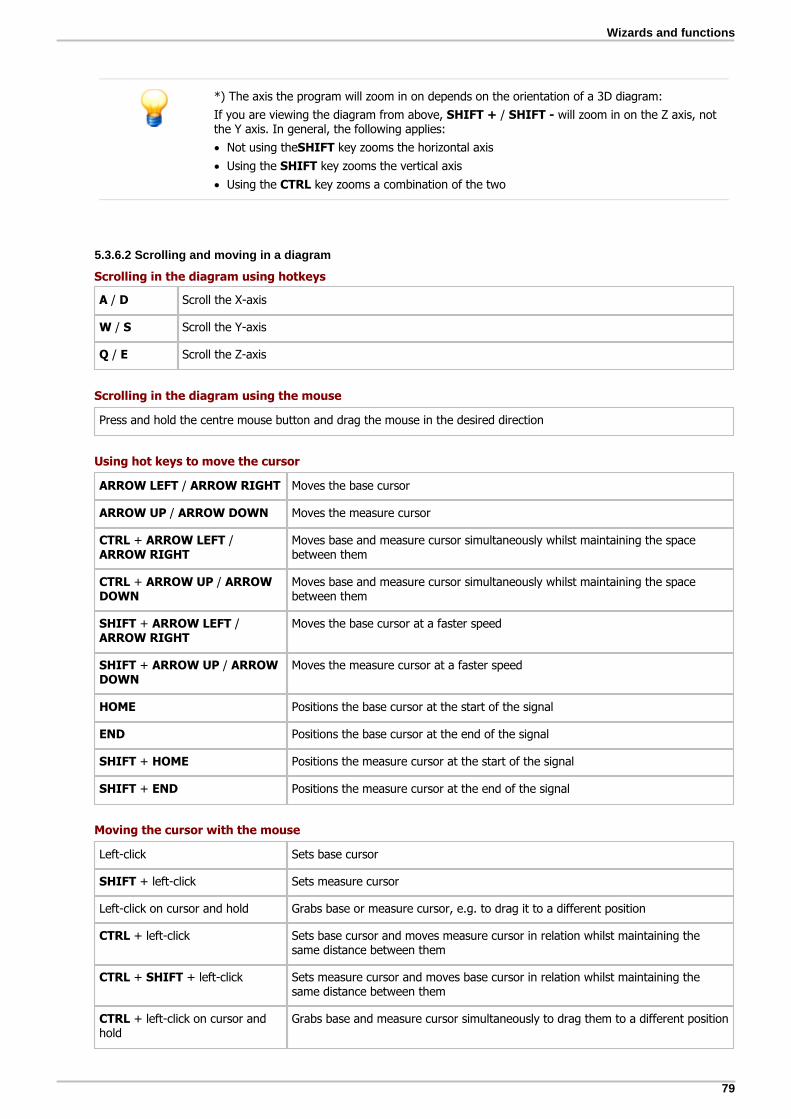
79
Wizards and functions
*) The axis the program will zoom in on depends on the orientation of a 3D diagram:
If you are viewing the diagram from above, SHIFT + / SHIFT - will zoom in on the Z axis, notthe Y axis. In general, the following applies:
Not using theSHIFT key zooms the horizontal axis
Using the SHIFT key zooms the vertical axis
Using the CTRL key zooms a combination of the two
5.3.6.2 Scrolling and moving in a diagram
Scrolling in the diagram using hotkeys
A / D Scroll the X-axis
W / S Scroll the Y-axis
Q / E Scroll the Z-axis
Scrolling in the diagram using the mouse
Press and hold the centre mouse button and drag the mouse in the desired direction
Using hot keys to move the cursor
ARROW LEFT / ARROW RIGHT Moves the base cursor
ARROW UP / ARROW DOWN Moves the measure cursor
CTRL + ARROW LEFT /ARROW RIGHT
Moves base and measure cursor simultaneously whilst maintaining the spacebetween them
CTRL + ARROW UP / ARROWDOWN
Moves base and measure cursor simultaneously whilst maintaining the spacebetween them
SHIFT + ARROW LEFT /ARROW RIGHT
Moves the base cursor at a faster speed
SHIFT + ARROW UP / ARROWDOWN
Moves the measure cursor at a faster speed
HOME Positions the base cursor at the start of the signal
END Positions the base cursor at the end of the signal
SHIFT + HOME Positions the measure cursor at the start of the signal
SHIFT + END Positions the measure cursor at the end of the signal
Moving the cursor with the mouse
Left-click Sets base cursor
SHIFT + left-click Sets measure cursor
Left-click on cursor and hold Grabs base or measure cursor, e.g. to drag it to a different position
CTRL + left-click Sets base cursor and moves measure cursor in relation whilst maintaining thesame distance between them
CTRL + SHIFT + left-click Sets measure cursor and moves base cursor in relation whilst maintaining thesame distance between them
CTRL + left-click on cursor andhold
Grabs base and measure cursor simultaneously to drag them to a different position

80
5.3.6.3 Other functions
Viewer and diagram
F11 Switch full screen mode on/off
You can also switch off full screen mode with ESC.
CTRL + C Copy diagram
CTRL + F Save diagram
CTRL + I Show/hide the viewer's information bar
Signal display
INPUT KEY Change between showing the active signals and all signals
IMAGE UP/IMAGEDOWN
Change between the loaded signals
Select cursor functions
F2 Select cursor function Basis analysis
F3 Select cursor function Gear mesh
F5 Select cursor function Harmonics
F6 Select cursor function Sidebands
F7 Select cursor function Harmonics with sidebands
F8 Select cursor function Speed
F10 Open Cursor settings dialogue box
Select option for cursor positioning
SHIFT + F2 Select Free positioning option
SHIFT + F3 Select Next value positioning option
SHIFT + F4 Select Nearest peak positioning option
SHIFT + F5 Select Tenths positioning option
SHIFT + F6 Select Hundredths positioning option
Scaling
CTRL + Z Reset range scaling
Camera functions in 3D spectrogram, waterfall and wireframe views
CTRL + ALT + press and hold middle mouse button
Rotate the diagram around the X and Y-axis
CTRL + ALT + turn mouse wheel Zoom in/out of the diagram
21

81
Wizards and functions
5.3.7 Appendix II: basic units
Basic units in the EU profile and US profile
Unit type Basic unitEU profile
Basic unitUS profile
Autoscale
Acceleration m/s² in/s² Yes
Speed mm/s in/s Yes
Displacement µm mil Yes
Frequency Hz Hz Yes
Speed Hz Hz Yes
Temperature °C °F Yes
Mass g oz Yes
Time s s Yes
Date and time Local time Local time Yes
Load % % Yes
Flow m³/s in³/h Yes
Voltage V V Yes
Current rating A A Yes
Pressure bar bar Yes
Sound pressure Pa Pa Yes
Torque Nm lbf in Yes
Force N N Yes
Power W W Yes
Band speed m/min in/s Yes
Unknown - - Yes
Phase ° ° Yes
Counter Quantity Quantity Yes
Expansion µEpsilon µEpsilon Yes
5.4 Create report
You use this wizard to create reports from the downloaded SmartCheck device data. To do this, the SmartUtility softwarecombines the selected device data with a selected report template in Rich Text Format (RTF). The RTF report templatesare included in the scope of delivery for all program languages. You can Edit templates and under More actions >Manage report templates, you can Change settings for reports .
In every step of this wizard, you will see the Finish button. Click this button to create the reportfrom your current step and go directly to the results list in step 4.
If you have started the wizard for the first time, the report will be created with the program'sdefault settings:
Selected devices (step 1): All available devices in the data directory
Report template (step 2): The current default report template
Report time range (step 3): The previous three months up to the current day
Save options (step 3) : Summarise reports for all devices in one report
You can also use the Finish button as a short cut using your own settings:
When you start the wizard for the first time, set the individual steps as desired.
The next time you start the wizard, these settings will be applied automatically when youclick Finish.
96
94

82
To create a report, proceed as follows:
Step 1:
1. Select the data directory containing the data for the report. This may be the default data directory or a directoryyou have selected yourself.
2. The SmartCheck devices for which data is available will then be listed below. Here, you can select one or multipledevices:
In the list of devices, you will find detailed information about each device, such as the alarm status, the device name, orthe date the data was downloaded. In the Status column, you will see data status symbols. When you move the mouseover it, you will see information about the status of the data.
The symbol indicates that the downloaded data has not been converted. A report cannot becreated from data in an out-dated format.
Step 2:
Select the directory containing the report templates. This may be the default directory or a directory you haveselected yourself.
The available report templates will then be listed below. The current default template will be preselected. Immediatelyafter installation, this is the sample template in the current program language. You use the function More actions >Manage report templates to Change the standard template as well as the template directory.
You can also use the buttons and context menu to create new templates , duplicate templates , edit templates ,rename templates or delete templates:
108
19
95
100
96 98 97
99

83
Wizards and functions
You must install the corresponding Windows language pack for the language in which you wantto create a report. If foreign-language entries in the Logbook section are incorrect or featureinvalid characters, you must also install the Windows language pack for the language of thelogbook entries. Note that some language packs are only available for the Professional orUltimate versions of the Windows operating system.
Future versions of SmartUtility will contain new sample templates if required. If you want tocreate a new template or edit an existing one, you will be informed about new sampletemplates. You can stop receiving these messages with the option Do not show this messageagain. After reinstallation, the message will appear again.
Step 3:
In the third step, you must specify the time range for which the report is to be created. You also specify here where andin which format the result is saved:

84
Here you have the following options:
Time range This is where you determine the time range for which the report is to be created:
Complete time range: The report is created from all measurement dataavailable in the selected directory.
Retroactively specify time range: If you activate this option, you can set thenumber of months, weeks or dates up to the current date. Only themeasurement data for this time range is then used for the report.If 3 months is preset, the report will then include measurement data for theprevious three months up to the current date.
Set user-defined time range: If you activate this option, you can enter datesdirectly in the From and To fields for the desired time range or select the datesfrom the calendar. Only the measurement data from the selected time range isused for the report.
Save options Specify the location and format in which the report is saved. You have the followingoptions:
Directory for report output:The list is preset to display the default directory to which the report is saved. Youspecify this directory when you first open the software, or later under Moreactions > Manage report templates .
Click to select a different directory as the storage location.
Combine all devices in one report:Select this option to summarise the report information for all selected devices ina single RTF document. Each device will have its own section in this RTFdocument.
Create a separate report for each device:Select this option to create a separate RTF document for each device.With both sub-operations, you specify whether the individual documents will besaved in one subdirectory or in separate subdirectories.
Archive reports as zip file:Activate this option to add the created reports to a ZIP archive. The compressedreports can then be sent by email for example.
95
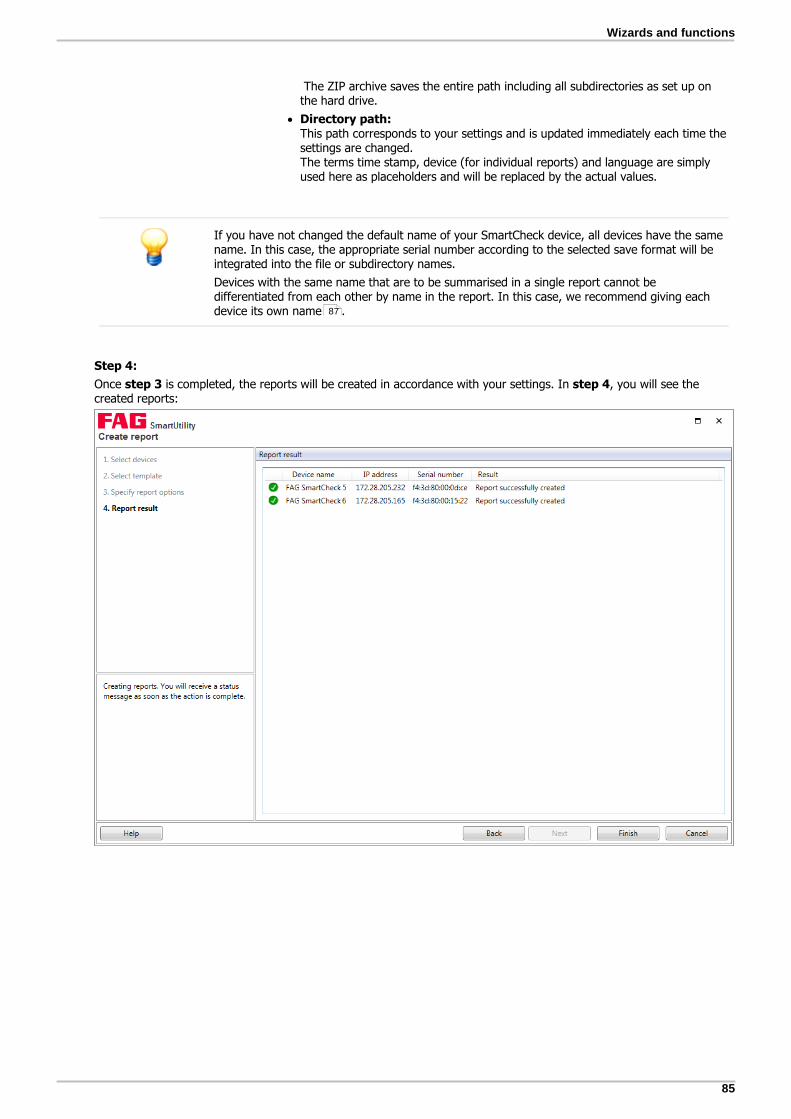
85
Wizards and functions
The ZIP archive saves the entire path including all subdirectories as set up onthe hard drive.
Directory path:This path corresponds to your settings and is updated immediately each time thesettings are changed.The terms time stamp, device (for individual reports) and language are simplyused here as placeholders and will be replaced by the actual values.
If you have not changed the default name of your SmartCheck device, all devices have the samename. In this case, the appropriate serial number according to the selected save format will beintegrated into the file or subdirectory names.
Devices with the same name that are to be summarised in a single report cannot bedifferentiated from each other by name in the report. In this case, we recommend giving eachdevice its own name .
Step 4:
Once step 3 is completed, the reports will be created in accordance with your settings. In step 4, you will see thecreated reports:
87
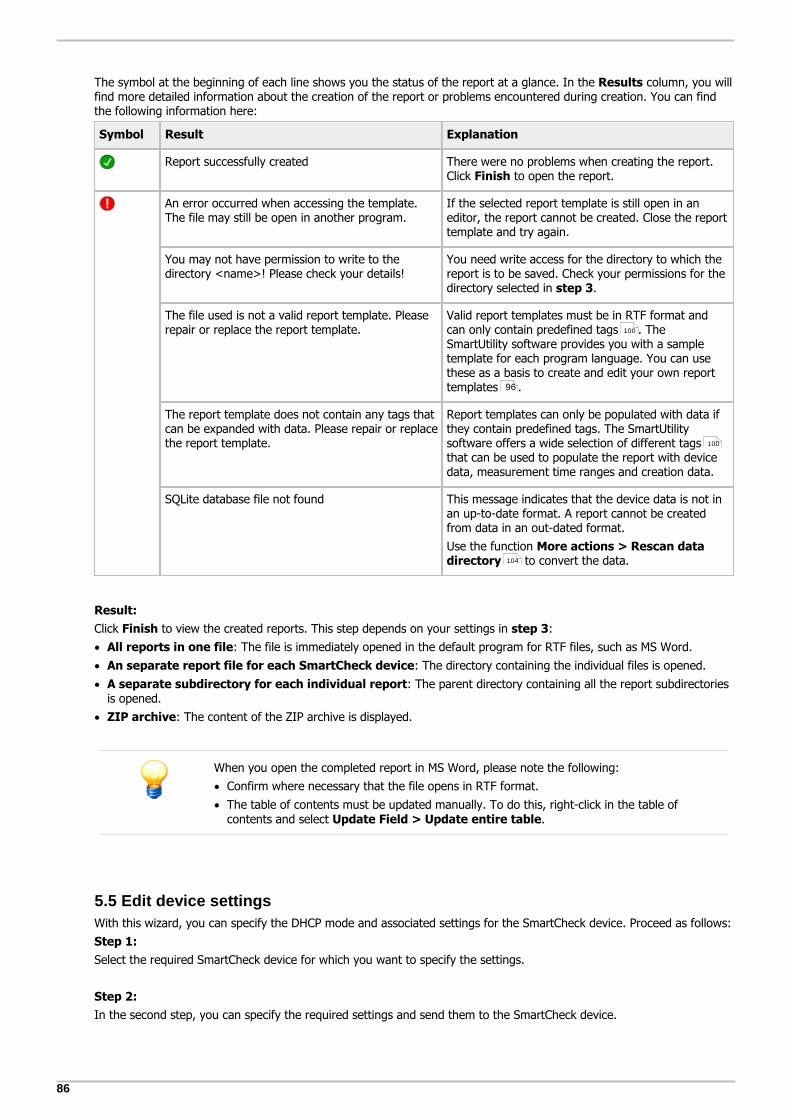
86
The symbol at the beginning of each line shows you the status of the report at a glance. In the Results column, you willfind more detailed information about the creation of the report or problems encountered during creation. You can findthe following information here:
Symbol Result Explanation
Report successfully created There were no problems when creating the report.Click Finish to open the report.
An error occurred when accessing the template.The file may still be open in another program.
If the selected report template is still open in aneditor, the report cannot be created. Close the reporttemplate and try again.
You may not have permission to write to thedirectory <name>! Please check your details!
You need write access for the directory to which thereport is to be saved. Check your permissions for thedirectory selected in step 3.
The file used is not a valid report template. Pleaserepair or replace the report template.
Valid report templates must be in RTF format andcan only contain predefined tags . TheSmartUtility software provides you with a sampletemplate for each program language. You can usethese as a basis to create and edit your own reporttemplates .
The report template does not contain any tags thatcan be expanded with data. Please repair or replacethe report template.
Report templates can only be populated with data ifthey contain predefined tags. The SmartUtilitysoftware offers a wide selection of different tagsthat can be used to populate the report with devicedata, measurement time ranges and creation data.
SQLite database file not found This message indicates that the device data is not inan up-to-date format. A report cannot be createdfrom data in an out-dated format.
Use the function More actions > Rescan datadirectory to convert the data.
Result:
Click Finish to view the created reports. This step depends on your settings in step 3:
All reports in one file: The file is immediately opened in the default program for RTF files, such as MS Word.
An separate report file for each SmartCheck device: The directory containing the individual files is opened.
A separate subdirectory for each individual report: The parent directory containing all the report subdirectoriesis opened.
ZIP archive: The content of the ZIP archive is displayed.
When you open the completed report in MS Word, please note the following:
Confirm where necessary that the file opens in RTF format.
The table of contents must be updated manually. To do this, right-click in the table ofcontents and select Update Field > Update entire table.
5.5 Edit device settings
With this wizard, you can specify the DHCP mode and associated settings for the SmartCheck device. Proceed as follows:
Step 1:
Select the required SmartCheck device for which you want to specify the settings.
Step 2:
In the second step, you can specify the required settings and send them to the SmartCheck device.
100
96
100
104

87
Wizards and functions
Here you have the following options:
No DHCP With this option, you can specify the IP address or continue to use the SmartCheckdevice's default IP address.
If No DHCP is activated, you must also specify the other settings in this step, e.g.IP address, netmask or host name.
DHCP client mode
(load host name from server)
With this option, the SmartCheck device automatically receives an IP address withinyour network. The device name is specified via the network's DNS server (reverseDNS).
DHCP client mode
(send host name to server)
With this option, the SmartCheck device automatically receives an IP address withinyour network. The device name is registered by the SmartCheck device in thenetwork's DNS server.
Device name Here you can alter the device name of the SmartCheck device. Give each device aunique name, so that you can find it again straight away in the list boxes.
If the IP address is allocated automatically via DHCP, the SmartCheck device can only beaccessed via the automatically allocated IP address. You can no longer use the default IPaddress.
The name of every SmartCheck device is FAG SmartCheck by default. If you want to integratemultiple SmartCheck devices into your system, it is important that you give each device aunique name. Otherwise, you can only identify the devices in the wizard lists via the IPaddress or the serial number.
If user management is activated on the SmartCheck device, you must also enter a usernameand password in SmartUtility. If these are not entered, the device settings will not betransferred.
Result:
In the third step, you can check the result of the action.
111
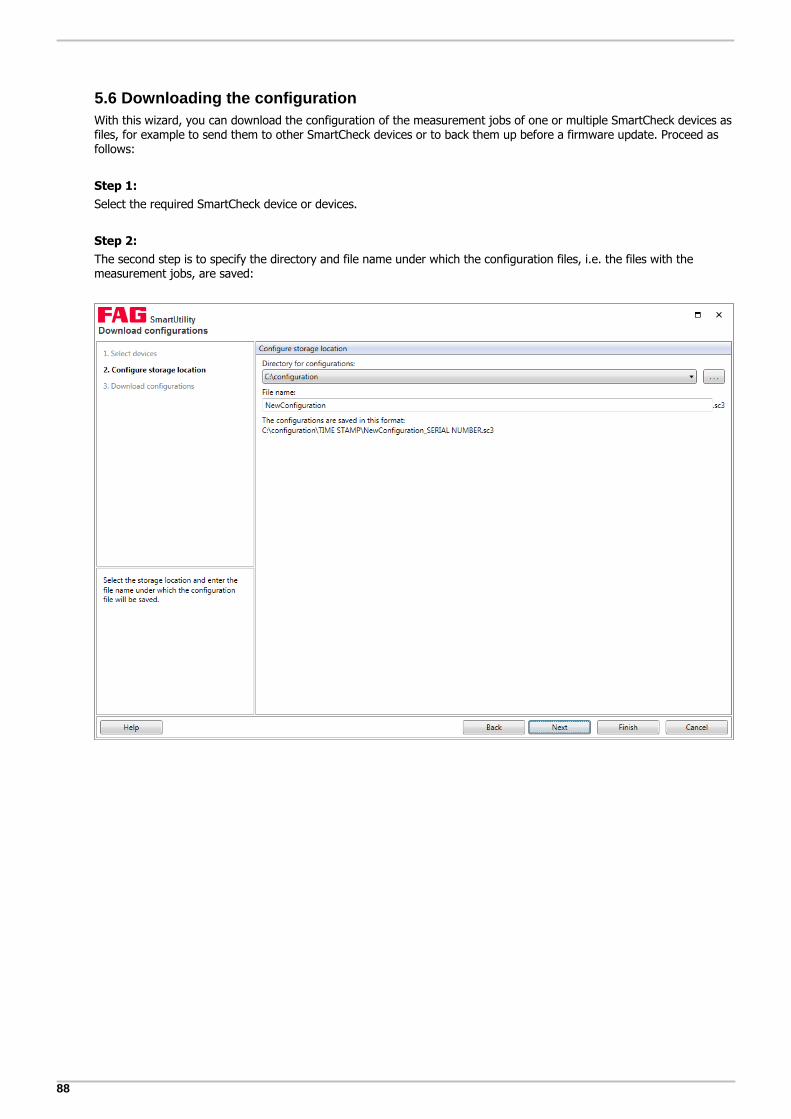
88
5.6 Downloading the configuration
With this wizard, you can download the configuration of the measurement jobs of one or multiple SmartCheck devices asfiles, for example to send them to other SmartCheck devices or to back them up before a firmware update. Proceed asfollows:
Step 1:
Select the required SmartCheck device or devices.
Step 2:
The second step is to specify the directory and file name under which the configuration files, i.e. the files with themeasurement jobs, are saved:

89
Wizards and functions
Here you have the following options:
Directory for configurations Here you determine the directory in which the configurations are to be saved. Youhave the following options:
The list shows the default directory for configurations by default. This directory isspecified either when you first launch the software or subsequently under Moreactions > Settings > General .
Click to select another directory and specify this as the save location.
File name Using valid characters, you can determine the file name here, which is to receivethe downloaded configurations. The names of the individual files will then besupplemented with the serial number of the appropriate device.
Invalid characters for the file name are:
< > ? " : | / \ *
If you use these characters, they will be replaced by an underscore.
The path generated from your settings for Directory and File name is indicated to you beneath the settings as anexample. This is automatically amended with each additional change.
Step 3:
The file or, in the case of several selected devices, the files, is/are downloaded. Wait until the process is completed.
Result:
The downloaded configurations are located in the directory you specified in Step 2. The file name specified by you issupplemented by the serial number of the appropriate SmartCheck devices.
If you download configurations from an SmartCheck device with firmware version 1.4 (or older),the configurations are automatically converted into the new file format for SmartUtility software1.6. You can then no longer send these converted configurations to SmartCheck devices withthe old firmware version!
5.7 Sending the configuration
With this wizard, you can send the configuration of the measurement jobs as a file to one SmartCheck device or severaldevices. Proceed as follows:
Step 1:
Select the required SmartCheck device or devices to which you want to send the configuration file with the measurementjobs.
Step 2:
The second step is to select the file (file ending SC1, SC2 or SC3) you want to send.
108
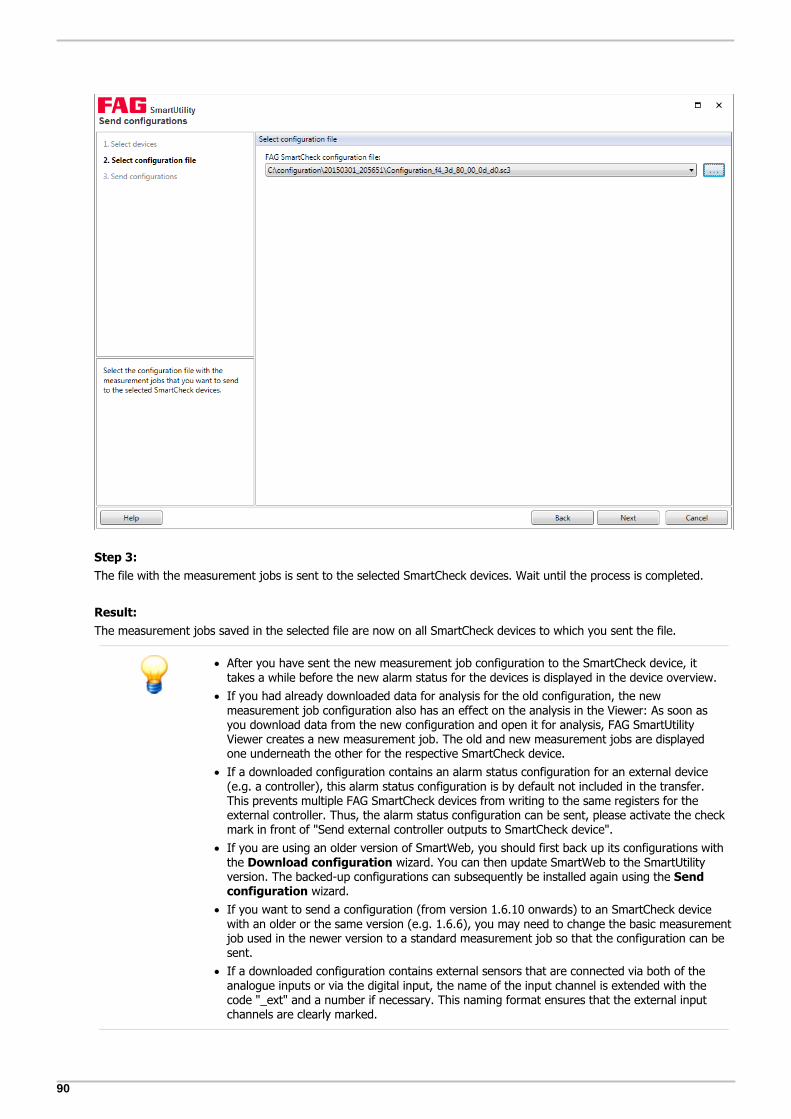
90
Step 3:
The file with the measurement jobs is sent to the selected SmartCheck devices. Wait until the process is completed.
Result:
The measurement jobs saved in the selected file are now on all SmartCheck devices to which you sent the file.
After you have sent the new measurement job configuration to the SmartCheck device, ittakes a while before the new alarm status for the devices is displayed in the device overview.
If you had already downloaded data for analysis for the old configuration, the newmeasurement job configuration also has an effect on the analysis in the Viewer: As soon asyou download data from the new configuration and open it for analysis, FAG SmartUtilityViewer creates a new measurement job. The old and new measurement jobs are displayedone underneath the other for the respective SmartCheck device.
If a downloaded configuration contains an alarm status configuration for an external device(e.g. a controller), this alarm status configuration is by default not included in the transfer.This prevents multiple FAG SmartCheck devices from writing to the same registers for theexternal controller. Thus, the alarm status configuration can be sent, please activate the checkmark in front of "Send external controller outputs to SmartCheck device".
If you are using an older version of SmartWeb, you should first back up its configurations withthe Download configuration wizard. You can then update SmartWeb to the SmartUtilityversion. The backed-up configurations can subsequently be installed again using the Sendconfiguration wizard.
If you want to send a configuration (from version 1.6.10 onwards) to an SmartCheck devicewith an older or the same version (e.g. 1.6.6), you may need to change the basic measurementjob used in the newer version to a standard measurement job so that the configuration can besent.
If a downloaded configuration contains external sensors that are connected via both of theanalogue inputs or via the digital input, the name of the input channel is extended with thecode "_ext" and a number if necessary. This naming format ensures that the external inputchannels are clearly marked.

91
Wizards and functions
5.8 Updating the firmware
With this wizard, you can send a file with a firmware update to one or more SmartCheck devices. More detailedinformation on firmware updates and the corresponding notifications is set out in your service or maintenance contract.
CAUTION Measurement data and configurations may be irretrievably deleted!
If you update the firmware of a FAG SmartCheck device, depending on the update version, youmay lose all the measurement data and configurations saved on the device. Note the following:
When changing from version 1.2 to a higher version, all measurement data and configurationsare lost.
When changing from version 1.4 or 1.6 to a higher version, all measurement data is lost.
From versions 1.4.27 and 1.6.6, configurations are usually retained.
Measurement data and configurations are not retained until version 1.10
Before updating firmware, download the measurement data with the SmartUtility software ifrequired. In addition, you can download the configuration (with the taught alarm limits) for theSmartCheck device via the SmartUtility software and install it again after the firmware update.
If the configurations and alarm limits must not be deleted during a firmware update, use theSmartUtility software.
Values in alarm maps with a completed learning mode may be lost!
If you have started the learning mode for the SmartCheck device in conjunction with one or twoother signals, the associated alarm maps are populated gradually during the learning process. Afirmware update has the following effects:
All alarm maps are reset to the Use learning mode status, regardless of whether thelearning mode was already completed in a map.
Learning mode is deactivated and the outstanding maps remain unchanged.
If you re-activate learning mode, it restarts for all maps. You also lose the values that havealready been taught-in.
To back up the values in the alarm maps with a completed learning mode, proceed as follows:
1. Manually deactivate the Use learning mode option for each completed alarm map. You canfind this option in the configuration wizards for the SmartWeb software.
2. Activate the learning mode only at this point.
For more information about the learning mode, please see the section entitled Learning modeand alarm maps in the manual for the SmartWeb software.
The update to version 1.10 is also associated with a migration. Due to the migration, you cannotdowngrade from 1.10 to a previous version. All future firmware versions will also be based onthis update with migration. This means, for example, that you can no longer update fromversion 1.6.20 directly to a future version 1.12. You must always install version 1.10 first.
To send a firmware update, proceed as follows:
Step 1:
Select the required SmartCheck device or devices whose firmware you want to update.
Step 2:
Specify the file with the firmware update; the file has the ending SF1. Once you have selected a file, you will find theversion number and the device type for this firmware file in the Information section.
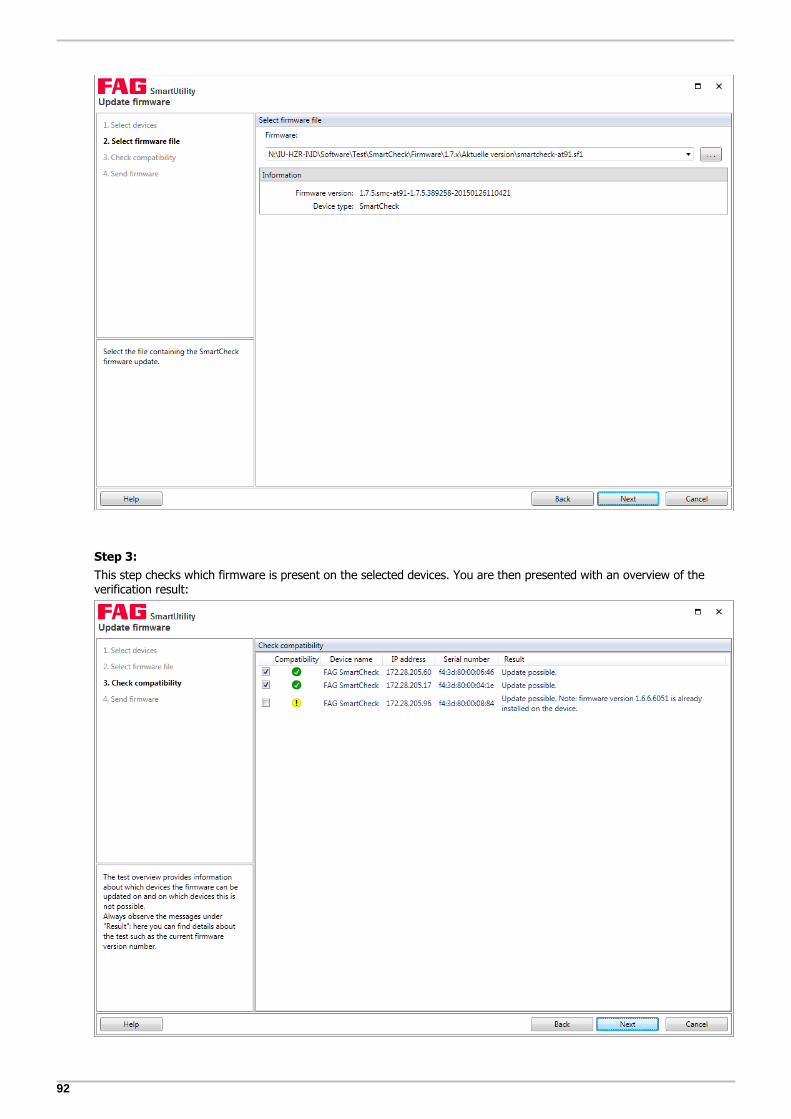
92
Step 3:
This step checks which firmware is present on the selected devices. You are then presented with an overview of theverification result:

93
Wizards and functions
You can find the following information here:
This symbol indicates devices whose firmware can be updated with the selected firmwareversion. These devices are already ticked.
The following requirement is needed for this status:
The firmware version of the device is lower than the selected firmware version.
Details on this can be found in the Result column.
This symbol indicates devices whose firmware can be updated with the selected firmwareversion. The checkmark is not yet activated for this status as the update could have undesiredeffects under certain circumstances.
For this status you will receive a detailed explanation of the verification result. You should notactivate the checkmark until you have read this explanation and have been notified of thepossible effects of the update.
The firmware version of the device is identical to the selected firmware version.
The firmware version of the device could not be read and it is not certain whether it iscompatible with the selected firmware version. If you perform the update, it is possible thatthe device will reset to the factory firmware version.
For updates prior to version 1.10: The firmware version of the device could not be read butthe device version is compatible with the selected firmware version. It is possible that youmay not be able to re-use the device configurations following the update.
The firmware version of the device is higher than the selected firmware version. The updatewill downgrade the device firmware version to the lower version. The configurations will belost in this case, as only upwards compatibility is guaranteed.
Details on this can be found in the Result column.
This symbol indicates devices whose firmware cannot be updated with the selected firmwareversion. You cannot tick these devices.
The update may be blocked for the following reasons:
The selected firmware version is lower than the factory firmware for the device.
The selected firmware version is not compatible with the device version.
The selected firmware version is unknown.
The version of SmartUtility is too low.
The firmware version of the device is too low and cannot be updated in a single step. Youmust first update the device with a lower firmware version.
The firmware version of the device is version 1.10 or above. In this case, it is no longerpossible to import a lower version.
A communication error occurred.
Device login failed. You may have activated user management in SmartWeb.
Details on this can be found in the Result column.
Device name,IP address,Serial number
This information identifies the SmartCheck device for the line in question.
Result Here you can find detailed information on the verification result. This information tells you whythe firmware can - or cannot - be updated.
Step 4:
Click Next to send the firmware to the selected SmartCheck devices and wait until the process is fully completed.
The factory firmware is the firmware originally supplied with the device. The version of the newfirmware cannot be lower than the factory firmware version; updating in this case will not bepossible. The system reverts to the factory firmware if required, e.g. if the update fails.
Result:
After the firmware is updated, the FAG SmartCheck device is unavailable for a time, as a safety mechanism is being run.This mechanism ensures that your device is functioning properly again after the firmware update. The duration of

94
unavailability depends on the result of this check:
If your device with the new firmware is functioning properly, the SmartCheck device will be available again afterapprox. 6–7 minutes.
If this is not the case, the old firmware will automatically be reinstalled. It will then take approx. 20 minutes until thedevice is available again.
For updates to firmware versions before version 1.10, please empty the browser cache after theupdate. This is necessary to ensure that the latest version of the FAG SmartWeb software isloaded in your browser.
Checking the firmware version on the SmartCheck device
You can see which version of the firmware is set up on your FAG SmartWeb device in the SmartCheck software. To dothis, proceed as follows:
1. With the Open devices wizard, open the required SmartCheck device or the corresponding SmartWeb software.Alternatively, you can also enter the IP address of the SmartCheck device in a browser.
2. In the SmartWeb software menu bar, click on Help.
3. Select Version.
Here you can find detailed information on the version of the SmartCheck device, including the device ID and serialnumber.
5.9 Opening the log file directory
Click on More actions > Open log file directory to open the directory in which SmartUtility deposits the log files.Depending on the Windows version installed on your system, this directory is located by default under:
Windows 7:
C:\Users\[User name]\AppData\Roaming\Condition Monitoring
All software system messages and information on processes are recorded in the log files. You can open a log file with atext editor or word processor.
5.10 Opening the default directories
Click on More actions > Open default directory for data/Open default directory for configurations/Opendefault directory for report output to open the directory in which the SmartUtility software saves/searches fordownloaded data/configuration files. Depending on the Windows version installed on your system, these directories arelocated by default under:
Windows 7:C:\dataC:\configurationC:\reports
You can change the default directories in Settings > General or Settings > Report .
Make sure that the downloaded data is always saved to the default directory for data. If youwant to specify your own directory, make sure that all the data is available in this directory. Theanalysis of downloaded data in the Viewer software is only useful when a trend for all thecollected data can be created. To this end, it is necessary that all data is collected in the samedirectory.
5.11 Manage report templates
You can use the SmartUtility software to create reports in RTF format from the downloaded SmartCheck device data.The templates for these reports can be managed in the following locations within the SmartUtility software:
In the menu under More actions > Manage templates
In the menu under More actions > Settings > Report
15
108 112
81
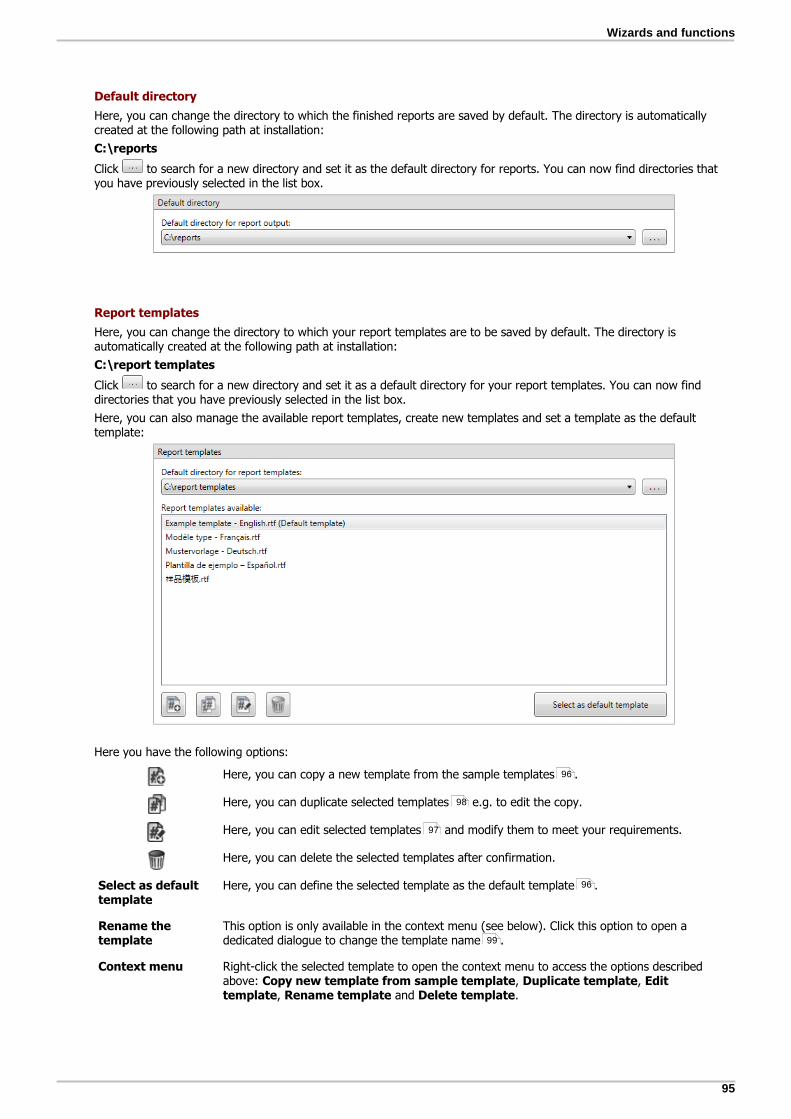
95
Wizards and functions
Default directory
Here, you can change the directory to which the finished reports are saved by default. The directory is automaticallycreated at the following path at installation:
C:\reports
Click to search for a new directory and set it as the default directory for reports. You can now find directories thatyou have previously selected in the list box.
Report templates
Here, you can change the directory to which your report templates are to be saved by default. The directory isautomatically created at the following path at installation:
C:\report templates
Click to search for a new directory and set it as a default directory for your report templates. You can now finddirectories that you have previously selected in the list box.
Here, you can also manage the available report templates, create new templates and set a template as the defaulttemplate:
Here you have the following options:
Here, you can copy a new template from the sample templates .
Here, you can duplicate selected templates e.g. to edit the copy.
Here, you can edit selected templates and modify them to meet your requirements.
Here, you can delete the selected templates after confirmation.
Select as defaulttemplate
Here, you can define the selected template as the default template .
Rename thetemplate
This option is only available in the context menu (see below). Click this option to open adedicated dialogue to change the template name .
Context menu Right-click the selected template to open the context menu to access the options describedabove: Copy new template from sample template, Duplicate template, Edittemplate, Rename template and Delete template.
96
98
97
96
99

96
The following hotkeys can also be used for the options described above:
Ctrl+S Select as default template
Ctrl+N Copy new template from sample template
Ctrl+D Duplicate template
Ctrl+E Edit template
F2 Rename template
DEL Delete template
5.11.1 Creating and editing report templates
The SmartUtility software creates reports on the basis of templates in RTF format. A sample template in every programlanguage is included in the scope of delivery. By default this can be found in the C:\report templates directory. Usingan editor and these sample templates as a basis, you can create new templates and directly edit all existingtemplates or first create a copy . You can also rename a template and define an existing template as thedefault template . Details about these actions can be found in the following sections.
Future versions of SmartUtility will contain new sample templates if required. If you want tocreate a new template or edit an existing one, you will be informed about new sample templates.You can stop receiving these messages with the option Do not show this message again.After reinstallation, the message will appear again.
If you rename or add templates in Windows Explorer, reload the template list to see the result. Todo this, reselect the directory for report templates:Open the list box and click the name of the directory:
Copy new template from sample template
This function can be found in the following location in the SmartUtility software:
In the Create report wizard, step 2
In the menu under More actions > Manage templates
In the menu under More actions > Settings > Report
Proceed as follows:
1. Click to open the window to select a sample template:
96
97 98 99
100

97
Wizards and functions
2. Select the sample template on which you want to base a new template.
3. Under Save template as, you must specify a name for the new template. By default, this is New report template- [language].
4. Click OK. The new template will be saved automatically in the default directory for report templates.
If you accidentally delete all templates in the template directory, you can use this function tocreate new templates. The sample templates in the various languages are embedded in theSmartUtility software and will still be available.
Edit template
This function can be found in the following location in the SmartUtility software:
In the Create report wizard, step 2
In the menu under More actions > Manage templates
In the menu under More actions > Settings > Report
Proceed as follows:
1. Select the template that you want to edit.
2. Click to open the template in the default editor for RTF files. In this example, this is MS Word:
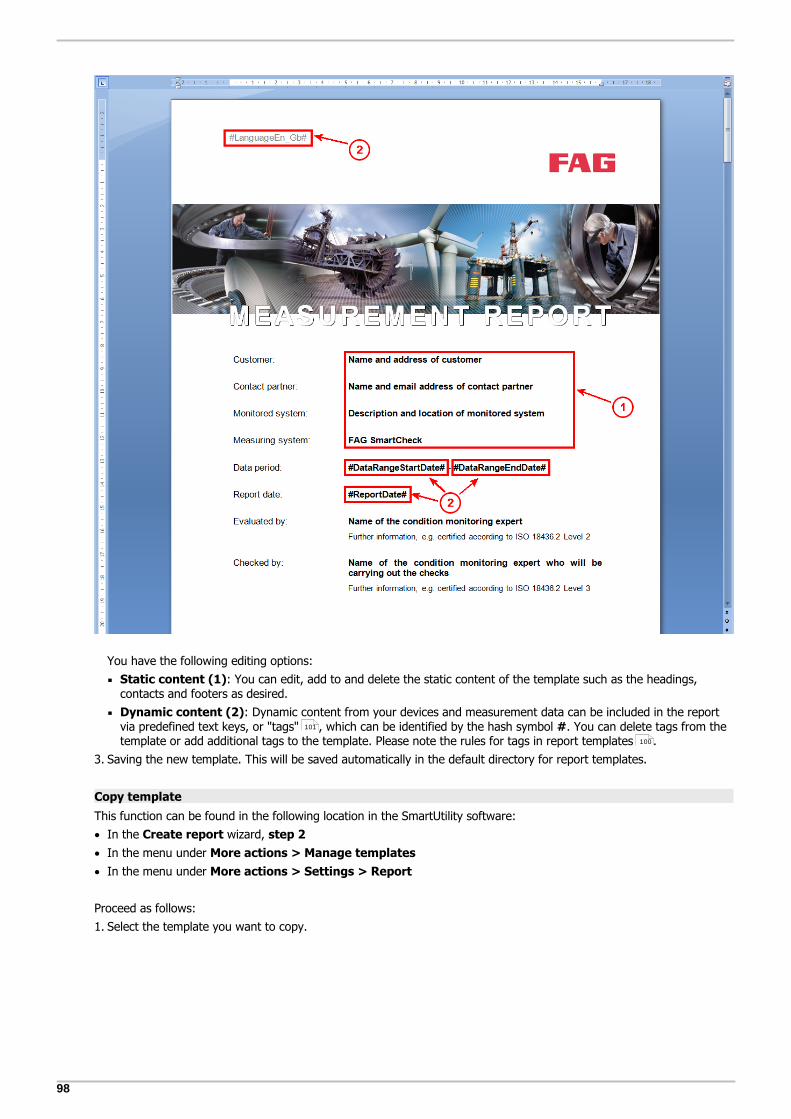
98
You have the following editing options:
Static content (1): You can edit, add to and delete the static content of the template such as the headings,contacts and footers as desired.
Dynamic content (2): Dynamic content from your devices and measurement data can be included in the reportvia predefined text keys, or "tags" , which can be identified by the hash symbol #. You can delete tags from thetemplate or add additional tags to the template. Please note the rules for tags in report templates .
3. Saving the new template. This will be saved automatically in the default directory for report templates.
Copy template
This function can be found in the following location in the SmartUtility software:
In the Create report wizard, step 2
In the menu under More actions > Manage templates
In the menu under More actions > Settings > Report
Proceed as follows:
1. Select the template you want to copy.
101
100

99
Wizards and functions
2. Click to create a copy of the template. The copy will appear in the list immediately. The name takes the followingformat: Copy of [name of the copied template]. The copy will be saved automatically in the default directory forreport templates.
Rename the template
This function can be found in the context menu of the template list in the following locations in the SmartUtility software:
In the Create report wizard, step 2
In the menu under Manage report templates
In the menu under More actions > Settings
Proceed as follows:
1. Select the template that you want to rename and right-click to open the context menu:
2. Select the Rename template option. The Rename template dialogue will open:
3. Enter the new name of the report template and click OK. The report template appears in the list with the new name:
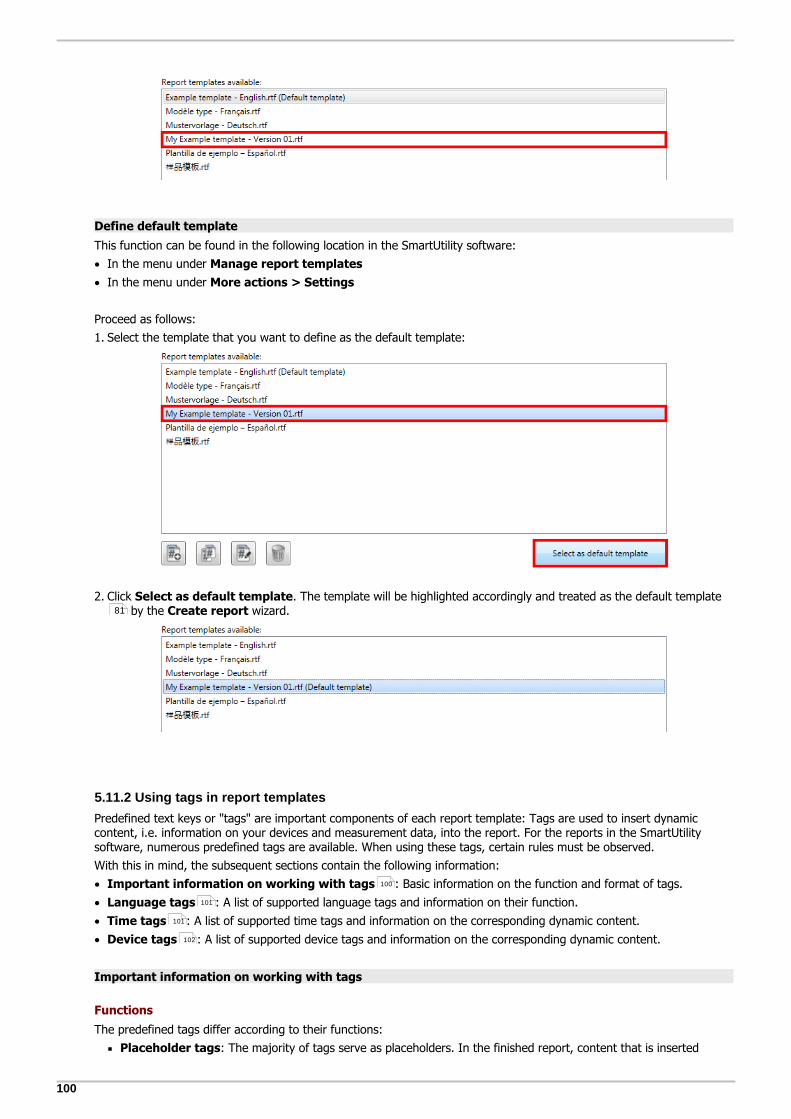
100
Define default template
This function can be found in the following location in the SmartUtility software:
In the menu under Manage report templates
In the menu under More actions > Settings
Proceed as follows:
1. Select the template that you want to define as the default template:
2. Click Select as default template. The template will be highlighted accordingly and treated as the default template by the Create report wizard.
5.11.2 Using tags in report templates
Predefined text keys or "tags" are important components of each report template: Tags are used to insert dynamiccontent, i.e. information on your devices and measurement data, into the report. For the reports in the SmartUtilitysoftware, numerous predefined tags are available. When using these tags, certain rules must be observed.
With this in mind, the subsequent sections contain the following information:
Important information on working with tags : Basic information on the function and format of tags.
Language tags : A list of supported language tags and information on their function.
Time tags : A list of supported time tags and information on the corresponding dynamic content.
Device tags : A list of supported device tags and information on the corresponding dynamic content.
Important information on working with tags
Functions
The predefined tags differ according to their functions:
Placeholder tags: The majority of tags serve as placeholders. In the finished report, content that is inserted
81
100
101
101
102
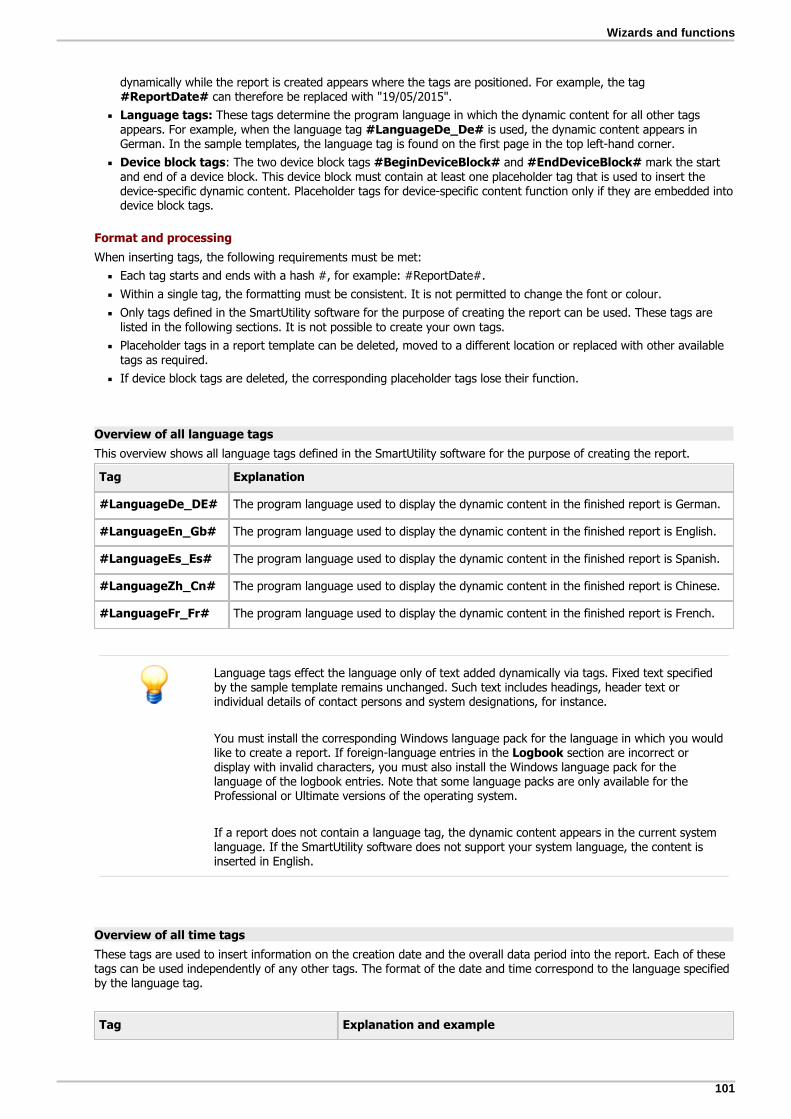
101
Wizards and functions
dynamically while the report is created appears where the tags are positioned. For example, the tag #ReportDate# can therefore be replaced with "19/05/2015".
Language tags: These tags determine the program language in which the dynamic content for all other tagsappears. For example, when the language tag #LanguageDe_De# is used, the dynamic content appears inGerman. In the sample templates, the language tag is found on the first page in the top left-hand corner.
Device block tags: The two device block tags #BeginDeviceBlock# and #EndDeviceBlock# mark the startand end of a device block. This device block must contain at least one placeholder tag that is used to insert thedevice-specific dynamic content. Placeholder tags for device-specific content function only if they are embedded intodevice block tags.
Format and processing
When inserting tags, the following requirements must be met:
Each tag starts and ends with a hash #, for example: #ReportDate#.
Within a single tag, the formatting must be consistent. It is not permitted to change the font or colour.
Only tags defined in the SmartUtility software for the purpose of creating the report can be used. These tags arelisted in the following sections. It is not possible to create your own tags.
Placeholder tags in a report template can be deleted, moved to a different location or replaced with other availabletags as required.
If device block tags are deleted, the corresponding placeholder tags lose their function.
Overview of all language tags
This overview shows all language tags defined in the SmartUtility software for the purpose of creating the report.
Tag Explanation
#LanguageDe_DE# The program language used to display the dynamic content in the finished report is German.
#LanguageEn_Gb# The program language used to display the dynamic content in the finished report is English.
#LanguageEs_Es# The program language used to display the dynamic content in the finished report is Spanish.
#LanguageZh_Cn# The program language used to display the dynamic content in the finished report is Chinese.
#LanguageFr_Fr# The program language used to display the dynamic content in the finished report is French.
Language tags effect the language only of text added dynamically via tags. Fixed text specifiedby the sample template remains unchanged. Such text includes headings, header text orindividual details of contact persons and system designations, for instance.
You must install the corresponding Windows language pack for the language in which you wouldlike to create a report. If foreign-language entries in the Logbook section are incorrect ordisplay with invalid characters, you must also install the Windows language pack for thelanguage of the logbook entries. Note that some language packs are only available for theProfessional or Ultimate versions of the operating system.
If a report does not contain a language tag, the dynamic content appears in the current systemlanguage. If the SmartUtility software does not support your system language, the content isinserted in English.
Overview of all time tags
These tags are used to insert information on the creation date and the overall data period into the report. Each of thesetags can be used independently of any other tags. The format of the date and time correspond to the language specifiedby the language tag.
Tag Explanation and example

102
#ReportDate# Date on which the report was created. 18/05/2015
#ReportTime# Local time at which the report wascreated.
13:45
#ReportTimeGmt# Local time at which the report wascreated. Brackets after the timecontain the difference to the standardtime zone GMT (Greenwich MeanTime).
13:45 (GMT +02:00)
#DataRangeStartDate# First day of the data period. The oldestdata to be included in the report datesback to this day.
18/02/2015
#DataRangeStartTime# Time at which the first data of the dataperiod was measured.
09:43
#DataRangeStartTimeGmt# Time at which the first data of the dataperiod was measured. Brackets afterthe time contain the difference to thestandard time zone GMT (GreenwichMean Time).
09:43 (GMT +02:00)
#DataRangeEndDate# Last day of the data period. The mostrecent data to be included in thereport dates back to this day.
18/05/2015
#DataRangeEndTime# Time at which the last data of the dataperiod was measured.
17:57
#DataRangeEndTimeGmt# Time at which the last data of the dataperiod was measured. Brackets afterthe time contain the difference to thestandard time zone GMT (GreenwichMean Time).
17:57 (GMT +02:00)
Overview of all device tags
The device tags are used to enter device-specific information into the report. All of these tags function only if they areembedded into a device block. The device block is defined by the tags #BeginDeviceBlock# (start of the block) and#EndDeviceBlock# (end of the block).
Tag Explanation and example
#BeginDeviceBlock##EndDeviceBlock#
Start (#BeginDeviceBlock#) and end (#EndDeviceBlock#) of a device block.Each of the following tags must be contained within a device block in order to bepopulated when the report is created.
#Counter# Numbering for each device within a device block 1
#DeviceName# Name of the device FAG SmartCheck
#DeviceSerial# Serial number of the device f4:3d:80:00:07:55
#DeviceIp# IP address of the device 172.28.205.60
#LastDataDownloadDate# Date and time of the last data download
This is the time at which data was downloaded fromthe device last. Regardless of the report period set,data that can be evaluated is available only up tothis time.
09/03/2015 13:35:43
#TableDeviceInfo# Table with the following information on the device:
Symbol for the overall alarm status

103
Wizards and functions
Name of the device
IP address
Serial number
Last data download
Firmware version
Example:
#ReportAlarmStatusCurrentDevice#
The alarm display in the trend report is based on the device status, which is alsodisplayed in the device table.
#ReportAlarmStatusLast# The alarm display in the trend report is based on the last measured value from theselected period.
#TableTrendReport# Table with detailed trend information:
Name of the device
Symbol for the alarm status of the configuration
Configuration name
Time of the first and last measurement
Trend diagram
Symbol for the overall alarm status
Example:
The trend diagram always covers the entire data period.This fact can lead to a loss of information within thediagram, especially if the overall data period is large.
Example scenario:
Date period: 3 months
Last alarm status of the device: Pre-alarm (datafrom 3 hours)
Trend diagram: The bar representing a period overseveral months is completely green. The yellow area forthe pre-alarm in the last 3 hours disappears/is no longervisible as a result of scaling.
#TableTrendReportShort# Table with a summary of the key trend information:
Symbol for the overall alarm status
Name of the device
Symbol for the alarm status of the configuration
Configuration name
Time of the last measurement
Example:

104
#TableLogbook# Table with logbook entries of the device
Example:
The alarm display in the trend report can be manipulated using the tags #ReportAlarmStatusLast# or #ReportAlarmStatusCurrentDevice#. If these tags arenot inserted, the #ReportAlarmStatusLast# setting is used by default: The alarm display isbased on the last measured value from the selected period.
5.12 Rescan data directory
This version of the FAG SmartUtility Viewer software includes the introduction of a new file format. Data in the previousfile format can no longer be loaded. This wizard enables you to convert data that has already been downloaded to thenew file format. This means that you can continue to open the data without having to download new data from the FAGSmartCheck device.
You can also use this wizard to convert measurement data into raw format for analysis. This may be necessary, forinstance, if you have activated the option Download raw data only in the Download data wizard.
To reimport the data directory, proceed as follows:
Step 1:
Select the directory in which the data is located. This may be the default directory or a directory you have selectedyourself. If you activate the Delete raw data following successful import? option, the data will be deleted after thewizard has completed successfully. If you do not delete the data, the system will try to scan the data again the nexttime. This will make the procedure take longer.
Step 2:
Select the required SmartCheck device that contains the data you want to reimport. You can also select multiple devices.A symbol in the Status column tells you whether data has already been converted to the required format. If you movethe mouse over the symbol , you will obtain more information about the conversion status.
108
19

105
Wizards and functions
Result:
The converted measurement data can be found in the directory you specified in Step 1, and can now be analysed withthe SmartUtility Viewer.
If the original data or alarm information is no longer available, this procedure will automaticallyreset the alarm status. The alarm status will be displayed again the next time you download datafrom the FAG SmartCheck device or update the measurement data for all devices in theSmartUtility Viewer software.
5.13 Export data
Use this wizard to export measurement data already downloaded to a different save location, to forward it, for example,for analysis.
To export measurement data, proceed as follows:
Step 1:
1. Select the directory containing the measurement data. This may be the default directory or a directory you haveselected yourself.
2. Select the required SmartCheck device or devices whose measurement data you want to export.
Step 2:
Next, determine the time range for which the measurement data is to be exported. You also specify the save location forthe data here.
108

106
Here you have the following options:
Time range This is where you determine the time range for which the measurement data is tobe exported:
Number of most recent measurement data sets for export permeasurement configuration: Only the most recent measurement records (i.e.the time signals) are exported. The trends are always exported in full.
Specify data from the selected time range: Only the measurement data forthe selected time period will be exported. If you activate this option, the defaultsetting is one day. You can enter the dates for your desired time range in the Fromand To fields or select the dates from the calendar.
Storage location Here you can determine the directory in which the exported measurement data is
to be saved. If the list box is empty, click on to select a directory and specifythis as the save location.
Step 3:
The data is exported and saved in the directory you specified in Step 2. Wait until the process is fully completed.
Result:
In the directory you specified in Step 2 you will find a full data directory with the exported measurement data.
5.14 Import SmartWeb data
In the SmartCheck device, if you use the Download measurement data option, you will receive the measurementdata in the format *.scd1. To be able to edit this measurement data with the SmartUtility software, you must import itinto the SmartUtility software with this wizard.
To import measurement data in the *.scd1 format, proceed as follows:
Step 1:
Select the directory to which the SmartWeb data is to be imported. This may be the default directory or a directoryyou have selected yourself.
Step 2:
108
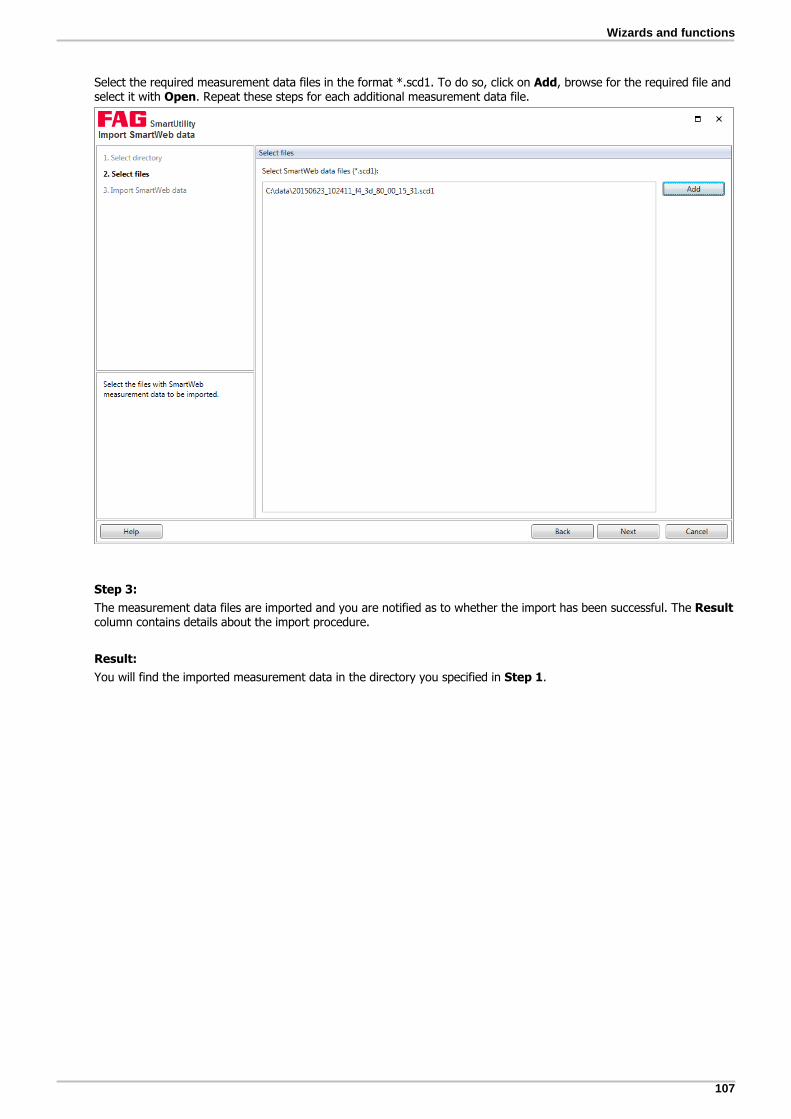
107
Wizards and functions
Select the required measurement data files in the format *.scd1. To do so, click on Add, browse for the required file andselect it with Open. Repeat these steps for each additional measurement data file.
Step 3:
The measurement data files are imported and you are notified as to whether the import has been successful. The Resultcolumn contains details about the import procedure.
Result:
You will find the imported measurement data in the directory you specified in Step 1.

108
6 Settings
Default settings can be found under More actions > Settings. You can use these settings to adapt the SmartUtilitysoftware to suit your requirements. Click on a term on the left in order to specify the settings in the area on the right.You must confirm all changes by clicking OK:
Here you have the following options:
General
Default directories
Here you can change the default directories. These are used by the SmartUtility software for downloaded data andconfiguration files and are automatically created during installation at the following path:
Windows 7:C:\dataC:\configuration
Click to search for a new directory and set it as a default directory. You can now find directories that you havepreviously selected in the list box.
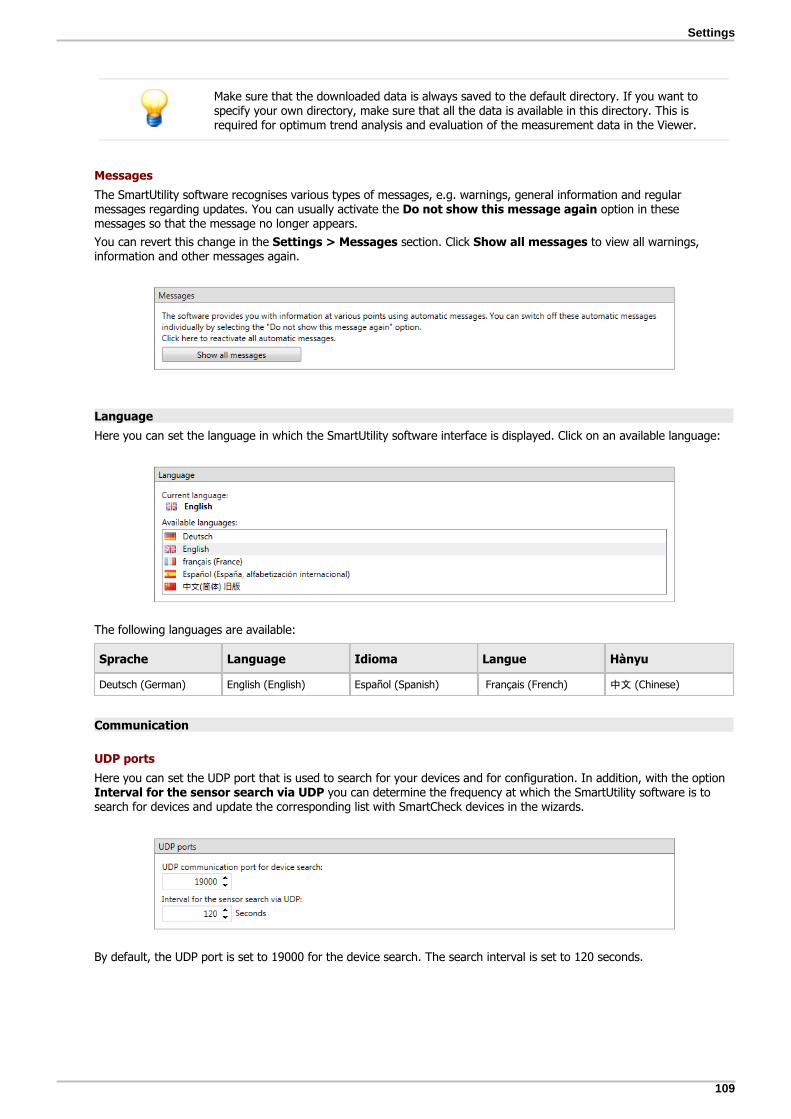
109
Settings
Make sure that the downloaded data is always saved to the default directory. If you want tospecify your own directory, make sure that all the data is available in this directory. This isrequired for optimum trend analysis and evaluation of the measurement data in the Viewer.
Messages
The SmartUtility software recognises various types of messages, e.g. warnings, general information and regularmessages regarding updates. You can usually activate the Do not show this message again option in thesemessages so that the message no longer appears.
You can revert this change in the Settings > Messages section. Click Show all messages to view all warnings,information and other messages again.
Language
Here you can set the language in which the SmartUtility software interface is displayed. Click on an available language:
The following languages are available:
Sprache Language Idioma Langue Hànyu
Deutsch (German) English (English) Español (Spanish) Français (French) (Chinese)
Communication
UDP ports
Here you can set the UDP port that is used to search for your devices and for configuration. In addition, with the option Interval for the sensor search via UDP you can determine the frequency at which the SmartUtility software is tosearch for devices and update the corresponding list with SmartCheck devices in the wizards.
By default, the UDP port is set to 19000 for the device search. The search interval is set to 120 seconds.
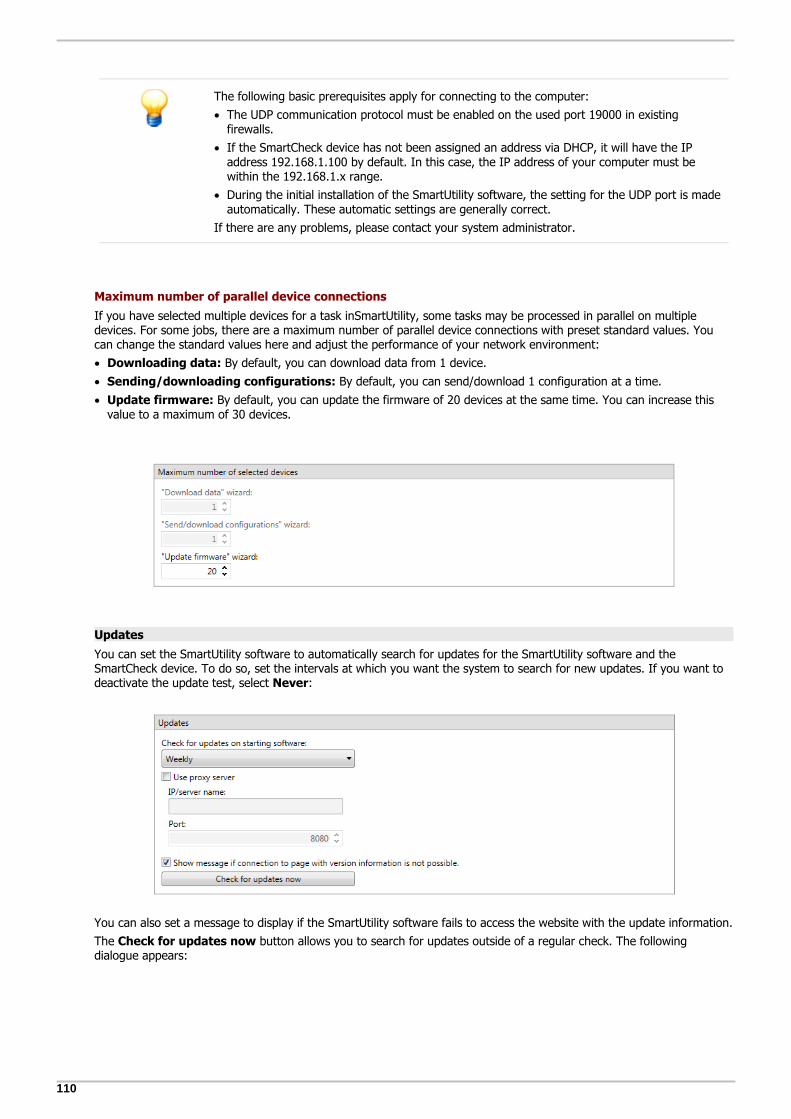
110
The following basic prerequisites apply for connecting to the computer:
The UDP communication protocol must be enabled on the used port 19000 in existingfirewalls.
If the SmartCheck device has not been assigned an address via DHCP, it will have the IPaddress 192.168.1.100 by default. In this case, the IP address of your computer must bewithin the 192.168.1.x range.
During the initial installation of the SmartUtility software, the setting for the UDP port is madeautomatically. These automatic settings are generally correct.
If there are any problems, please contact your system administrator.
Maximum number of parallel device connections
If you have selected multiple devices for a task inSmartUtility, some tasks may be processed in parallel on multipledevices. For some jobs, there are a maximum number of parallel device connections with preset standard values. Youcan change the standard values here and adjust the performance of your network environment:
Downloading data: By default, you can download data from 1 device.
Sending/downloading configurations: By default, you can send/download 1 configuration at a time.
Update firmware: By default, you can update the firmware of 20 devices at the same time. You can increase thisvalue to a maximum of 30 devices.
Updates
You can set the SmartUtility software to automatically search for updates for the SmartUtility software and theSmartCheck device. To do so, set the intervals at which you want the system to search for new updates. If you want todeactivate the update test, select Never:
You can also set a message to display if the SmartUtility software fails to access the website with the update information.
The Check for updates now button allows you to search for updates outside of a regular check. The followingdialogue appears:

111
Settings
The following information and functions are to be found here:
The first section of the dialogue contains information on whether any updates were found and where you candownload them.
The Updates section provides you once again with the selection list in which you can determine the frequency atwhich the system should search for updates.
If you are using a proxy server between the browser and the Internet in your company network,please activate Use proxy server and enter the address and port number of the proxy server.Please contact your system administrator for more detailed information about proxy settings.
User name/password
Here you can change the user name and password for every SmartCheck device that the SmartUtility software finds.Select the required device in the Select devices list. This list contains all the SmartCheck devices that have ever beendetected. The IP address is displayed if the device is available or has been added manually. Enter the user name andpassword, and then repeat the password to confirm:
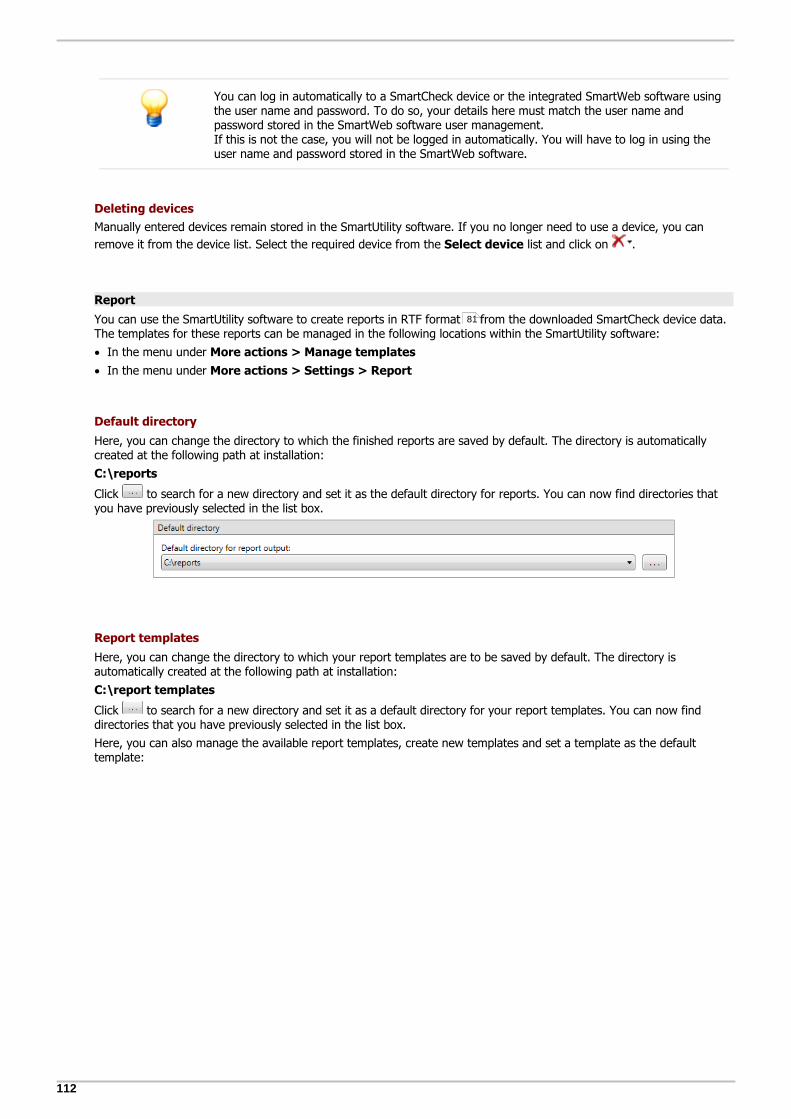
112
You can log in automatically to a SmartCheck device or the integrated SmartWeb software usingthe user name and password. To do so, your details here must match the user name andpassword stored in the SmartWeb software user management.If this is not the case, you will not be logged in automatically. You will have to log in using theuser name and password stored in the SmartWeb software.
Deleting devices
Manually entered devices remain stored in the SmartUtility software. If you no longer need to use a device, you can
remove it from the device list. Select the required device from the Select device list and click on .
Report
You can use the SmartUtility software to create reports in RTF format from the downloaded SmartCheck device data.The templates for these reports can be managed in the following locations within the SmartUtility software:
In the menu under More actions > Manage templates
In the menu under More actions > Settings > Report
Default directory
Here, you can change the directory to which the finished reports are saved by default. The directory is automaticallycreated at the following path at installation:
C:\reports
Click to search for a new directory and set it as the default directory for reports. You can now find directories thatyou have previously selected in the list box.
Report templates
Here, you can change the directory to which your report templates are to be saved by default. The directory isautomatically created at the following path at installation:
C:\report templates
Click to search for a new directory and set it as a default directory for your report templates. You can now finddirectories that you have previously selected in the list box.
Here, you can also manage the available report templates, create new templates and set a template as the defaulttemplate:
81
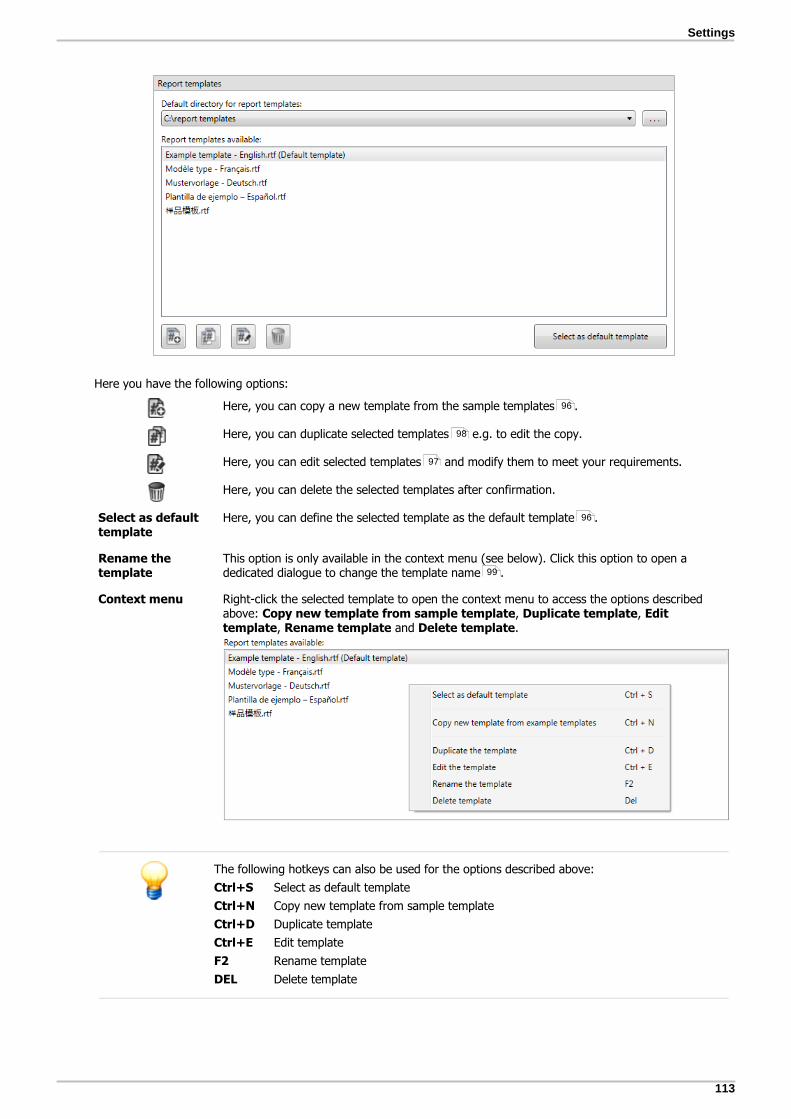
113
Settings
Here you have the following options:
Here, you can copy a new template from the sample templates .
Here, you can duplicate selected templates e.g. to edit the copy.
Here, you can edit selected templates and modify them to meet your requirements.
Here, you can delete the selected templates after confirmation.
Select as defaulttemplate
Here, you can define the selected template as the default template .
Rename thetemplate
This option is only available in the context menu (see below). Click this option to open adedicated dialogue to change the template name .
Context menu Right-click the selected template to open the context menu to access the options describedabove: Copy new template from sample template, Duplicate template, Edittemplate, Rename template and Delete template.
The following hotkeys can also be used for the options described above:
Ctrl+S Select as default template
Ctrl+N Copy new template from sample template
Ctrl+D Duplicate template
Ctrl+E Edit template
F2 Rename template
DEL Delete template
96
98
97
96
99

114
7 Further information
Information on support and the current program version can be found under More actions > Info:
Here you have the following options:
Version: Here you can view the current version of your SmartUtility software
Website: Click this link to switch to the Schaeffler Industrial Services website.
Email: Click this link to email a general query to Schaeffler Industrial Services.
System info: Click this button to switch directly to the System information page of your Windows system.
DirectX info: Click this button to switch directly to the DirectX diagnostic program.
Information and services relating to FAG SmartCheck
We offer a unique range of services for FAG SmartCheck — from training courses, technical mentoring during theinduction phase and expert support with diagnostic issues, right through to customised service agreements includingremote monitoring and reporting.
A selection of our comprehensive range of products and services for FAG SmartCheck can be found on the Internet at www.FAG-SmartCheck.com.

115
Manufacturer/support
8 Manufacturer/support
Manufacturer
FAG Industrial Services GmbH
Kaiserstraße 100
52134 Herzogenrath
Germany
Tel.: +49 (0) 2407 9149-66
Fax: +49 (0) 2407 9149-59
Support: +49 (0) 2407 9149-99
Website: www.schaeffler.com/services
Further information: www.FAG-SmartCheck.com
Contact: [email protected]
Please send all correspondence directly to FAG Industrial Services GmbH!
A subsidiary of
Schaeffler Technologies AG & Co. KG
PO Box 1260
97419 Schweinfurt
Germany
Georg-Schäfer-Straße 30
97421 Schweinfurt
Germany
Support
Tel.: +49 (0) 2407 9149 99
Email: [email protected]
We provide support services for the FAG SmartCheck device and related software products. A detailed description of thetype and scope of the support services we provide can be found online at www.FAG-SmartCheck.com.
