imprensa - 4t17 - novo modelo - inglês - 15 março...
TRANSCRIPT


DISCLAIMER—The presentation may contain forward-looking statements about future events within the meaning of Section 27A of the Securities Act of 1933, as amended, and Section 21E of the Securities Exchange Act of 1934, as amended, that are not based on historical facts and are not assurances of future results. Such forward-looking statements merely reflect the Company’s current views and estimates of future economic circumstances, industry conditions, company performance and financial results. Such terms as "anticipate", "believe", "expect", "forecast", "intend", "plan", "project", "seek", "should", along with similar or analogous expressions, are used to identify such forward-looking statements. Readers are cautioned that these statements are only projections and may differ materially from actual future results or events. Readers are referred to the documents filed by the Company with the SEC, specifically the Company’s most recent Annual Report on Form 20-F, which identify important risk factors that could cause actual results to differ from those contained in the forward-looking statements, including, among other things, risks relating to general economic and business conditions, including crude oil and other commodity prices, refining margins and prevailing exchange rates, uncertainties inherent in making estimates of our oil and gas reserves including recently discovered oil and gas reserves, international and Brazilian political, economic and social developments, receipt of governmental approvals and licenses and our ability to obtain financing.
We undertake no obligation to publicly update or revise any forward-looking statements, whether as a result of new information or future events or for any other reason. Figures for 2018 on are estimates or targets.
All forward-looking statements are expressly qualified in their entirety by this cautionary statement, and you should not place reliance on any forward-looking statement contained in this presentation.
In addition, this presentation also contains certain financial measures that are not recognized under Brazilian GAAP or IFRS. These measures do not have standardized meanings and may not be comparable to similarly-titled measures provided by other companies. We are providing these measures because we use them as a measure of company performance; they should not be considered in isolation or as a substitute for other financial measures that have been disclosed in accordance with Brazilian GAAP or IFRS.
NON-SEC COMPLIANT OIL AND GAS RESERVES:
CAUTIONARY STATEMENT FOR US INVESTORS
We present certain data in this presentation, such as oil and gas resources, that we are not permitted to present in documents filed with the United States Securities and Exchange Commission (SEC) under new Subpart 1200 to Regulation S-K because such terms do not qualify as proved, probable or possible reserves under Rule 4-10(a) of Regulation S-X.

• Main Deliveries
• Integrated Report
• Results Highlights
• Outlook 2018
• Operational Highlights
AGENDA—

5.11
3.54 3.24 3.23 3.163.67
2015 2016 1Q17 2Q17 3Q17 4Q17
NET DEBT/ADJUSTED EBITDA
3.20**
** Excluding the Class Action agreement
2.15
1.631.24 1.11 1.09 1.08
2015 2016 1Q17 2Q17 3Q17 4Q17
TOTAL RECORDABLE INJURIES – TRI*
* Total recordable injuries per million man-hour frequency rate
MAIN DELIVERIES—Top Metrics
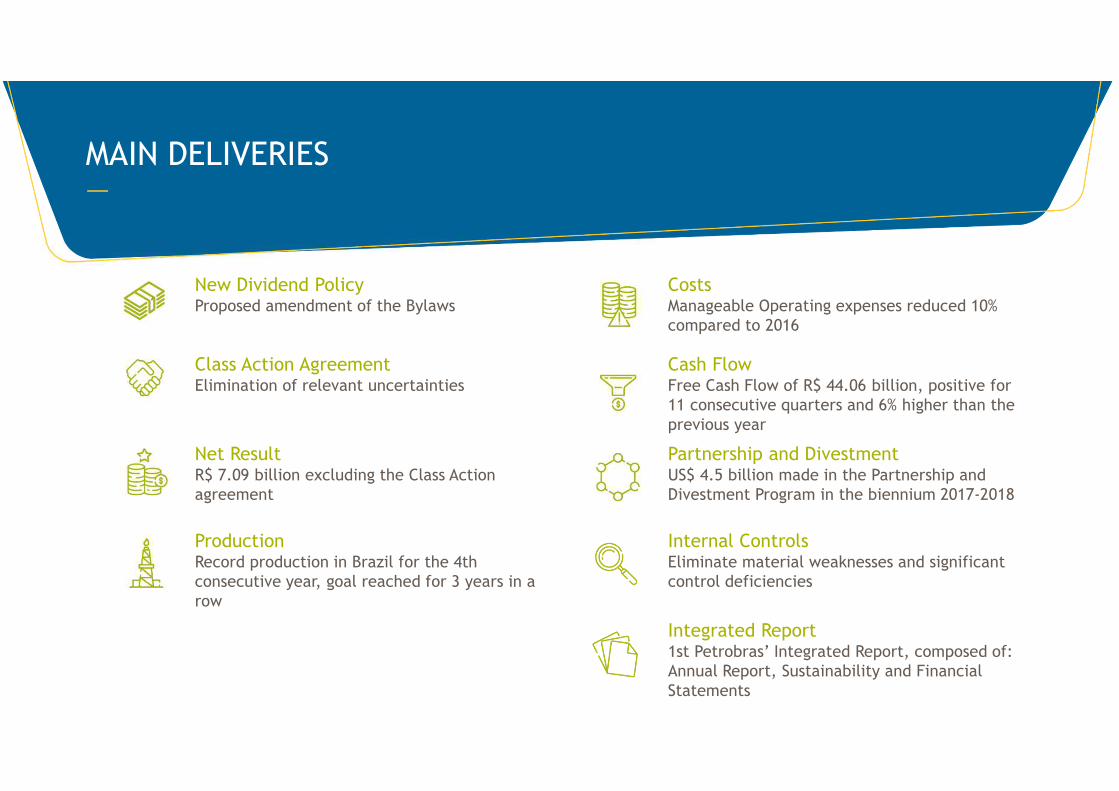
MAIN DELIVERIES—
New Dividend PolicyProposed amendment of the Bylaws
CostsManageable Operating expenses reduced 10% compared to 2016
Class Action AgreementElimination of relevant uncertainties
Cash FlowFree Cash Flow of R$ 44.06 billion, positive for 11 consecutive quarters and 6% higher than the previous year
Net ResultR$ 7.09 billion excluding the Class Action agreement
Partnership and DivestmentUS$ 4.5 billion made in the Partnership and Divestment Program in the biennium 2017-2018
ProductionRecord production in Brazil for the 4th consecutive year, goal reached for 3 years in a row
Internal ControlsEliminate material weaknesses and significant control deficiencies
Integrated Report1st Petrobras’ Integrated Report, composed of: Annual Report, Sustainability and Financial Statements

INTEGRATED REPORT 2017—
MATERIALITY MODELO DE NEGÓCIOS
6

INTEGRATED COMPANY WITH A SINGLE SYSTEM OF MANAGEMENT AND CONTROL—
EVOLUTION PANEL
7
Indicators
Initiatives
Indicatorsby process
Manageable Operating Costs
User Manual
Scorecards

HIGHER BRENT PRICES AND APRECIATION OF THE REAL—
BRENT (US$/bbl)
FX RATE(R$/US$)
US$ 54.3/bbl2017 average
3.192017 average
3.90
3.51
3.25 3.30 3.25 3.22 3.16 3.25
1Q16 2Q16 3Q16 4Q16 1Q17 2Q17 3Q17 4Q17
3446 46 49 54 50 52
61
1Q16 2Q16 3Q16 4Q16 1Q17 2Q17 3Q17 4Q17

-0.45 NET RESULTS
7.09NET RESULTS(excluding CLASS ACTION)
76.56 ADJUSTED EBITDA
87.76ADJUSTED EBITDA(excluding CLASS ACTION)
44.06 FREE CASH FLOW
FINANCIAL PERFORMANCE 2017—
(R$ billion)
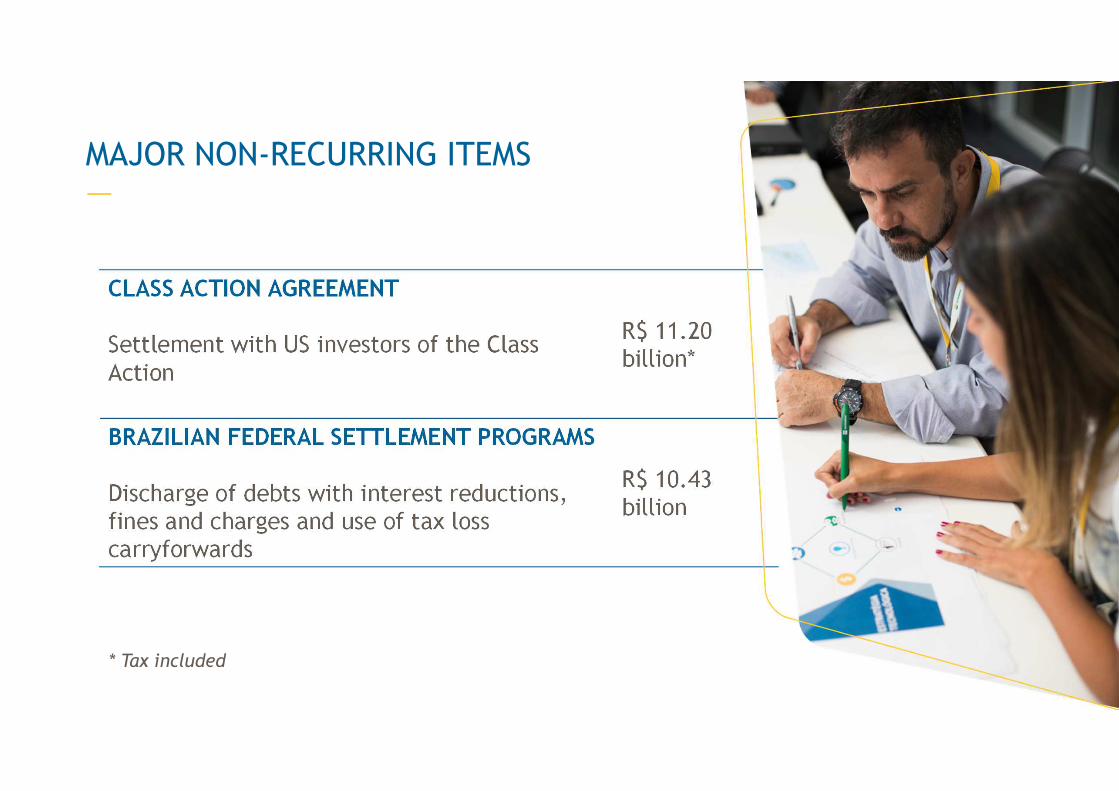
CLASS ACTION AGREEMENT
Settlement with US investors of the Class Action
R$ 11.20 billion*
BRAZILIAN FEDERAL SETTLEMENT PROGRAMS
Discharge of debts with interest reductions, fines and charges and use of tax loss carryforwards
R$ 10.43 billion
MAJOR NON-RECURRING ITEMS—
* Tax included

OPERATING INCOME SURPASS NET FINANCE INCOME—(R$ billion)
Operating Income
17.1
35.6
2016 2017
• Lower asset impairment
• Cost Reduction(personnel, write-offs of wells and equipmentidleness)
• Higher crude exports athigher prices
+108%
Net Finance Income reached R$ 31.6 billion in 2017

ADJUSTED EBITDA—
* Adjusted EBITDA excluding the Class Action agreement
Adjusted EBITDA evolution(R$ billion)
88.7
76.6
2016 2017
Petrobras
87.8*
53.665.3
2016 2017
Exploration and Production
47.5
28.6
2016 2017
Refining, Transportationand Marketing

POSITIVE FREE CASH FLOW—
Free Cash Flow* Interest
41.6 44.1
2016 2017
25.6 22.3
2016 2017
*Free Cash Flow to the Firm
(R$ billion)

CAPEX OPTIMIZATION—
• Efficiency gains in programmed shutdowns and well construction
• Re-planning investments in wells and platforms
• Payment of R$ 2.9 billion in signing bonus in 4Q2017
21.5
13.7 13.3
2015 2016 2017
CAPEX (US$ billion)
84% E&P

OPERATING EXEPENSES EVOLUTION—
15.913.8 14.5
2015 2016 2017
Sales Expenses
+5%between 2016 e 2017
78,47068,829
62,703
2015 2016 2017
Workforce
-19%between 2016 e 2017
93.087.0
78.4
2015 2016 2017
Manageable Operating Costs
-10%between 2016 e 2017
(R$ billion)
11.0 11.59.3
2015 2016 2017
General and Administrative
Expenses(R$ billion)
(R$ billion)
-9%between 2016 e 2017

DEBT REDUCTION—
DEBT (US$ billion)
126.2118.4 115.1
109.3100.4 96.4 95.0
84.9
2015 2016 1Q17 4Q17
Total Debt Net Debt
1Q17 4Q17
Average interest rate (% p.y.) 6.2 6.1
Average Duration (years) 7.61 8.62
Leverage (%) 54 51

EXPOSURE TO PUBLIC INSTITUTIONS—
17
Exposure - Public Institutions(USD MM)

2.66.5
9.813.1
18.5
11.88.2 8.1
6.1 5.2 6.3
1.2
2018 2019 2020 2021 2022 2023 2024 2025 2026 2027 2028 2029
Position as of 01/31/2018
LIABILITY MANAGEMENT—
AMORTIZATION SCHEDULE
24.1
Cash Position as of
01/31/2018
(US$ billion)
+ Revolving Credit Facility of US$ 4.35 billion in March 2018

REALIZATIONS COMPETITIVE PROCESSES
• 71 Onshore fields• 33 shallow water fields• 3 deep water fileds• Distribution in Paraguay• North/Northeast pipelines• Fertilizer Units• POG BV (Africa)• Pasadena Refinery• BSBios
STRATEGIC PARTNERSHIPS
PARTNERSHIPS AND DIVESTMENTS IN PROGRESS—Target maintained for 2017-2018
0.6
2.3
6.4
2.2
2015 2016 2017 2018
Cash in(US$ billion)
Received:
US$ 11.6 billion
To receive:
US$ 5.7 billion
19

DEBT REDUCTION
IMPROVEMENT IN CASH GENERATION
OF OPERATING ACTIVITIES
REALIZATIONS IN PARTNERSHIPS AND
DIVESTMENTS
OUTLOOK FOR 2018—
• Prodution of 2,7 MM boed
• Higher diesel and gasolinesales
• Continuous effort to reduce costs
• Meeting the US$ 21 billion target
• Several Ongoing projetcs
• Greater Market Interest
• Net Debt of US$ 77 billion at the end of 2018
• Active Liability management
IMPROVEMENT OF RESULTS
DIVIDENDS DISTRIBUTION
In case of Profit
• New dividend policy
• Quarterly distribution to be proposed at the Shareholders Meeting
20

OPERATIONAL HIGHLIGHTS—
21

9.67 9.75+0.36
+0.39
+0.25
-0.92
Variation in proved oil and natural gas reserves(Bi boe, SEC criteria)
RESERVE REPLACEMENT EXCEEDED THE PRODUCTION—
Higher oil prices
Incorporationof Pre-Salt
areas
Best response of
water injection in reservoirs
RESERVE REPLACEMENT RATIO
109%
Production
Maintenance of reserve / production index
R/P 10.5 years 10.6 years22

SELECTIVE ACQUISITION OF NEW EXPLORATORY AREAS—
Concession contracted
PSC contracted
PSC To Bid in 2018
PSC to bid in 2018 with expression of interest byPetrobras
Concessionto Bid in 2018
Uirapuru
Pre-salt polygon
Dois Irmãos
Três Marias
Entorno de Sapinhoá Peroba
Alto de Cabo Frio Central
Libra
Lula
Cessão Onerosa
Campos Basin
Santos Basin
Sector SC-AP3
2017
• Strategic partnerships
• Investment of R$ 2.9 billion in the acquisition of 10 new exploration blocks in 2017
• Expression of interest for three areas of the 4th Round of PSC
2018
• Beginning in 2018 of the seismic activities in the blocks acquired in 2017
• 17% increase in exploration area
PAR-T-175MS
SP
23

RECORDS FOR PRODUCTION AND GAS AVAILABILITY—
2,144 2,154
485 500
161 112 2,790 2,767
2016 2017
Oil and Natural gas production(thousand boed)
Exterior
Óleo e LGN Brasil
Gás NaturalBrasil
-0.8%
77.1 79.6
2016 2017
Natural gas production record in Brazil(Million m3)
+3.2%
Natural gasproduction
record : 96.5%
Oil production record in Brazil for the 4º yearin a row (thousand bpd)
1,931
2,034
2,128 2,144 2,154
2013 2014 2015 2016 2017
+5.3%
+4.6%+0.7% +0.5%
E&P SUSTAINED GROWTH HIGHER EFFICIENCY IN GAS AVAILABILITY PREVISIBILITY
24

OPEX REDUCTION IN E&P—
13.312.4
2016 2017
E&P Opex(US$ billion)
-6%in 2017
10.3 10.40.6
2016 2017
Lifting cost Brasil and abroad(US$/boe)
FX effect
Lifting costwithout FX effect
11.0
25

—
Lula and Cernambi
Concession
Two last platforms, P-67 andP-69, to be installed in 2018
Búzios
Cessão Onerosa
First oil in 2018, with P-74, which is on location
Mero
Partilha
The first unit, FPSO Guanabara,has been contracted
On location Under construction/ Under planning
ADVANCED STAGE IN THE DEVELOPMENT OF THE MAJOR PRE-SALT FIELDS—
26

LOWER RISK FOR THE NEW PRODUCTION SYSTEMS START-UP—
27
• P-74 on location: the FPSO arrived on Buzios Field and should
start-up in the first semester.
• Tartaruga Verde e Mestiça: under prepare for pre-mooring of
FPSO Campo dos Goytacazes on location.
• Advancement of FPSOs integration activities and pre-mooring:
units with production start-up forecasted for 2018.
• Mero and Sépia FPSOs contracted: units with production start-up
forecasted to 2021.
• Beggining on contracting process for chartering of production
systems for Parque das Baleias integrated Project and for the 2nd
Mero system: units with production start-up forecasted to 2021
and 2022, respectively.

LOWER OIL PRODUCTS SALES IN THE ACCUMULATEDCOMPARISON—
780 717
545 521
739702
2016 2017
Sales Volume(kbbl/day)*
Others
Gasoline
Diesel
2,0641,940
775 692
444 439
668 670
2016 2017
Oil Products Production(kbbl/day)*
Others
Gasoline
Diesel
1,887 1,800
94 96
2016 2017
Refining PlantsOperational Availability
(%)
92 93
2016 2017
Participation of domestic oil in the
processed feedstock(%)
*Includes BR Distribuidora

MARKET SHARE EVOLUTION—
96% 90% 83% 77%
2015 2016 2017 fev/18
Gasoline
97%83% 74% 79%
2015 2016 2017 fev/18
Diesel
Diesel Gasolina
JAN 2017
NOV 2017
FEV 2018
730 thousand
m³
320 thousand
m³
1560 thousand m³
300 thousand
m³
680 thousand
m³
360 thousand
m³
Third-party imports
29

EXPORTS OF 669 KBPD OF OIL AND OIL PRODUCTS IN 2017, A NET BALANCE OF 362 KBPD—
239
181
136
127
2016 2017
Imports(kbpd)
Oil Products Crude Oil
375
308
155 157
387
512
2016 2017
Exports(kbpd)
Oil Products Crude Oil
542
669
-84-24
385
Net Balance(kbpd)
Oil Products Crude Oil
167
361
2016 2017
251

NATURAL GAS SUPPLY AND DEMAND—
4453
28
24
45
2016 2017
Natural Gas Supply(MMm3/day)
LNG
Bolivia
Domestic
7683
17 17
24 29
3537
2016 2017
Natural gas Demand(MMm3/day)
Non Thermoeletric
Thermoeletric
System Gas
7683
*Includes BR Distribuidora

HIGHER THERMOELETRIC GENERATION—
2,252
3,165
20172016
Petrobras Thermoeletric Generation(Average MW)
Charge SIN(Average GW)
40 41 42 43 42 38
33 24
18 19 23
51 58 57 56 52
46 40
35 33 34
julmar apr octaug sepjan decmayfeb novjun
Reservoir Level SIN (%)
Hydrology SIN(%MLT)
Southeast Spot Price(R$/MWh)
65 66
2016 2017
85 76
2016 2017
320
107
20172016
2016
2017
