imports, productivity and global value chains: a … · imports, productivity and global value...
TRANSCRIPT
1
IMPORTS, PRODUCTIVITY AND GLOBAL VALUE CHAINS:
A EUROPEAN FIRM-LEVEL ANALYSIS
Mariarosaria Agostino (a), Anna Giunta (b)*, Domenico Scalera (c) and Francesco Trivieri (a) (a)University of Calabria, (b)Roma Tre University, (c)University of Sannio
ABSTRACT
The effect of importing on firms’ productivity has received adequate attention only recently, with the
massive expansion of trade in intermediate goods originated by the international dispersion of production.
We contribute to this literature by analyzing the relationship between imports of intermediate goods and
firms’ total factor productivity (TFP). Our econometric investigation, conducted on a sample of more
than 14,000 European industrial firms based on the 2010 EU-EFIGE survey, finds that: 1) importing in-
termediate goods is positively and significantly associated with TFP; 2) the productivity-enhancing effect
is amplified for the best performers, i.e. those with above-median TFP, and for exporters; and 3) a “tech-
nology transfer through imports” effect would appear to be at play, as firms gain more from importing
intermediate goods when they have greater absorptive capacity and when they source customized rather
than standardized inputs, and import intermediate goods from advanced rather than developing countries.
These results hold more forcefully for supplier firms, and especially the most capable ones, supporting
the hypothesis that participation in global value chains does exert a particularly significant impact on
supplier firms’ performance.
Keywords: Imports, Two-way Traders, Productivity, Firm Data, Global Value Chains
JEL:D22, F14, F61
* Corresponding author: [email protected] The authors wish to thank Francesco Aiello, Carlo Altomonte,
Emanuela Marrocu, Andrea Petrella, Stefano Usai, Davide Vannoni, the participants in the SASE Conference (LSE,
2-4 July, 2015) and the Workshop “Global Value Chains. Firms, Trade and Policy Implications” (Rossi-Doria Cen-
tre and Italian Trade Study Group, Roma Tre University, 10-11 December, 2015) for useful comments on a previous
version. Grateful acknowledgements are also due to Bruegel (www.bruegel.org) for making the EFIGE data set
available.

2
1. INTRODUCTION
Until a few years ago, scant attention was devoted to importing as a determinant of firms’ effi-
ciency, as incisively observed by Bernard et al. (2007: 123): ‘‘the empirical literature on firms in
international trade has been concerned almost exclusively with exporting, largely due to limita-
tions in data sets. As a result, the new theories of heterogeneous firms and trade were developed
to explain facts about firm export behavior and yield few predictions (if any) for firm import be-
havior”. This situation is now changing rapidly. The growing interest in the role of imports on
the part of researchers and policy makers stems especially from the development of global value
chains (GVCs), which in the last two decades have led to worldwide interconnection of indus-
tries.1 As is noted by De Backer and Miroudot (2014), more than half of world manufactures im-
ports now consist of inputs (materials, parts and components, and semi-finished products), and
over 70 percent of service imports are intermediate services.
In line with recent developments, this paper analyses the impact of imports of intermediate
goods on firms’ productivity.2 We employ micro-data from the 2010 EU-EFIGE Bruegel-
Unicredit survey, which gathers survey and balance-sheet information on a sample of more than
14,000 industrial firms larger than 10 employees, operating in seven European countries with
considerable involvement in GVCs: Austria, France, Germany, Hungary, Italy, Spain and the
United Kingdom.
The relationship between productivity and imports is a broad and complex one, as imports
may affect a firm’s productivity in a variety of ways. We accordingly consider several aspects of
that relationship, following the suggestions of the recent literature. To investigate the relationship
between productivity and imports of intermediate goods, we estimate several econometric speci-
1 It is also to take into account the availability of new datasets with firm-level information that permit closer inspec-
tion of firms’ import behavior and its determinants and effects (Castellani et al., 2010; Vogel and Wagner, 2010).
2 In the paper we use interchangeably inputs and intermediate goods.

3
fications in which exports and imports are explanatory variables for total factor productivity
(TFP). As imports and exports may be complementary, gains in productivity may also come
from being a two-way trader. So our regressions include interaction terms meant to single such
complementarities out. We also seek to determine whether the benefits of importing vary signifi-
cantly with the firm’s absorptive capacity (proxied by several variables such as: R&D activity;
workers involved in formal training programs; firms’ innovation propensity), source country (de-
veloped or developing), and specific features of the intermediate goods (customized or standard-
ized). Finally, we also implement a quantile regression to allow for the possibly heterogeneous
impact of our explanatory variables on productivity, depending on firms’ ranking in the TFP
measure.
Notably, our analysis also distinguishes between firms’ different status within GVCs, in order
to appreciate “the sequential and back-and-forth aspect of global linkages” (Baldwin and Yan,
2014). To this end, we not only distinguish firms that only export or only import from two-way
traders, we also focus on “supplier firms”, i.e. firms selling 100% of their output to other firms.
Indeed, the status of supplier, more than any other, highlights the true essence of specialization
and participation in the international division of labor.3
We contribute to the literature in at least three ways. First, we advance the strand of literature
on a still under-researched area, namely the impact of intermediate goods imports on firms’ TFP
and some of its likely channels.
3 The effects of the participation of firms and countries in international production networks and more specifically in
GVCs have given rise to a substantial body of literature. The main topics, in particular, have been the benefits of and
requirements for GVC membership (Agostino et al., 2015; Amador and di Mauro, 2015; Antras and Chor, 2013;
Giovannetti et al., 2015; Giunta et al., 2012), the importance of the model of chain governance (Humphrey and
Schmitz, 2001; Gereffi et al., 2005; Gereffi and Fernandez-Stark, 2011), and the position of firms and countries along
the chain (Amador et al., 2015; Benkovskis and Worz, 2015; De Backer and Miroudot, 2014; Koopman et al., 2011).

4
Second, although it is widely recognized that trade in intermediate goods is a direct conse-
quence of the international dispersion of production, there is still little empirical work on the spe-
cific behavior and performance of supplier firms, which produce for outsourcers and so are com-
plementary to international production in global networks (Giunta et al., 2010). In our economet-
ric investigations we consider supplier firms with specific regressions. Ours is one of a few pa-
pers that explicitly consider this typology of firms in investigating the effect of imports on TFP.
In some countries, supplier firms make up the bulk of the industrial structure; Italy is a case in
point. Suppliers are often seen as suffering from comparatively low productivity (subcontracting
discount) (Razzolini and Vannoni, 2011), even though some researchers have noted their hetero-
geneous behavior and performance (Accetturo et al., 2011, Agostino et al., 2015).
Third, we seek to fill the gap between the macro-level knowledge of European countries’
GVC participation and the paucity of firm-level work on behavior and performance in GVCs,
which has been the subject of only a handful of studies (among them: Agostino et al., 2015; Bar-
ba Navaretti et al., 2011; Békés et al., 2011; Del Prete et al., 2015; Giovannetti et al., 2015;
Veugelers, 2013). In fact, while we know that the European countries in our sample are heavily
involved in the international dispersion of production (De Backer and Miroudot, 2014), as meas-
ured by the GVC participation index,4 our information on the profitability, for firms, of joining
GVCs is scanty.
We obtain three main results: 1) In accordance with the literature, we find that imports are
positively and significantly correlated with firms’ TFP, which suggests a learning-by-importing
effect. This result holds both for the whole sample and for the subsample of suppliers, indicating
4 The participation index (Koopman et al., 2011) is expressed as a percentage of gross exports and indicates the share
of foreign inputs in exports (backward participation) and domestically produced inputs used in third countries’ ex-
ports (forward participation). Among our seven countries, Hungary shows the highest backward participation (40%
of gross exports), followed by Austria (around 30%), Germany (around 25%), France (20%), Spain (20%), and Italy
(20%); the United Kingdom exhibits the lowest backward participation index (around 15%).
5
that the latter may improve their performance when they in turn source foreign inputs. 2) The
foregoing potential effect tends to be amplified for the best performers, especially in the subsam-
ple of suppliers. 3) As to the channels through which imports enhance productivity, we find that
the impact is stronger when the firms source more from developed countries, when they have a
higher share of workers in training programs, when sales of innovative products are higher, and
when investment in R&D is greater. We interpret all this as evidence that imports improve TFP
to the extent that firms have the capacity to absorb the technology embodied in the imported in-
puts. Our results hold also for suppliers: those with high absorptive capacity may achieve the best
performances and fully exploit the opportunities offered by the international dispersion of pro-
duction.
The paper is organized as follows. Section 2 briefly reviews the literature. Section 3 presents
the data (3.1), the econometric methodology (3.2) and some descriptive statistics (3.3). Section 4
reports the main econometric results. In particular, 4.1 gives the benchmark results, 4.2 focuses
on the technological content of imported intermediate goods, 4.3 deals with endogeneity and 4.4
with firm heterogeneity. Sub-section 4.5 is devoted specifically to the subsample of suppliers.
Section 5 concludes.
2. THE RELATED LITERATURE
The recent surge of interest in imports of intermediate goods is generally explained by the inter-
national dispersion of production that has taken place in the last two decades, which has led a
larger share of firms to engage in international trade in intermediates. As De Backer and
Miroudot (2014) note, the interconnectedness of industries worldwide means that today more
than half the world’s manufactured imports are intermediate goods (materials, parts and compo-
nents, and semi-finished products). This development carries extremely important macro- and
microeconomic consequences.
6
From the macroeconomic perspective, the role of foreign inputs in spurring economic growth
was first stressed by the literature on endogenous growth (Romer, 1987). On the other hand, the
literature on trade in value added has shown that improving access to imports stimulates a coun-
try’s exports and even guarantees “an export premium associated with good connectivity to the
sources of value added” (Santoni and Taglioni, 2015:71). At the same time, concerns have been
voiced over the repercussions of imported intermediate goods on domestic jobs and inequality
(OECD, 2010), while several authors (Alessandria et al., 2011; Altomonte et al., 2012a; Accettu-
ro and Giunta, 2016) have highlighted the role of intermediate goods in the transmission of
shocks in the crisis of 2008-09, provoking the “great trade collapse”. In particular, it is argued
that large inventories of imported goods enabled firms to continue production, thus reducing de-
mand for the output of upstream exporters.
The microeconomic impact for firms is also noteworthy. A growing body of empirical work
has documented a positive relationship between firms’ importing activity and productivity (Fer-
nandes, 2007; Kasahara and Rodrigue, 2004; Vogel and Wagner, 2010; Wagner, 2012): there is a
significant productivity gap between the firms that import and those that do not. The discussion
focuses on three issues: i) the direction of causality between intermediate goods imports and firm
performance; ii) complementarities between exporting and importing (two-way trading); and iii)
the channels through which importing may enhance productivity.
Direction of causality
On the first issue, we have two contrasting, yet not mutually exclusive, hypotheses. The first is
that, as regards exports (Bernard and Jensen, 1999; Roberts and Tybout, 1997), the sunk costs of
international operation may cause self-selection of the more productive firms into importing
(Andersson et al., 2008; Castellani et al., 2008; Kasahara and Lapham, 2008). So far, this hy-
pothesis has found only limited empirical support (Kraay et al., 2002; Kasahara and Lapham,
2008; Kugler and Verhoogen, 2008; Vogel and Wagner, 2010). The second hypothesis (Clerides

7
et al., 1998) is that it is also likely that once a firm is engaged in importing, its productivity will
be increased thanks to “learning-by-importing” (Altomonte and Békés, 2009; Andersson et al.,
2008; Augier et al., 2013; Halpern et al., 2011; Muuls and Pisu, 2007). Such an effect is con-
firmed by a number of empirical studies (Altomonte and Békés, 2009; Augier et al., 2013; Bald-
win and Yan, 2014; Bas and Strauss-Kahn, 2014; Halpern et al., 2011; Kasahara and Rodrigue,
2008).
Complementarities between exports and imports
Concerning complementarities, many contributions have discussed why two-way international
trade might be more profitable than importing or exporting alone (Aristei et al., 2013; Bernard et
al., 2007; Muulsand Pisu, 2009; Díaz-Mora et al., 2015). In the view of some (Kasahara and
Lapham, 2008), one explanation could be sunk cost complementarity, whereby starting up either
form of international business (exporting or importing) is less costly when the firm is already en-
gaged in the other. This happens, for example, when firms acquire information on foreign mar-
kets about both potential buyers and suppliers of intermediate goods , or, say, about customs pro-
cedures, incurring sunk costs that are common to both types of trade. Alternatively, there may be
other interactions where imports boost a firm’s efficiency, making it more competitive on the ex-
port side; or else exporting may enable firms to bear the sunk costs of importing or prompt them
to source high-quality foreign intermediates, bringing out new products or improving product
quality. Bas and Strauss-Kahn (2014) emphasize that highly productive firms with broadly diver-
sified imported inputs also tend to be major exporters, thanks to complementarity and technology
transfer. The empirical literature has generally confirmed these hypotheses, showing that two-
way traders, i.e. firms that both import and export, usually perform better (Serti and Tomasi,
2008; Castellani et al., 2010; Conti et al., 2014).

8
The channels
The most commonly postulated channels through which imports enable firms to achieve dynamic
positive externalities are: a) cost saving, b) technology transfer or input quality improvement, and
c) complementarity with domestic inputs.
Lowering production costs is the most obvious motivation for importing cheaper intermediate
goods. Channel (a) creates the capability to produce the same amount of output at a lower cost,
enabling firms to increase efficiency and TFP and raise profits.
Second (channel b), firms may find importing profitable, because embedded advanced tech-
nologies can be a vehicle of knowledge transfer (Andersson et al., 2008; Blalock and Veloso,
2007; Castellani et al., 2008; Bas and Strauss-Kahn, 2014) and/or because importing high-quality
intermediates gives the firm the chance to export higher quality goods at higher prices (Kugler
and Verhoogen, 2008). Yet when productivity gains are achieved via the technology transfer
channel, the impact on productivity is likely to vary from firm to firm, according to their specific
absorptive capacity. In fact, to integrate imported inputs into the production process, particularly
with knowledge-intensive or high-quality intermediates, firms need adequate capabilities. On
this, Augier et al. (2013), using a dataset on Spanish firms, find that a higher degree of absorptive
capacity – proxied by skill intensity – significantly enhances the productivity gain from import-
ing intermediate goods.
More generally, the interpretation suggested by channel (c) is that complementarities between
domestic and foreign inputs can help explain why importing intermediates is associated with
higher productivity. Essentially, by accessing a greater variety of inputs, firms achieve a broad
complementarity among them, which in turn enhances productivity. This “love of variety” mech-
anism has been sustained by empirical evidence for French firms (Bas and Strauss-Kahn, 2014)
and for a panel of Hungarian firms (Halpern et al., 2011).
9
3. DATA, METHODS AND DESCRIPTIVE STATISTICS
3.1 The data
We use microdata from the EU-EFIGE Bruegel-UniCredit dataset, provided by Bruegel, a Bel-
gian non-profit international association. The dataset contains both survey and balance-sheet in-
formation on 14,759 firms with more than 10 employees operating in seven European countries:
Austria, France, Germany, Hungary, Italy, Spain and the United Kingdom.5 Although the quali-
tative and quantitative data from the EFIGE survey, conducted in 2010, refer mostly to 2007-
2009, almost all the variables factored into our econometric model (see sub-section 3.2 and Table
1) are available for 2008 only. After eliminating potential outliers (we discard the observations
outside the range 0-100 for all the ratios in Table 1, as well as any negative values of firm age),
we have a final sample of 14,168 firms: 418 for Austria, 2,874 for France, 2,852 for Germany,
467 for Hungary, 2,814 for Italy, 2,692 for Spain, and 2,051 for the UK.
3.2 Empirical model and methodology
To test whether importing intermediate goods affects firms’ productivity, we estimate the follow-
ing model:
���� = �� + ���� + �� ��� + ���� �� + ���� � + ������� + ������� ++ ����&�� + + ������� + ��������� + � (1)
where the dependent variable is the firm’s total factor productivity (TFP) provided, in log terms,
by the EFIGE Bruegel-Unicredit dataset.6 On the right-hand side: IMP is imported intermediate
5 For more detailed information on the EU-EFIGE dataset, see http://bruegel.org/2012/10/the-eu-efigebruegel-
unicredit-dataset/
6 For a discussion on the method used to estimate TFP in the EFIGE dataset, see Altomonte et al., 2012b and Al-
tomonte et al., 2013.

10
goods; EXP is the ratio of exports to total sales;7 SMES is a size dummy coded 1 for small and
medium-sized firms (under 250 employees); AGE is the (log of) firm age; TRAIN is the share of
the firm’s employees involved in formal training programs; DINNO and DR&D are dummies re-
spectively equal to 1 if firms carried out product/process innovation or research activities in the
years 2007-2009; SUPP is the share of the firm’s sales accounted for by made-to-order goods;
and DGROUP a group dummy coded 1 if the firm belongs to a (national or foreign) group. Final-
ly, country and industry dummies are included among the controls.8 In a few specifications, a
dummy equal to 1 if the firm imports services from abroad (DSERV) is also considered as an ex-
planatory variable.
As a second step, we test the hypothesis that two-way traders achieve better productivity per-
formance than firms that operate as importers or exporters only. To this purpose, we include the
interaction variable IMP*EXP in the set of regressors.
We also inquire into how the technological content or quality of the intermediate goods af-
fects TFP, by a variety of techniques. First, we test the hypothesis that imported intermediate
goods impact differently on TFP depending on the firm’s absorptive capacity. We check whether
skill intensity (proxied by the percentage of employees involved in formal training programs,
TRAIN), propensity to innovate (proxied by the share of sales accounted for by innovative prod-
ucts, TINNO) and R&D activity (in particular, the share of sales revenue invested in research ac-
tivity, R&D) enhance the TFP benefit from importing intermediate goods , by building up inter-
action terms IMP*TRAIN, IMP*TINNO and IMP*R&D. Second, to test the conjecture that the
7 We also estimate a different specification of equation (1) by using the dummies DIMP and DEXP, respectively
equal to 1 if the firm acquires intermediate goods from abroad or if it exports. Using dummies instead of continuous
variables is motivated by the larger numbers of observations available for DIMP and DEXP.
8 To preserve the anonymity of the firms surveyed, the EFIGE dataset provides information on industrial sectors in
the form of a randomised identifier ranking from 1 to 11, these values not mapping “any particular ordering of the
original data” (Altomonte and Aquilante 2012, p. 18).

11
higher quality embedded in customized rather standardized inputs might affect TFP, we modify
equation (1) by introducing the dummy TECON coded 0 for only standardized and 1 for only
customized intermediate imports. Third, assuming as in Bas and Strauss-Kahn (2014) and
Smeets and Warzynski (2013) that imports from developed countries have higher technological
content, we also insert a variable AREA, coded 0 for purchases from developing countries and 1
for developed countries (the EU, U.S. and Canada).9 Finally, considering the interaction
TECON*AREA, we can assess the differential impact of importing customized intermediate
goods, according to the country of origin.
In addition, to allow for heterogeneous impacts of our explanatory variables on productivity,10
depending on where firms are located in the distribution of the TFP measure, we run a quantile
regression. This technique has been used in a number of fields thanks to its flexibility (see
Chamberlain, 1994; Bedi and Edwards, 2002; Manning et al., 1995; Cade et al., 1999; Barba
Navaretti et al., 2014). It not only overcomes some of the limitations of conditional mean model-
ling – such as sensitiveness to outliers, and the assumptions of normality and homoscedasticity –
but also permits a deeper understanding of the phenomenon under investigation. In fact, by mod-
elling several quantiles, one can inspect the relationship under study in different strata of the re-
sponse variable or focus on the lower and upper tails rather than the center of a distribution. Fi-
nally, one can interpret a quantile-estimated coefficient like an OLS parameter. Where the latter
represents the marginal effect of an explanatory variable on the conditional mean of the depend-
ent variable, a quantile regression coefficient stands for the marginal effect on a given segment
(quantile) of a distribution, ceteris paribus (for a detailed illustration of the quantile regression
9 We distinguish between developing and developed countries on the basis of the following survey question: From
which of the following areas the firm has purchased intermediate goods in 2008?, the options being: EU countries;
other European countries (e.g. Switzerland, Norway, Russia, Turkey); China and India; other Asian countries; United
States and Canada; Central and South America; other areas.
10 On the heterogeneity of European firms in productivity, see Aiello and Ricotta (2016) on the same EFIGE dataset.

12
approach, see Koenker, 2001 and 2005). To test the significance of the quantile coefficients, re-
searchers may opt for either the asymptotic or the bootstrap method. Whereas the former requires
strong parametric assumptions (Koenker, 1994), the bootstrap procedure is more flexible and,
more importantly for our analysis, permits testing the equivalence of the coefficients across the
various quantiles.11
3.3 Descriptive statistics
Table 1 describes the variables used in this and the next section, with their summary statistics.
[TABLE 1]
Table 2 offers a preliminary view of firms’ sourcing strategies, with some descriptive statistics
on firms that engage in domestic sourcing, international sourcing of standard and customized in-
puts, and sourcing from developed and developing countries. A total of 8,343 firms, 59% of our
sample, do not purchase inputs from abroad (column 1). By comparison with those that do im-
port (column 2), the non-importers are on average much smaller (67 as against 255 employees),
less export-intensive (13% of sales against 26%), less innovative (59% undertaking process and
product innovation, as against over 74%), and less likely to belong to a group (16% as against
31%). In particular, the greatest differences are found between firms with only domestic sourcing
(column 1) and those that source customized inputs abroad (column 4).The latter are more often
exporters (intensive margin around 31%) and service importers (22% vs. 17%), and more com-
monly conduct innovative activities and training programs. A comparison between importers of
11 The bootstrap method (Efron, 1979) dispenses with assumptions on the distribution of the response variable. It
consists in extracting – with replacements – a large number of sub-samples (of size n) from the observed sample.
These resamples are randomly different from the original sample and are used to get parameter estimates, as well as
variance and covariance estimates. In particular, the covariance matrix also provides the covariance of the estimated
coefficients of the same regressor across distinct quantiles, so one can verify the equivalence of the marginal effect of
a covariate at different quantiles.
13
standardized with those of customized intermediates (columns 3 and 4) produces analogous con-
clusions. The latter are more open, more innovative and training-oriented. Finally, the striking
feature of firms that source from developed countries (column 6) is their high percentage of out-
put-to-order in total sales, which suggests that this group includes a large number of suppliers.
[TABLE 2]
4. RESULTS
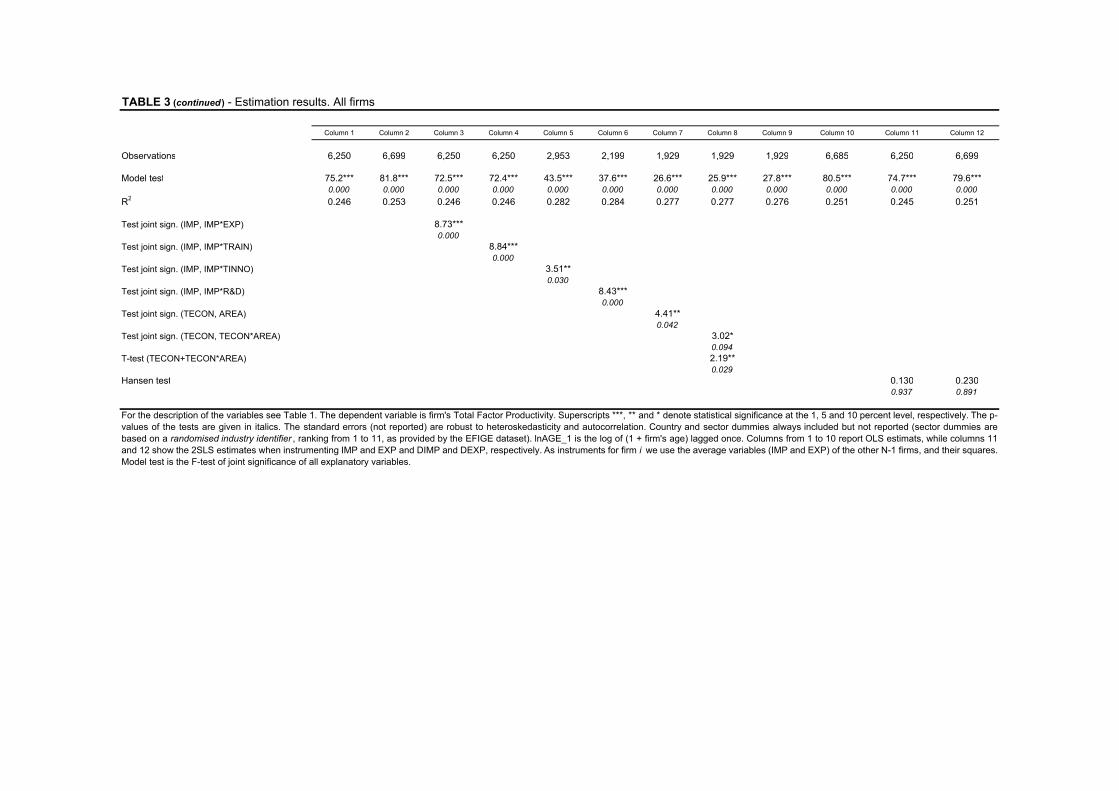
Table 3 summarizes our main estimation results, each column referring to a different specifica-
tion of equation (1). Consistent with the foregoing description, we distinguish five main sets of
results.
4.1 Benchmark results: imports, exports and two-way trade effects
Our benchmark specification, reported in column (1), employs continuous variables IMP and
EXP. Column (2) replaces these with the corresponding dummies DIMP and DEXP, and also in-
cludes the dummy DSERV (service imports) among the regressors.12 Column (3) introduces
IMP*EXP to investigate possible differential effects of imports on productivity, conditional on
firms’ ability to export (i.e. the two-way trade effect).
[TABLE 3]
In these first three specifications, all the control variables are statistically significant at the 5%
level except DINNO (innovation). The signs of the coefficients are always as expected: like most
of the literature, we find that older and larger firms and those conducting R&D and training pro-
12 A number of papers have considered the role of international trade in services (for example Conti et al., 2010, and
Federico and Tosti, 2012). We do not investigate this specific aspect, because our dataset offers little relevant infor-
mation: only 1,380 firms report the share of total services accounted for by imports (Table 1), which is why we do
not include the continuous variable SERV in the regressions.

14
grams are, on average, more productive.13 As to our “supplier” variable (SUPP), we confirm the
findings of the previous literature (Razzolini and Vannoni, 2011; Giunta et al., 2012) that on av-
erage suppliers suffer a productivity gap. However, although statistically significant, this effect is
small: a change in status from supplier (100% of sales are produced to order) to final firm (no
sales produced to order) results in a rise of only 4% in the TFP index. Group membership also
appears to affect TFP significantly. As is well known, research on the effects of group member-
ship has not produced unequivocal conclusions. The positive impact on performance in terms of
cost savings in procuring additional resources (Scalera and Zazzaro, 2011) and the observed ad-
vantages resulting from internal trade relationships and inter-firm division of labor (Estrin et al.,
2009) contrast with the adverse effects of agency and coordination problems, causing inefficien-
cy and the expropriation of wealth from minority shareholders (Morcket al., 2005). In our case,
the estimates suggest that the benefits outweigh the disadvantages.
Turning to our key variables, we can address the core issue, namely the relationship between
productivity and imports. Table 3, columns 1-3, shows that importing inputs and services from
abroad exerts a significant positive effect on TFP, which averages about 10% higher for import-
ers. This confirms other recent works (Castellani et al., 2010; Fernandes, 2007; Halpern et al.,
2011; Kasahara and Rodrigue, 2008; Vogel and Wagner, 2010), but indicates that the effect is
only moderate.
In estimating the relationship between intermediate imports and productivity, we control for
exports, considering both extensive (DEXP) and intensive (EXP) margins, not only in order to
assess the role of exports in determining TFP but also to take account of the possible comple-
mentarities between imports and exports, which would bias the estimate of import premiums
13 In columns 5 and 6, where the continuous variables TINNO and R&D replace the corresponding dummies, signifi-
cance is lost, and the sign may even be reversed. This surprising result is probably due to fact that here the sample is
restricted to the larger firms, inducing less variation and a decline in significance.
15
upward (Serti et al., 2010; Conti et al., 2014). Table 3, columns 1 and 2, shows the clear positive
and statistically significant correlation between export activities and TFP, confirming the thesis
of a substantial literature (for a review, see Castellani et al., 2010). Again, however, and even
more markedly than in the case of imports, the coefficients are fairly small, showing that the
magnitude of the effect is limited.
In order to check complementarities between import and export activities and provide a ra-
tionale for better performance by two-way traders, we include the additional multiplicative varia-
ble IMP*EXP among the regressors in specification (3). The test reported at the bottom of Table
3 shows that although the multiplicative term by itself is not significant, IMP and IMP*EXP are
jointly significant at the 5% level. Figure 1 confirms that for a very large portion of firms (those
exporting less than 90% of their output, 97% of our sample) the marginal effect of importing on
productivity slightly increases with the propensity to export: the higher the export share, the
greater the benefits of imported inputs.14
[FIGURE 1]
4.2 The influence of technological content and quality on TFP
As noted above, there are multiple channels through which importing intermediate goods may
enhance productivity: it may allow firms to use higher quality inputs, to exploit new production
complementarities, to take advantage of potential technology transfers, to abandon inefficient
production phases and benefit from the resulting specialization, or simply to cut input costs. In
particular, the hypothesis that imports’ impact on TFP varies with the firm’s ability to absorb
14 Figure 1 depicts the marginal impact of IMP on TFP with respect to different values of EXP. Marginal impacts are
evaluated as �!"#$ + �� ∗ �!"#$∗&'$ (where �!s are estimated values of �s) and the corresponding standard errors as
() = *+,-.�!"#$/ + 0 ��1� ∗ +,-.�!"#$∗&'$/ + 2 �� ∗ 34+.�!"#$ ∗ �!"#$∗&'$/. The marginal impacts shown in
Figures 2-4 and 6-7 are calculated consistently.
16
more advanced technology or to exploit complementarities can be tested by considering interac-
tion between IMP and the variables representing staff skill (TRAIN) and the firm’s propensity
for innovation (TINNO) and research (R&D). Column (4) presents the interaction term
IMP*TRAIN; column (5) replaces DINNO with the corresponding continuous variable TINNO
and includes the interaction term IMP*TINNO; column (6) substitutes R&D for DR&D and adds
the interaction term IMP* R&D.
The results (columns 4-6 of Table 3) confirm that higher shares of a) workers involved in
training, b) sales accounted for by innovative products and c) investment in R&D all amplify the
effect of importing on TFP.15 In particular, we find that innovation and R&D activity have a sub-
stantial influence on the extent to which importing intermediates affects productivity: the firms
whose TINNO and R&D score close to the mean enjoy positive effects that are respectively
about 3 and 2.5 times larger than those that do not innovate and do not undertake R&D. Figures
2, 3 and 4 confirm the importance and statistical significance of this impact.
[FIGURES 2, 3 and 4]
Another method of identifying the channels through which imports impact on productivity is
employed by Conti et al. (2014): matching each channel with a different commercial partner, on
the assumption that firms in developed countries are more likely to be close to the technological
frontier and to supply high-technology inputs, while firms in developing countries more probably
supply cheaper inputs. Following this approach, to take the technological content or quality of
the inputs into account, we include in equation (1) the dummy variables TECON and AREA de-
scribed in Section 3 and Table 1.
The results (column (7) of Table 3) confirm a) that the firms that import customized inputs
have an advantage over those that import standardized inputs and b) that sourcing from advanced
15 On the relationship between innovation and internationalization, see Altomonte et al. (2013).

17
countries enjoy an extra productivity gain with respect to those sourcing from developing coun-
tries. In column (8) we also include the interaction term TECON* AREA, which is significant
jointly with TECON. And as the t-value reported at the bottom of Table 3 shows, the marginal
effect of TECON when AREA=1 (i.e. the sum of the coefficients of TECON and the interaction
term) is statistically significant. This means that among firms that import customized inputs,
sourcing from developed countries yields an extra TFP gain.
As a further robustness check, we define an index (TECON_IND), coded 0 if a firm imports
only standard inputs, 1 if it imports only customized inputs from developing countries, and 2 if it
imports customized inputs from developed countries. As column (9) shows, the TECON_IND
parameter is consistently positive and significant. Thus like a number of earlier works (Augier et
al., 2013; Acharia and Keller, 2009), our results suggest that while importing inputs is beneficial
in general, the effect is enhanced when the sourcing is directed to acquiring technology and high-
quality inputs and not just motivated solely by cost considerations.
4.3 Endogeneity
In this subsection, compatibly with the data at hand, we address some econometric problems that
affect our key explanatory variables.16 First, to mitigate simultaneity bias, we replace DIMP,
DSERV and DEXP with dummies taking value 1 if firms imported intermediate goods, imported
services or exported, respectively, before 2008 (DIMP_BEF, DSERV_BEF and DEXP_BEF
column 10). Next we address selection bias by adopting the model of Heckman (1979). The firms
that source intermediate goods from abroad could well be systematically different from those that
buy them domestically, so that their higher productivity could be unrelated to input sourcing. In
16 It is worth recalling that our sample is a cross-section of firms, as the EFIGE database provides information on
most of our variables only for the year 2008. Therefore, unobservable firm heterogeneity cannot be captured employ-
ing static panel methods, nor can possible endogeneity (pertaining to some regressors) and TFP dynamics be dealt
with by dynamic panel estimators.
18
other words, if unobservable characteristics that help determine TFP also affect the decision to
buy inputs from abroad, a selection issue arises. In this case, the parameter estimates will be bi-
ased. To cope with this problem, we specify the following selection process:
���5� = 1 if 9�∗ = :� + ;�′:++� > 0 ���5� = 0 4>ℎ@-ABC@ (2)
where 9∗ is a latent variable interpreted as the firm’s propensity to import inputs. This propensity
is a linear function of a set of regressors Z and an error term vi, assumed to be iid N(0, 1). The re-
siduals from probit estimation of (2) are used to construct a selection bias control factor λ (equiv-
alent to the inverse Mill’s ratio), which is added to the main equation for TFP, equation (1).
Since this factor reflects the effect of all the unobserved characteristics related to the sourcing de-
cision, its inclusion in the substantial equation controls for the effect of any unmeasured charac-
teristics relevant to TFP that also weigh in the decision to purchase inputs abroad. Thus, if its co-
efficient is significant, a bias exists.17 In our analysis, the parameter λ is not statistically signifi-
cant; that is, the null hypothesis of independence of the main and the selection-bias equations
cannot be rejected. Accordingly, we omit these results (they are available on request).
This selection problem can also be described as heterogeneity bias, in that information on the
dependent variable is available for all firms but a potentially non-random selection process splits
the observations into two sub-samples (importers and non-importers), which interferes with the
estimation of the correlation between importing activity and TFP. This heterogeneity bias can be
seen as an additional source of endogeneity, which arises whenever – owing to omitted variables,
measurement errors or simultaneity bias – the error terms are correlated with explanatory varia-
17 Owing to data limitations, we could not find any exclusion restrictions. Hence, the vector Z encompasses the same
explanatory variables as the main regression (1), the identification of our model depending on the non-linearity of the
inverse Mill’s ratio.
19
bles. Therefore, besides two-step procedures à la Heckman (1979), IV methods can also be used
(Vella and Verbeek, 1999, Agostino, 2008).
The last two columns of Table 3 show the results from estimating equation (1) by 2SLS, using
as instruments for IMP and EXP (or DIMP and DEXP), the respective mean values computed for
the other firms operating in the same country and their squares. The rationale is that the average
importing and exporting activities within a country should reflect exogenous dynamics of world
demand and supply of intermediate products.18 As columns 11-12 show, the results appear to be
remarkably robust.
4.4 Allowing for firm heterogeneity
If there is heterogeneity among firms, then the average intensity of the correlation of input im-
porting with productivity, as estimated by specifications (1)-(11) in Table 3, may not accurately
describe the effect on TFP in firms that differ in productivity. We address this issue by means of
a quantile regression analysis,19 estimating the effect of the imports at different points along the
conditional TFP distribution.
Table 4, reporting the results of the quantile regression, both for all firms and for the subsam-
ple of suppliers, shows that the least productive firms are the least able to reap benefits from in-
put imports, while the impact of imports is greatest for the firms above the median TFP. Figure 5
graphs the estimated effect of imports on TFP by TFP quantiles, showing that the DIMP coeffi-
cient is higher for the firms belonging to the second and third quartiles of the TFP distribution.
The implication is that especially the most capable and efficient firms succeed in seizing the ad-
18 Similarly, Checherita-Westphal and Rother (2012), in investigating the relationship between debt and growth in 12
euro-area countries, instrument the debt-to-GDP ratio of country i at time t with the average debt-to-GDP ratio in the
other 11 countries at time t.
19 A similar exercise was performed, for exports only, by Yasar et al. (2006) on a sample of Turkish manufacturing
firms.

20
vantages of technology transfer embodied in imported intermediates, possibly because they have
better absorptive capacity. The F-tests reported at the bottom of Table 4 show the significance of
the differences between the coefficients of different quantiles for both importing and exporting.
As concerns exports, only the most productive firms get a positive reward for exporting, the ef-
fect being greatest for the top quartile of the TFP distribution.
[TABLE 4]
[FIGURE 5]
4.5 The subsample of suppliers
Table 5 reports the results for the subsample of supplier firms. As for the whole sample, the first
two specifications are the benchmark specifications, first with the continuous explanatory varia-
bles IMP and EXP and then with the dummies DIMP and DEXP; columns (3) and (4) include the
interactions of IMP with EXP and TRAIN; column (5) considers lagged rather than current val-
ues for exports and imported inputs and services; finally, columns (6) and (7) report 2SLS esti-
mates.
[TABLE 5]
A comparison with Table 3 shows that the results for suppliers alone appear to be qualitatively
identical and quantitatively very similar to those for all firms. However, a comparison of Figures
6 and 7 with Figures 1 and 2 reveals significant differences, as complementarities prove to be es-
pecially important in the case of suppliers. For the whole sample, firms that export 100% of their
output enjoy a marginal effect of importing about 22% greater than those that do not export; but
for supplier firms the difference is much greater, with an extra benefit of 75%. In the same vein,
absorptive capacity also appears to be more important for suppliers: the difference in the margin-

21
al effect of importing between firms whose employees are and are not involved in training pro-
grams is 89% for the whole sample and 96% for suppliers.
[FIGURES 6 and 7]
Further peculiarities for suppliers emerge from the quantile regression results reported in Ta-
ble 4. The right-hand panel shows that in the case of suppliers the pattern of the variation in the
strength of the link with TFP is highly similar for exports and imports: relatively unproductive
suppliers fail to benefit from internationalization, while the impact of importing inputs and of ex-
porting increases with TFP at the same pace and is greatest for the top TFP quartile. Comparison
with panels (a) and (b) in Figure 5 evinces that again the disparities according to productivity
level are more marked for supplier firms, since higher productivity and greater absorptive capaci-
ty have the greatest effect on the profitability of sourcing from abroad.
This empirical finding demonstrates that for suppliers, capability – ability to export and en-
gagement in staff training – is all the more instrumental to reaping the benefits of imported in-
puts. With the exception of marginal producers (those in the bottom decile of TFP), it is suppliers
that benefit most from international opening and specifically from importing customized inter-
mediate goods from developed countries. A reasonable interpretation of these findings relates to
participation in global value chains: through the governance of their own suppliers’ international
network, suppliers that belong to GVCs, acting at once as suppliers and outsourcers, can best ex-
ploit the opportunities offered by the international dispersion of production and reap the largest
productivity gains.
5. CONCLUDING REMARKS
Although imports and exports of intermediate goods have now gained a prominent position in
world trade with the establishment of GVCs and the international dispersion of production, there

22
has been relatively little exploration at micro level of the role of imports of intermediates in de-
termining firms’ efficiency. And only recently has the issue won the attention of researchers and
policy makers. This paper contributes to this recent strand of the literature by exploiting a rich
and novel dataset, EU-EFIGE, that provides both qualitative and quantitative data on firms’ char-
acteristics and activities, which we merge with balance-sheet data from Amadeus (Bureau Van
Dijk). Our analysis is conducted on a sample of more than 14,000 firms in Austria, France, Ger-
many, Hungary Italy, Spain and the UK that are significantly involved in GVCs, according to the
Koopman participation index.
Our econometric inquiry confirms the positive relationship that the recent literature has ob-
served between firms’ imports of inputs and their TFP. We also find evidence that the magnitude
of the beneficial impact of these imports on productivity depends on a number of complementary
factors. In particular, being a two-way trader (i.e. both importer and exporter) and having better
absorptive capacity in terms of staff skills and the firm’s propensity for innovation and research
enable firms to gain the most from their imports of inputs. This finding indicates that intermedi-
ate imports may enable firms to acquire technology and enhance quality, thus boosting their
productivity.
An original finding of ours relates to the effects of importing intermediates on efficiency at
supplier firms in particular. Suppliers in turn produce intermediates for other firms, and thus are
among the protagonists in GVCs and global production sharing. For this reason, we study suppli-
ers as such by means of specific regressions. The econometric results show that the suppliers that
import intermediate goods are more productive and that when endowed with good absorptive ca-
pacity and capability to be an international player as two-way traders, suppliers are the firms that
benefit most from foreign sourcing. We interpret this evidence in the light of GVCs. That is, we
maintain that suppliers that are part of GVCs, acting simultaneously as suppliers and as out-
sourcers, are in the best position to take advantage of the opportunities provided by the interna-

23
tional dispersion of production and score the biggest improvements in productivity. The findings
of our paper would appear to have substantial implications for national competitiveness and trade
policy. As shown by a recent study (OECD, 2015:18), “productivity growth is facilitated by trade
openness, participation in GVCs and the international mobility of skilled workers. Rising GVC
participation magnifies the benefits from lifting barriers to international trade”. Not forgetting
that trade comprises both export and imports. In particular, several studies (Iacovone and
Javorcik, 2010; Koenig et al., 2010) point out that, among other factors, uncertainty and infor-
mation asymmetries about international markets are serious obstacles for SMEs. So, in order to
foster SMEs internationalization, public policy should facilitate the flow of both export and im-
port specific information and support the diffusion of knowledge on international markets

24
REFERENCES Accetturo, A., Giunta A., 2016 , Value Chains and the Great Recession: Evidence from Italian and Ger-
man Firms, Questioni di Economia e Finanza, n.304, Banca d’Italia, Rome.
Accetturo, A., Giunta, A., Rossi, S., 2011, Le imprese italiane tra crisi e nuova globalizzazione, Questioni
di Economia e Finanza, n. 86, Banca d’Italia, Rome.
Acharya, R.C., Keller, W., 2009, Technology Transfer through imports, Canadian Journal of Economics,
42(4), 1411-1448.
Agostino, M., 2008, World Bank Conditional Loans and Private Investment in Recipient Countries, World
Development, 36 (10), 1692-1708.
Agostino, M., Giunta, A., Nugent, J., Scalera, D., Trivieri, F., 2015, The Importance of Being a Capable
Supplier: Italian Industrial Firms in Global Value Chains, International Small Business Journal, 33(7),
708-730.
Aiello F., Ricotta F., 2016, Firms Heterogeneity in Productivity across Europe: Evidence from Multilevel
Models, Economics of Innovation and New Technology, 25:1, 57-89
Alessandria, G., Kaboski, J.P., Midrigan, V., 2011, US Trade and Inventory Dynamics, American Eco-
nomic Review, 101 (3), 303-07, May.
Altomonte, C., Aquilante, T.,2012, The EU-EFIGE/BRUEGEL-UNICREDIT DATASET. Bruegel WP 13.
Altomonte, C., Aquilante, T., Békés, G., Ottaviano G., 2013, Internationalization and Innovation of Firms:
Evidence and Policy, Economic Policy 28 (76), 663–700.
Altomonte, C., Di Mauro, F., Ottaviano, G., Rungi, A., Vicard, V.,2012a, Global Value Chains During
the Great Trade Collapse. A Bullwhip Effect?, European Central Bank, Working Paper Series, n. 1412.
Altomonte, C., Aquilante, T., Ottaviano G.,2012b, The Triggers of Competitiveness. The EFIGE Cross-
Country Report, Bruegel Blueprint Series.
Altomonte, C., Békés, G., 2009, Trade Complexity and Productivity, IEHAS Discussion Papers 0914, In-
stitute of Economics, Hungarian Academy of Sciences.
Amador, J., di Mauro, F., 2015, The Age of Global Value Chains, VoxEu.org E Book.
Amador, J., Cappariello, R., Stehrer R., 2015, Foreign Value Added in Eurozone Exports, in Amador J.
and di Mauro F. (edited by) The Age of Global Value Chains, VoxEu.org E Book, 24-35.
Andersson, M., Johansson, S., Loof H., 2008, Productivity and International Trade: Firm Level Evidence
from a Small Open Economy, Review of World Economics, 144, (4), 774–801. Antras, P, Chor, D., 2013, Organizing the Global Value Chain, Econometrica 81(6): 2127-2204.
Aristei, D., Castellani, D., Franco C., 2013, Firms’ Exporting and Importing Activities: Is There a Two-
Way Relationship?, Review of World Economics, 149(1), 55-84.
Augier P., Cadot, O., Dovis, M, 2013, Imports and TFP at the Firm Level: The Role of Absorptive Capac-
ity, Canadian Journal of Economics, 46, (3), 956 – 981.
Baldwin J., Yan, B., 2014, Global Value Chains and the Productivity of Canadian Manufacturing Firms,
Economic Analysis Research Paper Series, March.
Barba Navaretti, G., Castellani, D., Pieri, F., 2014, Age and Firm Growth: Evidence from Three European
Countries, Small Business Economics, DOI 10.1007/s11187-014-9564-6.
Barba Navaretti, G., Bugamelli, M., Schivardi, F., Altomonte, C., Horgos, D., Maggioni, D., 2011, The
Global Operations of European Firms. The Second EFIGE Policy Report. Bruegel Blueprint Series.
Bas M., Strauss-Kahn V., 2014, Does Importing More Inputs Raise Exports? Firm-Level Evidence from
France, Review of World Economics, 150 (2), 241-475.
Bedi, A., Edwards, J., 2002, The Impact of School Quality on Earnings and Educational Returns: Evi-
dence from a Low-Income Country, Journal of Development Economics, 68, 157-185.
Békés, G., Halpern, L., Koren, M., Muraközy, B., 2011, Still Standing: How European Firms Weathered,
The Third EFIGE Policy Report. Bruegel Blueprint Series.
Benkovskis K., WörzJ., 2015, “The Interpretation of Changes in Global Market Shares: Adding the Glob-
al Value Chain Dimension”. In: Amador, J., di Mauro, F. (edited by) The Age of Global Value Chains,
VoxEu.org E Book, 148-162.
Bernard, A., Jensen, B., 1999, Exceptional Exporter Performance: Cause, Effect, or Both? Journal of In-
ternational Economics, 47, (1), 1-25.
Bernard, A.B., Jensen, J. B., Redding, S. J. and Schott, P. K., 2007, Firms in International Trade, Journal
of Economic Perspectives 21, 105- 130.

25
Blalock, G., Veloso, F.M, 2007, Imports, Productivity Growth and Supply Chain Learning, World Devel-
opment 35, 1134–51.
Cade, B.S., Terrell, J.W., Schroeder, R.L., 1999, Estimating Effects of Limiting Factors with Regression
Quantiles, Ecology, 80, 311-323.
Castellani D., Serti F., Tomasi C., 2010, Firms in International Trade: Importers’ and Exporters’ Hetero-
geneity in Italian Manufacturing Industry, The World Economy, 33 (3), 424-457, March.
Chamberlain, G., 1994, Quantile Regression, Censoring, and the Structure of Wages. Advances in Econo-
metrics, Sims Christopher (ed.). New York: Elsevier.
Checherita-Westphal, C., Rother, P., 2012, The impact of high government debt on economic growth and
its channels: An empirical investigation for the euro area. European Economic Review, 56(7), 1392–
1405.
Clerides S., Lach, S., Tybout, J., 1998, Is Learning-by-Exporting Important? Micro Dynamic Evidence
from Colombia, Mexico, and Morocco, Quarterly Journal of Economics 113, 903–947.
Conti, G., Lo Turco, A., Maggioni, D., 2010, Exporters in Services: New Evidence from Italian Firms.
Applied Economic Quarterly 56, 73-98.
Conti, G., Lo Turco, A., Maggioni, D., 2014, Rethinking the Import-Productivity Nexus for Italian Manu-
facturing, Empirica, 41(4), 589-617.
De Backer, K., Miroudot, S., 2014, Mapping Global Value Chains, European Central Bank, Working Pa-
per Series, n. 1677, May.
Del Prete, D., Giovannetti, G., Marvasi E., 2015, Participation in Global Value Chains: macro and micro
evidence for North Africa.
Díaz-Mora, C., Córcoles, D. Gandoy, R., 2015, Exit from exporting: Does being a two-way trader mat-
ter?, Economics Discussion Papers, No. 2015-15, www.econstore.eu.
Efron, B., 1979, Bootstrap Methods: Another Look at the Jackknife, The annals of Statistics, 1-26.
Estrin S., Poukliakova, S., Shapiro, D., 2009, The Performance Effects of Business Groups in Russia,
Journal of Management Studies, 46(3), 393-420.
Federico, S., Tosti, E., 2012, Exporters and Importers of Services: Firm-Level Evidence on Italy, Eco-
nomic Working Papers n. 877, Bank of Italy.
Fernandes, A.M., 2007, Trade Policy, Trade Volumes and Plant-Level Productivity in Colombian Manu-
facturing Industries, Journal of International Economics, 71, 422-40.
Gereffi, G., Fernandez-Stark, K., 2011, Global Value Chains Analysis: A Primer. Center on Globalization,
Governance & Competitiveness (CGGC) Duke University.
Gereffi, G., Humphrey, J., Sturgeon, T., 2005, The Governance of Global Value Chains, Review of Inter-
national Political Economy, 12(1), 78-104.
Giovannetti, G., Marvasi, E., Sanfilippo, M., 2015, Supply Chains and the Internationalization of SMEs:
Evidence from Italy, Small Business Economics 44, 845-865.
Giunta, A, Nifo, A., Scalera, D., 2012, Subcontracting in Italian Industry: Labour Division, Firm Growth
and the North–South Divide, Regional Studies 46, (8), 1067–1083.
Halpern, L., Koren, M., Szeidl, A., 2011, Imported Inputs and Productivity, CeFiG Working Papers 8,
Center for Firms in the Global Economy.
Heckman, J.J., 1979, Sample Selection Bias as a Specification Error, Econometrica, 47(1), 153-161.
Humphrey, J., Schmitz, H., 2001, Governance in global value chains, IDS Bulletin 32.3, Institute of De-
velopment Studies.
Kasahara, H., Lapham B., 2008, Productivity and the Decision to Import and Export: Theory and Evi-
dence, CESifo Working Paper 2240, CESifo Group Munich.
Kasahara, H., Rodrigue, J., 2008, Does the Use of Imported Intermediates Increase Productivity? Plant-
Level Evidence, Journal of Development Economics 87(1), 106 -118.
Koenker, R., 1994, Confidence Intervals for Regression Quantiles. In: Mandl, P., Huskova, M. (Eds.) As-
ymptotic Statistics, Physica Verlag, 349-359.
Koenker, R., 2001, Quantile Regression. Journal of Economic Perspectives,15 (4), 143-156.
Koenker, R., 2005, Quantile regression. Econometric society monograph series. Cambridge Univ. Press.
Koopman, R., Powers, W., Wang, Z., Wei, S., 2011, Give Credit Where Credit is Due: Tracing Value-
Added in Global Production Chains, NBER Working Paper No. 16426.

26
Kraay, A., Soloaga, I., Tybout, J., 2002, Product Quality, Productive Efficiency, and International Tech-
nology Diffusion: Evidence from Plant-level Panel Data, World Bank Policy Research Working Paper
2759, Washington, DC: The World Bank.
Kugler, M., Verhoogen, E., 2008, The Quality–Complementarity Hypothesis: Theory and Evidence from
Colombia, NBER Working Paper Series 14418, Cambridge, MA: National Bureau of Economic Re-
search.
Manning, W., Blumberg, L., Moulton, L., 1995, The Demand for Alcohol: the Differential Response to
Price, Journal of Health Economics, 14, 123-148.
Morck, R., Wolfenzon, D., Yeung, B. 2005, Corporate governance, Economic Entrenchment and Growth,
Journal of Economic Literature, 43, 657-722.
Muuls, M., Pisu M., 2009, Imports and Exports at the Level of the Firm, World Economy, 32, 692-734.
OECD, 2015, The Future of Productivity, OECD, Paris, 2015
OECD, 2010, How Imports Improve Productivity and Competitiveness, OECD, Paris, May.
Razzolini, T., Vannoni, D., 2011, Export Premia and Subcontracting Discount: Passive Strategies and Per-
formance in Domestic and Foreign Markets, World Economy, 34(6): 984–1013.
Roberts, M. J., Tybout J., 1997, The Decision to Export in Colombia: An Empirical Model of Entry with
Sunk Costs, American Economic Review, 87, (4), 545–64.
Romer, P., 1987, Growth Based on Increasing Returns due to Specialization, American Economic Review
77, 56-62.
Santoni, G., Taglioni, D., 2015 “Networks and Structural Integration in Global Value Chains”, in: Ama-
dor, J. di Mauro, F. (Edited by), The Age of Global Value Chains, a VoxEU.org eBook, 68-84.
Scalera, D., Zazzaro, A., 2011, Do Inter-Firm Networks Make Access to Finance Easier? Issues and Em-
pirical Evidence, in Cafaggi F. (ed.), “Contractual Networks, Inter-Firm Cooperation and Economic
Growth”, Edward Elgard, Cheltenham.
Serti, F., Tomasi, C., 2008, Firm Heterogeneity: Do Destinations of Exports and Origins of Imports Mat-
ter?. In: Piscitello, L., Santangelo, G. (eds.) Multinationals and Local Competitiveness”, Franco Angeli,
Milano.
Smeets, V., Warzynski, F., 2013, Estimating productivity with multi-product firms, pricing heterogeneity
and the role of international trade, Journal of International Economics, 90 (2), 237-244.
Vella, F., Verbeek, M., 1999. Estimating and interpreting models with endogenous treatment effects.
Journal of Business and Economic Statistics, 17(4), 473–478.
Veugelers, R., 2013, Innovative firms in Global Value Chains, European Commission Policy Brief, 21.
Vogel, A., Wagner J., 2010, Higher Productivity in Importing German Manufacturing Firms: Self-Selec-
tion, Learning from Importing, or Both?, Review of World Economics, 145, 641-665.
Wagner, J., 2012, International Trade and Firm Performance: A Survey of Empirical Studies since 2006,
Review of World Economiccs/Weltwirtschaftliches Archiv, 148(2), 235–267.
Yasar, M., Nelson, C.H., Rejesus, R., 2006, Productivity and Exporting Status of Manufacturing Firms:
Evidence from Quantile Regressions, Review of World Economics, 142(4), 675-694.
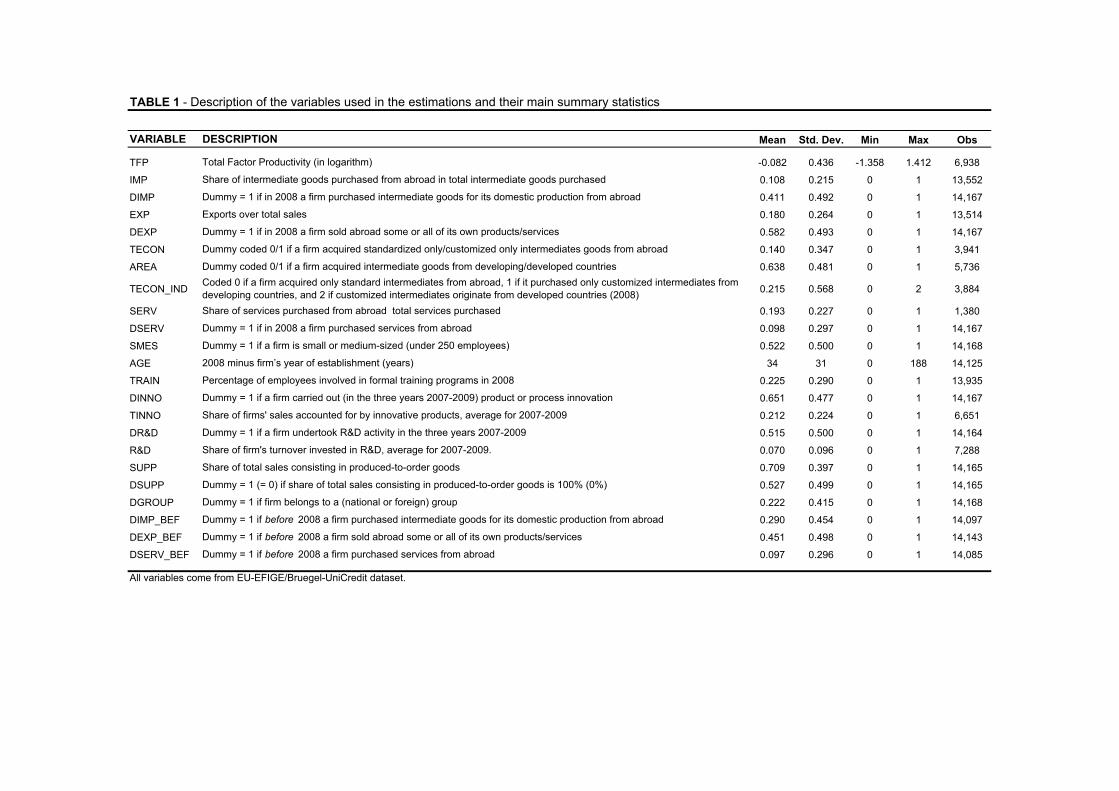
VARIABLE DESCRIPTION Mean Std. Dev. Min Max Obs
TFP -0.082 0.436 -1.358 1.412 6,938
IMP 0.108 0.215 0 1 13,552
DIMP 0.411 0.492 0 1 14,167
EXP 0.180 0.264 0 1 13,514
DEXP 0.582 0.493 0 1 14,167
TECON 0.140 0.347 0 1 3,941
AREA 0.638 0.481 0 1 5,736
TECON_IND 0.215 0.568 0 2 3,884
SERV 0.193 0.227 0 1 1,380
DSERV 0.098 0.297 0 1 14,167
SMES 0.522 0.500 0 1 14,168
AGE 34 31 0 188 14,125
TRAIN 0.225 0.290 0 1 13,935
DINNO 0.651 0.477 0 1 14,167
TINNO 0.212 0.224 0 1 6,651
DR&D 0.515 0.500 0 1 14,164
R&D 0.070 0.096 0 1 7,288
SUPP 0.709 0.397 0 1 14,165
DSUPP 0.527 0.499 0 1 14,165
DGROUP 0.222 0.415 0 1 14,168
DIMP_BEF 0.290 0.454 0 1 14,097
DEXP_BEF 0.451 0.498 0 1 14,143
DSERV_BEF 0.097 0.296 0 1 14,085
All variables come from EU-EFIGE/Bruegel-UniCredit dataset.
Dummy = 1 if a firm is small or medium-sized (under 250 employees)
2008 minus firm’s year of establishment (years)
Dummy = 1 if a firm carried out (in the three years 2007-2009) product or process innovation
Percentage of employees involved in formal training programs in 2008
Share of total sales consisting in produced-to-order goods
Dummy = 1 (= 0) if share of total sales consisting in produced-to-order goods is 100% (0%)
Dummy = 1 if a firm undertook R&D activity in the three years 2007-2009
Share of firms' sales accounted for by innovative products, average for 2007-2009
Share of firm's turnover invested in R&D, average for 2007-2009.
Dummy = 1 if before 2008 a firm sold abroad some or all of its own products/services
TABLE 1 - Description of the variables used in the estimations and their main summary statistics
Total Factor Productivity (in logarithm)
Share of intermediate goods purchased from abroad in total intermediate goods purchased
Dummy = 1 if in 2008 a firm purchased intermediate goods for its domestic production from abroad
Dummy coded 0/1 if a firm acquired standardized only/customized only intermediates goods from abroad
Dummy = 1 if in 2008 a firm purchased services from abroad
Exports over total sales
Dummy = 1 if in 2008 a firm sold abroad some or all of its own products/services
Dummy = 1 if before 2008 a firm purchased intermediate goods for its domestic production from abroad
Dummy = 1 if before 2008 a firm purchased services from abroad
Dummy coded 0/1 if a firm acquired intermediate goods from developing/developed countries
Dummy = 1 if firm belongs to a (national or foreign) group
Share of services purchased from abroad total services purchased
Coded 0 if a firm acquired only standard intermediates from abroad, 1 if it purchased only customized intermediates from
developing countries, and 2 if customized intermediates originate from developed countries (2008)

Column 1 Column 2 Column 3 Column 4 Column 5 Column 6
Do not purchase
intermediate
goods from abroad
Purchase
intermediate
goods from abroad
Purchase only
standardized
intermediates
from abroad
Purchase only
customized
intermediates
from abroad
Purchase
intermediates
from developing
countries
Purchase
intermediates
from developed
countries
Number of firms 8,343 5,824 3,391 550 2,075 3,661
Number of employees 67 255 299 123 197 291
Firm's age 32 35 34 33 39 34
Share of services purchased from abroad 17.3% 20.1% 16.7% 22.1% 21.9% 18.9%
Exports over total sales 12.8% 25.5% 23.2% 30.9% 30.5% 22.8%
Product and process innovation 58.7% 74.3% 71.9% 78.0% 81.4% 70.4%
Employees in training programs 21.6% 23.8% 22.7% 25.0% 25.3% 23.1%
Produced-to-order goods over total sales 70.3% 71.7% 71.1% 69.5% 65.1% 75.2%
Group 16.0% 31.0% 26.4% 29.5% 35.2% 28.7%
Authors' calculations from EU-EFIGE/Bruegel-UniCredit dataset
TABLE 2 - Descriptive statistics by import status

Column 1 Column 2 Column 3 Column 4 Column 5 Column 6 Column 7 Column 8 Column 9 Column 10 Column 11 Column 12
IMP 0.100*** 0.094*** 0.082*** 0.024 0.042 0.124***0.000 0.002 0.007 0.598 0.370 0.000
DIMP 0.055*** 0.078***0.000 0.002
EXP 0.078*** 0.075*** 0.078*** 0.101*** 0.129*** 0.066 0.066 0.060 0.070***0.000 0.002 0.000 0.001 0.000 0.122 0.122 0.158 0.004
DEXP 0.027*** 0.057**0.008 0.025
TECON 0.053** 0.02600.042 0.217
AREA 0.038** 0.032*0.044 0.071
TECON*AREA 0.04800.280
TECON_IND 0.036**0.047
DSERV 0.055*** 0.044**0.001 0.014
SMES -0.373*** -0.357*** -0.373*** -0.372*** -0.376*** -0.348*** -0.414*** -0.413*** -0.411*** -0.357*** -0.373*** -0.353***0.000 0.000 0.000 0.000 0.000 0.000 0.000 0.000 0.000 0.000 0.000 0.000
lnAGE_1 0.020*** 0.020*** 0.020*** 0.020*** 0.018* 0.032*** 0.0140 0.0140 0.0140 0.018*** 0.020*** 0.018***0.002 0.001 0.002 0.002 0.051 0.002 0.212 0.200 0.216 0.003 0.002 0.003
TRAIN 0.103*** 0.103*** 0.103*** 0.095*** 0.124*** 0.143*** 0.075* 0.076* 0.076* 0.104*** 0.103*** 0.105***0.000 0.000 0.000 0.000 0.000 0.000 0.063 0.061 0.058 0.000 0.000 0.000
DINNO 0.0130 0.0150 0.0130 0.0130 -0.0290 0.0170 0.0180 0.0160 0.0160 0.0130 0.01000.241 0.181 0.239 0.251 0.478 0.320 0.306 0.368 0.152 0.249 0.372
DR&D 0.027** 0.026** 0.027** 0.027** 0.038** 0.0400 0.0400 0.0400 0.028** 0.027** 0.01800.018 0.017 0.018 0.018 0.027 0.116 0.116 0.113 0.011 0.018 0.109
SUPP -0.037*** -0.038*** -0.037*** -0.037*** -0.036* -0.0290 -0.0420 -0.0410 -0.0370 -0.035*** -0.037*** -0.038***0.007 0.004 0.007 0.007 0.055 0.179 0.142 0.143 0.184 0.009 0.007 0.004
DGROUP 0.158*** 0.164*** 0.158*** 0.157*** 0.170*** 0.160*** 0.184*** 0.184*** 0.183*** 0.160*** 0.157*** 0.158***0.000 0.000 0.000 0.000 0.000 0.000 0.000 0.000 0.000 0.000 0.000 0.000
IMP*EXP 0.02100.792
IMP*TRAIN 0.07300.398
TINNO -0.100**0.011
IMP*TINNO 0.24200.117
R&D -0.16500.130
IMP*R&D 0.962***0.006
DIMP_BEF 0.050***0.000
DEXP_BEF 0.033***0.002
DSERV_BEF 0.049***0.005
TABLE 3 - Estimation results. All firms
(continued)
Column 1 Column 2 Column 3 Column 4 Column 5 Column 6 Column 7 Column 8 Column 9 Column 10 Column 11 Column 12
Observations 6,250 6,699 6,250 6,250 2,953 2,199 1,929 1,929 1,929 6,685 6,250 6,699
Model test 75.2*** 81.8*** 72.5*** 72.4*** 43.5*** 37.6*** 26.6*** 25.9*** 27.8*** 80.5*** 74.7*** 79.6***
0.000 0.000 0.000 0.000 0.000 0.000 0.000 0.000 0.000 0.000 0.000 0.000
R2
0.246 0.253 0.246 0.246 0.282 0.284 0.277 0.277 0.276 0.251 0.245 0.251
Test joint sign. (IMP, IMP*EXP) 8.73***
0.000
Test joint sign. (IMP, IMP*TRAIN) 8.84***
0.000
Test joint sign. (IMP, IMP*TINNO) 3.51**
0.030
Test joint sign. (IMP, IMP*R&D) 8.43***
0.000
Test joint sign. (TECON, AREA) 4.41**
0.042
Test joint sign. (TECON, TECON*AREA) 3.02*
0.094
T-test (TECON+TECON*AREA) 2.19**
0.029
Hansen test 0.130 0.230
0.937 0.891
For the description of the variables see Table 1. The dependent variable is firm's Total Factor Productivity. Superscripts ***, ** and * denote statistical significance at the 1, 5 and 10 percent level, respectively. The p-
values of the tests are given in italics. The standard errors (not reported) are robust to heteroskedasticity and autocorrelation. Country and sector dummies always included but not reported (sector dummies are
based on a randomised industry identifier , ranking from 1 to 11, as provided by the EFIGE dataset). lnAGE_1 is the log of (1 + firm's age) lagged once. Columns from 1 to 10 report OLS estimats, while columns 11
and 12 show the 2SLS estimates when instrumenting IMP and EXP and DIMP and DEXP, respectively. As instruments for firm i we use the average variables (IMP and EXP) of the other N-1 firms, and their squares.
Model test is the F-test of joint significance of all explanatory variables.
TABLE 3 (continued ) - Estimation results. All firms

FIGURE 1- Marginal effect of IMP on TFP as EXP changes. All firms (---95% confidence interval)
FIGURE 2- Marginal effect of IMP on TFP as TRAIN changes. All firms (---95% confidence interval)
96.9% of the estimating sample observations
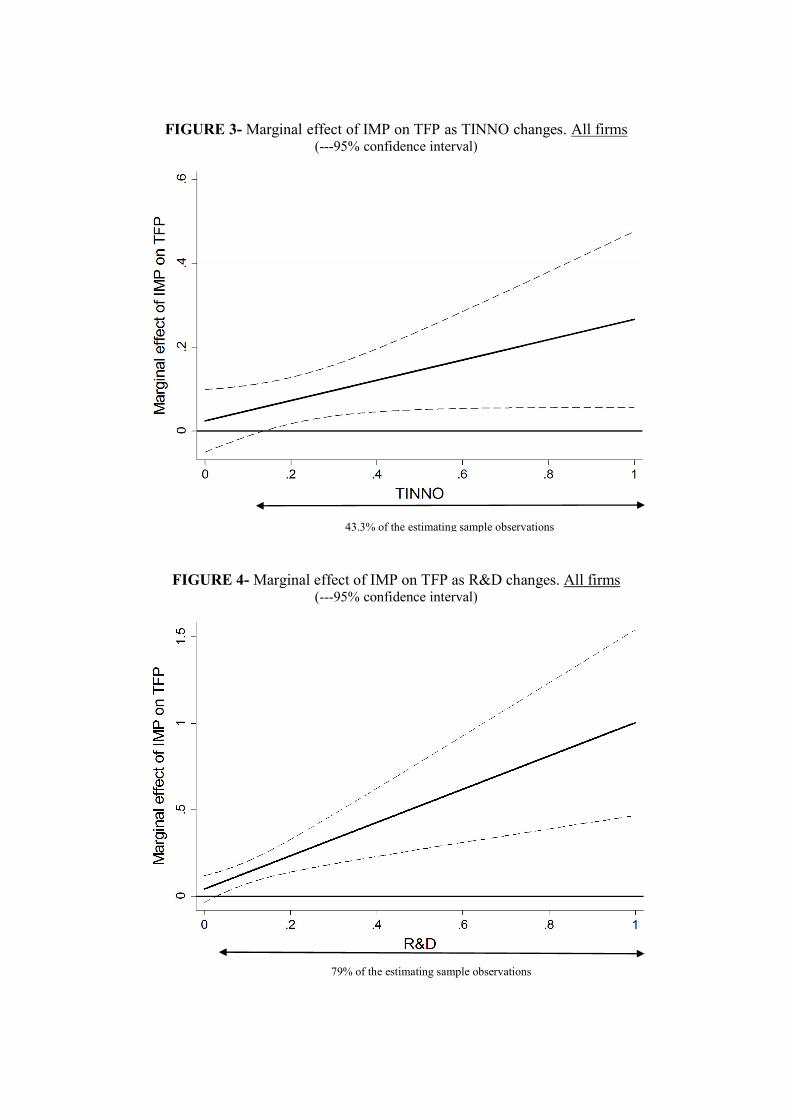
FIGURE 3- Marginal effect of IMP on TFP as TINNO changes. All firms (---95% confidence interval)
FIGURE 4- Marginal effect of IMP on TFP as R&D changes. All firms (---95% confidence interval)
43.3% of the estimating sample observations
79% of the estimating sample observations

q10 q25 q50 q75 q90 q10 q25 q50 q75 q90
DIMP 0.016** 0.038*** 0.049*** 0.046*** 0.030** 0.0120 0.030* 0.054*** 0.071*** 0.043***0.022 0.001 0.000 0.000 0.015 0.177 0.055 0.000 0.000 0.007
DEXP 0.0020 0.0150 0.031*** 0.049*** 0.047*** 0.0020 0.0220 0.029* 0.063*** 0.035*0.689 0.168 0.006 0.000 0.001 0.748 0.128 0.063 0.001 0.078
DSERV 0.0360 0.057*** 0.037** 0.0090 0.0240 0.0300 0.071** 0.056** 0.0130 0.01000.134 0.009 0.018 0.535 0.157 0.334 0.015 0.022 0.517 0.626
SMES -0.276*** -0.358*** -0.312*** -0.205*** -0.101*** -0.247*** -0.300*** -0.284*** -0.189*** -0.094***0.000 0.000 0.000 0.000 0.000 0.000 0.000 0.000 0.000 0.000
lnAGE_1 0.0040 0.023*** 0.035*** 0.019*** 0.0000 0.009* 0.033*** 0.041*** 0.023*** 0.00800.243 0.000 0.000 0.001 0.958 0.093 0.000 0.000 0.010 0.402
TRAIN 0.020* 0.063*** 0.075*** 0.084*** 0.059** 0.0070 0.0240 0.041* 0.0410 0.070**0.064 0.006 0.000 0.000 0.011 0.598 0.394 0.059 0.136 0.012
DINNO 0.0040 0.0140 0.0150 -0.0050 -0.0060 0.0070 0.0080 0.0010 -0.0190 0.00000.400 0.234 0.226 0.751 0.628 0.427 0.502 0.947 0.263 0.982
DR&D 0.0050 0.032*** 0.028** 0.030** 0.0200 0.0080 0.054*** 0.048*** 0.042** 0.01100.335 0.006 0.015 0.030 0.110 0.274 0.000 0.003 0.021 0.497
SUPP 0.0100 -0.0060 -0.024* -0.041*** -0.039***0.223 0.633 0.097 0.005 0.005
DGROUP 0.043** 0.108*** 0.149*** 0.170*** 0.115*** 0.0390 0.081*** 0.125*** 0.136*** 0.083***0.026 0.000 0.000 0.000 0.000 0.106 0.000 0.000 0.000 0.000
Observations
Bootstrap replications
F-Test (q10=q25=q50=q75=q90):- DIMP 2.67** 3.17**
0.030 0.013
- DEXP 3.66*** 2.62**0.006 0.033
TABLE 4 - Quantile regressions
All firms Suppliers (100%) only
For the description of the variables see Table 1. The dependent variable is firm's Total Factor Productivity. Superscripts ***, ** and * denote statistical significance at the 1, 5 and 10
percent level, respectively. The p-values of the tests are given In italics. Bootstrapped standard errors (500 replications) are omitted. Country and sector dummies always included but not
reported (sector dummies are based on a randomised industry identifier , ranking from 1 to 11, as provided by the EFIGE dataset). AGE is the log of (1+firm's age) and lagged once. The F-
test reported verifies the equivalence of the DIMP and DEXP coefficients across quantiles. Model test is the F-test of joint significance of all explanatory variables.
6,699500
3,618500

FIGURE 5
Panel [A] - Quantile results. All firms Panel [B] - Quantile results. Supplier firms

Column 1 Column 2 Column 3 Column 4 Column 5 Column 6 Column 7
OLS OLS OLS OLS OLS 2SLS 2SLS
IMP 0.096*** 0.076* 0.079* 0.140***0.004 0.069 0.058 0.005
DIMP 0.057*** 0.077**0.000 0.041
EXP 0.094*** 0.084*** 0.093*** 0.085***0.001 0.006 0.001 0.009
DEXP 0.031** 0.077**0.024 0.023
DSERV 0.062*** 0.048*0.009 0.059
SMES -0.336*** -0.331*** -0.334*** -0.335*** -0.335*** -0.335*** -0.325***0.000 0.000 0.000 0.000 0.000 0.000 0.000
lnAGE_1 0.030*** 0.032*** 0.030*** 0.030*** 0.029*** 0.030*** 0.029***0.000 0.000 0.000 0.000 0.000 0.000 0.000
TRAIN 0.064*** 0.062*** 0.064*** 0.056** 0.062*** 0.064*** 0.066***0.008 0.007 0.009 0.032 0.008 0.008 0.004
DINNO 0.0030 0.0040 0.0040 0.0030 0.0050 0.0030 -0.00200.815 0.788 0.807 0.835 0.707 0.850 0.900
DR&D 0.040*** 0.037*** 0.040*** 0.040*** 0.042*** 0.039*** 0.028*0.008 0.009 0.007 0.007 0.003 0.008 0.062
DGROUP 0.126*** 0.135*** 0.126*** 0.125*** 0.138*** 0.124*** 0.129***0.000 0.000 0.000 0.000 0.000 0.000 0.000
IMP*EXP 0.06900.526
IMP*TRAIN 0.07600.544
DIMP_BEF 0.050***0.001
DEXP_BEF 0.028**0.048
DSERV_BEF 0.02000.420
Observations 3,418 3,618 3,418 3,418 3,612 3,418 3,618
Model test 37.53*** 40.60*** 36.15*** 36.05*** 39.58*** 36.88*** 39.09***
0.000 0.000 0.000 0.000 0.000 0.000 0.000
R2
0.22 0.23 0.22 0.22 0.23 0.22 0.23
Test joint sign. (IMP, IMP*EXP) 4.18**
0.015
Test joint sign. (IMP, IMP*TRAIN) 4.26**
0.014
Hansen test 0.200 0.254
0.905 0.881
TABLE 5 - Estimation results. Supplier firms
For the description of variables see Table 1. The dependent variable is firm's Total Factor Productivity. Superscripts ***, ** and * denote
statistical significance at the 1, 5 and 10 percent level, respectively. The p-values of the tests are given In italics. The standard errors (not
reported) are robust to heteroskedasticity and autocorrelation. Country and sector dummies always included but not reported (sector dummies
are based on a randomised industry identifier , ranking from 1 to 11, as provided by the EFIGE dataset). inAGE_1 is the log of (1 + firm's age)
lagged once. Columns from 1 to 5 report OLS estimats, while columns 6 and 7 show the 2SLS estimates when instrumenting IMP and EXP
and DIMP and DEXP, respectively. As instruments for firm i we use the average variables (IMP and EXP) of the other N-1 firms, and their
squares. Model test is the F-test of joint significance of all explanatory variables.
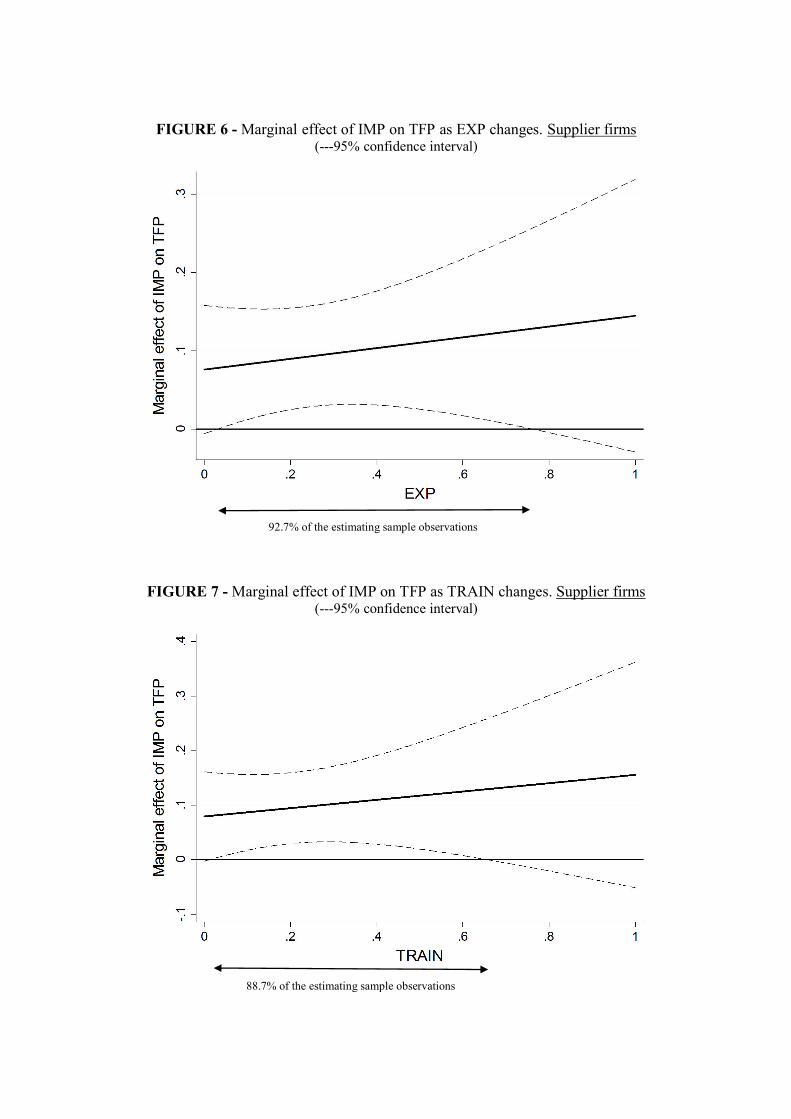
FIGURE 6 - Marginal effect of IMP on TFP as EXP changes. Supplier firms (---95% confidence interval)
FIGURE 7 - Marginal effect of IMP on TFP as TRAIN changes. Supplier firms (---95% confidence interval)
92.7% of the estimating sample observations
88.7% of the estimating sample observations