importance of transportation to advanced technology industries
TRANSCRIPT

Transportation Research Record 1076 1
Importance of Transportation to
Advanced Technology Industries
NORMAN P. HUMMON, LINDA ZEMOTEL,
A.G. R. BULLEN, and JAMES P. DeANGELIS
ABSTRACT
Transportation is beginning to play a role in the economic development of advanced technology. This paper is a report on an analysis of a short mail-back questionnaire designed to gain information about the importance of transportation service to advanced technology firms in Pennsylvania. Transportation was defined in three ways: (a) transport of materials and products to and from markets and suppliers, (b) access of personnel to others in similar industries, and (c) the quality of transportation facilities and services and their contribution to making the community a pleasant place to live and work. A categorical variable regression model was used to predict transportation service preferences using the independent variables of firm type, firm size, age of technology used in production, and a Standard Industrial Classification (SIC) definition of advanced technology. The major finding was that an SIC-based variable contributed little to the prediction of transportation service preferences. Instead, type of firm, size of firm, and age of technology predicted the transportation preferences.
The promotion of advanced technology industries has become a common economic development focus of state and local governments. The commonwealth of Pennsylvania is no exception and, in 1982, initiated a technology development program to bring together research universities and the private sector. More recently, the Pennsylvania Department of Transportation has become interested in transportation infrastructure to meet the requirements of advanced technology firms.
The role of transportation in the economic development of advanced technology is beginning to receive some attention. In the Joint Economic Committee's report of 1982 <llr determinants that were found to be most important to interregional locational decisions were labor skills and availability, labor costs, and state and local taxes. The most important factors that could influence the choice within a region were labor skills, labor availability, taxes, and business climate. Proximity to customers was rated significant or very significant for the choice of location within a region by less than half of the respondents (47 percent). Proximity to raw materials and component supplies was rated significant or very significant by only 36 percent of the respondents. According. to the study, 11 [c]learly, the traditional locational factors of access to markets and raw materials were not important factors for high technology plant location decisions. 11 However, a good transportation system for people ·was rated as significant or very significant by 76 percent of the respondents.
The conclusion of the Joint Economic Committee
N.P. Hummon, Department of Sociology, University of Pittsburgh, Pittsburgh, Pa. 15260. L. Zemotel and A.G.R. Bullen, Department of Civil Engineering, University of Pittsburgh, Pittsburgh, Pa. 15260. J.P. DeAngelis, University Center for Social and Urban Research, University of Pittsburgh, Pittsburgh, Pa. 15260.
(JEC) was that high technology companies were 11 footloose" because access to raw materials, access to markets, and transportation were not major locational determinants. This suggests that a less conventional view of transportation may be necessary in studying advanced technology firms. Commuting time and traffic congestion may be "quality-of-life" factors that transportation engineers should consider.
In 1983 the Pennsylvania State University's Institute of Public Administration conducted a survey of advanced technology manufacturing and service firms in Pennsylvania (2). According to this survey, the top five factors that influenced firms' decisions to locate at their present sites were (a) proximity to markets, (b) proximity to family, (c) availability of labor, (d) commuting distance, and (e) cost of property. Penn State's results appear to contradict the JEC finding because access to markets was not often cited as an important factor. The contradiction may have to be resolved by looking at the samples selectedi that is, generalizations about high technology industries must be defined for type of company (manufacturing firms only or both manufacturing and service firms), area of the country ( 70 percent in Massachusetts and California versus all in Pennsylvania), age of technology, and size of company.
The label "advanced technology" is such an allencompassing phrase that making generalizations about these industries may be risky. Support for this statement comes from the research of Glasmeier et al. (3) that was designed to study growth performance and locational tendencies in high technology industries. They state that their "most important conclusion is that the location and growth of hightech industry is a very varied and disparate process which will require highly disaggregated industry-byindustry analysis.•
Two groups have explicitly studied relationships between advanced technology and transportation issues. The first group, Toft and Mahmassani, pre-
2
sented a framework for planning advanced technology economic development (il· They developed a case that transportation is important in at least four areas: "(a) the journey to work of the predominately professional, white-collar workforce i (b) business air travel fo r scien t ific, technical, and business pur posesi (c) high air freight volume due to high value, low bulk, time-sensitive, and fragile nature of shipments i and (d) clean, campuslike, semirural, highly visible sites in the vicinity of major arterials, Interstates, and airports" (4,p.28).
Route 202 in Chester and Montgomery Counties, Pennsylvania, was the focus of the second group, the Delaware Valley Regional Planning Commission (DVRPC) (5) . This report has made planning for the transport~tion needs of advanced technology firms a part of the short-range transportation improvement program for the region ' s "high-teen corr i aor. "
In the DVRPC survey, the investigators compared samples of high-tech and non-high-tech firms. Both groups were asked to rate seven criteria in choosing their locations. The high-tech group ranked them in order of importance as (a) existing residence of professional and managerial staff, (b) ownership or rental costs, (c) physical environment, (d) highway facilities, (e) availability of trained labor force, (f) local taxes, and (g) local government attitude or incentives. Both groups rated most criteria similarly except that existing residences were very important to 79 percent of the high-tech respondents but to only 53 percent of the non-high-tech respondents. The investigators conclude that "the best sites to promote for high technology firms are those which are nearby to good housing stock."
Another important difference between the hightech and the non-high-tech firms is the importance of access to an airport (in this case, Philadelphia International Airport) • The DVRPC study found that the airport was a highly important destination to 60 percent of the high-tech firms and unimportant to 4 percent whereas it was highly important to only 30 percent of non-high-tech firms and unimportant to 20 percent.
This brief description of some of the research being done to determine linkages between transportation needs and economic development through promo-ticn cf advanced industries shows the tentative nature of the results and highlights the need for more research, first into the nature of this emerging group of industries and then into its possible transportation needs, which may be different than those currently being met.
ADVANCED TECHNOLOGY INDUSTRIES
The first problem in studying transportation needs of advanced technology industries is the definition of such industries. The JEC presents a comprehensive definition <!.>:
High technology industries consist of heterogeneous collections of firms that share several attributes. First, the firms are labor-intensive rather than capital-intensive in their production processes, employing a higher percentage of technicians, engineers and scientists than other manufacturing companies. Second, the industries are sciencebased in that they thrive on the application of advances . in science to the marketplace in the form of new products and production methods. Third, R&D inputs are much more important to the continued successful operation of high technology firms than is the case for other manufacturing industries.
Transportation Research Record 1076
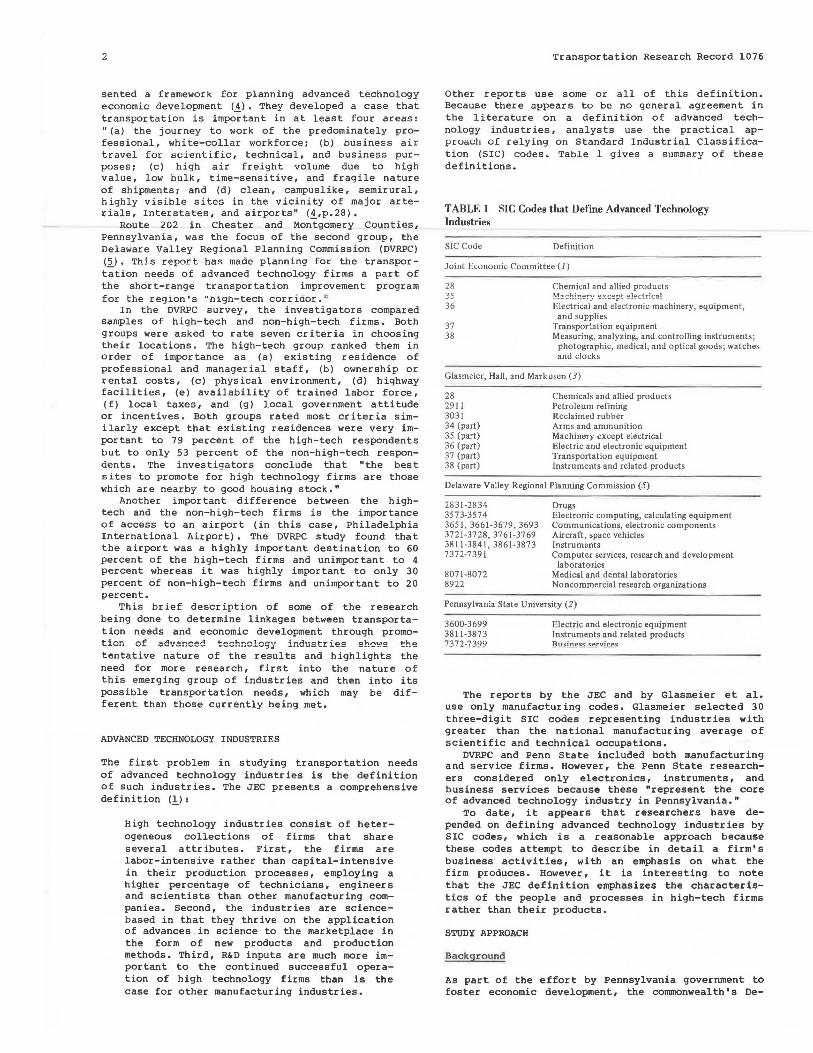
Other reports use some or all of this definition. Because there appears to be no general agreement in the literature on a definition of advanced technology industries, analysts use the practical apvruacli of relying on Standard Industrial Classification (SIC) codes. Table 1 gives a summary of these definitions.
TABLE 1 SIC Codes that Define Advanced Technology Industries
SIC Code Definition
Joint Economic Committee (1)
28 35 36
37 38
Chemical and allied products ~:fa.~hi!!e!'j' ex-:ept '!!'?4=!!i'2'~! Electrical and electronic machinery, equipment,
and supplies Transportation equipment Measuring, analyzing, and controlling instruments;
photographic, medical, and optical goods; watches and clocks
Glasmeier, Hall, and Markusen (3)
28 2911 3031 34 (part) 35 (part) 36 (part) 37 (part) 38 (part)
Chemicals and allied products Petroleum refining Reclaimed rubber Arms and ammunition Machinery except electrical Electric and electronic equipment Transportation equipment Instruments and related products
Delaware Valley Regional Planning Commission (5)
2831-2834 3573-3574 3651, 3661-3679. 3693 3721-3728, 3761-3769 3811-3841, 3861-3873 7372-7391
8071-8072 8922
Drugs Electronic computing, calculating equipment Communications, electronic components Aircraft, space vehicles Instruments Computer services, research and development
laboratories Medical and dental laboratories Noncommercial research organizations
Pennsylvania State University (2)
3600-3699 3811-3873 7372-7399
Electric and electronic equipment Instruments and related products .Bnsin_e:s.s. s.e:rvfoP.s.
The reports by the JEC and by Glasmeier et al. use only manufacturing codes. Glasmeier selected 30 three-digit SIC codes representing industries with greater than the national manufacturing average of scientific and technical occupations.
DVRPC and Penn State included both manufacturing and service firms. However, the Penn State researchers considered only electronics, instruments, and business services because these "represent the core of advanced technology industry in Pennsylvania."
To date, it appears that researchers have depended on defining advanced technology industries by SIC codes, which is a reasonable approach because these codes attempt to describe in detail a firm's business activities, with an emphasis on what the firm produces. However, it is interesting to note that the JEC definition emphasizes the characteristics of the people and processes in high-tech firms rather than their products.
STUDY APPROACH
Bac kground
As part of the effort by Pennsylvania government to foster economic development, the commonweal th' s De-

Hummon et al.
partment of Transportation contracted for research directed at "understanding the impact of transportation access and other locational factors to the establishment and growth of advanced technology firms in Pennsylvania." The research plan includes surveys of existing advanced technology firms, and the results are to be used in recommending to the transportation department ways to assist, or at least not hinder, these firms in their business activities.
The study is currently under way, and this paper is a report on the results of Phase I: analysis of a short mail-back questionnaire completed by executives of 1,136 firms in Pennsylvania.
survey Design
The purpose of the survey accomplished in Phase I was to gain information about the relative importance of transportation to current business activities of the firms as well as some basic knowledge of the characteristics of the firms .
The questions about the importance of transportation covered three areas: (a) transport of finished products and supplies, (b) access to others in similar industries, and (c) quality-of-life factors. The questions were
What is the relative importance of each of the following to the current business activities of your firm?
The transport of materials and products to and from markets and suppliers.
Access of your personnel to others in your industry, such as clients, firms in similar product lines, educators, researchers, and trade representatives.
The quality of the transportation facilities and services in making your community a pleasant place to live and work.
Respondents were asked to rate each question using a scale of "very important," "important," "neither important nor unimportant," "unimportant," or "very unimportant."
The first question about markets and supplies was designed to capture the "traditional" role of transportation service to a business. The second question about access to others was included to explore the popular notion that agglomeration factors may be more important to advanced technology firms than to non-advanced technology firms. And finally, the third question looked at transportation as a lifestyle factor that is sometimes cited as important in enabling advanced technology firms to develop and expand.
The variables that could be used to describe the firms were contained in the following questions:
How would you describe your primary product or service? (SIC code could be determined from this open-ended response.)
How would you classify the age of the technology used in producing your primary product or service? (The scale used was "less than l year," "l to 5 years," "6 to 10 years," "ll to 20 years," or "over 20 years.")
Approximately how many people, including yourself and part-time workers, are employed at this facility? (The respondent was asked to give the actual number of employees.)
3
Responses to the Survey
According to the description given for product or service, 637 firms were coded as producing a product and 498 firms as providing a service.
The median size of the firms was 22 employees, and firm sizes ranged from 23 firms with only l employee to a company with more than 10,000 employees. However, one-quarter of the responding firms reported 8 or fewer employees and three-quarters had 82 or fewer employees.
Responses to the question concerning the age of technology used in producing the firm's primary product or service are given in Table 2. The responses to the transportation questions are given in Table 3.
ANALYSIS
TABLE 2 Age of Technology Used in Production
Less than l year I to 5 years 6 to 10 years 11 to 20 years More than 20 years Multiple responses No response
No.of Firms
47 374 140 146 36S
41 23
Percentage
4 33 12 13 32
4 2
TABLE 3 Importance of Transportation
No. of Firms Percentage
Importance of Transport of Materials and Products to and from Markets and Suppliers
Very important 622 SS Important 274 24 Neither 110 10 Unimportant 63 5 Very unimportant 60 5 No response 7 l
Importance of Access of Personnel to Others in the Industry, Such as Clients, Firms in Similar Product Lines, Educators, Researchers , and Trade Representatives
Very important 374 33 Important 391 3S Neither 240 21 Unimportant 79 7 Very unimportant 49 4 No response 3
Importance of Quality of Transportation Facilities and Services in Making the Community a Pleasant Place to Live and Work
Very important Important Neither Unimportant Very unimportant No response
409 488 176 44 17 2
36 43 16 4 I
Methodology
Using the variables age of technology, SIC code, firm size, and firm type, the sample was partitioned into 16 subsamples. All variables were dichotomized. Age of technology (AGETECH) was defined by two val-
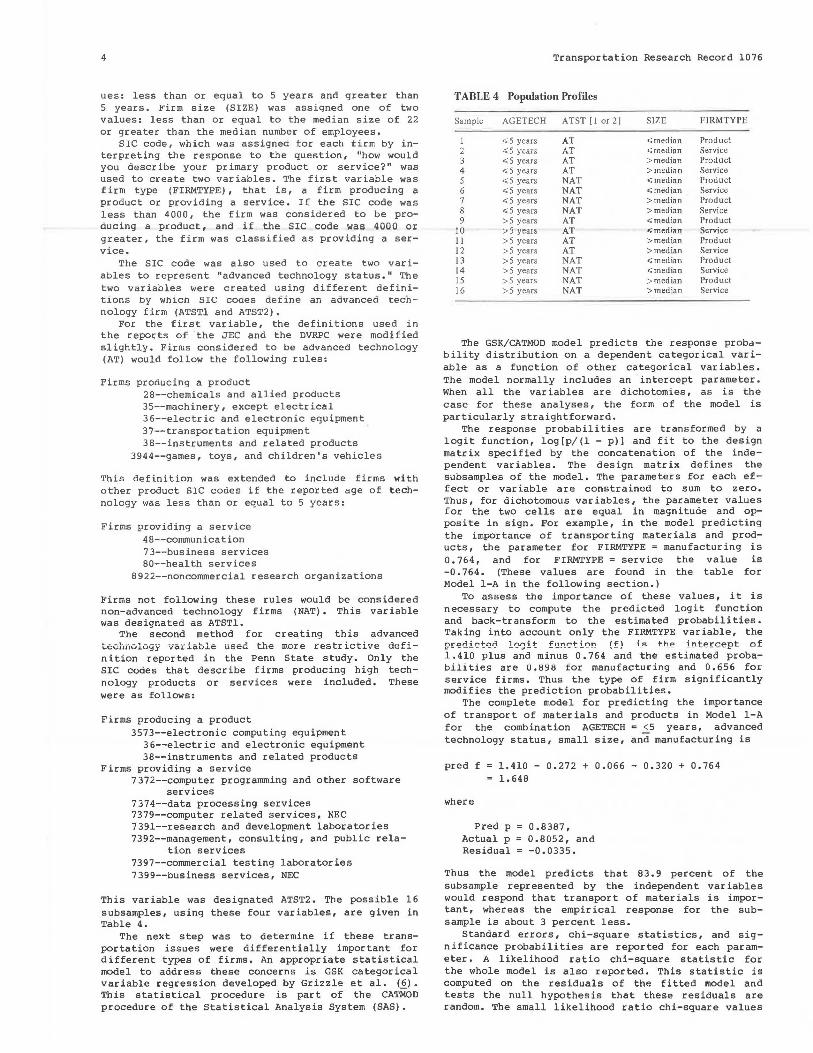
4
ues: less than or equal to 5 years and greater than 5 years. Firm size (SIZE) was assigned one of two values: less than or equal to the median size of 22 or greater than the median number of employees.
SIC code, which was assigned tor each tirm by interpreting the response to the question, "how would you describe your primary product or service?" was used to create two variables. The first variable was firm type (FIRMTYPE) , that is, a firm producing a product or providing a service. If the SIC code was less than 4000, the firm was considered to be producing a product, and if the SIC code was 4000 or greater, the firm was classified as providing a service.
The SIC code was also used to create two variables to represent "advanced technology status." The two variables were created using different definitions by which SI C codes de f ine an advanced tech nology firm (ATSTl and ATST2).
For the first variable, the definitions used in the reports of the JEC and the DVRPC were modified slightly. Firms considered to be advanced technology (AT) would follow the following rules:
Firms producing a product 28--chemicals and allied products 35--machinery, except electrical 36--electric and electronic equipment 37--transportation equipment 38--instruments and related products
3944--games, toys, and children's vehicles
This definition was extended to include firms with other product SIC codes if the reported age of technology was less than or equal to 5 years:
Firms providing a service 48--communication 73--business services 80--health services
8922--noncommercial research organizations
Firms not following these rules would be considered non-advanced technology firms (NAT). This variable was designated as ATSTl.
The second method for creating this advanced technology variable used the more reatr icti•vTe dafi-nition reported in the Penn State study. Only the SIC codes that describe firms producing high technology products or services were included. These were as follows:
Firms producing a product 3573--electronic computing equipment
36--electric and electronic equipment 38--instruments and related products
Firms providing a service 7372--computer programming and other software
services 7374--data processing services 7379--computer related services, NEC 7391--research and development laboratories 7392--management, consulting, and public rela-
tion services 7397--commercial testing laboratories 7399--business services, NEC
This variable was designated ATST2. The possible 16 subsamples, using these four variables, are given in Table 4.
The next step was to determine if these transportation issues were differentially important for different types of firms. An appropriate statistical model to address these concerns is GSK categorical variable regression developed by Grizzle et al. (§). This statistical procedure is part of the CATMOD procedure of the Statistical Analysis System (SAS).
Transportation Research Record 1076
TABLE4 Population Profiles
Sample AGETECH ATST [I or2] SIZE FIRMTYPE
I .;;5 years AT <;median Pro du ct 2 ,;;;; 5 years AT .:;;;median Servi ce 3 ..;; 5 years AT >median Product 4 ..;; 5 years AT >median Service 5 ~5 years NAT .;;;;;medfan Product 6 ..;; 5 years NAT ...:median Service 7 ,,;5 years NAT >median Product 8 ..;5 years NAT > median Service 9 >5 years AT .;;;;; median Product
10 :>5 yean AT <;median Service II >5 years AT > median Product 12 >5 years AT > median Service 13 >5 years NAT ....;; median Product 14 >5 years NAT o.;:,;; median Service 15 >5 years NAT > median Product 16 >5 years NAT >median Service
The GSK/CATMOD model predicts the response probdb ili ty distribution on a dependent categorical variable as a function of other categorical variables. The model normally includes an intercept parameter. When all the variables are dichotomies, as is the case for these analyses, the form of the model is particularly straightforward.
The response probabilities are transformed by a legit function, log[p/(l - p)] and fit to the design matrix specified by the concatenation of the independent variables. The design matrix defines the subsamples of the model. The parameters for each effect or variable are constrained to sum to zero. Thus, for dichotomous variables, the parameter values for the two cells are equal in magnitude and opposite in sign. For example, in the model predicting the importance of transporting materials and products, the parameter for FIRMTYPE = manufacturing is 0.764, and for FIRMTYPE =service the value is -0. 764. (These values are found in the table for Model 1-A in the following section.)
To assess the importance of these values, it is necessary to compute the predicted legit function and back-transform to the estimated probabilities. Taking into account only the FIRMTYPE variable, the predicted logit function (f) is the iri.t~rcept of 1.410 plus and minus 0.764 and the estimated probabilities are 0 .898 for manufacturing and O. 656 for service firms. Thus the type of firm significantly modifies the prediction probabilities.
The complete model for predicting the importance of transport of materials and products in Model 1-A for the combination AGETECH = <5 years, advanced technology status, small size, and manufacturing is
pred f 1.410 - 0.272 + 0.066 - 0.320 + 0.764 1. 648
where
Pred p Actual p Residual
0.8387, 0.8052, and -0.0335.
Thus the model predicts that 83. 9 percent of the subsample represented by the independent variables would respond that transport of materials is important, whereas the empirical response for the subsample is about 3 percent less.
Standard errors, chi-square statistics, and significance probabilities are reported for each parameter. A likelihood ratio chi-square statistic for the whole model is also reported. This statistic is computed on the residuals of the fitted model and tests the null hypothesis that these residuals are random. The small likelihood ratio chi-square values
Hummon et al.
and probabilities greater than 0.05 or 0.10 indicate that the null hypothesis cannot be rejected and that the model fits the data. Finally, all parameters are estimated using the maximum likelihood option of CATMOD.
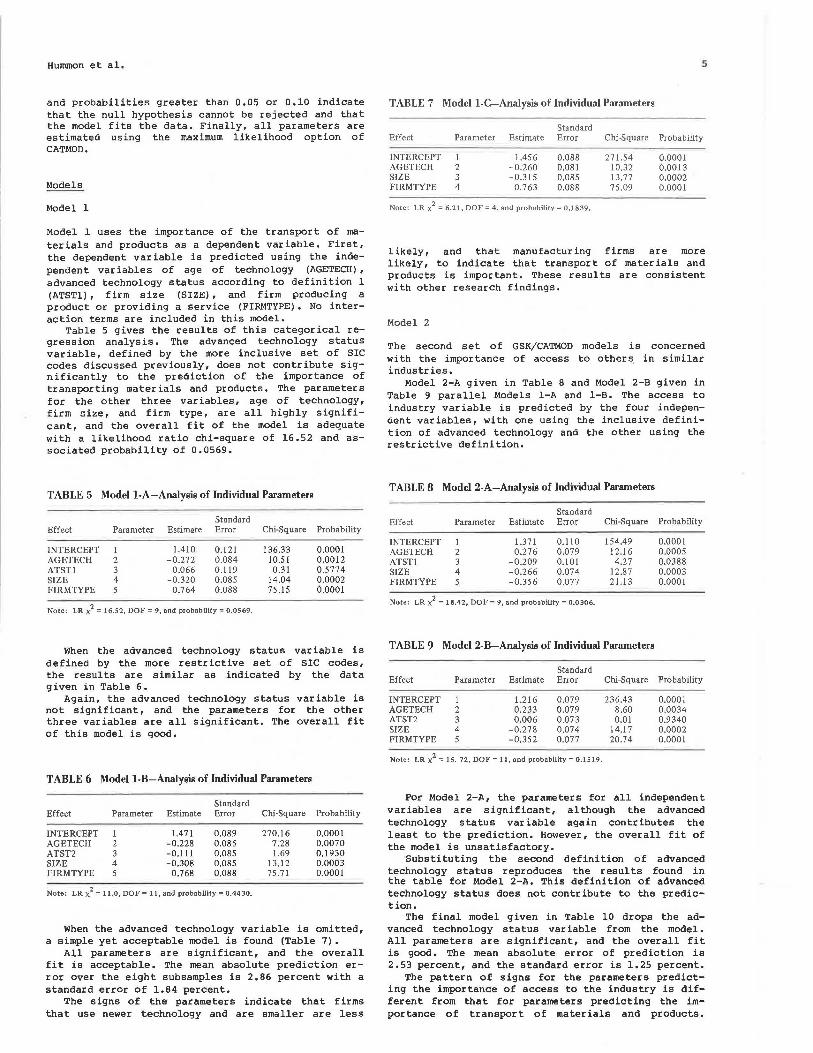
Model 1
Model 1 uses the importance of the transport of materials and products as a dependent variable. First, the dependent variable is predicted using the independent variables of age of technology (AGETECH), advanced technology status according to definition 1 (ATSTl) , firm size (SIZE) , and firm producing a product or providing a service (FIRMTYPE). No interaction terms are included in this model.
Table 5 gives the results of this categorical regression analysis. The advanced technology status variable, defined by the more inclusive set of SIC codes discussed previously, does not contribute significantly to the prediction of the importance of transporting materials and products. The parameters for the other three variables, age of technology, firm size, and firm type, are all highly significant, and the overall fit of the model is adequate with a likelihood ratio chi-square of 16.52 and associated probability of 0.0569.
TABLE 5 Model I-A-Analysis of Individual Parameters
Standard Effect Parameter Estimate Error Chi-Square Probability
INTERCEPT I 1.410 0.121 136.33 0.0001 AGETECH 2 -0.272 0.084 10.51 0.0012 ATST! 3 0.066 0.119 0.31 0.5774 SIZE 4 -0.320 0.085 14.04 0.0002 FIRM TYPE 5 0.764 0.088 75.15 0.0001
Note: LR x2 = 16.52, DOF = 9, and probability= 0.0569.
When the advanced technology status variable is defined by the more restrictive set of SIC codes, the results are similar as indicated by the data given in Table 6.
Again, the advanced technology status variable is not significant, and the parameters for the other three variables are all significant. The overall fit of this model is good.
TABLE 6 Model 1-B-Analysis of Individual Parameters
Standard Effect Parameter Estimate Error Chi-Square Probability
INTERCEPT 1 1.471 0.089 270.16 0.0001 AGETECH 2 -0.228 0.085 7.28 0.0070 ATST2 3 -0.111 0.085 1.69 0.1930 SIZE 4 -0.308 0.085 13.12 0.0003 FIRM TYPE 5 0.768 0.088 75.71 0.0001
Note: LR x2 = 11.0, DOF = 11, and probability= 0.4430.
When the advanced technology variable is omitted, a simple yet acceptable model is found (Table 7) •
All parameters are significant, and the overall fit is acceptable. The mean absolute prediction error over the eight subsamples is 2.86 percent with a standard error of 1.84 percent.
The signs of the parameters indicate that firms that use newer technology and are smaller are less
5
TABLE 7 Model 1-C-Analysis of Individual Parameters
Standard Effect Parameter Estimate Error Chi-Square Probability
INTERCEPT I 1.456 0.088 271.54 0.0001 AGETECH 2 -0.260 0.081 10.32 0.0013 SIZE 3 -0.315 0.085 13.77 0.0002 FIRM TYPE 4 0.763 0.088 75.09 0.0001
Note: LR X 2 = 6.21, DOF = 4, and probability= 0.1839.
1 ikely, and that manufacturing firms are more likely, to indicate that transport of materials and products is important. These results are consistent with other research findings.
Model 2
The second set of GSK/CATMOD models is concerned with the importance of access to others, in similar industries.
Model 2-A given in Table 8 and Model 2-B given in Table 9 parallel Models 1-A and 1-B. The access to industry variable is predicted by the four independent variables, with one using the inclusive definition of advanced technology and the other using the restrictive definition.
TABLES Model 2-A-Analysis of Individual Parameters
Standard Effect Parameter Estimate Error Chi-Square Probability
INTERCEPT 1 1.371 0.110 154.49 0.0001 AGETECH 2 0.276 0.079 12.16 0.0005 ATST! 3 -0.209 0.101 4.27 0.0388 SIZE 4 -0.266 0.074 12.87 0.0003 FIRM TYPE 5 -0.356 0.077 21.13 0.0001
Note: LR x2 = 18.42, DOF = 9, and probability= 0.0306.
TABLE9 Model 2-B-Analysis of Individual Parameters
Standard Effect Parameter Estimate Error Chi-Square Probability
INTERCEPT 1 1.216 0.079 236.43 0.0001 AGETECH 2 0.233 0.079 8.60 0.0034 ATST2 3 0,006 0.073 0.01 0.9340 SIZE 4 -0.278 0.074 14.17 0.0002 FIRMTYPE 5 -0.352 0.077 20.74 0.0001
Note: LR x2 = 15. 72, DOF = 11, and probability= 0.1519.
For Model 2-A, the parameters for all independent variables are significant, although the advanced technology status variable again contributes the least to the prediction. However, the overall fit of the model is unsatisfactory.
Substituting the second definition of advanced technology status reproduces the results found in the table for Model 2-A. This definition of advanced technology status does not contribute to the prediction.
The final model given in Table 10 drops the advanced technology status variable from the model. All parameters are significant, and the overall fit is good. The mean absolute error of prediction is 2.53 percent, and the standard error is 1.25 percent.
The pattern of signs for the parameters predicting the importance of access to the industry is different from that for parameters predicting the importance of transport of materials and products.
6
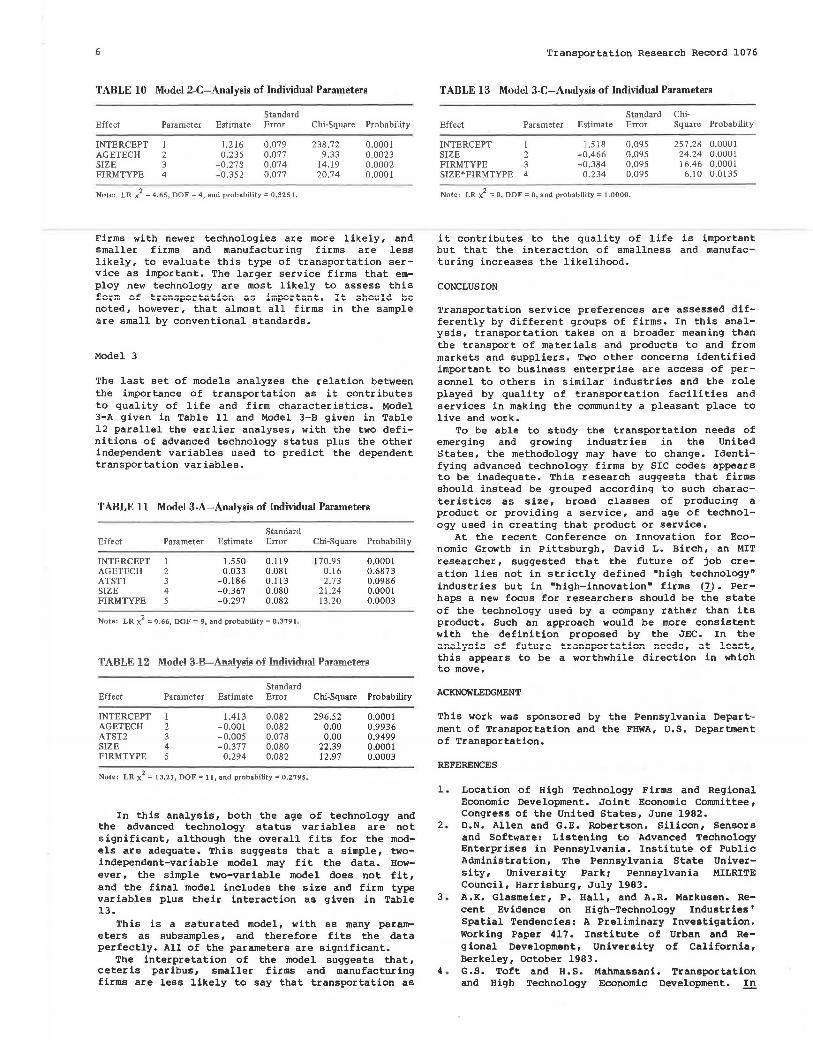
TABLE 10 Model 2-C-Analysis of Individual Parameters
Standard Effect Parameter Estimate Error Chi-Square Probability
INTERCEPT 1.216 0.079 238.72 0.0001 AGETECH 2 0.235 0.077 9.33 0.0023 SIZE 3 -0.278 0.074 14.19 0.0002 FIRMTYPE 4 -0.352 0.077 20.74 0.0001
Note: LR x2 = 4.65, DOF = 4, and probability= 0.3251.
Firms with newer technologies are more likely, and smaller firms and manufacturing firms are less likely , to evaluate this type of transportation service as important. The larger service firms that employ new technology are most likely to assess this ,f!,.._ ......... .f! ""----..... --&. ...... .: .............. -=-~- .... -- .... .._...,.._,., ..,.._ ... ...,,..1u;;;i.t"""''- ._~ ... .._...,,, ""'""' .i.111.t"-'.l. ... r;.t.ll""•
noted, however, that almost all firms in the sample are small by conventional standards.
Model 3
The last set of models analyzes the relation between the importance of transportation as it contributes to quality of life and firm characteristics. Model 3-A given in Table 11 and Model 3-B given in Table 12 parallel the earlier analyses, with the two definitions of advanced technology status plus the other independent variables used to predict the dependent transportation variables.
TABLE 11 Model 3-A-Analysis of Individual Parameters
Standard Effect Parameter Estimate Error Chi-Square Probability
INTERCEPT 1 1.550 0.119 170.95 0.0001 AGETECH 2 0.033 0.081 0.16 0.6873 ATSTI 3 -0.186 0.113 2.73 0.0986 SIZE 4 -0.367 0.080 21.24 0.0001 FIRMTYPE 5 -0.297 0.082 13.20 0.0003
Note: LR x2 = 9.66, DOF = 9, and probability= 0.3791.
TABLE 12 Model 3-B-Amtlysis of Individual Parnmeter8
Standard Effect Parameter Estimate Error Chi-Square Probability
INTERCEPT 1 1.413 0.082 296.52 0.0001 AGETECH 2 -0.001 0.082 0.00 0.9936 ATST2 3 -0.005 0.078 0.00 0.9499 SIZE 4 -0.377 0.080 22.39 0.0001 FIRMTYPE 5 0.294 0.082 12.97 0.0003
Note: LR x2 = 13.21, DOF = 11, and probability= 0.2795 .
In this analysis, both the age of technology and the advanced technology status variables are not significant, although the overall fits for the models are adequate. This suggests that a simple, twoindependent-var iable model may fit the data. However, the simple two-variable model does not fit, and the final model includes the size and firm type variables plus their interaction as given in Table 13.
This is a saturated model, with as many parameters as subsamples, and therefore fits the data perfectly. All of the parameters are significant.
The interpretation of the model suggests that, ceteris paribus, smaller firms and manufacturing firms are less likely to say that transportation as
Transportation Research Record 1076
TABLE 13 Model 3-C-Analysis of Individual Parameters
Standard Chi-Effect Parameter Estimate Error Square Probability
INTERCEPT 1 1.518 0.095 257 .28 0.0001 SIZE 2 -0.466 0.095 24.24 0.0001 FIRM TYPE 3 -0.384 0.095 16.46 0.0001 SIZE*FIRMTYPE 4 0.234 0.095 6.10 0.0135
Note: LR x2 = 0, DOF = o, and probability= 1.0000.
it contributes to the quality of life is important but that the interaction of smallness and manufacturing increases the likelihood.
CONCLUSION
Transportation service preferences are assessed differently by different groups of firms. In this analysis, transportation takes on a broader meaning than the transport of materials and products to and from markets and suppliers. Two other concerns identified important to business enterprise are access of personnel to others in similar industries and the role played by quality of transportation facilities and services in making the community a pleasant place to live and work.
To be able to study the transportation needs of emerging and growing industries in the United ::ltates, the methodology may have to change. Identifying advanced technology firms by SIC codes appears to be inadequate. This research suggests that firms should instead be grouped according to such characteristics as size, broad classes of producing a product or providing a service, and age of technology used in creating that product or service.
At the recent Conference on Innovation for Economic Growth in Pittsburgh, David L. Birch, an MIT researcher, suggested that the future of job creation lies not in strictly defined "high technology• industries but in "high-innovation" firms <ll. Perhaps a new focus for researchers should be the state of the technology used by a company rather than its product. Such an approach would be more consistent with the definition proposed by the JEC. In the anal~"sis cf futur~ transportation needs, at least, this appears to be a worthwhile direction in which to move.
ACKNOWLEDGMENT
This work was sponsored by the Pennsylvania Department of Transportation and the FHWA, U.S. Department of Transportation.
REFERENCES
l . Location of High Technology Firms and Regional Economic Development. Joint Economic Committee, Congress of the United States, June 1982.
2. D.N. Allen and G.E. Robertson. Silicon, Sensors and Software: Listening to Advanced Technology Enterprises in Pennsylvania. Institute of Public Administration, The Pennsylvania State University, University Parki Pennsylvania MILRITE Council, Harrisburg, July 1983.
3. A.K. Glasmeier, P. Hall, and A.R. Markusen. Recent Evidence on High-Technology Industries' Spatial Tendencies: A Preliminary Investigation. Working Paper 417. Institute of Urban and Regional Development, University of California, Berkeley, October 1983.
4 . G.S. Toft and H.S. Mahmassani. Transportation and High Technology Economic Development. In
Transportation Research Record 1076
Transportation Research Record 984, TRB, National Research Council, Washington, D.C., 1984, pp. 22-29.
S. Transportation Needs for High Technology Firms: Route 202 in Chester and Montgomery Counties. Delaware Valley Regional Planning Commission, Philadelphia, Pa., February 1984.
6. H.E. Grizzle, F. Starmer, and G.C. Koch. Analysis of Categorical Data by Linear Models. Biornetr ics, Vol. 25, 1969, pp. 489-504.
7 . States Urged to Focus on Innovative Firms. Pittsburgh Post-Gazette, July 31, 1985.
7
The contents of this report reflect the views of the authors who are responsible for the facts and the accuracy of the data presented herein. The contents do not necessarily reflect the official views or policies of the U.S. Department of Transportation, the FHWA, or the commonwealth of Pennsylvania. This paper does not constitute a standard, specification, or regulation.
Publication of this paper sponsored by Committee on Transportation Programming, Planning and Systems Evaluation.
Sufficiency Ratings for Secondary Roads:
Model Development
CLETUS R. MERCIER
ABSTRACT
Work has been done to develop nurner ical evaluation sys terns for priority planning use with secondary roads. However, the resulting systems are somewhat local in orientation and are not easily usable in other parts of the country because of differences in road netwo·rks, terrain, soil and weather conditions, and even political climate. Most state highway organizations use a form of numerical evaluation called sufficiency rating systems for priority planning. However, this practice is not prevalent in county highway organizations. County highway administrators have used a priority system that is commonly the composite of (a) knowledge of the local road network and its condition, (b) comparison of road conditions with a set of objectives (whether formally or informally adopted), and (c) political expediency. The research reported here was undertaken to develop a sufficiency rating system for secondary roads in Iowa. If a usable system that would yield reasonable results were available, county engineers would have an additional tool to assist them in arriving at a defensible road improvement program. The steps taken to develop the proposed model are recounted in this paper. Described are the instrument used to gather data to choose the rating criteria, the criteria chosen, their relative weights, and the final form of the model.
Work has been done to develop and improve numerical evaluation systems for priority planning use with secondary roads (_!-1.l. However, the resulting systems are local in orientation and have limited application to planning needs of road systems in other parts of the country. Enough differences exist in road networks, terrain, soil conditions, weather conditions, and even political climate to preclude direct application.
There are elements of these systems that are reusable in other locations. Most rating systems are patterned after the sufficiency rating system originally developed by the Arizona Highway Department in
Department of Engineering, 403 Marston Hall, Iowa State University, Ames, Iowa 50011.
1946. Most systems even use much the same list of rating criteria and the maximum composite rating of 100, although there are some variations in the relative importance of the criteria.
The choice of rating criteria and the relative importance of each criterion compared with the others used make it possible to tailor the system to fit local needs. This is because sufficiency ratings are "descriptive": they use a mathematical expression as a measure of immediacy of need. The choice of criteria used'and their relative importance (relative weight) is an ernpir ical process based on an evaluation of past design practice and the resulting investment.
Although most state highway organizations use sufficiency rating scores for priority planning, the