importance of monsoon rainfall in mass fluxes of filtered and unfiltered mercury in gwangyang bay,...
TRANSCRIPT
Science of the Total Environment 409 (2011) 1498–1503
Contents lists available at ScienceDirect
Science of the Total Environment
j ourna l homepage: www.e lsev ie r.com/ locate /sc i totenv
Importance of monsoon rainfall in mass fluxes of filtered and unfiltered mercuryin Gwangyang Bay, Korea
Jiyi Jang, Seunghee Han ⁎School of Environmental Science and Engineering, Gwangju Institute of Science and Technology, Gwangju 500-712, Republic of Korea
⁎ Corresponding author. Tel.: +82 62 715 2438; fax:E-mail address: [email protected] (S. Han).
0048-9697/$ – see front matter © 2011 Elsevier B.V. Adoi:10.1016/j.scitotenv.2011.01.003
a b s t r a c t
a r t i c l e i n f oArticle history:Received 24 June 2010Received in revised form 25 December 2010Accepted 5 January 2011Available online 28 January 2011
Keywords:MercuryParticleMonsoonRainfallSpeciationCoastal water
We investigated the effects of the East Asian Summer Monsoon (EASM), which brings approximately half ofKorea's annual rainfall in July, on the concentration and particle–water partitioning, and sources of Hg incoastal waters. Surface seawater samples were collected from eight sites in Gwangyang Bay, Korea, during themonsoon (July, 2009) and non-monsoon dry (April and November, 2009) seasons and the concentrations ofsuspended particulate matter, chlorophyll-a, and unfiltered and filtered Hg were determined. We foundsignificant (pb0.05) increases in filtered Hg in the monsoon season (1.8±0.019 pM) compared to the dryseason (0.62±0.047 pM). In contrast, the Hg concentrations associated with particles showed no significantdifferences (pN0.05) between the monsoon (459±141 pmol g−1) and the dry season (346±30 pmol g−1),which resulted in decreased particle–water partition coefficients of Hg in the monsoon season compared tothe values in the dry season: 5.7±0.1 in April, 5.3±0.1 in July, and 5.8±0.1 in November. The annual Hginput to Gwangyang Bay was estimated at 64±6.6 mol yr−1 and 27±1.9 mol yr−1 for unfiltered and filteredHg, respectively. The Hg discharged from rivers was a major source of Hg in Gwangyang Bay: the river inputcontributed 83±13% of total input of unfiltered and 73±6.0% of filtered Hg. On amonthly basis, unfiltered Hginput was 17±11 mol month−1 in the monsoon season and 3.2±0.70 mol month−1 in the dry season, whilefiltered Hg input was 7.1±4.1 mol month−1 in the monsoon and 1.3±0.26 mol month−1 in the dry.Consequently, the EASM resulted in an unfiltered Hg input 5.3 times greater than the mean dry month inputand a filtered Hg input 5.5 times greater than the mean dry month input, which is mainly attributable toenhanced river water discharge during the monsoon season.
+82 62 715 2434.
ll rights reserved.
© 2011 Elsevier B.V. All rights reserved.
1. Introduction
The East Asian Summer Monsoon (EASM), called the Changma inKorea, is a seasonal phenomenon characterized by intense rainfallbetween June and August in China, Korea, and Japan. Based on in situand satellite observations, the EASM arrives in Korea every July aftermoving across the Indo-China peninsula (mid-May), the YangtzeRiver basin, and the lower Yellow River valley (mid-June) (Qian et al.,2002). In Korea, the mean annual rainfall from year 2000 to 2009 was1589 mm yr−1, and approximately 40% of this annual rainfall,618 mm yr−1, occurred during the EASM (Korea MeteorologicalAdministration).
The EASM is known to influence the concentration of atmospheric Hgin Taiwan and Korea. The monthly means of gaseous elemental Hgconcentration determined from a high-elevation background station inTaiwan indicated that the lowest value occurred in summer (1.3±0.39 ng m−3) and the highest in winter (1.9±0.60 ng m−3; Sheu et al.,2010). The low atmospheric Hg concentration in the summer seasonwas
explained by regional wind field variation and pronounced monsoonactivity. A similar pattern was reported for Seoul, Korea (Kim and Kim,2001), where the highestmean gaseous Hg in airwas observed inwinter(6.0±4.2 ng m−3) and the lowest mean in summer (5.0±2.6 ng m−3).In the same report, the mean concentration of gaseous Hg was clearlylower for July andAugust than for June,which appears to reflect the effectof the EASM (Kim and Kim, 2001). Comparable results were reported byShon et al. (2008) for gaseous elemental Hg variation in Seoul.
In general, total Hg concentrations are higher in rainwater than incoastal water. For instance, total Hg in unfiltered rainwater rangedfrom 10 to 150 pM (20–80 pM in Sichuan province, China, Fu et al.,2008; 30–150 pM in Guizhou province, China, Guo et al., 2008;10–150 pM in Maryland, USA, Lawson and Mason, 2001) and total Hgin unfiltered coastal water ranged from 1 to 25 pM (6.0±1.5 pM inthe South China Sea, Fu et al., 2010; 2–25 pM in Galveston Bay, USA,Han et al., 2006; 1–20 pM in the North Sea, Leermakers et al., 2001).Therefore, depending on the relative extent of wet deposition versusother sources, atmospheric deposition could be a substantial source ofHg in coastal water. Several temperate (e.g., Tokyo Bay andChesapeake Bay) and arctic (e.g., Northern Alaska) coastal systemsreceive considerable amounts of Hg due to atmospheric deposition(Fitzgerald, et al., 2005; Mason et al., 1999; Sakata et al., 2006).
1499J. Jang, S. Han / Science of the Total Environment 409 (2011) 1498–1503
Following atmospheric deposition, particle-associated fractions of Hgsink into the sediment. There, methylating bacteria convert inorganic Hg(II) to monomethylmercury (MMHg; Fitzgerald et al., 2007; King et al.,2001). Consequently, increased atmospheric deposition of Hg in coastalsystems is likely to result in increased MMHg content in sediments andaquatic biota. Recently, Hammerschmidt and Fitzgerald (2005, 2006)reported a positive correlation between wet atmospheric deposition ofHg and the MMHg body burdens in aquatic biota. For this reason,scavenging of Hg by suspended particulate matter (SPM) is important incontrolling Hg bioavailability (Balcom et al., 2008; Cardona-Marek et al.,2007; Lacerda andGoncalves, 2001). Particulate organicmatter (POM) isa critical component of SPM in the scavenging of Hg (Turner et al., 2004).In addition, colloidal coagulation might also be an important process forsinking dissolved Hg from estuarine waters in particulate form (Stordalet al., 1996a, 1996b). For example, using Hg radioisotopes, Stordal et al.(1996b)were able to demonstrate the transfer ofHg fromacolloidal poolto a particulate pool, suggesting that colloids served as intermediaries inthe removal of Hg from estuarine waters by particle scavenging.
The importance of the EASM in the East Asia region on seasonalvariation of coastal Hg concentration has not yet been reported. In thepresent study, we collected coastal water samples from GwangyangBay, located on the southern coast of Korea, in pre-monsoon, monsoon,and post-monsoon seasons. From these samples, we determinedchlorophyll-a, SPM, and Hg concentrations in unfiltered and filteredwater. The goal of this studywas to evaluate the importance of the EASMin determining the Hg mass flux and to determine the role of EASM inincreasing coastal water Hg concentration.
2. Materials and methods
2.1. Study area
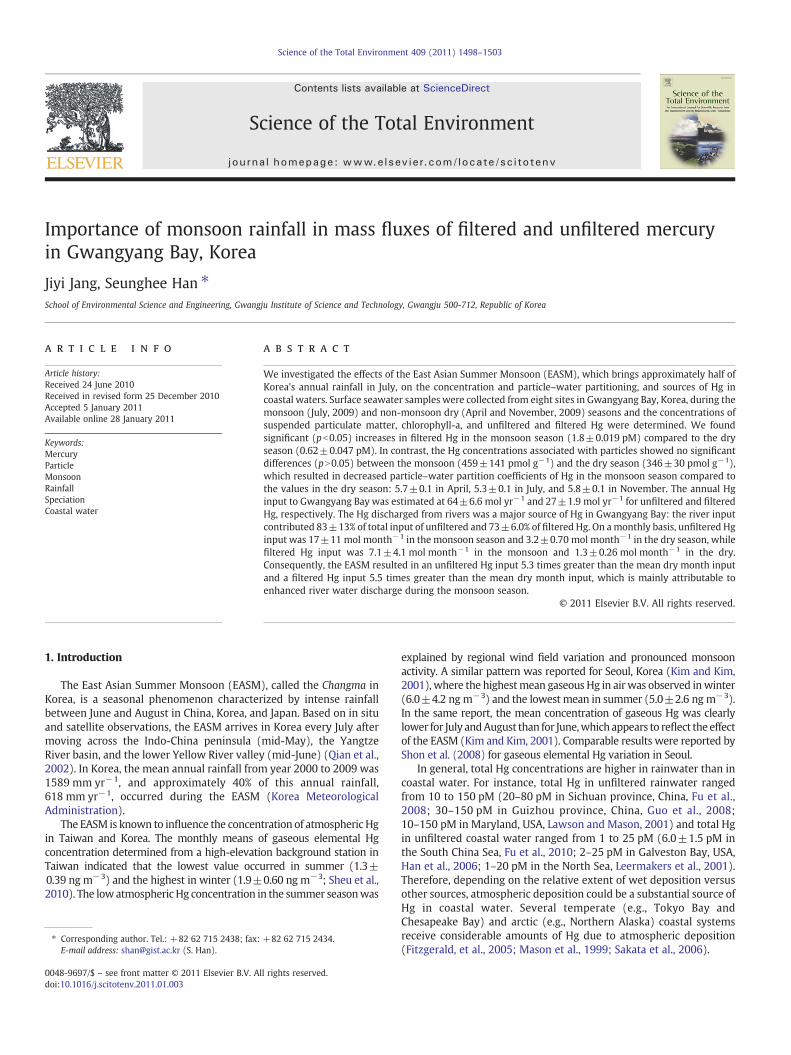
Gwangyang Bay, located on theKorean Peninsula's southern coast, is17 kmwide and 9 km long, with a total area of approximately 230 km2
(Fig. 1). It is semi-enclosed,with seawater exchangeoccurring through anarrow passage betweenYeosu andNamhae Islands. The average depthof the inner bay (Sites 1–4) is approximately 5 m,while that of the outerbay (Sites 5–8) is over 10 m (Kim et al., 2007). Due to rapidindustrialization and population growth since the 1970s, GwangyangBay has experienced increased industrial and domestic wastewaterdischarge and subsequent episodes of coastal eutrophication (Hyunet al., 2006; Lee et al., 2005). Mercury concentrations have not yet beendetermined in this area; however, sedimentary pollution by heavymetals such as Cd, Co, Pb, and Zn has been reported (Hyun et al., 2006).The average discharge rate from the Seomjin River was estimated at
Fig. 1. Sampling locations in
0.21×10⁶m3d−1 in 2009, which accounted for over 90% of the overallriver water discharged into the bay (Kim et al., 2007).
2.2. Sample collection
We collected surface seawater samples on April 10, July 2, andNovember 16, 2009 from eight sites in Gwangyang Bay (Fig. 1). The Julysampling was carried out during the EASM. We collected filtered watersamples forHganalysis in acid-cleaned Teflonbottles using acid-cleanedTeflon tubing connected to 0.2 μm pore size polyethersulfone (PES)cartridge filters. Surface water samples were drawn from a depth ofapproximately 30 cm using a peristaltic pump on a boat. We collectedunfiltered water samples using the samemethod, but without filtration.Sample bottleswere double-bagged and transported to the laboratory inan ice-filled cooler. Approximately 250–500 mL of each water samplewas acidified at room temperature with 9 M H2SO4 to a 0.2% (v/v)concentration and then stored at 4 °C until analysis. Unfiltered watersamples for SPM and chlorophyll-a analysis were collected separately in1 L polyethylene bottles. Salinity, pH, water temperature, and dissolvedoxygen concentrations were measured in the field using a multipara-meter water quality meter.
For Hgmass flux calculation, we collected rainwater and river watersamples. Rainwater samples were collected from Gwangju on May 6,May 18, July 10, August 10, and September 11, 2010. Among these, Julyand August samples were used to determine Hg concentration inmonsoon rainwater. Unfiltered rainwater samples were collected inacid-cleaned 250–500 mL of Teflon bottles using acid-cleaned glassfunnels. Filtration was carried out immediately after the rainwatercollection. Unfiltered and filtered river water samples were collectedfrom the head of Gwangyang Bay (salinity 0–1 ppt) on October 21 usingthe surface water sampling procedures described above. Rainwater andriver water samples were acidified with 12 M HCl to a 0.5% (v/v)concentration and then stored at 4 °C until analysis.
2.3. Mercury analysis
Total Hg concentrations were analyzed using cold vapor atomicfluorescence spectrometry (CVAFS) after 24 h of ultraviolet (UV)oxidation (Choe et al., 2003; Gill and Bruland, 1990; Han et al., 2006).Following UV oxidation, approximately 100 mL of each sample wastreated with 500 μL of SnCl2 solution (1 M). The reduced Hg was thentrapped on a gold-coated quartz column by N2 purging. Mercuryreleased from the gold-coated quartz column by thermal desorptionwas detected using CVAFS. Themethod detection limit, defined as threetimes the standard deviation of themethod blank, was 0.17 pM, and the
Gwangyang Bay, Korea.
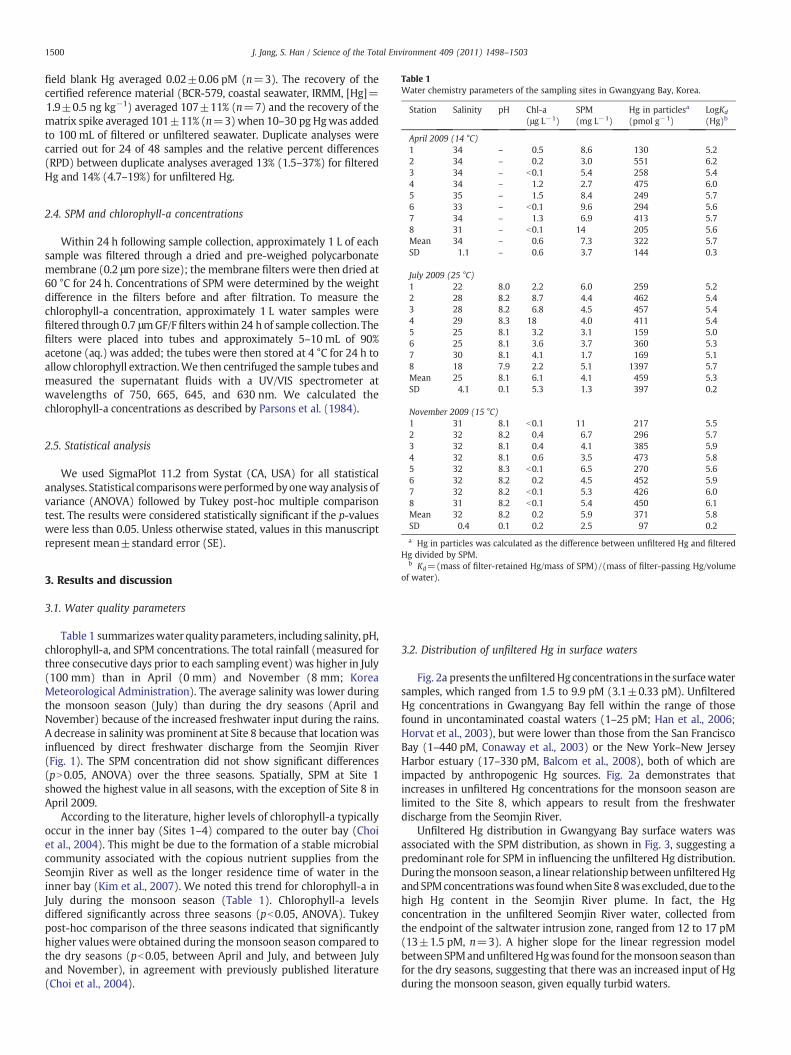
Table 1Water chemistry parameters of the sampling sites in Gwangyang Bay, Korea.
Station Salinity pH Chl-a(μg L−1)
SPM(mg L−1)
Hg in particlesa
(pmol g−1)LogKd
(Hg)b
April 2009 (14 °C)1 34 – 0.5 8.6 130 5.22 34 – 0.2 3.0 551 6.23 34 – b0.1 5.4 258 5.4
1500 J. Jang, S. Han / Science of the Total Environment 409 (2011) 1498–1503
field blank Hg averaged 0.02±0.06 pM (n=3). The recovery of thecertified reference material (BCR-579, coastal seawater, IRMM, [Hg]=1.9±0.5 ng kg−1) averaged 107±11% (n=7) and the recovery of thematrix spike averaged 101±11% (n=3)when 10–30 pg Hgwas addedto 100 mL of filtered or unfiltered seawater. Duplicate analyses werecarried out for 24 of 48 samples and the relative percent differences(RPD) between duplicate analyses averaged 13% (1.5–37%) for filteredHg and 14% (4.7–19%) for unfiltered Hg.
4 34 – 1.2 2.7 475 6.05 35 – 1.5 8.4 249 5.76 33 – b0.1 9.6 294 5.67 34 – 1.3 6.9 413 5.78 31 – b0.1 14 205 5.6Mean 34 – 0.6 7.3 322 5.7SD 1.1 – 0.6 3.7 144 0.3
July 2009 (25 °C)1 22 8.0 2.2 6.0 259 5.22 28 8.2 8.7 4.4 462 5.43 28 8.2 6.8 4.5 457 5.44 29 8.3 18 4.0 411 5.45 25 8.1 3.2 3.1 159 5.06 25 8.1 3.6 3.7 360 5.37 30 8.1 4.1 1.7 169 5.18 18 7.9 2.2 5.1 1397 5.7Mean 25 8.1 6.1 4.1 459 5.3SD 4.1 0.1 5.3 1.3 397 0.2
November 2009 (15 °C)
2.4. SPM and chlorophyll-a concentrations
Within 24 h following sample collection, approximately 1 L of eachsample was filtered through a dried and pre-weighed polycarbonatemembrane (0.2 μmpore size); the membrane filters were then dried at60 °C for 24 h. Concentrations of SPM were determined by the weightdifference in the filters before and after filtration. To measure thechlorophyll-a concentration, approximately 1 L water samples werefiltered through 0.7 μmGF/Ffilterswithin 24 h of sample collection. Thefilters were placed into tubes and approximately 5–10 mL of 90%acetone (aq.) was added; the tubes were then stored at 4 °C for 24 h toallow chlorophyll extraction.We then centrifuged the sample tubes andmeasured the supernatant fluids with a UV/VIS spectrometer atwavelengths of 750, 665, 645, and 630 nm. We calculated thechlorophyll-a concentrations as described by Parsons et al. (1984).
1 31 8.1 b0.1 11 217 5.52 32 8.2 0.4 6.7 296 5.73 32 8.1 0.4 4.1 385 5.94 32 8.1 0.6 3.5 473 5.85 32 8.3 b0.1 6.5 270 5.66 32 8.2 0.2 4.5 452 5.97 32 8.2 b0.1 5.3 426 6.08 31 8.2 b0.1 5.4 450 6.1Mean 32 8.2 0.2 5.9 371 5.8SD 0.4 0.1 0.2 2.5 97 0.2
a Hg in particles was calculated as the difference between unfiltered Hg and filtered
2.5. Statistical analysis
We used SigmaPlot 11.2 from Systat (CA, USA) for all statisticalanalyses. Statistical comparisonswere performedbyonewayanalysis ofvariance (ANOVA) followed by Tukey post-hoc multiple comparisontest. The results were considered statistically significant if the p-valueswere less than 0.05. Unless otherwise stated, values in this manuscriptrepresent mean±standard error (SE).
Hg divided by SPM.b Kd=(mass of filter-retained Hg/mass of SPM)/(mass of filter-passing Hg/volume
of water).
3. Results and discussion3.1. Water quality parameters
Table 1 summarizeswater quality parameters, including salinity, pH,chlorophyll-a, and SPM concentrations. The total rainfall (measured forthree consecutive days prior to each sampling event) was higher in July(100 mm) than in April (0 mm) and November (8 mm; KoreaMeteorological Administration). The average salinity was lower duringthe monsoon season (July) than during the dry seasons (April andNovember) because of the increased freshwater input during the rains.A decrease in salinity was prominent at Site 8 because that locationwasinfluenced by direct freshwater discharge from the Seomjin River(Fig. 1). The SPM concentration did not show significant differences(pN0.05, ANOVA) over the three seasons. Spatially, SPM at Site 1showed the highest value in all seasons, with the exception of Site 8 inApril 2009.
According to the literature, higher levels of chlorophyll-a typicallyoccur in the inner bay (Sites 1–4) compared to the outer bay (Choiet al., 2004). This might be due to the formation of a stable microbialcommunity associated with the copious nutrient supplies from theSeomjin River as well as the longer residence time of water in theinner bay (Kim et al., 2007). We noted this trend for chlorophyll-a inJuly during the monsoon season (Table 1). Chlorophyll-a levelsdiffered significantly across three seasons (pb0.05, ANOVA). Tukeypost-hoc comparison of the three seasons indicated that significantlyhigher values were obtained during the monsoon season compared tothe dry seasons (pb0.05, between April and July, and between Julyand November), in agreement with previously published literature(Choi et al., 2004).
3.2. Distribution of unfiltered Hg in surface waters
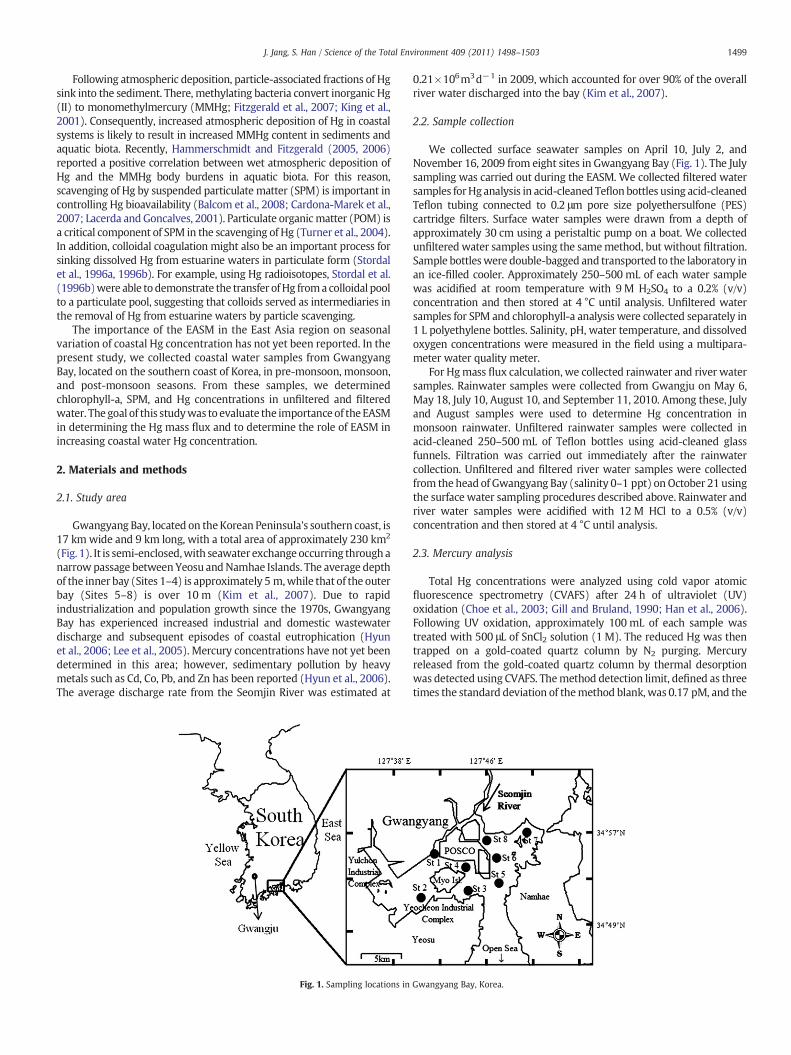
Fig. 2a presents theunfilteredHgconcentrations in the surfacewatersamples, which ranged from 1.5 to 9.9 pM (3.1±0.33 pM). UnfilteredHg concentrations in Gwangyang Bay fell within the range of thosefound in uncontaminated coastal waters (1–25 pM; Han et al., 2006;Horvat et al., 2003), but were lower than those from the San FranciscoBay (1–440 pM, Conaway et al., 2003) or the New York–New JerseyHarbor estuary (17–330 pM, Balcom et al., 2008), both of which areimpacted by anthropogenic Hg sources. Fig. 2a demonstrates thatincreases in unfiltered Hg concentrations for the monsoon season arelimited to the Site 8, which appears to result from the freshwaterdischarge from the Seomjin River.
Unfiltered Hg distribution in Gwangyang Bay surface waters wasassociated with the SPM distribution, as shown in Fig. 3, suggesting apredominant role for SPM in influencing the unfiltered Hg distribution.During themonsoon season, a linear relationship betweenunfilteredHgandSPMconcentrationswas foundwhenSite 8wasexcluded, due to thehigh Hg content in the Seomjin River plume. In fact, the Hgconcentration in the unfiltered Seomjin River water, collected fromthe endpoint of the saltwater intrusion zone, ranged from 12 to 17 pM(13±1.5 pM, n=3). A higher slope for the linear regression modelbetweenSPMandunfilteredHgwas found for themonsoon season thanfor the dry seasons, suggesting that there was an increased input of Hgduring the monsoon season, given equally turbid waters.
Station1 2 3 4 5 6 7 8
TH
g (p
M)
0
2
4
6
8
10
12Apr 2009Jul 2009Nov 2009
(a)
Station1 2 3 4 5 6 7 8
DH
g (p
M)
0.0
0.5
1.0
1.5
2.0
2.5
3.0
3.5(b)
Station1 2 3 4 5 6 7 8
%D
Hg/
TH
g
0
20
40
60
80
100(c)
Fig. 2. (a) Unfiltered Hg concentration (THg), (b) filtered Hg concentration (DHg), and(c) fraction of filtered Hg in unfiltered Hg in surface waters of Gwangyang Bay, Korea,collected in April, July, and November, 2009. (Error bars represent 14% errors induplicate sample analysis).
SPM (mg L-1)
0 2 4 6 8 10 12 14 16
TH
g (p
M)
0
2
4
6
8
10
12Apr 2009Jul 2009Nov 2009
r2=0.62p=0.036
r2=0.44p=0.005
St. 8
Fig. 3. Relationship between unfiltered Hg and SPM concentrations. Site 8 (circled) isnot included in the linear regression for July 2009, and April and November 2009 dataare included in one regression.
1501J. Jang, S. Han / Science of the Total Environment 409 (2011) 1498–1503
3.3. Distribution of filtered Hg in surface waters
Filtered Hg concentrations ranged from 0.32 to 2.7 pM (1.1±0.13 pM) in surfacewater samples (Fig. 2b).Many studies have reportedsimilar ranges of filtered Hg concentrations in pristine coastal waters(0.5–6 pM; Cossa et al., 1997; Han et al., 2006; Horvat et al., 2003),whereas those in contaminated areas tend to be higher than our values(0.4–60 pM; Balcom et al., 2008; Conaway et al., 2003; Lacerda andGoncalves, 2001). Filtered Hg concentration differed significantly acrossthe three seasons (pb0.05, ANOVA). Tukey post-hoc comparison of the
three seasons indicated that significantly higher values were obtainedfor themonsoon group than the dry groups (pb0.05, between April andJuly, and July andNovember), indicating an influenceofmonsoon rainfallon dissolved Hg concentration. Higher percentages of filtered overunfiltered Hg were noted for the monsoon season compared with thedry seasons (Fig. 2c): 26±3.9% in April, 55±6.1% in July, and 23±2.0%in November (pb0.05 between April and July, and July and November,Tukey post-hoc comparison), suggesting that the enhanced input of Hgduring themonsoon season appears to be limited to the dissolved phase.
3.4. Influence of monsoon rainfall on the particle–water partitioningof Hg
The Hg concentration in suspended particles (PHg) averaged 322±51 (SE) pmol g−1 in April, 459±141 (SE) pmol g−1 in July, and 371±34(SE) pmol g−1 inNovember (Table 1). Even thoughmeanPHgwashigherfor the monsoon season than for the dry seasons, this increase was notstatistically significant (p=0.55, ANOVA). This result indicates that theincreased slope of the linear regression model shown in Fig. 3 is indeedattributable to increased dissolved Hg concentration. The range of PHgfound in the surfacewaters of Gwangyang Baywas lower or similar to thelower limit of the PHg found in contaminated coastal waters (e.g., 420−8890 pmol g−1 in the New York–New Jersey Harbor estuary, Balcomet al., 2008). The influences of anthropogenic sources on PHg concentra-tion are well known to increase with proximity to industrial regions(Balcomet al., 2008). In thepresent study, although industrial facilities arelocated near Sites 2 and 3, these facilities did not appear to increase PHgconcentration.
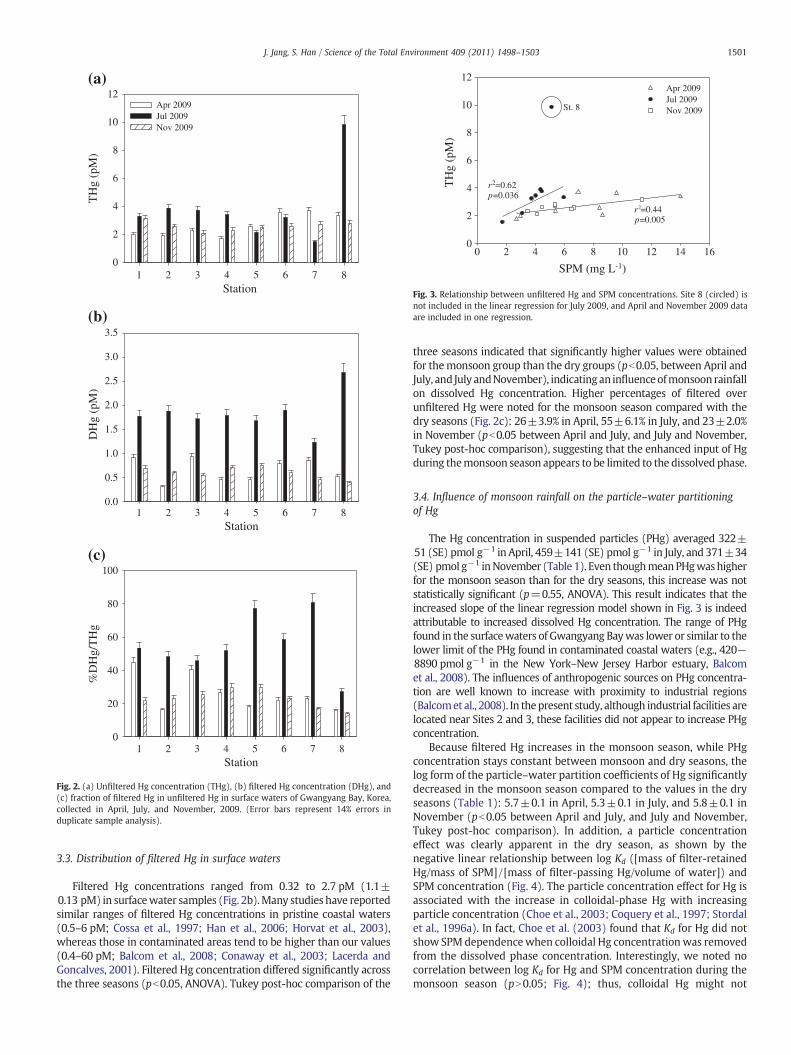
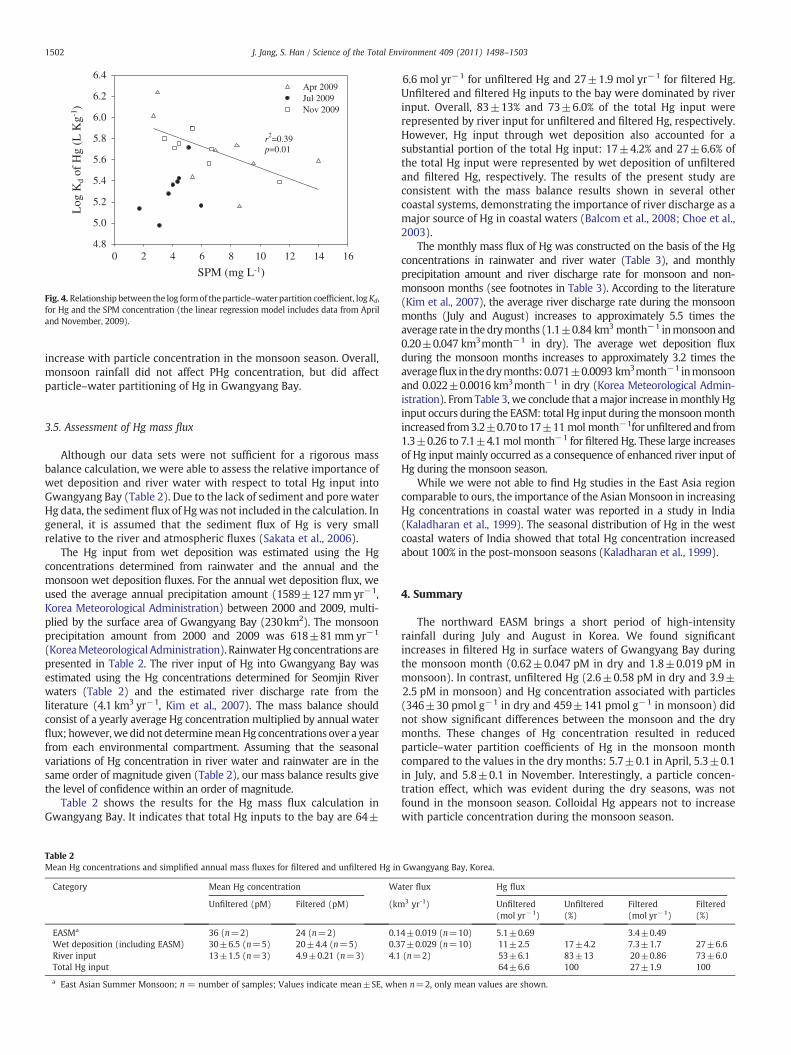
Because filtered Hg increases in the monsoon season, while PHgconcentration stays constant between monsoon and dry seasons, thelog form of the particle–water partition coefficients of Hg significantlydecreased in the monsoon season compared to the values in the dryseasons (Table 1): 5.7±0.1 in April, 5.3±0.1 in July, and 5.8±0.1 inNovember (pb0.05 between April and July, and July and November,Tukey post-hoc comparison). In addition, a particle concentrationeffect was clearly apparent in the dry season, as shown by thenegative linear relationship between log Kd ([mass of filter-retainedHg/mass of SPM]/[mass of filter-passing Hg/volume of water]) andSPM concentration (Fig. 4). The particle concentration effect for Hg isassociated with the increase in colloidal-phase Hg with increasingparticle concentration (Choe et al., 2003; Coquery et al., 1997; Stordalet al., 1996a). In fact, Choe et al. (2003) found that Kd for Hg did notshow SPM dependencewhen colloidal Hg concentrationwas removedfrom the dissolved phase concentration. Interestingly, we noted nocorrelation between log Kd for Hg and SPM concentration during themonsoon season (pN0.05; Fig. 4); thus, colloidal Hg might not
SPM (mg L-1)0 2 4 6 8 10 12 14 16
Log
Kd
of H
g (L
Kg-1
)
4.8
5.0
5.2
5.4
5.6
5.8
6.0
6.2
6.4Apr 2009Jul 2009Nov 2009
r2=0.39p=0.01
Fig. 4. Relationship between the log formof theparticle–water partition coefficient, logKd,for Hg and the SPM concentration (the linear regression model includes data from Apriland November, 2009).
1502 J. Jang, S. Han / Science of the Total Environment 409 (2011) 1498–1503
increase with particle concentration in the monsoon season. Overall,monsoon rainfall did not affect PHg concentration, but did affectparticle–water partitioning of Hg in Gwangyang Bay.
3.5. Assessment of Hg mass flux
Although our data sets were not sufficient for a rigorous massbalance calculation, we were able to assess the relative importance ofwet deposition and river water with respect to total Hg input intoGwangyang Bay (Table 2). Due to the lack of sediment and pore waterHg data, the sediment flux of Hgwas not included in the calculation. Ingeneral, it is assumed that the sediment flux of Hg is very smallrelative to the river and atmospheric fluxes (Sakata et al., 2006).
The Hg input from wet deposition was estimated using the Hgconcentrations determined from rainwater and the annual and themonsoon wet deposition fluxes. For the annual wet deposition flux, weused the average annual precipitation amount (1589±127 mm yr−1,Korea Meteorological Administration) between 2000 and 2009, multi-plied by the surface area of Gwangyang Bay (230km2). The monsoonprecipitation amount from 2000 and 2009 was 618±81 mm yr−1
(KoreaMeteorological Administration). RainwaterHg concentrations arepresented in Table 2. The river input of Hg into Gwangyang Bay wasestimated using the Hg concentrations determined for Seomjin Riverwaters (Table 2) and the estimated river discharge rate from theliterature (4.1 km3 yr−1, Kim et al., 2007). The mass balance shouldconsist of a yearly average Hg concentration multiplied by annual waterflux; however,wedid not determinemeanHg concentrations over a yearfrom each environmental compartment. Assuming that the seasonalvariations of Hg concentration in river water and rainwater are in thesame order of magnitude given (Table 2), our mass balance results givethe level of confidence within an order of magnitude.
Table 2 shows the results for the Hg mass flux calculation inGwangyang Bay. It indicates that total Hg inputs to the bay are 64±
Table 2Mean Hg concentrations and simplified annual mass fluxes for filtered and unfiltered Hg in
Category Mean Hg concentration W
Unfiltered (pM) Filtered (pM) (km
EASMa 36 (n=2) 24 (n=2) 0.1Wet deposition (including EASM) 30±6.5 (n=5) 20±4.4 (n=5) 0.3River input 13±1.5 (n=3) 4.9±0.21 (n=3) 4.1Total Hg input
a East Asian Summer Monsoon; n = number of samples; Values indicate mean±SE, whe
6.6 mol yr−1 for unfiltered Hg and 27±1.9 mol yr−1 for filtered Hg.Unfiltered and filtered Hg inputs to the bay were dominated by riverinput. Overall, 83±13% and 73±6.0% of the total Hg input wererepresented by river input for unfiltered and filtered Hg, respectively.However, Hg input through wet deposition also accounted for asubstantial portion of the total Hg input: 17±4.2% and 27±6.6% ofthe total Hg input were represented by wet deposition of unfilteredand filtered Hg, respectively. The results of the present study areconsistent with the mass balance results shown in several othercoastal systems, demonstrating the importance of river discharge as amajor source of Hg in coastal waters (Balcom et al., 2008; Choe et al.,2003).
The monthly mass flux of Hg was constructed on the basis of the Hgconcentrations in rainwater and river water (Table 3), and monthlyprecipitation amount and river discharge rate for monsoon and non-monsoon months (see footnotes in Table 3). According to the literature(Kim et al., 2007), the average river discharge rate during the monsoonmonths (July and August) increases to approximately 5.5 times theaverage rate in thedrymonths (1.1±0.84 km3 month−1 inmonsoon and0.20±0.047 km3month−1 in dry). The average wet deposition fluxduring the monsoon months increases to approximately 3.2 times theaverageflux in thedrymonths:0.071±0.0093 km3month−1 inmonsoonand 0.022±0.0016 km3month−1 in dry (Korea Meteorological Admin-istration). FromTable 3, we conclude that amajor increase inmonthly Hginput occurs during the EASM: total Hg input during themonsoonmonthincreased from3.2±0.70 to17±11mol month−1for unfilteredand from1.3±0.26 to 7.1±4.1 mol month−1 for filtered Hg. These large increasesof Hg input mainly occurred as a consequence of enhanced river input ofHg during the monsoon season.
While we were not able to find Hg studies in the East Asia regioncomparable to ours, the importance of the AsianMonsoon in increasingHg concentrations in coastal water was reported in a study in India(Kaladharan et al., 1999). The seasonal distribution of Hg in the westcoastal waters of India showed that total Hg concentration increasedabout 100% in the post-monsoon seasons (Kaladharan et al., 1999).
4. Summary
The northward EASM brings a short period of high-intensityrainfall during July and August in Korea. We found significantincreases in filtered Hg in surface waters of Gwangyang Bay duringthe monsoon month (0.62±0.047 pM in dry and 1.8±0.019 pM inmonsoon). In contrast, unfiltered Hg (2.6±0.58 pM in dry and 3.9±2.5 pM in monsoon) and Hg concentration associated with particles(346±30 pmol g−1 in dry and 459±141 pmol g−1 in monsoon) didnot show significant differences between the monsoon and the drymonths. These changes of Hg concentration resulted in reducedparticle–water partition coefficients of Hg in the monsoon monthcompared to the values in the dry months: 5.7±0.1 in April, 5.3±0.1in July, and 5.8±0.1 in November. Interestingly, a particle concen-tration effect, which was evident during the dry seasons, was notfound in the monsoon season. Colloidal Hg appears not to increasewith particle concentration during the monsoon season.
Gwangyang Bay, Korea.
ater flux Hg flux
3 yr-1) Unfiltered(mol yr−1)
Unfiltered(%)
Filtered(mol yr−1)
Filtered(%)
4±0.019 (n=10) 5.1±0.69 3.4±0.497±0.029 (n=10) 11±2.5 17±4.2 7.3±1.7 27±6.6(n=2) 53±6.1 83±13 20±0.86 73±6.0
64±6.6 100 27±1.9 100
n n=2, only mean values are shown.
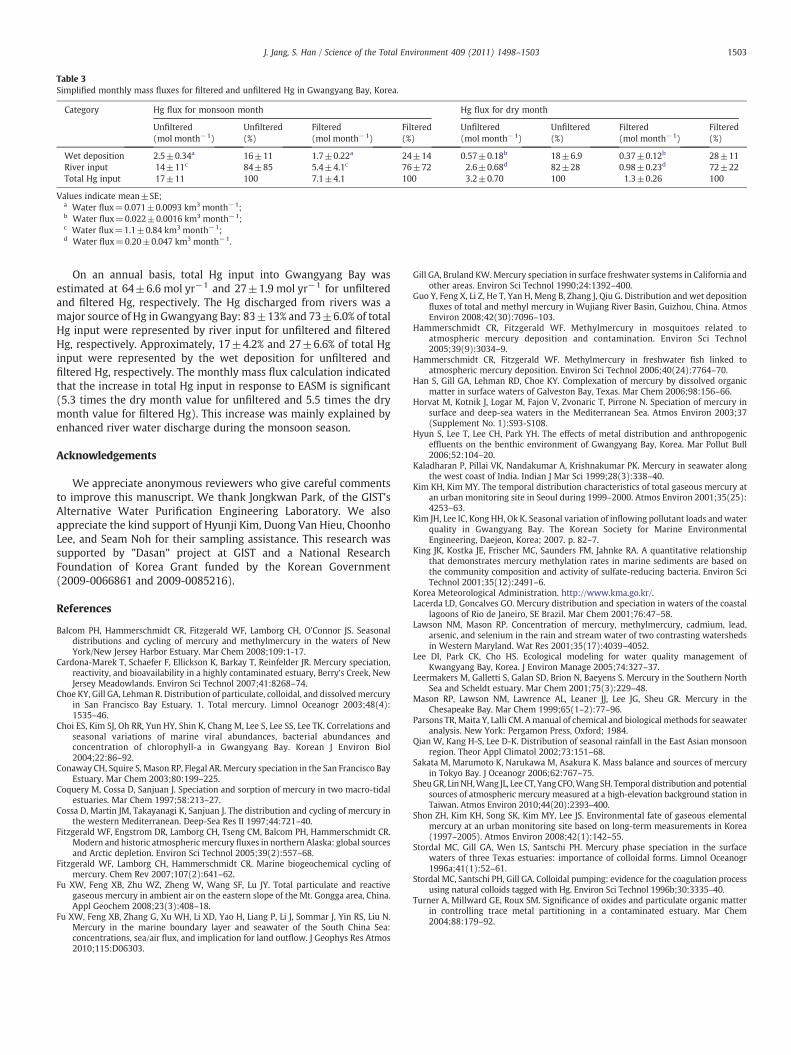
Table 3Simplified monthly mass fluxes for filtered and unfiltered Hg in Gwangyang Bay, Korea.
Category Hg flux for monsoon month Hg flux for dry month
Unfiltered(mol month−1)
Unfiltered(%)
Filtered(mol month−1)
Filtered(%)
Unfiltered(mol month−1)
Unfiltered(%)
Filtered(mol month−1)
Filtered(%)
Wet deposition 2.5±0.34a 16±11 1.7±0.22a 24±14 0.57±0.18b 18±6.9 0.37±0.12b 28±11River input 14±11c 84±85 5.4±4.1c 76±72 2.6±0.68d 82±28 0.98±0.23d 72±22Total Hg input 17±11 100 7.1±4.1 100 3.2±0.70 100 1.3±0.26 100
Values indicate mean±SE;a Water flux=0.071±0.0093 km3 month−1;b Water flux=0.022±0.0016 km3 month−1;c Water flux=1.1±0.84 km3 month−1;d Water flux=0.20±0.047 km3 month−1.
1503J. Jang, S. Han / Science of the Total Environment 409 (2011) 1498–1503
On an annual basis, total Hg input into Gwangyang Bay wasestimated at 64±6.6 mol yr−1 and 27±1.9 mol yr−1 for unfilteredand filtered Hg, respectively. The Hg discharged from rivers was amajor source of Hg in Gwangyang Bay: 83±13% and 73±6.0% of totalHg input were represented by river input for unfiltered and filteredHg, respectively. Approximately, 17±4.2% and 27±6.6% of total Hginput were represented by the wet deposition for unfiltered andfiltered Hg, respectively. The monthly mass flux calculation indicatedthat the increase in total Hg input in response to EASM is significant(5.3 times the dry month value for unfiltered and 5.5 times the drymonth value for filtered Hg). This increase was mainly explained byenhanced river water discharge during the monsoon season.
Acknowledgements
We appreciate anonymous reviewers who give careful commentsto improve this manuscript. We thank Jongkwan Park, of the GIST'sAlternative Water Purification Engineering Laboratory. We alsoappreciate the kind support of Hyunji Kim, Duong Van Hieu, ChoonhoLee, and Seam Noh for their sampling assistance. This research wassupported by "Dasan" project at GIST and a National ResearchFoundation of Korea Grant funded by the Korean Government(2009-0066861 and 2009-0085216).
References
Balcom PH, Hammerschmidt CR, Fitzgerald WF, Lamborg CH, O'Connor JS. Seasonaldistributions and cycling of mercury and methylmercury in the waters of NewYork/New Jersey Harbor Estuary. Mar Chem 2008;109:1-17.
Cardona-Marek T, Schaefer F, Ellickson K, Barkay T, Reinfelder JR. Mercury speciation,reactivity, and bioavailability in a highly contaminated estuary, Berry's Creek, NewJersey Meadowlands. Environ Sci Technol 2007;41:8268–74.
Choe KY, Gill GA, Lehman R. Distribution of particulate, colloidal, and dissolvedmercuryin San Francisco Bay Estuary. 1. Total mercury. Limnol Oceanogr 2003;48(4):1535–46.
Choi ES, Kim SJ, Oh RR, Yun HY, Shin K, Chang M, Lee S, Lee SS, Lee TK. Correlations andseasonal variations of marine viral abundances, bacterial abundances andconcentration of chlorophyll-a in Gwangyang Bay. Korean J Environ Biol2004;22:86–92.
Conaway CH, Squire S, Mason RP, Flegal AR. Mercury speciation in the San Francisco BayEstuary. Mar Chem 2003;80:199–225.
Coquery M, Cossa D, Sanjuan J. Speciation and sorption of mercury in two macro-tidalestuaries. Mar Chem 1997;58:213–27.
Cossa D, Martin JM, Takayanagi K, Sanjuan J. The distribution and cycling of mercury inthe western Mediterranean. Deep-Sea Res II 1997;44:721–40.
Fitzgerald WF, Engstrom DR, Lamborg CH, Tseng CM, Balcom PH, Hammerschmidt CR.Modern and historic atmosphericmercury fluxes in northern Alaska: global sourcesand Arctic depletion. Environ Sci Technol 2005;39(2):557–68.
Fitzgerald WF, Lamborg CH, Hammerschmidt CR. Marine biogeochemical cycling ofmercury. Chem Rev 2007;107(2):641–62.
Fu XW, Feng XB, Zhu WZ, Zheng W, Wang SF, Lu JY. Total particulate and reactivegaseous mercury in ambient air on the eastern slope of the Mt. Gongga area, China.Appl Geochem 2008;23(3):408–18.
Fu XW, Feng XB, Zhang G, Xu WH, Li XD, Yao H, Liang P, Li J, Sommar J, Yin RS, Liu N.Mercury in the marine boundary layer and seawater of the South China Sea:concentrations, sea/air flux, and implication for land outflow. J Geophys Res Atmos2010;115:D06303.
Gill GA, Bruland KW.Mercury speciation in surface freshwater systems in California andother areas. Environ Sci Technol 1990;24:1392–400.
Guo Y, Feng X, Li Z, He T, Yan H, Meng B, Zhang J, Qiu G. Distribution and wet depositionfluxes of total and methyl mercury in Wujiang River Basin, Guizhou, China. AtmosEnviron 2008;42(30):7096–103.
Hammerschmidt CR, Fitzgerald WF. Methylmercury in mosquitoes related toatmospheric mercury deposition and contamination. Environ Sci Technol2005;39(9):3034–9.
Hammerschmidt CR, Fitzgerald WF. Methylmercury in freshwater fish linked toatmospheric mercury deposition. Environ Sci Technol 2006;40(24):7764–70.
Han S, Gill GA, Lehman RD, Choe KY. Complexation of mercury by dissolved organicmatter in surface waters of Galveston Bay, Texas. Mar Chem 2006;98:156–66.
Horvat M, Kotnik J, Logar M, Fajon V, Zvonaric T, Pirrone N. Speciation of mercury insurface and deep-sea waters in the Mediterranean Sea. Atmos Environ 2003;37(Supplement No. 1):S93-S108.
Hyun S, Lee T, Lee CH, Park YH. The effects of metal distribution and anthropogeniceffluents on the benthic environment of Gwangyang Bay, Korea. Mar Pollut Bull2006;52:104–20.
Kaladharan P, Pillai VK, Nandakumar A, Krishnakumar PK. Mercury in seawater alongthe west coast of India. Indian J Mar Sci 1999;28(3):338–40.
Kim KH, Kim MY. The temporal distribution characteristics of total gaseous mercury atan urban monitoring site in Seoul during 1999–2000. Atmos Environ 2001;35(25):4253–63.
Kim JH, Lee IC, Kong HH, Ok K. Seasonal variation of inflowing pollutant loads andwaterquality in Gwangyang Bay. The Korean Society for Marine EnvironmentalEngineering, Daejeon, Korea; 2007. p. 82–7.
King JK, Kostka JE, Frischer MC, Saunders FM, Jahnke RA. A quantitative relationshipthat demonstrates mercury methylation rates in marine sediments are based onthe community composition and activity of sulfate-reducing bacteria. Environ SciTechnol 2001;35(12):2491–6.
Korea Meteorological Administration. http://www.kma.go.kr/.Lacerda LD, Goncalves GO. Mercury distribution and speciation in waters of the coastal
lagoons of Rio de Janeiro, SE Brazil. Mar Chem 2001;76:47–58.Lawson NM, Mason RP. Concentration of mercury, methylmercury, cadmium, lead,
arsenic, and selenium in the rain and stream water of two contrasting watershedsin Western Maryland. Wat Res 2001;35(17):4039–4052.
Lee DI, Park CK, Cho HS. Ecological modeling for water quality management ofKwangyang Bay, Korea. J Environ Manage 2005;74:327–37.
Leermakers M, Galletti S, Galan SD, Brion N, Baeyens S. Mercury in the Southern NorthSea and Scheldt estuary. Mar Chem 2001;75(3):229–48.
Mason RP, Lawson NM, Lawrence AL, Leaner JJ, Lee JG, Sheu GR. Mercury in theChesapeake Bay. Mar Chem 1999;65(1–2):77–96.
Parsons TR,Maita Y, Lalli CM. Amanual of chemical and biological methods for seawateranalysis. New York: Pergamon Press, Oxford; 1984.
Qian W, Kang H-S, Lee D-K. Distribution of seasonal rainfall in the East Asian monsoonregion. Theor Appl Climatol 2002;73:151–68.
Sakata M, Marumoto K, Narukawa M, Asakura K. Mass balance and sources of mercuryin Tokyo Bay. J Oceanogr 2006;62:767–75.
SheuGR, LinNH,Wang JL, Lee CT, YangCFO,WangSH. Temporal distribution and potentialsources of atmospheric mercury measured at a high-elevation background station inTaiwan. Atmos Environ 2010;44(20):2393–400.
Shon ZH, Kim KH, Song SK, Kim MY, Lee JS. Environmental fate of gaseous elementalmercury at an urban monitoring site based on long-term measurements in Korea(1997–2005). Atmos Environ 2008;42(1):142–55.
Stordal MC, Gill GA, Wen LS, Santschi PH. Mercury phase speciation in the surfacewaters of three Texas estuaries: importance of colloidal forms. Limnol Oceanogr1996a;41(1):52–61.
Stordal MC, Santschi PH, Gill GA. Colloidal pumping: evidence for the coagulation processusing natural colloids tagged with Hg. Environ Sci Technol 1996b;30:3335–40.
Turner A, Millward GE, Roux SM. Significance of oxides and particulate organic matterin controlling trace metal partitioning in a contaminated estuary. Mar Chem2004;88:179–92.