importance of concentrated flow paths in agricultural
TRANSCRIPT
Southern Illinois University CarbondaleOpenSIUC
Theses Theses and Dissertations
5-1-2017
Importance of Concentrated Flow Paths inAgricultural Watersheds of Southern IllinoisPrabisha ShresthaSouthern Illinois University Carbondale, [email protected]
Follow this and additional works at: http://opensiuc.lib.siu.edu/theses
This Open Access Thesis is brought to you for free and open access by the Theses and Dissertations at OpenSIUC. It has been accepted for inclusion inTheses by an authorized administrator of OpenSIUC. For more information, please contact [email protected].
Recommended CitationShrestha, Prabisha, "Importance of Concentrated Flow Paths in Agricultural Watersheds of Southern Illinois" (2017). Theses. 2143.http://opensiuc.lib.siu.edu/theses/2143

IMPORTANCE OF CONCENTRATED FLOW PATHS IN AGRICULTURAL
WATERSHEDS IN SOUTHERN ILLINOIS
by
Prabisha Shrestha
B.S., Asian University for Women, 2013
A Thesis
Submitted in Partial Fulfillment of the Requirements for the
Master of Science Degree.
Department of Forestry
in the Graduate School
Southern Illinois University Carbondale
May 2017
THESIS APPROVAL
IMPORTANCE OF CONCENTRATED FLOW PATHS IN AGRICULTURAL WATERSHEDS IN SOUTHERN ILLINOIS
By
Prabisha Shrestha
A Thesis Submitted in Partial
Fulfillment of the Requirements
for the Degree of
Master of Science Degree
in the field of Forestry
Approved by:
Dr. Karl W. J. Williard, Chair
Dr. Jon E. Schoonover
Dr. Logan Park
Graduate School Southern Illinois University Carbondale
December 19, 2016
i
AN ABSTRACT OF THE THESIS OF
Prabisha Shrestha, for the Masters of Science degree in Forestry, presented on December 17, 2016 at Southern Illinois University Carbondale. TITLE: IMPORTANCE OF CONCENTRATED FLOW PATHS IN AGRICULTURAL WATERSHEDS OF SOUTHERN ILLINOIS MAJOR PROFESSOR: Dr. Karl. W. J. Williard
Field scale research shows concentrated flow paths (CFPs) are prevalent in agricultural
watersheds. They are an important source of soil erosion in cropland and contribute significantly
to the transport and delivery of agricultural pollutants such as sediment and nutrients to nearby
water resources. High resolution LiDAR data have enabled the investigation of the prevalence of
concentrated flow at a large geographic extent. This study focused on identifying CFPs in 389
agricultural fields in Jackson County in southern Illinois and estimating the contribution of the
CFPs to drainage of the fields. Addressing the lack of literature on factors influencing CFP
characteristics, this study also investigates various topographical and soil factors that influence
CFP development. LiDAR derived DEMs with a cell resolution of 3 meters were used to identify
areas of flow concentration and delineate a drainage basin of each CFP using the Hydrology
tools in the Spatial Analyst toolbox in ArcMap 10.3.1. Information on the topographical and soil
characteristics were obtained from the DEMs and SSURGO database using the Soil Data Viewer
6.2 extension for ArcMap. Multiple regression analysis in SAS v. 9.4 was used to identify factors
influencing CFP characteristics, while CART analysis in R v. 3.3.1 was conducted to detect
linear dependencies among predictor variables. An average of 5 CFPs per agricultural field were
observed in the study area with a minimum of 0 and maximum of 17 CFPs, but only two fields
had no CFPs indicating a high prevalence of CFPs throughout the study area. The mean percent
of field area drained by CFPs was estimated to be 81 percent with minimum of 36 percent and

ii
maximum of 100 percent. The majority of the fields, 85 percent, had more than 70 percent of
their area drained by CFPs. Statistically significant regression equations were found for all CFP
characteristics with slope, LS factor, K factor and organic matter as the factors influencing CFP
characteristics. However, the factors only explained 2 to 22 percent of variation observed. Both
multiple regression and CART analysis indicated slope as the most important influencing factor.
Variation in CFP characteristics followed regional trends with higher values in the floodplain
region and lower values in the rough hills region suggesting residual variation could be explained
by other environmental factors along with topographical and climatological factors which were
not included in the study. Results from this study highlight the prevalence of CFPs at a regional
scale and their substantial contribution to field drainage identifying a need for research in
quantifying the impacts of CFP on soil loss and water quality. This study also reports a need of
future research to identify important factors controlling CFP formation and development that
could help build empirical and physical models to accurately predict CFP locations and
morphology. Such information could be useful in designing and targeting conservation practices
that protect both soil health and water quality.

iii
ACKNOWLEDGEMENTS
I would like to express my immeasurable appreciation and deepest gratitude to my
advisor and research committee chair Dr. Karl W. J. Williard for his unwavering guidance,
support, encouragement and patience that helped me complete my research for the thesis and
grow as a research scientist. I would also like to thank the members of my research committee,
Dr. Jon Schoonover and Dr. Logan Park, for their technical guidance, and insights in developing
the research and valuable comments and suggestions during the manuscript writing process. I am
also sincerely thankful to Dr. John D. Reeve, my Biostatistics professor, for his mathematical
expertise that contributed positively in data analyses and interpretation. I am also thankful to
Tejesh Mahesh Naik, GIS Analyst, ESRI for all his technical help and support in spatial analysis
using ArcGIS. I also want to thank my fellow graduate students, especially, Gurbir Singh and
Matthew Enger, for their help throughout my academic journey. I am also immensely grateful to
Patti Cludray and the administrative staff in the Department of Forestry, for all their help and
support.
Lastly, I am thankful to my friends and family for their unwavering moral and emotional
support in my academic pursuit.
iv
TABLE OF CONTENTS
ABSTRACT ..................................................................................................................................... i
ACKNOWLEDGEMENTS ........................................................................................................... iii
TABLE OF CONTENTS ............................................................................................................... iv
LIST OF TABLES ......................................................................................................................... vi
LIST OF FIGURES ...................................................................................................................... vii
CHAPTER 1: INTRODUCTION AND LITERATURE REVIEW ............................................... 1
INTRODUCTION ....................................................................................................................... 1
DEFINING CONCENTRATED FLOW PATHS ................................................................... 1
IMPORTANCE OF CFPs ....................................................................................................... 4
SCOPE OF THE STUDY........................................................................................................ 6
OBJECTIVES .......................................................................................................................... 6
LITERATURE REVIEW ............................................................................................................ 7
SOIL EROSION ...................................................................................................................... 7
AGRICULTURE AND SOIL EROSION ............................................................................. 10
BEST MANAGEMENT PRACTICES AND AGRICULTURAL WATER POLLUTION. 12
CONCENTRATED FLOW PATHS IN RIPARIAN BUFFERS ......................................... 14
DIFFERENT APPROACHES TO STUDY CFPs ................................................................ 15
FACTORS AFFECTING CFP FORMATION ..................................................................... 17
CHAPTER 2: METHODS ............................................................................................................ 20
STUDY AREA .......................................................................................................................... 20
PHYSIOGRAPHY AND GEOLOGY ...................................................................................... 20
PERCENTAGE OF FIELD DRAINAGE CALCULATION ................................................... 23
FACTORS INFLUENCING CONCENTRATED FLOW ....................................................... 28
STATISTICS ............................................................................................................................. 29
ABSTRACT .............................................................................................................................. 33
INTRODUCTION ..................................................................................................................... 34
METHODS................................................................................................................................ 36
STUDY AREA ...................................................................................................................... 36
PERCENTAGE OF FIELD DRAINAGE CALCULATION ............................................... 38
FACTORS INFLUENCING CONCENTRATED FLOW .................................................... 40
v
STATISTICS ......................................................................................................................... 41
RESULTS.................................................................................................................................. 43
IDENTIFYING CFPs IN AGRICULTURAL WATERSHEDS ........................................... 43
PERCENT DRAINAGE AREA CALCULATION (Experimental Unit=Individual Fields) 51
ASSOCIATION OF CFP FORMATION AND TOPOGRPAHIC AND SOIL
CHARACTERISTICS ........................................................................................................... 54
CART ANALYSIS: RELATIONSHIPS BETWEEN CFP CHARACTERISTICS AND
TOPOGRAPHIC AND SOIL CHARACTERISTICS .......................................................... 59
DISCUSSION ........................................................................................................................... 64
CONCLUSION ......................................................................................................................... 69
CHAPTER 4: SYNTHESIS .......................................................................................................... 72
SUMMARY .................................................................................................................................. 72
LIMITATIONS ............................................................................................................................. 73
RECOMMENDATIONS FOR FUTURE RESEARCH ............................................................... 74
MANAGEMENT IMPLICATIONS ............................................................................................ 77
LITERATURE CITED ................................................................................................................. 80
APPENDIX I – Physiographic Divisions of Illinois..................................................................... 89
APPENDIX II – ArcMap model to Batch Process Watershed Delineation ................................ 90
APPENDIX III– Example Figures Showing Methods Used to Determine Field Length Parallel to
Concentrated Flow ........................................................................................................................ 91
APPENDIX IV– Predicting Spatial Distribution of CFP Characteristics .................................... 92
APPENDIX V– Data .................................................................................................................... 97
Table A1. CFP Physical Characteristics ................................................................................... 97
Table A2. Topographical properties, productivity index, drainage class and geographic
coordinates of the study fields. ................................................................................................ 148
Table A3. Soil properties of the study fields. .......................................................................... 169
APPENDIX VI– Statistical Package .......................................................................................... 183
VITA ........................................................................................................................................... 199
vi
LIST OF TABLES
Table 1 Independent (topographic and soil characteristics) and dependent variables (CFP
characteristics) used in the multiple regression and CART analysis ............................................ 40
Table 2 Summary statistics of the different CFP characteristics in agricultural fields in Jackson
County, IL (N=2049) .................................................................................................................... 43
Table 3 Comparison of means of concentrated flow path characteristics among different
topographic regions. Means with different letters are statistically significantly different. .......... 44
Table 4 Mean values of concentrated flow path characteristics based on the three topographic
regions and among different soil texture groups (N=2047) .......................................................... 48
Table 5 Summary statistics of the number of concentrated flow paths and percent of field area
drained by concentrated flow paths (N=387) *............................................................................. 51
Table 6 Multiple regression results for the CFP characteristics................................................... 54

vii
LIST OF FIGURES
Figure 1 A large concentrated flow path leading to a nearby stream observed in one of the study
sites of Pankau (2010) ..................................................................................................................... 1
Figure 2 The three basic steps: detachment, transport and deposition, of water erosion (UBC
2013) ............................................................................................................................................... 8
Figure 3 Types of surface runoff or overland flow. Hortonian or infiltration excess flow is
produced when precipitation exceeds soil infiltration capacity or in some cases, if soil is
impermeable, while saturated overland flow is produced from saturated soil conditions (UCAR
2006) ............................................................................................................................................... 9
Figure 4 Water induced erosion showing sheet, rill, and gully erosion (adapted from Cleveland
et al. (1991)) .................................................................................................................................... 9
Figure 5 Conceptual model describing formation of concentrated flow paths on and through
riparian buffer (Pankau et al. 2012). ............................................................................................. 15
Figure 6 Three major topographic regions, flat forested inside the green boundary, rough hills
region inside the orange boundary and floodplain region inside the blue boundary, of Jackson
County, Illinois (USDA 2005) ...................................................................................................... 21
Figure 7 Study area of Jackson County, IL including the 389 study agricultural fields. ............. 22
Figure 8 Elevation raster (top left) used to determine flow direction raster (top right) using the
single flow eight-direction (D8) flow algorithm (adapted from ESRI) ........................................ 24
Figure 9 Flow direction raster (top left) showing the direction of flow from each cell, flow
accumulation raster (right) with the number of cells that flow into each cell (adapted from ESRI)
....................................................................................................................................................... 25
Figure 10. Calculation of drainage area of individual CFPs in one of the study fields ............... 27
Figure 11 Percent of field area drained by the CFPs in an agricultural field ............................... 27
Figure 12 Study area, Jackson County, IL ................................................................................... 37
Figure 13 Elevation map of one of the agricultural watersheds in the study area derived from
LiDAR point cloud data. The color gradient, yellow to blue, represents higher to lower elevation.
The orange lines represent the CFPs determined using flow accumulations lines ....................... 38
Figure 14 Calculation of drainage area of individual CFPs (left) and percent of field area drained
by the CFPs (right) in one of the agricultural watersheds in the study area ................................. 39

viii
Figure 15 Comparison of means of CFP characteristics among the three topographic regions of
Jackson County, Illinois. Means with different letters are significantly different. The mean
difference is significant at the alpha level of 0.05. ....................................................................... 47
Figure 16 Size distribution of drainage area of concentrated flow paths among different soil
texture groups (N=2047). 2 fields with stratified silty clay loam to silt loam texture, one each in
Small and Medium category, were excluded from the graphs as they largely skewed the
distribution. ................................................................................................................................... 49
Figure 17 Size distribution of length of concentrated flow paths among different soil texture
groups (N=2047). Two fields with stratified silty clay loam to silt loam texture in Large category
were excluded from the graphs as they largely skewed the distribution. ..................................... 50
Figure 18 Percent of field area drained by concentrated flow paths in the study area (N=387).
Two fields with no CFPs were not included in the percent of field drainage calculation ............ 52
Figure 19 DEM and Ortho-imagery of agricultural fields in the study area representing CFPs and
basin area delineated around the CFPs with 35 percent of field area drained (top) and 94 percent
of field area drained (bottom). ...................................................................................................... 53
Figure 20 Theoretical Semivariograms for models showing semivariance as a function of
increasing lag distance. Semivariance does not increase with lag for spatially independent data
whereas semivariance may increase or level off for spatially dependent data. (Adapted from
(Chen et al. 2012) .......................................................................................................................... 55
Figure 21 Semivariograms for the CFP characteristics (CFP number, CFP drainage area,
drainage density, CFP length and ratio of CFP length to drainage area ....................................... 58
Figure 22 Regression trees developed from classification and regression tree analysis for (a)
number of concentrated flow paths (CFPs) (b) CFP drainage area (c) CFP length (d) ratio of CFP
length to drainage area and (e) drainage density. Each regression tree has its branch labeled with
the explanatory variable associated with the partitioning of the response variable with the percent
of variation explained by the variable in parenthesis. Each box represents a node and includes
information about the explanatory variable with threshold value associated with each split,
sample size of the split and the mean value of the response variable. Terminal nodes are
represented by dashed boxes. ........................................................................................................ 61
Figure 23 3D view of a CFP in an agricultural field in the study area (top left) and the expanded
version of the CFP (bottom right) showing possibility of measurement of the CFP length ......... 75
Figure 24 A section of the CFP (top right) selected for profile view (bottom right) that shows the
possibility of measurement of depth and width of CFP ................................................................ 75
Figure 25 Schematic diagram showing the relationship between field runoff area, total riparian
buffer area and effective area of riparian buffer area (Dosskey et al. (2002). .............................. 78

ix
Figure 26 Variable riparian buffer width designed based on runoff loads and morphology of a
concentrated flow path and to accommodate standard farming equipment (Williard et al. 2012) 79

1
CHAPTER 1: INTRODUCTION AND LITERATURE REVIEW
INTRODUCTION
Agricultural is one of the biggest contributors to the local and regional economy in the
Midwest. Advancement in farming tools and techniques, such as tillage, tile drainage, and plant
genetics along with inexpensive fertilizers and pesticides have intensified farming practices
resulting in high crop yields. However, such intensive farming practices have posed water
quality challenges in the region (EPA 2009). Sediment and nutrients eroded by the agricultural
runoff negatively affect water quality and disrupt aquatic habitats. The 2004 US Environmental
Protection Agency National Water Quality Inventory reported that agriculture is one of the
leading sources of water quality impairments in surface water resources such as rivers, lakes and
estuaries (EPA 2009). Sediment and nutrient delivery from agricultural fields to water resources
via soil erosion can be accelerated through concentrated flow channels.
DEFINING CONCENTRATED FLOW PATHS
Figure 1 A large concentrated flow path leading to a nearby stream observed in one of the study sites of Pankau (2010)

2
According to the Soil Science Society of America (2016), concentrated flow paths
(CFPs) are narrow channels only a few centimeters deep that form frequently on sloping fields,
specifically agricultural fields. CFPs can be ephemeral in nature as they can be and are easily
tilled during normal farming operations that creates a susceptible area in a field for subsequent
erosion and CFP formation in the same location (Soil Science Society of America 2016; Auzet et
al. 1995; Bradford et al. 1980; Hutchinson et al. 1976). Foster (1986) provided one of the first
comprehensive discussions toward an understanding of CFPs. In general, topographical features
of a field cause overland flow to collect and concentrate in channels (Foster 1986), but Poesen
(1993) found that overland flow can also follow linear features in a landscape such as tillage
patterns. CFPs can form a single channel or can also develop a drainage network in a large basin
(Foster 1986).
Generally, CFPs are referred to as ephemeral gullies and can be described as channels
with an intermediate size between rills and permanent gullies. Rills are narrow and shallow
channels that can be of various sizes but are usually less than 10 centimeters wide while
permanent gullies are large channels that are too wide and deep to be filled by normal tillage
operations (Hutchinson et al. 1976). Additionally, according to the USDA Soil Conservation
Service (USDA 1986), permanent gullies are formed by removal of topsoil along with parent
material by concentrated flow. Compared to permanent gullies, CFPs are relatively small and
are more temporary. Permanent gullies evolve after its formation through head-cut migration
and erosion of the gully floors and walls, whereas the ephemeral nature of CFPs causes their
repeated formation. CFPs tend to form more through incision process than head-cut migration
and erosion of their floors and walls (Nachtergaele et al. 2002). A critical channel cross-
sectional area of one square foot was given by Hauge (1977) to distinguish between rills and
3
gullies, and the channel area above this threshold is also perceived by farmers as the channel
area that interferes with equipment trafficability on their fields (Souchère 1995).
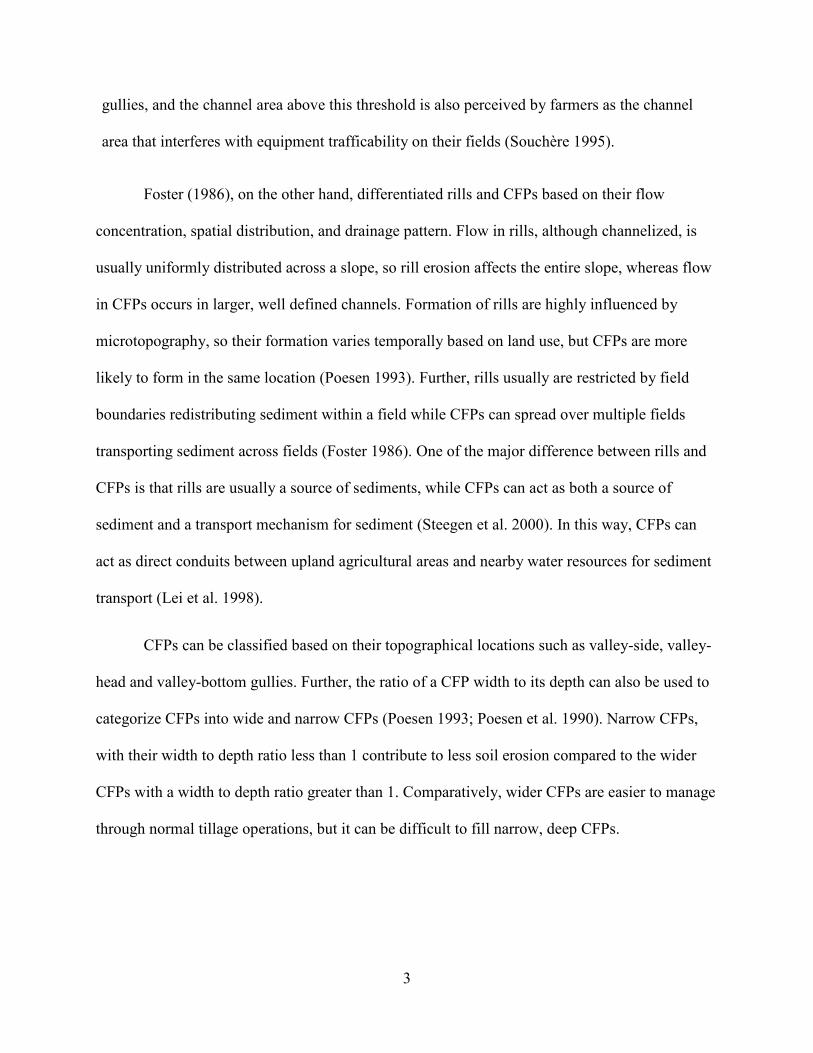
Foster (1986), on the other hand, differentiated rills and CFPs based on their flow
concentration, spatial distribution, and drainage pattern. Flow in rills, although channelized, is
usually uniformly distributed across a slope, so rill erosion affects the entire slope, whereas flow
in CFPs occurs in larger, well defined channels. Formation of rills are highly influenced by
microtopography, so their formation varies temporally based on land use, but CFPs are more
likely to form in the same location (Poesen 1993). Further, rills usually are restricted by field
boundaries redistributing sediment within a field while CFPs can spread over multiple fields
transporting sediment across fields (Foster 1986). One of the major difference between rills and
CFPs is that rills are usually a source of sediments, while CFPs can act as both a source of
sediment and a transport mechanism for sediment (Steegen et al. 2000). In this way, CFPs can
act as direct conduits between upland agricultural areas and nearby water resources for sediment
transport (Lei et al. 1998).
CFPs can be classified based on their topographical locations such as valley-side, valley-
head and valley-bottom gullies. Further, the ratio of a CFP width to its depth can also be used to
categorize CFPs into wide and narrow CFPs (Poesen 1993; Poesen et al. 1990). Narrow CFPs,
with their width to depth ratio less than 1 contribute to less soil erosion compared to the wider
CFPs with a width to depth ratio greater than 1. Comparatively, wider CFPs are easier to manage
through normal tillage operations, but it can be difficult to fill narrow, deep CFPs.

4
IMPORTANCE OF CFPs
CFPs can transport a significant amount of soil annually, sometimes up to two orders of
magnitude higher than sediment transport rate by raindrop splash, and the sediment transported
by rills can be up to ten times more than non-rill and interrill areas. The contribution of
concentrated flow erosion to soil loss can vary from 10 to 94 percent of total sediment yield
(Poesen et al. 2003). CFPs were identified as dominant soil loss process in agricultural fields
accounting for 44 percent of the total sediment production (Poesen et al. 1998) in central
Belgium while 80 and 83 percent of the total sediment in south-east Portugal and south-east
Spain, respectively. The findings align with the conclusions by Heimlich (2003) that ephemeral
gully erosion was identified as the dominant water erosion process with sediment yields from
cultivated lands. Furthermore, sediment yield was estimated to be 29 times higher from rill
erosion compared to sheet erosion, and off-site impacts of sediment transport through rill erosion
were observed to be detrimental to water quality and aquatic habitat (Whiting et al. 2001). These
findings highlight the importance of CFPs as source and transport of sediment and sediment-
bound particles in agricultural runoff.
Most studies on concentrated flow are field surveys which are limited in space and time
because the field-based studies are very time consuming and do not account for the temporal
variation of CFPs since they are a snapshot in time (Nachtergaele et al. 2002). Earlier, such
limitations were overcome using aerial photography to assess distribution of CFPs at a larger
scale (Nachtergaele et al. 1999). Geospatial studies, most recently using high resolution data
such as LiDAR, have been used to identify locations of CFPs (Hancock et al. 2015; Pankau et al.
2012; Funkhouser 2012; Zhu et al. 2009), and utilized percent field area being drained by CFPs
instead of sediment production to investigate the level of influence CFPs have on field drainage

5
(Hancock et al. 2015; Funkhouser 2012; Pankau 2010). Pankau (2010) demonstrated in a field-
scale study in southern Illinois that CFPs are common in agricultural watersheds, and 82.5 to100
percent of the agricultural fields were drained by CFPs. Funkhouser (2012) and Hancock et al.
(2015) utilized geospatial methods along with field surveys and showed 51 to 91 percent and 81
percent, respectively, of field areas were being drained through 1 percent or less of the field
margin in the Coastal Plain of Virginia.
Research has shown CFPs to form in or through riparian buffers making them less
efficient at trapping pollutants (Hancock et al. 2015; Pankau et al. 2012; Dosskey et al. 2002).
Dosskey et al. (2002) observed that riparian buffers are one of the effective management
practices that can remove 41 to 99 percent of sediment from agricultural runoff, but they also
observed non-uniform distribution of runoff through concentrated flow can reduce the sediment
trapping efficiency by 7 to 56 percent. Additionally, Funkhouser (2012), Pankau et al. (2012) and
Hancock et al. (2015) also observed CFPs developed in and through the riparian buffers.
This study evolved from the Pankau (2010) study indicating a high prevalence of CFPs in
agricultural watersheds and to address the lack of literature on the prevalence of CFPs at a
regional scale. In recent years, the availability of high-resolution data such as Light Detection
and Ranging (LiDAR) have enabled geospatial studies to overcome the limitation of geographic
extent and effectively detect concentrated flows at a large scale (Hancock et al. 2015; Zhu et al.
2009). Further, the factors affecting the occurrence of CFPs has received little attention in the
United States, so this study attempts to identify soil and topographical features contributing to
CFP prevalence at regional scale using geospatial methods.
6
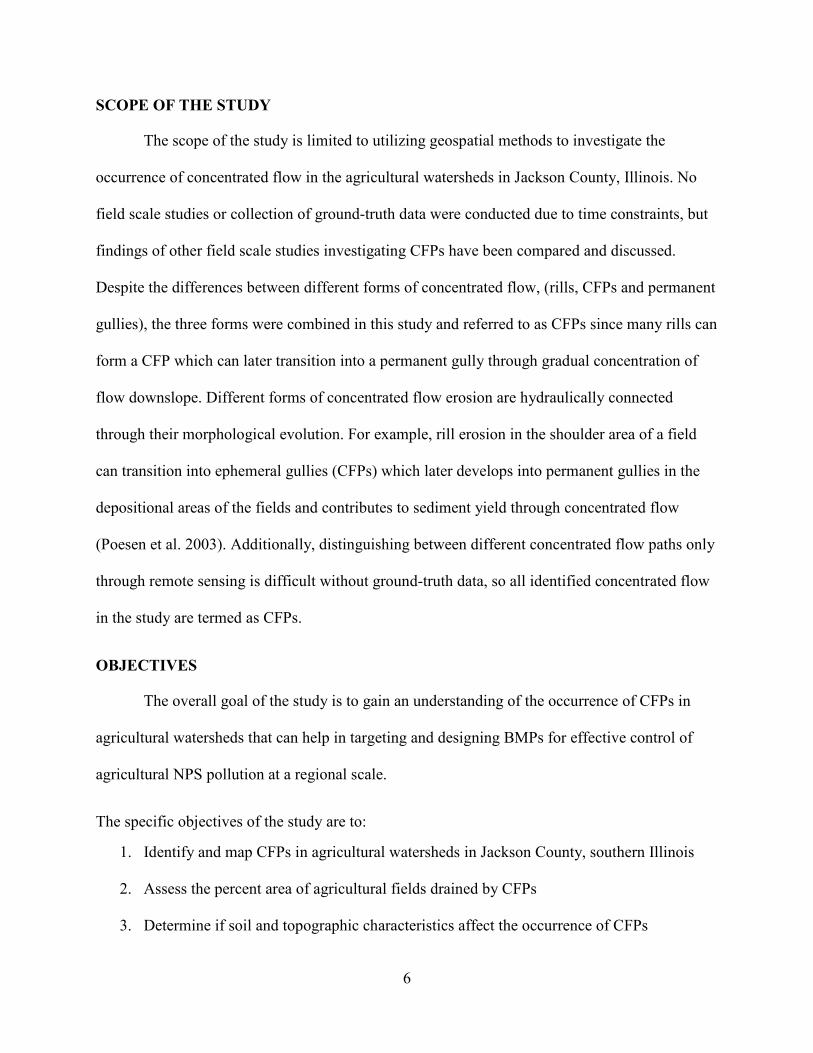
SCOPE OF THE STUDY
The scope of the study is limited to utilizing geospatial methods to investigate the
occurrence of concentrated flow in the agricultural watersheds in Jackson County, Illinois. No
field scale studies or collection of ground-truth data were conducted due to time constraints, but
findings of other field scale studies investigating CFPs have been compared and discussed.
Despite the differences between different forms of concentrated flow, (rills, CFPs and permanent
gullies), the three forms were combined in this study and referred to as CFPs since many rills can
form a CFP which can later transition into a permanent gully through gradual concentration of
flow downslope. Different forms of concentrated flow erosion are hydraulically connected
through their morphological evolution. For example, rill erosion in the shoulder area of a field
can transition into ephemeral gullies (CFPs) which later develops into permanent gullies in the
depositional areas of the fields and contributes to sediment yield through concentrated flow
(Poesen et al. 2003). Additionally, distinguishing between different concentrated flow paths only
through remote sensing is difficult without ground-truth data, so all identified concentrated flow
in the study are termed as CFPs.
OBJECTIVES
The overall goal of the study is to gain an understanding of the occurrence of CFPs in
agricultural watersheds that can help in targeting and designing BMPs for effective control of
agricultural NPS pollution at a regional scale.
The specific objectives of the study are to:
1. Identify and map CFPs in agricultural watersheds in Jackson County, southern Illinois
2. Assess the percent area of agricultural fields drained by CFPs
3. Determine if soil and topographic characteristics affect the occurrence of CFPs

7
LITERATURE REVIEW
SOIL EROSION
Soil erosion is a geomorphological process caused by water and wind. Geologic erosion
is natural erosion process that occurs at low rates over a long time period while accelerated
erosion refers to erosion processes that exceed the natural soil erosion rates usually due to
anthropogenic activities such as intensive farming (Blanco et al. 2008). Soil erosion is a complex
process that involves interactions of various hydrologic, land use, soil, topographic and climate
variables. Water is the most common agent to provide the energy to erode soil. Erosion by water
occurs in various forms such as interrills, rills, concentrated flow paths and gullies in an
agricultural watershed (Romero et al. 2007; Montgomery 2007; Cochrane 1995).
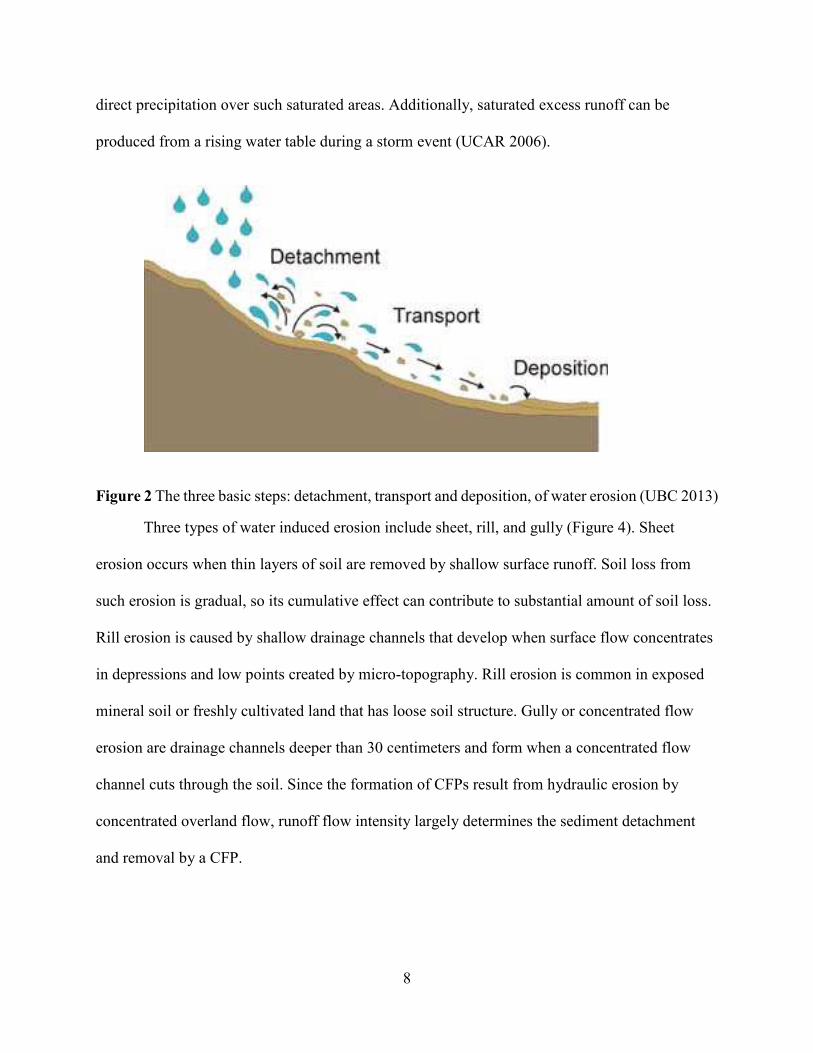
The basic processes of soil erosion by water is detachment, transport and deposition of
soil particles (Figure 2). Detachment of soil particles is caused by raindrop impact or by surface
runoff. Detached soil particles can be transported by dragging, floating, rolling or splashing
either under the influence of slope or preferential flow toward lower elevations. The transported
soil particles either settle on the surface when runoff is slowed by surface roughness or lower
elevation or are transported through concentrated runoff to a stream (Van Donk et al. 2001).
Surface runoff can be categorized based on two generation mechanisms: infiltration excess and
saturation excess (Figure 3). Infiltration excess or Hortonian runoff occurs during a precipitation
event when the precipitation rate exceeds the soil infiltration capacity. Saturation excess runoff is
produced from saturated soil conditions. Vertical discontinuities such as argillic horizon where
clay accumulates can be present in a soil profile that can result in accumulation of infiltrated
water in the horizon. In large precipitation events, saturation excess runoff can be generated from
8
direct precipitation over such saturated areas. Additionally, saturated excess runoff can be
produced from a rising water table during a storm event (UCAR 2006).
Figure 2 The three basic steps: detachment, transport and deposition, of water erosion (UBC 2013)
Three types of water induced erosion include sheet, rill, and gully (Figure 4). Sheet
erosion occurs when thin layers of soil are removed by shallow surface runoff. Soil loss from
such erosion is gradual, so its cumulative effect can contribute to substantial amount of soil loss.
Rill erosion is caused by shallow drainage channels that develop when surface flow concentrates
in depressions and low points created by micro-topography. Rill erosion is common in exposed
mineral soil or freshly cultivated land that has loose soil structure. Gully or concentrated flow
erosion are drainage channels deeper than 30 centimeters and form when a concentrated flow
channel cuts through the soil. Since the formation of CFPs result from hydraulic erosion by
concentrated overland flow, runoff flow intensity largely determines the sediment detachment
and removal by a CFP.

9
Figure 3 Types of surface runoff or overland flow. Hortonian or infiltration excess flow is produced when precipitation exceeds soil infiltration capacity or in some cases, if soil is impermeable, while saturated overland flow is produced from saturated soil conditions (UCAR 2006)
Figure 4 Water induced erosion showing sheet, rill, and gully erosion (adapted from Cleveland et al. (1991))
10
AGRICULTURE AND SOIL EROSION
The midwestern United States, known as “America’s Breadbasket”, has favorable soil
and weather conditions for growing different crops, especially corn and soybeans. Hence,
extensive areas in the Midwest have been converted into cropland. Although the Midwest is
considered the “Corn Belt”, the economic value of agriculture includes a variety of crops and
livestock besides corn such as soybean, wheat, vegetables, fruits, tree nuts and greenhouse plants
(Wang et al. 2015). In Illinois, cropland is the most dominant land use and occupies
approximately 75 percent of the landscape contributing significantly to the local and regional
economy. The wide extent of row-crop agriculture in Illinois has also resulted in significant
erosion rates (NASS 2011).
Soil erosion from agricultural fields has both on-site and off-site environmental impacts
(Pimentel et al. 1995). On-site impacts include reduction in soil fertility and crop productivity
due to removal of topsoil. The estimated average tolerance level of soil erosion used in soil and
water conservation planning in the U.S. is 11 Mg ha-1yr-1; the tolerance value is the amount of
soil erosion that does not significantly decrease soil productivity (Blanco et al. 2008). Over the
past three decades, conservation farming practices to reduce soil erosion have been widely
promoted to and among farmers in the U.S. Consequently, soil erosion on cropland has
decreased by 44 percent, with water erosion decreasing from 1.59 billion tons per year to 0.96
billion tons per year, between 1982 and 2012 (USDA 2015).
Off-site impacts of soil erosion from agricultural fields include impairment of water
quality and destruction of aquatic habitats. Agriculture is a major source of sediment, nutrients,
pesticides and pathogens to surface waters, and sediment is the most common contaminant of
surface water by weight and volume (EPA 2009). An evaluation of erosion control practices by
11
Lenat (1984) on stream water quality and aquatic biota showed that poorly managed agricultural
watersheds resulted in higher sedimentation in agricultural streams. Sediment affects water
resources by reducing the lifespan of reservoirs through siltation, burying streamside wetlands
and increasing the probability and severity of floods. Furthermore, increased turbidity in water,
due to suspended sediment, not only affects water quality but also degrades aquatic habitat.
Increases in turbidity and siltation affects aquatic ecosystems through loss and physical
modification of aquatic habitats and spawning grounds and destruction of habitats of many
aquatic insects and plants by changing aquatic temperature and sunlight exposure (Moss 2008;
Zilberman 1998).
Nutrients in agricultural runoff, mainly nitrogen and phosphorus, are also major
contaminants of surface water. Nitrogen in the nitrate form is readily soluble and transported
largely in the dissolved form in soil water, and groundwater, and surface runoff, while phosphate
is moderately soluble and largely transported in the sediment-bound phosphate form. The
availability of inexpensive fertilizers and relatively high crop prices has led to over application of
fertilizers that resulted in transport of considerable amounts of nitrogen and phosphorus into
surface waters. Nitrogen is considered the most common limiting nutrient in brackish or salt
water and phosphorus is the most common limiting nutrient in freshwater, but both nutrients
promote eutrophication or accelerated algal production in surface water (Carpenter et al. 1998).
When bacteria decompose this excessive organic matter, dissolved oxygen levels decrease
leading to anoxic or hypoxic zones resulting in fish kills. A regional study of impacts of row-
crop agriculture on water quality showed that unit-area phosphorus loading was higher despite
low erosion rates causing excessive algal growth that affected the aquatic ecosystem (Baker
1985). The addition of nutrients and organic matter along with sediment also showed changes in

12
the food web of benthic macroinvertebrates. A lower taxa richness was observed for the
intolerant groups implying agricultural runoff negatively affects stream fauna (Lenat 1984). In
addition to the impacts on water quality and aquatic habitat, nitrate also has potential threats to
human health. In infants, nitrate is converted to nitrite in the gastrointestinal tract which prevents
the oxygen transport in the bloodstream causing methemoglobinemia, also known as “blue-baby
syndrome” (Heimlich 2003).
Some pollutants such as pesticides, metals and nutrients that bind to sediments can also
degrade water quality making it unsuitable to support aquatic life (Castro et al. 1995). Zilberman
(1998) reported that surface water contamination by agricultural chemicals and residues in
agricultural runoff have been one of the most persistent environmental problems over the last
decade. Agricultural chemicals such as pesticides can impair aquatic ecosystem through loss of
predators by affecting their growth and reproduction (Ongley 1996). Aquatic species are highly
susceptible to bioaccumulation of pesticides compared to terrestrial organisms (Willis et al.
1982), so there is an increased concern on the detrimental effects of delivery of agricultural
pollutants like pesticides by CPFs on water quality and aquatic habitat.
BEST MANAGEMENT PRACTICES AND AGRICULTURAL WATER POLLUTION
Significant awareness of agricultural non-point source (NPS) pollution in the United
States began during the 1960s, which fueled the national level commitment for agricultural NPS
pollution control in the 1990s (Logan 1993). To prevent water quality impairments by
agricultural pollutants, many best management practices (BMPs) have been developed, and
farmers are encouraged to integrate the BMPs into their farming practices. BMPs include various
structural and non-structural farming techniques and management practices that enhance soil

13
health and prevent water quality impairment by agricultural pollutants (Miller et al. 2012; Lam et
al. 2011).
Non-structural BMPs are management approaches that modify farming techniques or
behaviors favorable to both soil health and water quality (Lam et al. 2011). Conservation
cropping such as cover crops and conservation tillage, such as no till and minimum tillage, are
recommended for improved soil quality and to reduce soil erosion. Improved nutrient
management, such as variable rate technology and precision technology, are recommended to
match fertilizer application rate and timing with plant growth and reduce the risk of nutrient
transport to surface waters (Miller et al. 2012).
Structural BMPs, such as conservation buffers, are permanent structures that control
volume and restrict flow of agricultural pollutants. Forested riparian buffers and grass filter strips
that utilize vegetation in trapping sediment and utilizing nutrients for their growth (Inamdar et al.
2001; Magette et al. 1989) are conventional approaches recommended to control agricultural
NPS pollution (Lam et al. 2011; D'Arcy et al. 2001). Establishment of BMPs have shown
reduction in water quality impairment by agricultural water pollutants (Zhang et al. 2011;
Anbumozhi et al. 2005; Blanco et al. 2004; Dillaha et al. 1996; Park et al. 1994). BMPs like
vegetative filter strips in agricultural fields were effective in reducing runoff, nutrient and
sediment loss (Lam et al. 2011; Blanco et al. 2004; Magette et al. 1989). Magette et al. (1989)
observed that efficiency of filter strips in nutrient removal and sediment entrapment increased
with their length, but decreased with an increase in the number of runoff events. The reduced
efficiency may have resulted from berm formation through sediment accumulation over
subsequent runoff events and contributed to CFP formation as explained by Pankau et al. (2012).
14
Various modifications of BMPs, such as multiple species and types of vegetation, a
combination of structural and non-structural BMPs, have also been studied to determine the
maximum efficiency of sediment and nutrient removal by vegetation strips (Lam et al. 2011; Lee
et al. 2003; Lee et al. 1998; Osborne et al. 1993). Lee et al. (2003) reported that a multi-species
riparian buffer, a combination of dense grass and woody vegetation, improved the effectiveness
of the buffer strip in removing agricultural pollutants. Similarly, an application of a combination
of BMPs, land use management, grazing management, field buffer strip and nutrient
management in the North German lowlands, showed a reduction of annual nitrate and total
nitrogen load by 53.9 percent and 46.7 percent, but no significant reduction in sediment and
phosphorus was observed (Lam et al. 2011). Besides soil and vegetation properties, buffer width
and slope have been identified as two main factors affecting the efficiency of vegetated buffers
in sediment trapping (Liu et al. 2008). Wider buffers were observed to trap more sediment while
no consistent relationship between slope and sediment trapping efficiency was observed (Yuan et
al. 2009; Lee et al. 1998).
CONCENTRATED FLOW PATHS IN RIPARIAN BUFFERS
Many management practices such as riparian buffer zones are used to prevent agricultural
pollutant transport to streams. Unfortunately, CFPs have been observed to form in riparian
buffers (Dosskey et al. 2015; Hancock et al. 2015; Pankau et al. 2012). (Pankau 2010) developed
a conceptual model to describe the formation of sediment berms and CFPs through riparian
buffers (Figure 5). Agricultural runoff is generated when precipitation exceeds soil infiltration
capacity. With increasing surface runoff energy, soil particles can be detached and transported
with the runoff as sheet flow along a field slope (Pankau et al. 2012). Increased surface
roughness and higher infiltration rates within buffers reduce the velocity of runoff allowing the

15
sediments and nutrient to settle in the buffer zone. A riparian buffer performs with its maximum
pollutant trapping efficiency if agricultural runoff flows as a sheet flow and is uniformly
dispersed across the buffer area (Dosskey et al. 2002). However, continuous settling of sediments
in the buffer area can result in sediment berm formation creating micro-topography that restricts
sheet flow and concentrates runoff along the berm. When runoff breaches through a low spot in
the berm, runoff flows through the berm and initiates a concentrated flow path. As runoff
continues over subsequent rainfall events, the CFP modifies its width and depth to accommodate
the new flow volume from the upslope catchment (Pankau et al. 2012).
Figure 5 Conceptual model describing formation of concentrated flow paths on and through riparian buffer (Pankau et al. 2012).
DIFFERENT APPROACHES TO STUDY CFPs
Various investigative approaches such as laboratory experiments, field studies, and
spatial exploration using remotely sensed data have been used to study physical processes of
CFP formation and sediment transport through CFPs. Generally, laboratory experiments are
carried out in flumes under simulated rainfall to gain an understanding of flow hydraulics and
morphology of concentrated flow (Bryan et al. 1989). Most field studies also accompanied by
16
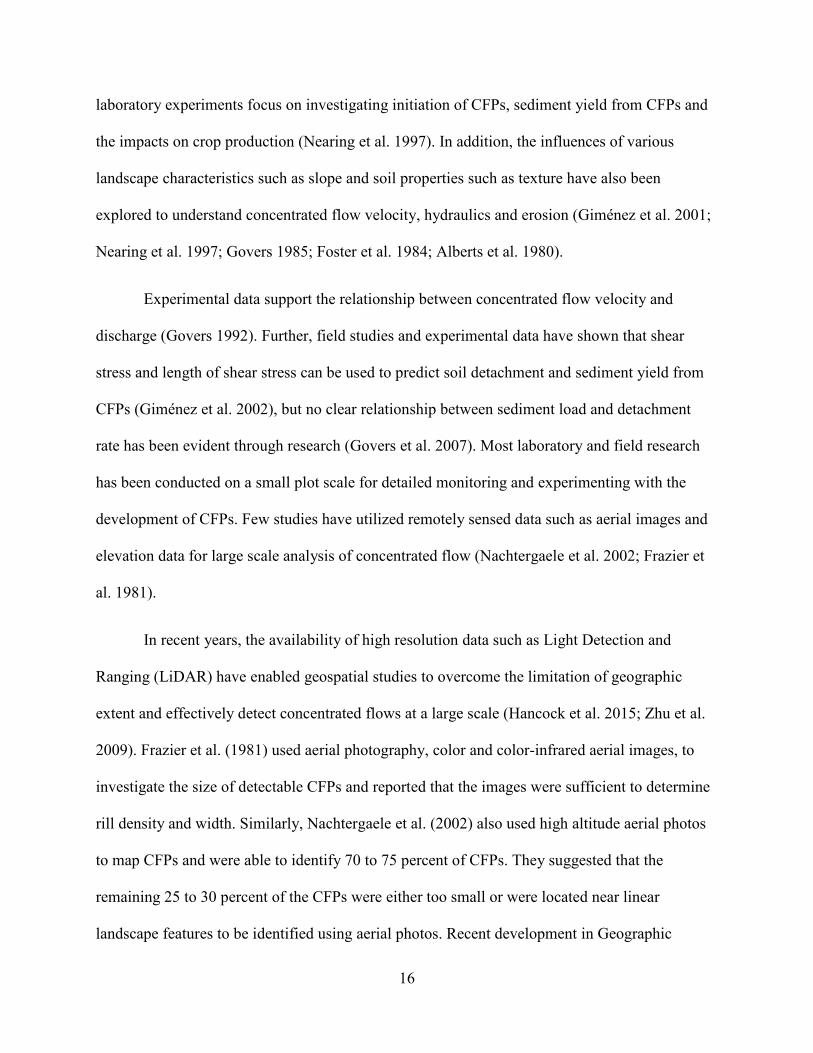
laboratory experiments focus on investigating initiation of CFPs, sediment yield from CFPs and
the impacts on crop production (Nearing et al. 1997). In addition, the influences of various
landscape characteristics such as slope and soil properties such as texture have also been
explored to understand concentrated flow velocity, hydraulics and erosion (Giménez et al. 2001;
Nearing et al. 1997; Govers 1985; Foster et al. 1984; Alberts et al. 1980).
Experimental data support the relationship between concentrated flow velocity and
discharge (Govers 1992). Further, field studies and experimental data have shown that shear
stress and length of shear stress can be used to predict soil detachment and sediment yield from
CFPs (Giménez et al. 2002), but no clear relationship between sediment load and detachment
rate has been evident through research (Govers et al. 2007). Most laboratory and field research
has been conducted on a small plot scale for detailed monitoring and experimenting with the
development of CFPs. Few studies have utilized remotely sensed data such as aerial images and
elevation data for large scale analysis of concentrated flow (Nachtergaele et al. 2002; Frazier et
al. 1981).
In recent years, the availability of high resolution data such as Light Detection and
Ranging (LiDAR) have enabled geospatial studies to overcome the limitation of geographic
extent and effectively detect concentrated flows at a large scale (Hancock et al. 2015; Zhu et al.
2009). Frazier et al. (1981) used aerial photography, color and color-infrared aerial images, to
investigate the size of detectable CFPs and reported that the images were sufficient to determine
rill density and width. Similarly, Nachtergaele et al. (2002) also used high altitude aerial photos
to map CFPs and were able to identify 70 to 75 percent of CFPs. They suggested that the
remaining 25 to 30 percent of the CFPs were either too small or were located near linear
landscape features to be identified using aerial photos. Recent development in Geographic
17
Information System (GIS) hydrologic modeling tools have enabled more accurate simulations of
flow direction and flow accumulations based on Digital Elevation Models (DEM) (Maidment
2002). Single-direction flow algorithms (D8) have been widely used for the simulations of the
surface flow paths (Zhu et al. 2009; Schäuble et al. 2008; Jones 2002; Marks et al. 1984).
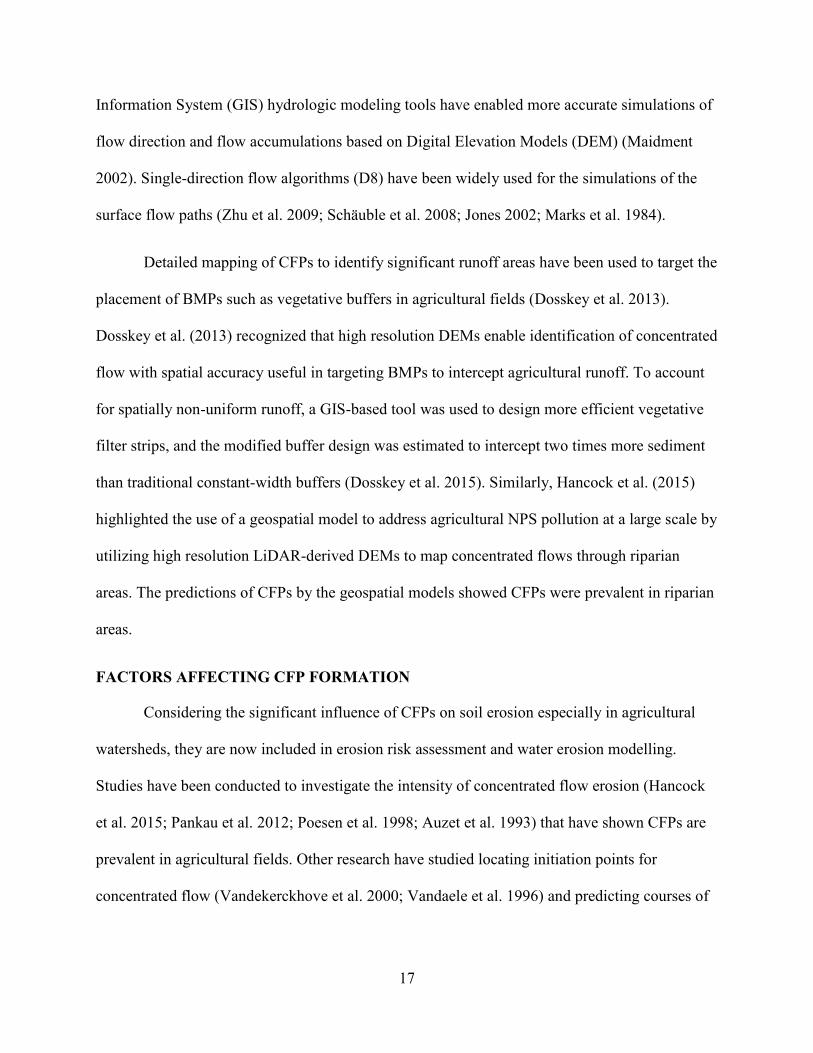
Detailed mapping of CFPs to identify significant runoff areas have been used to target the
placement of BMPs such as vegetative buffers in agricultural fields (Dosskey et al. 2013).
Dosskey et al. (2013) recognized that high resolution DEMs enable identification of concentrated
flow with spatial accuracy useful in targeting BMPs to intercept agricultural runoff. To account
for spatially non-uniform runoff, a GIS-based tool was used to design more efficient vegetative
filter strips, and the modified buffer design was estimated to intercept two times more sediment
than traditional constant-width buffers (Dosskey et al. 2015). Similarly, Hancock et al. (2015)
highlighted the use of a geospatial model to address agricultural NPS pollution at a large scale by
utilizing high resolution LiDAR-derived DEMs to map concentrated flows through riparian
areas. The predictions of CFPs by the geospatial models showed CFPs were prevalent in riparian
areas.
FACTORS AFFECTING CFP FORMATION
Considering the significant influence of CFPs on soil erosion especially in agricultural
watersheds, they are now included in erosion risk assessment and water erosion modelling.
Studies have been conducted to investigate the intensity of concentrated flow erosion (Hancock
et al. 2015; Pankau et al. 2012; Poesen et al. 1998; Auzet et al. 1993) that have shown CFPs are
prevalent in agricultural fields. Other research have studied locating initiation points for
concentrated flow (Vandekerckhove et al. 2000; Vandaele et al. 1996) and predicting courses of
18
concentrated flow (Vandaele et al. 1996; Desmet et al. 1996; Moore et al. 1988), primarily using
the relationship between local surface slope and upslope drainage area.
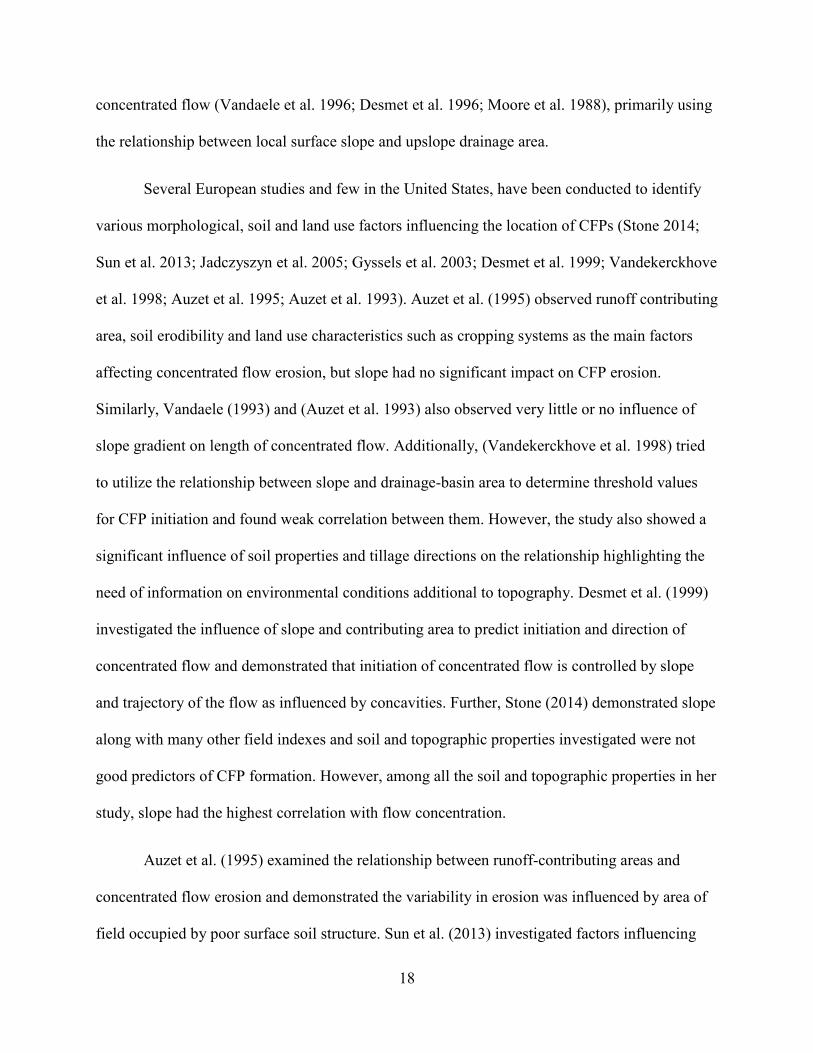
Several European studies and few in the United States, have been conducted to identify
various morphological, soil and land use factors influencing the location of CFPs (Stone 2014;
Sun et al. 2013; Jadczyszyn et al. 2005; Gyssels et al. 2003; Desmet et al. 1999; Vandekerckhove
et al. 1998; Auzet et al. 1995; Auzet et al. 1993). Auzet et al. (1995) observed runoff contributing
area, soil erodibility and land use characteristics such as cropping systems as the main factors
affecting concentrated flow erosion, but slope had no significant impact on CFP erosion.
Similarly, Vandaele (1993) and (Auzet et al. 1993) also observed very little or no influence of
slope gradient on length of concentrated flow. Additionally, (Vandekerckhove et al. 1998) tried
to utilize the relationship between slope and drainage-basin area to determine threshold values
for CFP initiation and found weak correlation between them. However, the study also showed a
significant influence of soil properties and tillage directions on the relationship highlighting the
need of information on environmental conditions additional to topography. Desmet et al. (1999)
investigated the influence of slope and contributing area to predict initiation and direction of
concentrated flow and demonstrated that initiation of concentrated flow is controlled by slope
and trajectory of the flow as influenced by concavities. Further, Stone (2014) demonstrated slope
along with many other field indexes and soil and topographic properties investigated were not
good predictors of CFP formation. However, among all the soil and topographic properties in her
study, slope had the highest correlation with flow concentration.
Auzet et al. (1995) examined the relationship between runoff-contributing areas and
concentrated flow erosion and demonstrated the variability in erosion was influenced by area of
field occupied by poor surface soil structure. Sun et al. (2013) investigated factors influencing

19
rill erosion and identified runoff erosivity and soil erodibility as two major factors that directly
affect rill erosion, and the study highlighted that future research must focus on combined effects
of multiple factors. Jadczyszyn et al. (2005) examined the effect of saturated hydraulic
conductivity to soil loss and concluded saturated hydraulic conductivity along with sand texture
groups can be used to assess soil loss from erosion. There is considerable variation in the
significance of the effects of slope and very limited research on the effects of soil properties on
concentrated flow. Further, very few studies have been conducted in the United States. This
study aims to contribute to the literature by assessing topographic features such as slope and
slope length and various physical and chemical properties of soil that influence CFP occurrence
and characteristics.

20
CHAPTER 2: METHODS
STUDY AREA
The study investigated agricultural fields in Jackson County, Illinois. The county is
located along the Mississippi River in southwestern Illinois. The climate in the area is typical of
the north-central United States with wide range of temperature between the extremes of winter
and summer and abundant rainfall. The average temperature in the area ranges from a low of -6
degrees Celsius in January to a high of 88 degrees Celsius in July. The area receives a range of
average monthly precipitation between 74 millimeters in January to 121 millimeters in May (WC
2016). Jackson County consists of cropland, pasture, forests, wetlands and small towns. The total
area of the county is 1,560 square kilometers with 1,510 square kilometers of land and 47 square
kilometers of water (USCB 2010). Minus areas near the Mississippi River, the average elevation
of the county is approximately 120 meters above mean sea level (USDC 2002).
PHYSIOGRAPHY AND GEOLOGY
Based on the national hierarchical framework for ecological units developed by the
United States Department of Agriculture (USDA) Forest Service, the southern part of Jackson
County lies in Shawnee Hills Section of the Interior Low Plateaus Province, the northern part of
the county lies in the Mount Vernon Hill County subsection of the Till Plains section of the
Central Lowland Province and the western part of the county lies in the Mississippi flood plain
of the Salem Plateau section of the Ozark Plateaus Province (Appendix I) (ISGS 2016).
The county has three distinctive topographic regions: a wide flood plain by the
Mississippi River in the southwestern portion, rocky bluffs and rough hills in the middle, and flat
forested areas with few island prairies lie in the northeastern portion of the county (Figure 6).
The parent material is loess over bedrock of Pennsylvanian and Mississippian age (USDA 2005).

21
The soils in the county are in different stages of development such as young soils in floodplains
under Inceptisol soil order that are exposed to frequent deposition as well as rapid erosion while
upland soils are under different mature stages based on ages of the loesses and exposure to
erosion, generally falling in the Alfisol soil order (Norton et al. 1933). The soil in the county is
rich in organic matter (1-2 percent) and nutrients for plant growth. Approximately, 55 percent of
land in the county is used for agricultural production (USDA 2012).
Figure 6 Three major topographic regions, flat forested inside the green boundary, rough hills region inside the orange boundary and floodplain region inside the blue boundary, of Jackson County, Illinois (USDA 2005)
22
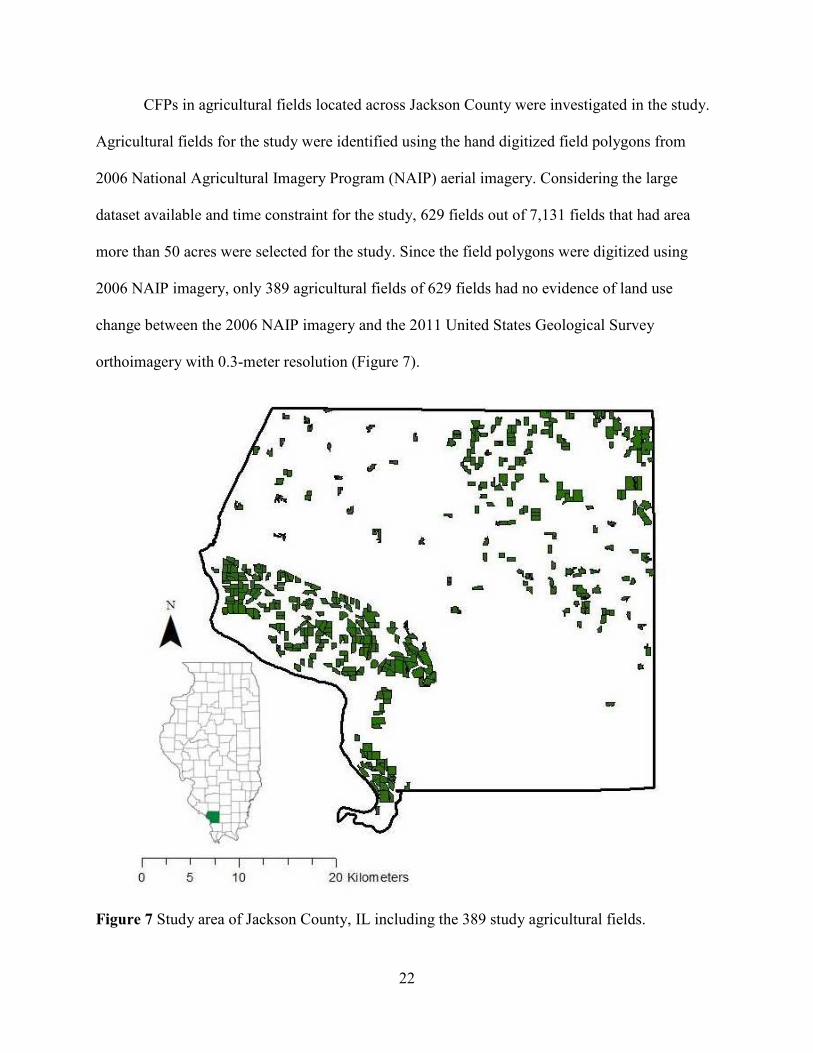
CFPs in agricultural fields located across Jackson County were investigated in the study.
Agricultural fields for the study were identified using the hand digitized field polygons from
2006 National Agricultural Imagery Program (NAIP) aerial imagery. Considering the large
dataset available and time constraint for the study, 629 fields out of 7,131 fields that had area
more than 50 acres were selected for the study. Since the field polygons were digitized using
2006 NAIP imagery, only 389 agricultural fields of 629 fields had no evidence of land use
change between the 2006 NAIP imagery and the 2011 United States Geological Survey
orthoimagery with 0.3-meter resolution (Figure 7).
Figure 7 Study area of Jackson County, IL including the 389 study agricultural fields.
23
PERCENTAGE OF FIELD DRAINAGE CALCULATION
With the availability of high resolution data such as LiDAR, mapping of concentrated
flow over a large geographic area is possible. ArcGIS v. 10.4 was used to derive DEMs from
LiDAR point data that were used to identify and map concentrated flow in the fields. The
LiDAR data were collected in 2011 by the Illinois Height Modernization Program (ILHMP)
managed by the Illinois State Geological Survey (ISGS). Point spacing for the data were 1.0
meters and point density of one point per 1 square meters. The calculated horizontal accuracy of
the point cloud data was 0.61 meter and calculated fundamental vertical accuracy of the
classified data was 0.07 meter.
The LiDAR point data were stored in LAS format which were converted to LAS dataset
using the Create LAS Dataset geoprocessing tool to make rasters like DEM directly from the
LAS dataset. Since DEMs are made from all the points that include ground and non-ground
points, Ground filter was selected from the Filter tab of Layer Properties dialog box of LAS
dataset to get the elevation DEM of ground. The created layer was then used as input to the LAS
Dataset to Raster tool. Since LiDAR data are dense, time-consuming interpolation methods were
deemed unnecessary, so fast binning of the points is selected for the interpolation method with
Natural Neighbor for Void Fill Method and Average selected for the Cell Assignment Type,
which is considered best for the bare earth points to produce the DEM. The LiDAR-derived
DEM had a cell resolution of 3 meters and was projected with Illinois State Plane West (NAD
1983, NAD 2011 adjustment) coordinate system with the linear unit of the US survey feet. The
DEM was used to delineate watersheds using the Hydrology toolbox under Spatial Analysis
Tools.

24
The DEM for all the fields was extracted from the LiDAR point data and were
preprocessed to fill sinks within the DEM using the Fill tool. Sinks in a surface raster are cells
without any drainage value. Filling the sinks in DEM is an important step because drainage value
indicates the flow direction out of a cell and helps build the drainage network. Using the Flow
direction tool, flow direction raster was generated from the filled DEM using the single flow
eight-direction (D8) flow algorithm that determines eight valid output directions related to the
eight adjacent cells around a cell (Figure 8) (Jenson et al. 1988). Flow direction was determined
by finding the direction of steepest downslope neighbor or maximum drop from each cell.
Maximum drop was calculated using the following equation:
Maximum drop = Change in elevationDistance between cell centers
Figure 8 Elevation raster (top left) used to determine flow direction raster (top right) using the single flow eight-direction (D8) flow algorithm (adapted from ESRI)
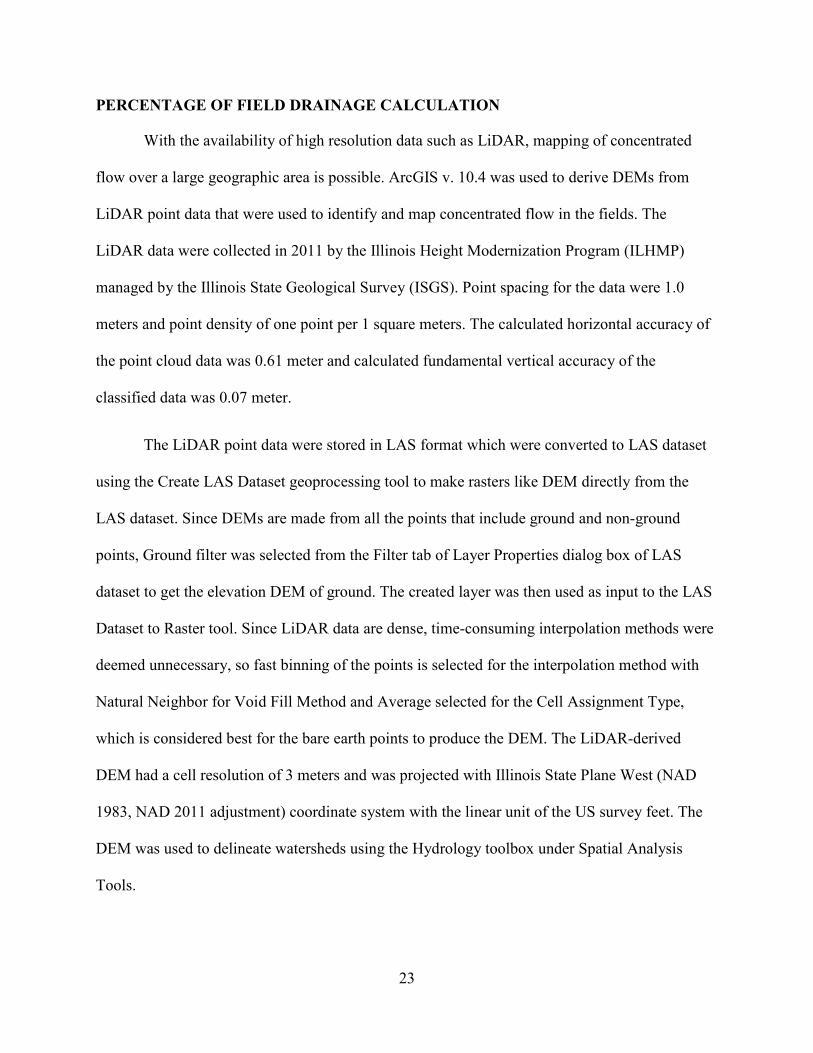
The flow direction raster was then processed to generate a flow accumulation raster using
the Flow accumulation tool that calculates accumulated flow as the accumulated weight of all
25
surrounding cells flowing into each downslope cell. In the flow accumulation raster, each cell
value represents the number of cells upstream which helps in calculating flow accumulation
above each cell (Figure 9). Cells with zero flow accumulation are local topographic highs while
cells with high flow accumulation are areas of concentrated flow and can be used to identify
channels such as CFPs or rills.
Figure 9 Flow direction raster (top left) showing the direction of flow from each cell, flow accumulation raster (right) with the number of cells that flow into each cell (adapted from ESRI)
Based on the general critical contributing area defined by Montgomery et al. (1989) , the
critical contributing area of 92.903 square meters was used to generate the flow accumulation
grid. Cells with high flow accumulation are areas of concentrated flow and can be used to
identify CFPs in an agricultural field. Based on the concentrated flow identified using the flow
accumulation raster, pour points were created as a shapefile, and using the Snap Pour Point tool,
the pour points were snapped to ensure the points were selected as high flow accumulation points
during watershed delineation. Using the pour points, watersheds were delineated to determine the
contributing area flowing to the selected points.

26
Using the Raster to Polygon tool in the Conversion toolbox, the flow accumulation
rasters were converted to polylines to calculate the length of each individual CFP, which is the
sum of length of all tributaries of a CFP. CFP length was further categorized into three groups:
small that ranged from 0 to 33 percent, medium that ranged from 34 to 66 percent and large that
was greater than 67 percent of the field length parallel to the CFP. Since CFP length used the
sum of all the tributaries of a CFP, in some cases the percent exceeded 100, so greater than 67
percent was used to categorize large CFP length. For irregular field polygons, such as triangles
and trapezoids, their height or the longest length and width, respectively, was used as the field
length parallel to concentrated flow. For other irregular field polygons with variable field length
sides, the field length most closely parallel to the concentrated flow was used (Appendix III).
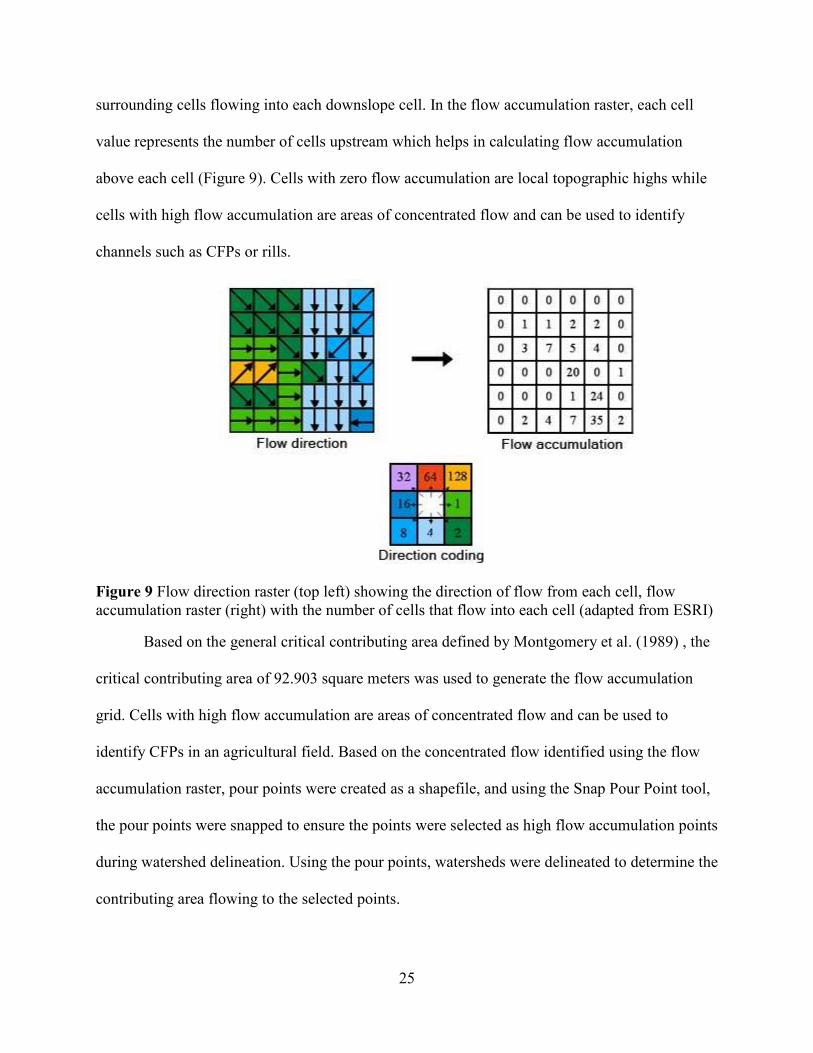
The delineated watershed rasters were then converted to polygons to calculate the
drainage area of each CFP (Figure 10). Since there were 2049 CFPs identified in 389 agricultural
fields, repeating each step of watershed delineation for all CFPs was made easy through ArcMap
models. Batch processing of snapping pour points to converting watershed rasters into polygons
was performed using a model developed using ArcGIS Model Builder for the project (Appendix
II). Additionally, the watershed area was also used to estimate the percent area of a field drained
by the watersheds inside the field. Some CFPs had contributing areas that extended beyond the
field to adjoining fields, so for drainage area of individual CFP, total watershed area (Figure 10),
but to estimate the percentage of field area drained, drainage area was limited to the field where
the CFP initiated (Figure 11). The drainage area of the CFPs were categorized into three
categories: small that ranged from 0 to 33 percent, medium that ranged from34 to 66 percent and
large that ranged from 67 to 100 percent of the field area. Drainage density, the total length of all
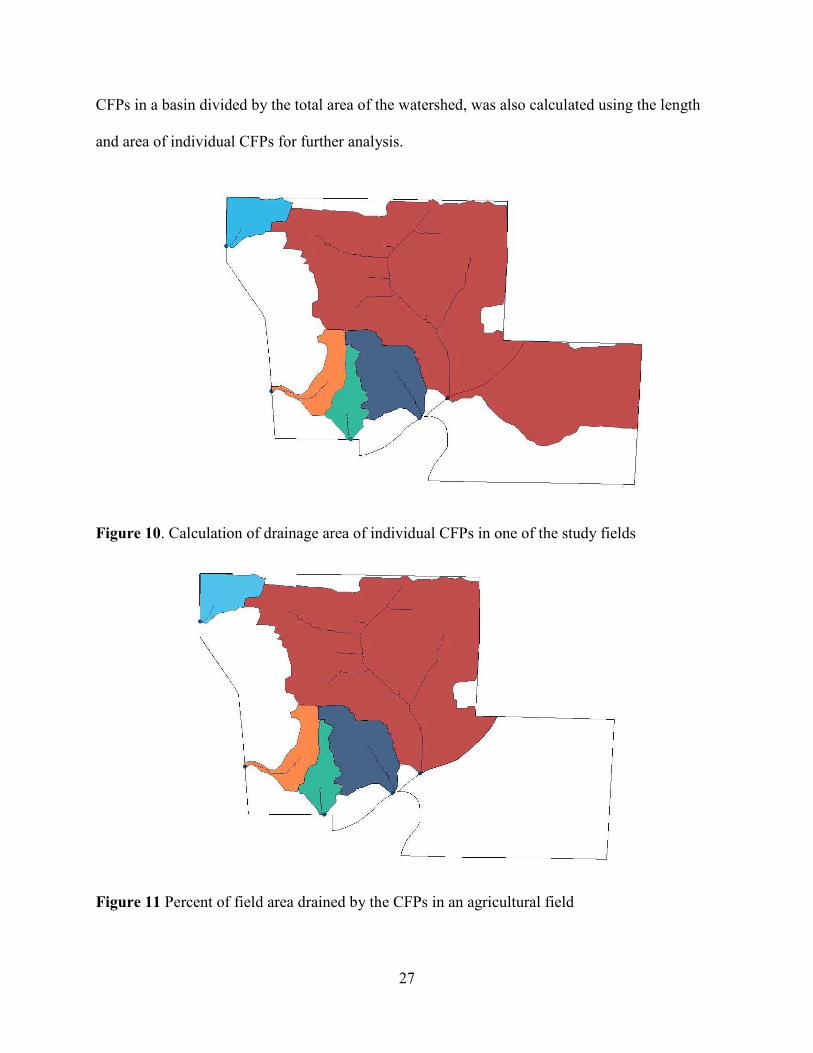
27
CFPs in a basin divided by the total area of the watershed, was also calculated using the length
and area of individual CFPs for further analysis.
Figure 10. Calculation of drainage area of individual CFPs in one of the study fields
Figure 11 Percent of field area drained by the CFPs in an agricultural field
28
FACTORS INFLUENCING CONCENTRATED FLOW
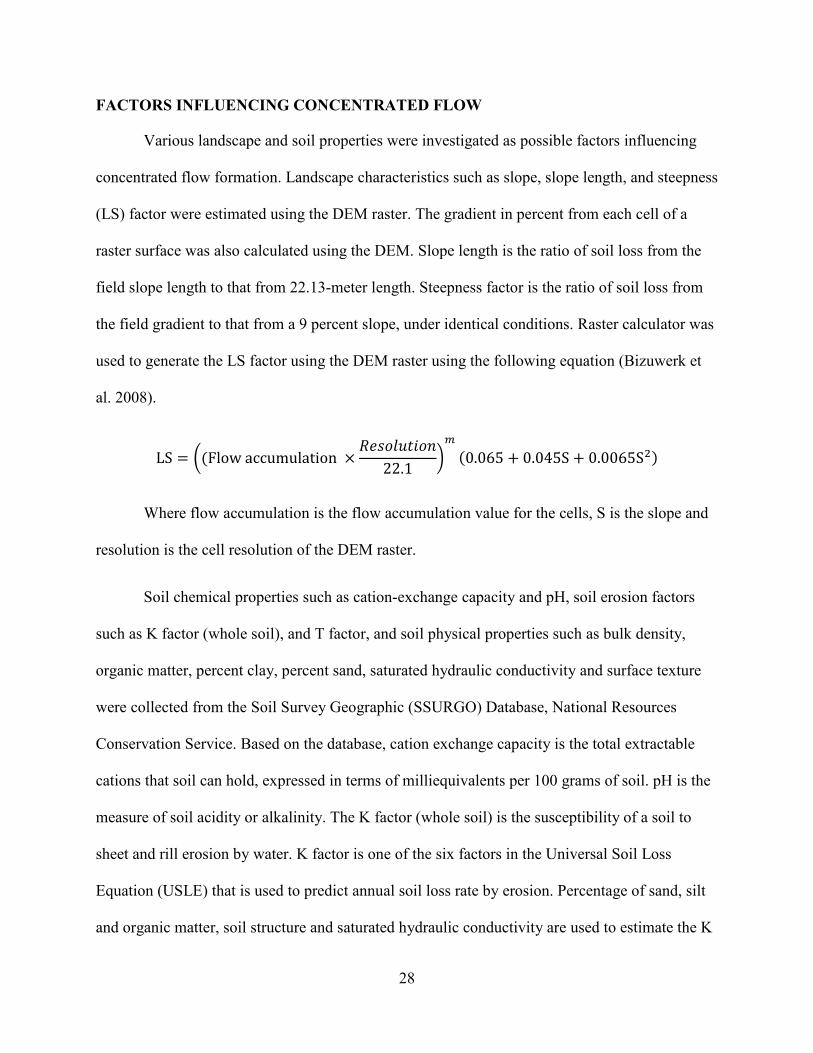
Various landscape and soil properties were investigated as possible factors influencing
concentrated flow formation. Landscape characteristics such as slope, slope length, and steepness
(LS) factor were estimated using the DEM raster. The gradient in percent from each cell of a
raster surface was also calculated using the DEM. Slope length is the ratio of soil loss from the
field slope length to that from 22.13-meter length. Steepness factor is the ratio of soil loss from
the field gradient to that from a 9 percent slope, under identical conditions. Raster calculator was
used to generate the LS factor using the DEM raster using the following equation (Bizuwerk et
al. 2008).
LS = �(Flow accumulation × !"#$%&'#(22.1 ,
-(0.065 + 0.045S + 0.0065S34
Where flow accumulation is the flow accumulation value for the cells, S is the slope and
resolution is the cell resolution of the DEM raster.
Soil chemical properties such as cation-exchange capacity and pH, soil erosion factors
such as K factor (whole soil), and T factor, and soil physical properties such as bulk density,
organic matter, percent clay, percent sand, saturated hydraulic conductivity and surface texture
were collected from the Soil Survey Geographic (SSURGO) Database, National Resources
Conservation Service. Based on the database, cation exchange capacity is the total extractable
cations that soil can hold, expressed in terms of milliequivalents per 100 grams of soil. pH is the
measure of soil acidity or alkalinity. The K factor (whole soil) is the susceptibility of a soil to
sheet and rill erosion by water. K factor is one of the six factors in the Universal Soil Loss
Equation (USLE) that is used to predict annual soil loss rate by erosion. Percentage of sand, silt
and organic matter, soil structure and saturated hydraulic conductivity are used to estimate the K
29
factor. In general, the value of K factor varies from 0.02 to 0.69, with higher values indicating
greater susceptibility of the soil to sheet and rill erosion. T factor is the estimate of the maximum
average annual soil erosion rate by wind and/or water that can occur without affecting crop
productivity over a sustained period. The T factor value ranges from 1 to 5 tons per acre per year,
with lower values representing shallow or fragile soils while higher values representing deep
soils less susceptible to erosion.
The bulk density is the measure of pore space in soil available for roots and water, which
is the oven dry weight of the soil material less than 2 millimeters in size per unit volume of soil.
Organic matter content of soil is comprised of plant and animal residues in the soil at various
stages of decomposition. Percent clay is expressed as a percentage by weight of the soil material
with diameter less than 0.002 millimeter. Similarly, percent sand is expressed as a percentage by
weight of the soil material with diameter 0.05 to 2 millimeters. Saturated hydraulic conductivity
(Ksat), measured in micrometers per second, determines the ability of the soil to transmit fluid,
generally water, through pore spaces under a hydraulic gradient. A higher value of the Ksat
indicates higher infiltration rate and lower susceptibility of overland flow generation and soil
detachment. Soil series information was collected from the SSURGO database and productivity
index categories were identified for each series using the taxonomically based productivity
index, ranging from 0 (least productive) to 19 (most productive), developed by Schaetzl et al.
(2012) for landscape-scale analysis. The range was divided into sub-categories of 0-5 as low
productivity, 6-12 as medium productivity and 13-19 as high productivity for this study.
STATISTICS
All statistical analyses were performed on the weighted average of the field
characteristics with numerical values, whereas the most representative value based on field area
30
covered were used for the field characteristics with categorical values. Mean values of all CFP
characteristics were compared among the topographic regions, and mean values of CFP drainage
area and length in different size categories were compared among different soil texture groups
using one way ANOVA in SAS v. 9.4 (SAS Institute Inc., Cary, NC, USA). Multiple regression
in conjunction with Classification and Regression Trees (CART) was used to examine the effect
of soil and topographic characteristics on CFP attributes. The association between the field
characteristics (bulk density, CEC, drainage class, ECEC, K factor, organic matter, percent clay,
percent sand, pH productivity index category, saturated hydraulic conductivity, soil texture,
slope, slope length, T factor) as independent variables and CFP drainage area, CFP length, CFP
length to drainage area ratio and drainage density as dependent variables was analyzed using
multiple regression. Akaike’s Information Criterion (AIC) (Akaike 1974) was used to choose the
best model among different subsets of the independent variables. Based on the AIC method, the
model among all possible models that explains the most variation in the dependent variable using
the fewest independent variables was selected as the best model. After the models were selected,
multiple regression was used to analyze the association between the soil and topographic
characteristics and CFP characteristics. Significance was tested at an alpha level of 0.05. Model
selection and multiple regression were performed in SAS v. 9.4 (SAS Institute Inc., Cary, NC,
USA).
Although many field characteristics were identified as statistically significant predictor
variables, the adjusted R squared values were relatively low. CART analysis was used to further
analyze the role of soil and topographic characteristics in CFP formation. CART analysis, a
common data mining technique, is a powerful analytical tool used to determine the most
important variables in a dataset and to generate visual representation of the effects of the factors

31
influencing CFP formation. CART analysis is a binary recursive partitioning method based on a
single independent variable that builds classification trees for categorical dependent variables
while regression trees for continuous dependent variables (Breiman et al. 1984). One of the
major benefit of CART is it handles imbalances, interactions and non-linear relationships in
complex dataset found in many ecological studies (Kulmatiski et al. 2004; De'Ath 2002). CART
analysis has also been used in soil and physiographic data to investigate determinants of storage
of carbon and nitrogen (Bedison et al. 2009; Johnson et al. 2009; Kulmatiski et al. 2004) ,
exchangeable calcium and magnesium (Kabrick et al. 2011) and total and available phosphorus
in forest soils (Singh et al. 2015). The CART model is very useful in large datasets as the model
is not sensitive to outliers and can handle missing values.
The CART analysis is performed in two major steps: a recursive partitioning and a cross
validation. In this study, CFP characteristics, number of CFPs, CFP length, CFP drainage area,
CFP length to drainage area ratio and drainage density were used as continuous response
variables to build five regression trees while the investigated explanatory variables were all soil
and topographic characteristics, the independent variables used in the multiple regression. The
first step partitions data into smaller groups which helps to clearly visualize interactions between
variables. The first iteration splits the data into two mutually-exclusive groups or “nodes” using
explanatory variables, with minimum variation of the two nodes. Each node was further
partitioned into two subsets using explanatory variables during successive iteration, which
reduces overall variation in the dataset. The splitting of data continued until a terminal node was
reached, allowing no further splitting, and the residual variation of data was less than 1 percent.
Since all the response variables were continuous datasets, ANOVA method was used to define
32
the splitting criteria: SST – (SSL+SSR), where SST is the sum of squares for the data and SSR
and SSL are the sums of squares for the left and right nodes created by splitting the data.
After the recursive partitioning process generated a tree of maximum size with possibility
of over fitted dataset, which appear statistically significant but are just noise (Breiman et al.
1984), a 10-fold cross validation procedure was used to determine the optimal model. The
procedure partitioned the dataset into ten equal groups with similar distribution. Models for nine
groups were then created and error was calculated between the nine groups and the remaining
one. The error comparison continued until each of the data groups were used for the error
comparison with the remaining nine groups. The model with the lowest overall error was
selected as the optimum model. The CART model was built using R software v. 3.3.1 using the
RPART package (The R Foundation for Statistical Computing, Vienna, Austria).
The distribution of the study agricultural fields in the county was observed to be
associated with the three major topographic regions in the county. Hence, the fields were
categorized into the three regions to address any spatial correlation that might influence the
occurrence of CPFs and add error term to the regression model if any spatial correlation is
detected. Spatial correlation was investigated in SAS v. 9.4 (SAS Institute Inc., Cary, NC, USA)
using the Variogram procedure and in ArcGIS v. 10.4 using the Geostatistical analyst tool to
generate semi-variograms for each dependent variable. Semi-variograms for all dependent
variables generated using the procedure did not indicate spatial correlation (increase in
variogram values with the separation distance), so no error term in the multiple regression
models were added.

33
CHAPTER 3: IMPORTANCE OF CONCENTRATED FLOW PATHS IN
AGRICULTURAL WATERSHEDS IN SOUTHERN ILLINOIS
ABSTRACT
Field scale research show concentrated flow paths (CFPs) are prevalent in agricultural
watersheds, but very few studies have investigated the occurrence of CFPs at a large geographic
extent. In 389 agricultural fields across Jackson County, southern Illinois, this study used high
resolution LiDAR data to identify CFPs in agricultural fields, and calculate the percentage of the
field drained by CFPs. Topographic and soil properties were obtained from SSURGO database to
investigate the association between field characteristics and CFP formation using multiple
regression and CART analysis. The mean number of CFPs in a field was 5 with a minimum of 0
and maximum of 17 CFPs, and only 2 of the 389 fields had no CFPs. The majority of the CFPs
fell under the large category for CFP length and drainage area that corresponds with high mean
percent of field area drained by CFPs, 81 percent, with minimum of 35 percent and maximum of
100 percent drainage. 85 percent of the fields had more than 70 percent of their area drained by
CFPs. These findings indicate high prevalence of CFPs at a county scale and their significant
contribution to field drainage. The multiple regression and CART analysis showed slope as an
important factor influencing CFP characteristics such as CFP length, CFP drainage area, ratio of
CFP length to drainage area and drainage density. Other factors such as organic matter, K factor,
percent sand and LS factor were also identified as predictors of CFP characteristics. However, all
the factors examined explained only 2 to 22 percent of the variation observed. Regional variation
in CFP characteristics was observed with higher variability in the floodplain region and lower
variability in the rough hills region indicating other environmental, topographical and
climatological factors not included in the study may help account for the residual variation. The
results indicate high prevalence of CFPs at a regional scale and their significant contribution in

34
field drainage highlighting a need for research to quantify impacts of CFPs, and identify
controlling factors for CFP formation and development. This understanding could be very useful
in designing and targeting management practices for preventing soil loss and protecting water
quality.
INTRODUCTION
Agricultural Non-Point Source (NPS) pollution is identified as one of the leading sources
of water quality impairments of surface water resources. Transport of sediment and nutrients by
agricultural runoff has contributed to reduced soil productivity and poor water quality (EPA
2009). Concentrated flow channels such as rills, concentrated flow paths (CFPs) and permanent
gullies can encourage the export of agricultural pollutants through increased connectivity
between upland contributing areas and nearby water resources (Costigan 2010; Poesen et al.
2003; Abrahams et al. 1996).
For the purposes of this study, CFPs, sometimes referred to as ephemeral gullies, are
defined as small channels with intermediate size between rills and permanent gullies. CFP’s can
be filled by tillage unlike permanent gullies that are large channels with significant large width
and depth (Soil Science Society of America 2016). Distinguishing between different categories
of concentrated flow only through remote sensing is difficult without ground-truthed data, so all
identified forms of concentrated flow were coined as CFPs in this study.
Patterns of topography and microrelief in a landscape prevents uniform distribution of
agricultural runoff, so agricultural runoff concentrates in rills that can coalesce to form CFPs
(Costigan 2010; Dosskey et al. 2002). However, concentrated flow can also be caused by tillage
marks, surface roughness and soil erosion process (Foster et al. 1977). Further, increased soil

35
erodibility and poor soil structure through farming practices such as tillage can influence the
morphological evolution of CFPs, generally resulting in non-uniform cross-sections and flow
hydraulics of CFPs which makes it difficult to study and predict CFP initiation and development
(Pankau et al. 2012; Foster et al. 1977)
Different investigational approaches such as laboratory experiments, field studies and
spatial exploration are used to understand the development and evolution of CPFs (Bazzoffi
2015; Hancock et al. 2015; Dosskey et al. 2015; Pankau et al. 2012; Zhu et al. 2009; Govers et
al. 2007; Dosskey et al. 2002; Foster et al. 1977). CFPs are identified as both sediment sources
and transport areas (Lei et al. 1998; Nearing et al. 1997). A combination of laboratory and field
experiment investigating the source of sediments in CFPs using tracers showed that majority of
the sediment were eroded from the sides of the CFPs (Stevens et al. 2008). The contribution of
concentrated flow erosion to soil loss can vary from 10 to 94 percent of total sediment yield
(Poesen et al. 2003). Such variation in the soil loss rate can be influenced by spatial, temporal
and environmental factors, but CFPs have been identified as a dominant soil loss pathway in
agricultural watersheds (Lee et al. 2003; Poesen et al. 2003). Annual sediment transport by CFPs
are significant that can be up to two orders magnitude higher than transport rate by raindrop
splash (Poesen et al. 2003).
Pankau (2010) observed in a field scale study in southern Illinois that concentrated flow
accounted from 82.5 to 100 percent of the upland drainage areas. Further, a geospatial study
indicated 8 to 83 percent of the fields, with an average of 34 percent, were being drained by
concentrated flow (Hancock et al. 2015). Best management practices (BMPs) such as riparian
buffers are recommended to prevent sediment and nutrient transport to water resources; however,
riparian buffers were designed to handle sheet flow and not concentrated flow for effective
36
sediment trapping (Hancock et al. 2015; Pankau 2010; Dosskey et al. 2002). An evaluation of
concentrated flow through riparian buffers by Dosskey et al. (2002) showed a significant decrease
in the sediment-trapping efficiency of the buffers with a greater prevalence of concentrated flow.
Furthermore, studies have shown CFPs can be formed through riparian buffers (Hancock et al.
2015; Pankau 2010; Dosskey et al. 2002), significantly limiting their function.
Few studies have examined the occurrence of CFPs and their contribution to the transport
of agricultural runoff at a regional scale. Conducting field-scale studies at a large geographical
extent is limited by time and resources, but the availability of the high-resolution data such as
Light Detection and Ranging (LiDAR) in recent years have enabled geospatial studies to
overcome the limitation to effectively detect concentrated flows at a large scale (Hancock et al.
2015; Zhu et al. 2009). Further, most studies have investigated physical processes of CFP
formation while few have focused on the factors affecting the occurrence of CFPs. Hence, the
study aims to utilize the new geospatial methods to investigate the occurrence of concentrated
flow in the agricultural watersheds in Jackson County, Illinois. The research attempts to identify
and map CFPs in agricultural watersheds in southern Illinois as well as assess the percent area of
agricultural field drained by CFPs. Additionally, the study examines the association between soil
and topographic characteristics and the occurrence of CFPs.
METHODS
STUDY AREA
The area of study is Jackson County, Illinois, located along Mississippi River in
southwestern Illinois. The average temperature in the area ranges from a low of -6 degrees
Celsius in January to a high of 88 degrees Celsius in July, and the average monthly precipitation
ranges between 74 millimeters in January to 121 millimeters in May (WC 2016). The southern

37
part of the county lies in Interior Plateaus Province, the northern part in Central Lowland and the
western part in the Ozark Plateaus Province (ISGS 2016). The county is divided into three major
topographic regions with a wide flood plain in its southwestern portion, rocky bluffs and hills in
the middle, and flat forested areas in the northeastern portion of the county (USDA 2005).
The parent material in the county is loess with majority of soils falling under Alfisol and
Inceptisol soil orders. The soil in the area is rich in organic matter and nutrients for plant growth,
approximately, 55 percent of land in the county is used for agricultural production (USDA 2012).
Hand digitized field polygons developed from 2006 National Agricultural Imagery Program
(NAIP) aerial imagery were used to select the agricultural fields for the study, so only 389 fields
out of 629 fields showed no evidence of land use change between the 2006 NAIP imagery and
the 2011 United States Geological Survey orthoimagery with 0.3-meter resolution (Figure 12).
Figure 12 Study area, Jackson County, IL

38
PERCENTAGE OF FIELD DRAINAGE CALCULATION
Digital Elevation Models (DEMs) were derived from LiDAR point data using ArcGIS v.
10.4 to identify concentrated flow in the fields (Figure 13). The LiDAR data were collected the
Illinois Height Modernization Program (ILHMP) managed by the Illinois State Geological
Survey (ISGS) in 2011. Point spacing for the data was 1.0 meters with a point density of one
point per 1 square meters. The calculated horizontal accuracy of the point cloud data was 0.61
meter and calculated fundamental vertical accuracy of the classified data was 0.07 meter. The
LiDAR derived DEMs had a cell resolution of 3 meters and were projected with Illinois State
Plane West (NAD 1983, NAD 2011 adjustment) coordinate system with the linear unit of US
survey feet.
Figure 13 Elevation map of one of the agricultural watersheds in the study area derived from LiDAR point cloud data. The color gradient, yellow to blue, represents higher to lower elevation. The orange lines represent the CFPs determined using flow accumulations lines

39
Using the Hydrology toolbox under Spatial Analysis Tools, the DEMs were used to
identify the areas with highest flow accumulation, with the critical contributing area of 92.903
square meters, as CFPs, and to delineate the watershed area drained by the identified
concentrated flow (Figure 14). The drainage area of individual CFPs in an agricultural field were
used to examine the percent of the field area drained by the CFPs (Figure 14). Other CFP
characteristics such as CFP length and drainage density were also calculated for statistical
analyses. CFP length was calculated as the total length of all the tributaries of a concentrated
flow, while drainage density was calculated as the total length of CFPs in a field divided by the
total area of the field. CFP length and area were categorized into small, medium and large groups
based on the percent of the field length parallel to the concentrated flow and percent of the field
area covered by a CFP drainage area, respectively. For CFP drainage area, small, medium, and
large area groups covered 0 to 33, 34 to 66 and 67 to 100 percent of field area. Similarly, for
CFP length, small, medium and large length groups covered 0 to 33, 34 to 66 and greater than 67
percent of field length parallel to CFPs.
Figure 14 Calculation of drainage area of individual CFPs (left) and percent of field area drained by the CFPs (right) in one of the agricultural watersheds in the study area
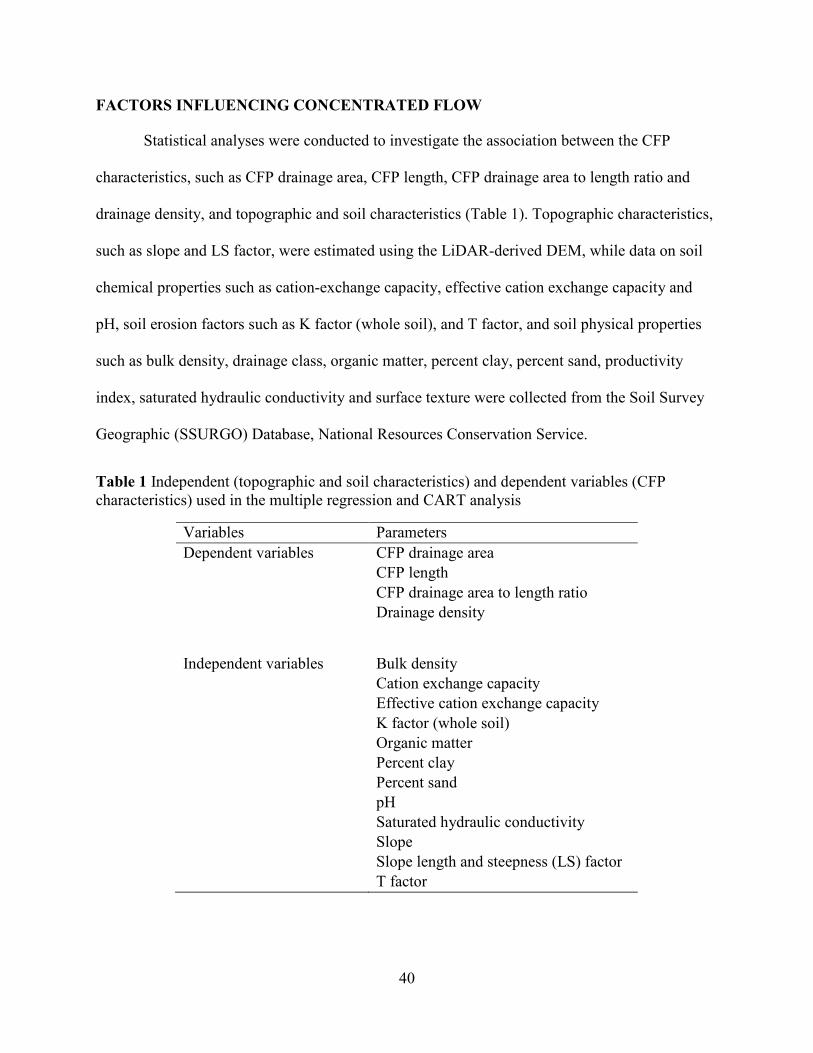
40
FACTORS INFLUENCING CONCENTRATED FLOW
Statistical analyses were conducted to investigate the association between the CFP
characteristics, such as CFP drainage area, CFP length, CFP drainage area to length ratio and
drainage density, and topographic and soil characteristics (Table 1). Topographic characteristics,
such as slope and LS factor, were estimated using the LiDAR-derived DEM, while data on soil
chemical properties such as cation-exchange capacity, effective cation exchange capacity and
pH, soil erosion factors such as K factor (whole soil), and T factor, and soil physical properties
such as bulk density, drainage class, organic matter, percent clay, percent sand, productivity
index, saturated hydraulic conductivity and surface texture were collected from the Soil Survey
Geographic (SSURGO) Database, National Resources Conservation Service.
Table 1 Independent (topographic and soil characteristics) and dependent variables (CFP characteristics) used in the multiple regression and CART analysis
Variables Parameters
Dependent variables CFP drainage area
CFP length
CFP drainage area to length ratio
Drainage density
Independent variables Bulk density
Cation exchange capacity
Effective cation exchange capacity
K factor (whole soil)
Organic matter
Percent clay
Percent sand
pH
Saturated hydraulic conductivity
Slope
Slope length and steepness (LS) factor
T factor
41
STATISTICS
In this study, the weighted average of the field characteristics with numerical values, and
the most representative value based on field area covered for the field characteristics with
categorical values, were used for all the statistical analyses. One way ANOVA in SAS v. 9.4
(SAS Institute Inc., Cary, NC, USA) was used to compare the mean values of all CFP
characteristics among the three topographical regions of the county and compare the CFP
drainage area and length size categories among different soil texture groups. Since agricultural
fields were distributed within the three topographic regions of the county, the fields were
categorized accordingly to address for any spatial correlation that might influence the occurrence
of CFPs. Spatial correlation was investigated by looking at the semi variogram for each
dependent variable generated using the Variogram procedure in SAS v. 9.4 (SAS Institute Inc.,
Cary, NC, USA) and Geostatistical analyst tool in ArcGIS v. 10.4 (ESRI, NY, USA).
Multiple regression in conjunction with Classification and Regression Trees (CART) was
used to investigate the factors influencing CFP characteristics. The association between the
topographic and soil characteristics as independent variables and CFP drainage area, CFP length,
CFP length to drainage area ratio and drainage density as dependent variables was analyzed
using multiple regression (Table 1). The best model among different subsets of independent
variables were selected using Akaike’s Information Criterion (AIC) (Akaike 1974) that selects
the model among all possible models that explains the most variation in the dependent variable
using the fewest independent variables. After the models were selected, multiple regression was
used to analyze the association between the topographic and soil characteristics and CFP
characteristics. Significance was tested at an alpha level of 0.05. Model selection and multiple
regression were performed in SAS v. 9.4 (SAS Institute Inc., Cary, NC, USA).
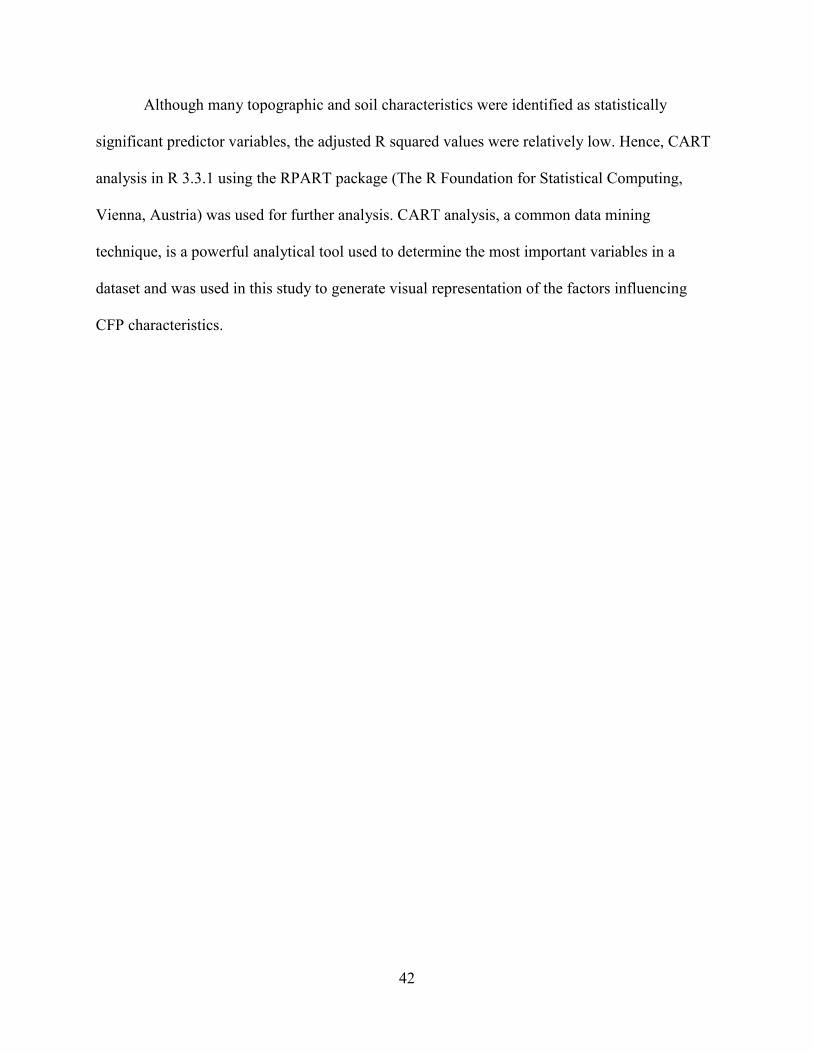
42
Although many topographic and soil characteristics were identified as statistically
significant predictor variables, the adjusted R squared values were relatively low. Hence, CART
analysis in R 3.3.1 using the RPART package (The R Foundation for Statistical Computing,
Vienna, Austria) was used for further analysis. CART analysis, a common data mining
technique, is a powerful analytical tool used to determine the most important variables in a
dataset and was used in this study to generate visual representation of the factors influencing
CFP characteristics.
43
RESULTS
IDENTIFYING CFPs IN AGRICULTURAL WATERSHEDS
In total, 2049 CFPs were identified in the study area, and the average number of CPFs
observed per study field was 5 with minimum of 0 and maximum of 17, and only two of the
fields had no CFPs (Table 2).
Table 2 Summary statistics of the different CFP characteristics in agricultural fields in Jackson County, IL (N=2049)
CFP characteristics Summary Statistics
CFP Length Mean 466.97
(meter) Min 3.74
Max 8501.15
CFP Drainage Area Mean 5.89
(hectares) Min 4.11E-04
Max 104.05
Drainage density Mean 0.0012
(per meter) Min 6.09E-06
Max 0.0117
The mean values of all CFP characteristics were higher in the floodplain region, followed
by the flat forested and the rough hills region, except for the number of CFPs (Figure 15) (Table
3). Fields with silty clay texture in the flat forested region had higher values of CFP length and
drainage area, while in the floodplain region, fields with fine sandy loam and silty clay loam
texture had higher values of CFP length and CFP drainage area (Table 4). Fields had a lower
drainage area ratio compared to the overall average for the region, except for the fields with silt
loam texture in the flat forested region and fields with silty clay texture in the floodplain region.
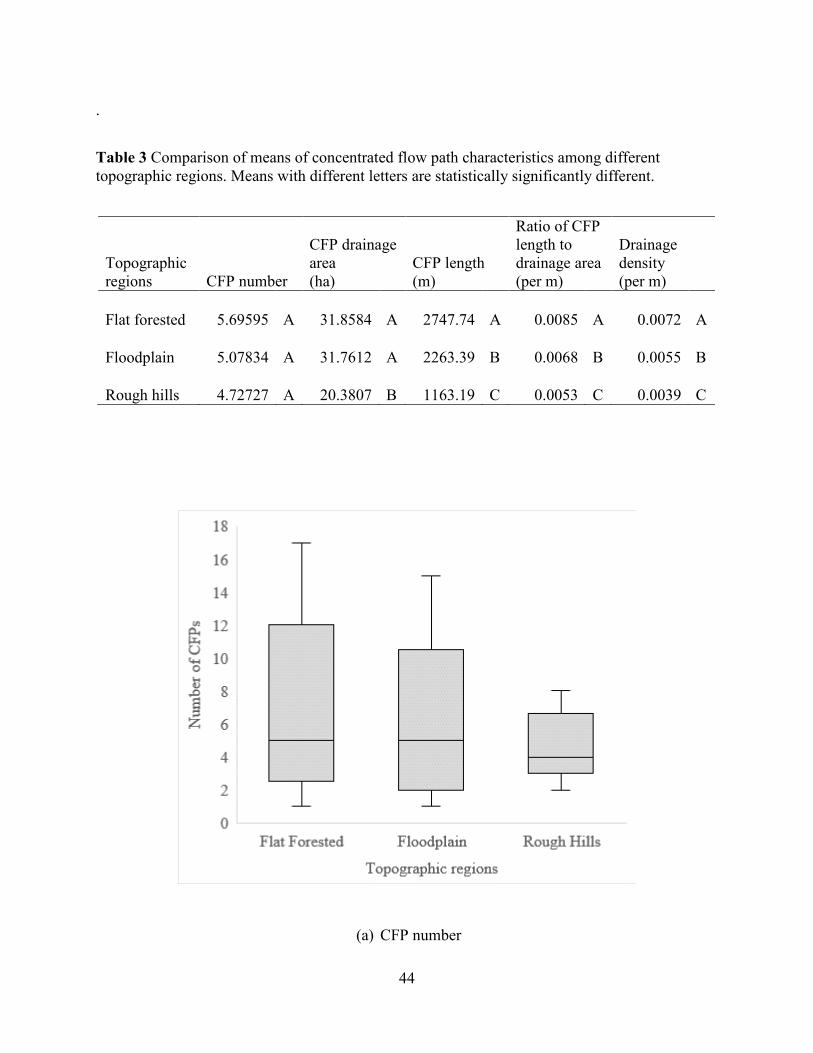
44
.
Table 3 Comparison of means of concentrated flow path characteristics among different topographic regions. Means with different letters are statistically significantly different.
Topographic regions CFP number
CFP drainage area (ha)
CFP length (m)
Ratio of CFP length to drainage area (per m)
Drainage density (per m)
Flat forested 5.69595 A 31.8584 A 2747.74 A 0.0085 A 0.0072 A
Floodplain 5.07834 A 31.7612 A 2263.39 B 0.0068 B 0.0055 B
Rough hills 4.72727 A 20.3807 B 1163.19 C 0.0053 C 0.0039 C
(a) CFP number

45
(b) CFP drainage area
(c) CFP length

46
(d) Ratio of CFP length to drainage area
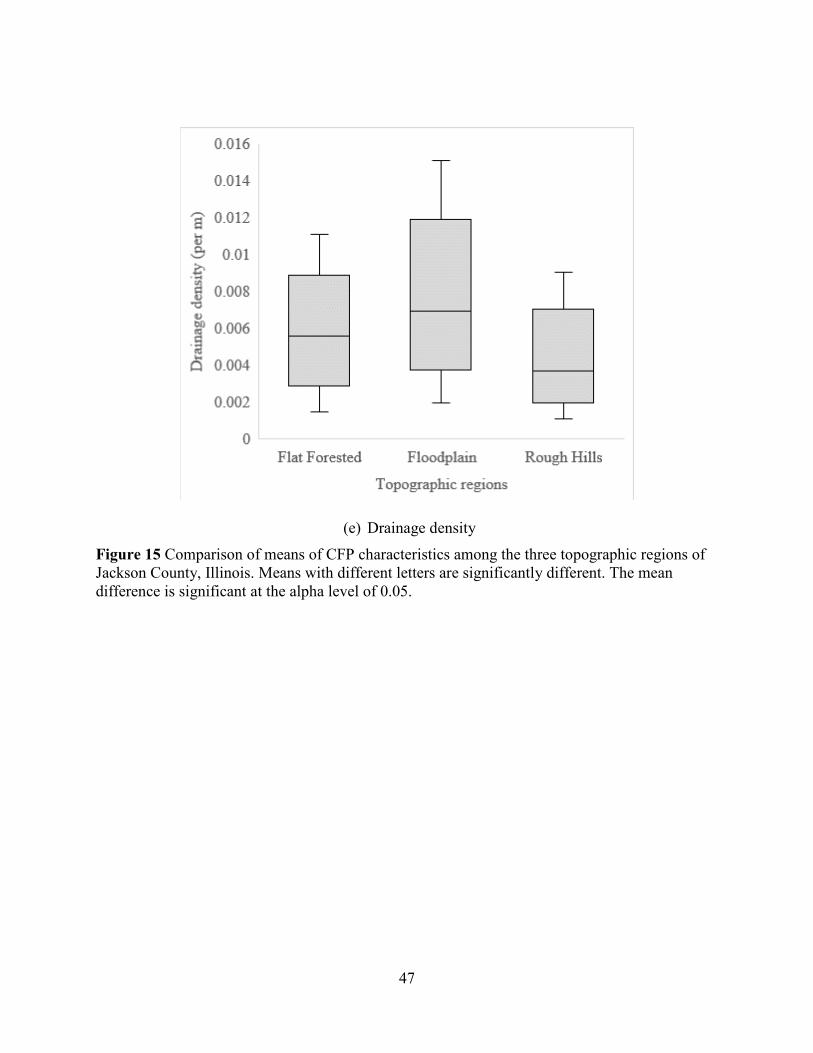
47
Figure 15 Comparison of means of CFP characteristics among the three topographic regions of Jackson County, Illinois. Means with different letters are significantly different. The mean difference is significant at the alpha level of 0.05.
(e) Drainage density

48
Table 4 Mean values of concentrated flow path characteristics based on the three topographic regions and among different soil texture groups (N=2047)
Topographic regions Soil texture CFP length
(meter) CFP drainage area (hectares)
Length to drainage area ratio
(per meter)
Drainage density (per meter)
Flat forested 397.37 5.58 0.0405 0.0010
Clay loam 161.72 2.48 0.0065 0.0004
Fine sandy loam 223.95 3.87 0.0048 0.0008
Silt loam 378.89 5.39 0.0466 0.0010
Silty clay 896.86 10.95 0.0063 0.0009
Silty clay loam 246.99 3.82 0.0058 0.0008
Floodplain 541.07 6.27 0.0949 0.0014
Fine sandy loam 649.57 10.66 0.0056 0.0010
Loam 462.42 5.78 0.0089 0.0017
Silt loam 534.87 6.04 0.0099 0.0014
Silty clay 528.58 6.11 0.1251 0.0014
Silty clay loam 658.01 7.33 0.0098 0.0016
Rough hills 246.06 4.31 0.0047 0.0008
Silt loam 244.86 4.33 .0046 0.0008
Silty clay loam 254.44 4.19 0.0053 0.0011
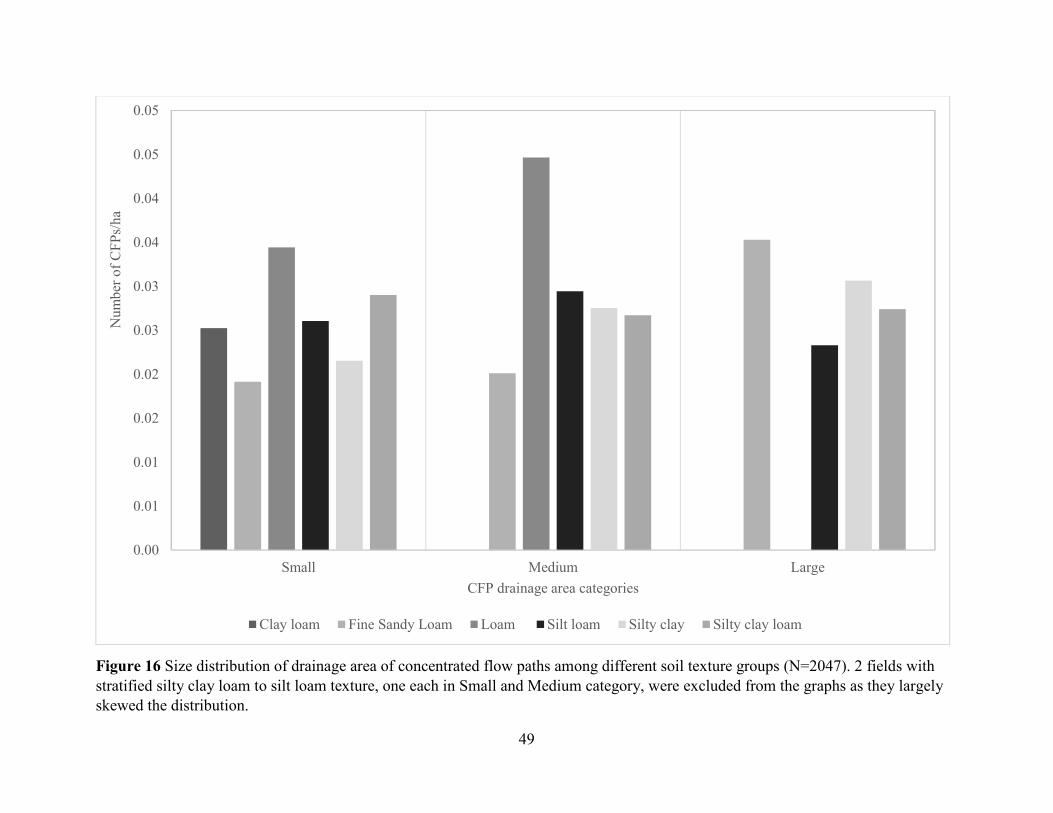
49
Figure 16 Size distribution of drainage area of concentrated flow paths among different soil texture groups (N=2047). 2 fields with
stratified silty clay loam to silt loam texture, one each in Small and Medium category, were excluded from the graphs as they largely
skewed the distribution.
0.00
0.01
0.01
0.02
0.02
0.03
0.03
0.04
0.04
0.05
0.05
Small Medium Large
Nu
mb
er o
f C
FP
s/h
a
CFP drainage area categories
Clay loam Fine Sandy Loam Loam Silt loam Silty clay Silty clay loam
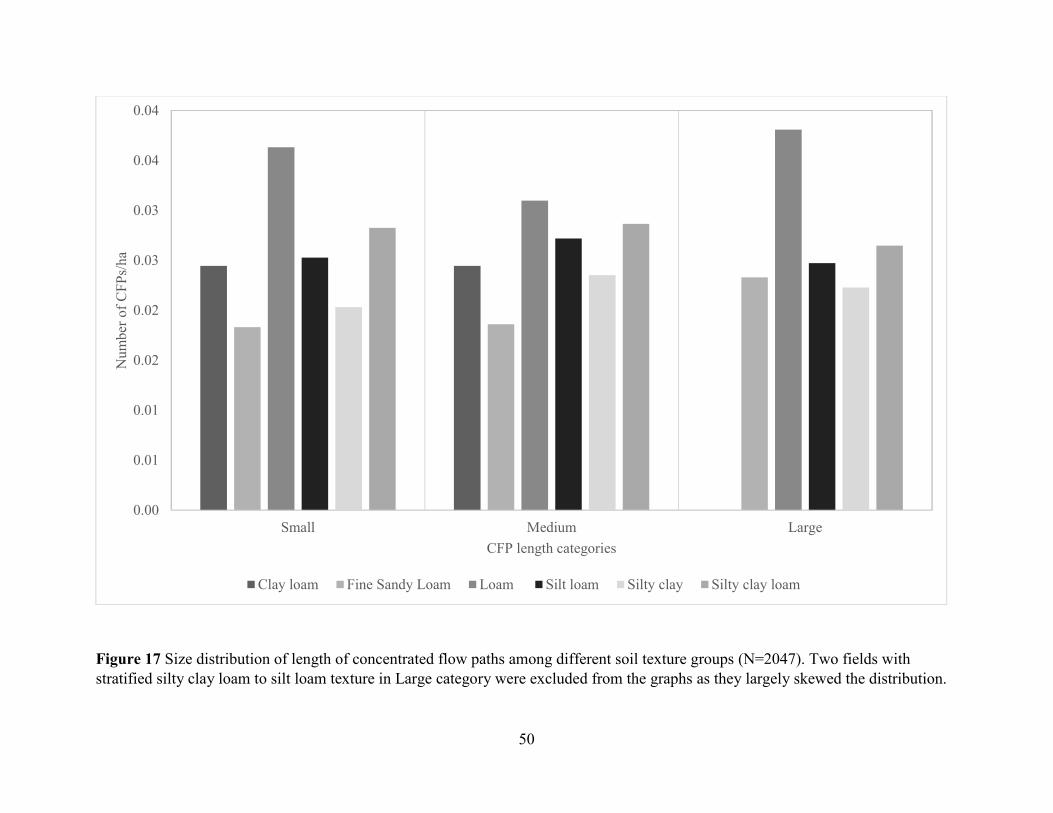
50
Figure 17 Size distribution of length of concentrated flow paths among different soil texture groups (N=2047). Two fields with
stratified silty clay loam to silt loam texture in Large category were excluded from the graphs as they largely skewed the distribution.
0.00
0.01
0.01
0.02
0.02
0.03
0.03
0.04
0.04
Small Medium Large
Num
ber
of
CF
Ps/
ha
CFP length categories
Clay loam Fine Sandy Loam Loam Silt loam Silty clay Silty clay loam

51
Comparison of the size distribution of CFP drainage area and length showed no specific
difference in the distribution (Figure 16 and 17). Among soil texture groups, number of CFPs per
hectare was higher in fields with loam texture, but the number of fields with loam texture is very
small.
PERCENT DRAINAGE AREA CALCULATION (Experimental Unit=Individual Fields)
Table 5 Summary statistics of the number of concentrated flow paths and percent of field area drained by concentrated flow paths (N=387) *
CFP characteristics Statistics Values
CFP number Average 5
Minimum 0
Maximum 17
Field area drained by CFPs Average 81.41
(%) Minimum 35.58
Maximum 99.75
*Two fields with no CFPs were not included in the percent drainage calculation
With each agricultural field as an experimental unit, an average of 5 CFPs were observed
per agricultural field with a minimum of 0 (only 2 fields) and maximum of 17 CFPs (Table 5).
The estimation of percent of field area drained by CFPs present in an agricultural field indicate
an average of 81 percent of field area is drained by CFPs, with minimum of 35 percent and
maximum of 100 percent (Table 5) (Figure 19). Some CFPs visible in the aerial imagery were
not included in the study as they were not detected using the LiDAR data probably because the
CFPs could have been tilled under or filled over (Figure 19). The vast majority of the study
fields, 85 percent, had more than 70 percent of their area drained by CFPs (Figure 18).
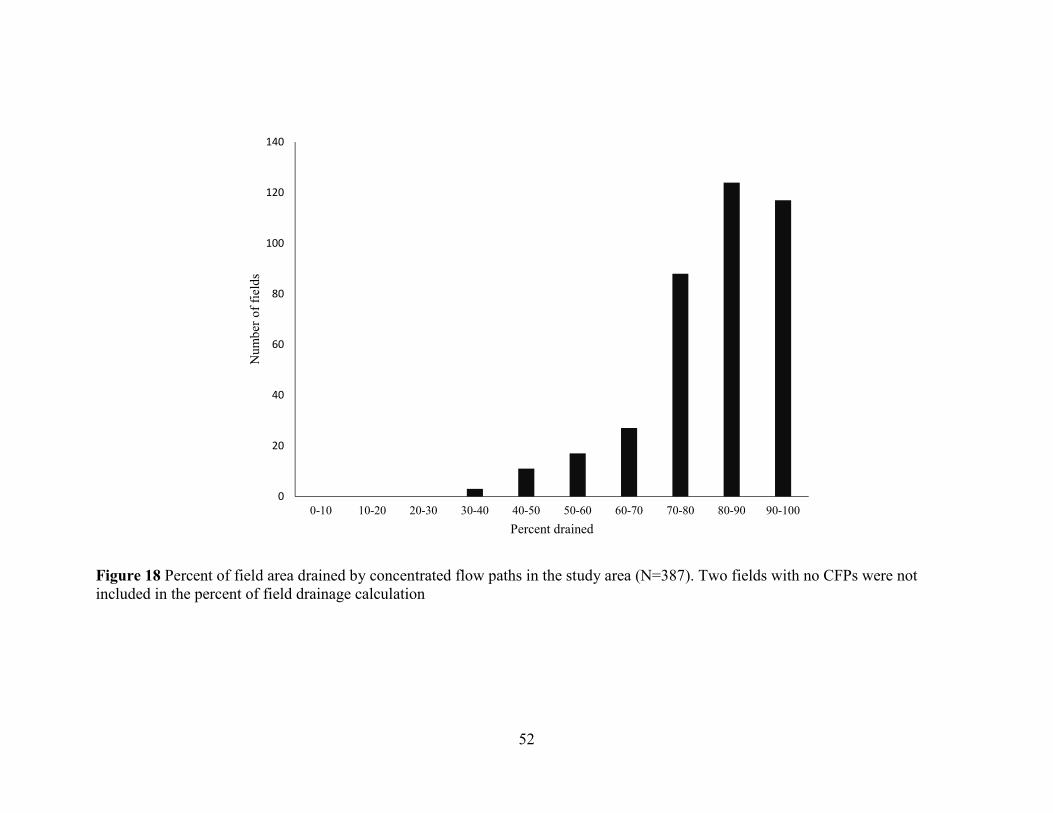
52
Figure 18 Percent of field area drained by concentrated flow paths in the study area (N=387). Two fields with no CFPs were not included in the percent of field drainage calculation
0
20
40
60
80
100
120
140
0-10 10-20 20-30 30-40 40-50 50-60 60-70 70-80 80-90 90-100
Num
ber
of
fiel
ds
Percent drained
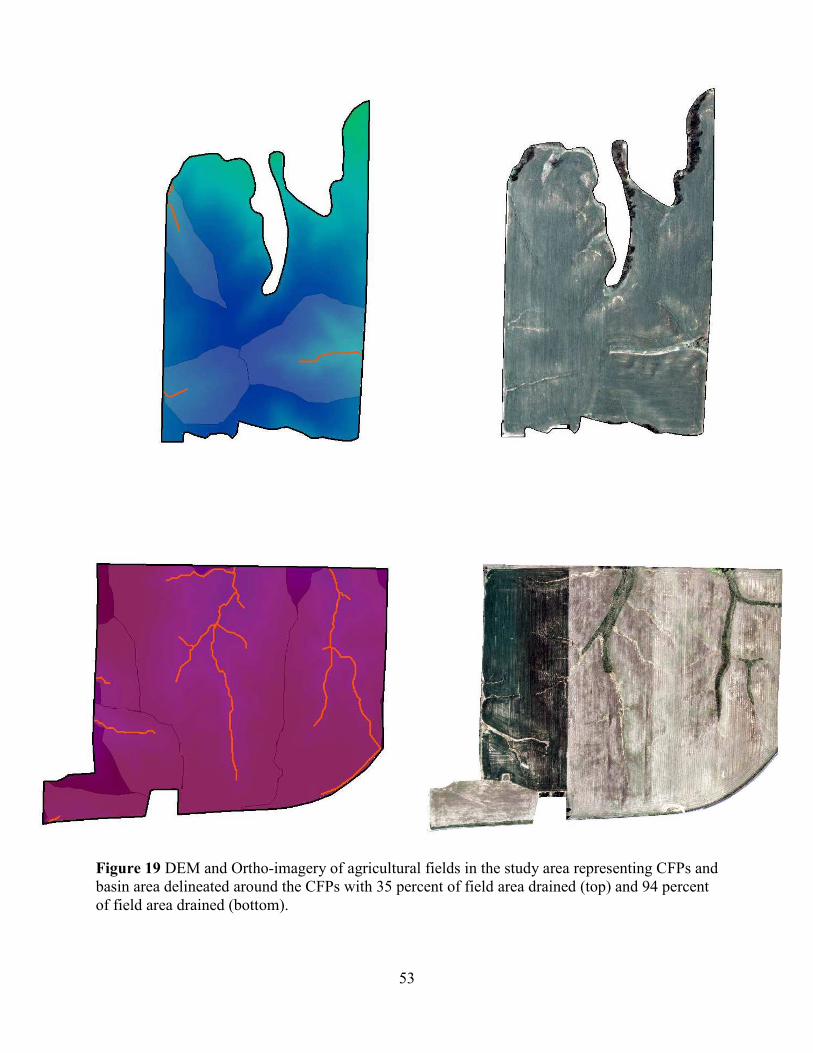
53
Figure 19 DEM and Ortho-imagery of agricultural fields in the study area representing CFPs and basin area delineated around the CFPs with 35 percent of field area drained (top) and 94 percent of field area drained (bottom).
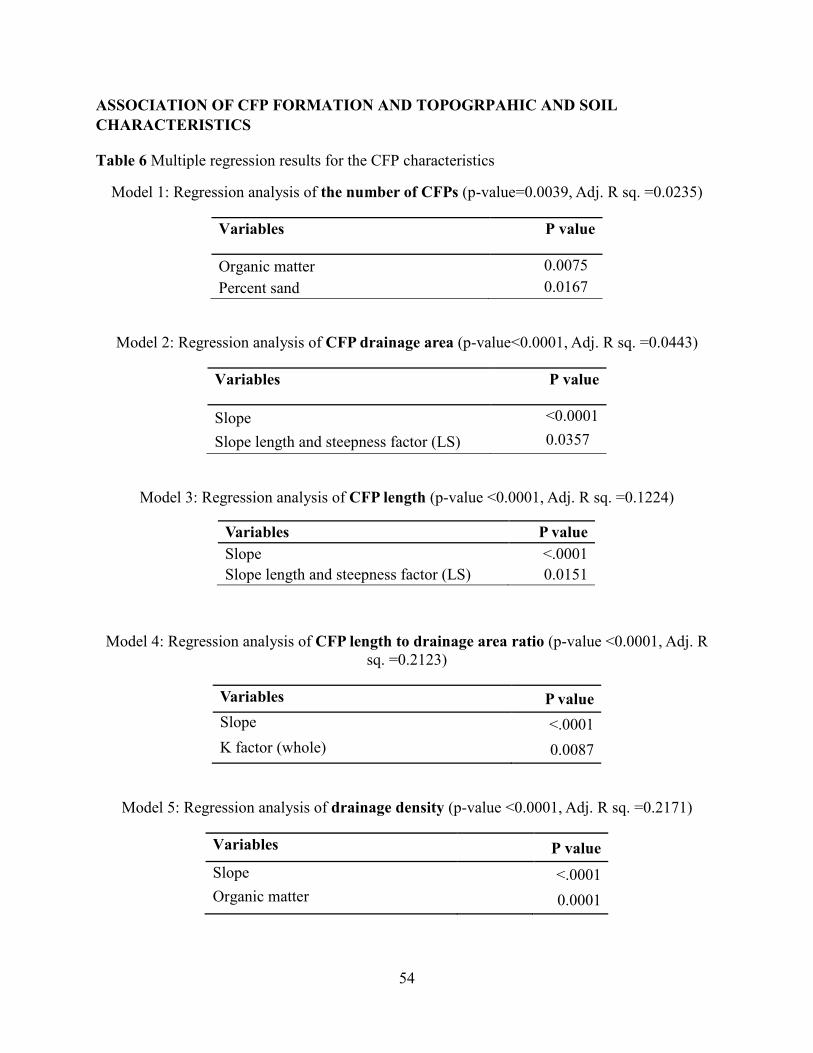
54
ASSOCIATION OF CFP FORMATION AND TOPOGRPAHIC AND SOIL
CHARACTERISTICS
Table 6 Multiple regression results for the CFP characteristics
Model 1: Regression analysis of the number of CFPs (p-value=0.0039, Adj. R sq. =0.0235)
Variables P value
Organic matter 0.0075
Percent sand 0.0167
Model 2: Regression analysis of CFP drainage area (p-value<0.0001, Adj. R sq. =0.0443)
Variables P value
Slope <0.0001
Slope length and steepness factor (LS) 0.0357
Model 3: Regression analysis of CFP length (p-value <0.0001, Adj. R sq. =0.1224)
Model 4: Regression analysis of CFP length to drainage area ratio (p-value <0.0001, Adj. R sq. =0.2123)
Variables P value
Slope <.0001
K factor (whole) 0.0087
Model 5: Regression analysis of drainage density (p-value <0.0001, Adj. R sq. =0.2171)
Variables P value
Slope <.0001
Organic matter 0.0001
Variables P value
Slope <.0001
Slope length and steepness factor (LS) 0.0151
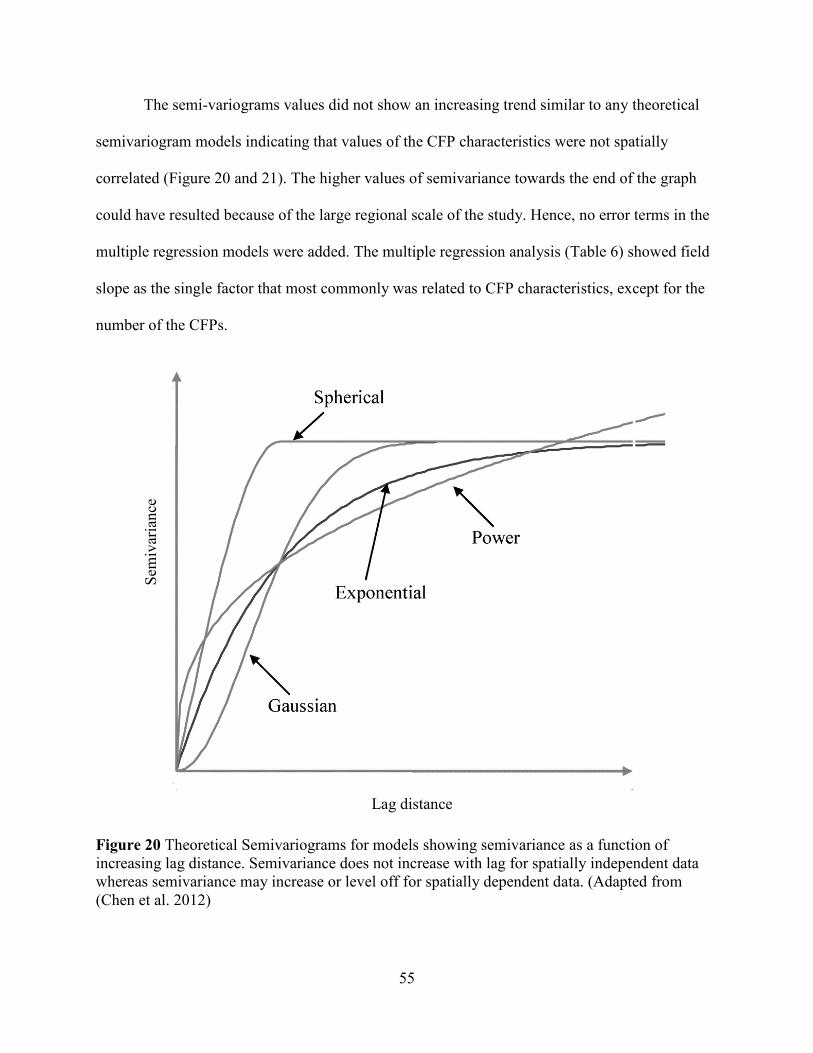
55
The semi-variograms values did not show an increasing trend similar to any theoretical
semivariogram models indicating that values of the CFP characteristics were not spatially
correlated (Figure 20 and 21). The higher values of semivariance towards the end of the graph
could have resulted because of the large regional scale of the study. Hence, no error terms in the
multiple regression models were added. The multiple regression analysis (Table 6) showed field
slope as the single factor that most commonly was related to CFP characteristics, except for the
number of the CFPs.
Figure 20 Theoretical Semivariograms for models showing semivariance as a function of increasing lag distance. Semivariance does not increase with lag for spatially independent data whereas semivariance may increase or level off for spatially dependent data. (Adapted from (Chen et al. 2012)
Sem
ivar
ian
ce
Lag distance
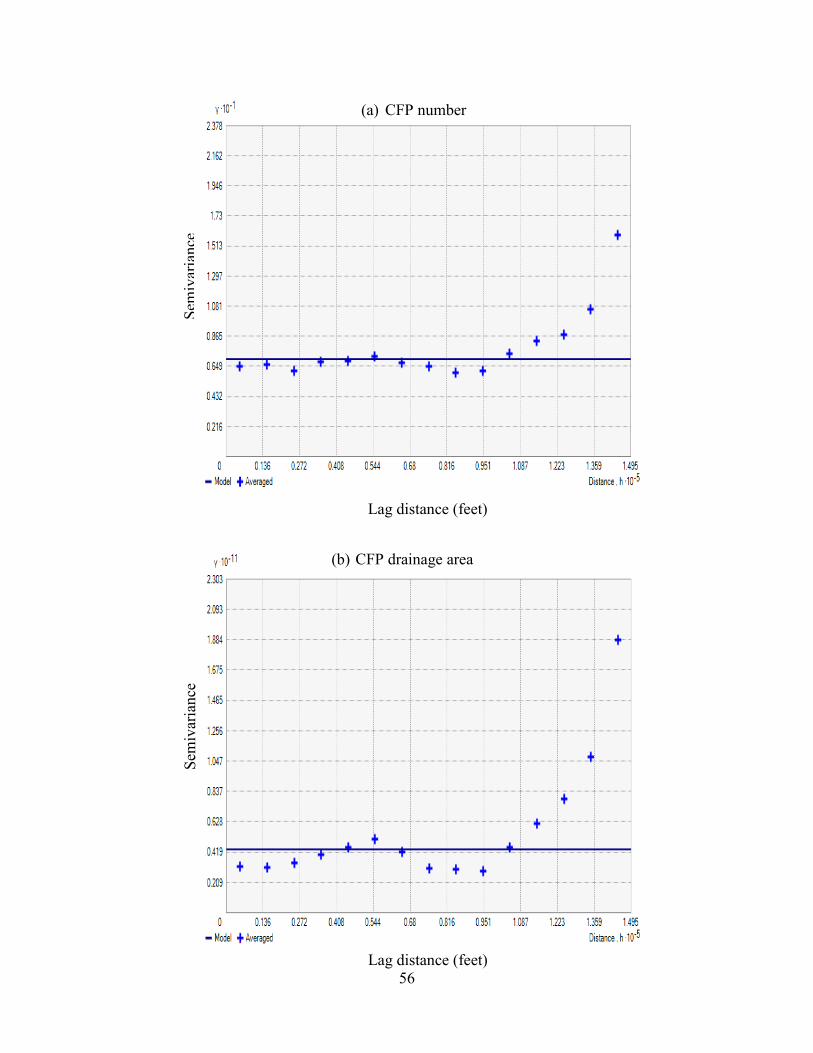
56
Sem
ivar
iance
Lag distance (feet)
(a) CFP number
Sem
ivar
iance
Lag distance (feet)
(b) CFP drainage area

57
Sem
ivar
iance
Lag distance (feet)
(c) Drainage density
Sem
ivar
ianc
e
Lag distance (feet)
(d) CFP length
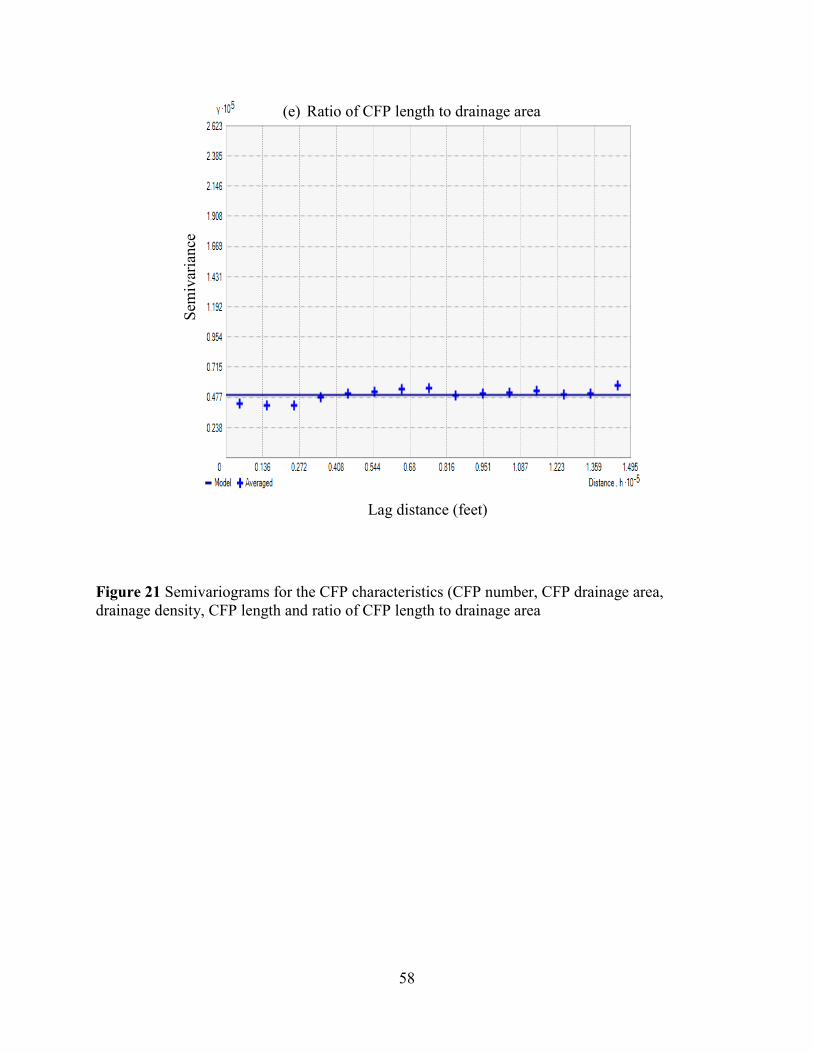
58
Figure 21 Semivariograms for the CFP characteristics (CFP number, CFP drainage area, drainage density, CFP length and ratio of CFP length to drainage area
Sem
ivar
iance
Lag distance (feet)
(e) Ratio of CFP length to drainage area
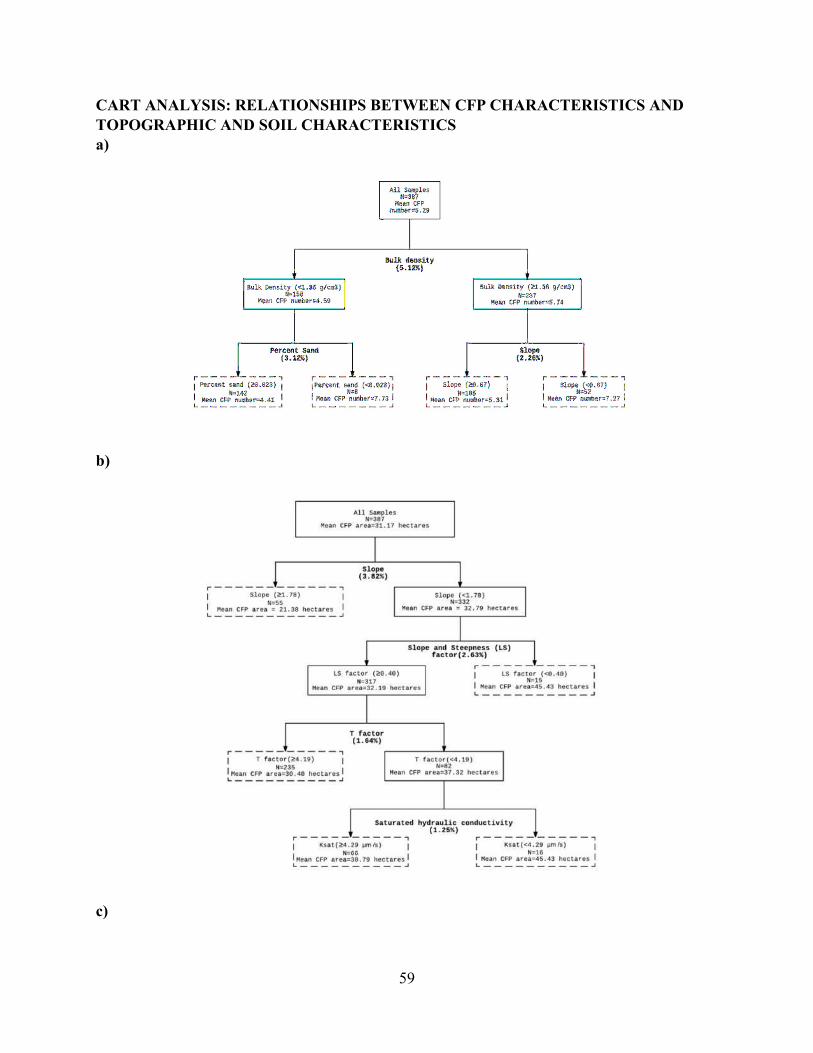
59
CART ANALYSIS: RELATIONSHIPS BETWEEN CFP CHARACTERISTICS AND
TOPOGRAPHIC AND SOIL CHARACTERISTICS
a)
b)
c)
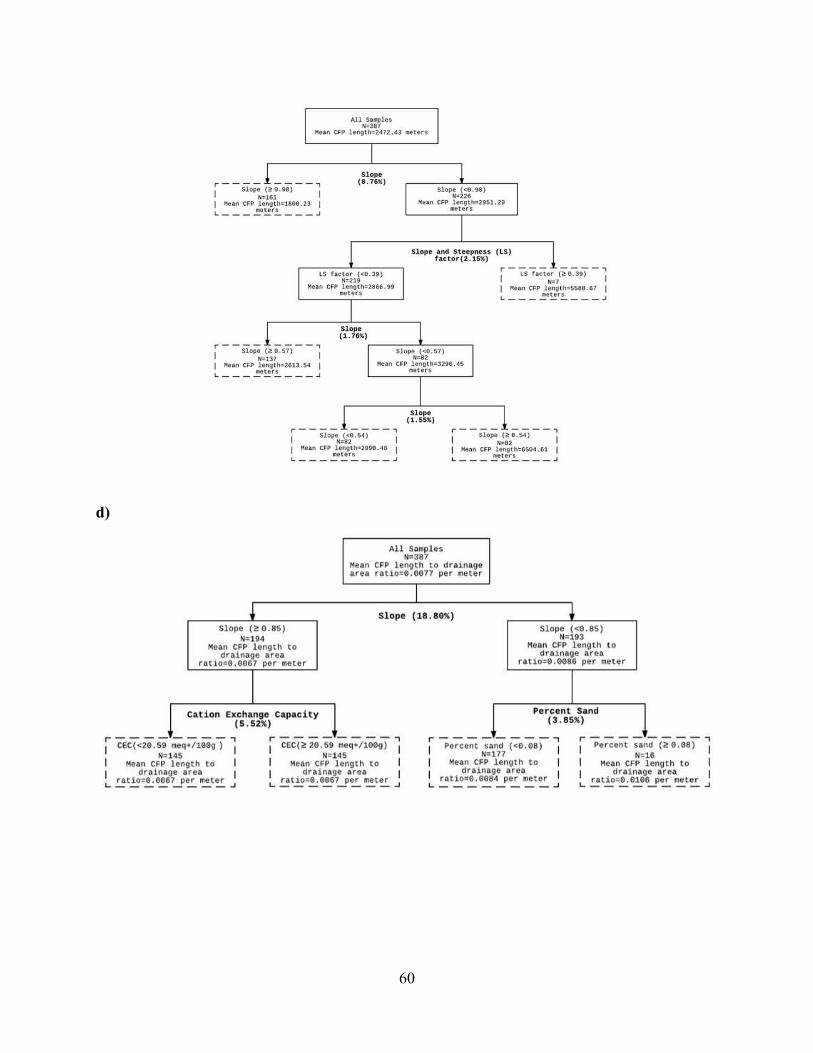
60
d)
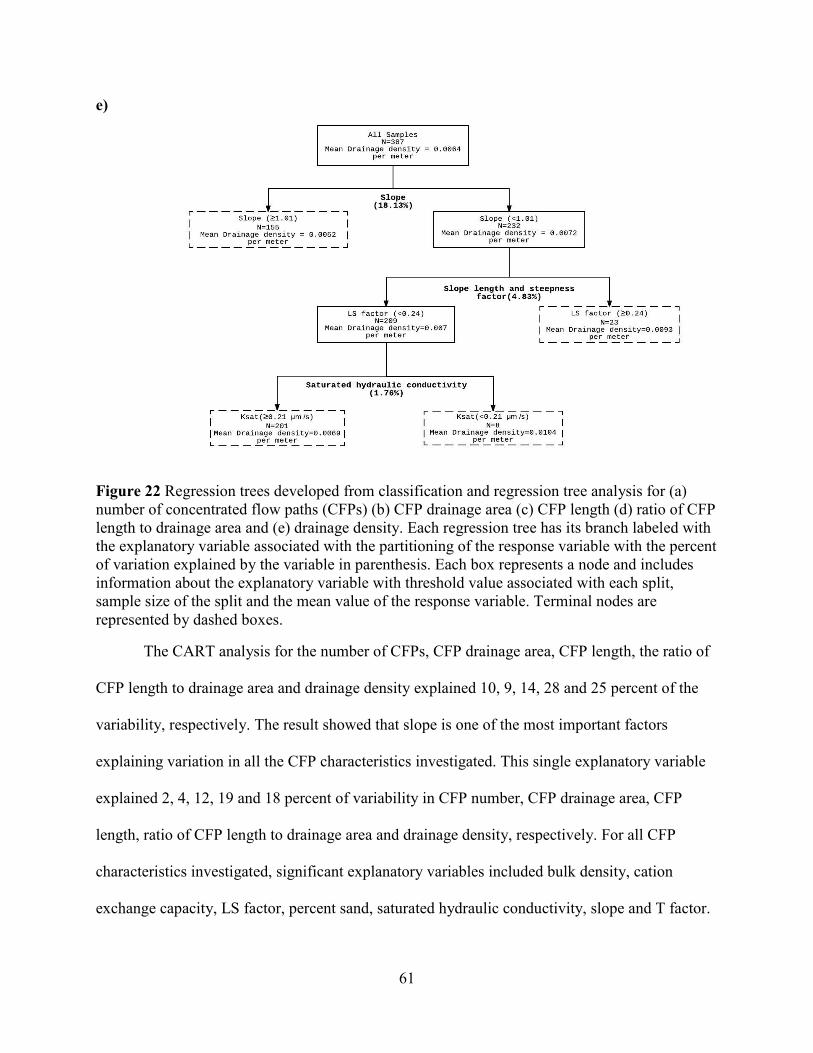
61
e)
Figure 22 Regression trees developed from classification and regression tree analysis for (a) number of concentrated flow paths (CFPs) (b) CFP drainage area (c) CFP length (d) ratio of CFP length to drainage area and (e) drainage density. Each regression tree has its branch labeled with the explanatory variable associated with the partitioning of the response variable with the percent of variation explained by the variable in parenthesis. Each box represents a node and includes information about the explanatory variable with threshold value associated with each split, sample size of the split and the mean value of the response variable. Terminal nodes are represented by dashed boxes.
The CART analysis for the number of CFPs, CFP drainage area, CFP length, the ratio of
CFP length to drainage area and drainage density explained 10, 9, 14, 28 and 25 percent of the
variability, respectively. The result showed that slope is one of the most important factors
explaining variation in all the CFP characteristics investigated. This single explanatory variable
explained 2, 4, 12, 19 and 18 percent of variability in CFP number, CFP drainage area, CFP
length, ratio of CFP length to drainage area and drainage density, respectively. For all CFP
characteristics investigated, significant explanatory variables included bulk density, cation
exchange capacity, LS factor, percent sand, saturated hydraulic conductivity, slope and T factor.
62
For the number of CFPs (Figure 22a), bulk density accounted for 5.1 percent of the
variation out of 10 percent. The mean number of CFPs was 5 for fields with bulk densities <1.36
g cm-3, which is similar to the overall average number of CFPs in the study area. The number of
CFPs (6) was slightly higher in fields with bulk densities ≥ 1.36 g cm-3. For fields with bulk
densities <1.36 g cm-3, percent sand accounted for 3.12 percent of the variation in the CFP
number. Fields with percent sand <0.023 had higher mean CFP number higher (8) compared to
the fields with percent sand ≥ 0.023 (mean CFP number = 4). For fields with bulk density ≥1.36
g cm-3, slope accounted for 2.26 percent of the variation, and mean number of CFP (5) in fields
with slope ≥0.67 being lower than the mean number of CFP (7) in fields with slope <0.67.
In case of CFP drainage area (Figure 22b), slope accounted for 3.82 percent of the
variation out of 9 percent. The mean CFP drainage area (32.79 hectares) was observed to be
comparatively higher in fields with slope <1.78 than in fields with slope ≥1.78 (mean CFP
drainage area =21.38 hectares). No further partitioning occurred for the fields with slope ≥1.78.
However, for fields with slope <1.78, LS factor further accounted for 2.63 percent of the
variation in CFP drainage area. The drainage area was comparatively higher in fields with LS
factor <0.40 (mean CFP drainage area=45.43 hectares) than in fields with LS factor ≥0.40 (mean
CFP drainage area=32.19 hectares). Further partitioning of the LS factor node indicated
additional ability to explain variation in CFP drainage area by T factor explaining 1.64 percent of
the variation. The mean CFP drainage area (37.32 hectares) was higher in fields with T factor
<4.19 compared to fields with T factor ≥4.19 (mean CFP drainage area= 30.40 hectares).
Additional variation (1.25 percent) associated with T factor (<4.19) was explained by Ksat.
Fields with Ksat<4.29 µm/s had larger mean CFP drainage area (45.43 hectares) compared to
fields with Ksat≥4.29 µm/s.
63
For CFP length, slope and LS factor were the two explanatory variables explaining 14
percent of the variation (Figure 22c). The first partition under slope node explained 8.76 percent
of the variation in mean CFP length. Fields with slope<0.98 had longer CFP length (2951.29
meters) compared to the fields with slope≥0.98 (mean CFP length=1800.23 meters). No further
partitioning occurred for the fields with slope ≥0.98. For fields with slope<0.98, LS factor
accounted for 2.15 percent of the variation. The mean CFP length (5588.67 meters) was
significantly higher in fields with LS factor ≥0.39 compared to fields with LS factor <0.39 (mean
CFP length=2866.99 meters). Further partitioning indicated slope explained 1.76 percent of the
variation in CFP length, and the mean CFP length (3290.45 meters) was comparatively higher in
fields with slope <0.57 than in fields with slope ≥0.57 (mean CFP length=2613.54 meters). No
further partitioning occurred for the fields with slope ≥0.57, but further partitioning of the slope
node <0.57 indicated slope additionally accounted for 1.55 percent of the variation. Fields with
slope ≥0.54 had longer CFP length (6504.61 meters) compared to the fields with slope <0.54
(mean CFP length =2990.46 meters).
Slope, CEC and percent sand were the explanatory variables explaining 28 percent
variation in the ratio of CFP length to drainage area ratio (Figure 22d). The slope node in the first
partition accounted for 18.80 percent of the variation, and the ratio in fields with slope <0.85
(0.0086 per meter) was higher compared to the fields with slope ≥0.85. For slope ≥0.85, second
partition under CEC node accounted for 5.52 percent of the variation. The fields with CEC ≥
20.59 meq+/100g had higher ratio (0.0079 per meter) compared to the fields with CEC<20.59
(ratio of length to drainage area=0.0063). Further slope <0.85, second partition under percent
sand accounted for 3.85 percent of the variation, and fields with percent sand ≥ 0.08 had higher

64
mean ratio (0.106 per meter) compared to the fields with percent sand >0.08 (mean ratio of CFP
length to drainage area = 0.0084 per meter).
For drainage density, slope, LS factor and Ksat were the explanatory variables explaining
25 percent variation. First partition under slope node explained 18.13 percent of the variation
(Figure 22e). Fields with slope <1.01 had higher mean drainage density (0.0052 per meter)
compared to the fields with slope ≥1.01 (mean drainage density=0.0052 per meter). No further
partitioning occurred for the fields with slope ≥1.01. Further partitioning of the slope node<1.01
indicated LS factor accounted for 4.83 percent of the variation, and fields with LS factor ≥0.24
had higher mean drainage density (0.0093 per meter) compared the fields with LS factor<0.24.
Third partitioning under the LS factor node <0.24 indicated Ksat accounted for 1.76 percent of
the variation. Fields with Ksat <0.21µm/s had higher mean drainage density (0.0104 per meter)
compared to the fields with Ksat ≥0.21µm/s (mean drainage density=0.0069 per meter).
DISCUSSION
The mapping of CFPs indicated CFPs are prevalent in agricultural watersheds in Jackson
county, southern Illinois. Except for two fields, an average of 5 CFPs were observed in the
investigated agricultural watersheds, with a maximum of 17 CFPs. Few studies have been
conducted on soil erosion at larger geographical extents, so more research should be conducted
using LiDAR data to identify the extent of CFP distribution in agricultural watersheds (Hancock
et al. 2015). There has been little research quantifying agricultural field area drained by
concentrated flow. Many studies on CFPs in agricultural fields only state visual observation of
presence of concentrate flow, but did not provide estimates of field area being drained by CFPs
(Knight et al. 2010; Daniels et al. 1996; Dillaha et al. 1989). A visual assessment method was
developed by Dosskey et al. (2002) to identify area of field being drained by CFPs, but no

65
methods were devised to quantify the drained area. This study showed an average of 81 percent
of agricultural field area were being drained by CFPs, and 88 percent of the fields had more than
70 percent of their area drained by concentrated flow. Pankau et al. (2012) utilized intensive
topographic surveys to measure agricultural field area being drained by CFPs and observed 82.5
to100 percent of agricultural fields being drained by concentrated flow, indicating large volume
of agricultural runoff were delivered to streams by CFPs. Recently, Hancock et al. (2015) used
geospatial methods utilizing high resolution LiDAR data to identify CFPs through riparian
buffers in the Coastal Plain of Virginia, and identified that 81 percent of field areas were being
drained through 1 percent or less of field margin. Similar to the findings of Pankau et al. (2012)
their results also indicated CFPs through vegetated riparian areas were commonly occurring
along the margin of agricultural fields. Due to lack of data on riparian buffer area on the county
scale, this study did not include vegetated riparian buffers in the spatial analysis, but all the CFPs
identified were located along field margins. Results from this study supports other studies that
have shown CFPs frequently occur in agricultural fields and largely contribute to sediment and
nutrient delivery from the fields to water resources (Sun et al. 2013; Kimaro et al. 2008; Govers
et al. 2007; Li et al. 2006; Owoputi et al. 1995; Bradford et al. 1980; Meyer et al. 1975)
The average percentage of field area drained by CFPs was relatively high (81 percent).
The result highlights the importance of concentrated flow in draining agricultural fields through
smaller portion of field area which accelerates the transport of sediment and nutrient to nearby
water resources. Sediment and nutrient loss directly affects soil health which consequently
affects plant growth and crop yield. Further, delivery of sediment and nutrient to water resources
affects water quality and disrupts aquatic ecosystem. The results from this study corroborates the
findings of previous studies (Hancock et al. 2015; Sun et al. 2013; Pankau et al. 2012; Stevens et
66
al. 2008; Poesen et al. 2003; Dosskey et al. 2002; Zilberman 1998; Auzet et al. 1995; Castro et
al. 1995; Pimentel et al. 1995; Vandaele 1993) demonstrating CFPs are common and drain the
clear majority of the area of agricultural fields and are a major source of agricultural NPS
pollution. Many BMPs have been recommended to address both on-site and off-site impacts of
CFPs such as forest riparian buffers and grass filter strips. Unfortunately, CFPs have been
observed to form through riparian buffers decreasing the sediment trapping and nutrient removal
efficiency of the buffers (Hancock et al. 2015; Pankau et al. 2012; Dosskey et al. 2002). In
general, static width buffers are established in agricultural fields that do not address the dynamic
morphological changes in CFPs over space and time. Empirical and physical models that include
the controlling factors of concentrated flow and account for the temporal variation of the flow in
response to topographical and climatological environments could help in predicting location and
characteristics of CFPs (Poesen et al. 1998). Such prediction could be useful in designing and
planning the location of buffers such as variable width buffer with increased efficiency in
trapping sediments and removing nutrients based on CFP characteristics. Variable width buffers
can minimize the area of field that are taken out of production through traditional buffer areas,
and width of the variable width buffers can be based partially on the size of the farm equipment,
so farming equipment can be easily used in presence of buffers.
Among different soil texture groups, fields with silty clay, fine sandy loam and silty clay
loam texture had higher values of CFP length and drainage area. Soils in silty clay texture class
have fine texture, while soils in silty clay loam have moderately fine and soils in fine sandy loam
have moderately coarse texture. Soils with fine texture can hold large amounts of water, but have
slow infiltration rates and permeability resulting in high runoff generation and erosion risk. Soils
with moderately fine and coarse texture have moderate soil erodibility, infiltration and

67
permeability rate. Among different topographic regions, average values of the CFP
characteristics were higher in the floodplain region. Floodplains usually have unconsolidated
sediments that are accumulations of sand, gravel, loam, silt and clay. The floodplain region has
soils with poor soil horizonation that are usually buried under alluvium. Such alluvial soils are
typically easily erodible that increase the susceptibility to concentrated flow development in the
floodplain region compared to other regions (Ballard et al. 2016).
Among the soil properties and topographical features investigated in the study, the results
from the multiple regression and CART analysis indicated slope as the most important factor
influencing CFP characteristics in the study area, except for the number of CFPs. Slope grade of
an agricultural fields can influence CFP characteristics as runoff velocity increases with an
increase in slope length and angle. Further, increased splash effect on steeper slopes can result in
dislodging of soil particles and initiation of CFP formation. Besides slope, results from the
multiple regression analysis showed K factor, LS factor and organic matter are other factors
affecting CFP characteristics. The soil erodibility factor, K factor, is a measure of the
susceptibility of soil to erosion. Soil properties such as organic matter content, particle size
distribution, permeability, and soil structure are considered in developing K factor value for a
soil. The effect of LS factor is similar to slope’s influence on soil erodibility resulting higher
runoff volume with increasing LS factor.
Organic matter significantly influences soil erodibility by contributing to soil biological
and physical properties. Presence of organic matter such as crop residues and mulches, cover the
soil surface reducing the exposure of soil to raindrop impacts and prevent surface crusting by
raindrop impacts, which reduces the detachment of soil particles. Organic matter also reduces
compaction and enhances formation of soil aggregates that improves soil structure resulting in an

68
increase in soil permeability. Further, large soil aggregates are more difficult to erode than
individual particles. Biological activities associated with organic matter such as bioturbating
activities of earthworms and other macroorganisms can increase soil macroporosity which
increases water infiltration capacity of soil. Increased water holding capacity of soil with
enhanced infiltration rate and permeability, decreases runoff generation, soil erosion and
consequently CFP development.
Since formation of a concentrated flow and its evolution is deemed to be largely affected
by runoff volume (large runoff contributing area) and relief energy (high local slope), previous
studies have widely used relationships between slope and drainage basin area to predict initiation
and pathways of concentrated flow. Some studies have shown weak correlation between slope
and CFP initiation (Vandekerckhove et al. 2000; Desmet et al. 1999; Vandaele et al. 1996;
Moore et al. 1988). Auzet et al. (1993) had also observed that the other factors such as percent
sand, thalweg incisable length, catchment capacity index and proportion of the upslope
contributing area, except slope, also accounted for the variation in CFP volumes. Similarly,
(Vandaele 1993) observed no influence of slope on cultivated lands. However, other studies have
shown strong influence of slope on initiation of concentrated flow (Stone 2014; Desmet et al.
1999). Further, Liu et al. (2001) identified slope as an important factor that affects overland flow
generation and soil erosion, and the erosion-resisting capacity of soil decreased with slope
gradient.
These findings suggest that although slope is the most important factor, other soil
properties and topographic factors that were not included in the study could influence CFP
characteristics. Other slope attributes, such as slope shape such as convex shapes and concave
shapes, and slope orientation that were not included in the study could also provide more insight
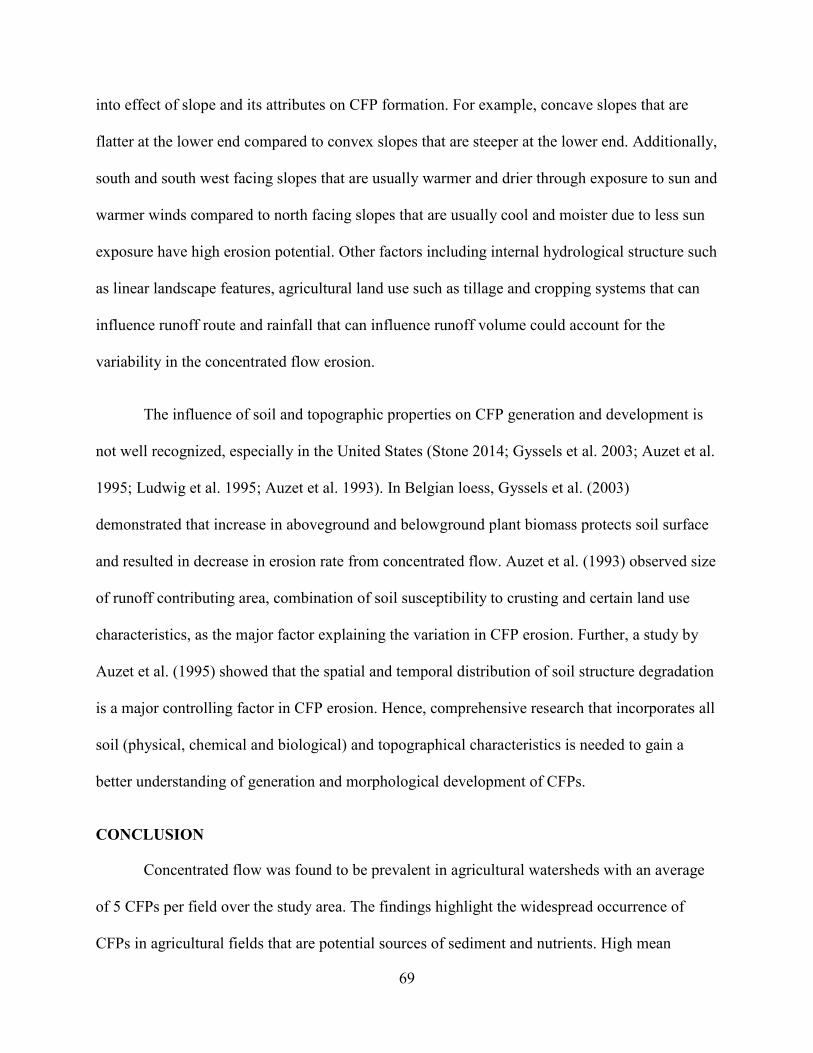
69
into effect of slope and its attributes on CFP formation. For example, concave slopes that are
flatter at the lower end compared to convex slopes that are steeper at the lower end. Additionally,
south and south west facing slopes that are usually warmer and drier through exposure to sun and
warmer winds compared to north facing slopes that are usually cool and moister due to less sun
exposure have high erosion potential. Other factors including internal hydrological structure such
as linear landscape features, agricultural land use such as tillage and cropping systems that can
influence runoff route and rainfall that can influence runoff volume could account for the
variability in the concentrated flow erosion.
The influence of soil and topographic properties on CFP generation and development is
not well recognized, especially in the United States (Stone 2014; Gyssels et al. 2003; Auzet et al.
1995; Ludwig et al. 1995; Auzet et al. 1993). In Belgian loess, Gyssels et al. (2003)
demonstrated that increase in aboveground and belowground plant biomass protects soil surface
and resulted in decrease in erosion rate from concentrated flow. Auzet et al. (1993) observed size
of runoff contributing area, combination of soil susceptibility to crusting and certain land use
characteristics, as the major factor explaining the variation in CFP erosion. Further, a study by
Auzet et al. (1995) showed that the spatial and temporal distribution of soil structure degradation
is a major controlling factor in CFP erosion. Hence, comprehensive research that incorporates all
soil (physical, chemical and biological) and topographical characteristics is needed to gain a
better understanding of generation and morphological development of CFPs.
CONCLUSION
Concentrated flow was found to be prevalent in agricultural watersheds with an average
of 5 CFPs per field over the study area. The findings highlight the widespread occurrence of
CFPs in agricultural fields that are potential sources of sediment and nutrients. High mean

70
percent of field drainage by CFPs, 81 percent, with a minimum of 35 percent and maximum of
100 percent was observed. Additionally, 85 percent of the field had more than 70 percent of their
field area drained by CFPs. Since CFPs act as both source and transport mechanism of sediment
and nutrient in agricultural runoff, such high percentage of drainage through CFPs is detrimental
to both soil health and water quality in the region.
CFPs identified using the geospatial method in this study was reasonable indicating the
possibility of using high resolution data such as Lidar in hydrologic modeling to gain better
understanding of CFP formation and development at a large geographical scale. Since CFPs are
temporally dynamic, availability of such data over time could also enable investigating
morphological development of CFPs. Ability to conduct such research at a larger scale could
provide better insight into the generation and development of CFPs regionally, and the
information can be used by the land managers and conservation agencies to design and modify
BMPs accordingly.
Based on the multiple regression and CART analysis results, slope was identified as one
of the most important factors affecting the CFP morphology. Other factors such as organic
matter, percent sand, K factor were also found to influence the investigated CFP characteristics,
explaining only 2 to 22 percent of the variation observed. Most statistical relationships
established in this study can be supported by physical interpretation, so this study can serve as a
foundational study for future studies on importance of CFPs at a regional scale. The study
recommends a comprehensive study that includes all soil (physical, chemical and biological),
topographical properties and farming practices in other regional areas to investigate major factors
influencing CFP formation in different environmental conditions. Understanding temporal
variation in CFP formation and factors influencing CFP characteristics might enhance the

71
empirical and physical models that can predict CFP initiation and development. Hence, future
research is needed to investigate other climatological, topographical and environmental factors
that could explain the residual variation in the occurrence of CFPs. Future research in
understanding the factors association with CFP formation and development could provide insight
into developing management practices that minimize the on-site and off-site impacts of CFP
erosion.

72
CHAPTER 4: SYNTHESIS
SUMMARY
Concentrated flow erosion has been identified as an important soil erosion mechanism in
agricultural fields contributing to sediment and nutrient transport and delivery to nearby water
resources. This study examined the prevalence of CFPs at county scale, assessed the percent of
field area drained by CFPs and investigated different topographical and soil properties that could
affect CFP formation and development. On average, 5 CFPs were observed in the study area
with a minimum of 0 (only 2 fields) and a maximum of 17 CFPs. CFPs were found to
significantly contribute in field drainage with an average of 81 percent of field area drained by
CFPs, with a minimum of 35 percent and maximum of 100 percent.
The multiple regression and CART analysis indicated slope as one of the main important
factor that influence CFP length and drainage area. Additionally, factors such as organic matter,
K factor, percent sand and LS factor were also observed to contribute to the variation in CFP
characteristics, but contributing to only 2 to 22 percent of the variation. Regional variation in
CFP characteristics with higher values in the floodplain region and lower values in the rough
hills region suggesting environmental factors along with other topographical and climatological
factors that were not included in the study could play role in varying concentrated flow erosion.

73
LIMITATIONS
The study used LiDAR data and orthoimagery to identify CFPs at a regional scale. The
LiDAR data have been a very useful tool for exploring areas where ground measurements are not
available or the scale of measurement is deemed impractical. Although the remotely sensed data
enabled accurate watershed delineation and mapping of CFPs at a large geographical extent and
provided a foundation to develop an understanding of the prevalence CFPs in agricultural
watersheds, there are some limitations in such geospatial methods of study. One of the major
limitations of utilizing remotely sensed data is the uncertainties with the data. The source of
uncertainties varies from measurement of data to prediction. Since the sensor to collect the data,
data resolution, sensor calibration and platform for data selection are chosen by human beings,
human error could be introduced. Further, remote sensing instruments can often go out of
calibration which can result in uncalibrated remotely sensed data. Assessment of uncertainties
and error in remote sensing data is important for effective use of the information.
In general, field scale data are collected along with remote sensing data for ground
truthing and better understanding of the area of study, but this study only utilized remote sensing
data due to time constraints. Remotely sensed data can provide repetitive coverage that enables
monitoring of agriculture but only through intervals of time. There may also be issues with data
sets that do not match in time. For instance, the study utilized field polygons hand digitized in
2006 and verified with orthoimagery from 2011. Further, CFPs are ephemeral in nature, and
CFPs that are tilled under or filled during data collection may not be detected by such geospatial
studies.
The statistical relationships established in this study cannot be considered as general or
predictive. Results highlight the need of further research to understand and identify the major
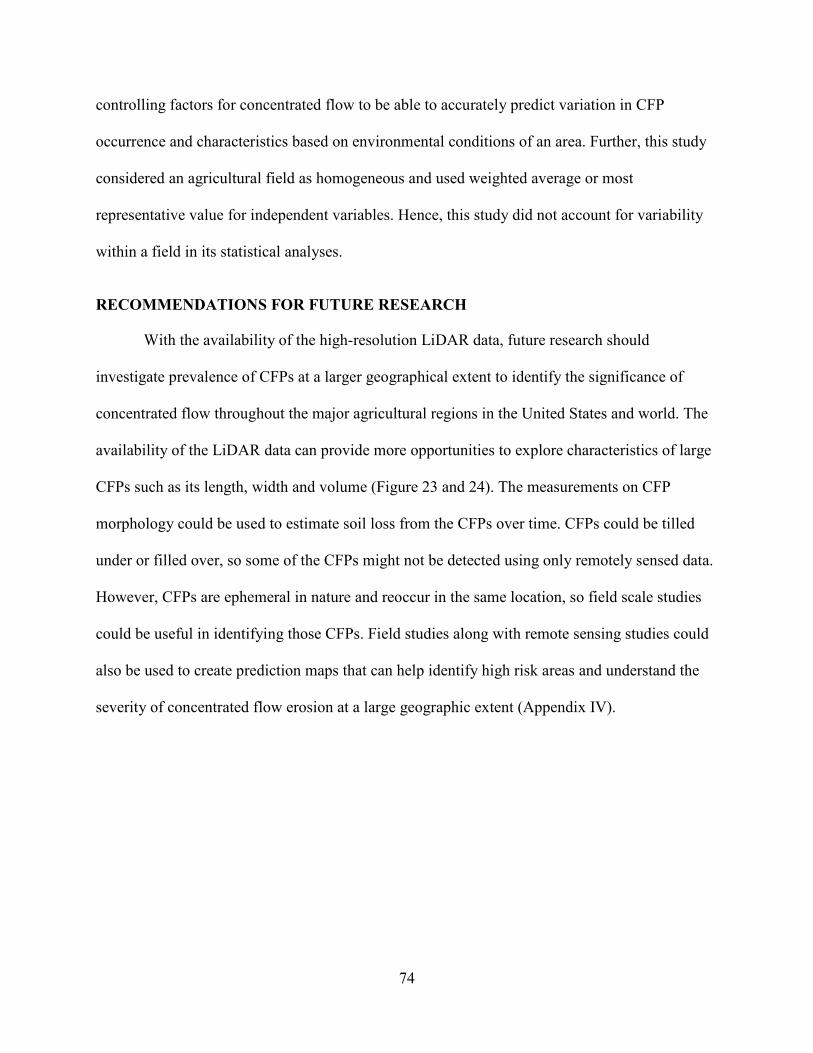
74
controlling factors for concentrated flow to be able to accurately predict variation in CFP
occurrence and characteristics based on environmental conditions of an area. Further, this study
considered an agricultural field as homogeneous and used weighted average or most
representative value for independent variables. Hence, this study did not account for variability
within a field in its statistical analyses.
RECOMMENDATIONS FOR FUTURE RESEARCH
With the availability of the high-resolution LiDAR data, future research should
investigate prevalence of CFPs at a larger geographical extent to identify the significance of
concentrated flow throughout the major agricultural regions in the United States and world. The
availability of the LiDAR data can provide more opportunities to explore characteristics of large
CFPs such as its length, width and volume (Figure 23 and 24). The measurements on CFP
morphology could be used to estimate soil loss from the CFPs over time. CFPs could be tilled
under or filled over, so some of the CFPs might not be detected using only remotely sensed data.
However, CFPs are ephemeral in nature and reoccur in the same location, so field scale studies
could be useful in identifying those CFPs. Field studies along with remote sensing studies could
also be used to create prediction maps that can help identify high risk areas and understand the
severity of concentrated flow erosion at a large geographic extent (Appendix IV).
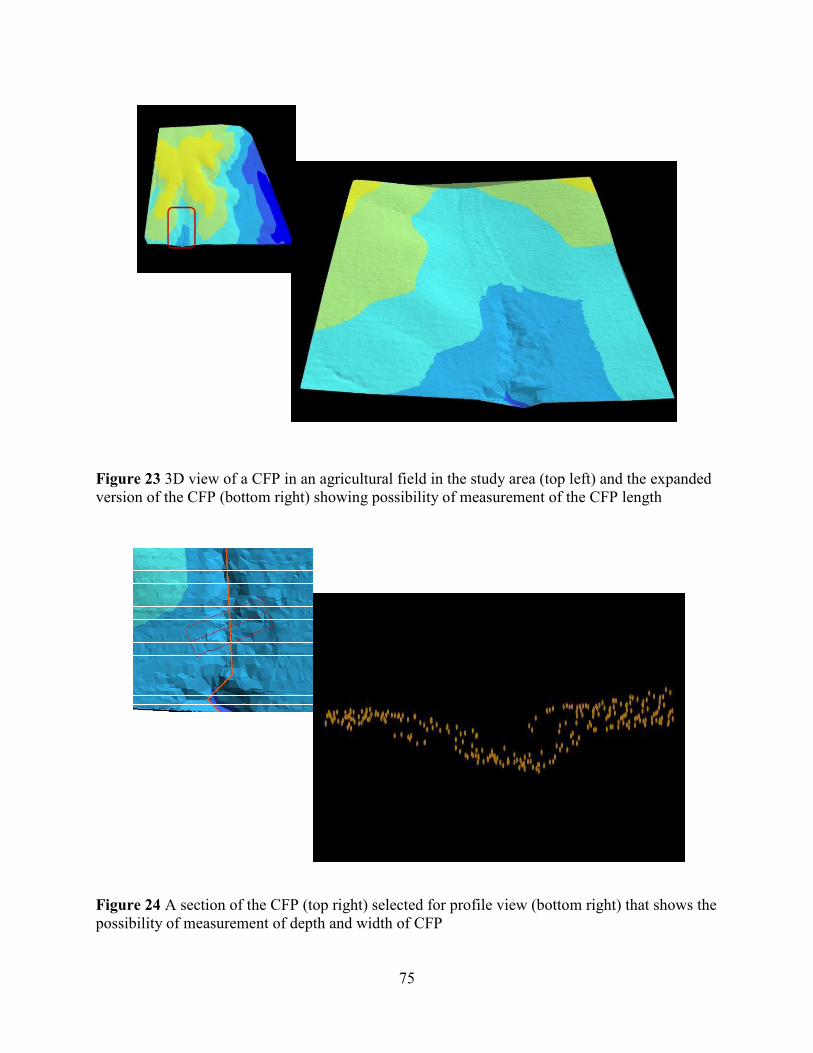
75
Figure 23 3D view of a CFP in an agricultural field in the study area (top left) and the expanded version of the CFP (bottom right) showing possibility of measurement of the CFP length
Figure 24 A section of the CFP (top right) selected for profile view (bottom right) that shows the possibility of measurement of depth and width of CFP
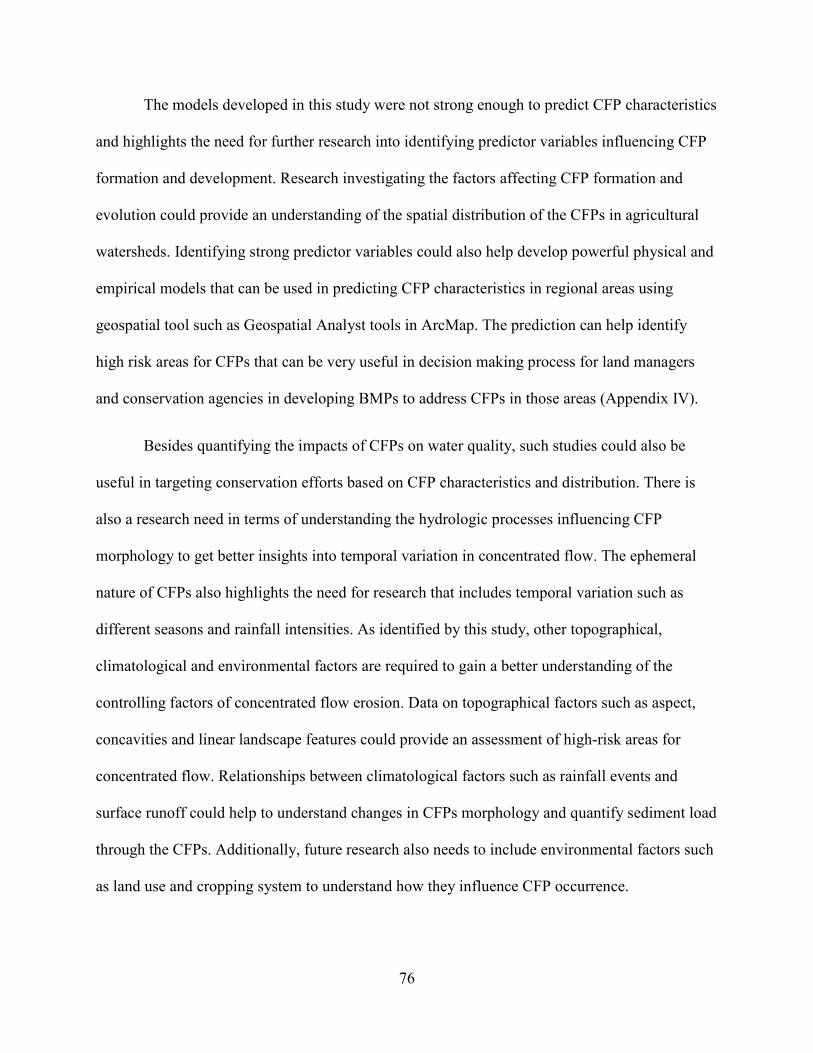
76
The models developed in this study were not strong enough to predict CFP characteristics
and highlights the need for further research into identifying predictor variables influencing CFP
formation and development. Research investigating the factors affecting CFP formation and
evolution could provide an understanding of the spatial distribution of the CFPs in agricultural
watersheds. Identifying strong predictor variables could also help develop powerful physical and
empirical models that can be used in predicting CFP characteristics in regional areas using
geospatial tool such as Geospatial Analyst tools in ArcMap. The prediction can help identify
high risk areas for CFPs that can be very useful in decision making process for land managers
and conservation agencies in developing BMPs to address CFPs in those areas (Appendix IV).
Besides quantifying the impacts of CFPs on water quality, such studies could also be
useful in targeting conservation efforts based on CFP characteristics and distribution. There is
also a research need in terms of understanding the hydrologic processes influencing CFP
morphology to get better insights into temporal variation in concentrated flow. The ephemeral
nature of CFPs also highlights the need for research that includes temporal variation such as
different seasons and rainfall intensities. As identified by this study, other topographical,
climatological and environmental factors are required to gain a better understanding of the
controlling factors of concentrated flow erosion. Data on topographical factors such as aspect,
concavities and linear landscape features could provide an assessment of high-risk areas for
concentrated flow. Relationships between climatological factors such as rainfall events and
surface runoff could help to understand changes in CFPs morphology and quantify sediment load
through the CFPs. Additionally, future research also needs to include environmental factors such
as land use and cropping system to understand how they influence CFP occurrence.

77
MANAGEMENT IMPLICATIONS
Results from the study indicate CFPs are prevalent in agricultural watersheds and
significantly contribute to field drainage. Common conservation practices targeting to minimize
the effects of CFPs are static width riparian buffers and grass filter strips. Mapping of
concentrated flow can be useful in planning location of vegetative filter strips. Information on
factors influencing CFP formation and development could also provide insight into high risk
areas of concentrated flow and design management practices tailored to the areas based on their
environmental conditions. However, studies have shown CFPs can form through vegetated
buffers that can decrease the sediment trapping and nutrient removal efficiency of riparian
buffers (Hancock et al. 2015; Pankau et al. 2012; Dosskey et al. 2002). In general, static width
vegetative strips are used and work effectively where runoff is distributed uniformly (Figure 25).
However, in case of non-uniform flow or divergent or convergent flow generated in response to
topography or concentrated flow, the effective area of a riparian buffer zone decreases which
decreases its efficiency in trapping the sediments and nutrients from the agricultural runoff
(Dosskey et al. 2002).

78
Figure 25 Schematic diagram showing the relationship between field runoff area, total riparian buffer area and effective area of riparian buffer area (Dosskey et al. (2002).
Further, fixed width buffers may not address the dynamic morphological development of
the CFPs over space and time, but variable width buffers can respond to CFP characteristics by
expanding and contracting to the spatial distribution of CFPs (Figure 26). Hence, understanding
the formation process and factors associated with CFP formation and development and runoff
loads could help in designing buffers based on the runoff and CFP characteristics (Bentrup
2008). In comparison to the traditional static width buffers, variable width buffers can minimize
the area of field that are taken out of production by the buffer area. Further, the width of the
buffer can be designed based on general farm equipment, so the equipment can be easily used in
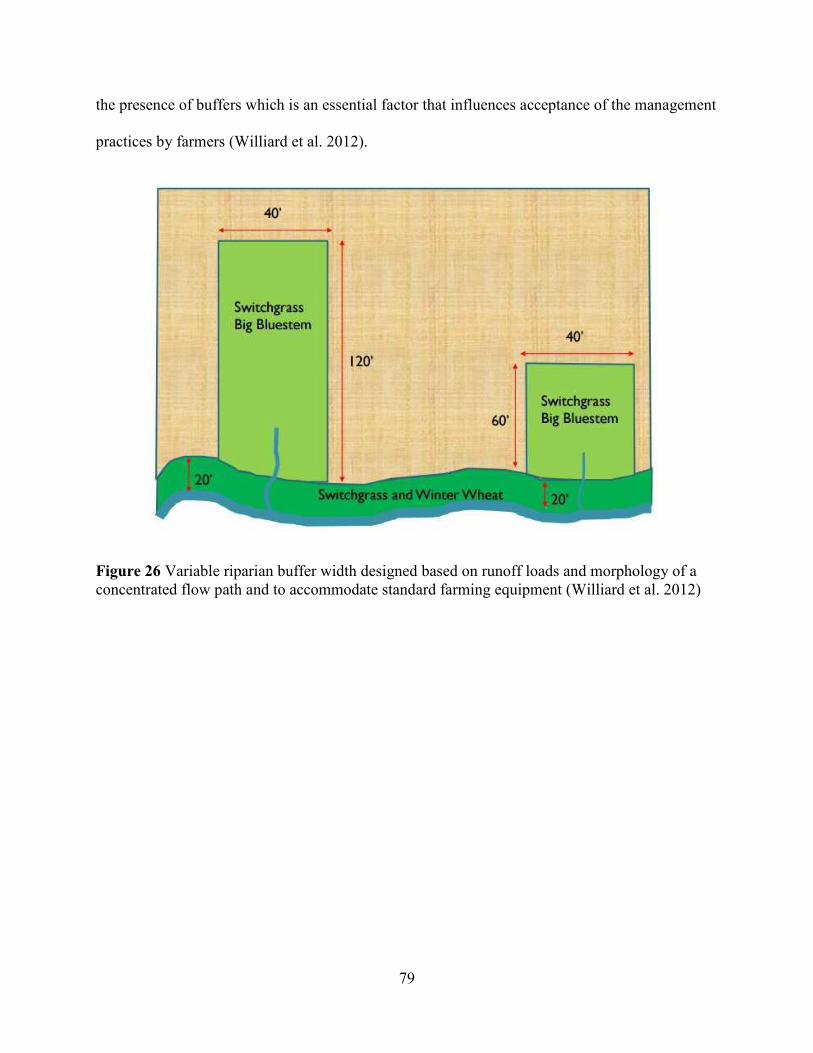
79
the presence of buffers which is an essential factor that influences acceptance of the management
practices by farmers (Williard et al. 2012).
Figure 26 Variable riparian buffer width designed based on runoff loads and morphology of a concentrated flow path and to accommodate standard farming equipment (Williard et al. 2012)
80
LITERATURE CITED
Abrahams, A.D., G. Li, and A.J. Parsons. 1996. Rill hydraulics on a semiarid hillslope, southern Arizona. Earth Surface Processes and Landforms 21(1):35-47.
Alberts, E.E., W.C. Moldenhauer, and G. Foster. 1980. Soil aggregates and primary particles transported in rill and interrill flow. Soil Science Society of America Journal 44(3):590-595.
Anbumozhi, V., J. Radhakrishnan, and E. Yamaji. 2005. Impact of riparian buffer zones on water quality and associated management considerations. Ecological Engineering 24(5):517-523.
Auzet, A., J. Boiffin, and B. Ludwig. 1995. Concentrated flow erosion in cultivated catchments: influence of soil surface state. Earth Surface Processes and Landforms 20(8):759-767.
Auzet, A., J. Boiffin, F. Papy, B. Ludwig, and J. Maucorps. 1993. Rill erosion as a function of the characteristics of cultivated catchments in the north of France. CATENA 20(1):41-62.
Baker, D.B. 1985. Regional water quality impacts of intensive row-crop agriculture: A Lake Erie Basin case study. Journal of Soil and Water Conservation 40(1):125-132.
Ballard, S., and B. Mahan. 2016. The Lower Mississippi River Bottom Lands Natural Division. Available online at https://www.dnr.illinois.gov/conservation/IWAP/Documents/NaturalDivisions/LowerMississippiRiverBottomlands.pdf; last accessed 21 Sep., 2014.
Bazzoffi, P. 2015. Measurement of rill erosion through a new UAV-GIS methodology. Ital J
Agron 10.
Bedison, J.E., and A.H. Johnson. 2009. Controls on the spatial patterns of carbon and nitrogen in Adirondack forest soils along a gradient of nitrogen deposition. Soil Science Society of
America Journal 73(6):2105-2117.
Bentrup, G. 2008. Conservation buffers: design guidelines for buffers, corridors, and greenways. Gen Tech Rep 110 p.
Bizuwerk, A., G. Taddese, and Y. Getahun. 2008. Application of GIS for Modeling Soil Loss Rate in Awash Basin, Ethiopia. International Livestock Research Institute (ILRI).
Blanco, H., C. Gantzer, S. Anderson, E. Alberts, and A. Thompson. 2004. Grass barrier and vegetative filter strip effectiveness in reducing runoff, sediment, nitrogen, and phosphorus loss. Soil Science Society of America Journal 68(5):1670-1678.
Blanco, H., and R. Lal. 2008. Principles of soil conservation and management. Springer Science & Business Media, Berlin.
Bradford, J., and R. Piest. 1980. Erosional development of valley-bottom gullies in the upper midwestern United States. Thresholds in geomorphology:75-101.
Breiman, L., J. Friedman, C.J. Stone, and R.A. Olshen. 1984. Classification and regression trees. CRC press.

81
Bryan, R., and J. Poesen. 1989. Laboratory experiments on the influence of slope length on runoff, percolation and rill development. Earth Surface Processes and Landforms 14(3):211-231.
Carpenter, S.R., N.F. Caraco, D.L. Correll, R.W. Howarth, A.N. Sharpley, and V.H. Smith. 1998. Nonpoint pollution of surface waters with phosphorus and nitrogen. Ecological
applications 8(3):559-568.
Castro, J., and F.F. Reckendorf. 1995. Effects of sediment on the aquatic environment: potential
NRCS actions to improve aquatic habitat. US Department of Agriculture, Soil Conservation Service, Washington D.C., USA.
Chen, Y.-C., H.-C. Yeh, and C. Wei. 2012. Estimation of river pollution index in a tidal stream using kriging analysis. International journal of environmental research and public health 9(9):3085-3100.
Cleveland, D.A., and D. Soleri. 1991. Food from dryland gardens: an ecological, nutritional and
social approach to small-scale household food production. Center for People, Food and Environment, Tucson, Arizona, USA.
Cochrane, T.A. 1995. Detachment and deposition in a simulated rill (Master's Thesis), Purdue University, West Lafayette, Indiana, USA.
Costigan, K. Initiation and evolution of concentrated flow induced erosion. in Proceedings of the
2nd Joint Federal Interagency Conference on Sedimentation and Hydrologic Modeling.
D'Arcy, B., and A. Frost. 2001. The role of best management practices in alleviating water quality problems associated with diffuse pollution. Science of the Total Environment 265(1):359-367.
Daniels, R., and J. Gilliam. 1996. Sediment and chemical load reduction by grass and riparian filters. Soil Science Society of America Journal 60(1):246-251.
De'Ath, G. 2002. Multivariate regression trees: a new technique for modeling species–environment relationships. Ecology 83(4):1105-1117.
Desmet, P., and G. Govers. 1996. Comparison of routing algorithms for digital elevation models and their implications for predicting ephemeral gullies. International Journal of
Geographical Information Science 10(3):311-331.
Desmet, P., J. Poesen, G. Govers, and K. Vandaele. 1999. Importance of slope gradient and contributing area for optimal prediction of the initiation and trajectory of ephemeral gullies. Catena 37(3):377-392.
Dillaha, T., and S. Inamdar. 1996. Buffer Zones as Sediment Traps or Sources. P. 33-42 in In N
E Haycock, T P Burt, K W T Goulding, and G Pinay (Eds), Buffer Zones: Their processes
and potential in water protection. Quest Environmental., Harpenden, Hertfordshire, UK.
Dillaha, T., R. Reneau, S. Mostaghimi, and D. Lee. 1989. Vegetative filter strips for agricultural nonpoint source pollution control. Transactions of the ASAE 32(2):513-0519.
82
Dosskey, M., M. Helmers, D. Eisenhauer, T. Franti, and K. Hoagland. 2002. Assessment of concentrated flow through riparian buffers. Journal of Soil and Water Conservation 57(6):336-343.
Dosskey, M., S. Neelakantan, T. Mueller, T. Kellerman, M. Helmers, and E. Rienzi. 2015. AgBufferBuilder: A geographic information system (GIS) tool for precision design and performance assessment of filter strips. Journal of Soil and Water Conservation 70(4):209-217.
Dosskey, M., Z. Qiu, and Y. Kang. 2013. A comparison of DEM‐based indexes for targeting the placement of vegetative buffers in agricultural watersheds. JAWRA Journal of the
American Water Resources Association 49(6):1270-1283.
EPA, Environmental Protection Agency. 2009. The National water quality inventory:report to
Congress for the 2004 reporting cycle - A profile. Available online at https://www.epa.gov/sites/production/files/2015-09/documents/2009_01_22_305b_2004report_factsheet2004305b.pdf; last accessed 11 May, 2016.
Foster, G. 1986. Understanding ephemeral gully erosion. Soil Conservation 2:90-125.
Foster, G., L. Huggins, and L. Meyer. 1984. A laboratory study of rill hydraulics: I. Velocity relationships. Transactions of the ASAE 27(3):790-796.
Foster, G., and L. Meyer. Soil erosion and sedimentation by water--an overview. in ASAE
Publication No 4-77 Proceedings of the National Symposium on Soil Erosion and
Sediment by Water, Chicago, Illinois, December 12-13, 1977.
Frazier, B.E., and D.K. Mccool. 1981. Aerial-Photography to Detect Rill Erosion. Transactions
of the Asae 24(5):1168-1176.
Funkhouser, L. 2012. Utilizing GIS to study concentrated flow from agricultural fields in the
Virginia Chesapeake Bay watershed. B. S. Thesis, The College of William and Mary, Willamsburg. 90 p.
Giménez, R., and G. Govers. 2001. Interaction between bed roughness and flow hydraulics in eroding rills. Water Resour Res 37(3):791-799.
Giménez, R., and G. Govers. 2002. Flow detachment by concentrated flow on smooth and irregular beds. Soil Science Society of America Journal 66(5):1475-1483.
Govers, G. 1985. Selectivity and transport capacity of thin flows in relation to rill erosion. Catena 12(1):35-49.
Govers, G. 1992. Relationship between discharge, velocity and flow area for rills eroding loose, non‐layered materials. Earth Surface Processes and Landforms 17(5):515-528.
Govers, G., R. Gimenez, and K. Van Oost. 2007. Rill erosion: Exploring the relationship between experiments, modelling and field observations. Earth-Sci Rev 84(3-4):87-102.
Gyssels, G., and J. Poesen. 2003. The importance of plant root characteristics in controlling concentrated flow erosion rates. Earth surface processes and Landforms 28(4):371-384.
83
Hancock, G., S.E. Hamilton, M. Stone, J. Kaste, and J. Lovette. 2015. A Geospatial Methodology to Identify Locations of Concentrated Runoff from Agricultural Fields. JAWRA Journal of the American Water Resources Association 51(6):1613-1625.
Hauge, C. 1977. Soil erosion definitions. CDF.
Heimlich, R.E. 2003. Agricultural resources and environmental indicators, 2003. USDA, Economic Research Service., Washington (DC).
Hutchinson, D., and H. Pritchard. 1976. Resources conservation glossary. Journal of soil and
water conservation 31(4):63-75.
Inamdar, S., S. Mostaghimi, P. McClellan, and K. Brannan. 2001. BMP impacts on sediment and nutrient yields from an agricultural watershed in the coastal plain region. Transactions of
the ASAE 44(5):1191.
ISGS, Illinois State Geological Survery. 2016. Physiographic Divisions of Illinois Available online at http://isgs.illinois.edu/content/physiographic-divisions-illinois, last accessed 19 Aug., 2014.
Jadczyszyn, J., and J. Niedzwiecki. 2005. Relation of saturated hydraulic conductivity to soil losses. Polish Journal of Environmental Studies 14(4):431-435.
Jenson, S.K., and J.O. Domingue. 1988. Extracting topographic structure from digital elevation data for geographic information system analysis. Photogrammetric engineering and
remote sensing 54(11):1593-1600.
Johnson, K.D., F.N. Scatena, A.H. Johnson, and Y. Pan. 2009. Controls on soil organic matter content within a northern hardwood forest. Geoderma 148(3):346-356.
Jones, R. 2002. Algorithms for using a DEM for mapping catchment areas of stream sediment samples. Computers & Geosciences 28(9):1051-1060.
Kabrick, J.M., K.W. Goyne, Z. Fan, and D. Meinert. 2011. Landscape determinants of exchangeable calcium and magnesium in Ozark Highland forest soils. Soil Science
Society of America Journal 75(1):164-180.
Kimaro, D., J. Poesen, B. Msanya, and J.A. Deckers. 2008. Magnitude of soil erosion on the northern slope of the Uluguru Mountains, Tanzania: Interrill and rill erosion. Catena 75(1):38-44.
Knight, K.W., R.C. Schultz, C.M. Mabry, and T.M. Isenhart. 2010. Ability of Remnant Riparian Forests, With and Without Grass Filters, to Buffer Concentrated Surface Runoff1. Wiley Online Library.
Kulmatiski, A., D.J. Vogt, T.G. Siccama, J.P. Tilley, K. Kolesinskas, T.W. Wickwire, and B.C. Larson. 2004. Landscape determinants of soil carbon and nitrogen storage in southern New England. Soil Science Society of America Journal 68(6):2014-2022.
Lam, Q., B. Schmalz, and N. Fohrer. 2011. The impact of agricultural Best Management Practices on water quality in a North German lowland catchment. Environmental
Monitoring and Assessment 183(1-4):351-379.
84
Lee, K., T. Isenhart, and R. Schultz. 2003. Sediment and nutrient removal in an established multi-species riparian buffer. Journal of Soil and Water Conservation 58(1):1-8.
Lee, K., T. Isenhart, R. Schultz, and S. Mickelson. 1998. Nutrient and sediment removal by switchgrass and cool-season grass filter strips in Central Iowa, USA. Agroforestry
Systems 44(2-3):121-132.
Lei, T.W., M.A. Nearing, K. Haghighi, and V.F. Bralts. 1998. Rill erosion and morphological evolution: A simulation model. Water Resour Res 34(11):3157-3168.
Lenat, D.R. 1984. Agriculture and stream water quality: a biological evaluation of erosion control practices. Environmental management 8(4):333-343.
Li, P., Z. Li, and L. Zheng. 2006. Hydrodynamics process of soil erosion and sediment yield by runoff on loess slope. Advances in Water Science 17(4):444.
Liu, Q., L. Chen, and J.L. Li. 2001. Influences of slope gradient on soil erosion. Applied
Mathematics and mechanics 22(5):510-519.
Liu, X., X. Zhang, and M. Zhang. 2008. Major factors influencing the efficacy of vegetated buffers on sediment trapping: A review and analysis. Journal of Environmental Quality 37(5):1667-1674.
Logan, T.J. 1993. Agricultural best management practices for water pollution control: current issues. Agriculture, Ecosystems & Environment 46(1):223-231.
Ludwig, B., J. Boiffin, J. Chad, and A.-V. Auzet. 1995. Hydrological structure and erosion damage caused by concentrated flow in cultivated catchments. Catena 25(1):227-252.
Magette, W.L., R.B. Brinsfield, R.E. Palmer, and J.D. Wood. 1989. Nutrient and sediment removal by vegetated filter strips. Transactions of the ASAE 32(2):663-0667.
Maidment, D.R. 2002. Arc Hydro: GIS for water resources. ESRI, Inc., Redlands, California.
Marks, D., J. Dozier, and J. Frew. 1984. Automated basin delineation from digital elevation data. Geo-processing 2(3):299-311.
Meyer, L., G. Foster, and M. Romkens. 1975. Source of soil eroded by water from upland slopes. Present and prospective technology for predicting sediment yields and sources 177:189.
Miller, T., J. Peterson, C. Lenhart, and Y. Nomura. 2012. Agricultural BMP Inventory. The
Agricultural BMP Handbook for Minnesota:16.
Montgomery, D.R. 2007. Soil erosion and agricultural sustainability. Proceedings of the
National Academy of Sciences 104(33):13268-13272.
Montgomery, D.R., and W.E. Dietrich. 1989. Source areas, drainage density, and channel initiation. Water Resour Res 25(8):1907-1918.
Moore, I., G. Burch, and D. Mackenzie. 1988. Topographic effects on the distribution of surface soil water and the location of ephemeral gullies. Transactions of the ASAE 31(4):1098-1107.

85
Moss, B. 2008. Water pollution by agriculture. Philosophical Transactions of the Royal Society
of London B: Biological Sciences 363(1491):659-666.
Nachtergaele, J., and J. Poesen. 1999. Assessment of soil losses by ephemeral gully erosion using high-altitude (stereo) aerial photographs. Earth Surface Processes and Landforms 24(8):693-706.
Nachtergaele, J., J. Poesen, and G. Govers. 2002. Ephemeral gullies. A spatial and temporal analysis of their characteristics, importance and prediction. Belgeo Revue belge de
géographie(2):159-182.
NASS. National Agricultural Statistics Service 2011. Illinois Farm Report. Available online at https://www.nass.usda.gov/Statistics_by_State/Illinois/Publications/Farmfacts/farmfact.pdf; last accessed 1 May, 2011.
Nearing, M., L. Norton, D. Bulgakov, G. Larionov, L. West, and K. Dontsova. 1997. Hydraulics and erosion in eroding rills. Water Resour Res 33(4):865-876.
Ongley, E.D. 1996. Control of water pollution from agriculture. Food & Agriculture Organization, Rome, Italy.
Osborne, L.L., and D.A. Kovacic. 1993. Riparian vegetated buffer strips in water‐quality restoration and stream management. Freshwater biology 29(2):243-258.
Owoputi, L., and W. Stolte. 1995. Soil detachment in the physically based soil erosion process: a review. Transactions of the ASAE 38(4):1099-1110.
Pankau, R. 2010. Concentrated flow paths in riparian buffer zones of southern illinois (Master's
Thesis), Southern Illinois University Carbondale, Carbondale, Illinois, USA.
Pankau, R., J. Schoonover, K. Williard, and P. Edwards. 2012. Concentrated flow paths in riparian buffer zones of southern Illinois. Agroforestry systems 84(2):191-205.
Park, S., S. Mostaghimi, R. Cooke, and P.W. McClellan. 1994. BMP impacts on watershed runoff, sediment, and nutrient yields. Journal of the American Water Resources
Association 30:1011-1023.
Pimentel, D., C. Harvey, P. Resosudarmo, K. Sinclair, D. Kurz, M. McNair, S. Crist, L. Shpritz, L. Fitton, R. Saffouri, and R. Blair. 1995. Environmental and economic costs of soil erosion and conservation benefits. Science 267(5201):1117-1122.
Poesen, J. Gully typology and gully control measures in the European loess belt. P. 221-239 in Farm Land Erosion in Temperate Plains Environments and Hills Proceedings. Elsevier Science Publishers.
Poesen, J., G. Govers, J. Boardman, I. Foster, and J. Dearing. Gully erosion in the loam belt of Belgium: typology and control measures. P. 513-530 in Soil erosion on agricultural land
Proceedings of a workshop sponsored by the British Geomorphological Research Group,
Coventry, UK, January 1989. John Wiley & Sons Ltd.
Poesen, J., J. Nachtergaele, G. Verstraeten, and C. Valentin. 2003. Gully erosion and environmental change: importance and research needs. Catena 50(2):91-133.
86
Poesen, J., K. Vandaele, and B. van Wesemael. 1998. Gully erosion: importance and model implications. P. 285-311 in Modelling soil erosion by water. Springer.
Romero, C.C., L. Stroosnijder, and G.A. Baigorria. 2007. Interrill and rill erodibility in the northern Andean Highlands. Catena 70(2):105-113.
Schaetzl, R.J., F.J. Krist Jr, and B.A. Miller. 2012. A taxonomically based ordinal estimate of soil productivity for landscape-scale analyses. Soil Science 177(4):288-299.
Schäuble, H., O. Marinoni, and M. Hinderer. 2008. A GIS-based method to calculate flow accumulation by considering dams and their specific operation time. Computers &
Geosciences 34(6):635-646.
Singh, G., K.W. Goyne, and J.M. Kabrick. 2015. Determinants of total and available phosphorus in forested Alfisols and Ultisols of the Ozark Highlands, USA. Geoderma Regional 5:117-126.
Soil Science Society of America. 2016. Glossary of soil science terms Available online at https://www.soils.org/publications/soils-glossary#; last accessed 29 Jan.,2014.
Souchère, V. 1995. Modélisation spatiale du ruissellement à des fins d'aménagement contre
l'érosion de Talweg: Application à des petits bassins versants en Pays de Caux (Haute
Normandie).
Steegen, A., G. Govers, J. Nachtergaele, I. Takken, L. Beuselinck, and J. Poesen. 2000. Sediment export by water from an agricultural catchment in the Loam Belt of central Belgium. Geomorphology 33(1):25-36.
Stevens, C.J., and J.N. Quinton. 2008. Investigating source areas of eroded sediments transported in concentrated overland flow using rare earth element tracers. Catena 74(1):31-36.
Stone, M.H. 2014. An assessment of the frequency and cause of concentrated flow on agricultural fields in the Virginia Coastal Plain portion of the Chesapeake Bay watershed.
Sun, L., H. Fang, D. Qi, J. Li, and Q. Cai. 2013. A review on rill erosion process and its influencing factors. Chinese geographical science 23(4):389-402.
UCAR, University Corporation for Atmospheric Research. 2006. Runoff Processes. Available online at http://www.meted.ucar.edu/hydro/basic/Runoff/print_version/print_index2.htm.
USCB, United States Census Bureau. 2010. State & County QuickFacts. Available online at http:////www.census.gov/quickfacts/; last accessed 12 Feb., 2015.
USDA. United States Department of Agriculture. 1986. Urban hydrology for small watersheds
[Technical Release]. Available online at https://www.nrcs.usda.gov/Internet/FSE_DOCUMENTS/stelprdb1044171.pdf, last accessed 28 May, 2015.
USDA, United States Department of Agriculture. 2005. Soil Survey of Jackson County, Illinois. Available online at http://www.nrcs.usda.gov/Internet/FSE_MANUSCRIPTS/illinois/IL077/0/Jackson_IL.pdf; last accessed on 1 Sep., 2015.

87
USDA. United States Department of Agriculture. 2012. Census of Agriculture (County Profile)-
Jackson County. Available online at https://www.agcensus.usda.gov/Publications/2012/Online_Resources/County_Profiles/Illinois/cp17077.pdf; last accessed on 18 May, 2016.
USDA. United States Department of Agriculture. 2015. Summer Report: 2012 National
Resource Inventory. Available online at http://www.nrcs.usda.gov/Internet/FSE_DOCUMENTS/nrcseprd396218.pdf; last accessed 1 May, 2016.
USDC. United Steats Department of Commerce, Bureau of the Census. 2002. Census of
agriculture. Available online at http://quickfacts.census.gov/qfd/.
Van Donk, S., and E. Skidmore. 2001. Field experiments for evaluating wind erosion models. Annals of arid zone 40(3):281-302.
Vandaele, K. 1993. Assessment of factors affecting ephemeral gully erosion in cultivated catchments of the Belgian Loam Belt. Farm Land Erosion in Temperate Plains
Environment and Hills Elsevier, Amsterdam 125136.
Vandaele, K., J. Poesen, G. Govers, and B. van Wesemael. 1996. Geomorphic threshold conditions for ephemeral gully incision. Geomorphology 16(2):161-173.
Vandekerckhove, L., J. Poesen, D. Oostwoud-Wijdenes, J. Nachtergaele, D. Kosmas, M. Roxo, and T.d. Figueiredo. 2000. Thresholds for gully initiation and sedimentation in Mediterranean Europe. Earth Surface Processes and Landforms:1201-1220.
Vandekerckhove, L., J. Poesen, D.O. Wijdenes, and T. De Figueiredo. 1998. Topographical thresholds for ephemeral gully initiation in intensively cultivated areas of the Mediterranean. Catena 33(3):271-292.
Wang, S.L., P. Heisey, D. Schimmelpfennig, and V.E. Ball. 2015. Agricultural Productivity Growth in the United States: Measurement, Trends, and Drivers. Economic Research
Service, Paper No ERR-189.
WC, The Weather Channel. 2016. Monthly Averages for Murphysboro, Illinois. Available online at https://weather.com/weather/monthly/l/USIL0825; last accessed on 1 May, 2016.
Whiting, P.J., E.C. Bonniwell, and G. Matisoff. 2001. Depth and areal extent of sheet and rill erosion based on radionuclides in soils and suspended sediment. Geology 29(12):1131-1134.
Williard, K.W.J., and J.E. Schoonover. 2012. Water quality benefits of riparian buffers in
southern illinois agricultural watersheds Available online at http://www.istc.illinois.edu/about/seminarpresentations/20120328.pdf; last accessed on 11 May, 2014.
Willis, G.H., and L.L. McDowell. 1982. Pesticides in agricultural runoff and their effects on downstream water quality. Environmental Toxicology and Chemistry 1(4):267-279.
Yuan, Y., R.L. Bingner, and M.A. Locke. 2009. A review of effectiveness of vegetative buffers on sediment trapping in agricultural areas. Ecohydrology 2(3):321-336.

88
Zhang, X., and M. Zhang. 2011. Modeling effectiveness of agricultural BMPs to reduce sediment load and organophosphate pesticides in surface runoff. Science of the Total
Environment 409(10):1949-1958.
Zhu, Q., and H.S. Lin. 2009. Simulation and validation of concentrated subsurface lateral flow paths in an agricultural landscape. Hydrol Earth Syst Sc 13(8):1503-1518.
Zilberman, D. 1998. The impact of agriculture on water quality. P. 133-149 in Sustinable
Management of Water in Agriculture: Issues and Policies, The Athens Workshop: OECD
Proceedings The Organization for Economic Co-operation and Development (OECD), Paris.

APPENDICES

89
APPENDIX I – Physiographic Divisions of Illinois
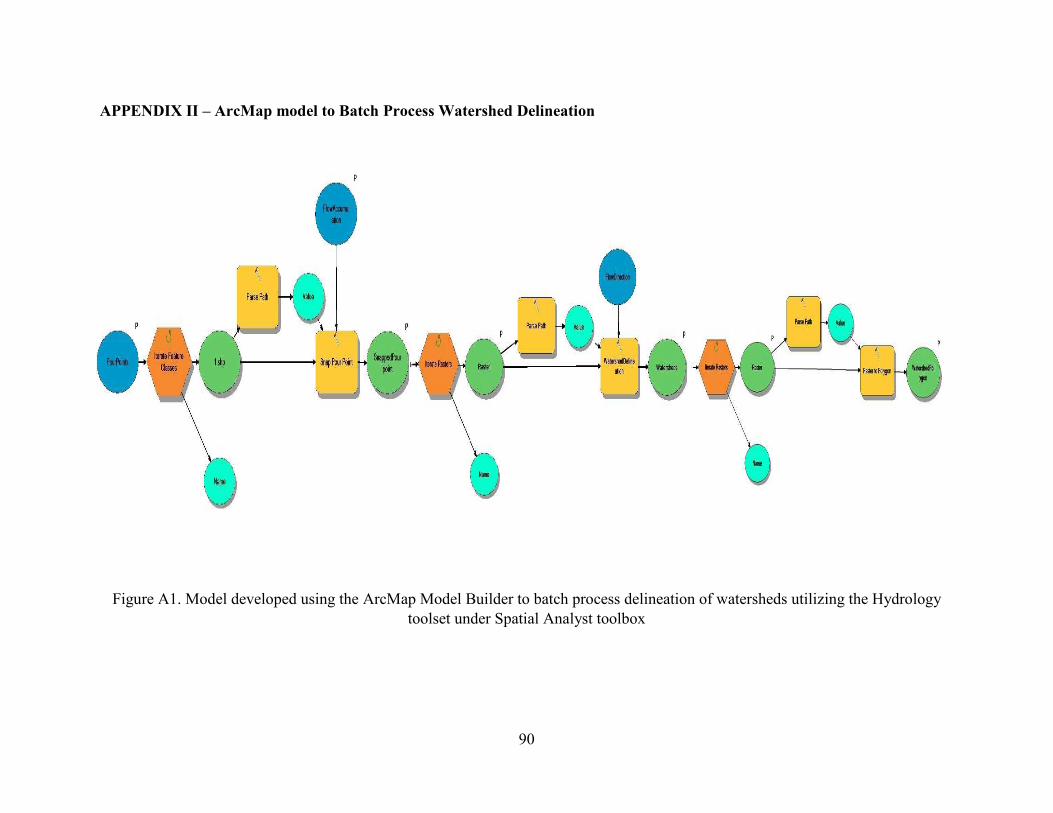
90
APPENDIX II – ArcMap model to Batch Process Watershed Delineation
Figure A1. Model developed using the ArcMap Model Builder to batch process delineation of watersheds utilizing the Hydrology
toolset under Spatial Analyst toolbox

91
APPENDIX III– Example Figures Showing Methods Used to Determine Field Length Parallel to Concentrated Flow
Figure A2. Example figures showing methods of determining field length parallel to concentrated flow in irregular field polygons a)
triangle b) trapezoid c) irregular shape where A, B, C represent concentrated flow identified and A’, B’ and C’ represent
corresponding field length parallel to the concentrated flow
(a) (b) (c)
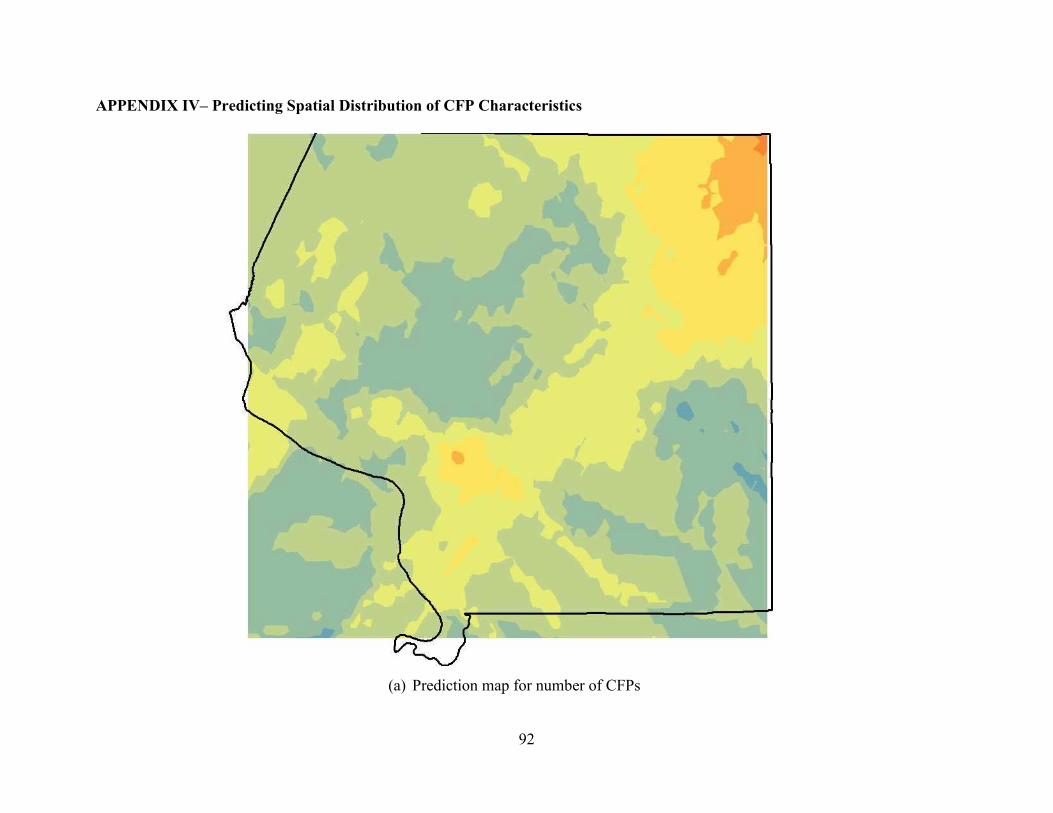
92
APPENDIX IV– Predicting Spatial Distribution of CFP Characteristics
(a) Prediction map for number of CFPs

93
(b) Prediction map for CFP length

94
(c) Prediction map for CFP drainage area

95
(d) Prediction map for drainage density

96
(e) Prediction map for ratio of CFP length to drainage area
Figure A3. Prediction maps for the CFP characteristics generated using the ordinary kriging method in ArcGIS v. 10.3.1 using the
Geospatial Analyst toolbox
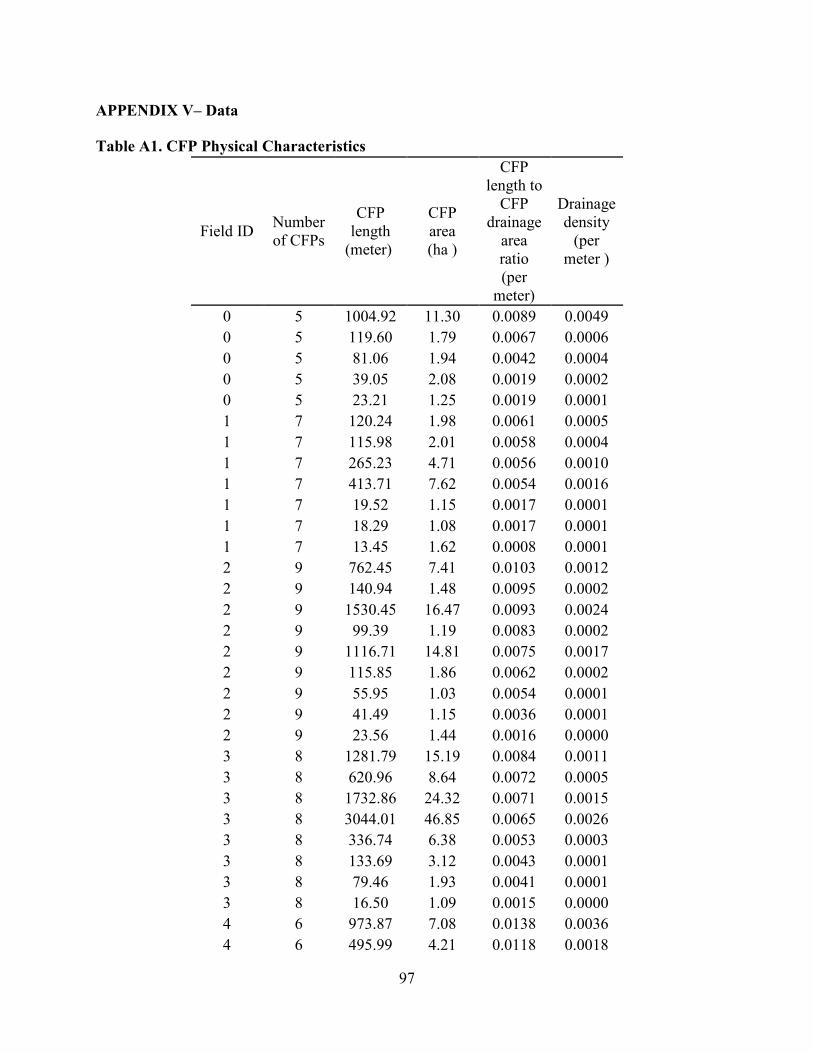
97
APPENDIX V– Data
Table A1. CFP Physical Characteristics
Field ID Number of CFPs
CFP length
(meter)
CFP area (ha )
CFP length to
CFP drainage
area ratio (per
meter)
Drainage density
(per meter )
0 5 1004.92 11.30 0.0089 0.0049
0 5 119.60 1.79 0.0067 0.0006
0 5 81.06 1.94 0.0042 0.0004
0 5 39.05 2.08 0.0019 0.0002
0 5 23.21 1.25 0.0019 0.0001
1 7 120.24 1.98 0.0061 0.0005
1 7 115.98 2.01 0.0058 0.0004
1 7 265.23 4.71 0.0056 0.0010
1 7 413.71 7.62 0.0054 0.0016
1 7 19.52 1.15 0.0017 0.0001
1 7 18.29 1.08 0.0017 0.0001
1 7 13.45 1.62 0.0008 0.0001
2 9 762.45 7.41 0.0103 0.0012
2 9 140.94 1.48 0.0095 0.0002
2 9 1530.45 16.47 0.0093 0.0024
2 9 99.39 1.19 0.0083 0.0002
2 9 1116.71 14.81 0.0075 0.0017
2 9 115.85 1.86 0.0062 0.0002
2 9 55.95 1.03 0.0054 0.0001
2 9 41.49 1.15 0.0036 0.0001
2 9 23.56 1.44 0.0016 0.0000
3 8 1281.79 15.19 0.0084 0.0011
3 8 620.96 8.64 0.0072 0.0005
3 8 1732.86 24.32 0.0071 0.0015
3 8 3044.01 46.85 0.0065 0.0026
3 8 336.74 6.38 0.0053 0.0003
3 8 133.69 3.12 0.0043 0.0001
3 8 79.46 1.93 0.0041 0.0001
3 8 16.50 1.09 0.0015 0.0000
4 6 973.87 7.08 0.0138 0.0036
4 6 495.99 4.21 0.0118 0.0018
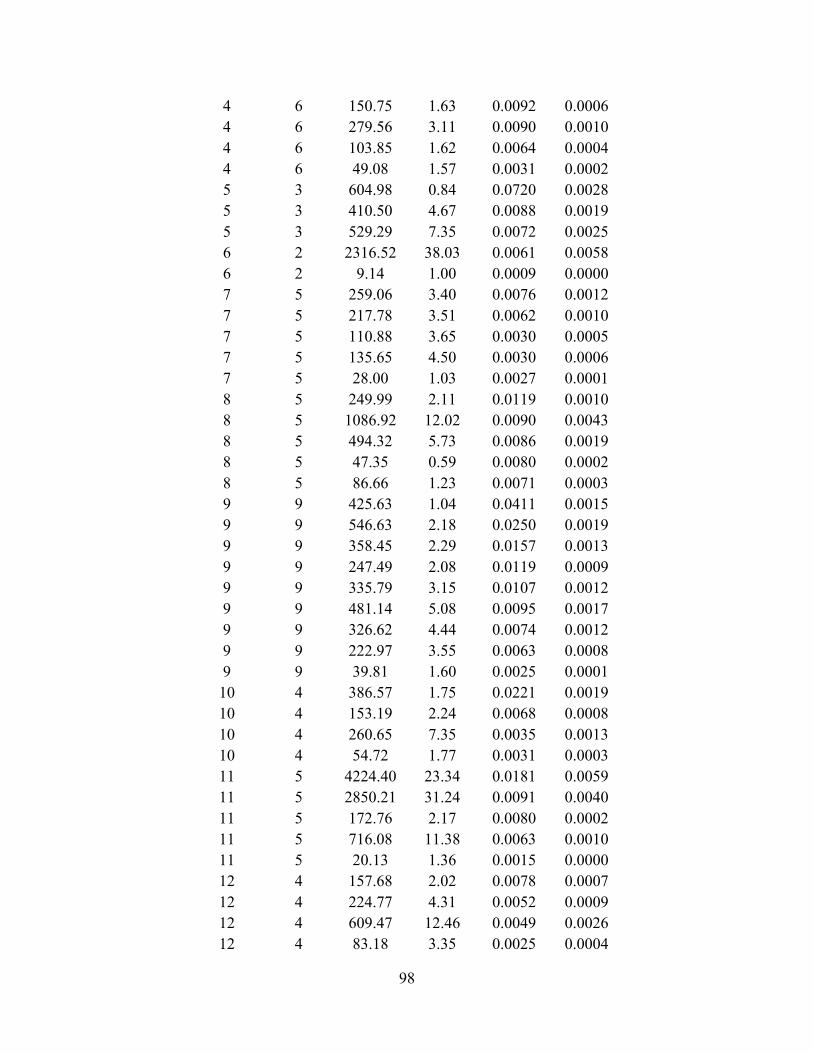
98
4 6 150.75 1.63 0.0092 0.0006
4 6 279.56 3.11 0.0090 0.0010
4 6 103.85 1.62 0.0064 0.0004
4 6 49.08 1.57 0.0031 0.0002
5 3 604.98 0.84 0.0720 0.0028
5 3 410.50 4.67 0.0088 0.0019
5 3 529.29 7.35 0.0072 0.0025
6 2 2316.52 38.03 0.0061 0.0058
6 2 9.14 1.00 0.0009 0.0000
7 5 259.06 3.40 0.0076 0.0012
7 5 217.78 3.51 0.0062 0.0010
7 5 110.88 3.65 0.0030 0.0005
7 5 135.65 4.50 0.0030 0.0006
7 5 28.00 1.03 0.0027 0.0001
8 5 249.99 2.11 0.0119 0.0010
8 5 1086.92 12.02 0.0090 0.0043
8 5 494.32 5.73 0.0086 0.0019
8 5 47.35 0.59 0.0080 0.0002
8 5 86.66 1.23 0.0071 0.0003
9 9 425.63 1.04 0.0411 0.0015
9 9 546.63 2.18 0.0250 0.0019
9 9 358.45 2.29 0.0157 0.0013
9 9 247.49 2.08 0.0119 0.0009
9 9 335.79 3.15 0.0107 0.0012
9 9 481.14 5.08 0.0095 0.0017
9 9 326.62 4.44 0.0074 0.0012
9 9 222.97 3.55 0.0063 0.0008
9 9 39.81 1.60 0.0025 0.0001
10 4 386.57 1.75 0.0221 0.0019
10 4 153.19 2.24 0.0068 0.0008
10 4 260.65 7.35 0.0035 0.0013
10 4 54.72 1.77 0.0031 0.0003
11 5 4224.40 23.34 0.0181 0.0059
11 5 2850.21 31.24 0.0091 0.0040
11 5 172.76 2.17 0.0080 0.0002
11 5 716.08 11.38 0.0063 0.0010
11 5 20.13 1.36 0.0015 0.0000
12 4 157.68 2.02 0.0078 0.0007
12 4 224.77 4.31 0.0052 0.0009
12 4 609.47 12.46 0.0049 0.0026
12 4 83.18 3.35 0.0025 0.0004

99
13 4 2259.14 14.51 0.0156 0.0054
13 4 216.97 1.46 0.0149 0.0005
13 4 459.92 3.37 0.0136 0.0011
13 4 2304.32 20.98 0.0110 0.0055
14 5 188.66 1.21 0.0156 0.0005
14 5 440.48 4.69 0.0094 0.0012
14 5 945.10 10.38 0.0091 0.0026
14 5 114.66 1.50 0.0077 0.0003
14 5 520.84 8.11 0.0064 0.0014
15 3 2196.41 21.31 0.0103 0.0077
15 3 187.36 2.88 0.0065 0.0007
15 3 183.19 2.82 0.0065 0.0006
16 4 994.60 10.26 0.0097 0.0044
16 4 162.24 1.70 0.0096 0.0007
16 4 325.46 5.53 0.0059 0.0014
16 4 37.82 1.28 0.0029 0.0002
17 3 1307.32 18.08 0.0072 0.0035
17 3 714.86 11.20 0.0064 0.0019
17 3 42.54 1.36 0.0031 0.0001
18 3 872.65 9.85 0.0089 0.0016
18 3 2316.73 28.24 0.0082 0.0042
18 3 85.72 1.10 0.0078 0.0002
19 6 222.36 3.60 0.0062 0.0011
19 6 292.95 5.95 0.0049 0.0014
19 6 54.03 1.17 0.0046 0.0003
19 6 104.14 2.71 0.0038 0.0005
19 6 128.10 3.46 0.0037 0.0006
19 6 31.47 2.41 0.0013 0.0002
20 5 2213.59 13.98 0.0158 0.0043
20 5 1323.94 14.93 0.0089 0.0026
20 5 373.48 4.55 0.0082 0.0007
20 5 427.15 5.52 0.0077 0.0008
20 5 498.51 8.04 0.0062 0.0010
21 5 577.55 5.23 0.0110 0.0015
21 5 799.76 7.40 0.0108 0.0020
21 5 1008.21 12.74 0.0079 0.0025
21 5 417.32 5.43 0.0077 0.0010
21 5 22.57 0.96 0.0023 0.0001
22 6 424.17 4.51 0.0094 0.0004
22 6 474.50 5.61 0.0085 0.0004
22 6 6243.63 74.06 0.0084 0.0056
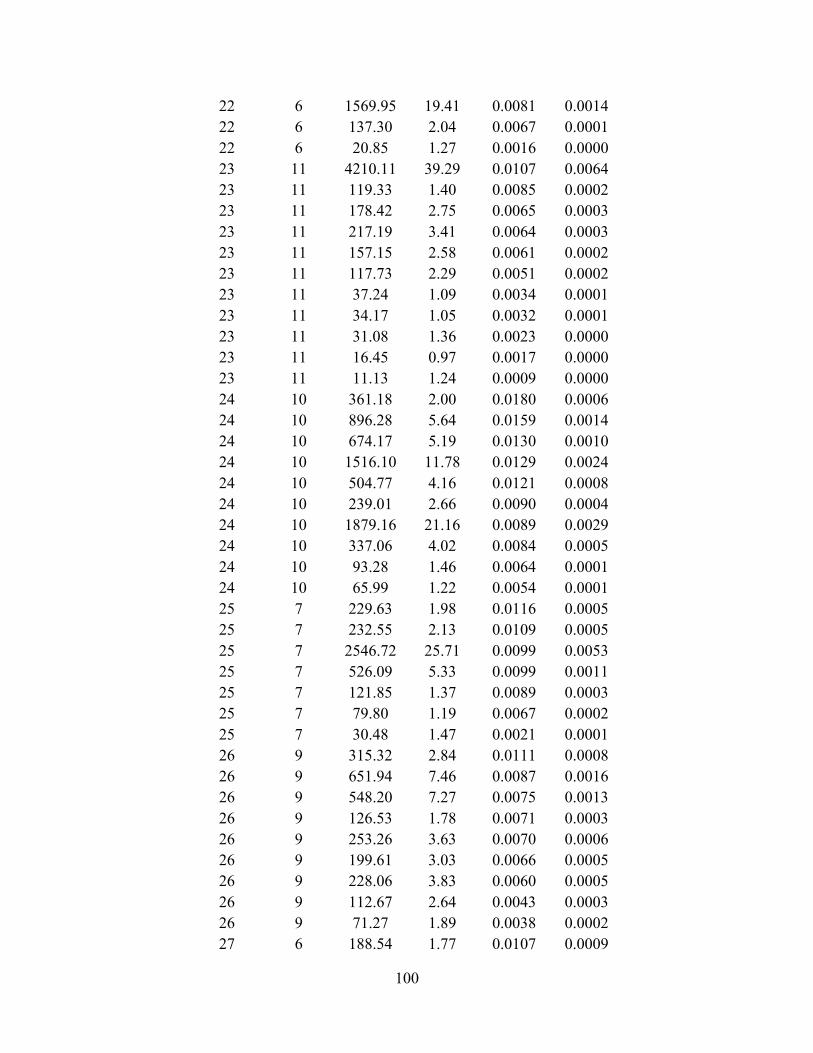
100
22 6 1569.95 19.41 0.0081 0.0014
22 6 137.30 2.04 0.0067 0.0001
22 6 20.85 1.27 0.0016 0.0000
23 11 4210.11 39.29 0.0107 0.0064
23 11 119.33 1.40 0.0085 0.0002
23 11 178.42 2.75 0.0065 0.0003
23 11 217.19 3.41 0.0064 0.0003
23 11 157.15 2.58 0.0061 0.0002
23 11 117.73 2.29 0.0051 0.0002
23 11 37.24 1.09 0.0034 0.0001
23 11 34.17 1.05 0.0032 0.0001
23 11 31.08 1.36 0.0023 0.0000
23 11 16.45 0.97 0.0017 0.0000
23 11 11.13 1.24 0.0009 0.0000
24 10 361.18 2.00 0.0180 0.0006
24 10 896.28 5.64 0.0159 0.0014
24 10 674.17 5.19 0.0130 0.0010
24 10 1516.10 11.78 0.0129 0.0024
24 10 504.77 4.16 0.0121 0.0008
24 10 239.01 2.66 0.0090 0.0004
24 10 1879.16 21.16 0.0089 0.0029
24 10 337.06 4.02 0.0084 0.0005
24 10 93.28 1.46 0.0064 0.0001
24 10 65.99 1.22 0.0054 0.0001
25 7 229.63 1.98 0.0116 0.0005
25 7 232.55 2.13 0.0109 0.0005
25 7 2546.72 25.71 0.0099 0.0053
25 7 526.09 5.33 0.0099 0.0011
25 7 121.85 1.37 0.0089 0.0003
25 7 79.80 1.19 0.0067 0.0002
25 7 30.48 1.47 0.0021 0.0001
26 9 315.32 2.84 0.0111 0.0008
26 9 651.94 7.46 0.0087 0.0016
26 9 548.20 7.27 0.0075 0.0013
26 9 126.53 1.78 0.0071 0.0003
26 9 253.26 3.63 0.0070 0.0006
26 9 199.61 3.03 0.0066 0.0005
26 9 228.06 3.83 0.0060 0.0005
26 9 112.67 2.64 0.0043 0.0003
26 9 71.27 1.89 0.0038 0.0002
27 6 188.54 1.77 0.0107 0.0009

101
27 6 469.32 5.65 0.0083 0.0023
27 6 109.28 1.47 0.0074 0.0005
27 6 80.59 1.55 0.0052 0.0004
27 6 50.16 1.11 0.0045 0.0002
27 6 26.09 1.16 0.0022 0.0001
28 4 159.67 1.82 0.0088 0.0005
28 4 1046.67 13.47 0.0078 0.0035
28 4 152.10 2.43 0.0063 0.0005
28 4 27.43 1.09 0.0025 0.0001
29 8 2580.12 17.34 0.0149 0.0034
29 8 314.24 2.49 0.0126 0.0004
29 8 233.58 1.91 0.0122 0.0003
29 8 176.45 1.58 0.0112 0.0002
29 8 870.99 8.37 0.0104 0.0012
29 8 2503.40 27.45 0.0091 0.0033
29 8 129.05 2.04 0.0063 0.0002
29 8 52.48 1.14 0.0046 0.0001
30 4 954.72 5.99 0.0159 0.0027
30 4 866.13 5.84 0.0148 0.0024
30 4 2330.17 20.13 0.0116 0.0065
30 4 64.91 2.10 0.0031 0.0002
31 2 959.34 6.53 0.0147 0.0041
31 2 1196.24 16.77 0.0071 0.0051
32 3 626.87 12.58 0.0050 0.0021
32 3 580.36 12.05 0.0048 0.0020
32 3 50.64 1.22 0.0042 0.0002
33 2 2100.63 24.48 0.0086 0.0068
33 2 316.29 5.65 0.0056 0.0010
34 5 528.59 7.51 0.0070 0.0015
34 5 275.12 3.94 0.0070 0.0008
34 5 1186.03 17.12 0.0069 0.0035
34 5 127.86 2.17 0.0059 0.0004
34 5 52.08 2.08 0.0025 0.0002
35 6 1627.19 12.80 0.0127 0.0046
35 6 390.87 3.97 0.0099 0.0011
35 6 653.16 9.90 0.0066 0.0018
35 6 76.94 1.31 0.0059 0.0002
35 6 44.39 1.10 0.0040 0.0001
35 6 29.19 1.04 0.0028 0.0001
36 3 395.85 5.58 0.0071 0.0015
36 3 922.51 14.84 0.0062 0.0035
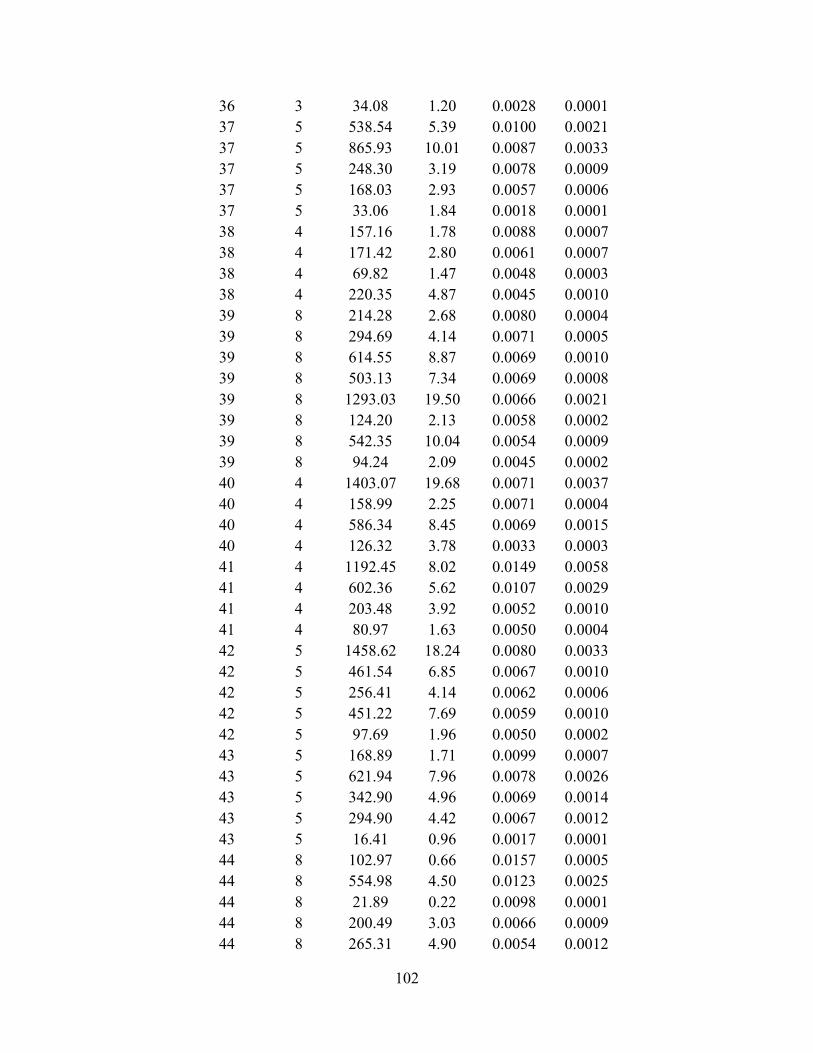
102
36 3 34.08 1.20 0.0028 0.0001
37 5 538.54 5.39 0.0100 0.0021
37 5 865.93 10.01 0.0087 0.0033
37 5 248.30 3.19 0.0078 0.0009
37 5 168.03 2.93 0.0057 0.0006
37 5 33.06 1.84 0.0018 0.0001
38 4 157.16 1.78 0.0088 0.0007
38 4 171.42 2.80 0.0061 0.0007
38 4 69.82 1.47 0.0048 0.0003
38 4 220.35 4.87 0.0045 0.0010
39 8 214.28 2.68 0.0080 0.0004
39 8 294.69 4.14 0.0071 0.0005
39 8 614.55 8.87 0.0069 0.0010
39 8 503.13 7.34 0.0069 0.0008
39 8 1293.03 19.50 0.0066 0.0021
39 8 124.20 2.13 0.0058 0.0002
39 8 542.35 10.04 0.0054 0.0009
39 8 94.24 2.09 0.0045 0.0002
40 4 1403.07 19.68 0.0071 0.0037
40 4 158.99 2.25 0.0071 0.0004
40 4 586.34 8.45 0.0069 0.0015
40 4 126.32 3.78 0.0033 0.0003
41 4 1192.45 8.02 0.0149 0.0058
41 4 602.36 5.62 0.0107 0.0029
41 4 203.48 3.92 0.0052 0.0010
41 4 80.97 1.63 0.0050 0.0004
42 5 1458.62 18.24 0.0080 0.0033
42 5 461.54 6.85 0.0067 0.0010
42 5 256.41 4.14 0.0062 0.0006
42 5 451.22 7.69 0.0059 0.0010
42 5 97.69 1.96 0.0050 0.0002
43 5 168.89 1.71 0.0099 0.0007
43 5 621.94 7.96 0.0078 0.0026
43 5 342.90 4.96 0.0069 0.0014
43 5 294.90 4.42 0.0067 0.0012
43 5 16.41 0.96 0.0017 0.0001
44 8 102.97 0.66 0.0157 0.0005
44 8 554.98 4.50 0.0123 0.0025
44 8 21.89 0.22 0.0098 0.0001
44 8 200.49 3.03 0.0066 0.0009
44 8 265.31 4.90 0.0054 0.0012

103
44 8 112.84 2.09 0.0054 0.0005
44 8 80.52 1.55 0.0052 0.0004
44 8 67.12 1.57 0.0043 0.0003
45 6 98.76 0.13 0.0742 0.0003
45 6 485.55 3.40 0.0143 0.0015
45 6 397.17 4.94 0.0080 0.0012
45 6 699.53 13.77 0.0051 0.0022
45 6 197.42 4.45 0.0044 0.0006
45 6 105.38 2.97 0.0036 0.0003
46 7 399.12 4.08 0.0098 0.0009
46 7 1006.97 13.66 0.0074 0.0023
46 7 857.98 12.10 0.0071 0.0020
46 7 193.74 2.97 0.0065 0.0005
46 7 162.99 3.26 0.0050 0.0004
46 7 43.90 1.14 0.0039 0.0001
46 7 48.39 1.34 0.0036 0.0001
47 6 114.30 1.14 0.0101 0.0003
47 6 548.52 5.71 0.0096 0.0016
47 6 880.03 13.56 0.0065 0.0025
47 6 389.84 6.06 0.0064 0.0011
47 6 269.72 5.56 0.0048 0.0008
47 6 50.77 1.50 0.0034 0.0001
48 6 212.96 3.14 0.0068 0.0007
48 6 1056.99 16.13 0.0066 0.0034
48 6 170.10 2.69 0.0063 0.0005
48 6 143.72 2.48 0.0058 0.0005
48 6 159.06 2.87 0.0055 0.0005
48 6 50.77 1.50 0.0034 0.0002
49 6 2800.35 33.94 0.0083 0.0050
49 6 128.00 1.76 0.0073 0.0002
49 6 414.19 6.46 0.0064 0.0007
49 6 93.63 1.88 0.0050 0.0002
49 6 57.00 1.56 0.0036 0.0001
49 6 59.40 2.14 0.0028 0.0001
50 5 575.57 8.85 0.0065 0.0018
50 5 482.05 7.56 0.0064 0.0015
50 5 625.74 11.04 0.0057 0.0020
50 5 34.75 1.53 0.0023 0.0001
50 5 19.52 0.99 0.0020 0.0001
51 7 162.68 1.60 0.0102 0.0005
51 7 376.79 3.99 0.0094 0.0011

104
51 7 400.84 4.40 0.0091 0.0012
51 7 1167.56 14.45 0.0081 0.0034
51 7 110.08 1.46 0.0076 0.0003
51 7 245.67 4.01 0.0061 0.0007
51 7 33.74 1.73 0.0020 0.0001
52 10 172.14 2.57 0.0067 0.0004
52 10 572.02 9.52 0.0060 0.0013
52 10 128.49 2.25 0.0057 0.0003
52 10 95.56 1.94 0.0049 0.0002
52 10 44.29 1.33 0.0033 0.0001
52 10 50.58 1.73 0.0029 0.0001
52 10 49.23 1.76 0.0028 0.0001
52 10 58.23 2.10 0.0028 0.0001
52 10 107.03 4.02 0.0027 0.0003
52 10 39.32 1.99 0.0020 0.0001
53 4 466.28 6.16 0.0076 0.0018
53 4 838.15 11.31 0.0074 0.0032
53 4 68.32 1.81 0.0038 0.0003
53 4 9.14 1.79 0.0005 0.0000
54 5 267.32 3.25 0.0082 0.0011
54 5 325.44 3.99 0.0081 0.0013
54 5 136.07 3.47 0.0039 0.0006
54 5 116.56 3.06 0.0038 0.0005
54 5 43.61 1.51 0.0029 0.0002
55 4 72.45 1.24 0.0058 0.0004
55 4 194.00 4.09 0.0047 0.0010
55 4 65.14 2.46 0.0027 0.0003
55 4 28.89 1.19 0.0024 0.0001
56 6 191.82 2.65 0.0072 0.0008
56 6 313.71 4.44 0.0071 0.0013
56 6 226.82 3.59 0.0063 0.0009
56 6 160.34 3.08 0.0052 0.0007
56 6 81.97 1.91 0.0043 0.0003
56 6 72.77 1.92 0.0038 0.0003
57 5 390.54 3.17 0.0123 0.0013
57 5 329.28 3.13 0.0105 0.0011
57 5 357.71 8.49 0.0042 0.0012
57 5 50.24 1.99 0.0025 0.0002
57 5 77.46 3.12 0.0025 0.0003
58 6 228.47 3.56 0.0064 0.0010
58 6 260.48 4.28 0.0061 0.0011

105
58 6 156.17 2.85 0.0055 0.0007
58 6 180.47 3.40 0.0053 0.0008
58 6 51.37 2.18 0.0024 0.0002
58 6 13.45 1.07 0.0013 0.0001
59 5 194.11 1.67 0.0116 0.0007
59 5 1048.74 11.26 0.0093 0.0036
59 5 191.35 3.07 0.0062 0.0007
59 5 116.65 2.72 0.0043 0.0004
59 5 51.90 1.72 0.0030 0.0002
60 9 161.50 1.49 0.0108 0.0006
60 9 542.28 6.29 0.0086 0.0020
60 9 184.25 2.23 0.0082 0.0007
60 9 106.06 1.92 0.0055 0.0004
60 9 136.27 2.56 0.0053 0.0005
60 9 144.11 2.78 0.0052 0.0005
60 9 72.94 1.56 0.0047 0.0003
60 9 81.67 1.93 0.0042 0.0003
60 9 80.66 2.32 0.0035 0.0003
61 5 102.80 2.37 0.0043 0.0005
61 5 33.74 1.16 0.0029 0.0002
61 5 51.44 2.40 0.0021 0.0002
61 5 22.07 1.18 0.0019 0.0001
61 5 40.09 2.15 0.0019 0.0002
62 4 351.69 5.27 0.0067 0.0012
62 4 595.42 10.19 0.0058 0.0021
62 4 234.86 4.65 0.0050 0.0008
62 4 46.21 1.72 0.0027 0.0002
65 5 962.47 12.58 0.0077 0.0023
65 5 1156.02 19.82 0.0058 0.0028
65 5 168.87 3.22 0.0053 0.0004
65 5 44.67 1.95 0.0023 0.0001
65 5 30.94 1.72 0.0018 0.0001
66 4 566.43 9.10 0.0062 0.0023
66 4 195.33 5.24 0.0037 0.0008
66 4 35.18 1.66 0.0021 0.0001
66 4 26.88 1.29 0.0021 0.0001
67 4 109.57 3.06 0.0036 0.0005
67 4 96.96 2.78 0.0035 0.0004
67 4 32.48 1.49 0.0022 0.0001
67 4 34.22 2.11 0.0016 0.0001
68 4 760.96 8.09 0.0094 0.0038
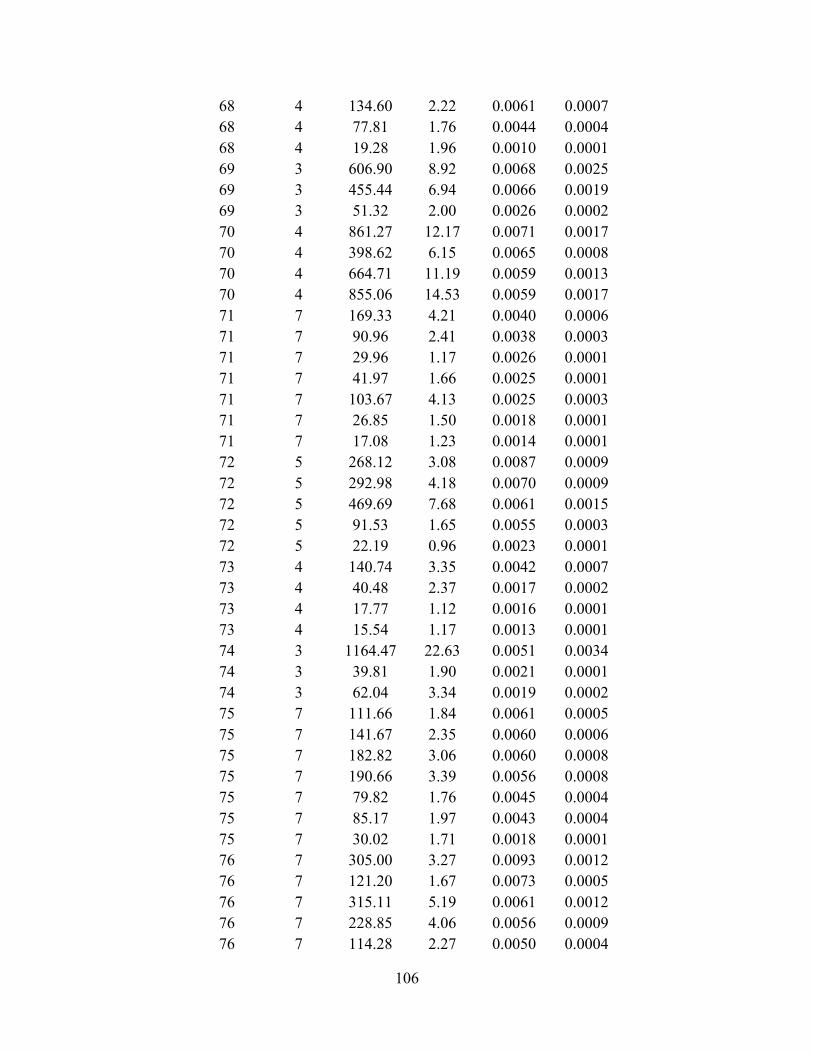
106
68 4 134.60 2.22 0.0061 0.0007
68 4 77.81 1.76 0.0044 0.0004
68 4 19.28 1.96 0.0010 0.0001
69 3 606.90 8.92 0.0068 0.0025
69 3 455.44 6.94 0.0066 0.0019
69 3 51.32 2.00 0.0026 0.0002
70 4 861.27 12.17 0.0071 0.0017
70 4 398.62 6.15 0.0065 0.0008
70 4 664.71 11.19 0.0059 0.0013
70 4 855.06 14.53 0.0059 0.0017
71 7 169.33 4.21 0.0040 0.0006
71 7 90.96 2.41 0.0038 0.0003
71 7 29.96 1.17 0.0026 0.0001
71 7 41.97 1.66 0.0025 0.0001
71 7 103.67 4.13 0.0025 0.0003
71 7 26.85 1.50 0.0018 0.0001
71 7 17.08 1.23 0.0014 0.0001
72 5 268.12 3.08 0.0087 0.0009
72 5 292.98 4.18 0.0070 0.0009
72 5 469.69 7.68 0.0061 0.0015
72 5 91.53 1.65 0.0055 0.0003
72 5 22.19 0.96 0.0023 0.0001
73 4 140.74 3.35 0.0042 0.0007
73 4 40.48 2.37 0.0017 0.0002
73 4 17.77 1.12 0.0016 0.0001
73 4 15.54 1.17 0.0013 0.0001
74 3 1164.47 22.63 0.0051 0.0034
74 3 39.81 1.90 0.0021 0.0001
74 3 62.04 3.34 0.0019 0.0002
75 7 111.66 1.84 0.0061 0.0005
75 7 141.67 2.35 0.0060 0.0006
75 7 182.82 3.06 0.0060 0.0008
75 7 190.66 3.39 0.0056 0.0008
75 7 79.82 1.76 0.0045 0.0004
75 7 85.17 1.97 0.0043 0.0004
75 7 30.02 1.71 0.0018 0.0001
76 7 305.00 3.27 0.0093 0.0012
76 7 121.20 1.67 0.0073 0.0005
76 7 315.11 5.19 0.0061 0.0012
76 7 228.85 4.06 0.0056 0.0009
76 7 114.28 2.27 0.0050 0.0004

107
76 7 166.19 4.74 0.0035 0.0006
76 7 17.24 1.10 0.0016 0.0001
77 2 376.67 5.72 0.0066 0.0019
77 2 301.26 5.60 0.0054 0.0015
78 9 2461.06 29.32 0.0084 0.0022
78 9 2196.43 27.94 0.0079 0.0020
78 9 1107.90 16.52 0.0067 0.0010
78 9 317.57 5.13 0.0062 0.0003
78 9 119.57 2.04 0.0058 0.0001
78 9 1015.52 17.89 0.0057 0.0009
78 9 95.89 1.99 0.0048 0.0001
78 9 127.15 2.79 0.0046 0.0001
78 9 112.09 3.17 0.0035 0.0001
79 4 245.86 1.34 0.0184 0.0004
79 4 3458.64 40.92 0.0085 0.0062
79 4 559.56 9.25 0.0060 0.0010
79 4 116.52 2.03 0.0057 0.0002
80 5 268.92 4.61 0.0058 0.0011
80 5 416.95 7.34 0.0057 0.0017
80 5 102.22 2.21 0.0046 0.0004
80 5 34.85 1.27 0.0027 0.0001
80 5 63.89 2.40 0.0027 0.0003
81 4 220.81 5.14 0.0043 0.0009
81 4 54.01 1.31 0.0041 0.0002
81 4 61.02 2.05 0.0030 0.0002
81 4 41.50 1.78 0.0023 0.0002
82 2 1007.04 13.38 0.0075 0.0049
82 2 333.58 6.59 0.0051 0.0016
83 5 303.97 2.68 0.0113 0.0009
83 5 1229.00 13.66 0.0090 0.0035
83 5 658.59 8.27 0.0080 0.0019
83 5 132.73 2.45 0.0054 0.0004
83 5 191.35 4.19 0.0046 0.0005
84 10 230.55 1.18 0.0195 0.0004
84 10 370.36 2.33 0.0159 0.0007
84 10 1115.07 14.03 0.0079 0.0022
84 10 201.39 2.56 0.0079 0.0004
84 10 415.77 5.40 0.0077 0.0008
84 10 228.91 2.99 0.0077 0.0004
84 10 30.15 0.52 0.0057 0.0001
84 10 262.98 6.41 0.0041 0.0005

108
84 10 73.77 1.89 0.0039 0.0001
84 10 24.35 1.94 0.0013 0.0000
85 6 272.96 2.28 0.0120 0.0011
85 6 472.19 4.12 0.0114 0.0020
85 6 263.66 4.46 0.0059 0.0011
85 6 88.82 1.81 0.0049 0.0004
85 6 95.89 2.22 0.0043 0.0004
85 6 173.97 4.37 0.0040 0.0007
86 4 1143.55 8.37 0.0137 0.0040
86 4 713.45 7.31 0.0098 0.0025
86 4 619.41 6.85 0.0090 0.0022
86 4 83.61 1.36 0.0061 0.0003
87 3 124.09 1.69 0.0074 0.0004
87 3 884.31 13.21 0.0067 0.0028
87 3 391.12 6.61 0.0059 0.0012
88 6 318.36 3.58 0.0089 0.0011
88 6 556.27 8.16 0.0068 0.0019
88 6 197.31 3.37 0.0059 0.0007
88 6 252.15 4.93 0.0051 0.0009
88 6 167.98 3.70 0.0045 0.0006
88 6 30.48 1.16 0.0026 0.0001
89 6 231.81 2.67 0.0087 0.0009
89 6 110.14 1.43 0.0077 0.0004
89 6 176.82 2.34 0.0076 0.0007
89 6 149.38 2.43 0.0061 0.0006
89 6 324.66 7.59 0.0043 0.0012
89 6 46.07 1.21 0.0038 0.0002
90 3 1736.02 26.72 0.0065 0.0051
90 3 107.48 2.16 0.0050 0.0003
90 3 44.26 2.96 0.0015 0.0001
91 8 121.18 1.73 0.0070 0.0005
91 8 178.53 3.07 0.0058 0.0008
91 8 141.24 2.46 0.0058 0.0006
91 8 70.73 1.35 0.0052 0.0003
91 8 125.64 2.78 0.0045 0.0006
91 8 67.02 1.69 0.0040 0.0003
91 8 82.21 2.58 0.0032 0.0004
91 8 19.52 1.11 0.0018 0.0001
92 3 785.34 12.78 0.0061 0.0035
92 3 97.97 1.74 0.0056 0.0004
92 3 149.57 4.03 0.0037 0.0007

109
93 1 1494.46 19.63 0.0076 0.0064
94 4 271.16 3.88 0.0070 0.0012
94 4 730.21 11.68 0.0063 0.0032
94 4 27.43 1.19 0.0023 0.0001
94 4 33.18 1.56 0.0021 0.0001
95 8 273.69 3.08 0.0089 0.0005
95 8 1003.89 13.09 0.0077 0.0020
95 8 72.60 1.32 0.0055 0.0001
95 8 118.73 2.36 0.0050 0.0002
95 8 118.34 2.46 0.0048 0.0002
95 8 144.56 4.10 0.0035 0.0003
95 8 33.85 1.14 0.0030 0.0001
95 8 30.27 1.70 0.0018 0.0001
96 6 170.25 2.63 0.0065 0.0006
96 6 236.98 4.22 0.0056 0.0008
96 6 344.39 7.25 0.0047 0.0012
96 6 163.19 3.59 0.0045 0.0005
96 6 64.94 1.50 0.0043 0.0002
96 6 64.91 2.36 0.0028 0.0002
97 5 402.35 7.08 0.0057 0.0018
97 5 236.01 4.55 0.0052 0.0010
97 5 112.51 2.32 0.0048 0.0005
97 5 69.36 1.91 0.0036 0.0003
97 5 71.09 2.16 0.0033 0.0003
98 11 466.63 5.31 0.0088 0.0013
98 11 459.23 5.55 0.0083 0.0013
98 11 149.41 2.28 0.0066 0.0004
98 11 71.88 1.11 0.0065 0.0002
98 11 99.20 1.72 0.0058 0.0003
98 11 100.13 2.00 0.0050 0.0003
98 11 76.32 1.58 0.0048 0.0002
98 11 79.32 2.00 0.0040 0.0002
98 11 97.03 2.83 0.0034 0.0003
98 11 26.72 1.16 0.0023 0.0001
98 11 12.57 1.20 0.0010 0.0000
99 12 207.69 2.07 0.0100 0.0005
99 12 156.76 1.85 0.0085 0.0004
99 12 93.44 1.23 0.0076 0.0002
99 12 132.03 1.83 0.0072 0.0003
99 12 249.33 3.60 0.0069 0.0006
99 12 76.99 1.16 0.0066 0.0002
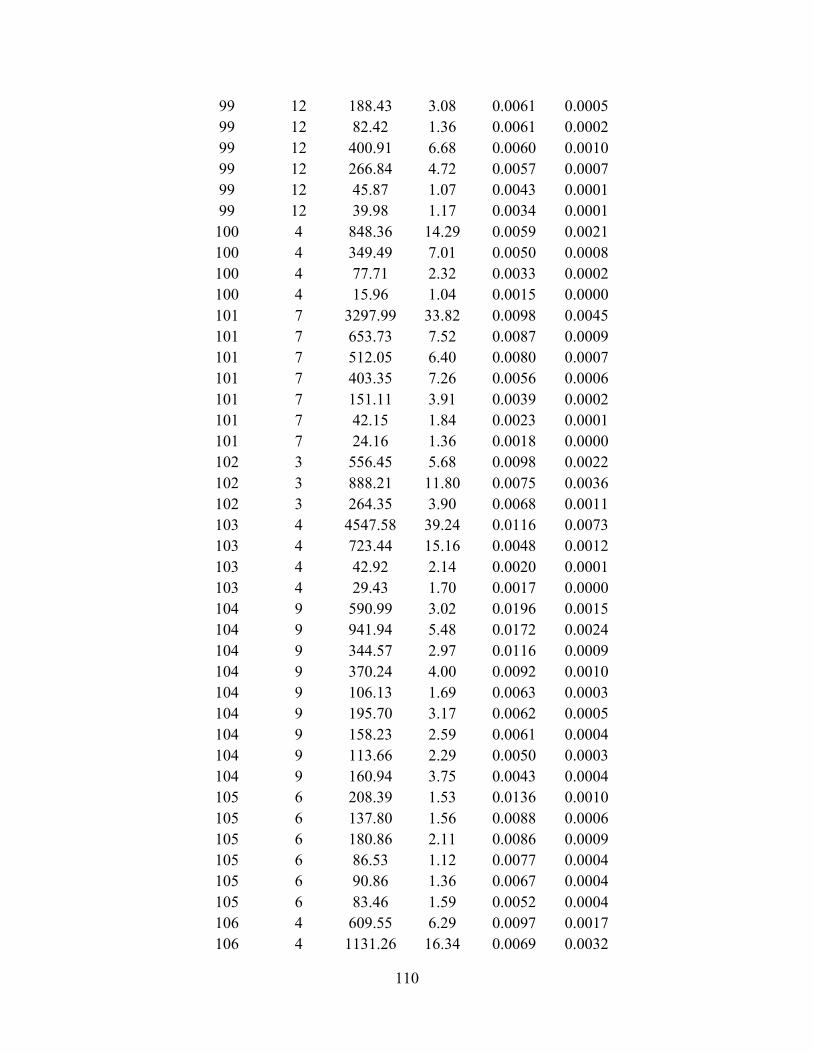
110
99 12 188.43 3.08 0.0061 0.0005
99 12 82.42 1.36 0.0061 0.0002
99 12 400.91 6.68 0.0060 0.0010
99 12 266.84 4.72 0.0057 0.0007
99 12 45.87 1.07 0.0043 0.0001
99 12 39.98 1.17 0.0034 0.0001
100 4 848.36 14.29 0.0059 0.0021
100 4 349.49 7.01 0.0050 0.0008
100 4 77.71 2.32 0.0033 0.0002
100 4 15.96 1.04 0.0015 0.0000
101 7 3297.99 33.82 0.0098 0.0045
101 7 653.73 7.52 0.0087 0.0009
101 7 512.05 6.40 0.0080 0.0007
101 7 403.35 7.26 0.0056 0.0006
101 7 151.11 3.91 0.0039 0.0002
101 7 42.15 1.84 0.0023 0.0001
101 7 24.16 1.36 0.0018 0.0000
102 3 556.45 5.68 0.0098 0.0022
102 3 888.21 11.80 0.0075 0.0036
102 3 264.35 3.90 0.0068 0.0011
103 4 4547.58 39.24 0.0116 0.0073
103 4 723.44 15.16 0.0048 0.0012
103 4 42.92 2.14 0.0020 0.0001
103 4 29.43 1.70 0.0017 0.0000
104 9 590.99 3.02 0.0196 0.0015
104 9 941.94 5.48 0.0172 0.0024
104 9 344.57 2.97 0.0116 0.0009
104 9 370.24 4.00 0.0092 0.0010
104 9 106.13 1.69 0.0063 0.0003
104 9 195.70 3.17 0.0062 0.0005
104 9 158.23 2.59 0.0061 0.0004
104 9 113.66 2.29 0.0050 0.0003
104 9 160.94 3.75 0.0043 0.0004
105 6 208.39 1.53 0.0136 0.0010
105 6 137.80 1.56 0.0088 0.0006
105 6 180.86 2.11 0.0086 0.0009
105 6 86.53 1.12 0.0077 0.0004
105 6 90.86 1.36 0.0067 0.0004
105 6 83.46 1.59 0.0052 0.0004
106 4 609.55 6.29 0.0097 0.0017
106 4 1131.26 16.34 0.0069 0.0032
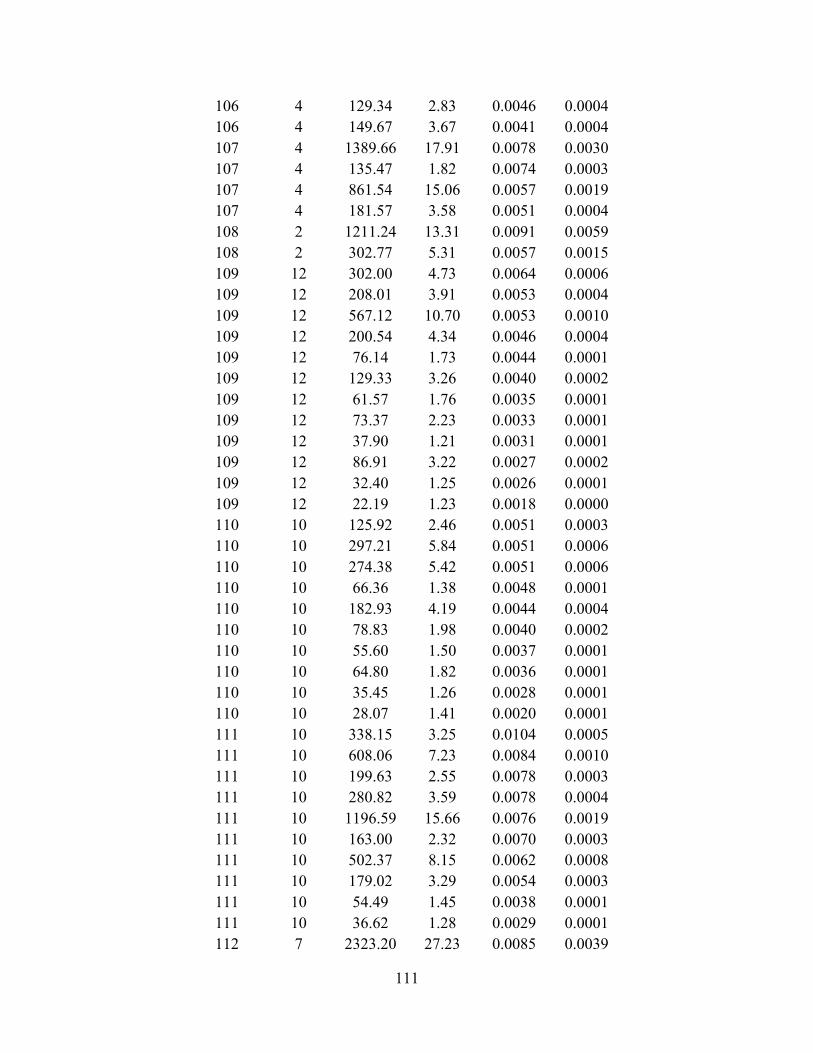
111
106 4 129.34 2.83 0.0046 0.0004
106 4 149.67 3.67 0.0041 0.0004
107 4 1389.66 17.91 0.0078 0.0030
107 4 135.47 1.82 0.0074 0.0003
107 4 861.54 15.06 0.0057 0.0019
107 4 181.57 3.58 0.0051 0.0004
108 2 1211.24 13.31 0.0091 0.0059
108 2 302.77 5.31 0.0057 0.0015
109 12 302.00 4.73 0.0064 0.0006
109 12 208.01 3.91 0.0053 0.0004
109 12 567.12 10.70 0.0053 0.0010
109 12 200.54 4.34 0.0046 0.0004
109 12 76.14 1.73 0.0044 0.0001
109 12 129.33 3.26 0.0040 0.0002
109 12 61.57 1.76 0.0035 0.0001
109 12 73.37 2.23 0.0033 0.0001
109 12 37.90 1.21 0.0031 0.0001
109 12 86.91 3.22 0.0027 0.0002
109 12 32.40 1.25 0.0026 0.0001
109 12 22.19 1.23 0.0018 0.0000
110 10 125.92 2.46 0.0051 0.0003
110 10 297.21 5.84 0.0051 0.0006
110 10 274.38 5.42 0.0051 0.0006
110 10 66.36 1.38 0.0048 0.0001
110 10 182.93 4.19 0.0044 0.0004
110 10 78.83 1.98 0.0040 0.0002
110 10 55.60 1.50 0.0037 0.0001
110 10 64.80 1.82 0.0036 0.0001
110 10 35.45 1.26 0.0028 0.0001
110 10 28.07 1.41 0.0020 0.0001
111 10 338.15 3.25 0.0104 0.0005
111 10 608.06 7.23 0.0084 0.0010
111 10 199.63 2.55 0.0078 0.0003
111 10 280.82 3.59 0.0078 0.0004
111 10 1196.59 15.66 0.0076 0.0019
111 10 163.00 2.32 0.0070 0.0003
111 10 502.37 8.15 0.0062 0.0008
111 10 179.02 3.29 0.0054 0.0003
111 10 54.49 1.45 0.0038 0.0001
111 10 36.62 1.28 0.0029 0.0001
112 7 2323.20 27.23 0.0085 0.0039
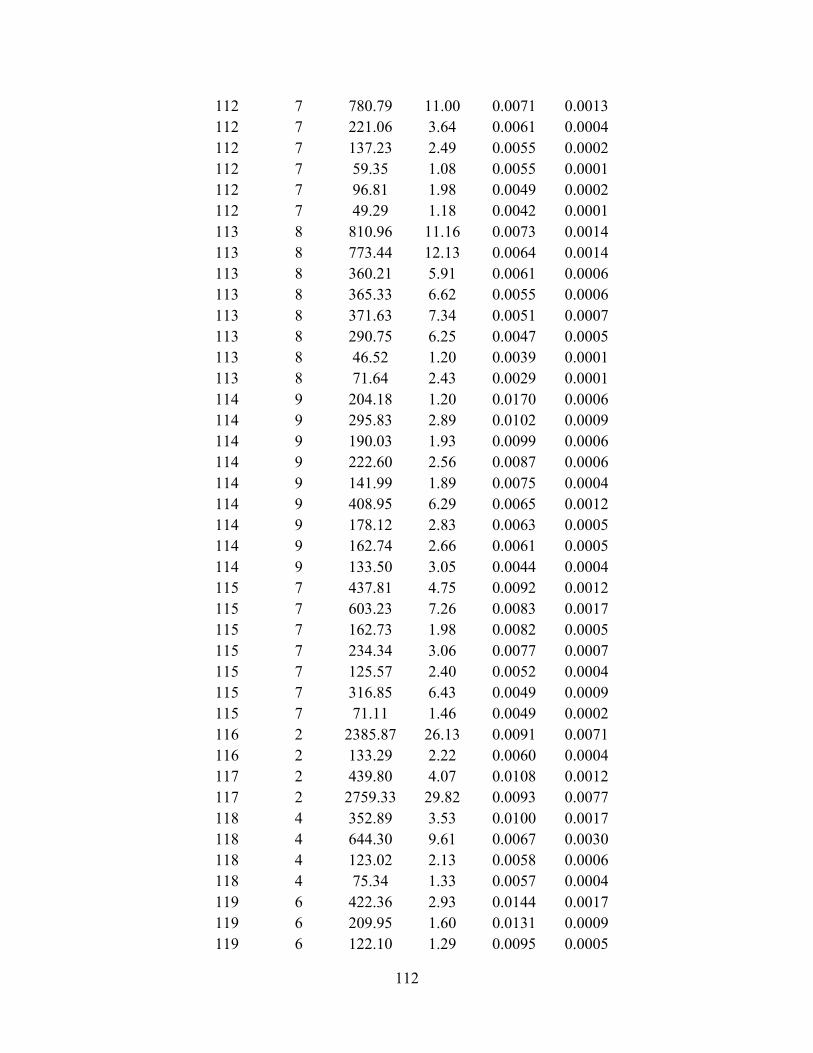
112
112 7 780.79 11.00 0.0071 0.0013
112 7 221.06 3.64 0.0061 0.0004
112 7 137.23 2.49 0.0055 0.0002
112 7 59.35 1.08 0.0055 0.0001
112 7 96.81 1.98 0.0049 0.0002
112 7 49.29 1.18 0.0042 0.0001
113 8 810.96 11.16 0.0073 0.0014
113 8 773.44 12.13 0.0064 0.0014
113 8 360.21 5.91 0.0061 0.0006
113 8 365.33 6.62 0.0055 0.0006
113 8 371.63 7.34 0.0051 0.0007
113 8 290.75 6.25 0.0047 0.0005
113 8 46.52 1.20 0.0039 0.0001
113 8 71.64 2.43 0.0029 0.0001
114 9 204.18 1.20 0.0170 0.0006
114 9 295.83 2.89 0.0102 0.0009
114 9 190.03 1.93 0.0099 0.0006
114 9 222.60 2.56 0.0087 0.0006
114 9 141.99 1.89 0.0075 0.0004
114 9 408.95 6.29 0.0065 0.0012
114 9 178.12 2.83 0.0063 0.0005
114 9 162.74 2.66 0.0061 0.0005
114 9 133.50 3.05 0.0044 0.0004
115 7 437.81 4.75 0.0092 0.0012
115 7 603.23 7.26 0.0083 0.0017
115 7 162.73 1.98 0.0082 0.0005
115 7 234.34 3.06 0.0077 0.0007
115 7 125.57 2.40 0.0052 0.0004
115 7 316.85 6.43 0.0049 0.0009
115 7 71.11 1.46 0.0049 0.0002
116 2 2385.87 26.13 0.0091 0.0071
116 2 133.29 2.22 0.0060 0.0004
117 2 439.80 4.07 0.0108 0.0012
117 2 2759.33 29.82 0.0093 0.0077
118 4 352.89 3.53 0.0100 0.0017
118 4 644.30 9.61 0.0067 0.0030
118 4 123.02 2.13 0.0058 0.0006
118 4 75.34 1.33 0.0057 0.0004
119 6 422.36 2.93 0.0144 0.0017
119 6 209.95 1.60 0.0131 0.0009
119 6 122.10 1.29 0.0095 0.0005

113
119 6 583.81 9.64 0.0061 0.0024
119 6 159.81 3.25 0.0049 0.0007
119 6 82.34 2.39 0.0034 0.0003
120 3 659.83 7.43 0.0089 0.0021
120 3 356.73 4.73 0.0075 0.0011
120 3 874.50 13.54 0.0065 0.0028
121 2 1584.55 20.92 0.0076 0.0045
121 2 34.98 1.25 0.0028 0.0001
122 5 163.20 1.49 0.0110 0.0005
122 5 1102.69 10.29 0.0107 0.0031
122 5 1102.56 13.03 0.0085 0.0031
122 5 65.41 1.19 0.0055 0.0002
122 5 257.86 5.79 0.0045 0.0007
123 2 946.57 7.89 0.0120 0.0041
123 2 1555.34 14.16 0.0110 0.0067
124 5 1361.31 11.79 0.0115 0.0046
124 5 461.94 4.40 0.0105 0.0016
124 5 552.28 6.97 0.0079 0.0019
124 5 208.35 2.98 0.0070 0.0007
124 5 95.90 1.71 0.0056 0.0003
125 5 349.93 3.15 0.0111 0.0011
125 5 219.59 2.40 0.0091 0.0007
125 5 1134.26 12.88 0.0088 0.0037
125 5 161.68 2.94 0.0055 0.0005
125 5 153.51 3.11 0.0049 0.0005
126 7 204.43 1.24 0.0165 0.0006
126 7 537.51 5.85 0.0092 0.0015
126 7 198.58 2.55 0.0078 0.0006
126 7 306.80 4.70 0.0065 0.0009
126 7 94.14 1.61 0.0059 0.0003
126 7 621.55 11.06 0.0056 0.0017
126 7 97.33 2.59 0.0038 0.0003
127 5 170.26 1.49 0.0114 0.0004
127 5 1196.81 17.62 0.0068 0.0025
127 5 315.35 5.54 0.0057 0.0007
127 5 81.95 2.40 0.0034 0.0002
127 5 33.53 1.34 0.0025 0.0001
128 1 1379.60 17.86 0.0077 0.0051
129 1 2178.02 29.19 0.0075 0.0069
130 3 263.02 2.67 0.0098 0.0011
130 3 1263.58 15.74 0.0080 0.0054

114
130 3 67.97 1.23 0.0055 0.0003
131 10 309.55 3.26 0.0095 0.0010
131 10 267.17 2.91 0.0092 0.0009
131 10 471.93 6.29 0.0075 0.0016
131 10 50.22 1.21 0.0041 0.0002
131 10 41.76 1.11 0.0037 0.0001
131 10 45.37 1.46 0.0031 0.0002
131 10 31.12 1.03 0.0030 0.0001
131 10 22.57 0.96 0.0023 0.0001
131 10 52.50 2.28 0.0023 0.0002
131 10 21.19 1.10 0.0019 0.0001
132 3 590.21 7.03 0.0084 0.0022
132 3 560.99 9.01 0.0062 0.0021
132 3 140.47 4.92 0.0029 0.0005
133 2 1422.07 19.48 0.0073 0.0045
133 2 530.32 7.54 0.0070 0.0017
134 6 280.33 2.00 0.0140 0.0012
134 6 364.98 3.06 0.0119 0.0015
134 6 902.27 11.59 0.0078 0.0037
134 6 134.37 1.85 0.0073 0.0006
134 6 143.28 2.59 0.0055 0.0006
134 6 53.07 1.27 0.0042 0.0002
135 7 1070.73 8.70 0.0123 0.0026
135 7 289.09 2.95 0.0098 0.0007
135 7 372.85 4.35 0.0086 0.0009
135 7 580.25 8.30 0.0070 0.0014
135 7 32.00 0.49 0.0065 0.0001
135 7 446.61 8.14 0.0055 0.0011
135 7 63.03 1.18 0.0053 0.0002
136 6 16.07 0.01 0.1197 0.0001
136 6 873.49 5.35 0.0163 0.0033
136 6 839.28 5.84 0.0144 0.0032
136 6 434.16 3.61 0.0120 0.0017
136 6 147.15 1.70 0.0087 0.0006
136 6 105.05 1.27 0.0083 0.0004
137 3 1197.56 10.34 0.0116 0.0034
137 3 1872.08 17.32 0.0108 0.0054
137 3 353.22 4.60 0.0077 0.0010
138 9 890.33 4.21 0.0212 0.0025
138 9 664.00 3.75 0.0177 0.0019
138 9 861.15 6.32 0.0136 0.0024

115
138 9 1318.99 9.94 0.0133 0.0037
138 9 335.37 4.76 0.0070 0.0009
138 9 202.79 2.96 0.0069 0.0006
138 9 111.69 1.78 0.0063 0.0003
138 9 88.75 1.74 0.0051 0.0002
138 9 33.18 1.03 0.0032 0.0001
138 9 27.73 1.06 0.0026 0.0001
139 3 613.66 11.17 0.0055 0.0029
139 3 216.39 4.10 0.0053 0.0010
139 3 45.26 1.22 0.0037 0.0002
140 2 1696.43 22.70 0.0075 0.0059
140 2 38.10 1.17 0.0033 0.0001
141 5 174.29 1.91 0.0091 0.0005
141 5 455.25 5.10 0.0089 0.0013
141 5 970.17 11.42 0.0085 0.0028
141 5 180.84 3.20 0.0056 0.0005
141 5 194.74 3.75 0.0052 0.0006
142 5 1227.00 15.32 0.0080 0.0039
142 5 102.02 1.31 0.0078 0.0003
142 5 184.70 2.47 0.0075 0.0006
142 5 326.60 4.79 0.0068 0.0010
142 5 46.62 1.18 0.0040 0.0001
143 3 742.12 9.10 0.0082 0.0036
143 3 530.08 7.16 0.0074 0.0026
143 3 134.92 2.58 0.0052 0.0007
144 8 1829.90 21.86 0.0084 0.0036
144 8 579.11 8.16 0.0071 0.0011
144 8 283.82 5.41 0.0052 0.0006
144 8 54.59 1.22 0.0045 0.0001
144 8 173.62 3.92 0.0044 0.0003
144 8 43.52 1.07 0.0041 0.0001
144 8 64.36 1.71 0.0038 0.0001
144 8 43.39 1.27 0.0034 0.0001
145 7 357.18 3.19 0.0112 0.0010
145 7 464.35 4.85 0.0096 0.0012
145 7 807.34 13.40 0.0060 0.0022
145 7 102.07 1.82 0.0056 0.0003
145 7 157.34 3.31 0.0048 0.0004
145 7 56.58 1.29 0.0044 0.0002
145 7 27.08 1.54 0.0018 0.0001
146 4 637.50 8.91 0.0072 0.0021
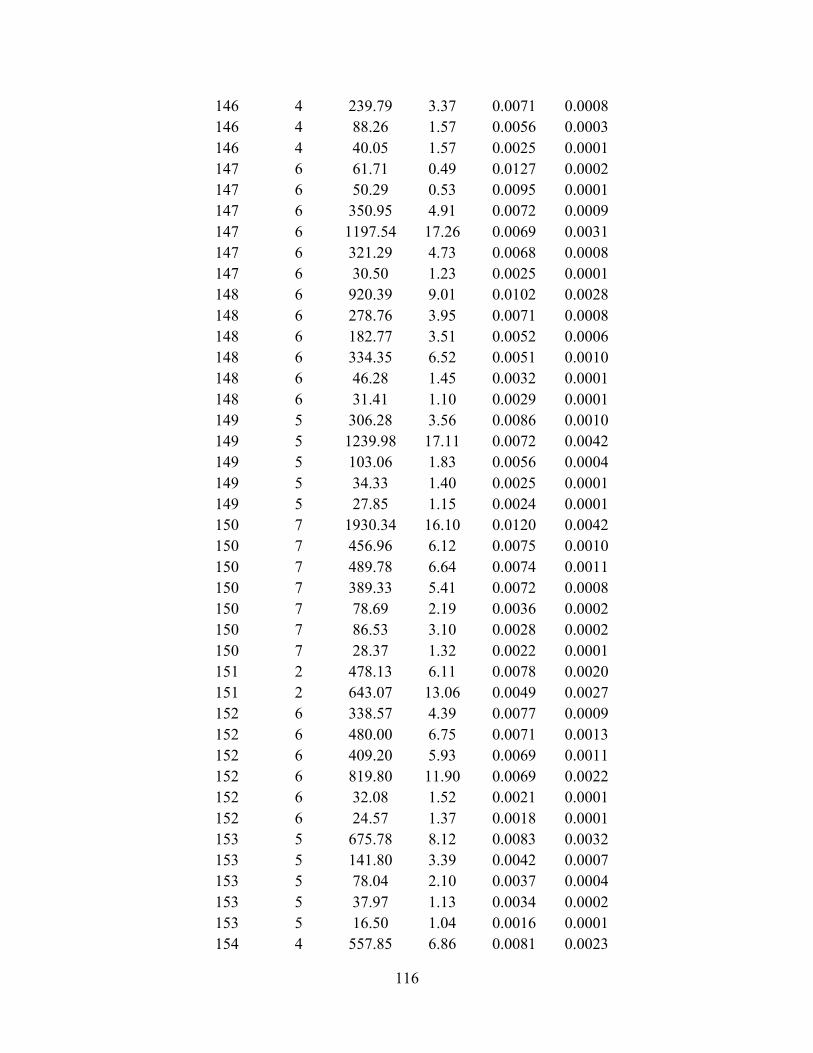
116
146 4 239.79 3.37 0.0071 0.0008
146 4 88.26 1.57 0.0056 0.0003
146 4 40.05 1.57 0.0025 0.0001
147 6 61.71 0.49 0.0127 0.0002
147 6 50.29 0.53 0.0095 0.0001
147 6 350.95 4.91 0.0072 0.0009
147 6 1197.54 17.26 0.0069 0.0031
147 6 321.29 4.73 0.0068 0.0008
147 6 30.50 1.23 0.0025 0.0001
148 6 920.39 9.01 0.0102 0.0028
148 6 278.76 3.95 0.0071 0.0008
148 6 182.77 3.51 0.0052 0.0006
148 6 334.35 6.52 0.0051 0.0010
148 6 46.28 1.45 0.0032 0.0001
148 6 31.41 1.10 0.0029 0.0001
149 5 306.28 3.56 0.0086 0.0010
149 5 1239.98 17.11 0.0072 0.0042
149 5 103.06 1.83 0.0056 0.0004
149 5 34.33 1.40 0.0025 0.0001
149 5 27.85 1.15 0.0024 0.0001
150 7 1930.34 16.10 0.0120 0.0042
150 7 456.96 6.12 0.0075 0.0010
150 7 489.78 6.64 0.0074 0.0011
150 7 389.33 5.41 0.0072 0.0008
150 7 78.69 2.19 0.0036 0.0002
150 7 86.53 3.10 0.0028 0.0002
150 7 28.37 1.32 0.0022 0.0001
151 2 478.13 6.11 0.0078 0.0020
151 2 643.07 13.06 0.0049 0.0027
152 6 338.57 4.39 0.0077 0.0009
152 6 480.00 6.75 0.0071 0.0013
152 6 409.20 5.93 0.0069 0.0011
152 6 819.80 11.90 0.0069 0.0022
152 6 32.08 1.52 0.0021 0.0001
152 6 24.57 1.37 0.0018 0.0001
153 5 675.78 8.12 0.0083 0.0032
153 5 141.80 3.39 0.0042 0.0007
153 5 78.04 2.10 0.0037 0.0004
153 5 37.97 1.13 0.0034 0.0002
153 5 16.50 1.04 0.0016 0.0001
154 4 557.85 6.86 0.0081 0.0023

117
154 4 293.18 5.34 0.0055 0.0012
154 4 166.26 3.48 0.0048 0.0007
154 4 98.55 2.95 0.0033 0.0004
155 5 172.17 1.54 0.0112 0.0008
155 5 528.52 6.41 0.0083 0.0024
155 5 250.60 4.27 0.0059 0.0011
155 5 35.04 1.05 0.0033 0.0002
155 5 68.69 2.14 0.0032 0.0003
156 4 202.25 1.26 0.0160 0.0006
156 4 571.84 4.99 0.0115 0.0018
156 4 2503.64 24.76 0.0101 0.0079
156 4 111.21 1.47 0.0076 0.0004
157 6 322.04 3.55 0.0091 0.0009
157 6 187.90 2.42 0.0078 0.0005
157 6 478.71 8.75 0.0055 0.0014
157 6 322.26 6.63 0.0049 0.0009
157 6 97.90 2.72 0.0036 0.0003
157 6 47.03 1.32 0.0035 0.0001
158 4 1354.51 10.82 0.0125 0.0027
158 4 1652.17 18.07 0.0091 0.0034
158 4 1094.75 12.15 0.0090 0.0022
158 4 458.03 5.79 0.0079 0.0009
159 8 518.05 1.00 0.0516 0.0008
159 8 474.83 3.97 0.0120 0.0007
159 8 354.46 4.23 0.0084 0.0006
159 8 1643.63 19.99 0.0082 0.0026
159 8 752.39 9.24 0.0081 0.0012
159 8 480.79 6.40 0.0075 0.0007
159 8 489.14 7.73 0.0063 0.0008
159 8 47.17 1.41 0.0033 0.0001
160 3 255.75 0.78 0.0327 0.0010
160 3 1674.46 15.76 0.0106 0.0068
160 3 555.03 7.23 0.0077 0.0023
161 2 4068.95 40.08 0.0102 0.0083
161 2 392.65 6.11 0.0064 0.0008
162 12 250.30 0.67 0.0373 0.0005
162 12 775.46 6.85 0.0113 0.0016
162 12 443.44 4.26 0.0104 0.0009
162 12 243.09 2.38 0.0102 0.0005
162 12 2685.29 30.27 0.0089 0.0054
162 12 620.24 7.73 0.0080 0.0012

118
162 12 369.29 4.88 0.0076 0.0007
162 12 339.98 5.01 0.0068 0.0007
162 12 117.20 2.41 0.0049 0.0002
162 12 53.04 1.48 0.0036 0.0001
162 12 39.47 1.15 0.0034 0.0001
162 12 22.05 1.07 0.0021 0.0000
163 2 1855.28 17.45 0.0106 0.0091
163 2 79.57 1.34 0.0059 0.0004
164 10 534.30 3.65 0.0146 0.0009
164 10 355.64 2.78 0.0128 0.0006
164 10 630.28 5.53 0.0114 0.0010
164 10 1251.00 14.17 0.0088 0.0020
164 10 462.08 5.63 0.0082 0.0007
164 10 1779.33 21.89 0.0081 0.0028
164 10 165.29 2.12 0.0078 0.0003
164 10 83.87 1.19 0.0070 0.0001
164 10 24.22 0.95 0.0026 0.0000
164 10 31.20 1.78 0.0018 0.0000
165 7 236.82 3.13 0.0076 0.0006
165 7 1254.86 16.93 0.0074 0.0033
165 7 570.66 7.79 0.0073 0.0015
165 7 62.05 1.09 0.0057 0.0002
165 7 53.69 1.10 0.0049 0.0001
165 7 146.36 3.94 0.0037 0.0004
165 7 19.01 0.98 0.0019 0.0000
166 6 306.71 3.29 0.0093 0.0010
166 6 491.03 5.59 0.0088 0.0015
166 6 484.43 5.54 0.0087 0.0015
166 6 488.42 5.93 0.0082 0.0015
166 6 624.04 8.40 0.0074 0.0019
166 6 62.76 2.26 0.0028 0.0002
167 5 1354.88 9.91 0.0137 0.0046
167 5 1179.98 10.52 0.0112 0.0040
167 5 266.32 4.17 0.0064 0.0009
167 5 77.67 1.49 0.0052 0.0003
167 5 59.23 1.98 0.0030 0.0002
168 3 3076.65 26.46 0.0116 0.0078
168 3 620.85 9.02 0.0069 0.0016
168 3 37.92 1.73 0.0022 0.0001
169 3 2532.26 19.04 0.0133 0.0050
169 3 3217.22 26.74 0.0120 0.0063
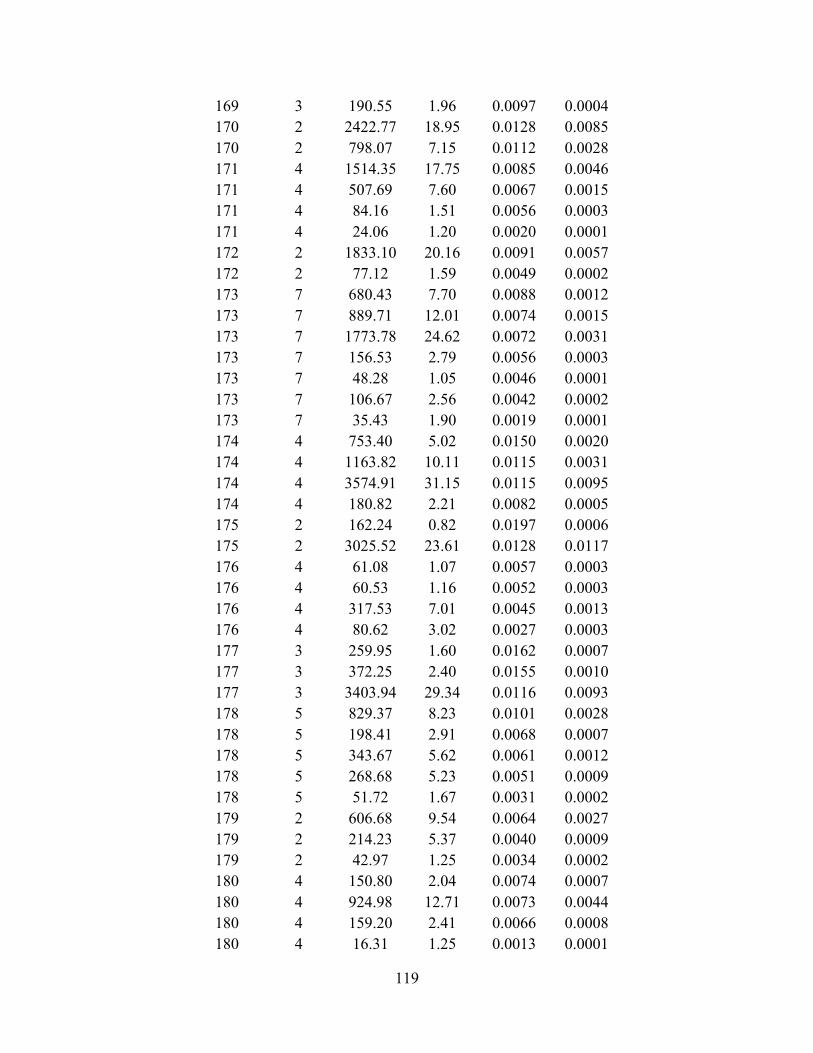
119
169 3 190.55 1.96 0.0097 0.0004
170 2 2422.77 18.95 0.0128 0.0085
170 2 798.07 7.15 0.0112 0.0028
171 4 1514.35 17.75 0.0085 0.0046
171 4 507.69 7.60 0.0067 0.0015
171 4 84.16 1.51 0.0056 0.0003
171 4 24.06 1.20 0.0020 0.0001
172 2 1833.10 20.16 0.0091 0.0057
172 2 77.12 1.59 0.0049 0.0002
173 7 680.43 7.70 0.0088 0.0012
173 7 889.71 12.01 0.0074 0.0015
173 7 1773.78 24.62 0.0072 0.0031
173 7 156.53 2.79 0.0056 0.0003
173 7 48.28 1.05 0.0046 0.0001
173 7 106.67 2.56 0.0042 0.0002
173 7 35.43 1.90 0.0019 0.0001
174 4 753.40 5.02 0.0150 0.0020
174 4 1163.82 10.11 0.0115 0.0031
174 4 3574.91 31.15 0.0115 0.0095
174 4 180.82 2.21 0.0082 0.0005
175 2 162.24 0.82 0.0197 0.0006
175 2 3025.52 23.61 0.0128 0.0117
176 4 61.08 1.07 0.0057 0.0003
176 4 60.53 1.16 0.0052 0.0003
176 4 317.53 7.01 0.0045 0.0013
176 4 80.62 3.02 0.0027 0.0003
177 3 259.95 1.60 0.0162 0.0007
177 3 372.25 2.40 0.0155 0.0010
177 3 3403.94 29.34 0.0116 0.0093
178 5 829.37 8.23 0.0101 0.0028
178 5 198.41 2.91 0.0068 0.0007
178 5 343.67 5.62 0.0061 0.0012
178 5 268.68 5.23 0.0051 0.0009
178 5 51.72 1.67 0.0031 0.0002
179 2 606.68 9.54 0.0064 0.0027
179 2 214.23 5.37 0.0040 0.0009
179 2 42.97 1.25 0.0034 0.0002
180 4 150.80 2.04 0.0074 0.0007
180 4 924.98 12.71 0.0073 0.0044
180 4 159.20 2.41 0.0066 0.0008
180 4 16.31 1.25 0.0013 0.0001
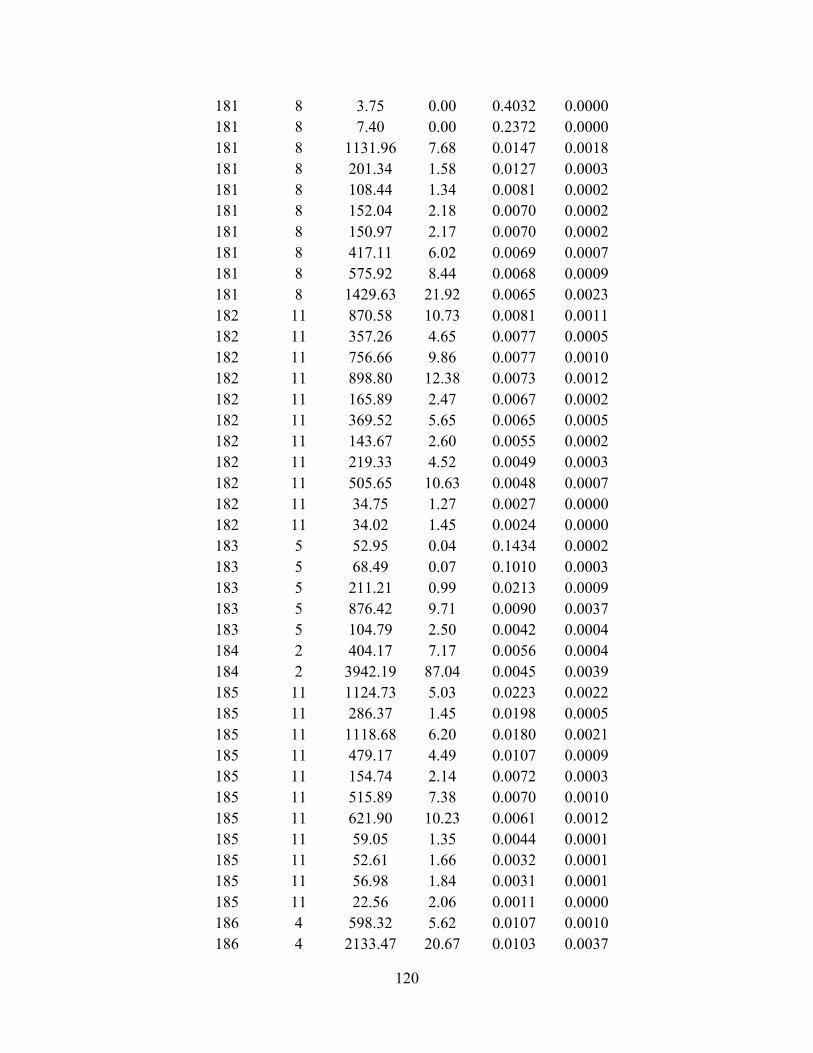
120
181 8 3.75 0.00 0.4032 0.0000
181 8 7.40 0.00 0.2372 0.0000
181 8 1131.96 7.68 0.0147 0.0018
181 8 201.34 1.58 0.0127 0.0003
181 8 108.44 1.34 0.0081 0.0002
181 8 152.04 2.18 0.0070 0.0002
181 8 150.97 2.17 0.0070 0.0002
181 8 417.11 6.02 0.0069 0.0007
181 8 575.92 8.44 0.0068 0.0009
181 8 1429.63 21.92 0.0065 0.0023
182 11 870.58 10.73 0.0081 0.0011
182 11 357.26 4.65 0.0077 0.0005
182 11 756.66 9.86 0.0077 0.0010
182 11 898.80 12.38 0.0073 0.0012
182 11 165.89 2.47 0.0067 0.0002
182 11 369.52 5.65 0.0065 0.0005
182 11 143.67 2.60 0.0055 0.0002
182 11 219.33 4.52 0.0049 0.0003
182 11 505.65 10.63 0.0048 0.0007
182 11 34.75 1.27 0.0027 0.0000
182 11 34.02 1.45 0.0024 0.0000
183 5 52.95 0.04 0.1434 0.0002
183 5 68.49 0.07 0.1010 0.0003
183 5 211.21 0.99 0.0213 0.0009
183 5 876.42 9.71 0.0090 0.0037
183 5 104.79 2.50 0.0042 0.0004
184 2 404.17 7.17 0.0056 0.0004
184 2 3942.19 87.04 0.0045 0.0039
185 11 1124.73 5.03 0.0223 0.0022
185 11 286.37 1.45 0.0198 0.0005
185 11 1118.68 6.20 0.0180 0.0021
185 11 479.17 4.49 0.0107 0.0009
185 11 154.74 2.14 0.0072 0.0003
185 11 515.89 7.38 0.0070 0.0010
185 11 621.90 10.23 0.0061 0.0012
185 11 59.05 1.35 0.0044 0.0001
185 11 52.61 1.66 0.0032 0.0001
185 11 56.98 1.84 0.0031 0.0001
185 11 22.56 2.06 0.0011 0.0000
186 4 598.32 5.62 0.0107 0.0010
186 4 2133.47 20.67 0.0103 0.0037
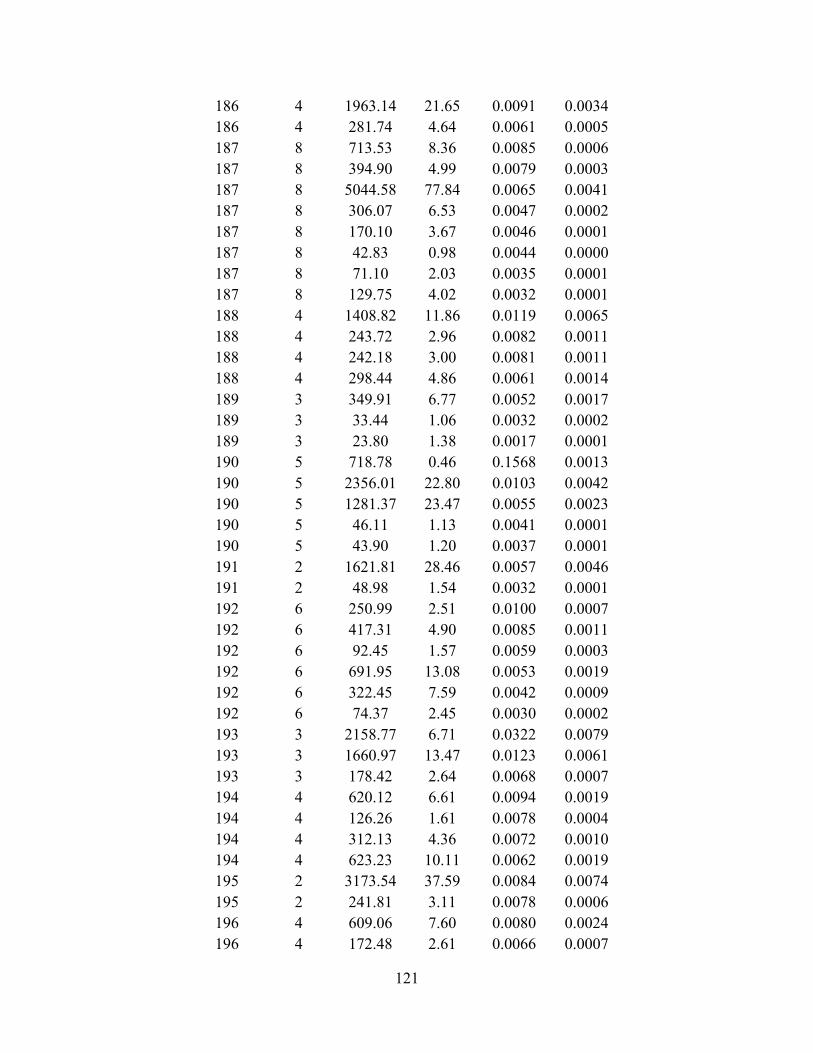
121
186 4 1963.14 21.65 0.0091 0.0034
186 4 281.74 4.64 0.0061 0.0005
187 8 713.53 8.36 0.0085 0.0006
187 8 394.90 4.99 0.0079 0.0003
187 8 5044.58 77.84 0.0065 0.0041
187 8 306.07 6.53 0.0047 0.0002
187 8 170.10 3.67 0.0046 0.0001
187 8 42.83 0.98 0.0044 0.0000
187 8 71.10 2.03 0.0035 0.0001
187 8 129.75 4.02 0.0032 0.0001
188 4 1408.82 11.86 0.0119 0.0065
188 4 243.72 2.96 0.0082 0.0011
188 4 242.18 3.00 0.0081 0.0011
188 4 298.44 4.86 0.0061 0.0014
189 3 349.91 6.77 0.0052 0.0017
189 3 33.44 1.06 0.0032 0.0002
189 3 23.80 1.38 0.0017 0.0001
190 5 718.78 0.46 0.1568 0.0013
190 5 2356.01 22.80 0.0103 0.0042
190 5 1281.37 23.47 0.0055 0.0023
190 5 46.11 1.13 0.0041 0.0001
190 5 43.90 1.20 0.0037 0.0001
191 2 1621.81 28.46 0.0057 0.0046
191 2 48.98 1.54 0.0032 0.0001
192 6 250.99 2.51 0.0100 0.0007
192 6 417.31 4.90 0.0085 0.0011
192 6 92.45 1.57 0.0059 0.0003
192 6 691.95 13.08 0.0053 0.0019
192 6 322.45 7.59 0.0042 0.0009
192 6 74.37 2.45 0.0030 0.0002
193 3 2158.77 6.71 0.0322 0.0079
193 3 1660.97 13.47 0.0123 0.0061
193 3 178.42 2.64 0.0068 0.0007
194 4 620.12 6.61 0.0094 0.0019
194 4 126.26 1.61 0.0078 0.0004
194 4 312.13 4.36 0.0072 0.0010
194 4 623.23 10.11 0.0062 0.0019
195 2 3173.54 37.59 0.0084 0.0074
195 2 241.81 3.11 0.0078 0.0006
196 4 609.06 7.60 0.0080 0.0024
196 4 172.48 2.61 0.0066 0.0007

122
196 4 278.68 5.31 0.0052 0.0011
196 4 253.29 6.08 0.0042 0.0010
197 6 652.20 6.30 0.0103 0.0011
197 6 2199.48 24.60 0.0089 0.0038
197 6 124.18 1.70 0.0073 0.0002
197 6 266.52 3.68 0.0072 0.0005
197 6 859.63 13.16 0.0065 0.0015
197 6 90.29 2.26 0.0040 0.0002
198 6 429.04 3.89 0.0110 0.0017
198 6 512.64 5.26 0.0097 0.0020
198 6 159.91 2.28 0.0070 0.0006
198 6 572.88 8.42 0.0068 0.0022
198 6 116.41 2.56 0.0046 0.0005
198 6 21.55 1.49 0.0014 0.0001
199 5 776.32 11.25 0.0069 0.0022
199 5 94.24 1.78 0.0053 0.0003
199 5 353.04 8.74 0.0040 0.0010
199 5 44.38 1.26 0.0035 0.0001
199 5 109.71 3.13 0.0035 0.0003
200 3 550.53 5.35 0.0103 0.0018
200 3 877.40 15.02 0.0058 0.0029
200 3 123.81 2.75 0.0045 0.0004
201 6 753.80 5.14 0.0147 0.0023
201 6 269.48 2.07 0.0130 0.0008
201 6 152.11 1.21 0.0125 0.0005
201 6 1003.82 8.43 0.0119 0.0030
201 6 465.56 4.19 0.0111 0.0014
201 6 532.54 6.43 0.0083 0.0016
202 3 1422.88 12.68 0.0112 0.0047
202 3 1112.12 10.28 0.0108 0.0037
202 3 551.75 5.66 0.0097 0.0018
203 5 361.34 3.66 0.0099 0.0014
203 5 257.46 3.10 0.0083 0.0010
203 5 467.20 7.71 0.0061 0.0018
203 5 41.29 1.03 0.0040 0.0002
203 5 14.72 1.00 0.0015 0.0001
204 5 414.41 4.10 0.0101 0.0012
204 5 1777.08 20.51 0.0087 0.0053
204 5 190.03 2.21 0.0086 0.0006
204 5 123.15 1.87 0.0066 0.0004
204 5 142.62 2.77 0.0051 0.0004

123
205 10 1973.20 9.46 0.0209 0.0027
205 10 375.43 3.52 0.0107 0.0005
205 10 1562.95 15.31 0.0102 0.0022
205 10 317.21 3.26 0.0097 0.0004
205 10 221.84 4.18 0.0053 0.0003
205 10 574.16 11.50 0.0050 0.0008
205 10 93.13 1.97 0.0047 0.0001
205 10 63.31 2.12 0.0030 0.0001
205 10 22.60 1.09 0.0021 0.0000
205 10 21.33 1.34 0.0016 0.0000
206 7 2268.19 20.22 0.0112 0.0021
206 7 2036.25 19.12 0.0106 0.0019
206 7 1906.56 19.76 0.0096 0.0018
206 7 1073.77 11.16 0.0096 0.0010
206 7 2553.58 26.58 0.0096 0.0024
206 7 1452.49 17.29 0.0084 0.0014
206 7 485.27 7.91 0.0061 0.0005
207 10 585.96 2.27 0.0258 0.0011
207 10 224.44 1.77 0.0127 0.0004
207 10 140.32 1.22 0.0115 0.0003
207 10 332.23 3.22 0.0103 0.0006
207 10 433.47 5.01 0.0086 0.0008
207 10 549.22 6.76 0.0081 0.0010
207 10 290.50 3.95 0.0074 0.0005
207 10 234.70 3.29 0.0071 0.0004
207 10 415.80 5.86 0.0071 0.0008
207 10 218.68 4.23 0.0052 0.0004
208 7 1441.63 14.72 0.0098 0.0041
208 7 139.76 1.71 0.0082 0.0004
208 7 101.41 1.40 0.0073 0.0003
208 7 184.52 2.57 0.0072 0.0005
208 7 445.17 6.97 0.0064 0.0013
208 7 88.24 1.64 0.0054 0.0003
208 7 41.76 1.11 0.0038 0.0001
209 3 1223.48 8.71 0.0140 0.0053
209 3 141.01 1.74 0.0081 0.0006
209 3 558.96 8.99 0.0062 0.0024
210 15 145.94 0.00 13.3011 0.0002
210 15 1454.24 10.11 0.0144 0.0018
210 15 327.67 2.33 0.0141 0.0004
210 15 1713.04 17.06 0.0100 0.0021

124
210 15 191.09 2.09 0.0091 0.0002
210 15 91.70 1.13 0.0081 0.0001
210 15 362.88 4.65 0.0078 0.0005
210 15 341.72 4.77 0.0072 0.0004
210 15 952.09 13.50 0.0071 0.0012
210 15 755.54 10.80 0.0070 0.0009
210 15 259.67 3.72 0.0070 0.0003
210 15 926.64 13.43 0.0069 0.0011
210 15 70.30 1.26 0.0056 0.0001
210 15 145.94 2.87 0.0051 0.0002
210 15 33.74 1.28 0.0026 0.0000
211 8 126.53 1.51 0.0084 0.0005
211 8 488.26 5.96 0.0082 0.0021
211 8 195.41 3.10 0.0063 0.0008
211 8 86.28 1.46 0.0059 0.0004
211 8 89.65 1.93 0.0047 0.0004
211 8 54.97 1.54 0.0036 0.0002
211 8 32.21 0.99 0.0033 0.0001
211 8 21.19 0.97 0.0022 0.0001
212 6 141.95 2.41 0.0059 0.0006
212 6 208.54 3.67 0.0057 0.0009
212 6 64.62 1.67 0.0039 0.0003
212 6 53.10 1.74 0.0031 0.0002
212 6 19.55 1.04 0.0019 0.0001
212 6 30.67 1.90 0.0016 0.0001
213 3 298.70 4.27 0.0070 0.0012
213 3 885.65 15.95 0.0056 0.0035
213 3 33.69 1.04 0.0032 0.0001
214 2 1388.28 19.91 0.0070 0.0032
214 2 729.32 10.78 0.0068 0.0017
215 5 187.87 2.96 0.0063 0.0008
215 5 154.91 2.55 0.0061 0.0007
215 5 205.52 4.25 0.0048 0.0009
215 5 61.01 1.91 0.0032 0.0003
215 5 30.17 2.35 0.0013 0.0001
216 2 2079.23 22.27 0.0093 0.0043
216 2 1779.39 21.18 0.0084 0.0037
217 4 562.38 4.00 0.0140 0.0015
217 4 378.30 3.02 0.0125 0.0010
217 4 1370.35 14.18 0.0097 0.0036
217 4 938.31 14.06 0.0067 0.0025

125
218 7 378.30 1.16 0.0327 0.0012
218 7 804.37 5.15 0.0156 0.0025
218 7 219.54 2.21 0.0099 0.0007
218 7 218.80 2.98 0.0073 0.0007
218 7 792.62 11.88 0.0067 0.0024
218 7 64.60 0.99 0.0065 0.0002
218 7 147.62 2.37 0.0062 0.0005
219 9 133.34 1.24 0.0108 0.0002
219 9 420.08 3.92 0.0107 0.0006
219 9 330.14 3.51 0.0094 0.0005
219 9 367.60 4.27 0.0086 0.0006
219 9 219.45 2.66 0.0083 0.0003
219 9 346.09 4.37 0.0079 0.0005
219 9 465.11 6.34 0.0073 0.0007
219 9 2083.37 32.55 0.0064 0.0031
219 9 109.72 1.72 0.0064 0.0002
220 5 1109.94 6.93 0.0160 0.0029
220 5 2205.49 16.82 0.0131 0.0057
220 5 570.65 6.11 0.0093 0.0015
220 5 266.44 3.54 0.0075 0.0007
220 5 32.91 1.30 0.0025 0.0001
221 4 2068.24 24.21 0.0085 0.0043
221 4 786.39 10.25 0.0077 0.0016
221 4 79.86 2.04 0.0039 0.0002
221 4 22.77 1.58 0.0014 0.0000
222 3 1303.44 9.54 0.0137 0.0033
222 3 947.04 14.05 0.0067 0.0024
222 3 14.04 0.97 0.0014 0.0000
223 5 1021.27 1.81 0.0565 0.0050
223 5 295.08 3.68 0.0080 0.0014
223 5 70.03 1.56 0.0045 0.0003
223 5 31.99 1.09 0.0029 0.0002
223 5 23.80 1.43 0.0017 0.0001
224 9 1626.06 19.07 0.0085 0.0024
224 9 610.89 7.47 0.0082 0.0009
224 9 120.57 1.54 0.0079 0.0002
224 9 1218.11 16.22 0.0075 0.0018
224 9 423.26 6.70 0.0063 0.0006
224 9 165.53 2.84 0.0058 0.0002
224 9 84.10 2.30 0.0037 0.0001
224 9 51.81 1.48 0.0035 0.0001

126
224 9 17.24 1.09 0.0016 0.0000
225 10 312.98 0.00 33.6932 0.0015
225 10 312.98 0.00 33.6921 0.0015
225 10 312.98 0.00 8.1406 0.0015
225 10 312.98 0.01 3.6882 0.0015
225 10 312.98 3.05 0.0103 0.0015
225 10 478.03 5.58 0.0086 0.0023
225 10 324.59 4.15 0.0078 0.0015
225 10 109.48 1.40 0.0078 0.0005
225 10 56.21 1.21 0.0046 0.0003
225 10 29.25 1.35 0.0022 0.0001
226 4 1415.84 8.82 0.0160 0.0069
226 4 994.88 6.58 0.0151 0.0049
226 4 96.24 1.66 0.0058 0.0005
226 4 47.07 1.22 0.0039 0.0002
227 3 864.43 13.32 0.0065 0.0038
227 3 46.45 1.46 0.0032 0.0002
227 3 98.79 3.25 0.0030 0.0004
228 9 555.05 3.02 0.0184 0.0022
228 9 502.35 2.87 0.0175 0.0020
228 9 540.64 3.10 0.0174 0.0022
228 9 371.53 2.15 0.0173 0.0015
228 9 356.81 2.18 0.0164 0.0014
228 9 220.15 1.45 0.0152 0.0009
228 9 328.19 2.17 0.0151 0.0013
228 9 246.00 1.87 0.0131 0.0010
228 9 317.02 2.65 0.0120 0.0013
229 5 920.02 6.47 0.0142 0.0011
229 5 1077.10 10.46 0.0103 0.0013
229 5 5285.99 60.52 0.0087 0.0064
229 5 41.03 1.32 0.0031 0.0000
229 5 30.34 1.00 0.0030 0.0000
230 4 875.49 3.13 0.0280 0.0035
230 4 1109.54 6.64 0.0167 0.0045
230 4 472.05 5.35 0.0088 0.0019
230 4 674.35 7.67 0.0088 0.0027
231 7 595.23 0.95 0.0626 0.0015
231 7 585.85 3.92 0.0149 0.0014
231 7 511.32 3.98 0.0128 0.0013
231 7 1652.28 16.37 0.0101 0.0041
231 7 351.88 5.54 0.0064 0.0009

127
231 7 41.34 1.09 0.0038 0.0001
231 7 58.13 1.62 0.0036 0.0001
232 3 424.08 7.18 0.0059 0.0016
232 3 349.40 7.28 0.0048 0.0013
232 3 34.19 0.97 0.0035 0.0001
233 4 595.23 4.18 0.0142 0.0026
233 4 698.90 5.35 0.0131 0.0031
233 4 282.66 3.22 0.0088 0.0013
233 4 696.79 8.56 0.0081 0.0031
234 6 779.17 6.62 0.0118 0.0025
234 6 134.10 1.70 0.0079 0.0004
234 6 1094.48 14.52 0.0075 0.0035
234 6 82.21 1.44 0.0057 0.0003
234 6 101.07 1.84 0.0055 0.0003
234 6 110.98 2.03 0.0055 0.0004
235 10 139.83 0.98 0.0143 0.0006
235 10 168.89 1.92 0.0088 0.0007
235 10 121.75 1.61 0.0076 0.0005
235 10 80.10 1.25 0.0064 0.0004
235 10 61.20 1.15 0.0053 0.0003
235 10 58.55 1.11 0.0053 0.0003
235 10 57.55 1.11 0.0052 0.0003
235 10 58.10 1.14 0.0051 0.0003
235 10 31.22 1.04 0.0030 0.0001
235 10 24.58 1.06 0.0023 0.0001
236 4 512.97 5.16 0.0099 0.0013
236 4 2076.79 24.91 0.0083 0.0054
236 4 76.18 1.17 0.0065 0.0002
236 4 152.93 3.28 0.0047 0.0004
237 4 434.00 0.95 0.0458 0.0021
237 4 1032.55 11.64 0.0089 0.0050
237 4 249.31 3.63 0.0069 0.0012
237 4 71.01 1.93 0.0037 0.0003
238 4 135.37 1.14 0.0118 0.0005
238 4 1367.22 17.75 0.0077 0.0052
238 4 33.18 1.06 0.0031 0.0001
238 4 36.02 1.32 0.0027 0.0001
239 9 204.23 1.56 0.0131 0.0004
239 9 586.30 4.53 0.0129 0.0011
239 9 990.25 8.28 0.0120 0.0019
239 9 924.34 9.05 0.0102 0.0018

128
239 9 392.69 3.87 0.0102 0.0008
239 9 336.72 3.87 0.0087 0.0006
239 9 397.37 4.60 0.0086 0.0008
239 9 368.25 5.64 0.0065 0.0007
239 9 41.45 1.10 0.0038 0.0001
240 2 1490.86 15.05 0.0099 0.0073
240 2 114.83 1.94 0.0059 0.0006
241 3 857.22 1.64 0.0523 0.0025
241 3 449.91 3.67 0.0123 0.0013
241 3 1801.24 25.91 0.0070 0.0053
242 10 487.22 1.56 0.0312 0.0003
242 10 4660.10 35.66 0.0131 0.0033
242 10 2012.85 21.56 0.0093 0.0014
242 10 1593.94 18.54 0.0086 0.0011
242 10 2279.83 31.84 0.0072 0.0016
242 10 1204.90 17.92 0.0067 0.0008
242 10 54.40 2.03 0.0027 0.0000
242 10 22.19 1.28 0.0017 0.0000
242 10 21.33 1.30 0.0016 0.0000
242 10 39.35 2.56 0.0015 0.0000
243 2 106.04 1.47 0.0072 0.0005
243 2 847.01 15.73 0.0054 0.0041
244 2 1770.79 22.47 0.0079 0.0067
244 2 62.22 1.34 0.0046 0.0002
245 2 2083.54 26.73 0.0078 0.0055
245 2 223.05 4.33 0.0051 0.0006
246 11 179.35 1.87 0.0096 0.0006
246 11 357.75 3.97 0.0090 0.0013
246 11 155.33 2.16 0.0072 0.0005
246 11 87.24 1.40 0.0062 0.0003
246 11 69.58 1.17 0.0060 0.0002
246 11 84.12 1.43 0.0059 0.0003
246 11 74.88 1.41 0.0053 0.0003
246 11 130.07 2.60 0.0050 0.0005
246 11 93.02 2.13 0.0044 0.0003
246 11 68.24 1.86 0.0037 0.0002
246 11 99.13 2.80 0.0035 0.0003
247 6 1140.48 4.66 0.0245 0.0028
247 6 968.28 11.21 0.0086 0.0024
247 6 274.49 3.81 0.0072 0.0007
247 6 722.54 11.60 0.0062 0.0018
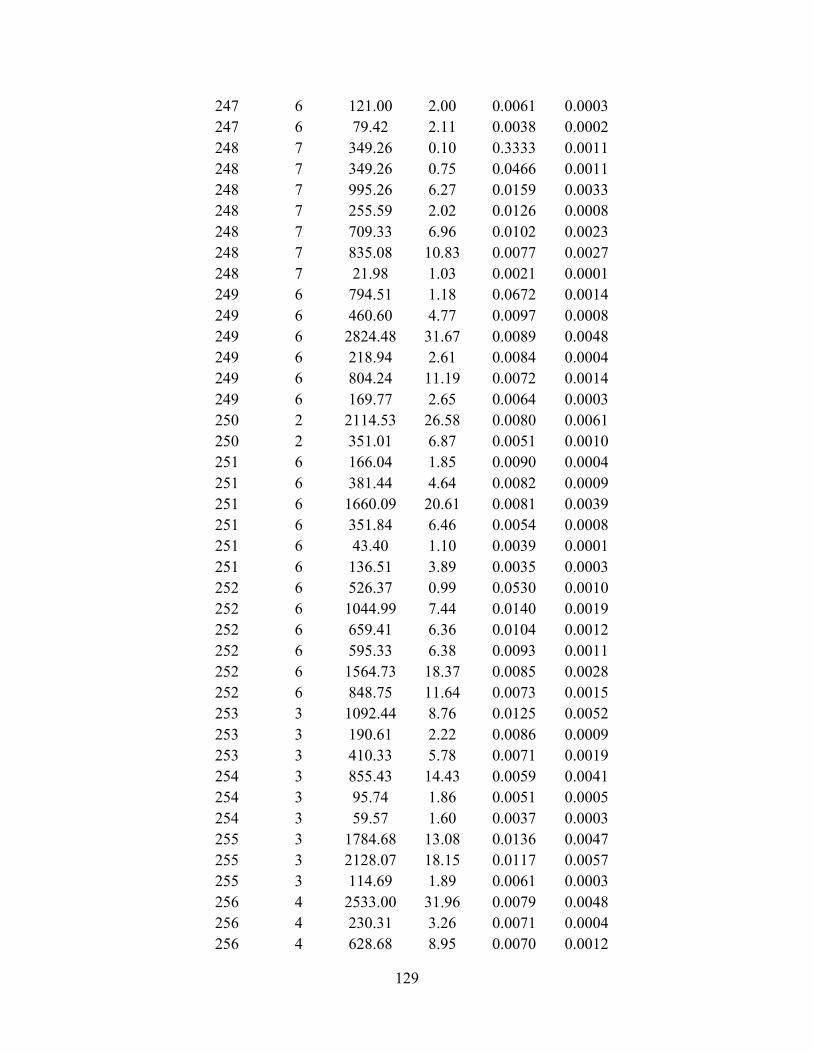
129
247 6 121.00 2.00 0.0061 0.0003
247 6 79.42 2.11 0.0038 0.0002
248 7 349.26 0.10 0.3333 0.0011
248 7 349.26 0.75 0.0466 0.0011
248 7 995.26 6.27 0.0159 0.0033
248 7 255.59 2.02 0.0126 0.0008
248 7 709.33 6.96 0.0102 0.0023
248 7 835.08 10.83 0.0077 0.0027
248 7 21.98 1.03 0.0021 0.0001
249 6 794.51 1.18 0.0672 0.0014
249 6 460.60 4.77 0.0097 0.0008
249 6 2824.48 31.67 0.0089 0.0048
249 6 218.94 2.61 0.0084 0.0004
249 6 804.24 11.19 0.0072 0.0014
249 6 169.77 2.65 0.0064 0.0003
250 2 2114.53 26.58 0.0080 0.0061
250 2 351.01 6.87 0.0051 0.0010
251 6 166.04 1.85 0.0090 0.0004
251 6 381.44 4.64 0.0082 0.0009
251 6 1660.09 20.61 0.0081 0.0039
251 6 351.84 6.46 0.0054 0.0008
251 6 43.40 1.10 0.0039 0.0001
251 6 136.51 3.89 0.0035 0.0003
252 6 526.37 0.99 0.0530 0.0010
252 6 1044.99 7.44 0.0140 0.0019
252 6 659.41 6.36 0.0104 0.0012
252 6 595.33 6.38 0.0093 0.0011
252 6 1564.73 18.37 0.0085 0.0028
252 6 848.75 11.64 0.0073 0.0015
253 3 1092.44 8.76 0.0125 0.0052
253 3 190.61 2.22 0.0086 0.0009
253 3 410.33 5.78 0.0071 0.0019
254 3 855.43 14.43 0.0059 0.0041
254 3 95.74 1.86 0.0051 0.0005
254 3 59.57 1.60 0.0037 0.0003
255 3 1784.68 13.08 0.0136 0.0047
255 3 2128.07 18.15 0.0117 0.0057
255 3 114.69 1.89 0.0061 0.0003
256 4 2533.00 31.96 0.0079 0.0048
256 4 230.31 3.26 0.0071 0.0004
256 4 628.68 8.95 0.0070 0.0012

130
256 4 53.20 1.14 0.0047 0.0001
257 6 553.62 4.99 0.0111 0.0016
257 6 674.37 7.32 0.0092 0.0019
257 6 140.18 1.67 0.0084 0.0004
257 6 290.07 3.90 0.0074 0.0008
257 6 716.18 9.82 0.0073 0.0020
257 6 52.73 1.60 0.0033 0.0001
258 5 1007.94 5.09 0.0198 0.0044
258 5 1089.92 10.51 0.0104 0.0048
258 5 113.88 1.58 0.0072 0.0005
258 5 125.52 1.91 0.0066 0.0005
258 5 76.91 2.19 0.0035 0.0003
259 7 240.19 2.56 0.0094 0.0010
259 7 118.85 1.66 0.0072 0.0005
259 7 692.51 9.96 0.0070 0.0029
259 7 67.05 1.58 0.0043 0.0003
259 7 45.72 1.40 0.0033 0.0002
259 7 38.43 1.34 0.0029 0.0002
259 7 15.24 0.96 0.0016 0.0001
260 4 136.13 2.08 0.0065 0.0005
260 4 566.79 9.20 0.0062 0.0022
260 4 405.85 8.43 0.0048 0.0016
260 4 19.55 1.86 0.0010 0.0001
261 5 607.94 6.78 0.0090 0.0018
261 5 289.39 4.10 0.0071 0.0009
261 5 109.89 1.65 0.0067 0.0003
261 5 133.78 2.31 0.0058 0.0004
261 5 631.58 11.65 0.0054 0.0019
262 8 255.59 1.33 0.0192 0.0004
262 8 2201.90 14.32 0.0154 0.0037
262 8 1747.58 14.79 0.0118 0.0029
262 8 811.98 9.26 0.0088 0.0014
262 8 105.04 1.28 0.0082 0.0002
262 8 191.34 2.57 0.0074 0.0003
262 8 390.23 5.64 0.0069 0.0007
262 8 85.00 1.27 0.0067 0.0001
263 10 379.58 2.38 0.0159 0.0011
263 10 367.80 2.48 0.0149 0.0011
263 10 233.55 1.64 0.0142 0.0007
263 10 326.73 2.65 0.0123 0.0010
263 10 208.07 1.70 0.0122 0.0006
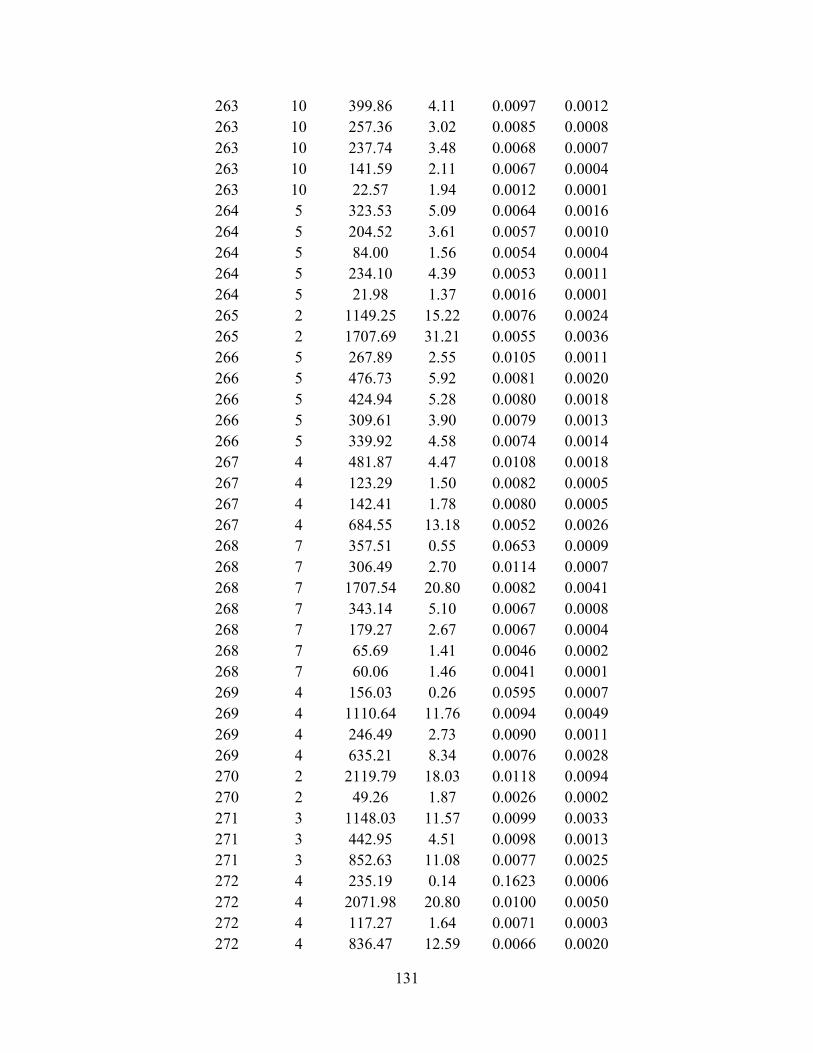
131
263 10 399.86 4.11 0.0097 0.0012
263 10 257.36 3.02 0.0085 0.0008
263 10 237.74 3.48 0.0068 0.0007
263 10 141.59 2.11 0.0067 0.0004
263 10 22.57 1.94 0.0012 0.0001
264 5 323.53 5.09 0.0064 0.0016
264 5 204.52 3.61 0.0057 0.0010
264 5 84.00 1.56 0.0054 0.0004
264 5 234.10 4.39 0.0053 0.0011
264 5 21.98 1.37 0.0016 0.0001
265 2 1149.25 15.22 0.0076 0.0024
265 2 1707.69 31.21 0.0055 0.0036
266 5 267.89 2.55 0.0105 0.0011
266 5 476.73 5.92 0.0081 0.0020
266 5 424.94 5.28 0.0080 0.0018
266 5 309.61 3.90 0.0079 0.0013
266 5 339.92 4.58 0.0074 0.0014
267 4 481.87 4.47 0.0108 0.0018
267 4 123.29 1.50 0.0082 0.0005
267 4 142.41 1.78 0.0080 0.0005
267 4 684.55 13.18 0.0052 0.0026
268 7 357.51 0.55 0.0653 0.0009
268 7 306.49 2.70 0.0114 0.0007
268 7 1707.54 20.80 0.0082 0.0041
268 7 343.14 5.10 0.0067 0.0008
268 7 179.27 2.67 0.0067 0.0004
268 7 65.69 1.41 0.0046 0.0002
268 7 60.06 1.46 0.0041 0.0001
269 4 156.03 0.26 0.0595 0.0007
269 4 1110.64 11.76 0.0094 0.0049
269 4 246.49 2.73 0.0090 0.0011
269 4 635.21 8.34 0.0076 0.0028
270 2 2119.79 18.03 0.0118 0.0094
270 2 49.26 1.87 0.0026 0.0002
271 3 1148.03 11.57 0.0099 0.0033
271 3 442.95 4.51 0.0098 0.0013
271 3 852.63 11.08 0.0077 0.0025
272 4 235.19 0.14 0.1623 0.0006
272 4 2071.98 20.80 0.0100 0.0050
272 4 117.27 1.64 0.0071 0.0003
272 4 836.47 12.59 0.0066 0.0020
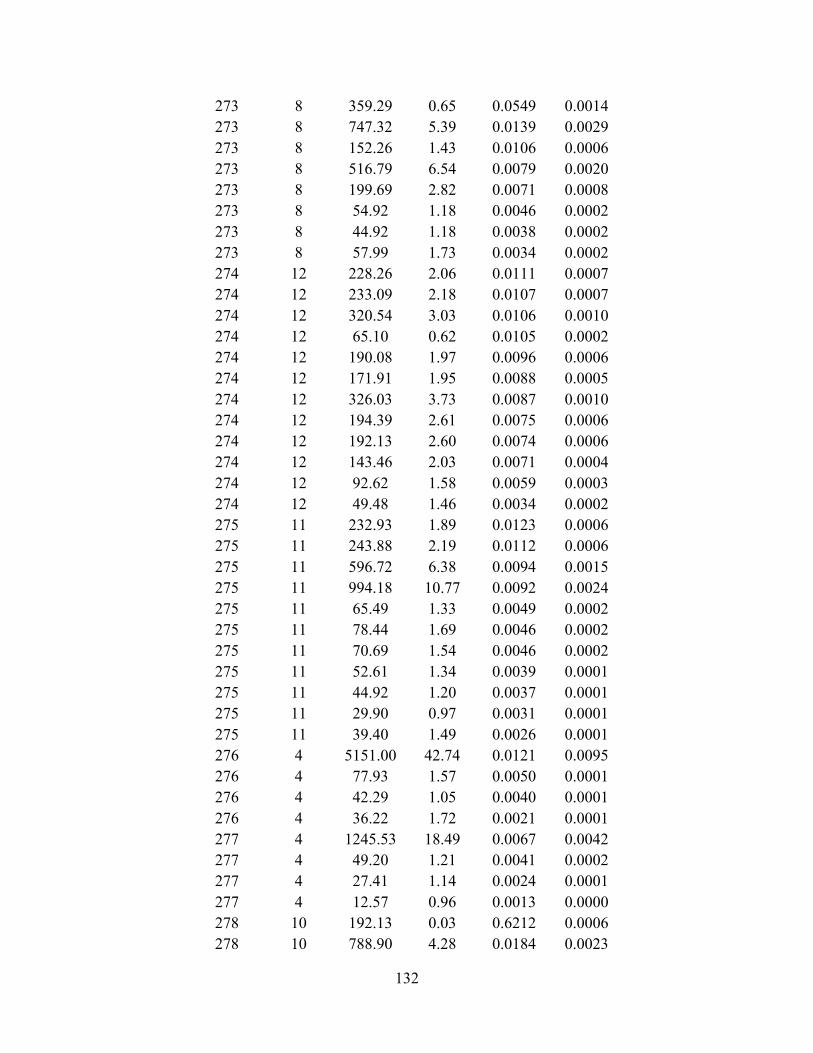
132
273 8 359.29 0.65 0.0549 0.0014
273 8 747.32 5.39 0.0139 0.0029
273 8 152.26 1.43 0.0106 0.0006
273 8 516.79 6.54 0.0079 0.0020
273 8 199.69 2.82 0.0071 0.0008
273 8 54.92 1.18 0.0046 0.0002
273 8 44.92 1.18 0.0038 0.0002
273 8 57.99 1.73 0.0034 0.0002
274 12 228.26 2.06 0.0111 0.0007
274 12 233.09 2.18 0.0107 0.0007
274 12 320.54 3.03 0.0106 0.0010
274 12 65.10 0.62 0.0105 0.0002
274 12 190.08 1.97 0.0096 0.0006
274 12 171.91 1.95 0.0088 0.0005
274 12 326.03 3.73 0.0087 0.0010
274 12 194.39 2.61 0.0075 0.0006
274 12 192.13 2.60 0.0074 0.0006
274 12 143.46 2.03 0.0071 0.0004
274 12 92.62 1.58 0.0059 0.0003
274 12 49.48 1.46 0.0034 0.0002
275 11 232.93 1.89 0.0123 0.0006
275 11 243.88 2.19 0.0112 0.0006
275 11 596.72 6.38 0.0094 0.0015
275 11 994.18 10.77 0.0092 0.0024
275 11 65.49 1.33 0.0049 0.0002
275 11 78.44 1.69 0.0046 0.0002
275 11 70.69 1.54 0.0046 0.0002
275 11 52.61 1.34 0.0039 0.0001
275 11 44.92 1.20 0.0037 0.0001
275 11 29.90 0.97 0.0031 0.0001
275 11 39.40 1.49 0.0026 0.0001
276 4 5151.00 42.74 0.0121 0.0095
276 4 77.93 1.57 0.0050 0.0001
276 4 42.29 1.05 0.0040 0.0001
276 4 36.22 1.72 0.0021 0.0001
277 4 1245.53 18.49 0.0067 0.0042
277 4 49.20 1.21 0.0041 0.0002
277 4 27.41 1.14 0.0024 0.0001
277 4 12.57 0.96 0.0013 0.0000
278 10 192.13 0.03 0.6212 0.0006
278 10 788.90 4.28 0.0184 0.0023
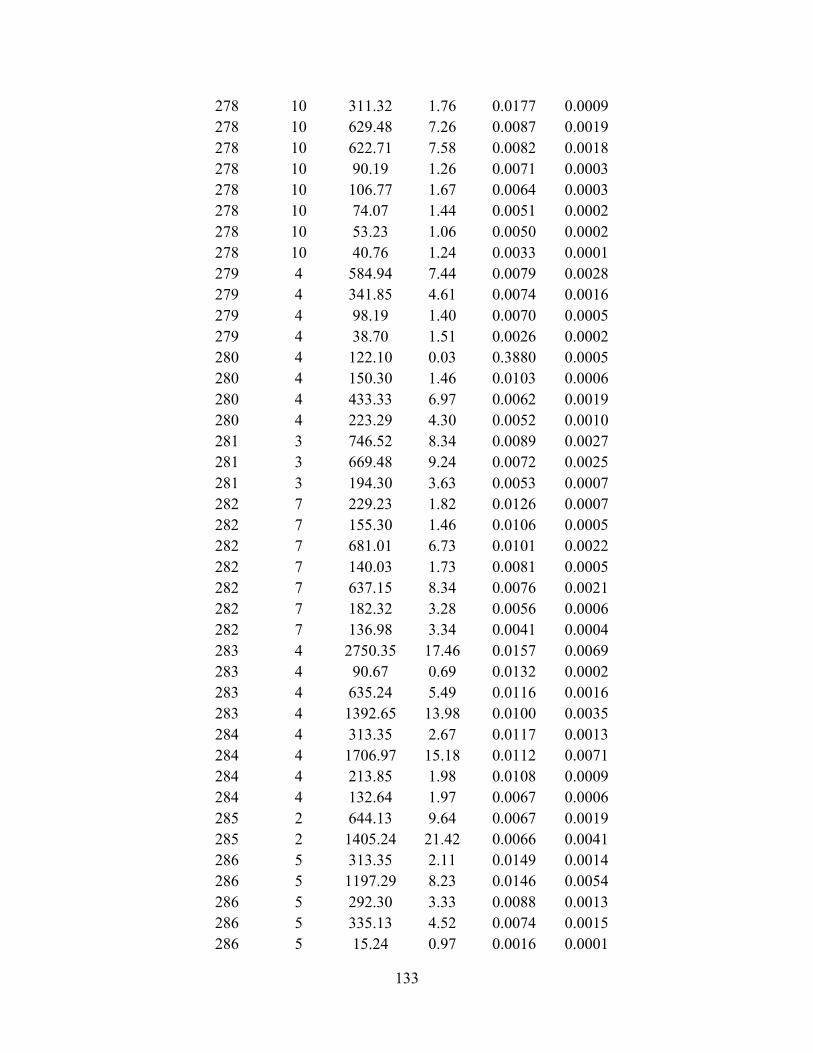
133
278 10 311.32 1.76 0.0177 0.0009
278 10 629.48 7.26 0.0087 0.0019
278 10 622.71 7.58 0.0082 0.0018
278 10 90.19 1.26 0.0071 0.0003
278 10 106.77 1.67 0.0064 0.0003
278 10 74.07 1.44 0.0051 0.0002
278 10 53.23 1.06 0.0050 0.0002
278 10 40.76 1.24 0.0033 0.0001
279 4 584.94 7.44 0.0079 0.0028
279 4 341.85 4.61 0.0074 0.0016
279 4 98.19 1.40 0.0070 0.0005
279 4 38.70 1.51 0.0026 0.0002
280 4 122.10 0.03 0.3880 0.0005
280 4 150.30 1.46 0.0103 0.0006
280 4 433.33 6.97 0.0062 0.0019
280 4 223.29 4.30 0.0052 0.0010
281 3 746.52 8.34 0.0089 0.0027
281 3 669.48 9.24 0.0072 0.0025
281 3 194.30 3.63 0.0053 0.0007
282 7 229.23 1.82 0.0126 0.0007
282 7 155.30 1.46 0.0106 0.0005
282 7 681.01 6.73 0.0101 0.0022
282 7 140.03 1.73 0.0081 0.0005
282 7 637.15 8.34 0.0076 0.0021
282 7 182.32 3.28 0.0056 0.0006
282 7 136.98 3.34 0.0041 0.0004
283 4 2750.35 17.46 0.0157 0.0069
283 4 90.67 0.69 0.0132 0.0002
283 4 635.24 5.49 0.0116 0.0016
283 4 1392.65 13.98 0.0100 0.0035
284 4 313.35 2.67 0.0117 0.0013
284 4 1706.97 15.18 0.0112 0.0071
284 4 213.85 1.98 0.0108 0.0009
284 4 132.64 1.97 0.0067 0.0006
285 2 644.13 9.64 0.0067 0.0019
285 2 1405.24 21.42 0.0066 0.0041
286 5 313.35 2.11 0.0149 0.0014
286 5 1197.29 8.23 0.0146 0.0054
286 5 292.30 3.33 0.0088 0.0013
286 5 335.13 4.52 0.0074 0.0015
286 5 15.24 0.97 0.0016 0.0001
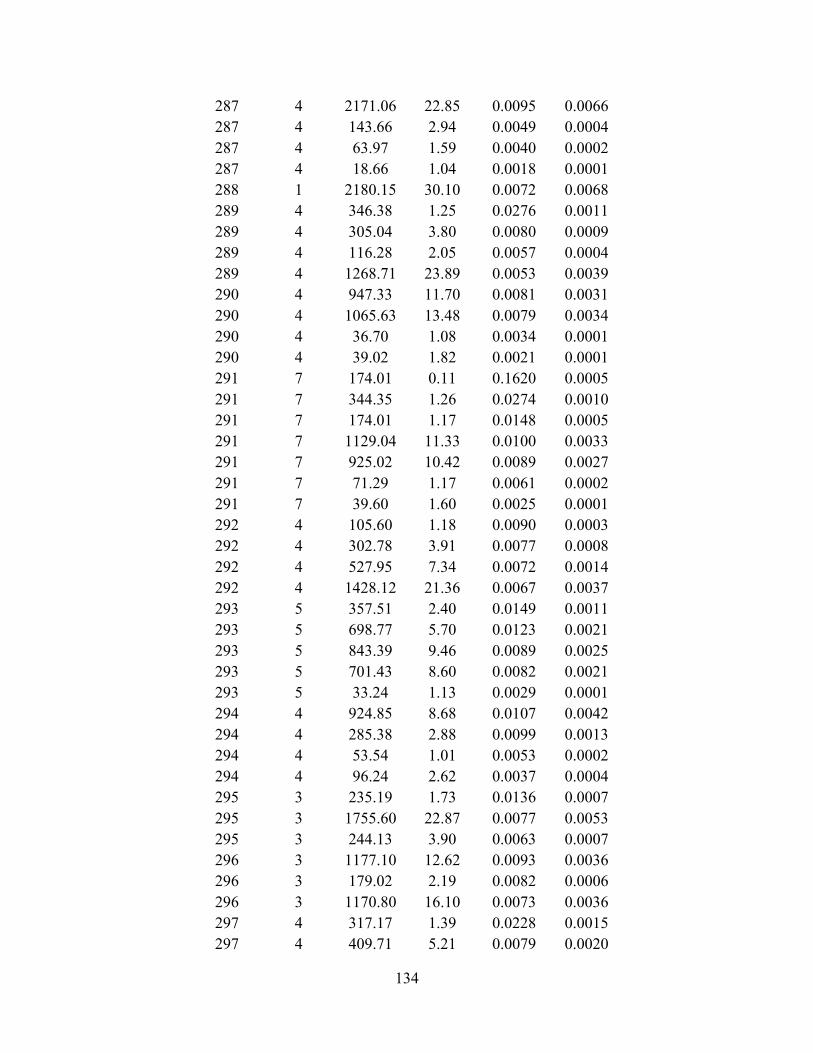
134
287 4 2171.06 22.85 0.0095 0.0066
287 4 143.66 2.94 0.0049 0.0004
287 4 63.97 1.59 0.0040 0.0002
287 4 18.66 1.04 0.0018 0.0001
288 1 2180.15 30.10 0.0072 0.0068
289 4 346.38 1.25 0.0276 0.0011
289 4 305.04 3.80 0.0080 0.0009
289 4 116.28 2.05 0.0057 0.0004
289 4 1268.71 23.89 0.0053 0.0039
290 4 947.33 11.70 0.0081 0.0031
290 4 1065.63 13.48 0.0079 0.0034
290 4 36.70 1.08 0.0034 0.0001
290 4 39.02 1.82 0.0021 0.0001
291 7 174.01 0.11 0.1620 0.0005
291 7 344.35 1.26 0.0274 0.0010
291 7 174.01 1.17 0.0148 0.0005
291 7 1129.04 11.33 0.0100 0.0033
291 7 925.02 10.42 0.0089 0.0027
291 7 71.29 1.17 0.0061 0.0002
291 7 39.60 1.60 0.0025 0.0001
292 4 105.60 1.18 0.0090 0.0003
292 4 302.78 3.91 0.0077 0.0008
292 4 527.95 7.34 0.0072 0.0014
292 4 1428.12 21.36 0.0067 0.0037
293 5 357.51 2.40 0.0149 0.0011
293 5 698.77 5.70 0.0123 0.0021
293 5 843.39 9.46 0.0089 0.0025
293 5 701.43 8.60 0.0082 0.0021
293 5 33.24 1.13 0.0029 0.0001
294 4 924.85 8.68 0.0107 0.0042
294 4 285.38 2.88 0.0099 0.0013
294 4 53.54 1.01 0.0053 0.0002
294 4 96.24 2.62 0.0037 0.0004
295 3 235.19 1.73 0.0136 0.0007
295 3 1755.60 22.87 0.0077 0.0053
295 3 244.13 3.90 0.0063 0.0007
296 3 1177.10 12.62 0.0093 0.0036
296 3 179.02 2.19 0.0082 0.0006
296 3 1170.80 16.10 0.0073 0.0036
297 4 317.17 1.39 0.0228 0.0015
297 4 409.71 5.21 0.0079 0.0020
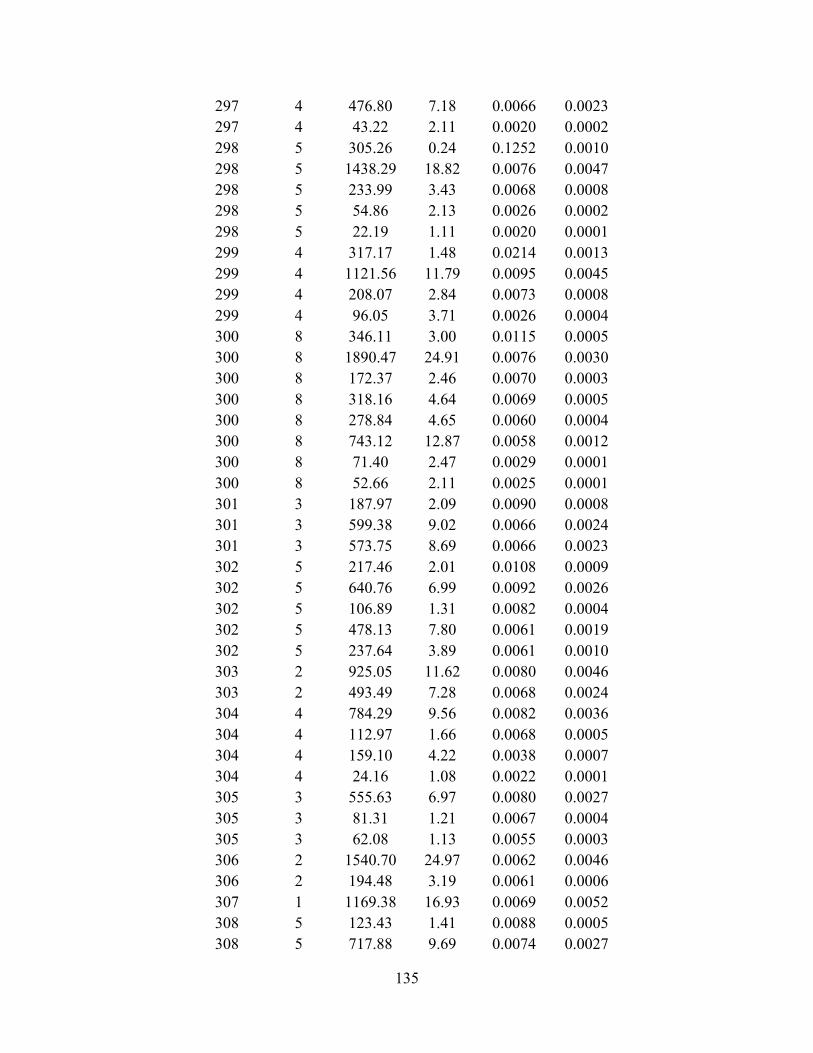
135
297 4 476.80 7.18 0.0066 0.0023
297 4 43.22 2.11 0.0020 0.0002
298 5 305.26 0.24 0.1252 0.0010
298 5 1438.29 18.82 0.0076 0.0047
298 5 233.99 3.43 0.0068 0.0008
298 5 54.86 2.13 0.0026 0.0002
298 5 22.19 1.11 0.0020 0.0001
299 4 317.17 1.48 0.0214 0.0013
299 4 1121.56 11.79 0.0095 0.0045
299 4 208.07 2.84 0.0073 0.0008
299 4 96.05 3.71 0.0026 0.0004
300 8 346.11 3.00 0.0115 0.0005
300 8 1890.47 24.91 0.0076 0.0030
300 8 172.37 2.46 0.0070 0.0003
300 8 318.16 4.64 0.0069 0.0005
300 8 278.84 4.65 0.0060 0.0004
300 8 743.12 12.87 0.0058 0.0012
300 8 71.40 2.47 0.0029 0.0001
300 8 52.66 2.11 0.0025 0.0001
301 3 187.97 2.09 0.0090 0.0008
301 3 599.38 9.02 0.0066 0.0024
301 3 573.75 8.69 0.0066 0.0023
302 5 217.46 2.01 0.0108 0.0009
302 5 640.76 6.99 0.0092 0.0026
302 5 106.89 1.31 0.0082 0.0004
302 5 478.13 7.80 0.0061 0.0019
302 5 237.64 3.89 0.0061 0.0010
303 2 925.05 11.62 0.0080 0.0046
303 2 493.49 7.28 0.0068 0.0024
304 4 784.29 9.56 0.0082 0.0036
304 4 112.97 1.66 0.0068 0.0005
304 4 159.10 4.22 0.0038 0.0007
304 4 24.16 1.08 0.0022 0.0001
305 3 555.63 6.97 0.0080 0.0027
305 3 81.31 1.21 0.0067 0.0004
305 3 62.08 1.13 0.0055 0.0003
306 2 1540.70 24.97 0.0062 0.0046
306 2 194.48 3.19 0.0061 0.0006
307 1 1169.38 16.93 0.0069 0.0052
308 5 123.43 1.41 0.0088 0.0005
308 5 717.88 9.69 0.0074 0.0027

136
308 5 141.61 1.94 0.0073 0.0005
308 5 407.64 6.76 0.0060 0.0015
308 5 70.35 1.20 0.0058 0.0003
309 7 523.66 9.95 0.0053 0.0015
309 7 151.41 2.91 0.0052 0.0004
309 7 210.57 4.85 0.0043 0.0006
309 7 82.46 2.11 0.0039 0.0002
309 7 47.61 1.34 0.0035 0.0001
309 7 41.25 1.23 0.0034 0.0001
309 7 19.28 1.31 0.0015 0.0001
310 11 319.62 1.81 0.0177 0.0003
310 11 244.88 3.04 0.0081 0.0002
310 11 3755.47 46.82 0.0080 0.0038
310 11 829.30 11.06 0.0075 0.0008
310 11 390.36 5.25 0.0074 0.0004
310 11 358.09 4.84 0.0074 0.0004
310 11 185.00 2.73 0.0068 0.0002
310 11 772.33 12.17 0.0063 0.0008
310 11 86.94 2.33 0.0037 0.0001
310 11 53.77 1.54 0.0035 0.0001
310 11 27.43 1.30 0.0021 0.0000
311 6 185.00 0.20 0.0945 0.0004
311 6 237.04 2.89 0.0082 0.0005
311 6 1656.50 20.50 0.0081 0.0034
311 6 153.28 2.12 0.0072 0.0003
311 6 1051.49 14.85 0.0071 0.0022
311 6 198.28 3.76 0.0053 0.0004
312 9 346.29 1.94 0.0179 0.0010
312 9 105.80 1.42 0.0075 0.0003
312 9 103.27 1.79 0.0058 0.0003
312 9 221.51 3.94 0.0056 0.0006
312 9 137.87 2.55 0.0054 0.0004
312 9 219.23 4.06 0.0054 0.0006
312 9 265.77 5.71 0.0047 0.0008
312 9 129.86 2.94 0.0044 0.0004
312 9 32.20 0.90 0.0036 0.0001
313 5 197.48 2.22 0.0089 0.0006
313 5 1741.44 20.88 0.0083 0.0050
313 5 311.98 4.30 0.0072 0.0009
313 5 71.39 1.90 0.0037 0.0002
313 5 24.06 1.06 0.0023 0.0001

137
314 2 1595.21 16.98 0.0094 0.0054
314 2 552.91 10.09 0.0055 0.0019
315 2 1369.07 13.52 0.0101 0.0060
315 2 430.59 7.08 0.0061 0.0019
316 5 531.01 2.38 0.0224 0.0015
316 5 507.45 5.21 0.0097 0.0014
316 5 1714.81 21.34 0.0080 0.0048
316 5 109.86 1.66 0.0066 0.0003
316 5 207.55 3.16 0.0066 0.0006
317 4 857.06 6.85 0.0125 0.0024
317 4 360.46 4.05 0.0089 0.0010
317 4 985.99 13.18 0.0075 0.0028
317 4 67.58 2.88 0.0023 0.0002
318 6 426.19 6.33 0.0067 0.0014
318 6 134.38 2.26 0.0060 0.0004
318 6 220.64 4.05 0.0054 0.0007
318 6 130.45 2.76 0.0047 0.0004
318 6 179.67 3.95 0.0045 0.0006
318 6 47.67 1.38 0.0035 0.0002
319 8 327.23 4.43 0.0074 0.0008
319 8 264.84 4.01 0.0066 0.0006
319 8 1123.71 17.14 0.0066 0.0026
319 8 94.28 1.81 0.0052 0.0002
319 8 131.90 2.54 0.0052 0.0003
319 8 44.00 1.13 0.0039 0.0001
319 8 33.74 1.02 0.0033 0.0001
319 8 83.99 3.09 0.0027 0.0002
320 3 1493.83 17.40 0.0086 0.0043
320 3 446.53 5.25 0.0085 0.0013
320 3 872.37 11.52 0.0076 0.0025
321 5 849.06 10.03 0.0085 0.0024
321 5 1240.64 16.85 0.0074 0.0035
321 5 128.30 3.01 0.0043 0.0004
321 5 24.35 1.12 0.0022 0.0001
321 5 26.53 1.35 0.0020 0.0001
322 4 260.73 3.70 0.0070 0.0011
322 4 520.93 8.14 0.0064 0.0022
322 4 125.28 2.71 0.0046 0.0005
322 4 22.07 1.13 0.0020 0.0001
323 3 489.16 1.63 0.0299 0.0016
323 3 1260.78 13.75 0.0092 0.0042

138
323 3 679.73 9.81 0.0069 0.0023
324 5 716.47 11.90 0.0060 0.0028
324 5 105.96 1.94 0.0055 0.0004
324 5 95.31 1.91 0.0050 0.0004
324 5 67.70 2.51 0.0027 0.0003
324 5 29.02 1.51 0.0019 0.0001
325 4 456.58 5.57 0.0082 0.0014
325 4 196.94 3.00 0.0066 0.0006
325 4 454.73 7.06 0.0064 0.0014
325 4 859.70 14.00 0.0061 0.0026
326 5 624.77 9.29 0.0067 0.0012
326 5 711.94 12.50 0.0057 0.0014
326 5 452.15 7.99 0.0057 0.0009
326 5 747.05 13.57 0.0055 0.0014
326 5 112.93 2.36 0.0048 0.0002
327 4 2375.51 30.53 0.0078 0.0057
327 4 274.13 3.72 0.0074 0.0007
327 4 109.46 2.83 0.0039 0.0003
327 4 82.50 2.67 0.0031 0.0002
328 3 916.98 11.09 0.0083 0.0032
328 3 634.87 10.24 0.0062 0.0022
328 3 22.19 1.06 0.0021 0.0001
329 5 462.43 4.58 0.0101 0.0014
329 5 93.79 1.41 0.0066 0.0003
329 5 613.27 9.36 0.0066 0.0019
329 5 473.87 8.19 0.0058 0.0014
329 5 250.46 5.35 0.0047 0.0008
330 3 5712.68 78.22 0.0073 0.0066
330 3 66.27 2.06 0.0032 0.0001
330 3 38.03 1.48 0.0026 0.0000
331 4 716.63 11.83 0.0061 0.0022
331 4 605.79 12.00 0.0050 0.0018
331 4 144.99 3.27 0.0044 0.0004
331 4 142.01 3.28 0.0043 0.0004
332 4 535.61 8.36 0.0064 0.0019
332 4 364.18 6.00 0.0061 0.0013
332 4 54.40 1.10 0.0050 0.0002
332 4 211.24 5.15 0.0041 0.0008
333 2 2847.59 35.72 0.0080 0.0057
333 2 149.02 1.89 0.0079 0.0003
334 7 488.90 2.46 0.0199 0.0014
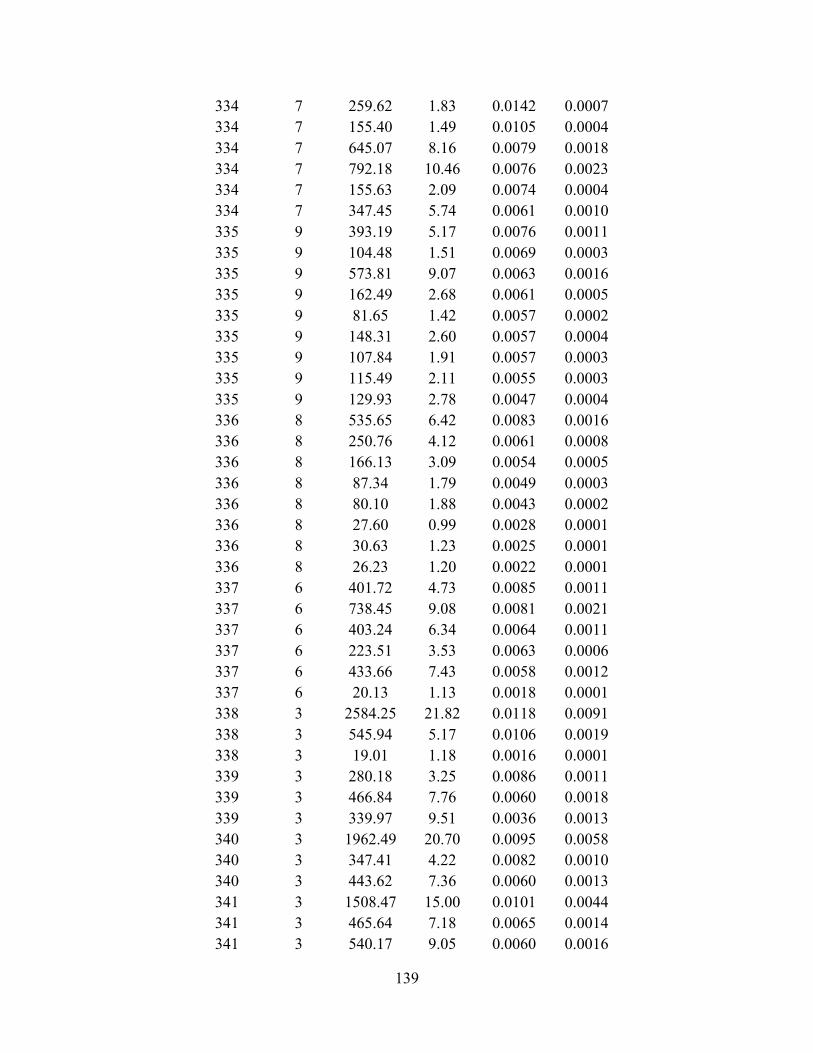
139
334 7 259.62 1.83 0.0142 0.0007
334 7 155.40 1.49 0.0105 0.0004
334 7 645.07 8.16 0.0079 0.0018
334 7 792.18 10.46 0.0076 0.0023
334 7 155.63 2.09 0.0074 0.0004
334 7 347.45 5.74 0.0061 0.0010
335 9 393.19 5.17 0.0076 0.0011
335 9 104.48 1.51 0.0069 0.0003
335 9 573.81 9.07 0.0063 0.0016
335 9 162.49 2.68 0.0061 0.0005
335 9 81.65 1.42 0.0057 0.0002
335 9 148.31 2.60 0.0057 0.0004
335 9 107.84 1.91 0.0057 0.0003
335 9 115.49 2.11 0.0055 0.0003
335 9 129.93 2.78 0.0047 0.0004
336 8 535.65 6.42 0.0083 0.0016
336 8 250.76 4.12 0.0061 0.0008
336 8 166.13 3.09 0.0054 0.0005
336 8 87.34 1.79 0.0049 0.0003
336 8 80.10 1.88 0.0043 0.0002
336 8 27.60 0.99 0.0028 0.0001
336 8 30.63 1.23 0.0025 0.0001
336 8 26.23 1.20 0.0022 0.0001
337 6 401.72 4.73 0.0085 0.0011
337 6 738.45 9.08 0.0081 0.0021
337 6 403.24 6.34 0.0064 0.0011
337 6 223.51 3.53 0.0063 0.0006
337 6 433.66 7.43 0.0058 0.0012
337 6 20.13 1.13 0.0018 0.0001
338 3 2584.25 21.82 0.0118 0.0091
338 3 545.94 5.17 0.0106 0.0019
338 3 19.01 1.18 0.0016 0.0001
339 3 280.18 3.25 0.0086 0.0011
339 3 466.84 7.76 0.0060 0.0018
339 3 339.97 9.51 0.0036 0.0013
340 3 1962.49 20.70 0.0095 0.0058
340 3 347.41 4.22 0.0082 0.0010
340 3 443.62 7.36 0.0060 0.0013
341 3 1508.47 15.00 0.0101 0.0044
341 3 465.64 7.18 0.0065 0.0014
341 3 540.17 9.05 0.0060 0.0016

140
342 6 381.80 3.67 0.0104 0.0008
342 6 376.76 5.01 0.0075 0.0008
342 6 1564.65 22.41 0.0070 0.0034
342 6 59.26 1.18 0.0050 0.0001
342 6 66.75 1.54 0.0043 0.0001
342 6 46.52 1.33 0.0035 0.0001
343 3 808.89 8.24 0.0098 0.0026
343 3 1247.93 13.04 0.0096 0.0041
343 3 437.53 7.06 0.0062 0.0014
344 6 409.08 4.26 0.0096 0.0016
344 6 760.05 10.64 0.0071 0.0030
344 6 88.34 1.71 0.0052 0.0003
344 6 59.86 1.23 0.0049 0.0002
344 6 59.57 1.29 0.0046 0.0002
344 6 110.11 3.34 0.0033 0.0004
345 3 217.58 1.33 0.0163 0.0010
345 3 1485.02 14.06 0.0106 0.0068
345 3 148.39 3.33 0.0045 0.0007
346 4 106.87 1.49 0.0072 0.0004
346 4 84.62 1.43 0.0059 0.0003
346 4 970.84 18.02 0.0054 0.0032
346 4 169.13 3.42 0.0049 0.0006
347 7 440.00 5.32 0.0083 0.0014
347 7 416.30 7.15 0.0058 0.0013
347 7 168.34 3.93 0.0043 0.0005
347 7 110.62 2.71 0.0041 0.0004
347 7 264.89 7.82 0.0034 0.0008
347 7 27.44 1.44 0.0019 0.0001
347 7 16.50 1.13 0.0015 0.0001
348 4 817.83 11.10 0.0074 0.0038
348 4 208.44 2.92 0.0071 0.0010
348 4 76.06 1.13 0.0068 0.0004
348 4 138.26 4.05 0.0034 0.0006
349 5 216.58 1.99 0.0109 0.0004
349 5 1837.90 26.20 0.0070 0.0037
349 5 93.99 1.75 0.0054 0.0002
349 5 171.20 4.04 0.0042 0.0003
349 5 67.40 1.91 0.0035 0.0001
350 6 83.31 1.07 0.0078 0.0003
350 6 662.94 9.50 0.0070 0.0026
350 6 252.96 3.79 0.0067 0.0010

141
350 6 299.19 4.61 0.0065 0.0012
350 6 111.26 2.21 0.0050 0.0004
350 6 24.38 1.01 0.0024 0.0001
351 5 212.02 2.05 0.0104 0.0010
351 5 636.28 7.06 0.0090 0.0029
351 5 141.28 2.41 0.0059 0.0006
351 5 263.29 5.64 0.0047 0.0012
351 5 15.24 1.10 0.0014 0.0001
352 3 208.09 2.61 0.0080 0.0004
352 3 2300.89 29.94 0.0077 0.0050
352 3 81.24 3.29 0.0025 0.0002
353 3 2275.93 25.13 0.0091 0.0077
353 3 181.30 2.20 0.0082 0.0006
353 3 141.61 1.76 0.0080 0.0005
354 9 139.96 1.84 0.0076 0.0003
354 9 112.08 1.67 0.0067 0.0002
354 9 394.12 6.30 0.0063 0.0008
354 9 309.73 5.02 0.0062 0.0007
354 9 642.50 10.73 0.0060 0.0014
354 9 140.37 2.92 0.0048 0.0003
354 9 82.81 2.12 0.0039 0.0002
354 9 63.73 2.69 0.0024 0.0001
354 9 25.13 1.23 0.0020 0.0001
355 5 459.41 6.89 0.0067 0.0019
355 5 291.49 4.54 0.0064 0.0012
355 5 92.57 1.51 0.0061 0.0004
355 5 167.91 3.52 0.0048 0.0007
355 5 75.45 2.16 0.0035 0.0003
356 5 274.50 4.31 0.0064 0.0011
356 5 326.31 5.42 0.0060 0.0013
356 5 369.72 6.86 0.0054 0.0015
356 5 165.41 3.61 0.0046 0.0007
356 5 138.03 3.38 0.0041 0.0005
357 4 496.08 5.65 0.0088 0.0021
357 4 415.34 5.83 0.0071 0.0018
357 4 159.51 3.43 0.0047 0.0007
357 4 194.30 5.31 0.0037 0.0008
358 4 115.50 1.70 0.0068 0.0006
358 4 124.09 2.26 0.0055 0.0006
358 4 150.91 3.47 0.0044 0.0007
358 4 78.07 2.53 0.0031 0.0004
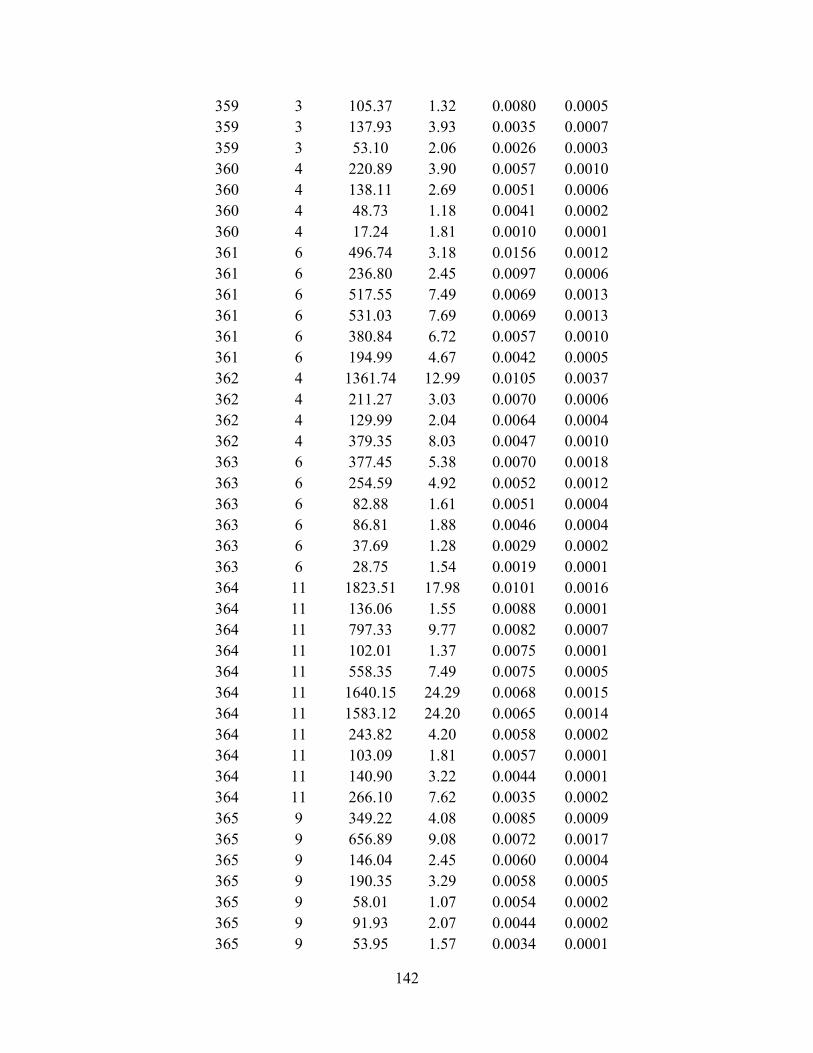
142
359 3 105.37 1.32 0.0080 0.0005
359 3 137.93 3.93 0.0035 0.0007
359 3 53.10 2.06 0.0026 0.0003
360 4 220.89 3.90 0.0057 0.0010
360 4 138.11 2.69 0.0051 0.0006
360 4 48.73 1.18 0.0041 0.0002
360 4 17.24 1.81 0.0010 0.0001
361 6 496.74 3.18 0.0156 0.0012
361 6 236.80 2.45 0.0097 0.0006
361 6 517.55 7.49 0.0069 0.0013
361 6 531.03 7.69 0.0069 0.0013
361 6 380.84 6.72 0.0057 0.0010
361 6 194.99 4.67 0.0042 0.0005
362 4 1361.74 12.99 0.0105 0.0037
362 4 211.27 3.03 0.0070 0.0006
362 4 129.99 2.04 0.0064 0.0004
362 4 379.35 8.03 0.0047 0.0010
363 6 377.45 5.38 0.0070 0.0018
363 6 254.59 4.92 0.0052 0.0012
363 6 82.88 1.61 0.0051 0.0004
363 6 86.81 1.88 0.0046 0.0004
363 6 37.69 1.28 0.0029 0.0002
363 6 28.75 1.54 0.0019 0.0001
364 11 1823.51 17.98 0.0101 0.0016
364 11 136.06 1.55 0.0088 0.0001
364 11 797.33 9.77 0.0082 0.0007
364 11 102.01 1.37 0.0075 0.0001
364 11 558.35 7.49 0.0075 0.0005
364 11 1640.15 24.29 0.0068 0.0015
364 11 1583.12 24.20 0.0065 0.0014
364 11 243.82 4.20 0.0058 0.0002
364 11 103.09 1.81 0.0057 0.0001
364 11 140.90 3.22 0.0044 0.0001
364 11 266.10 7.62 0.0035 0.0002
365 9 349.22 4.08 0.0085 0.0009
365 9 656.89 9.08 0.0072 0.0017
365 9 146.04 2.45 0.0060 0.0004
365 9 190.35 3.29 0.0058 0.0005
365 9 58.01 1.07 0.0054 0.0002
365 9 91.93 2.07 0.0044 0.0002
365 9 53.95 1.57 0.0034 0.0001

143
365 9 23.69 0.94 0.0025 0.0001
365 9 30.03 2.13 0.0014 0.0001
366 6 94.81 1.56 0.0061 0.0004
366 6 392.83 7.74 0.0051 0.0016
366 6 84.67 1.90 0.0045 0.0004
366 6 43.39 1.13 0.0039 0.0002
366 6 54.55 2.12 0.0026 0.0002
366 6 42.21 2.93 0.0014 0.0002
367 9 1234.23 13.38 0.0092 0.0024
367 9 242.10 2.74 0.0088 0.0005
367 9 731.19 8.99 0.0081 0.0014
367 9 484.04 7.05 0.0069 0.0009
367 9 197.89 3.32 0.0060 0.0004
367 9 64.23 1.34 0.0048 0.0001
367 9 83.14 2.02 0.0041 0.0002
367 9 59.60 1.59 0.0037 0.0001
367 9 90.76 2.91 0.0031 0.0002
368 4 270.85 3.00 0.0090 0.0009
368 4 194.73 2.55 0.0076 0.0007
368 4 482.80 7.11 0.0068 0.0016
368 4 83.03 2.26 0.0037 0.0003
369 6 1751.76 22.74 0.0077 0.0035
369 6 792.40 13.05 0.0061 0.0016
369 6 66.71 2.32 0.0029 0.0001
369 6 26.72 1.07 0.0025 0.0001
369 6 18.54 0.95 0.0019 0.0000
369 6 15.24 1.10 0.0014 0.0000
370 13 325.56 1.06 0.0308 0.0005
370 13 492.94 3.01 0.0164 0.0007
370 13 328.10 2.10 0.0157 0.0005
370 13 1471.27 11.23 0.0131 0.0020
370 13 206.18 1.70 0.0121 0.0003
370 13 433.01 4.41 0.0098 0.0006
370 13 895.92 13.18 0.0068 0.0012
370 13 114.41 1.69 0.0068 0.0002
370 13 1001.18 16.93 0.0059 0.0014
370 13 76.23 3.03 0.0025 0.0001
370 13 25.07 1.09 0.0023 0.0000
370 13 24.94 1.11 0.0022 0.0000
370 13 24.88 1.96 0.0013 0.0000
371 6 117.53 0.00 28.6150 0.0004
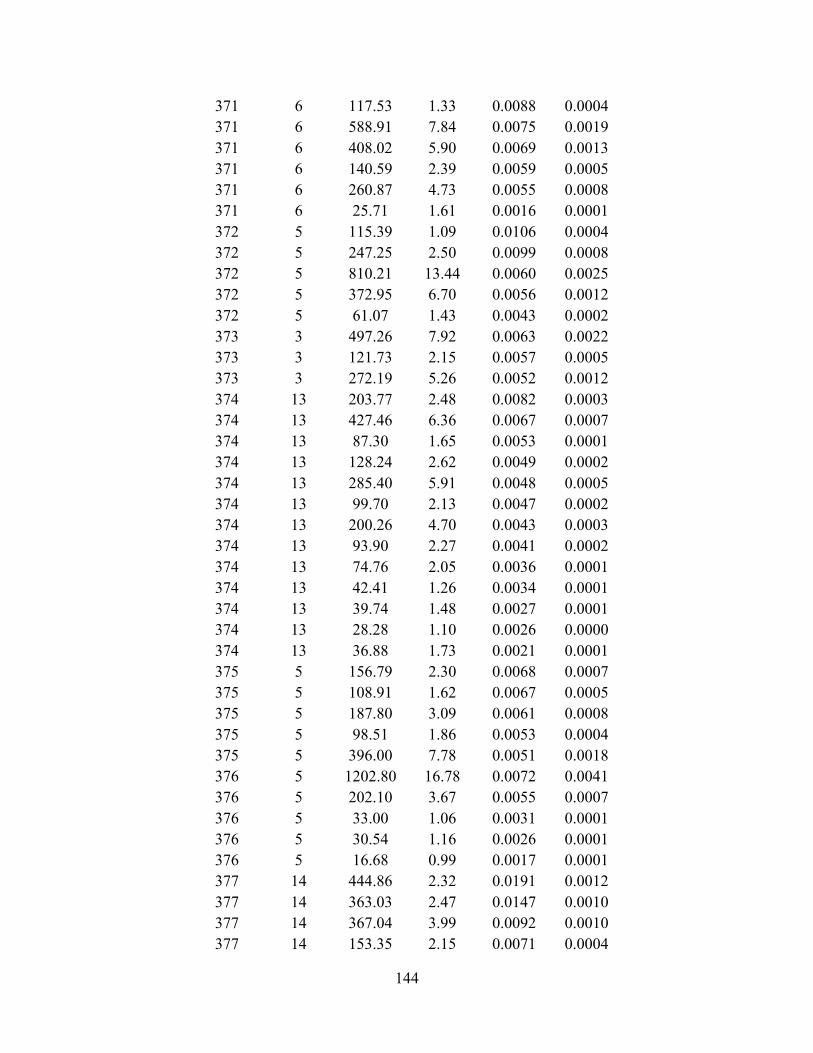
144
371 6 117.53 1.33 0.0088 0.0004
371 6 588.91 7.84 0.0075 0.0019
371 6 408.02 5.90 0.0069 0.0013
371 6 140.59 2.39 0.0059 0.0005
371 6 260.87 4.73 0.0055 0.0008
371 6 25.71 1.61 0.0016 0.0001
372 5 115.39 1.09 0.0106 0.0004
372 5 247.25 2.50 0.0099 0.0008
372 5 810.21 13.44 0.0060 0.0025
372 5 372.95 6.70 0.0056 0.0012
372 5 61.07 1.43 0.0043 0.0002
373 3 497.26 7.92 0.0063 0.0022
373 3 121.73 2.15 0.0057 0.0005
373 3 272.19 5.26 0.0052 0.0012
374 13 203.77 2.48 0.0082 0.0003
374 13 427.46 6.36 0.0067 0.0007
374 13 87.30 1.65 0.0053 0.0001
374 13 128.24 2.62 0.0049 0.0002
374 13 285.40 5.91 0.0048 0.0005
374 13 99.70 2.13 0.0047 0.0002
374 13 200.26 4.70 0.0043 0.0003
374 13 93.90 2.27 0.0041 0.0002
374 13 74.76 2.05 0.0036 0.0001
374 13 42.41 1.26 0.0034 0.0001
374 13 39.74 1.48 0.0027 0.0001
374 13 28.28 1.10 0.0026 0.0000
374 13 36.88 1.73 0.0021 0.0001
375 5 156.79 2.30 0.0068 0.0007
375 5 108.91 1.62 0.0067 0.0005
375 5 187.80 3.09 0.0061 0.0008
375 5 98.51 1.86 0.0053 0.0004
375 5 396.00 7.78 0.0051 0.0018
376 5 1202.80 16.78 0.0072 0.0041
376 5 202.10 3.67 0.0055 0.0007
376 5 33.00 1.06 0.0031 0.0001
376 5 30.54 1.16 0.0026 0.0001
376 5 16.68 0.99 0.0017 0.0001
377 14 444.86 2.32 0.0191 0.0012
377 14 363.03 2.47 0.0147 0.0010
377 14 367.04 3.99 0.0092 0.0010
377 14 153.35 2.15 0.0071 0.0004
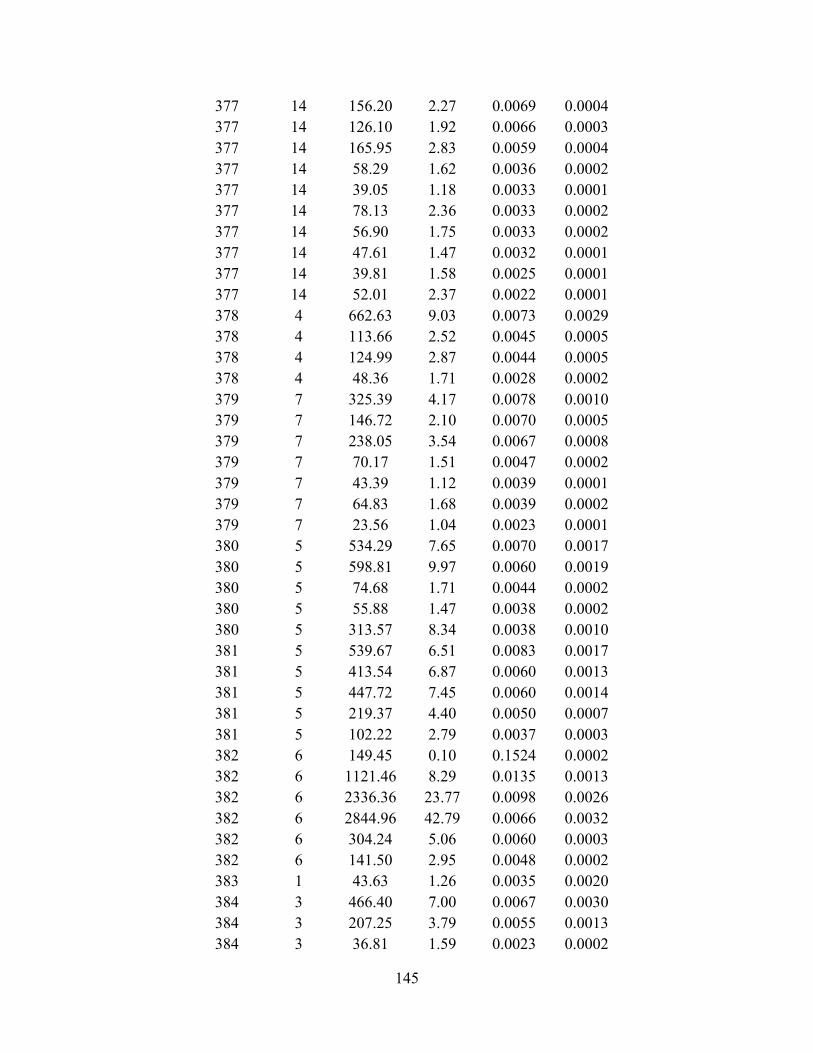
145
377 14 156.20 2.27 0.0069 0.0004
377 14 126.10 1.92 0.0066 0.0003
377 14 165.95 2.83 0.0059 0.0004
377 14 58.29 1.62 0.0036 0.0002
377 14 39.05 1.18 0.0033 0.0001
377 14 78.13 2.36 0.0033 0.0002
377 14 56.90 1.75 0.0033 0.0002
377 14 47.61 1.47 0.0032 0.0001
377 14 39.81 1.58 0.0025 0.0001
377 14 52.01 2.37 0.0022 0.0001
378 4 662.63 9.03 0.0073 0.0029
378 4 113.66 2.52 0.0045 0.0005
378 4 124.99 2.87 0.0044 0.0005
378 4 48.36 1.71 0.0028 0.0002
379 7 325.39 4.17 0.0078 0.0010
379 7 146.72 2.10 0.0070 0.0005
379 7 238.05 3.54 0.0067 0.0008
379 7 70.17 1.51 0.0047 0.0002
379 7 43.39 1.12 0.0039 0.0001
379 7 64.83 1.68 0.0039 0.0002
379 7 23.56 1.04 0.0023 0.0001
380 5 534.29 7.65 0.0070 0.0017
380 5 598.81 9.97 0.0060 0.0019
380 5 74.68 1.71 0.0044 0.0002
380 5 55.88 1.47 0.0038 0.0002
380 5 313.57 8.34 0.0038 0.0010
381 5 539.67 6.51 0.0083 0.0017
381 5 413.54 6.87 0.0060 0.0013
381 5 447.72 7.45 0.0060 0.0014
381 5 219.37 4.40 0.0050 0.0007
381 5 102.22 2.79 0.0037 0.0003
382 6 149.45 0.10 0.1524 0.0002
382 6 1121.46 8.29 0.0135 0.0013
382 6 2336.36 23.77 0.0098 0.0026
382 6 2844.96 42.79 0.0066 0.0032
382 6 304.24 5.06 0.0060 0.0003
382 6 141.50 2.95 0.0048 0.0002
383 1 43.63 1.26 0.0035 0.0020
384 3 466.40 7.00 0.0067 0.0030
384 3 207.25 3.79 0.0055 0.0013
384 3 36.81 1.59 0.0023 0.0002

146
385 11 237.60 1.75 0.0136 0.0005
385 11 760.13 5.83 0.0130 0.0015
385 11 195.43 1.55 0.0126 0.0004
385 11 240.65 2.08 0.0116 0.0005
385 11 573.06 6.05 0.0095 0.0012
385 11 419.72 4.76 0.0088 0.0009
385 11 857.48 10.48 0.0082 0.0017
385 11 270.33 3.73 0.0073 0.0005
385 11 345.38 5.34 0.0065 0.0007
385 11 85.62 1.83 0.0047 0.0002
385 11 155.83 3.48 0.0045 0.0003
386 9 422.10 5.37 0.0079 0.0010
386 9 132.81 1.82 0.0073 0.0003
386 9 1039.46 15.72 0.0066 0.0024
386 9 302.71 4.65 0.0065 0.0007
386 9 186.13 3.24 0.0057 0.0004
386 9 102.50 1.88 0.0055 0.0002
386 9 160.22 4.07 0.0039 0.0004
386 9 66.07 2.27 0.0029 0.0002
386 9 18.54 1.70 0.0011 0.0000
387 17 913.33 5.55 0.0165 0.0005
387 17 3945.00 36.16 0.0109 0.0021
387 17 4280.66 39.25 0.0109 0.0023
387 17 1233.33 11.31 0.0109 0.0007
387 17 195.38 1.96 0.0100 0.0001
387 17 2590.66 26.55 0.0098 0.0014
387 17 123.59 1.27 0.0097 0.0001
387 17 4227.43 46.73 0.0090 0.0022
387 17 124.61 1.54 0.0081 0.0001
387 17 383.46 4.93 0.0078 0.0002
387 17 430.73 6.66 0.0065 0.0002
387 17 129.65 2.16 0.0060 0.0001
387 17 89.03 1.70 0.0052 0.0000
387 17 121.15 2.61 0.0046 0.0001
387 17 31.50 1.30 0.0024 0.0000
387 17 46.21 2.06 0.0022 0.0000
387 17 26.88 1.24 0.0022 0.0000
388 13 8501.15 104.05 0.0082 0.0045
388 13 2013.74 25.41 0.0079 0.0011
388 13 1410.68 20.33 0.0069 0.0007
388 13 456.65 8.10 0.0056 0.0002
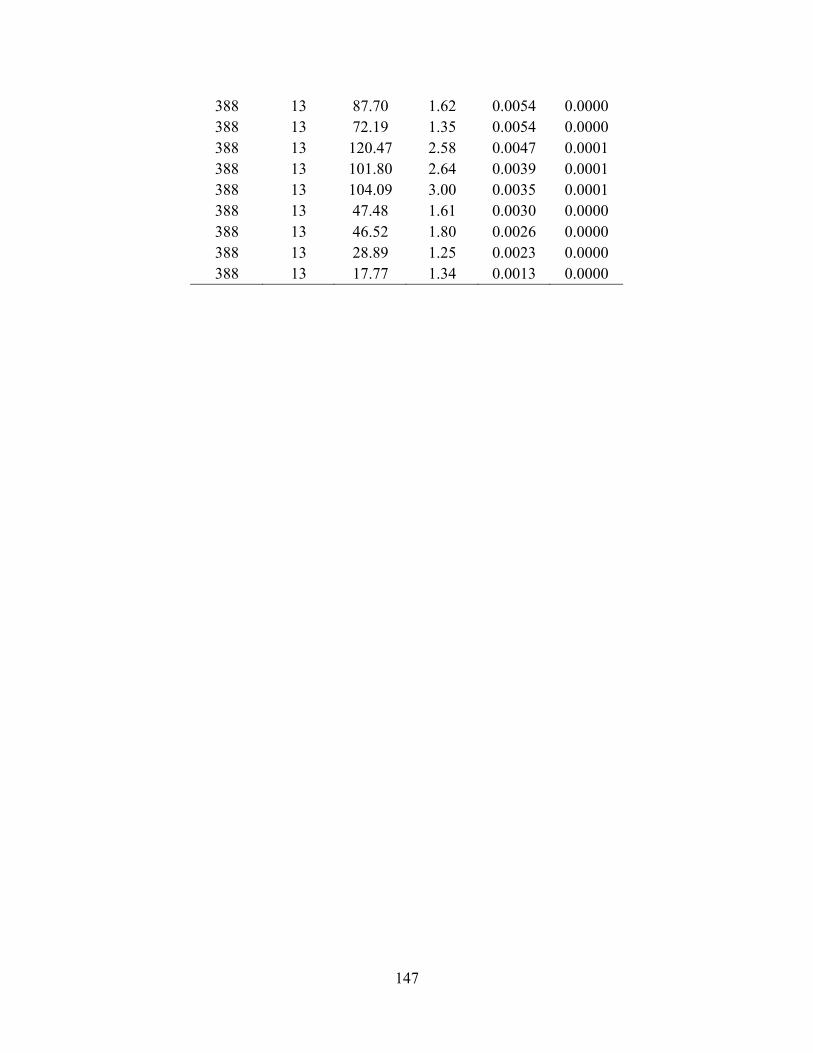
147
388 13 87.70 1.62 0.0054 0.0000
388 13 72.19 1.35 0.0054 0.0000
388 13 120.47 2.58 0.0047 0.0001
388 13 101.80 2.64 0.0039 0.0001
388 13 104.09 3.00 0.0035 0.0001
388 13 47.48 1.61 0.0030 0.0000
388 13 46.52 1.80 0.0026 0.0000
388 13 28.89 1.25 0.0023 0.0000
388 13 17.77 1.34 0.0013 0.0000
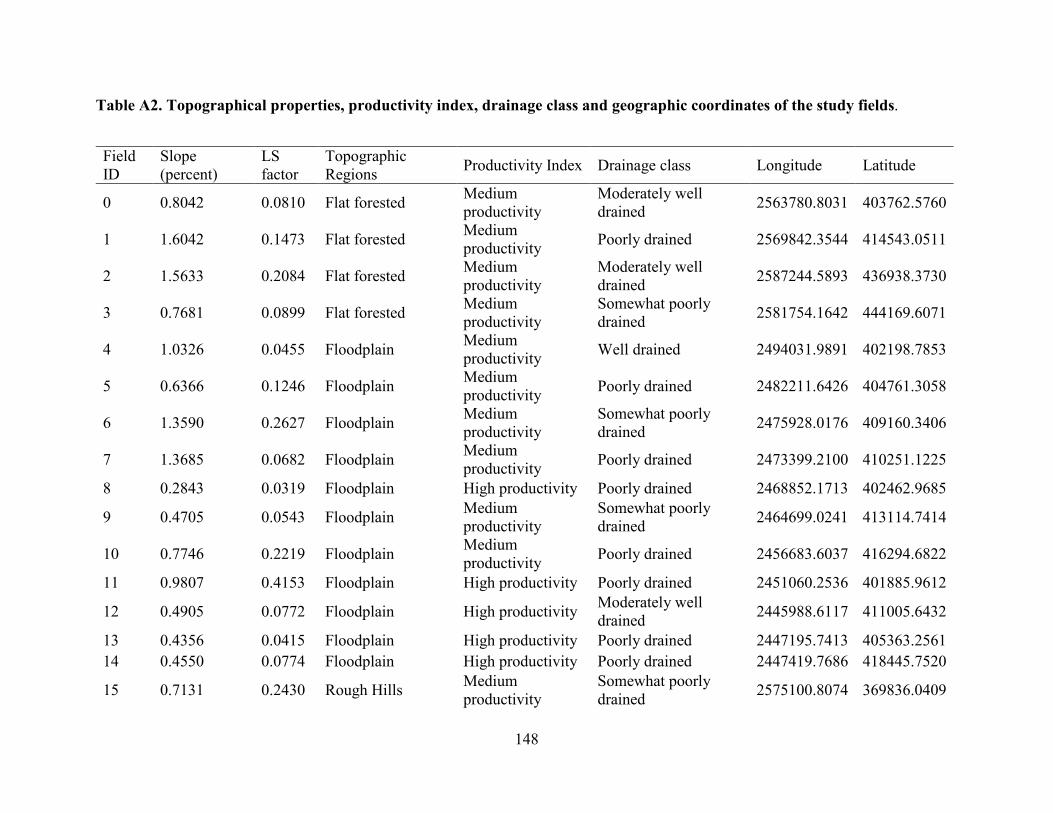
148
Table A2. Topographical properties, productivity index, drainage class and geographic coordinates of the study fields.
Field ID
Slope (percent)
LS factor
Topographic Regions
Productivity Index Drainage class Longitude Latitude
0 0.8042 0.0810 Flat forested Medium productivity
Moderately well drained
2563780.8031 403762.5760
1 1.6042 0.1473 Flat forested Medium productivity
Poorly drained 2569842.3544 414543.0511
2 1.5633 0.2084 Flat forested Medium productivity
Moderately well drained
2587244.5893 436938.3730
3 0.7681 0.0899 Flat forested Medium productivity
Somewhat poorly drained
2581754.1642 444169.6071
4 1.0326 0.0455 Floodplain Medium productivity
Well drained 2494031.9891 402198.7853
5 0.6366 0.1246 Floodplain Medium productivity
Poorly drained 2482211.6426 404761.3058
6 1.3590 0.2627 Floodplain Medium productivity
Somewhat poorly drained
2475928.0176 409160.3406
7 1.3685 0.0682 Floodplain Medium productivity
Poorly drained 2473399.2100 410251.1225
8 0.2843 0.0319 Floodplain High productivity Poorly drained 2468852.1713 402462.9685
9 0.4705 0.0543 Floodplain Medium productivity
Somewhat poorly drained
2464699.0241 413114.7414
10 0.7746 0.2219 Floodplain Medium productivity
Poorly drained 2456683.6037 416294.6822
11 0.9807 0.4153 Floodplain High productivity Poorly drained 2451060.2536 401885.9612
12 0.4905 0.0772 Floodplain High productivity Moderately well drained
2445988.6117 411005.6432
13 0.4356 0.0415 Floodplain High productivity Poorly drained 2447195.7413 405363.2561
14 0.4550 0.0774 Floodplain High productivity Poorly drained 2447419.7686 418445.7520
15 0.7131 0.2430 Rough Hills Medium productivity
Somewhat poorly drained
2575100.8074 369836.0409

149
16 1.5541 0.1072 Flat Forested Medium productivity
Moderately well drained
2564852.6735 396620.3175
17 0.9485 0.2342 Floodplain Medium productivity
Poorly drained 2511681.8266 377165.7154
18 0.8758 0.0430 Floodplain Medium productivity
Well drained 2508773.7103 388763.4872
19 1.8608 0.1951 Floodplain Medium productivity
Somewhat poorly drained
2512514.0717 389066.4325
20 1.2310 0.1218 Floodplain High productivity Moderately well drained
2498922.7647 344324.4898
21 1.4033 0.1149 Floodplain High productivity Well drained 2501460.8505 338319.8756
22 0.9779 0.0905 Floodplain High productivity Moderately well drained
2499149.5405 338648.9281
23 0.4867 0.0693 Floodplain Medium productivity
Poorly drained 2501609.7414 347308.5846
24 0.5120 0.0429 Floodplain High productivity Somewhat poorly drained
2500013.5853 372876.7380
25 0.6732 0.0963 Floodplain High productivity Well drained 2497538.1325 372680.6329
26 0.3492 0.0467 Floodplain High productivity Poorly drained 2501086.7111 380350.6553
27 0.3894 0.0484 Floodplain High productivity Poorly drained 2497586.9179 381626.3453
28 0.6803 0.0784 Floodplain Medium productivity
Somewhat poorly drained
2503343.7919 391787.9668
29 0.3022 0.1287 Floodplain Medium productivity
Poorly drained 2493409.3672 355336.8371
30 0.6947 0.0510 Floodplain Medium productivity
Somewhat poorly drained
2496450.8121 362297.3355
31 0.7338 0.2077 Floodplain High productivity Poorly drained 2491660.5746 391642.0996
32 0.6368 0.1207 Floodplain High productivity Poorly drained 2488445.7321 378685.8814
33 0.7327 0.2296 Floodplain High productivity Poorly drained 2488037.2290 380214.9662
34 1.3288 0.2495 Floodplain High productivity Somewhat poorly drained
2474188.0279 383692.1507
35 0.3517 0.0588 Floodplain High productivity Poorly drained 2480485.2927 396611.0892

150
36 0.6906 0.0771 Floodplain High productivity Moderately well drained
2472793.5102 391901.7561
37 0.5796 0.0422 Floodplain Low productivity Somewhat poorly drained
2464336.6225 387013.5401
38 0.3234 0.0211 Floodplain High productivity Poorly drained 2469508.8851 394611.1109
39 1.0029 0.0991 Floodplain High productivity Poorly drained 2456042.0009 400056.5114
40 1.0647 0.0989 Flat Forested High productivity Somewhat poorly drained
2572897.8939 398343.9857
41 0.3643 0.0401 Flat Forested Medium productivity
Poorly drained 2574401.4403 400812.9015
42 1.2884 0.1001 Flat Forested Medium productivity
Somewhat poorly drained
2587816.4026 387907.3591
43 1.5567 0.0789 Flat Forested Medium productivity
Moderately well drained
2585588.6374 396175.4635
44 1.2501 0.1560 Flat Forested Medium productivity
Somewhat poorly drained
2562160.6679 466941.9556
45 0.9614 0.1607 Flat Forested Medium productivity
Somewhat poorly drained
2560193.5920 456086.9289
46 0.9773 0.1032 Flat Forested Medium productivity
Moderately well drained
2552523.6123 446044.3079
47 1.0122 0.1669 Flat Forested Medium productivity
Somewhat poorly drained
2550068.4349 432557.4718
48 0.7888 0.1298 Flat Forested Medium productivity
Somewhat poorly drained
2546715.7090 435614.5791
49 1.4475 0.1445 Flat Forested Medium productivity
Moderately well drained
2544468.3377 446347.0143
50 2.3141 0.2198 Flat Forested Medium productivity
Moderately well drained
2548108.4548 457171.0112
51 1.7825 0.2855 Flat Forested Medium productivity
Moderately well drained
2542710.2385 462471.1576
52 1.7403 0.3303 Flat Forested Medium productivity
Poorly drained 2538738.8709 430880.8255
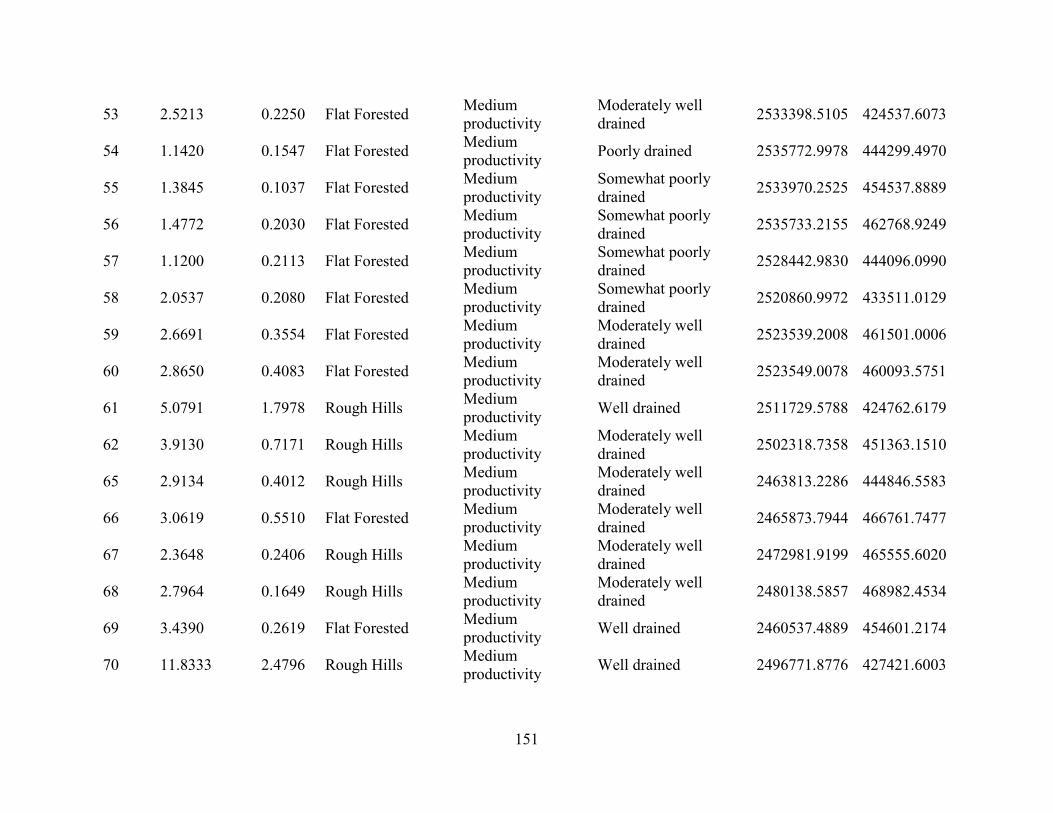
151
53 2.5213 0.2250 Flat Forested Medium productivity
Moderately well drained
2533398.5105 424537.6073
54 1.1420 0.1547 Flat Forested Medium productivity
Poorly drained 2535772.9978 444299.4970
55 1.3845 0.1037 Flat Forested Medium productivity
Somewhat poorly drained
2533970.2525 454537.8889
56 1.4772 0.2030 Flat Forested Medium productivity
Somewhat poorly drained
2535733.2155 462768.9249
57 1.1200 0.2113 Flat Forested Medium productivity
Somewhat poorly drained
2528442.9830 444096.0990
58 2.0537 0.2080 Flat Forested Medium productivity
Somewhat poorly drained
2520860.9972 433511.0129
59 2.6691 0.3554 Flat Forested Medium productivity
Moderately well drained
2523539.2008 461501.0006
60 2.8650 0.4083 Flat Forested Medium productivity
Moderately well drained
2523549.0078 460093.5751
61 5.0791 1.7978 Rough Hills Medium productivity
Well drained 2511729.5788 424762.6179
62 3.9130 0.7171 Rough Hills Medium productivity
Moderately well drained
2502318.7358 451363.1510
65 2.9134 0.4012 Rough Hills Medium productivity
Moderately well drained
2463813.2286 444846.5583
66 3.0619 0.5510 Flat Forested Medium productivity
Moderately well drained
2465873.7944 466761.7477
67 2.3648 0.2406 Rough Hills Medium productivity
Moderately well drained
2472981.9199 465555.6020
68 2.7964 0.1649 Rough Hills Medium productivity
Moderately well drained
2480138.5857 468982.4534
69 3.4390 0.2619 Flat Forested Medium productivity
Well drained 2460537.4889 454601.2174
70 11.8333 2.4796 Rough Hills Medium productivity
Well drained 2496771.8776 427421.6003

152
71 3.7448 0.7520 Rough Hills Medium productivity
Moderately well drained
2494331.9330 463009.6953
72 2.9896 0.5090 Rough Hills Medium productivity
Moderately well drained
2494718.5056 449527.2713
73 4.3478 0.8395 Rough Hills Medium productivity
Moderately well drained
2483629.3854 446193.4497
74 3.6958 1.2979 Rough Hills Medium productivity
Moderately well drained
2487669.8954 434997.0408
75 2.8828 0.4855 Rough Hills Medium productivity
Moderately well drained
2473790.9440 440982.4356
76 1.9545 0.4640 Rough Hills Medium productivity
Moderately well drained
2473388.2294 439421.3211
77 4.1428 0.3741 Rough Hills Medium productivity
Well drained 2480503.8530 456687.8852
78 1.4054 0.1794 Flat Forested Medium productivity
Somewhat poorly drained
2564274.3897 440064.3740
79 1.7083 0.3478 Flat Forested Medium productivity
Somewhat poorly drained
2561020.8918 439076.0246
80 1.1544 0.0911 Flat Forested Medium productivity
Somewhat poorly drained
2570153.0629 428670.4734
81 2.5483 0.4931 Flat Forested Medium productivity
Well drained 2575670.7849 430699.2697
82 1.0183 0.0727 Flat Forested Medium productivity
Somewhat poorly drained
2588831.9744 452156.8876
83 0.5690 0.0694 Flat Forested Medium productivity
Poorly drained 2554486.7559 464300.3353
84 0.8550 0.1301 Flat Forested Medium productivity
Poorly drained 2558410.1866 459155.9815
85 0.5319 0.1879 Flat Forested Medium productivity
Somewhat poorly drained
2583321.9652 421513.4858
86 0.6587 0.0901 Flat Forested Medium productivity
Poorly drained 2580485.6417 412157.1218

153
87 2.0788 0.3580 Flat Forested Medium productivity
Moderately well drained
2530626.2359 408905.8518
88 2.2012 0.2039 Flat Forested Medium productivity
Moderately well drained
2575246.8804 422562.5899
89 1.0575 0.0963 Flat Forested Medium productivity
Poorly drained 2555377.8636 411141.1258
90 1.4865 0.1973 Flat Forested Medium productivity
Somewhat poorly drained
2554901.9081 422162.4468
91 2.2869 0.3065 Flat Forested Medium productivity
Moderately well drained
2556103.1229 416613.2041
92 1.5478 0.1443 Flat Forested Medium productivity
Well drained 2546620.5145 410492.6240
93 2.9914 0.1931 Flat Forested Medium productivity
Well drained 2548032.4177 408485.1134
94 1.9008 0.2750 Flat Forested Medium productivity
Somewhat poorly drained
2538679.7259 419995.9233
95 2.0056 0.1397 Rough Hills Medium productivity
Poorly drained 2523087.5124 401517.0171
96 3.4604 0.4903 Rough Hills Medium productivity
Moderately well drained
2520903.9805 411202.8209
97 0.9284 0.1402 Flat Forested Medium productivity
Poorly drained 2575625.0787 457160.6377
98 0.4239 0.0567 Flat Forested Medium productivity
Somewhat poorly drained
2575649.5493 467362.2386
99 2.9023 0.4714 Flat Forested Medium productivity
Well drained 2455821.7532 455419.1347
100 4.3524 0.8750 Rough Hills Medium productivity
Moderately well drained
2450003.7308 436493.7124
101 0.3325 0.0302 Flat Forested Medium productivity
Poorly drained 2587177.8632 462216.6135
102 1.2353 0.1226 Flat Forested Medium productivity
Somewhat poorly drained
2563339.2447 409051.9482

154
103 0.5170 0.0246 Flat Forested Medium productivity
Poorly drained 2565342.3876 408406.0990
104 0.6092 0.0756 Flat Forested Medium productivity
Poorly drained 2566755.3664 406437.3735
105 0.4227 0.0197 Flat Forested Medium productivity
Poorly drained 2565005.5280 406346.4928
106 0.7886 0.0393 Flat Forested Medium productivity
Poorly drained 2567356.6245 403432.5422
107 2.0737 0.1617 Flat Forested Medium productivity
Well drained 2570632.5024 408220.7401
108 1.1795 0.0866 Flat Forested Medium productivity
Somewhat poorly drained
2566051.0951 403161.4903
109 1.5924 0.2849 Flat Forested Medium productivity
Poorly drained 2565066.8756 414129.0255
110 3.0313 0.3756 Flat Forested Medium productivity
Moderately well drained
2561513.6284 414570.2011
111 1.5155 0.2802 Flat Forested Moderately well drained
2585583.1322 434400.7000
112 1.7400 0.3207 Flat Forested Medium productivity
Moderately well drained
2587504.3547 431635.3224
113 0.7447 0.1570 Flat Forested Medium productivity
Somewhat poorly drained
2585014.8194 444242.1574
114 1.2176 0.1025 Flat Forested Medium productivity
Somewhat poorly drained
2583888.7875 444517.2388
115 1.6468 0.3155 Flat Forested Medium productivity
Moderately well drained
2583392.7931 436091.7232
116 0.7730 0.0432 Floodplain Medium productivity
Well drained 2490168.8325 403459.7784
117 0.8461 0.0777 Floodplain Medium productivity
Somewhat poorly drained
2485048.4260 405423.1029
118 1.0487 0.0768 Floodplain Medium productivity
Well drained 2488190.6454 404540.4534

155
119 0.6305 0.0983 Floodplain Medium productivity
Poorly drained 2483522.3043 404623.3282
120 0.9243 0.1087 Floodplain Medium productivity
Somewhat poorly drained
2482331.9818 406640.9458
121 0.6721 0.1803 Floodplain High productivity Poorly drained 2486994.9813 402399.3303
122 0.5496 0.0479 Floodplain High productivity Moderately well drained
2482574.9266 402939.1382
123 0.8056 0.0575 Floodplain High productivity Well drained 2486403.1466 404990.3811
124 0.6006 0.0807 Floodplain High productivity Poorly drained 2473747.3374 402772.1781
125 0.6257 0.0776 Floodplain High productivity Moderately well drained
2473849.7423 404101.4197
126 0.7256 0.1370 Floodplain High productivity Moderately well drained
2470015.2481 403640.2674
127 0.6846 0.1585 Floodplain High productivity Poorly drained 2474135.6588 407496.2581
128 1.1296 0.2447 Floodplain High productivity Poorly drained 2472526.2416 404260.0957
129 0.7697 0.0279 Floodplain Medium productivity
Poorly drained 2478880.5324 404589.2960
130 0.4225 0.1990 Floodplain Medium productivity
Poorly drained 2464345.3123 410393.1599
131 0.5043 0.0555 Floodplain High productivity Poorly drained 2463619.1749 408988.5980
132 0.7415 0.1036 Floodplain High productivity Poorly drained 2462897.7068 404407.6126
133 0.6297 0.0777 Floodplain High productivity Poorly drained 2463184.3405 402880.1588
134 0.5981 0.0778 Floodplain Medium productivity
Somewhat poorly drained
2470001.0403 411701.2308
135 0.4434 0.0441 Floodplain High productivity Poorly drained 2468377.3936 405069.0242
136 0.7280 0.0401 Floodplain Medium productivity
Somewhat poorly drained
2466290.5908 412453.4568
137 0.8345 0.0340 Floodplain Medium productivity
Somewhat poorly drained
2467468.6537 412649.1867
138 0.4947 0.0513 Floodplain Medium productivity
Somewhat poorly drained
2463922.1597 413529.1411
139 0.5091 0.1304 Floodplain High productivity Poorly drained 2459526.7028 401689.9977
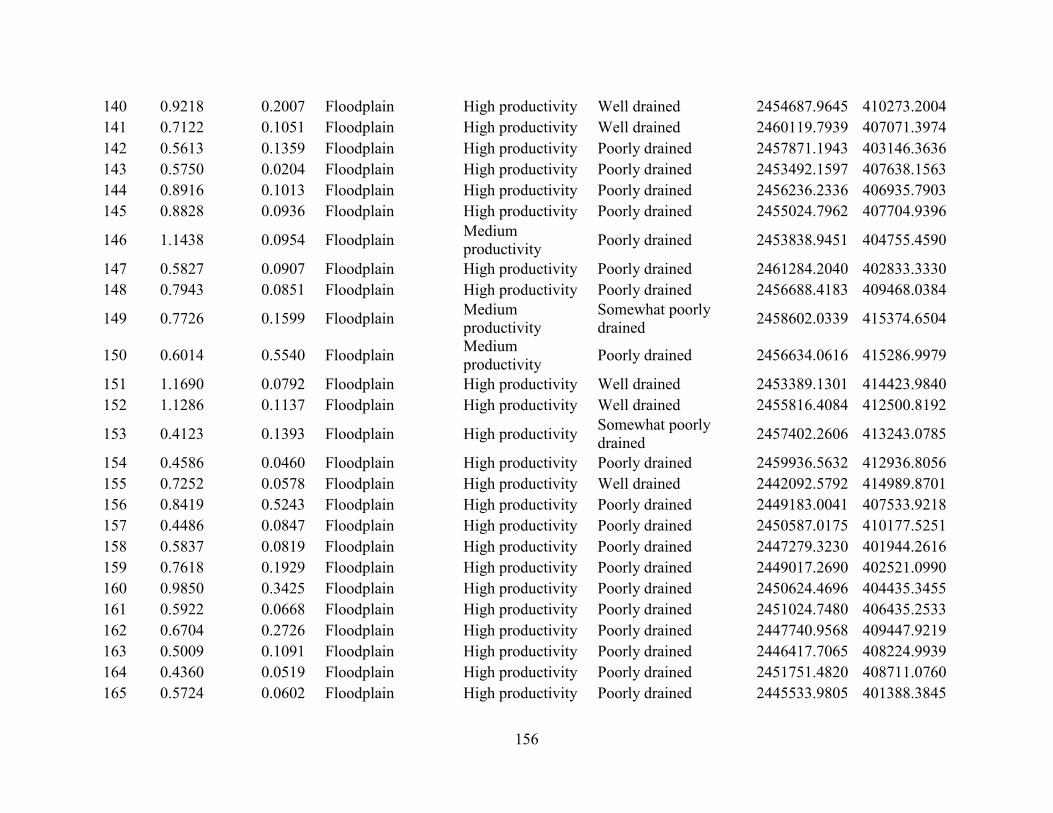
156
140 0.9218 0.2007 Floodplain High productivity Well drained 2454687.9645 410273.2004
141 0.7122 0.1051 Floodplain High productivity Well drained 2460119.7939 407071.3974
142 0.5613 0.1359 Floodplain High productivity Poorly drained 2457871.1943 403146.3636
143 0.5750 0.0204 Floodplain High productivity Poorly drained 2453492.1597 407638.1563
144 0.8916 0.1013 Floodplain High productivity Poorly drained 2456236.2336 406935.7903
145 0.8828 0.0936 Floodplain High productivity Poorly drained 2455024.7962 407704.9396
146 1.1438 0.0954 Floodplain Medium productivity
Poorly drained 2453838.9451 404755.4590
147 0.5827 0.0907 Floodplain High productivity Poorly drained 2461284.2040 402833.3330
148 0.7943 0.0851 Floodplain High productivity Poorly drained 2456688.4183 409468.0384
149 0.7726 0.1599 Floodplain Medium productivity
Somewhat poorly drained
2458602.0339 415374.6504
150 0.6014 0.5540 Floodplain Medium productivity
Poorly drained 2456634.0616 415286.9979
151 1.1690 0.0792 Floodplain High productivity Well drained 2453389.1301 414423.9840
152 1.1286 0.1137 Floodplain High productivity Well drained 2455816.4084 412500.8192
153 0.4123 0.1393 Floodplain High productivity Somewhat poorly drained
2457402.2606 413243.0785
154 0.4586 0.0460 Floodplain High productivity Poorly drained 2459936.5632 412936.8056
155 0.7252 0.0578 Floodplain High productivity Well drained 2442092.5792 414989.8701
156 0.8419 0.5243 Floodplain High productivity Poorly drained 2449183.0041 407533.9218
157 0.4486 0.0847 Floodplain High productivity Poorly drained 2450587.0175 410177.5251
158 0.5837 0.0819 Floodplain High productivity Poorly drained 2447279.3230 401944.2616
159 0.7618 0.1929 Floodplain High productivity Poorly drained 2449017.2690 402521.0990
160 0.9850 0.3425 Floodplain High productivity Poorly drained 2450624.4696 404435.3455
161 0.5922 0.0668 Floodplain High productivity Poorly drained 2451024.7480 406435.2533
162 0.6704 0.2726 Floodplain High productivity Poorly drained 2447740.9568 409447.9219
163 0.5009 0.1091 Floodplain High productivity Poorly drained 2446417.7065 408224.9939
164 0.4360 0.0519 Floodplain High productivity Poorly drained 2451751.4820 408711.0760
165 0.5724 0.0602 Floodplain High productivity Poorly drained 2445533.9805 401388.3845

157
166 0.3666 0.1148 Floodplain High productivity Poorly drained 2447883.6689 407525.0194
167 0.5803 0.0853 Floodplain High productivity Poorly drained 2447041.3012 404019.6656
168 0.3939 0.0327 Floodplain Medium productivity
Poorly drained 2445423.7342 415416.3771
169 0.3331 0.0298 Floodplain High productivity Poorly drained 2448382.3150 415266.8285
170 0.3389 0.0276 Floodplain High productivity Poorly drained 2446770.5658 415465.8093
171 0.6985 0.0855 Floodplain High productivity Poorly drained 2445336.6172 412703.9664
172 0.6797 0.0734 Floodplain High productivity Poorly drained 2447327.0845 412217.5575
173 0.4254 0.0864 Floodplain High productivity Poorly drained 2448340.0328 413164.0720
174 0.3514 0.0236 Floodplain High productivity Poorly drained 2451392.4876 412162.0113
175 0.3771 0.0198 Floodplain High productivity Poorly drained 2450968.4171 413477.8761
176 0.9378 0.2350 Floodplain High productivity Poorly drained 2449292.1520 417388.5510
177 0.6118 0.1152 Floodplain High productivity Poorly drained 2445968.1812 417536.3718
178 1.2768 0.3542 Floodplain Medium productivity
Poorly drained 2451955.5935 415691.1604
179 2.0254 0.1936 Flat Forested Medium productivity
Somewhat poorly drained
2567481.9721 401199.1976
180 2.0893 0.4310 Flat Forested Medium productivity
Somewhat poorly drained
2566174.5157 401325.1501
181 0.6441 0.4436 Floodplain Low productivity Poorly drained 2508053.3250 383037.4119
182 0.4970 0.2419 Floodplain Medium productivity
Poorly drained 2508201.6833 385009.1475
183 1.4374 0.3217 Floodplain Medium productivity
Poorly drained 2508758.5011 387618.1670
184 1.4665 0.4240 Floodplain Medium productivity
Poorly drained 2510584.9678 380356.9255
185 1.0412 0.0703 Floodplain Medium productivity
Poorly drained 2515268.1351 379186.2838
186 0.9707 0.0822 Floodplain Medium productivity
Poorly drained 2514091.3651 381366.7674
187 1.1649 0.2906 Floodplain Medium productivity
Poorly drained 2512875.4340 385437.8339
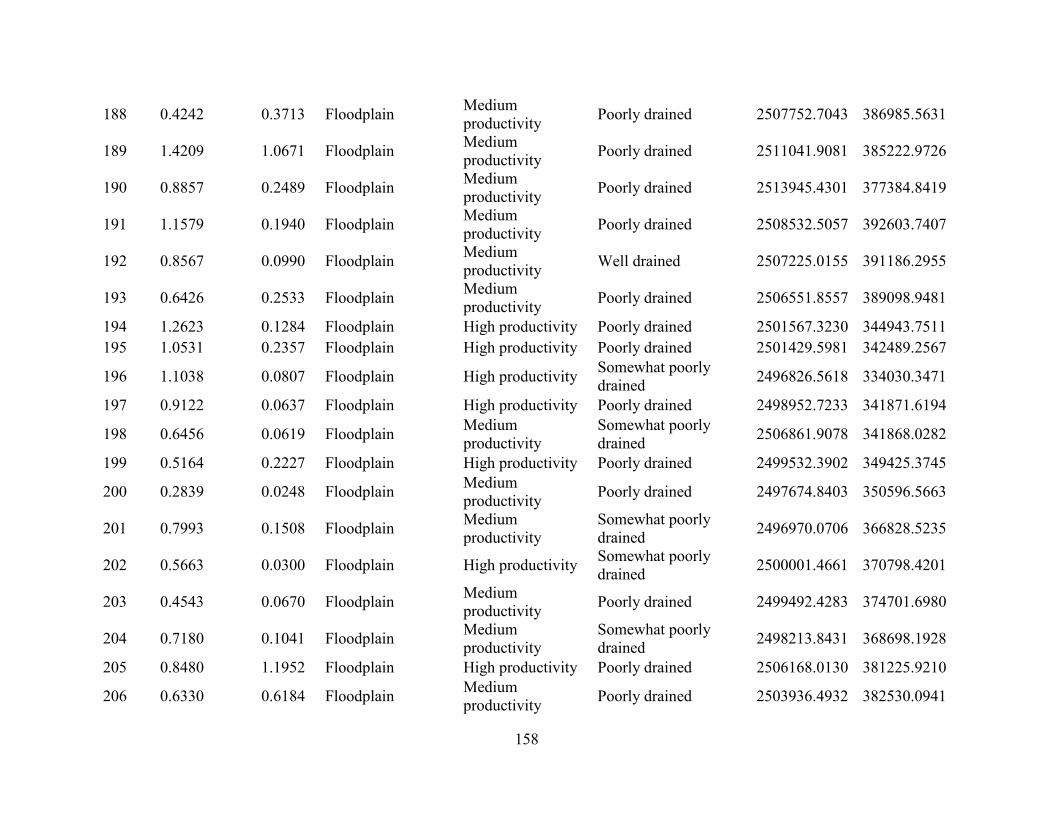
158
188 0.4242 0.3713 Floodplain Medium productivity
Poorly drained 2507752.7043 386985.5631
189 1.4209 1.0671 Floodplain Medium productivity
Poorly drained 2511041.9081 385222.9726
190 0.8857 0.2489 Floodplain Medium productivity
Poorly drained 2513945.4301 377384.8419
191 1.1579 0.1940 Floodplain Medium productivity
Poorly drained 2508532.5057 392603.7407
192 0.8567 0.0990 Floodplain Medium productivity
Well drained 2507225.0155 391186.2955
193 0.6426 0.2533 Floodplain Medium productivity
Poorly drained 2506551.8557 389098.9481
194 1.2623 0.1284 Floodplain High productivity Poorly drained 2501567.3230 344943.7511
195 1.0531 0.2357 Floodplain High productivity Poorly drained 2501429.5981 342489.2567
196 1.1038 0.0807 Floodplain High productivity Somewhat poorly drained
2496826.5618 334030.3471
197 0.9122 0.0637 Floodplain High productivity Poorly drained 2498952.7233 341871.6194
198 0.6456 0.0619 Floodplain Medium productivity
Somewhat poorly drained
2506861.9078 341868.0282
199 0.5164 0.2227 Floodplain High productivity Poorly drained 2499532.3902 349425.3745
200 0.2839 0.0248 Floodplain Medium productivity
Poorly drained 2497674.8403 350596.5663
201 0.7993 0.1508 Floodplain Medium productivity
Somewhat poorly drained
2496970.0706 366828.5235
202 0.5663 0.0300 Floodplain High productivity Somewhat poorly drained
2500001.4661 370798.4201
203 0.4543 0.0670 Floodplain Medium productivity
Poorly drained 2499492.4283 374701.6980
204 0.7180 0.1041 Floodplain Medium productivity
Somewhat poorly drained
2498213.8431 368698.1928
205 0.8480 1.1952 Floodplain High productivity Poorly drained 2506168.0130 381225.9210
206 0.6330 0.6184 Floodplain Medium productivity
Poorly drained 2503936.4932 382530.0941

159
207 0.4568 0.1159 Floodplain Medium productivity
Poorly drained 2503182.6930 386584.6943
208 0.6753 0.3296 Floodplain Medium productivity
Poorly drained 2504155.9369 385192.6816
209 0.4032 0.1582 Floodplain Medium productivity
Poorly drained 2500477.6409 384005.6940
210 0.3509 0.1193 Floodplain Medium productivity
Poorly drained 2501180.5252 382801.8000
211 0.3702 0.0536 Floodplain High productivity Poorly drained 2499287.7531 381435.3296
212 0.2646 0.0259 Floodplain Medium productivity
Poorly drained 2498580.9950 383627.0453
213 0.5875 0.1994 Floodplain Medium productivity
Poorly drained 2501983.5984 396509.8133
214 0.7333 0.1689 Floodplain Medium productivity
Poorly drained 2501659.8069 394670.8021
215 1.2477 0.1238 Floodplain Medium productivity
Somewhat poorly drained
2506483.6131 395922.9388
216 1.4856 0.2599 Floodplain High productivity Moderately well drained
2495888.2561 341753.9599
217 1.4971 0.7053 Floodplain High productivity Moderately well drained
2496303.7513 345181.3650
218 0.9218 0.0892 Floodplain High productivity Moderately well drained
2496934.0369 343496.3190
219 0.3914 0.1674 Floodplain Medium productivity
Poorly drained 2496291.1919 352627.8567
220 0.3614 0.1739 Floodplain High productivity Poorly drained 2494154.5880 352633.1323
221 0.8920 0.0506 Floodplain High productivity Well drained 2492018.5614 347062.2682
222 0.7248 0.0690 Floodplain High productivity Poorly drained 2493005.2003 348920.5280
223 0.7330 0.3681 Floodplain High productivity Poorly drained 2497888.4859 349497.6164
224 0.7607 0.0341 Floodplain High productivity Poorly drained 2497288.3272 347857.8146
225 0.6962 0.2968 Floodplain High productivity Poorly drained 2494024.0111 349545.6033
226 0.2714 0.0443 Floodplain High productivity Poorly drained 2492862.9438 353010.8430
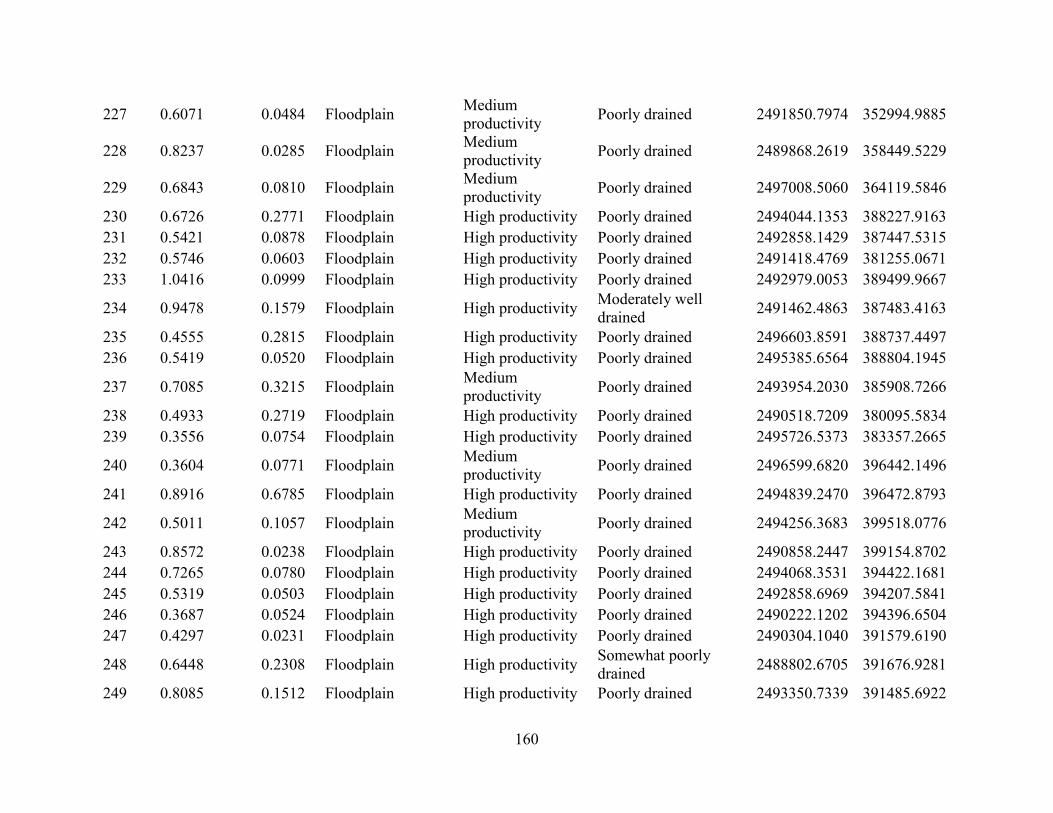
160
227 0.6071 0.0484 Floodplain Medium productivity
Poorly drained 2491850.7974 352994.9885
228 0.8237 0.0285 Floodplain Medium productivity
Poorly drained 2489868.2619 358449.5229
229 0.6843 0.0810 Floodplain Medium productivity
Poorly drained 2497008.5060 364119.5846
230 0.6726 0.2771 Floodplain High productivity Poorly drained 2494044.1353 388227.9163
231 0.5421 0.0878 Floodplain High productivity Poorly drained 2492858.1429 387447.5315
232 0.5746 0.0603 Floodplain High productivity Poorly drained 2491418.4769 381255.0671
233 1.0416 0.0999 Floodplain High productivity Poorly drained 2492979.0053 389499.9667
234 0.9478 0.1579 Floodplain High productivity Moderately well drained
2491462.4863 387483.4163
235 0.4555 0.2815 Floodplain High productivity Poorly drained 2496603.8591 388737.4497
236 0.5419 0.0520 Floodplain High productivity Poorly drained 2495385.6564 388804.1945
237 0.7085 0.3215 Floodplain Medium productivity
Poorly drained 2493954.2030 385908.7266
238 0.4933 0.2719 Floodplain High productivity Poorly drained 2490518.7209 380095.5834
239 0.3556 0.0754 Floodplain High productivity Poorly drained 2495726.5373 383357.2665
240 0.3604 0.0771 Floodplain Medium productivity
Poorly drained 2496599.6820 396442.1496
241 0.8916 0.6785 Floodplain High productivity Poorly drained 2494839.2470 396472.8793
242 0.5011 0.1057 Floodplain Medium productivity
Poorly drained 2494256.3683 399518.0776
243 0.8572 0.0238 Floodplain High productivity Poorly drained 2490858.2447 399154.8702
244 0.7265 0.0780 Floodplain High productivity Poorly drained 2494068.3531 394422.1681
245 0.5319 0.0503 Floodplain High productivity Poorly drained 2492858.6969 394207.5841
246 0.3687 0.0524 Floodplain High productivity Poorly drained 2490222.1202 394396.6504
247 0.4297 0.0231 Floodplain High productivity Poorly drained 2490304.1040 391579.6190
248 0.6448 0.2308 Floodplain High productivity Somewhat poorly drained
2488802.6705 391676.9281
249 0.8085 0.1512 Floodplain High productivity Poorly drained 2493350.7339 391485.6922
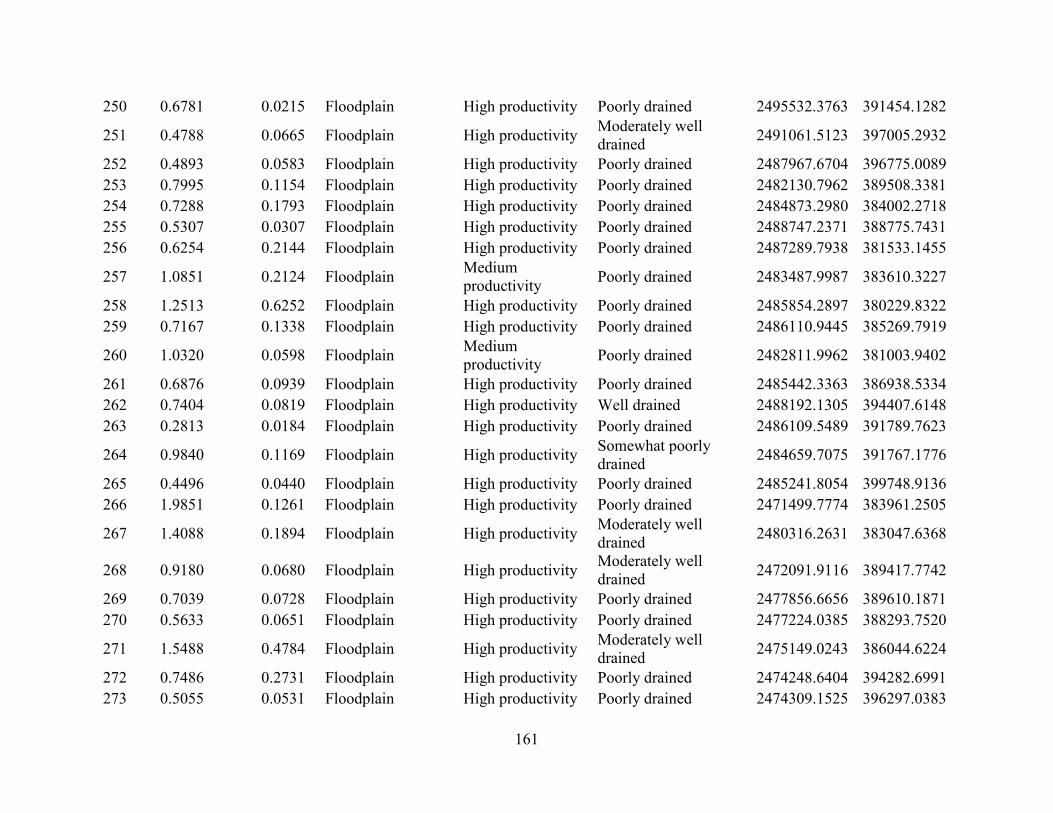
161
250 0.6781 0.0215 Floodplain High productivity Poorly drained 2495532.3763 391454.1282
251 0.4788 0.0665 Floodplain High productivity Moderately well drained
2491061.5123 397005.2932
252 0.4893 0.0583 Floodplain High productivity Poorly drained 2487967.6704 396775.0089
253 0.7995 0.1154 Floodplain High productivity Poorly drained 2482130.7962 389508.3381
254 0.7288 0.1793 Floodplain High productivity Poorly drained 2484873.2980 384002.2718
255 0.5307 0.0307 Floodplain High productivity Poorly drained 2488747.2371 388775.7431
256 0.6254 0.2144 Floodplain High productivity Poorly drained 2487289.7938 381533.1455
257 1.0851 0.2124 Floodplain Medium productivity
Poorly drained 2483487.9987 383610.3227
258 1.2513 0.6252 Floodplain High productivity Poorly drained 2485854.2897 380229.8322
259 0.7167 0.1338 Floodplain High productivity Poorly drained 2486110.9445 385269.7919
260 1.0320 0.0598 Floodplain Medium productivity
Poorly drained 2482811.9962 381003.9402
261 0.6876 0.0939 Floodplain High productivity Poorly drained 2485442.3363 386938.5334
262 0.7404 0.0819 Floodplain High productivity Well drained 2488192.1305 394407.6148
263 0.2813 0.0184 Floodplain High productivity Poorly drained 2486109.5489 391789.7623
264 0.9840 0.1169 Floodplain High productivity Somewhat poorly drained
2484659.7075 391767.1776
265 0.4496 0.0440 Floodplain High productivity Poorly drained 2485241.8054 399748.9136
266 1.9851 0.1261 Floodplain High productivity Poorly drained 2471499.7774 383961.2505
267 1.4088 0.1894 Floodplain High productivity Moderately well drained
2480316.2631 383047.6368
268 0.9180 0.0680 Floodplain High productivity Moderately well drained
2472091.9116 389417.7742
269 0.7039 0.0728 Floodplain High productivity Poorly drained 2477856.6656 389610.1871
270 0.5633 0.0651 Floodplain High productivity Poorly drained 2477224.0385 388293.7520
271 1.5488 0.4784 Floodplain High productivity Moderately well drained
2475149.0243 386044.6224
272 0.7486 0.2731 Floodplain High productivity Poorly drained 2474248.6404 394282.6991
273 0.5055 0.0531 Floodplain High productivity Poorly drained 2474309.1525 396297.0383
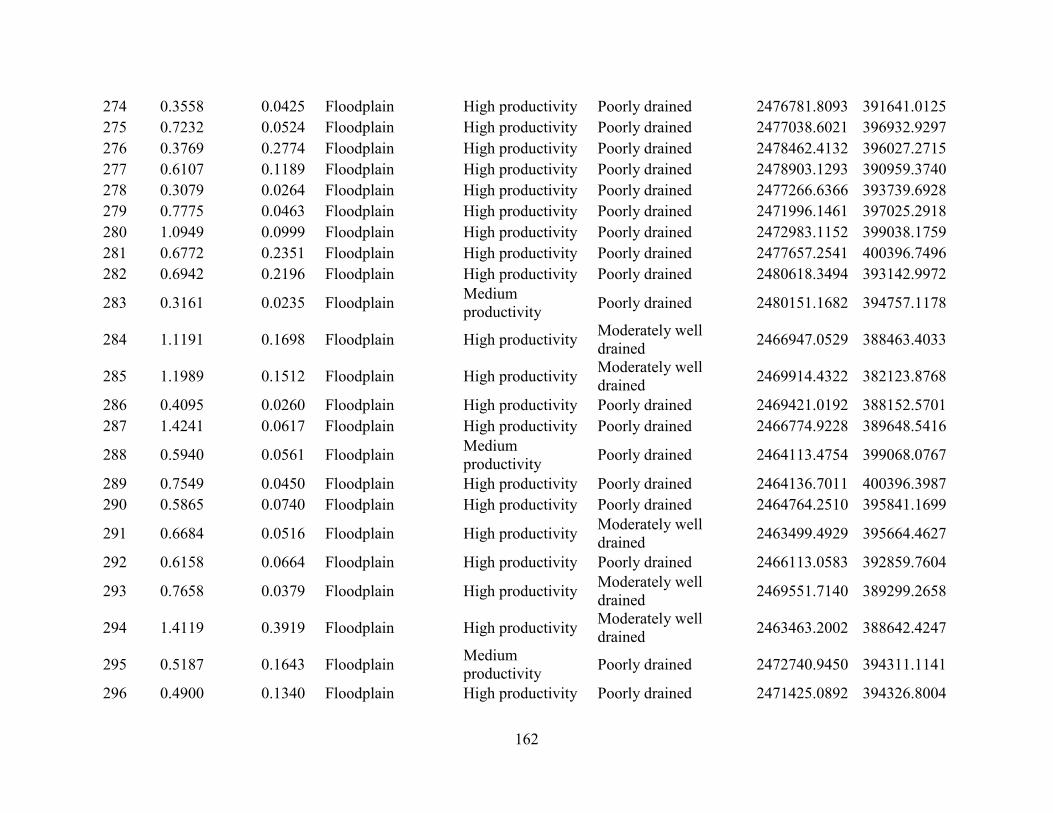
162
274 0.3558 0.0425 Floodplain High productivity Poorly drained 2476781.8093 391641.0125
275 0.7232 0.0524 Floodplain High productivity Poorly drained 2477038.6021 396932.9297
276 0.3769 0.2774 Floodplain High productivity Poorly drained 2478462.4132 396027.2715
277 0.6107 0.1189 Floodplain High productivity Poorly drained 2478903.1293 390959.3740
278 0.3079 0.0264 Floodplain High productivity Poorly drained 2477266.6366 393739.6928
279 0.7775 0.0463 Floodplain High productivity Poorly drained 2471996.1461 397025.2918
280 1.0949 0.0999 Floodplain High productivity Poorly drained 2472983.1152 399038.1759
281 0.6772 0.2351 Floodplain High productivity Poorly drained 2477657.2541 400396.7496
282 0.6942 0.2196 Floodplain High productivity Poorly drained 2480618.3494 393142.9972
283 0.3161 0.0235 Floodplain Medium productivity
Poorly drained 2480151.1682 394757.1178
284 1.1191 0.1698 Floodplain High productivity Moderately well drained
2466947.0529 388463.4033
285 1.1989 0.1512 Floodplain High productivity Moderately well drained
2469914.4322 382123.8768
286 0.4095 0.0260 Floodplain High productivity Poorly drained 2469421.0192 388152.5701
287 1.4241 0.0617 Floodplain High productivity Poorly drained 2466774.9228 389648.5416
288 0.5940 0.0561 Floodplain Medium productivity
Poorly drained 2464113.4754 399068.0767
289 0.7549 0.0450 Floodplain High productivity Poorly drained 2464136.7011 400396.3987
290 0.5865 0.0740 Floodplain High productivity Poorly drained 2464764.2510 395841.1699
291 0.6684 0.0516 Floodplain High productivity Moderately well drained
2463499.4929 395664.4627
292 0.6158 0.0664 Floodplain High productivity Poorly drained 2466113.0583 392859.7604
293 0.7658 0.0379 Floodplain High productivity Moderately well drained
2469551.7140 389299.2658
294 1.4119 0.3919 Floodplain High productivity Moderately well drained
2463463.2002 388642.4247
295 0.5187 0.1643 Floodplain Medium productivity
Poorly drained 2472740.9450 394311.1141
296 0.4900 0.1340 Floodplain High productivity Poorly drained 2471425.0892 394326.8004

163
297 0.9855 0.0702 Floodplain High productivity Well drained 2461891.1667 391018.4324
298 0.7982 0.0585 Floodplain High productivity Moderately well drained
2461727.8195 396105.2616
299 1.1729 0.1136 Floodplain High productivity Somewhat poorly drained
2461478.5210 392218.4640
300 0.8655 0.2010 Floodplain High productivity Poorly drained 2454028.0182 400774.5902
301 0.4651 0.0406 Flat Forested Medium productivity
Poorly drained 2575758.5347 400601.2944
302 0.7102 0.0688 Flat Forested Medium productivity
Poorly drained 2573105.6592 401139.5519
303 1.2843 0.0795 Flat Forested Medium productivity
Poorly drained 2571710.6375 394981.5362
304 1.0846 0.2017 Rough Hills Medium productivity
Somewhat poorly drained
2585341.8837 382437.5338
305 1.1413 0.0715 Flat Forested Medium productivity
Poorly drained 2581423.4889 399768.0593
306 1.5015 0.2661 Flat Forested Medium productivity
Somewhat poorly drained
2560841.0458 467343.2679
307 1.3063 0.1554 Flat Forested Medium productivity
Somewhat poorly drained
2570356.6096 467583.2547
308 1.1908 0.2211 Flat Forested Medium productivity
Somewhat poorly drained
2570126.9445 464607.0741
309 1.0387 0.0857 Flat Forested Medium productivity
Somewhat poorly drained
2555591.4811 426842.2546
310 1.3018 0.2562 Flat Forested Medium productivity
Poorly drained 2558877.5806 440714.5131
311 1.4040 0.2879 Flat Forested Medium productivity
Somewhat poorly drained
2558145.0140 443456.7172
312 0.6675 0.1181 Flat Forested Medium productivity
Somewhat poorly drained
2560137.9636 457377.5875
313 0.8508 0.2057 Flat Forested Medium productivity
Poorly drained 2550083.5002 433901.3642
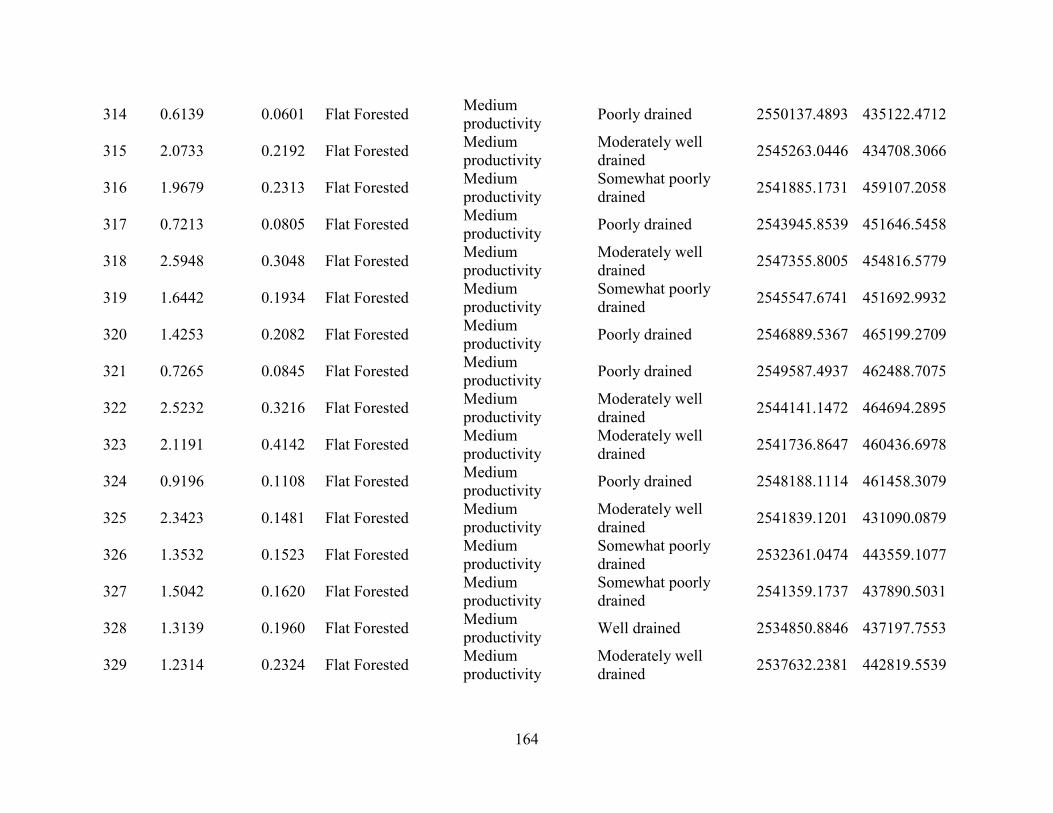
164
314 0.6139 0.0601 Flat Forested Medium productivity
Poorly drained 2550137.4893 435122.4712
315 2.0733 0.2192 Flat Forested Medium productivity
Moderately well drained
2545263.0446 434708.3066
316 1.9679 0.2313 Flat Forested Medium productivity
Somewhat poorly drained
2541885.1731 459107.2058
317 0.7213 0.0805 Flat Forested Medium productivity
Poorly drained 2543945.8539 451646.5458
318 2.5948 0.3048 Flat Forested Medium productivity
Moderately well drained
2547355.8005 454816.5779
319 1.6442 0.1934 Flat Forested Medium productivity
Somewhat poorly drained
2545547.6741 451692.9932
320 1.4253 0.2082 Flat Forested Medium productivity
Poorly drained 2546889.5367 465199.2709
321 0.7265 0.0845 Flat Forested Medium productivity
Poorly drained 2549587.4937 462488.7075
322 2.5232 0.3216 Flat Forested Medium productivity
Moderately well drained
2544141.1472 464694.2895
323 2.1191 0.4142 Flat Forested Medium productivity
Moderately well drained
2541736.8647 460436.6978
324 0.9196 0.1108 Flat Forested Medium productivity
Poorly drained 2548188.1114 461458.3079
325 2.3423 0.1481 Flat Forested Medium productivity
Moderately well drained
2541839.1201 431090.0879
326 1.3532 0.1523 Flat Forested Medium productivity
Somewhat poorly drained
2532361.0474 443559.1077
327 1.5042 0.1620 Flat Forested Medium productivity
Somewhat poorly drained
2541359.1737 437890.5031
328 1.3139 0.1960 Flat Forested Medium productivity
Well drained 2534850.8846 437197.7553
329 1.2314 0.2324 Flat Forested Medium productivity
Moderately well drained
2537632.2381 442819.5539
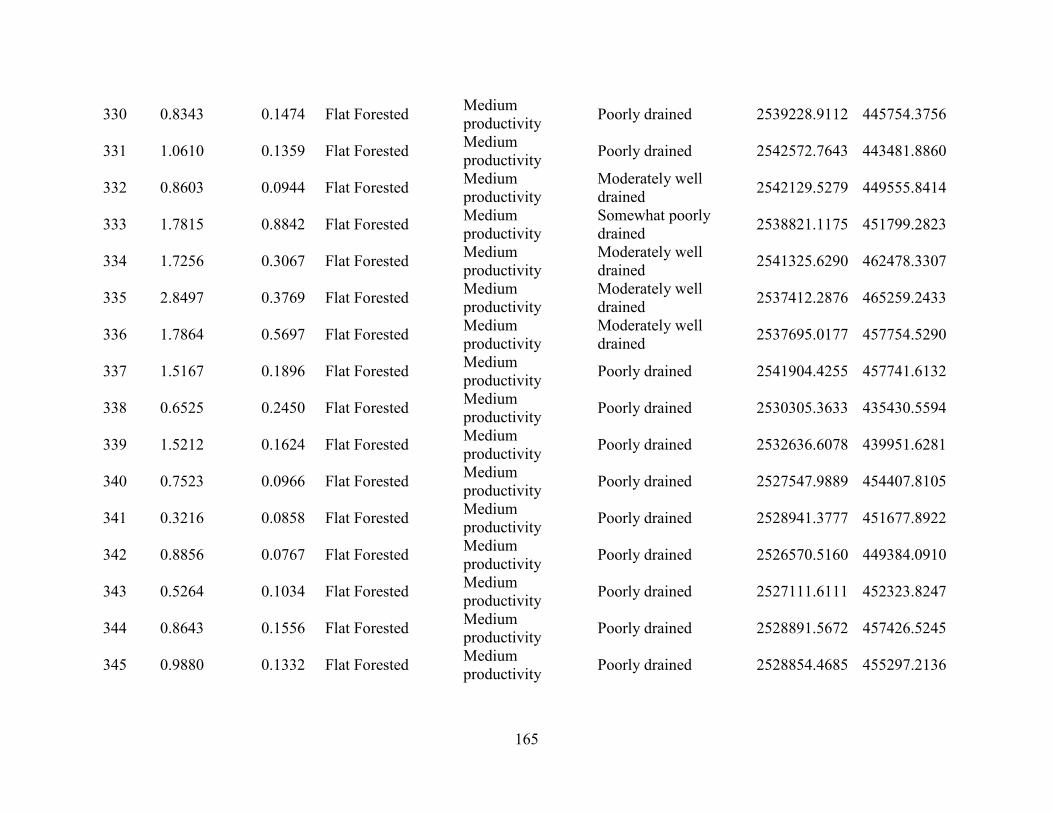
165
330 0.8343 0.1474 Flat Forested Medium productivity
Poorly drained 2539228.9112 445754.3756
331 1.0610 0.1359 Flat Forested Medium productivity
Poorly drained 2542572.7643 443481.8860
332 0.8603 0.0944 Flat Forested Medium productivity
Moderately well drained
2542129.5279 449555.8414
333 1.7815 0.8842 Flat Forested Medium productivity
Somewhat poorly drained
2538821.1175 451799.2823
334 1.7256 0.3067 Flat Forested Medium productivity
Moderately well drained
2541325.6290 462478.3307
335 2.8497 0.3769 Flat Forested Medium productivity
Moderately well drained
2537412.2876 465259.2433
336 1.7864 0.5697 Flat Forested Medium productivity
Moderately well drained
2537695.0177 457754.5290
337 1.5167 0.1896 Flat Forested Medium productivity
Poorly drained 2541904.4255 457741.6132
338 0.6525 0.2450 Flat Forested Medium productivity
Poorly drained 2530305.3633 435430.5594
339 1.5212 0.1624 Flat Forested Medium productivity
Poorly drained 2532636.6078 439951.6281
340 0.7523 0.0966 Flat Forested Medium productivity
Poorly drained 2527547.9889 454407.8105
341 0.3216 0.0858 Flat Forested Medium productivity
Poorly drained 2528941.3777 451677.8922
342 0.8856 0.0767 Flat Forested Medium productivity
Poorly drained 2526570.5160 449384.0910
343 0.5264 0.1034 Flat Forested Medium productivity
Poorly drained 2527111.6111 452323.8247
344 0.8643 0.1556 Flat Forested Medium productivity
Poorly drained 2528891.5672 457426.5245
345 0.9880 0.1332 Flat Forested Medium productivity
Poorly drained 2528854.4685 455297.2136

166
346 1.5156 0.1727 Flat Forested Medium productivity
Poorly drained 2530474.0110 449995.7840
347 1.1670 0.1800 Flat Forested Medium productivity
Poorly drained 2531575.7651 451704.3813
348 1.1185 0.1749 Flat Forested Medium productivity
Somewhat poorly drained
2531642.9697 463238.9678
349 0.9691 0.1321 Flat Forested Medium productivity
Poorly drained 2529949.8479 464311.9537
350 0.6891 0.0676 Flat Forested High productivity Poorly drained 2532637.4690 460582.4286
351 0.7447 0.1180 Flat Forested Medium productivity
Poorly drained 2529161.5436 461717.7776
352 0.7921 0.1556 Flat Forested Medium productivity
Poorly drained 2530315.6530 460348.0245
353 0.4598 0.0717 Flat Forested High productivity Poorly drained 2528893.0490 459780.6823
354 1.9946 0.2269 Flat Forested Medium productivity
Somewhat poorly drained
2521574.2533 458043.8095
355 4.1223 0.4425 Rough Hills Medium productivity
Moderately well drained
2509495.9433 459663.1877
356 3.1204 0.3007 Rough Hills Medium productivity
Moderately well drained
2467109.6915 447483.0723
357 2.2474 0.3258 Rough Hills Medium productivity
Moderately well drained
2465799.0907 448098.3483
358 3.4247 0.2633 Flat Forested Medium productivity
Moderately well drained
2464585.3416 458212.0335
359 3.9612 0.7126 Flat Forested Medium productivity
Moderately well drained
2474014.7693 462826.9074
360 3.8081 0.5741 Rough Hills Medium productivity
Moderately well drained
2484058.3074 441858.2683
361 1.4576 0.1807 Flat Forested Medium productivity
Moderately well drained
2579637.7995 440458.2743
362 2.1697 0.1755 Flat Forested Medium productivity
Moderately well drained
2578316.7127 440521.1367

167
363 2.0666 0.1546 Flat Forested Medium productivity
Moderately well drained
2568210.1972 436131.3677
364 0.7023 0.0922 Flat Forested Medium productivity
Somewhat poorly drained
2575298.6028 461471.5908
365 1.0986 0.1283 Flat Forested Medium productivity
Moderately well drained
2571494.6507 467028.9373
366 1.0460 0.1582 Flat Forested Medium productivity
Moderately well drained
2572882.0563 467539.9790
367 0.9633 0.1236 Flat Forested Medium productivity
Poorly drained 2580799.0199 461202.9771
368 1.4606 0.5666 Flat Forested Medium productivity
Somewhat poorly drained
2581066.3005 454313.9371
369 0.9388 0.1797 Flat Forested Medium productivity
Somewhat poorly drained
2555159.3526 461647.9702
370 0.6482 0.0902 Flat Forested Medium productivity
Poorly drained 2553444.5305 467525.7153
371 1.1247 0.1478 Flat Forested Medium productivity
Somewhat poorly drained
2553194.9802 461694.0790
372 0.8319 0.1281 Flat Forested Medium productivity
Somewhat poorly drained
2555780.2343 465528.9571
373 1.5570 0.0719 Flat Forested Medium productivity
Poorly drained 2580193.1042 405452.4510
374 2.4108 0.3622 Flat Forested Medium productivity
Well drained 2587095.4558 419242.5366
375 0.7810 0.0927 Flat Forested Medium productivity
Poorly drained 2582779.3675 411126.8426
376 0.4820 0.0482 Flat Forested Medium productivity
Poorly drained 2560382.6318 401087.7204
377 0.9377 0.1526 Flat Forested Medium productivity
Poorly drained 2555995.9250 408207.8224
378 1.2378 0.1794 Flat Forested Medium productivity
Well drained 2544990.5870 414356.2303

168
379 1.8826 0.2253 Flat Forested Medium productivity
Well drained 2547845.5676 412774.1091
380 1.1647 0.3079 Flat Forested Medium productivity
Somewhat poorly drained
2541845.7513 418633.6663
381 1.0327 0.1462 Flat Forested Medium productivity
Poorly drained 2533028.7758 419353.4340
382 0.9196 0.1074 Flat Forested Medium productivity
Somewhat poorly drained
2577515.9800 463973.3803
383 1.0152 0.1034 Flat Forested Medium productivity
Somewhat poorly drained
2578025.5163 466299.5890
384 1.0812 0.0801 Flat Forested Medium productivity
Somewhat poorly drained
2586350.0229 450775.6885
385 1.4195 0.1197 Flat Forested Medium productivity
Moderately well drained
2584998.0876 453460.3056
386 1.6657 0.4119 Flat Forested Medium productivity
Somewhat poorly drained
2588716.0129 414471.6992
387 0.5688 0.0557 Flat Forested Medium productivity
Poorly drained 2587363.0159 457337.0871
388 0.5471 0.0625 Flat Forested Medium productivity
Poorly drained 2584052.9966 458786.7314
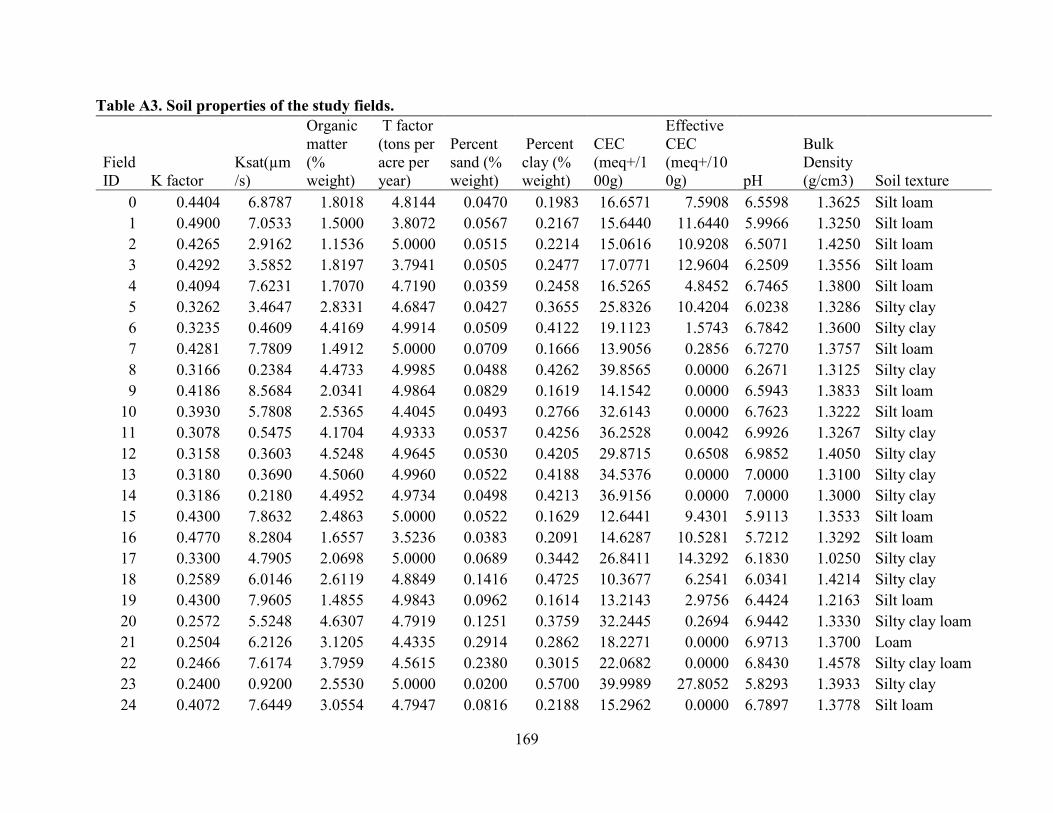
169
Table A3. Soil properties of the study fields.
Field ID K factor
Ksat(µm/s)
Organic matter (% weight)
T factor (tons per acre per year)
Percent sand (% weight)
Percent clay (% weight)
CEC (meq+/100g)
Effective CEC (meq+/100g) pH
Bulk Density (g/cm3) Soil texture
0 0.4404 6.8787 1.8018 4.8144 0.0470 0.1983 16.6571 7.5908 6.5598 1.3625 Silt loam
1 0.4900 7.0533 1.5000 3.8072 0.0567 0.2167 15.6440 11.6440 5.9966 1.3250 Silt loam
2 0.4265 2.9162 1.1536 5.0000 0.0515 0.2214 15.0616 10.9208 6.5071 1.4250 Silt loam
3 0.4292 3.5852 1.8197 3.7941 0.0505 0.2477 17.0771 12.9604 6.2509 1.3556 Silt loam
4 0.4094 7.6231 1.7070 4.7190 0.0359 0.2458 16.5265 4.8452 6.7465 1.3800 Silt loam
5 0.3262 3.4647 2.8331 4.6847 0.0427 0.3655 25.8326 10.4204 6.0238 1.3286 Silty clay
6 0.3235 0.4609 4.4169 4.9914 0.0509 0.4122 19.1123 1.5743 6.7842 1.3600 Silty clay
7 0.4281 7.7809 1.4912 5.0000 0.0709 0.1666 13.9056 0.2856 6.7270 1.3757 Silt loam
8 0.3166 0.2384 4.4733 4.9985 0.0488 0.4262 39.8565 0.0000 6.2671 1.3125 Silty clay
9 0.4186 8.5684 2.0341 4.9864 0.0829 0.1619 14.1542 0.0000 6.5943 1.3833 Silt loam
10 0.3930 5.7808 2.5365 4.4045 0.0493 0.2766 32.6143 0.0000 6.7623 1.3222 Silt loam
11 0.3078 0.5475 4.1704 4.9333 0.0537 0.4256 36.2528 0.0042 6.9926 1.3267 Silty clay
12 0.3158 0.3603 4.5248 4.9645 0.0530 0.4205 29.8715 0.6508 6.9852 1.4050 Silty clay
13 0.3180 0.3690 4.5060 4.9960 0.0522 0.4188 34.5376 0.0000 7.0000 1.3100 Silty clay
14 0.3186 0.2180 4.4952 4.9734 0.0498 0.4213 36.9156 0.0000 7.0000 1.3000 Silty clay
15 0.4300 7.8632 2.4863 5.0000 0.0522 0.1629 12.6441 9.4301 5.9113 1.3533 Silt loam
16 0.4770 8.2804 1.6557 3.5236 0.0383 0.2091 14.6287 10.5281 5.7212 1.3292 Silt loam
17 0.3300 4.7905 2.0698 5.0000 0.0689 0.3442 26.8411 14.3292 6.1830 1.0250 Silty clay
18 0.2589 6.0146 2.6119 4.8849 0.1416 0.4725 10.3677 6.2541 6.0341 1.4214 Silty clay
19 0.4300 7.9605 1.4855 4.9843 0.0962 0.1614 13.2143 2.9756 6.4424 1.2163 Silt loam
20 0.2572 5.5248 4.6307 4.7919 0.1251 0.3759 32.2445 0.2694 6.9442 1.3330 Silty clay loam
21 0.2504 6.2126 3.1205 4.4335 0.2914 0.2862 18.2271 0.0000 6.9713 1.3700 Loam
22 0.2466 7.6174 3.7959 4.5615 0.2380 0.3015 22.0682 0.0000 6.8430 1.4578 Silty clay loam
23 0.2400 0.9200 2.5530 5.0000 0.0200 0.5700 39.9989 27.8052 5.8293 1.3933 Silty clay
24 0.4072 7.6449 3.0554 4.7947 0.0816 0.2188 15.2962 0.0000 6.7897 1.3778 Silt loam
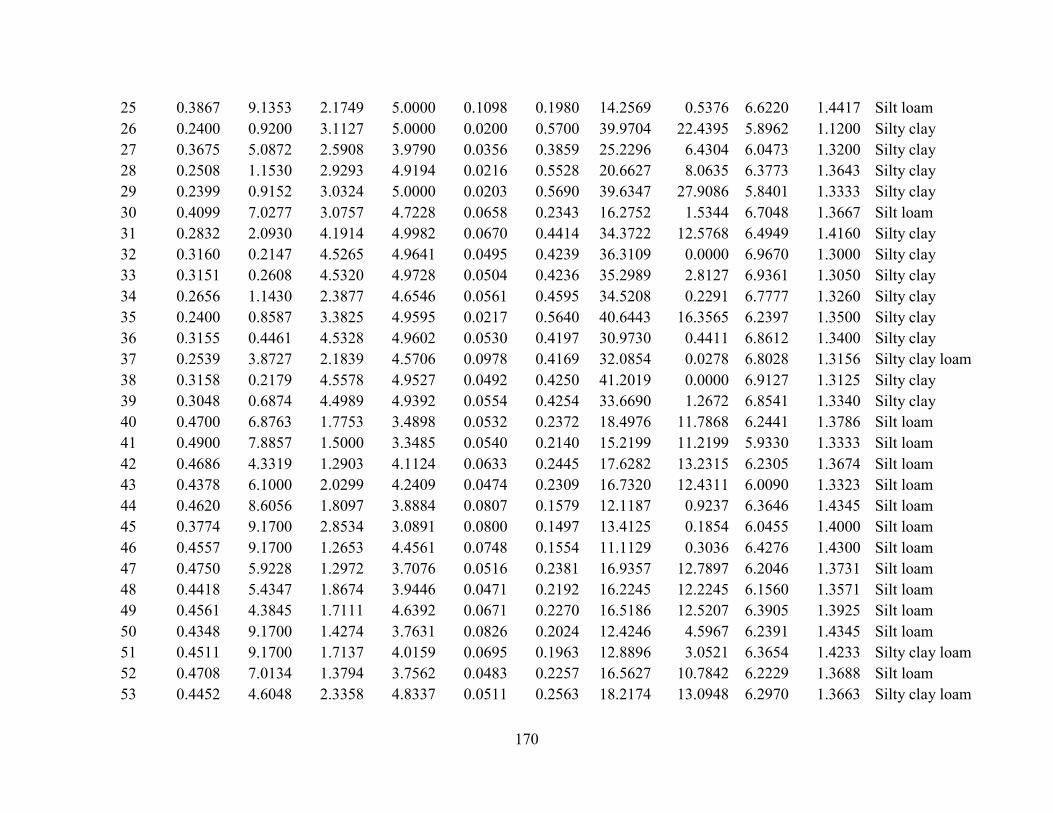
170
25 0.3867 9.1353 2.1749 5.0000 0.1098 0.1980 14.2569 0.5376 6.6220 1.4417 Silt loam
26 0.2400 0.9200 3.1127 5.0000 0.0200 0.5700 39.9704 22.4395 5.8962 1.1200 Silty clay
27 0.3675 5.0872 2.5908 3.9790 0.0356 0.3859 25.2296 6.4304 6.0473 1.3200 Silty clay
28 0.2508 1.1530 2.9293 4.9194 0.0216 0.5528 20.6627 8.0635 6.3773 1.3643 Silty clay
29 0.2399 0.9152 3.0324 5.0000 0.0203 0.5690 39.6347 27.9086 5.8401 1.3333 Silty clay
30 0.4099 7.0277 3.0757 4.7228 0.0658 0.2343 16.2752 1.5344 6.7048 1.3667 Silt loam
31 0.2832 2.0930 4.1914 4.9982 0.0670 0.4414 34.3722 12.5768 6.4949 1.4160 Silty clay
32 0.3160 0.2147 4.5265 4.9641 0.0495 0.4239 36.3109 0.0000 6.9670 1.3000 Silty clay
33 0.3151 0.2608 4.5320 4.9728 0.0504 0.4236 35.2989 2.8127 6.9361 1.3050 Silty clay
34 0.2656 1.1430 2.3877 4.6546 0.0561 0.4595 34.5208 0.2291 6.7777 1.3260 Silty clay
35 0.2400 0.8587 3.3825 4.9595 0.0217 0.5640 40.6443 16.3565 6.2397 1.3500 Silty clay
36 0.3155 0.4461 4.5328 4.9602 0.0530 0.4197 30.9730 0.4411 6.8612 1.3400 Silty clay
37 0.2539 3.8727 2.1839 4.5706 0.0978 0.4169 32.0854 0.0278 6.8028 1.3156 Silty clay loam
38 0.3158 0.2179 4.5578 4.9527 0.0492 0.4250 41.2019 0.0000 6.9127 1.3125 Silty clay
39 0.3048 0.6874 4.4989 4.9392 0.0554 0.4254 33.6690 1.2672 6.8541 1.3340 Silty clay
40 0.4700 6.8763 1.7753 3.4898 0.0532 0.2372 18.4976 11.7868 6.2441 1.3786 Silt loam
41 0.4900 7.8857 1.5000 3.3485 0.0540 0.2140 15.2199 11.2199 5.9330 1.3333 Silt loam
42 0.4686 4.3319 1.2903 4.1124 0.0633 0.2445 17.6282 13.2315 6.2305 1.3674 Silt loam
43 0.4378 6.1000 2.0299 4.2409 0.0474 0.2309 16.7320 12.4311 6.0090 1.3323 Silt loam
44 0.4620 8.6056 1.8097 3.8884 0.0807 0.1579 12.1187 0.9237 6.3646 1.4345 Silt loam
45 0.3774 9.1700 2.8534 3.0891 0.0800 0.1497 13.4125 0.1854 6.0455 1.4000 Silt loam
46 0.4557 9.1700 1.2653 4.4561 0.0748 0.1554 11.1129 0.3036 6.4276 1.4300 Silt loam
47 0.4750 5.9228 1.2972 3.7076 0.0516 0.2381 16.9357 12.7897 6.2046 1.3731 Silt loam
48 0.4418 5.4347 1.8674 3.9446 0.0471 0.2192 16.2245 12.2245 6.1560 1.3571 Silt loam
49 0.4561 4.3845 1.7111 4.6392 0.0671 0.2270 16.5186 12.5207 6.3905 1.3925 Silt loam
50 0.4348 9.1700 1.4274 3.7631 0.0826 0.2024 12.4246 4.5967 6.2391 1.4345 Silt loam
51 0.4511 9.1700 1.7137 4.0159 0.0695 0.1963 12.8896 3.0521 6.3654 1.4233 Silty clay loam
52 0.4708 7.0134 1.3794 3.7562 0.0483 0.2257 16.5627 10.7842 6.2229 1.3688 Silt loam
53 0.4452 4.6048 2.3358 4.8337 0.0511 0.2563 18.2174 13.0948 6.2970 1.3663 Silty clay loam

171
54 0.4656 5.8774 1.3980 3.7217 0.0533 0.2393 16.9405 12.6863 6.2131 1.3813 Silt loam
55 0.4443 4.0295 1.6906 4.3019 0.0610 0.2386 17.2058 13.0041 6.2897 1.4188 Silt loam
56 0.3990 9.1245 2.2320 3.8843 0.0768 0.1578 13.3106 2.4151 6.0741 1.3975 Silt loam
57 0.3980 4.7683 1.9003 3.7845 0.0503 0.2805 20.5484 15.4219 6.0922 1.3500 Silt loam
58 0.4500 5.4658 2.2515 4.7350 0.0463 0.2283 16.4623 8.8575 6.3437 1.3950 Silt loam
59 0.4433 8.2293 1.8393 4.5971 0.0441 0.2378 18.2161 4.6500 6.3816 1.3750 Silt loam
60 0.4364 8.8998 1.5703 3.6448 0.0406 0.2398 18.4669 2.0277 6.4137 1.3911 Silt loam
61 0.4561 9.1700 1.3721 4.8740 0.0352 0.1900 13.0000 10.0000 6.2000 1.3300 Silt loam
62 0.4093 9.1700 1.0880 3.5966 0.0934 0.2734 18.3531 2.6046 6.3665 1.4164 Silty clay loam
65 0.4328 9.1700 1.9170 3.9859 0.0395 0.2337 18.7460 0.9533 6.4651 1.3744 Silt loam
66 0.4300 9.1700 1.5769 3.6941 0.0400 0.2288 19.0000 0.0000 6.5000 1.4000 Silt loam
67 0.4364 9.1700 1.5999 3.7376 0.0454 0.2162 18.3839 3.4009 6.3584 1.4129 Silt loam
68 0.4300 8.8880 2.0758 4.5797 0.0490 0.2375 17.3152 1.9491 6.3757 1.3767 Silty clay loam
69 0.4093 9.1196 1.7588 4.5151 0.1186 0.2543 17.3481 7.0008 6.1650 1.4118 Silty clay loam
70 0.4400 9.7131 1.5506 4.4965 0.0340 0.1887 13.3244 10.0567 6.1645 1.3340 Silt loam
71 0.4319 9.1700 1.5487 3.9662 0.0394 0.2300 18.2440 1.2684 6.4608 1.3625 Silt loam
72 0.4259 9.1700 2.0243 4.0299 0.0494 0.2294 18.3603 0.4057 6.4640 1.4333 Silt loam
73 0.4365 9.1700 2.9046 4.6759 0.0480 0.1970 15.4772 4.8009 6.3140 1.3507 Silt loam
74 0.4234 9.1700 1.9757 3.9980 0.0546 0.2272 18.6604 0.5892 6.4563 1.4200 Silt loam
75 0.4321 9.1700 1.5146 3.8599 0.0396 0.2375 18.3981 1.0032 6.4699 1.3767 Silt loam
76 0.4362 9.1700 1.9056 3.9657 0.0390 0.2172 18.4651 3.2525 6.3756 1.3823 Silt loam
77 0.4510 9.0995 1.4508 4.7436 0.0370 0.1905 13.6735 8.7699 6.2236 1.3456 Silt loam
78 0.4818 9.1608 1.7914 3.4188 0.0782 0.1542 13.1788 0.9944 6.5256 1.4108 Silt loam
79 0.4838 9.1517 1.6997 3.1430 0.0787 0.1549 11.6147 0.5243 6.4597 1.4080 Silt loam
80 0.4575 3.0846 1.5660 4.4771 0.0588 0.2371 16.7987 12.6956 6.2618 1.3864 Silt loam
81 0.4420 6.3760 1.2977 4.8082 0.0500 0.2026 16.6975 10.0844 6.4151 1.4167 Silt loam
82 0.4584 7.5651 1.9125 3.3128 0.0693 0.1714 14.1275 6.3228 6.3332 1.4000 Silt loam
83 0.4894 9.1700 1.5647 3.0000 0.0800 0.1568 13.7156 0.0000 6.5852 1.4000 Silt loam
84 0.4334 9.1700 2.3350 3.1652 0.0798 0.1513 13.5140 0.0000 6.2350 1.4056 Silt loam
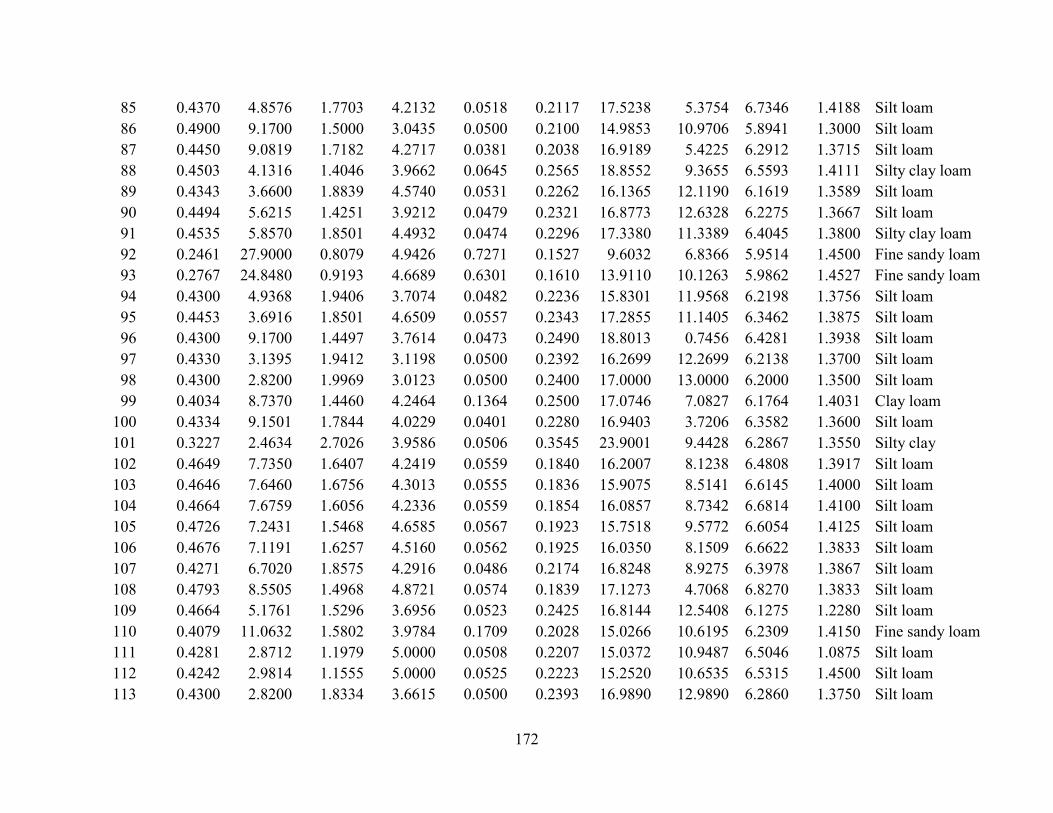
172
85 0.4370 4.8576 1.7703 4.2132 0.0518 0.2117 17.5238 5.3754 6.7346 1.4188 Silt loam
86 0.4900 9.1700 1.5000 3.0435 0.0500 0.2100 14.9853 10.9706 5.8941 1.3000 Silt loam
87 0.4450 9.0819 1.7182 4.2717 0.0381 0.2038 16.9189 5.4225 6.2912 1.3715 Silt loam
88 0.4503 4.1316 1.4046 3.9662 0.0645 0.2565 18.8552 9.3655 6.5593 1.4111 Silty clay loam
89 0.4343 3.6600 1.8839 4.5740 0.0531 0.2262 16.1365 12.1190 6.1619 1.3589 Silt loam
90 0.4494 5.6215 1.4251 3.9212 0.0479 0.2321 16.8773 12.6328 6.2275 1.3667 Silt loam
91 0.4535 5.8570 1.8501 4.4932 0.0474 0.2296 17.3380 11.3389 6.4045 1.3800 Silty clay loam
92 0.2461 27.9000 0.8079 4.9426 0.7271 0.1527 9.6032 6.8366 5.9514 1.4500 Fine sandy loam
93 0.2767 24.8480 0.9193 4.6689 0.6301 0.1610 13.9110 10.1263 5.9862 1.4527 Fine sandy loam
94 0.4300 4.9368 1.9406 3.7074 0.0482 0.2236 15.8301 11.9568 6.2198 1.3756 Silt loam
95 0.4453 3.6916 1.8501 4.6509 0.0557 0.2343 17.2855 11.1405 6.3462 1.3875 Silt loam
96 0.4300 9.1700 1.4497 3.7614 0.0473 0.2490 18.8013 0.7456 6.4281 1.3938 Silt loam
97 0.4330 3.1395 1.9412 3.1198 0.0500 0.2392 16.2699 12.2699 6.2138 1.3700 Silt loam
98 0.4300 2.8200 1.9969 3.0123 0.0500 0.2400 17.0000 13.0000 6.2000 1.3500 Silt loam
99 0.4034 8.7370 1.4460 4.2464 0.1364 0.2500 17.0746 7.0827 6.1764 1.4031 Clay loam
100 0.4334 9.1501 1.7844 4.0229 0.0401 0.2280 16.9403 3.7206 6.3582 1.3600 Silt loam
101 0.3227 2.4634 2.7026 3.9586 0.0506 0.3545 23.9001 9.4428 6.2867 1.3550 Silty clay
102 0.4649 7.7350 1.6407 4.2419 0.0559 0.1840 16.2007 8.1238 6.4808 1.3917 Silt loam
103 0.4646 7.6460 1.6756 4.3013 0.0555 0.1836 15.9075 8.5141 6.6145 1.4000 Silt loam
104 0.4664 7.6759 1.6056 4.2336 0.0559 0.1854 16.0857 8.7342 6.6814 1.4100 Silt loam
105 0.4726 7.2431 1.5468 4.6585 0.0567 0.1923 15.7518 9.5772 6.6054 1.4125 Silt loam
106 0.4676 7.1191 1.6257 4.5160 0.0562 0.1925 16.0350 8.1509 6.6622 1.3833 Silt loam
107 0.4271 6.7020 1.8575 4.2916 0.0486 0.2174 16.8248 8.9275 6.3978 1.3867 Silt loam
108 0.4793 8.5505 1.4968 4.8721 0.0574 0.1839 17.1273 4.7068 6.8270 1.3833 Silt loam
109 0.4664 5.1761 1.5296 3.6956 0.0523 0.2425 16.8144 12.5408 6.1275 1.2280 Silt loam
110 0.4079 11.0632 1.5802 3.9784 0.1709 0.2028 15.0266 10.6195 6.2309 1.4150 Fine sandy loam
111 0.4281 2.8712 1.1979 5.0000 0.0508 0.2207 15.0372 10.9487 6.5046 1.0875 Silt loam
112 0.4242 2.9814 1.1555 5.0000 0.0525 0.2223 15.2520 10.6535 6.5315 1.4500 Silt loam
113 0.4300 2.8200 1.8334 3.6615 0.0500 0.2393 16.9890 12.9890 6.2860 1.3750 Silt loam

173
114 0.4137 2.6566 1.9211 3.5037 0.0509 0.2655 20.6302 15.6832 6.2957 1.3875 Silt loam
115 0.4101 3.3513 1.6684 4.0702 0.0540 0.2715 16.6775 10.2427 6.4629 1.3958 Silt loam
116 0.4132 7.6700 1.7139 4.6843 0.0367 0.2413 17.5118 6.4792 6.5962 1.3467 Silt loam
117 0.3664 6.5178 1.8581 4.7549 0.0460 0.2792 18.1377 0.0000 6.9006 1.3500 Silt loam
118 0.4388 9.1700 1.6120 4.6848 0.0489 0.1733 13.5384 0.0000 6.8895 1.3750 Silt loam
119 0.3327 3.4241 2.7966 4.6985 0.0463 0.3551 25.6791 5.5851 6.0507 1.3375 Silty clay
120 0.4133 7.6421 1.8093 5.0000 0.0552 0.1960 13.7057 0.0659 6.6508 1.3857 Silt loam
121 0.2383 0.7482 3.4847 4.9805 0.0292 0.5354 36.4047 6.5370 6.0792 1.3100 Silty clay
122 0.3128 0.9273 4.4830 5.0000 0.0603 0.4128 29.5974 0.0000 6.8768 1.3200 Silty clay
123 0.3629 6.7207 1.8524 4.7450 0.0430 0.2835 16.6546 0.0000 6.7761 1.3400 Silt loam
124 0.3167 0.4836 4.5155 4.9897 0.0539 0.4178 34.3495 0.0000 7.0000 1.3450 Silty clay
125 0.3164 0.4591 4.5257 4.9828 0.0534 0.4186 32.7164 0.0000 7.0000 1.2860 Silty clay
126 0.3149 0.3535 4.4871 4.9802 0.0515 0.4249 32.3473 0.0000 6.9624 1.3811 Silty clay
127 0.3183 0.2123 4.5395 4.9718 0.0498 0.4216 36.8776 0.0000 6.9997 1.2900 Silty clay
128 0.3169 0.4608 4.5123 4.9918 0.0535 0.4180 37.3021 0.0000 7.0000 1.3100 Silty clay
129 0.3165 1.1390 4.3420 4.9986 0.0601 0.4056 26.3394 12.3707 6.3302 1.3550 Silty clay
130 0.3183 3.4342 2.5426 3.8576 0.0360 0.4474 25.1715 7.8079 6.0535 1.3750 Silty clay
131 0.3256 3.5404 2.4427 3.9813 0.0361 0.4385 35.9624 2.9843 6.2294 1.3800 Silty clay
132 0.3188 0.2684 4.4897 4.9738 0.0509 0.4203 35.4341 5.2093 6.6802 1.3867 Silty clay
133 0.3189 0.2467 4.5275 4.9548 0.0504 0.4207 34.9770 6.9748 6.8253 1.3286 Silty clay
134 0.3845 6.5687 2.5186 4.9020 0.0603 0.2565 22.4038 0.0000 6.8759 1.3500 Silt loam
135 0.3165 0.2694 4.4623 5.0000 0.0504 0.4250 36.2079 0.0000 6.5756 1.4200 Silty clay
136 0.4272 8.6545 1.9330 4.3967 0.0858 0.1704 15.0479 0.0068 6.7129 1.3650 Silt loam
137 0.4368 9.1700 1.6869 3.8756 0.0909 0.1792 13.9899 0.0085 6.6998 1.3686 Silt loam
138 0.4169 9.1700 2.0376 5.0000 0.0838 0.1578 14.5519 0.0000 6.5891 1.3917 Silt loam
139 0.3198 0.2311 4.5128 4.9864 0.0504 0.4196 33.6958 3.6362 6.9174 1.3167 Silty clay
140 0.3159 0.5618 4.4683 4.9892 0.0633 0.4126 22.5520 1.2893 6.9707 1.3475 Silty clay
141 0.3184 0.4192 4.4708 4.9901 0.0580 0.4148 18.6770 0.7624 6.9827 1.4140 Silty clay
142 0.3195 0.2724 4.4990 4.9925 0.0510 0.4192 32.1503 4.0212 6.9086 1.3822 Silty clay
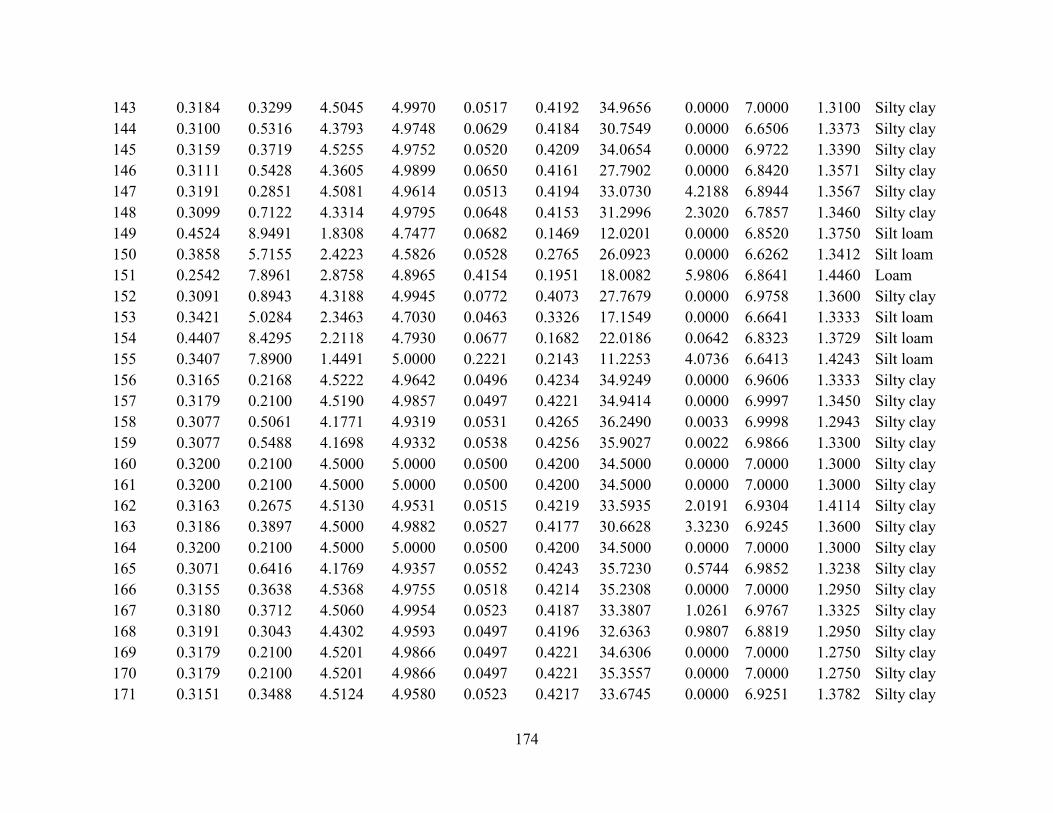
174
143 0.3184 0.3299 4.5045 4.9970 0.0517 0.4192 34.9656 0.0000 7.0000 1.3100 Silty clay
144 0.3100 0.5316 4.3793 4.9748 0.0629 0.4184 30.7549 0.0000 6.6506 1.3373 Silty clay
145 0.3159 0.3719 4.5255 4.9752 0.0520 0.4209 34.0654 0.0000 6.9722 1.3390 Silty clay
146 0.3111 0.5428 4.3605 4.9899 0.0650 0.4161 27.7902 0.0000 6.8420 1.3571 Silty clay
147 0.3191 0.2851 4.5081 4.9614 0.0513 0.4194 33.0730 4.2188 6.8944 1.3567 Silty clay
148 0.3099 0.7122 4.3314 4.9795 0.0648 0.4153 31.2996 2.3020 6.7857 1.3460 Silty clay
149 0.4524 8.9491 1.8308 4.7477 0.0682 0.1469 12.0201 0.0000 6.8520 1.3750 Silt loam
150 0.3858 5.7155 2.4223 4.5826 0.0528 0.2765 26.0923 0.0000 6.6262 1.3412 Silt loam
151 0.2542 7.8961 2.8758 4.8965 0.4154 0.1951 18.0082 5.9806 6.8641 1.4460 Loam
152 0.3091 0.8943 4.3188 4.9945 0.0772 0.4073 27.7679 0.0000 6.9758 1.3600 Silty clay
153 0.3421 5.0284 2.3463 4.7030 0.0463 0.3326 17.1549 0.0000 6.6641 1.3333 Silt loam
154 0.4407 8.4295 2.2118 4.7930 0.0677 0.1682 22.0186 0.0642 6.8323 1.3729 Silt loam
155 0.3407 7.8900 1.4491 5.0000 0.2221 0.2143 11.2253 4.0736 6.6413 1.4243 Silt loam
156 0.3165 0.2168 4.5222 4.9642 0.0496 0.4234 34.9249 0.0000 6.9606 1.3333 Silty clay
157 0.3179 0.2100 4.5190 4.9857 0.0497 0.4221 34.9414 0.0000 6.9997 1.3450 Silty clay
158 0.3077 0.5061 4.1771 4.9319 0.0531 0.4265 36.2490 0.0033 6.9998 1.2943 Silty clay
159 0.3077 0.5488 4.1698 4.9332 0.0538 0.4256 35.9027 0.0022 6.9866 1.3300 Silty clay
160 0.3200 0.2100 4.5000 5.0000 0.0500 0.4200 34.5000 0.0000 7.0000 1.3000 Silty clay
161 0.3200 0.2100 4.5000 5.0000 0.0500 0.4200 34.5000 0.0000 7.0000 1.3000 Silty clay
162 0.3163 0.2675 4.5130 4.9531 0.0515 0.4219 33.5935 2.0191 6.9304 1.4114 Silty clay
163 0.3186 0.3897 4.5000 4.9882 0.0527 0.4177 30.6628 3.3230 6.9245 1.3600 Silty clay
164 0.3200 0.2100 4.5000 5.0000 0.0500 0.4200 34.5000 0.0000 7.0000 1.3000 Silty clay
165 0.3071 0.6416 4.1769 4.9357 0.0552 0.4243 35.7230 0.5744 6.9852 1.3238 Silty clay
166 0.3155 0.3638 4.5368 4.9755 0.0518 0.4214 35.2308 0.0000 7.0000 1.2950 Silty clay
167 0.3180 0.3712 4.5060 4.9954 0.0523 0.4187 33.3807 1.0261 6.9767 1.3325 Silty clay
168 0.3191 0.3043 4.4302 4.9593 0.0497 0.4196 32.6363 0.9807 6.8819 1.2950 Silty clay
169 0.3179 0.2100 4.5201 4.9866 0.0497 0.4221 34.6306 0.0000 7.0000 1.2750 Silty clay
170 0.3179 0.2100 4.5201 4.9866 0.0497 0.4221 35.3557 0.0000 7.0000 1.2750 Silty clay
171 0.3151 0.3488 4.5124 4.9580 0.0523 0.4217 33.6745 0.0000 6.9251 1.3782 Silty clay
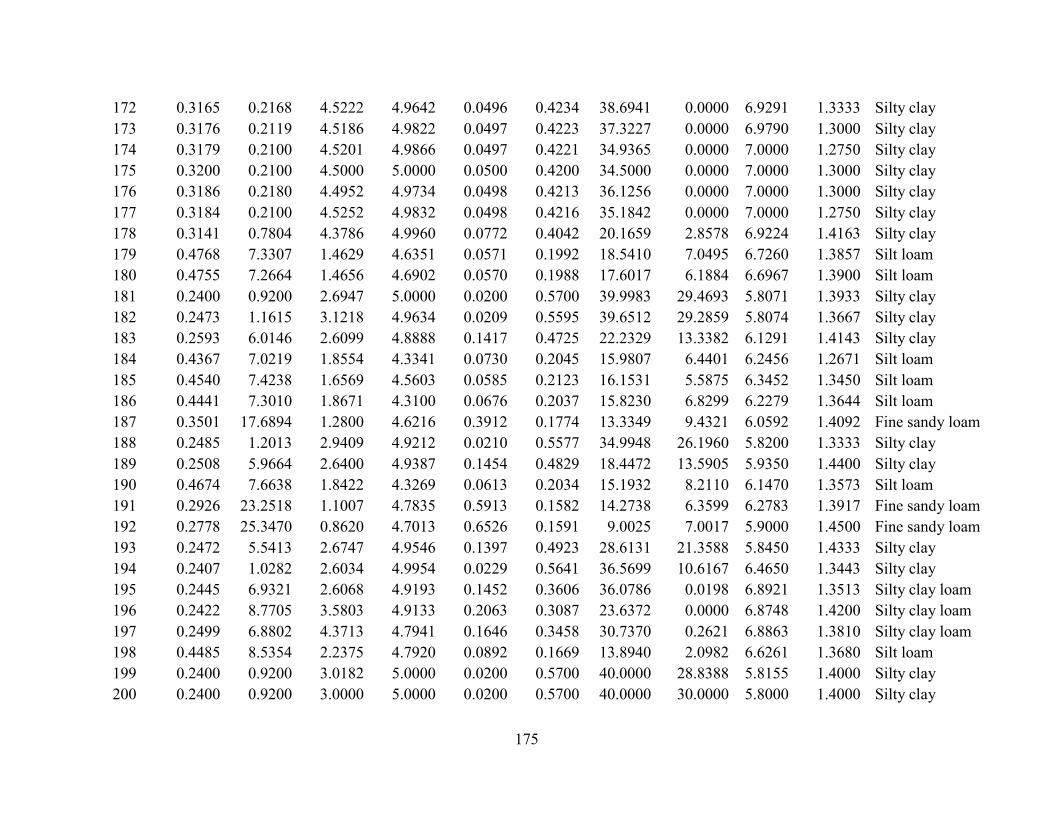
175
172 0.3165 0.2168 4.5222 4.9642 0.0496 0.4234 38.6941 0.0000 6.9291 1.3333 Silty clay
173 0.3176 0.2119 4.5186 4.9822 0.0497 0.4223 37.3227 0.0000 6.9790 1.3000 Silty clay
174 0.3179 0.2100 4.5201 4.9866 0.0497 0.4221 34.9365 0.0000 7.0000 1.2750 Silty clay
175 0.3200 0.2100 4.5000 5.0000 0.0500 0.4200 34.5000 0.0000 7.0000 1.3000 Silty clay
176 0.3186 0.2180 4.4952 4.9734 0.0498 0.4213 36.1256 0.0000 7.0000 1.3000 Silty clay
177 0.3184 0.2100 4.5252 4.9832 0.0498 0.4216 35.1842 0.0000 7.0000 1.2750 Silty clay
178 0.3141 0.7804 4.3786 4.9960 0.0772 0.4042 20.1659 2.8578 6.9224 1.4163 Silty clay
179 0.4768 7.3307 1.4629 4.6351 0.0571 0.1992 18.5410 7.0495 6.7260 1.3857 Silt loam
180 0.4755 7.2664 1.4656 4.6902 0.0570 0.1988 17.6017 6.1884 6.6967 1.3900 Silt loam
181 0.2400 0.9200 2.6947 5.0000 0.0200 0.5700 39.9983 29.4693 5.8071 1.3933 Silty clay
182 0.2473 1.1615 3.1218 4.9634 0.0209 0.5595 39.6512 29.2859 5.8074 1.3667 Silty clay
183 0.2593 6.0146 2.6099 4.8888 0.1417 0.4725 22.2329 13.3382 6.1291 1.4143 Silty clay
184 0.4367 7.0219 1.8554 4.3341 0.0730 0.2045 15.9807 6.4401 6.2456 1.2671 Silt loam
185 0.4540 7.4238 1.6569 4.5603 0.0585 0.2123 16.1531 5.5875 6.3452 1.3450 Silt loam
186 0.4441 7.3010 1.8671 4.3100 0.0676 0.2037 15.8230 6.8299 6.2279 1.3644 Silt loam
187 0.3501 17.6894 1.2800 4.6216 0.3912 0.1774 13.3349 9.4321 6.0592 1.4092 Fine sandy loam
188 0.2485 1.2013 2.9409 4.9212 0.0210 0.5577 34.9948 26.1960 5.8200 1.3333 Silty clay
189 0.2508 5.9664 2.6400 4.9387 0.1454 0.4829 18.4472 13.5905 5.9350 1.4400 Silty clay
190 0.4674 7.6638 1.8422 4.3269 0.0613 0.2034 15.1932 8.2110 6.1470 1.3573 Silt loam
191 0.2926 23.2518 1.1007 4.7835 0.5913 0.1582 14.2738 6.3599 6.2783 1.3917 Fine sandy loam
192 0.2778 25.3470 0.8620 4.7013 0.6526 0.1591 9.0025 7.0017 5.9000 1.4500 Fine sandy loam
193 0.2472 5.5413 2.6747 4.9546 0.1397 0.4923 28.6131 21.3588 5.8450 1.4333 Silty clay
194 0.2407 1.0282 2.6034 4.9954 0.0229 0.5641 36.5699 10.6167 6.4650 1.3443 Silty clay
195 0.2445 6.9321 2.6068 4.9193 0.1452 0.3606 36.0786 0.0198 6.8921 1.3513 Silty clay loam
196 0.2422 8.7705 3.5803 4.9133 0.2063 0.3087 23.6372 0.0000 6.8748 1.4200 Silty clay loam
197 0.2499 6.8802 4.3713 4.7941 0.1646 0.3458 30.7370 0.2621 6.8863 1.3810 Silty clay loam
198 0.4485 8.5354 2.2375 4.7920 0.0892 0.1669 13.8940 2.0982 6.6261 1.3680 Silt loam
199 0.2400 0.9200 3.0182 5.0000 0.0200 0.5700 40.0000 28.8388 5.8155 1.4000 Silty clay
200 0.2400 0.9200 3.0000 5.0000 0.0200 0.5700 40.0000 30.0000 5.8000 1.4000 Silty clay
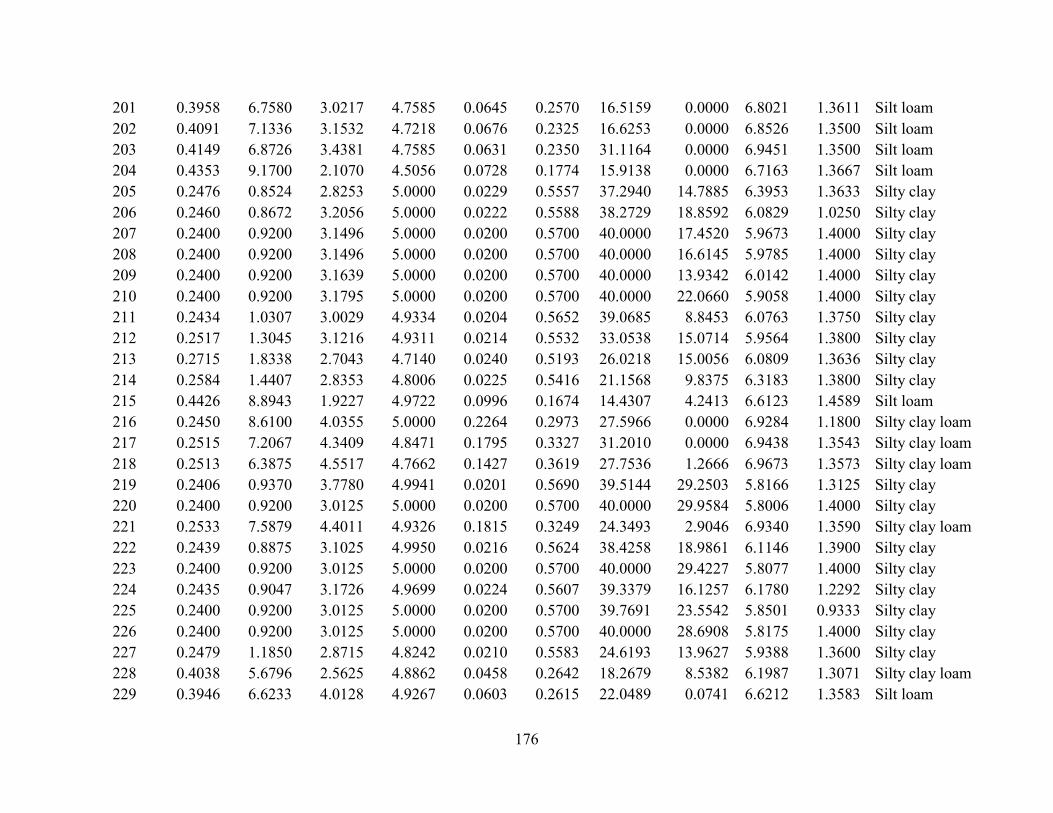
176
201 0.3958 6.7580 3.0217 4.7585 0.0645 0.2570 16.5159 0.0000 6.8021 1.3611 Silt loam
202 0.4091 7.1336 3.1532 4.7218 0.0676 0.2325 16.6253 0.0000 6.8526 1.3500 Silt loam
203 0.4149 6.8726 3.4381 4.7585 0.0631 0.2350 31.1164 0.0000 6.9451 1.3500 Silt loam
204 0.4353 9.1700 2.1070 4.5056 0.0728 0.1774 15.9138 0.0000 6.7163 1.3667 Silt loam
205 0.2476 0.8524 2.8253 5.0000 0.0229 0.5557 37.2940 14.7885 6.3953 1.3633 Silty clay
206 0.2460 0.8672 3.2056 5.0000 0.0222 0.5588 38.2729 18.8592 6.0829 1.0250 Silty clay
207 0.2400 0.9200 3.1496 5.0000 0.0200 0.5700 40.0000 17.4520 5.9673 1.4000 Silty clay
208 0.2400 0.9200 3.1496 5.0000 0.0200 0.5700 40.0000 16.6145 5.9785 1.4000 Silty clay
209 0.2400 0.9200 3.1639 5.0000 0.0200 0.5700 40.0000 13.9342 6.0142 1.4000 Silty clay
210 0.2400 0.9200 3.1795 5.0000 0.0200 0.5700 40.0000 22.0660 5.9058 1.4000 Silty clay
211 0.2434 1.0307 3.0029 4.9334 0.0204 0.5652 39.0685 8.8453 6.0763 1.3750 Silty clay
212 0.2517 1.3045 3.1216 4.9311 0.0214 0.5532 33.0538 15.0714 5.9564 1.3800 Silty clay
213 0.2715 1.8338 2.7043 4.7140 0.0240 0.5193 26.0218 15.0056 6.0809 1.3636 Silty clay
214 0.2584 1.4407 2.8353 4.8006 0.0225 0.5416 21.1568 9.8375 6.3183 1.3800 Silty clay
215 0.4426 8.8943 1.9227 4.9722 0.0996 0.1674 14.4307 4.2413 6.6123 1.4589 Silt loam
216 0.2450 8.6100 4.0355 5.0000 0.2264 0.2973 27.5966 0.0000 6.9284 1.1800 Silty clay loam
217 0.2515 7.2067 4.3409 4.8471 0.1795 0.3327 31.2010 0.0000 6.9438 1.3543 Silty clay loam
218 0.2513 6.3875 4.5517 4.7662 0.1427 0.3619 27.7536 1.2666 6.9673 1.3573 Silty clay loam
219 0.2406 0.9370 3.7780 4.9941 0.0201 0.5690 39.5144 29.2503 5.8166 1.3125 Silty clay
220 0.2400 0.9200 3.0125 5.0000 0.0200 0.5700 40.0000 29.9584 5.8006 1.4000 Silty clay
221 0.2533 7.5879 4.4011 4.9326 0.1815 0.3249 24.3493 2.9046 6.9340 1.3590 Silty clay loam
222 0.2439 0.8875 3.1025 4.9950 0.0216 0.5624 38.4258 18.9861 6.1146 1.3900 Silty clay
223 0.2400 0.9200 3.0125 5.0000 0.0200 0.5700 40.0000 29.4227 5.8077 1.4000 Silty clay
224 0.2435 0.9047 3.1726 4.9699 0.0224 0.5607 39.3379 16.1257 6.1780 1.2292 Silty clay
225 0.2400 0.9200 3.0125 5.0000 0.0200 0.5700 39.7691 23.5542 5.8501 0.9333 Silty clay
226 0.2400 0.9200 3.0125 5.0000 0.0200 0.5700 40.0000 28.6908 5.8175 1.4000 Silty clay
227 0.2479 1.1850 2.8715 4.8242 0.0210 0.5583 24.6193 13.9627 5.9388 1.3600 Silty clay
228 0.4038 5.6796 2.5625 4.8862 0.0458 0.2642 18.2679 8.5382 6.1987 1.3071 Silty clay loam
229 0.3946 6.6233 4.0128 4.9267 0.0603 0.2615 22.0489 0.0741 6.6212 1.3583 Silt loam

177
230 0.2400 0.9099 3.5392 4.9789 0.0203 0.5690 39.9918 2.8904 6.1639 1.3700 Silty clay
231 0.2547 3.6411 4.1223 4.9742 0.0813 0.4549 37.4571 0.4394 6.5297 1.3300 Silty clay
232 0.3170 0.2223 4.4402 5.0000 0.0497 0.4226 34.5886 0.0000 6.7873 1.3000 Silty clay
233 0.2548 3.6651 4.1056 4.9828 0.0816 0.4546 32.9152 1.8825 6.9551 1.3460 Silty clay
234 0.2844 2.1090 4.3616 4.9916 0.0673 0.4389 29.8429 3.1179 6.8231 1.3700 Silty clay
235 0.2400 0.9200 3.3273 5.0000 0.0200 0.5700 40.0000 0.0003 6.2000 1.4000 Silty clay
236 0.2400 0.9200 3.3709 5.0000 0.0200 0.5700 40.0000 24.1031 5.8786 1.4000 Silty clay
237 0.2403 0.9281 3.4067 4.8727 0.0203 0.5691 39.6963 8.8055 6.0998 1.4000 Silty clay
238 0.3162 0.2100 4.5252 4.9832 0.0495 0.4238 34.5436 0.0000 7.0000 1.2750 Silty clay
239 0.3063 3.7047 2.7257 4.4039 0.0334 0.4429 27.2890 4.5523 5.9486 1.3200 Silty clay
240 0.2743 2.0507 2.8049 4.7399 0.0241 0.5207 37.2151 27.8835 5.8111 1.3333 Silty clay
241 0.2639 1.7085 2.9438 4.8203 0.0229 0.5356 33.1373 23.2835 5.8475 1.3800 Silty clay
242 0.2708 2.0814 2.7414 4.7478 0.0247 0.5167 27.8694 13.8710 5.9426 1.3722 Silty clay
243 0.2585 0.7233 3.5987 5.0000 0.0287 0.5284 36.9434 13.0371 6.3507 1.3250 Silty clay
244 0.2400 0.7823 3.9299 4.8280 0.0239 0.5564 40.2016 0.0000 6.2807 1.3250 Silty clay
245 0.2526 3.3086 4.2197 4.9035 0.0768 0.4608 37.4345 0.0000 6.7552 1.3560 Silty clay
246 0.2425 1.7637 3.5166 4.8649 0.0409 0.5307 38.1041 17.9971 6.0684 1.3660 Silty clay
247 0.2862 0.8838 4.1144 4.9663 0.0455 0.4691 36.6987 3.7234 6.4989 1.3600 Silty clay
248 0.2874 1.3946 4.1327 4.9754 0.0754 0.4414 29.6301 0.0000 6.6823 1.3883 Silty clay
249 0.2537 3.2738 4.2011 4.8894 0.0775 0.4595 35.3806 2.2691 6.6902 1.3982 Silty clay
250 0.2400 0.9200 3.3709 5.0000 0.0200 0.5700 40.0000 19.3522 5.9420 1.4000 Silty clay
251 0.2474 3.5405 4.2671 4.9259 0.0788 0.4641 31.2868 0.1405 6.9881 1.3300 Silty clay
252 0.2418 2.0714 3.2369 4.8243 0.0947 0.4950 38.3146 18.1378 6.2633 1.4200 Silty clay
253 0.3172 0.3866 4.4858 4.9282 0.0548 0.4175 32.9899 7.8215 6.7998 1.3422 Silty clay
254 0.3195 0.4127 4.5142 4.9562 0.0538 0.4151 32.4276 11.6353 6.7356 1.3375 Silty clay
255 0.2925 0.4439 4.2522 4.9652 0.0400 0.4705 38.1797 6.4479 6.4031 1.3200 Silty clay
256 0.3146 0.2769 4.5379 4.9614 0.0506 0.4236 35.8719 0.6564 6.9851 1.3125 Silty clay
257 0.3119 0.9356 4.4334 4.9664 0.0647 0.4100 26.5475 8.1364 6.7059 1.3850 Silty clay
258 0.3135 0.4003 4.5355 4.9737 0.0522 0.4225 36.5855 2.1751 6.9506 1.3157 Silty clay
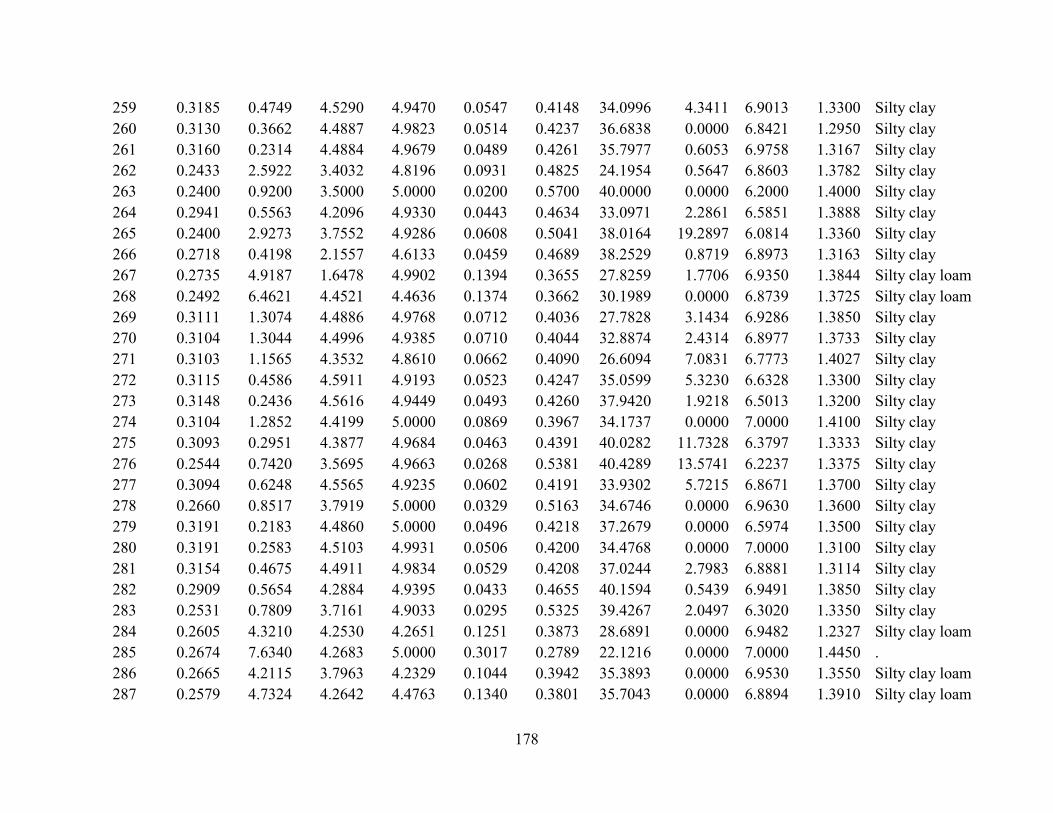
178
259 0.3185 0.4749 4.5290 4.9470 0.0547 0.4148 34.0996 4.3411 6.9013 1.3300 Silty clay
260 0.3130 0.3662 4.4887 4.9823 0.0514 0.4237 36.6838 0.0000 6.8421 1.2950 Silty clay
261 0.3160 0.2314 4.4884 4.9679 0.0489 0.4261 35.7977 0.6053 6.9758 1.3167 Silty clay
262 0.2433 2.5922 3.4032 4.8196 0.0931 0.4825 24.1954 0.5647 6.8603 1.3782 Silty clay
263 0.2400 0.9200 3.5000 5.0000 0.0200 0.5700 40.0000 0.0000 6.2000 1.4000 Silty clay
264 0.2941 0.5563 4.2096 4.9330 0.0443 0.4634 33.0971 2.2861 6.5851 1.3888 Silty clay
265 0.2400 2.9273 3.7552 4.9286 0.0608 0.5041 38.0164 19.2897 6.0814 1.3360 Silty clay
266 0.2718 0.4198 2.1557 4.6133 0.0459 0.4689 38.2529 0.8719 6.8973 1.3163 Silty clay
267 0.2735 4.9187 1.6478 4.9902 0.1394 0.3655 27.8259 1.7706 6.9350 1.3844 Silty clay loam
268 0.2492 6.4621 4.4521 4.4636 0.1374 0.3662 30.1989 0.0000 6.8739 1.3725 Silty clay loam
269 0.3111 1.3074 4.4886 4.9768 0.0712 0.4036 27.7828 3.1434 6.9286 1.3850 Silty clay
270 0.3104 1.3044 4.4996 4.9385 0.0710 0.4044 32.8874 2.4314 6.8977 1.3733 Silty clay
271 0.3103 1.1565 4.3532 4.8610 0.0662 0.4090 26.6094 7.0831 6.7773 1.4027 Silty clay
272 0.3115 0.4586 4.5911 4.9193 0.0523 0.4247 35.0599 5.3230 6.6328 1.3300 Silty clay
273 0.3148 0.2436 4.5616 4.9449 0.0493 0.4260 37.9420 1.9218 6.5013 1.3200 Silty clay
274 0.3104 1.2852 4.4199 5.0000 0.0869 0.3967 34.1737 0.0000 7.0000 1.4100 Silty clay
275 0.3093 0.2951 4.3877 4.9684 0.0463 0.4391 40.0282 11.7328 6.3797 1.3333 Silty clay
276 0.2544 0.7420 3.5695 4.9663 0.0268 0.5381 40.4289 13.5741 6.2237 1.3375 Silty clay
277 0.3094 0.6248 4.5565 4.9235 0.0602 0.4191 33.9302 5.7215 6.8671 1.3700 Silty clay
278 0.2660 0.8517 3.7919 5.0000 0.0329 0.5163 34.6746 0.0000 6.9630 1.3600 Silty clay
279 0.3191 0.2183 4.4860 5.0000 0.0496 0.4218 37.2679 0.0000 6.5974 1.3500 Silty clay
280 0.3191 0.2583 4.5103 4.9931 0.0506 0.4200 34.4768 0.0000 7.0000 1.3100 Silty clay
281 0.3154 0.4675 4.4911 4.9834 0.0529 0.4208 37.0244 2.7983 6.8881 1.3114 Silty clay
282 0.2909 0.5654 4.2884 4.9395 0.0433 0.4655 40.1594 0.5439 6.9491 1.3850 Silty clay
283 0.2531 0.7809 3.7161 4.9033 0.0295 0.5325 39.4267 2.0497 6.3020 1.3350 Silty clay
284 0.2605 4.3210 4.2530 4.2651 0.1251 0.3873 28.6891 0.0000 6.9482 1.2327 Silty clay loam
285 0.2674 7.6340 4.2683 5.0000 0.3017 0.2789 22.1216 0.0000 7.0000 1.4450 .
286 0.2665 4.2115 3.7963 4.2329 0.1044 0.3942 35.3893 0.0000 6.9530 1.3550 Silty clay loam
287 0.2579 4.7324 4.2642 4.4763 0.1340 0.3801 35.7043 0.0000 6.8894 1.3910 Silty clay loam

179
288 0.3109 0.2479 4.3484 5.0000 0.0489 0.4280 34.9253 0.0000 5.9793 1.3000 Silty clay
289 0.1500 0.9200 2.8710 5.0000 0.0300 0.5700 34.9987 0.0000 5.8002 1.3400 Silty clay
290 0.3152 0.6392 4.4673 4.9920 0.0632 0.4124 29.3315 0.0000 7.0000 1.4300 Silty clay
291 0.3152 0.6392 4.4741 4.9876 0.0632 0.4124 23.6238 0.0000 7.0000 1.4043 Silty clay
292 0.3151 0.3710 4.5402 4.9411 0.0571 0.4188 34.4060 4.3540 6.9010 1.3417 Silty clay
293 0.2637 4.8825 4.5070 4.7652 0.1154 0.3828 30.4885 0.0000 6.9087 1.3360 Silty clay loam
294 0.2444 3.9827 1.9110 4.8819 0.1520 0.3951 29.1472 0.0001 6.9741 1.0760 Silty clay
295 0.3124 0.4727 4.5453 4.9483 0.0526 0.4236 36.1656 2.8329 6.7639 1.3430 Silty clay
296 0.3151 0.2238 4.5552 4.9530 0.0490 0.4262 37.7748 0.0000 6.9997 1.3100 Silty clay
297 0.2718 4.2968 3.4943 4.6712 0.2153 0.3276 21.0567 3.0634 6.9016 1.2300 Loam
298 0.3155 0.5945 4.4759 4.9902 0.0607 0.4140 27.4381 0.0000 7.0000 1.3517 Silty clay
299 0.2456 4.8571 4.2350 4.3953 0.2247 0.3418 30.6974 0.0000 6.4971 1.2060 Loam
300 0.3045 0.6987 4.0907 4.9481 0.0555 0.4256 36.4640 0.1152 6.9708 1.3244 Silty clay
301 0.4846 8.6001 1.5255 3.0000 0.0500 0.2127 15.5658 11.5658 5.9849 1.3250 Silt loam
302 0.4900 8.9126 1.4516 3.0825 0.0503 0.2130 15.4127 11.3393 5.9509 1.3667 Silt loam
303 0.4246 2.9578 2.5168 4.6483 0.0598 0.2820 22.4191 8.7494 6.4603 1.3500 Silt loam
304 0.4425 6.7308 2.4838 4.9838 0.0646 0.1579 11.0037 8.4820 6.1360 1.0825 Silt loam
305 0.2995 1.3724 1.9733 5.0000 0.0624 0.4662 34.6786 26.0665 5.8921 1.3967 Silty clay
306 0.4574 8.7244 1.7076 3.2424 0.0781 0.1618 12.2986 2.1450 6.4279 1.4273 Silt loam
307 0.4574 7.2374 1.9477 4.3427 0.0680 0.1889 13.3724 3.4662 6.3980 1.4100 Silt loam
308 0.4532 6.5071 1.8860 4.6718 0.0742 0.1987 14.8849 8.1543 6.3731 1.4150 Silt loam
309 0.4653 7.4891 1.4152 3.9007 0.0397 0.2126 16.9313 10.9019 6.1427 1.3836 Silt loam
310 0.4897 9.1378 1.3636 3.9673 0.0798 0.1542 13.6803 0.1568 6.5989 1.4125 Silt loam
311 0.4842 9.1700 1.3741 4.0021 0.0793 0.1544 11.9226 0.0000 6.4929 1.4125 Silt loam
312 0.3726 9.1700 2.9522 3.0000 0.0800 0.1492 13.3333 0.0000 6.0333 1.4000 Silt loam
313 0.4686 6.2348 1.7103 4.4736 0.0500 0.2321 16.3192 12.1766 6.1095 1.3714 Silt loam
314 0.4668 5.8507 1.7079 3.6652 0.0524 0.2227 15.8478 11.8478 6.0446 1.3556 Silt loam
315 0.4500 4.7956 1.3954 3.7731 0.0476 0.2420 17.0649 12.7358 6.2987 1.3600 Silt loam
316 0.4515 9.1700 1.8020 4.0744 0.0724 0.1877 13.7668 3.7647 6.3702 1.4271 Silt loam

180
317 0.4616 9.1700 1.6993 3.0526 0.0770 0.1579 13.6684 0.8474 6.3821 1.3969 Silt loam
318 0.4239 9.0659 1.6903 4.4806 0.1061 0.1772 12.4031 4.2977 6.2359 1.4460 Silt loam
319 0.4589 9.1700 1.7180 3.8679 0.0865 0.1742 13.6409 3.5242 6.3651 1.4295 Silt loam
320 0.4823 9.1442 1.5603 3.1283 0.0777 0.1657 14.2426 3.8752 6.3817 1.4120 Silt loam
321 0.4825 9.1700 1.4370 3.0162 0.0771 0.1704 12.8187 0.1864 6.5393 1.4200 Silt loam
322 0.4543 9.0693 1.5996 3.8868 0.0683 0.1845 13.4909 5.4041 6.2515 1.4200 Silt loam
323 0.4476 9.1700 1.8360 4.1200 0.0693 0.1935 13.4555 4.3392 6.3189 1.4167 Silt loam
324 0.4819 9.1700 1.4435 3.0233 0.0771 0.1694 13.1221 1.0790 6.5039 1.4278 Silt loam
325 0.4669 5.9043 1.5101 3.4044 0.0491 0.2373 17.8748 12.2216 6.3758 1.3591 Silt loam
326 0.4405 4.2682 1.9221 4.6537 0.0570 0.2363 16.7650 11.8143 6.3211 1.3912 Silt loam
327 0.4647 5.3700 1.5760 3.4738 0.0492 0.2425 17.6190 13.2710 6.2514 1.3625 Silt loam
328 0.4540 7.7730 1.6625 3.3769 0.0474 0.2046 15.5757 11.5757 6.1197 1.3375 Silt loam
329 0.3851 3.8224 2.1197 4.0259 0.0512 0.2945 19.2803 11.3434 6.4540 1.3792 Silty clay
330 0.4040 4.0025 2.1518 3.7783 0.0508 0.2793 21.5998 8.8168 6.3474 1.3538 Silty clay
331 0.4715 5.1291 1.4992 3.5655 0.0627 0.2247 17.0073 12.8362 6.2772 1.3893 Silt loam
332 0.4627 7.2073 1.6647 3.4792 0.0656 0.1967 16.0932 11.3993 6.1910 1.3700 Silt loam
333 0.4479 7.5588 1.9677 3.7245 0.0678 0.1512 10.8496 2.6133 6.3758 1.4214 Silt loam
334 0.4482 9.1700 1.6708 3.5894 0.0683 0.1856 12.1242 1.8475 6.4054 1.4235 Silt loam
335 0.4386 8.8845 1.6735 3.7113 0.0607 0.2124 13.8543 6.8330 6.1722 1.4200 Silty clay loam
336 0.4445 9.1700 1.8512 3.7085 0.0710 0.1603 11.3942 1.3688 6.3977 1.4273 Silt loam
337 0.4552 9.1700 1.8951 3.8259 0.0772 0.1534 11.3686 0.1986 6.4654 1.4215 Silt loam
338 0.4745 6.9168 1.4277 3.2336 0.0500 0.2274 16.0984 11.9946 6.0492 1.3500 Silt loam
339 0.4545 6.5723 1.8710 4.7717 0.0539 0.2091 15.7370 11.6146 6.1171 1.3700 Silt loam
340 0.4557 7.4675 1.7047 3.2591 0.0470 0.2549 25.3190 7.7183 6.1986 1.3591 Silt loam
341 0.4900 9.1700 1.5000 3.0000 0.0500 0.2100 15.0000 11.0000 5.9000 1.3000 Silt loam
342 0.4641 8.3171 1.6564 3.3944 0.0508 0.2407 26.3356 19.6502 5.8882 1.3288 Silt loam
343 0.4884 8.8410 1.5096 3.0290 0.0505 0.2113 15.3301 11.3301 5.9495 1.3417 Silt loam
344 0.4572 7.8234 1.7099 3.2694 0.0464 0.2563 21.7477 9.4830 6.1523 1.3750 Silt loam
345 0.4555 7.5668 1.7035 3.2951 0.0467 0.2556 24.9982 8.1262 6.2385 1.3700 Silt loam
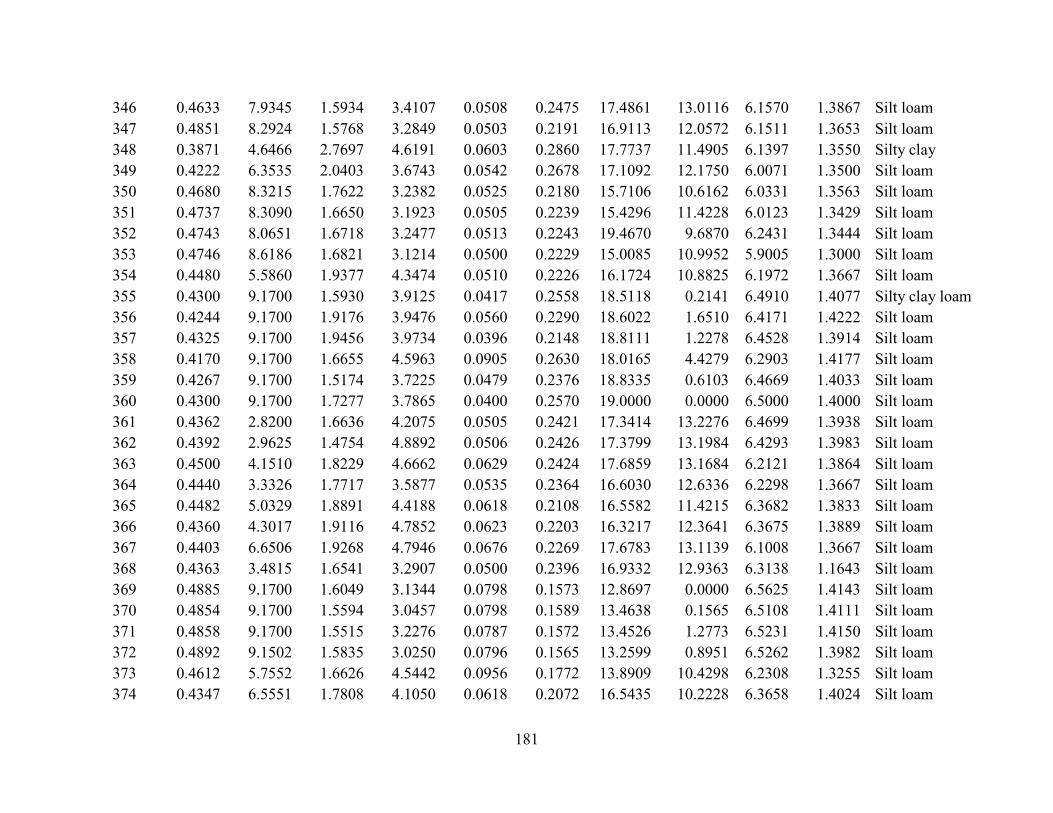
181
346 0.4633 7.9345 1.5934 3.4107 0.0508 0.2475 17.4861 13.0116 6.1570 1.3867 Silt loam
347 0.4851 8.2924 1.5768 3.2849 0.0503 0.2191 16.9113 12.0572 6.1511 1.3653 Silt loam
348 0.3871 4.6466 2.7697 4.6191 0.0603 0.2860 17.7737 11.4905 6.1397 1.3550 Silty clay
349 0.4222 6.3535 2.0403 3.6743 0.0542 0.2678 17.1092 12.1750 6.0071 1.3500 Silt loam
350 0.4680 8.3215 1.7622 3.2382 0.0525 0.2180 15.7106 10.6162 6.0331 1.3563 Silt loam
351 0.4737 8.3090 1.6650 3.1923 0.0505 0.2239 15.4296 11.4228 6.0123 1.3429 Silt loam
352 0.4743 8.0651 1.6718 3.2477 0.0513 0.2243 19.4670 9.6870 6.2431 1.3444 Silt loam
353 0.4746 8.6186 1.6821 3.1214 0.0500 0.2229 15.0085 10.9952 5.9005 1.3000 Silt loam
354 0.4480 5.5860 1.9377 4.3474 0.0510 0.2226 16.1724 10.8825 6.1972 1.3667 Silt loam
355 0.4300 9.1700 1.5930 3.9125 0.0417 0.2558 18.5118 0.2141 6.4910 1.4077 Silty clay loam
356 0.4244 9.1700 1.9176 3.9476 0.0560 0.2290 18.6022 1.6510 6.4171 1.4222 Silt loam
357 0.4325 9.1700 1.9456 3.9734 0.0396 0.2148 18.8111 1.2278 6.4528 1.3914 Silt loam
358 0.4170 9.1700 1.6655 4.5963 0.0905 0.2630 18.0165 4.4279 6.2903 1.4177 Silt loam
359 0.4267 9.1700 1.5174 3.7225 0.0479 0.2376 18.8335 0.6103 6.4669 1.4033 Silt loam
360 0.4300 9.1700 1.7277 3.7865 0.0400 0.2570 19.0000 0.0000 6.5000 1.4000 Silt loam
361 0.4362 2.8200 1.6636 4.2075 0.0505 0.2421 17.3414 13.2276 6.4699 1.3938 Silt loam
362 0.4392 2.9625 1.4754 4.8892 0.0506 0.2426 17.3799 13.1984 6.4293 1.3983 Silt loam
363 0.4500 4.1510 1.8229 4.6662 0.0629 0.2424 17.6859 13.1684 6.2121 1.3864 Silt loam
364 0.4440 3.3326 1.7717 3.5877 0.0535 0.2364 16.6030 12.6336 6.2298 1.3667 Silt loam
365 0.4482 5.0329 1.8891 4.4188 0.0618 0.2108 16.5582 11.4215 6.3682 1.3833 Silt loam
366 0.4360 4.3017 1.9116 4.7852 0.0623 0.2203 16.3217 12.3641 6.3675 1.3889 Silt loam
367 0.4403 6.6506 1.9268 4.7946 0.0676 0.2269 17.6783 13.1139 6.1008 1.3667 Silt loam
368 0.4363 3.4815 1.6541 3.2907 0.0500 0.2396 16.9332 12.9363 6.3138 1.1643 Silt loam
369 0.4885 9.1700 1.6049 3.1344 0.0798 0.1573 12.8697 0.0000 6.5625 1.4143 Silt loam
370 0.4854 9.1700 1.5594 3.0457 0.0798 0.1589 13.4638 0.1565 6.5108 1.4111 Silt loam
371 0.4858 9.1700 1.5515 3.2276 0.0787 0.1572 13.4526 1.2773 6.5231 1.4150 Silt loam
372 0.4892 9.1502 1.5835 3.0250 0.0796 0.1565 13.2599 0.8951 6.5262 1.3982 Silt loam
373 0.4612 5.7552 1.6626 4.5442 0.0956 0.1772 13.8909 10.4298 6.2308 1.3255 Silt loam
374 0.4347 6.5551 1.7808 4.1050 0.0618 0.2072 16.5435 10.2228 6.3658 1.4024 Silt loam
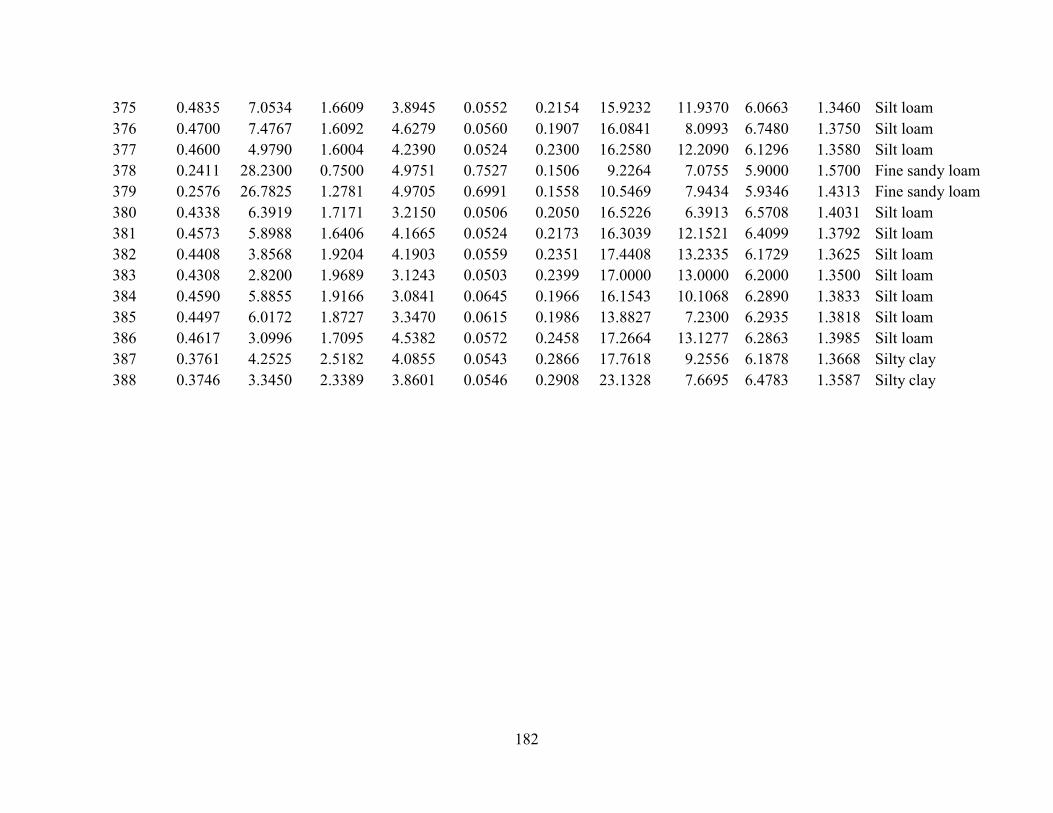
182
375 0.4835 7.0534 1.6609 3.8945 0.0552 0.2154 15.9232 11.9370 6.0663 1.3460 Silt loam
376 0.4700 7.4767 1.6092 4.6279 0.0560 0.1907 16.0841 8.0993 6.7480 1.3750 Silt loam
377 0.4600 4.9790 1.6004 4.2390 0.0524 0.2300 16.2580 12.2090 6.1296 1.3580 Silt loam
378 0.2411 28.2300 0.7500 4.9751 0.7527 0.1506 9.2264 7.0755 5.9000 1.5700 Fine sandy loam
379 0.2576 26.7825 1.2781 4.9705 0.6991 0.1558 10.5469 7.9434 5.9346 1.4313 Fine sandy loam
380 0.4338 6.3919 1.7171 3.2150 0.0506 0.2050 16.5226 6.3913 6.5708 1.4031 Silt loam
381 0.4573 5.8988 1.6406 4.1665 0.0524 0.2173 16.3039 12.1521 6.4099 1.3792 Silt loam
382 0.4408 3.8568 1.9204 4.1903 0.0559 0.2351 17.4408 13.2335 6.1729 1.3625 Silt loam
383 0.4308 2.8200 1.9689 3.1243 0.0503 0.2399 17.0000 13.0000 6.2000 1.3500 Silt loam
384 0.4590 5.8855 1.9166 3.0841 0.0645 0.1966 16.1543 10.1068 6.2890 1.3833 Silt loam
385 0.4497 6.0172 1.8727 3.3470 0.0615 0.1986 13.8827 7.2300 6.2935 1.3818 Silt loam
386 0.4617 3.0996 1.7095 4.5382 0.0572 0.2458 17.2664 13.1277 6.2863 1.3985 Silt loam
387 0.3761 4.2525 2.5182 4.0855 0.0543 0.2866 17.7618 9.2556 6.1878 1.3668 Silty clay
388 0.3746 3.3450 2.3389 3.8601 0.0546 0.2908 23.1328 7.6695 6.4783 1.3587 Silty clay
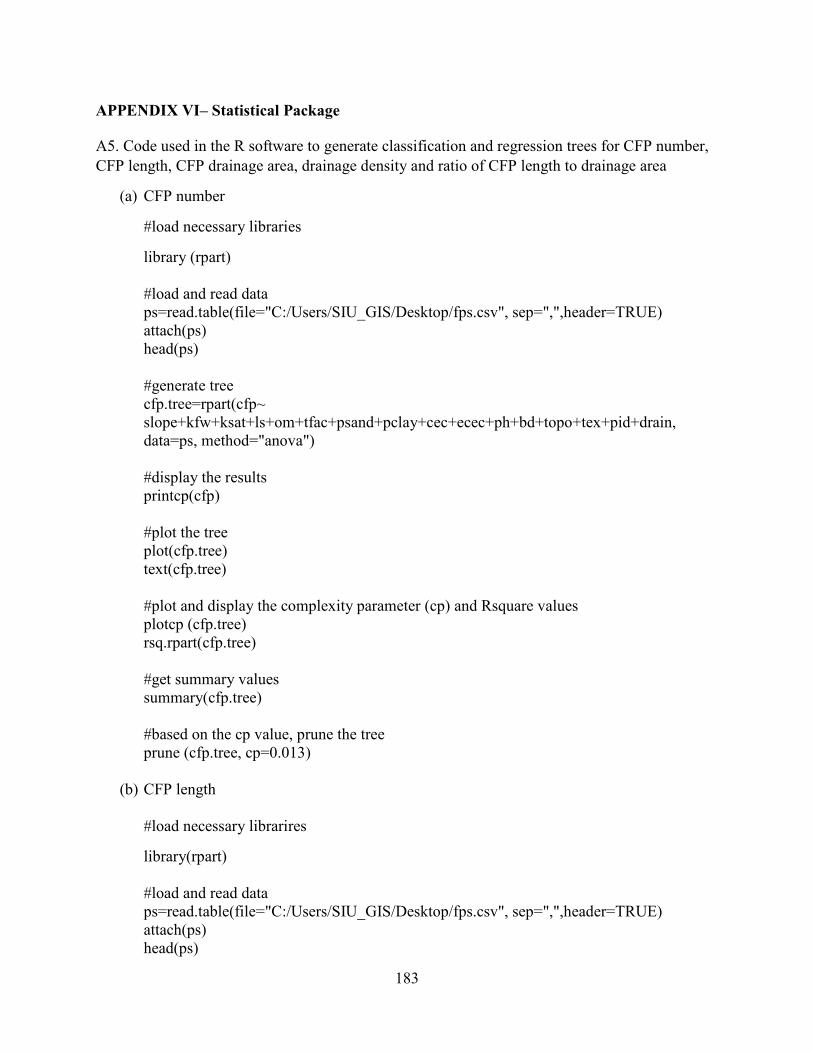
183
APPENDIX VI– Statistical Package
A5. Code used in the R software to generate classification and regression trees for CFP number,
CFP length, CFP drainage area, drainage density and ratio of CFP length to drainage area
(a) CFP number
#load necessary libraries
library (rpart) #load and read data ps=read.table(file="C:/Users/SIU_GIS/Desktop/fps.csv", sep=",",header=TRUE) attach(ps) head(ps) #generate tree cfp.tree=rpart(cfp~ slope+kfw+ksat+ls+om+tfac+psand+pclay+cec+ecec+ph+bd+topo+tex+pid+drain, data=ps, method="anova") #display the results printcp(cfp) #plot the tree plot(cfp.tree) text(cfp.tree) #plot and display the complexity parameter (cp) and Rsquare values plotcp (cfp.tree) rsq.rpart(cfp.tree) #get summary values summary(cfp.tree) #based on the cp value, prune the tree prune (cfp.tree, cp=0.013)
(b) CFP length
#load necessary librarires
library(rpart) #load and read data ps=read.table(file="C:/Users/SIU_GIS/Desktop/fps.csv", sep=",",header=TRUE) attach(ps) head(ps)
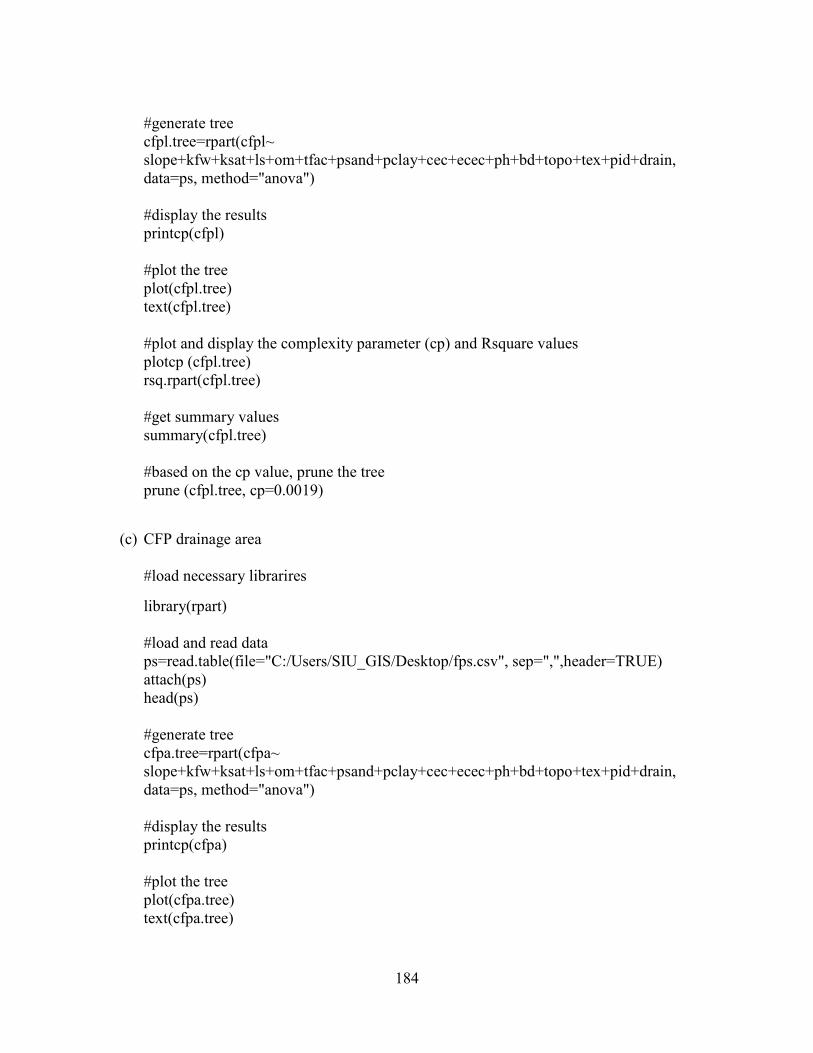
184
#generate tree cfpl.tree=rpart(cfpl~ slope+kfw+ksat+ls+om+tfac+psand+pclay+cec+ecec+ph+bd+topo+tex+pid+drain, data=ps, method="anova") #display the results printcp(cfpl) #plot the tree plot(cfpl.tree) text(cfpl.tree) #plot and display the complexity parameter (cp) and Rsquare values plotcp (cfpl.tree) rsq.rpart(cfpl.tree) #get summary values summary(cfpl.tree) #based on the cp value, prune the tree prune (cfpl.tree, cp=0.0019)
(c) CFP drainage area
#load necessary librarires
library(rpart) #load and read data ps=read.table(file="C:/Users/SIU_GIS/Desktop/fps.csv", sep=",",header=TRUE) attach(ps) head(ps) #generate tree cfpa.tree=rpart(cfpa~ slope+kfw+ksat+ls+om+tfac+psand+pclay+cec+ecec+ph+bd+topo+tex+pid+drain, data=ps, method="anova") #display the results printcp(cfpa) #plot the tree plot(cfpa.tree) text(cfpa.tree)
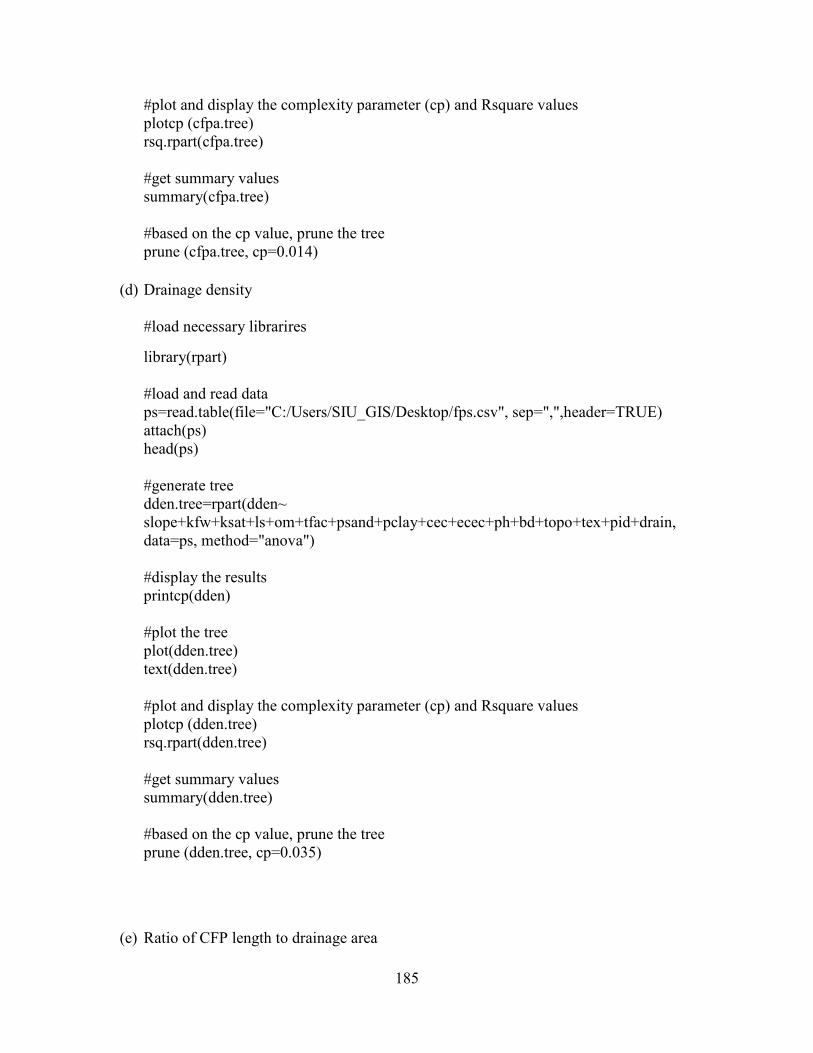
185
#plot and display the complexity parameter (cp) and Rsquare values plotcp (cfpa.tree) rsq.rpart(cfpa.tree) #get summary values summary(cfpa.tree) #based on the cp value, prune the tree prune (cfpa.tree, cp=0.014)
(d) Drainage density
#load necessary librarires
library(rpart) #load and read data ps=read.table(file="C:/Users/SIU_GIS/Desktop/fps.csv", sep=",",header=TRUE) attach(ps) head(ps) #generate tree dden.tree=rpart(dden~ slope+kfw+ksat+ls+om+tfac+psand+pclay+cec+ecec+ph+bd+topo+tex+pid+drain, data=ps, method="anova") #display the results printcp(dden) #plot the tree plot(dden.tree) text(dden.tree) #plot and display the complexity parameter (cp) and Rsquare values plotcp (dden.tree) rsq.rpart(dden.tree) #get summary values summary(dden.tree) #based on the cp value, prune the tree prune (dden.tree, cp=0.035)
(e) Ratio of CFP length to drainage area
186
#load necessary librarires
library(rpart) #load and read data ps=read.table(file="C:/Users/SIU_GIS/Desktop/fps.csv", sep=",",header=TRUE) attach(ps) head(ps) #generate tree dlr.tree=rpart(dlr ~ slope+kfw+ksat+ls+om+tfac+psand+pclay+cec+ecec+ph+bd+topo+tex+pid+drain, data=ps, method="anova") #display the results printcp(dlr) #plot the tree plot(dlr.tree) text(dlr.tree) #plot and display the complexity parameter (cp) and Rsquare values plotcp (dlr.tree) rsq.rpart(dlr.tree) #get summary values summary(dlr.tree) #based on the cp value, prune the tree prune (dlr.tree, cp=0.035)
A6. Code for SAS to select models based on AIC method
options pageno=1 linesize=80; goptions reset=all; title "Multiple Regression"; data field; input fid cfp cfpl cfpa dlr dden slope kfw ksat ls om tfac psand pclay cec ecec ph buden;
*select y based on each CFP characteristics. In this example, CFP number as cfp is selected y=log(cfp); *y=log(cfpa); *y=log(cfpl); *y=log(dlr); *y=log(dden);

187
datalines;
[dataset]
*Print data set; proc print data=field;
run; *Plot y vs x variables; proc gplot data=field; plot y*(slope kfw ksat ls om tfac psand pclay cec ecec ph buden ec); symbol1 i=r1 v=star c=black;
run; *Multiple regression analysis; ods html; ods graphics on; proc reg data=field plots=criteria; * Specify variables in regression model and method of selection; model y = slope kfw ksat ls om tfac psand pclay cec ecec ph buden/ aic sbc selection=cp; ods output SubsetSelSummary=models;
run; ods graphics off; ods html close; * Sort models by AIC; proc sort data=models; by aic;
run; title2 "Models sorted by AIC"; proc print data=models;
run; * Sort models by BIC; proc sort data=models; by sbc;
run; title2 "Models sorted by BIC"; proc print data=models;
run; quit;
A7. Code for SAS to run multiple regression based on the models selected from the AIC method
options pageno=1 linesize=80; goptions reset=all; title "Multiple regression for Table 16.1 data - IC method"; data table16_1;
188
input fid cfp cfpl cfpa dlr dden slope kfw ksat ls om tfac psand pclay cec ecec ph buden topo$ tex$ pid$ drain$ long lat; yc=log(cfp); ya=log(cfpa); yl=log(cfpl); yr=log(dlr); yd=log(dden); datalines;
[dataset]
; run; * Print data set; proc print data=table16_1;
run; * Multiple regression analysis with model selection; ods html; ods graphics on; *Identification; proc reg data=table16_1; model yc=ksat om /partial; output out=residuals p=yhat r=yresid;
run; * Print data set; proc print data=table16_1;
run; * Multiple regression analysis with model selection; ods html; ods graphics on; proc reg data=table16_1 plots=criteria; * Specify variables in regression model and method of selection; model yc = om psand; model ya = slope ls; model yl = slope ls; model yr = slope kfw; model yd = slope om;
run; quit;
A8. Code for generating Semivariograms in SAS
(a) CFP number
options pageno=1 linesize=80; goptions reset=all; title "Spatial Correlation";

189
data field; input fid cfp cfpl cfpa dlr dden slope kfw ksat ls om tfac psand pclay cec ecec ph buden topo$ tex$ pid$ drain$ long lat; datalines;
[dataset]
; proc print data=field (obs=10);
run; ods html; ods graphics on; proc gplot data=field; title 'Scatter plot of study locations'; plot lat*long /frame cframe=ligr haxis=axis1 vaxis=axis2; symbol1 v=dot color=blue; axis1 minor=none; axis2 minor=none label=(angle=90 rotate=0); label lat ='Latitude' long='Longitude';
run; proc g3d data=field; title 'Surface Plot of CFP length'; scatter lat*long=cfp / xticknum=5 yticknum=5 grid zmin=0 zmax=20; label lat ='Latitude' long='Longitude' cfp='CFP number';
run; *determining LAGDISTANCE and MAXLAGS; proc variogram data=field outdistance=outd; compute nhc=20 novariogram; coordinates xc=long yc=lat; var cfp;
run; title 'OUTDISTANCE= Data Set Showing Distance Intervals'; proc print data=outd;
run; data outd; set outd; mdpt=round((lb+ub)/2,.1); label mdpt = 'Midpoint of Interval';
run; axis1 minor=none; axis2 minor=none label=(angle=90 rotate=0); title ’Distribution of Pairwise Distances’; proc gchart data=outd;
190
vbar mdpt / type=sum sumvar=count discrete frame cframe=ligr gaxis=axis1 raxis=axis2 nolegend;
run; *running with lagdistance and maxlags; proc variogram data=field outv=outv; compute lagd=19936.03 maxlag=8 robust; coordinates xc=long yc=lat; var cfp;
run; title 'OUTVAR= Data Set Showing Sample Variogram Results'; proc print data=outv label; var lag count distance variog rvario;
run; data outv2; set outv; vari=variog; type = 'regular'; output; vari=rvario; type = 'robust'; output;
run; title 'Standard and Robust Semivariogram for Number of CFP Data'; proc gplot data=outv2; plot vari*distance=type / frame cframe=ligr vaxis=axis2 haxis=axis1; symbol1 i=join l=1 c=blue /* v=star */; symbol2 i=join l=1 c=yellow /* v=square */; axis1 minor=none label=(c=black 'Lag Distance') /* offset=(3,3) */; axis2 order=(0 to 18 by 1) minor=none label=(angle=90 rotate=0 c=black 'Variogram') /* offset=(3,3) */;
run; quit;
(b) CFP length
options pageno=1 linesize=80; goptions reset=all; title "Spatial Correlation"; data field; input fid cfp cfpl cfpa dlr dden slope kfw ksat ls om tfac psand pclay cec ecec ph buden topo$ tex$ pid$ drain$ long lat; datalines;
[dataset]
; proc print data=field (obs=10);
run; ods html; ods graphics on;

191
proc gplot data=field; title 'Scatter plot of study locations'; plot lat*long /frame cframe=ligr haxis=axis1 vaxis=axis2; symbol1 v=dot color=blue; axis1 minor=none; axis2 minor=none label=(angle=90 rotate=0); label lat ='Latitude' long='Longitude';
run; proc g3d data=field; title 'Surface Plot of CFP length'; scatter lat*long=cfpl / xticknum=5 yticknum=5 grid zmin=40 zmax=20000; label lat ='Latitude' long='Longitude' cfpl='CFP length';
run; *determining LAGDISTANCE and MAXLAGS; proc variogram data=field outdistance=outd; compute nhc=20 novariogram; coordinates xc=long yc=lat; var cfpl;
run; title 'OUTDISTANCE= Data Set Showing Distance Intervals'; proc print data=outd;
run; data outd; set outd; mdpt=round((lb+ub)/2,.1); label mdpt = 'Midpoint of Interval';
run; axis1 minor=none; axis2 minor=none label=(angle=90 rotate=0); title ’Distribution of Pairwise Distances’; proc gchart data=outd; vbar mdpt / type=sum sumvar=count discrete frame cframe=ligr gaxis=axis1 raxis=axis2 nolegend;
run; *running with lagdistance and maxlags; proc variogram data=field outv=outv; compute lagd=9968.01 maxlag=15 robust; coordinates xc=long yc=lat; var cfpl;
run; title 'OUTVAR= Data Set Showing Sample Variogram Results';
192
proc print data=outv label; var lag count distance variog rvario;
run; data outv2; set outv; vari=variog; type = 'regular'; output; vari=rvario; type = 'robust'; output;
run; title 'Standard and Robust Semivariogram for CFP length Data'; proc gplot data=outv2; plot vari*distance=type / frame cframe=ligr vaxis=axis2 haxis=axis1; symbol1 i=join l=1 c=blue /* v=star */; symbol2 i=join l=1 c=yellow /* v=square */; axis1 minor=none label=(c=black 'Lag Distance') /* offset=(3,3) */; axis2 order=(1000000 to 14000000 by 1000000) minor=none label=(angle=90 rotate=0 c=black 'Variogram') /* offset=(3,3) */;
run; quit;
(c) CFP drainage area
options pageno=1 linesize=80; goptions reset=all; title "Spatial Correlation"; data field; input fid cfp cfpl cfpa dlr dden slope kfw ksat ls om tfac psand pclay cec ecec ph buden topo$ tex$ pid$ drain$ long lat; datalines;
[dataset]
; proc print data=field (obs=10);
run; ods html; ods graphics on; proc gplot data=field; title 'Scatter plot of study locations'; plot lat*long /frame cframe=ligr haxis=axis1 vaxis=axis2; symbol1 v=dot color=blue; axis1 minor=none; axis2 minor=none label=(angle=90 rotate=0); label lat ='Latitude' long='Longitude';
193
run; proc g3d data=field; title 'Surface Plot of CFP drainage area'; scatter lat*long=cfpa / xticknum=5 yticknum=5 grid zmin=0 zmax=200; label lat ='Latitude' long='Longitude' cfpa='CFP area';
run; *determining LAGDISTANCE and MAXLAGS; proc variogram data=field outdistance=outd; compute nhc=20 novariogram; coordinates xc=long yc=lat; var cfpa;
run; title 'OUTDISTANCE= Data Set Showing Distance Intervals'; proc print data=outd;
run; data outd; set outd; mdpt=round((lb+ub)/2,.1); label mdpt = 'Midpoint of Interval';
run; axis1 minor=none; axis2 minor=none label=(angle=90 rotate=0); title ’Distribution of Pairwise Distances’; proc gchart data=outd; vbar mdpt / type=sum sumvar=count discrete frame cframe=ligr gaxis=axis1 raxis=axis2 nolegend;
run; *running with lagdistance and maxlags; proc variogram data=field outv=outv; compute lagd=9968.01 maxlag=15 robust; coordinates xc=long yc=lat; var cfpa;
run; title 'OUTVAR= Data Set Showing Sample Variogram Results'; proc print data=outv label; var lag count distance variog rvario;
run; data outv2; set outv; vari=variog; type = 'regular'; output; vari=rvario; type = 'robust'; output;
run; title 'Standard and Robust Semivariogram for CFP drainage area Data'; proc gplot data=outv2;
194
plot vari*distance=type / frame cframe=ligr vaxis=axis2 haxis=axis1; symbol1 i=join l=1 c=blue /* v=star */; symbol2 i=join l=1 c=yellow /* v=square */; axis1 minor=none label=(c=black 'Lag Distance') /* offset=(3,3) */; axis2 order=(100 to 1600 by 300) minor=none label=(angle=90 rotate=0 c=black 'Variogram') /* offset=(3,3) */;
run; quit;
(d) Drainage Density
options pageno=1 linesize=80; goptions reset=all; title "Spatial Correlation"; data field; input fid cfp cfpl cfpa dlr dden slope kfw ksat ls om tfac psand pclay cec ecec ph buden topo$ tex$ pid$ drain$ long lat; datalines;
[dataset]
; proc print data=field (obs=10);
run; ods html; ods graphics on; proc gplot data=field; title 'Scatter plot of study locations'; plot lat*long /frame cframe=ligr haxis=axis1 vaxis=axis2; symbol1 v=dot color=blue; axis1 minor=none; axis2 minor=none label=(angle=90 rotate=0); label lat ='Latitude' long='Longitude';
run; proc g3d data=field; title 'Surface Plot of Drainage density'; scatter lat*long=dden / xticknum=5 yticknum=5 grid zmin=40 zmax=20000; label lat ='Latitude' long='Longitude' dden='Drainage density';
run;

195
*determining LAGDISTANCE and MAXLAGS; proc variogram data=field outdistance=outd; compute nhc=20 novariogram; coordinates xc=long yc=lat; var dden;
run; title 'OUTDISTANCE= Data Set Showing Distance Intervals'; proc print data=outd;
run; data outd; set outd; mdpt=round((lb+ub)/2,.1); label mdpt = 'Midpoint of Interval';
run; axis1 minor=none; axis2 minor=none label=(angle=90 rotate=0); title ’Distribution of Pairwise Distances’; proc gchart data=outd; vbar mdpt / type=sum sumvar=count discrete frame cframe=ligr gaxis=axis1 raxis=axis2 nolegend;
run; *running with lagdistance and maxlags; proc variogram data=field outv=outv; compute lagd=9968.01 maxlag=15 robust; coordinates xc=long yc=lat; var dden;
run; title 'OUTVAR= Data Set Showing Sample Variogram Results'; proc print data=outv label; var lag count distance variog rvario;
run; data outv2; set outv; vari=variog; type = 'regular'; output; vari=rvario; type = 'robust'; output;
run; title 'Standard and Robust Semivariogram for CFP length Data'; proc gplot data=outv2; plot vari*distance=type / frame cframe=ligr vaxis=axis2 haxis=axis1; symbol1 i=join l=1 c=blue /* v=star */; symbol2 i=join l=1 c=black /* v=square */; axis1 minor=none label=(c=black 'Lag Distance') /* offset=(3,3) */; axis2 order=(0 to 1 by 0.0001) minor=none label=(angle=90 rotate=0 c=black 'Variogram') /* offset=(3,3) */;
run;

196
quit;
(e) Ratio of CFP length to drainage area
options pageno=1 linesize=80; goptions reset=all; title "Spatial Correlation"; data field; input fid cfp cfpl cfpa dlr dden slope kfw ksat ls om tfac psand pclay cec ecec ph buden topo$ tex$ pid$ drain$ long lat; datalines;
[dataset]
; proc print data=field (obs=10);
run; ods html; ods graphics on; proc gplot data=field; title 'Scatter plot of study locations'; plot lat*long /frame cframe=ligr haxis=axis1 vaxis=axis2; symbol1 v=dot color=blue; axis1 minor=none; axis2 minor=none label=(angle=90 rotate=0); label lat ='Latitude' long='Longitude';
run; proc g3d data=field; title 'Surface Plot of CFP length to drainage area ratio'; scatter lat*long=dlr / xticknum=5 yticknum=5 grid zmin=0 zmax=0.015; label lat ='Latitude' long='Longitude' dlr='Length to drainage area ratio';
run; *determining LAGDISTANCE and MAXLAGS; proc variogram data=field outdistance=outd; compute nhc=20 novariogram; coordinates xc=long yc=lat; var dlr;
run; title 'OUTDISTANCE= Data Set Showing Distance Intervals'; proc print data=outd;
run;

197
data outd; set outd; mdpt=round((lb+ub)/2,.1); label mdpt = 'Midpoint of Interval';
run; axis1 minor=none; axis2 minor=none label=(angle=90 rotate=0); title ’Distribution of Pairwise Distances’; proc gchart data=outd; vbar mdpt / type=sum sumvar=count discrete frame cframe=ligr gaxis=axis1 raxis=axis2 nolegend;
run; *running with lagdistance and maxlags; proc variogram data=field outv=outv; compute lagd=9968.01 maxlag=15 robust; coordinates xc=long yc=lat; var dlr;
run; title 'OUTVAR= Data Set Showing Sample Variogram Results'; proc print data=outv label; var lag count distance variog rvario;
run; data outv2; set outv; vari=variog; type = 'regular'; output; vari=rvario; type = 'robust'; output;
run; title 'Standard and Robust Semivariogram for CFP length to drainage area ratio Data'; proc gplot data=outv2; plot vari*distance=type / frame cframe=ligr vaxis=axis2 haxis=axis1; symbol1 i=join l=1 c=blue /* v=star */; symbol2 i=join l=1 c=yellow /* v=square */; axis1 minor=none label=(c=black 'Lag Distance') /* offset=(3,3) */; axis2 order=(0 to 1 by 0.000001) minor=none label=(angle=90 rotate=0 c=black 'Variogram') /* offset=(3,3) */;
run; quit;
A9. Code to run one-way ANOVA to compare mean of CFP characteristics among different
topographic regions
options pageno=1 linesize=80; goptions reset=all; title "One-way ANOVA";
198
data onewayanova; input toporeg$ cfp cfpa cfpl dlr dden; datalines;
[dataset]
; run; * Print data set; proc print data=onewayanova;
run; *One way anova proc anova data=onewayanova; class toporeg; model cfp = toporeg; model cfpl = toporeg; model cfpa = toporeg; model dlr = toporeg; model dden= toporeg;
run; quit;

199
VITA
Graduate School Southern Illinois University
Prabisha Shrestha
Asian University for Women Bachelor of Science, Environmental Science, May 2013
Thesis Title: Importance of concentrated flow paths in agricultural watersheds of southern Illinois
Major Professor: Karl W. J. Williard
Professional Presentations:
Shrestha, P. Importance of concentrated flow paths in agricultural watersheds in southern Illinois. 2016 UCOWR/NIWR Annual Conference, Pensacola, Florida.
Shrestha, P. Effect of field characteristics on concentrated flow path formation in agricultural watersheds in southern Illinois. 2015 UCOWR/NIWR/CUAHSI Annual Conference, Las Vegas, Nevada.