implicit methods for testing product …nc266/webfiles/schoen_&_crilly_(2012... ·...
TRANSCRIPT
Proceedings of 8th International Design and Emotion Conference London 2012 Central Saint Martins College of Art & Design, 11-14 September 2012 Edited by J. Brassett, J. McDonnell & M. Malpass
IMPLICIT METHODS FOR TESTING PRODUCT PREFERENCE
EXPLORATORY STUDIES WITH THE AFFECTIVE SIMON TASK
Katrina L. Schoen and Nathan Crilly University of Cambridge, Engineering Design Centre
[email protected], [email protected]
ABSTRACT
Design researchers often use interviews and
questionnaires to measure consumer response to
products. This practice is despite the inherent
limitations of these “explicit” self-report methods. In
psychology, “implicit” tests have been developed in
an attempt to overcome self-report biases and to
obtain a more automatic measure of attitudes. This
paper investigates the adaptation of implicit methods
to measure product preferences. Two exploratory
studies were conducted to (i) establish an acceptable
methodology for implicit tests using product images,
and (ii) determine whether response to products can
produce significant effects in affective Simon
experiments. Results indicate that (i) the affective
Simon task can be modified to assess product
stimuli, and (ii) significant differences in consumer
response can be measured within product
categories. With further work, implicit tests may
become a helpful tool for designers and researchers
investigating how users respond to product design
variations.
Keywords: product form, consumer testing,
implicit methods, approach avoidance test,
stimulus-response compatibility
INTRODUCTION
This paper outlines the potential benefits of applying
research techniques from experimental psychology to
investigate product preference. As such, the paper
fits into that stream of design research that has
contributed methodological developments for
measuring consumer response (e.g., see Desmet,
Hekkert, & Jacobs, 2000; Mugge, Govers, &
Schoormans, 2009). However, rather than developing
alternative or improved self-report methods, we
explore the use of implicit measurement techniques
that might replace or supplement explicit measures.
We first describe current product design research and
conventional methods for gathering consumer
feedback. We then review the distinctive
characteristics of implicit testing methods and the
methodological variables that must be considered
when creating an implicit test for use with products.
This overview is followed by a report on the design
and implementation of two exploratory studies
featuring the affective Simon task. Finally, we reflect
on procedural findings and present recommendations
for the further exploration of implicit tests in product
design research.
CONSUMER RESEARCH IN PRODUCT DESIGN
Understanding how people experience designed
products has important implications for design
research and design practice. Consequently, there
have been many attempts to develop knowledge
about the relationship between product designs and
the responses they elicit from consumers (for
overviews, see Bloch, 1995; Crilly, Moultrie &
Clarkson, 2004; Creusen & Schoormans, 2005;
Schifferstein & Hekkert, 2008). In particular, design
researchers in academia and industry are often
interested in knowing which consumer groups prefer
which products, and which product features contribute
to those preferences. These questions are often
investigated experimentally, by presenting consumers
with a range of products or design variants and
measuring subjective responses to these stimuli. This
process can offer guidance for what products or
design variants might be most preferred and can give
useful clues for further design development (for
OUT OF CONTROL
example, see empirical studies in Bell, Hollbrook, &
Solomon, 1991; Nagamachi, 2002; Desmet, Hekkert,
& Jacobs, 2007; Mugge, Govers, & Schoormans,
2009; Blijlevens, Carbon, Mugge, & Schoormans,
2012).
LIMITATIONS TO CURRENT RESEARCH METHODS
In much of the current research on product form,
consumer response is measured using self-report
survey methods, such as questionnaires, interviews,
and focus groups. Questionnaire methods are
especially popular, and often feature attitude response
scales such as the Likert Scale or Semantic
Differential Rating, as well as open-ended or multiple-
choice questions. Although these “explicit” measures
can provide helpful feedback to product designers,
they are also subject to a number of limitations.
Consumer survey responses may not fully capture
reactions to a product or predict future behavior, such
as purchasing decisions in the marketplace.
This conflict could occur for a variety of reasons; word
choice in questionnaires, for example, may inherently
bias the responses (Oskamp, 1977). In some cases,
participants might be motivated to answer a
questionnaire dishonestly, or in a way that seems
most socially acceptable; additionally, participants
may attempt to provide answers that they believe
most likely to please the researcher (Orne, 1962). On
the other hand, even if participants respond to
carefully-worded questions as honestly as possible,
the survey may not be targeting the same thought
processes that a consumer faces in the product use
scenario or in the marketplace. There is evidence that
actual product-related behavior is affected by more
spontaneous or impulsive processes, as consumers
are often distracted or pressed for time while
consuming goods or making purchasing decisions
(Friese, Hofmann, & Wänke, 2009). Additionally,
consumer judgments may occur nonconsciously or as
a result of subliminal influences, and therefore may
not be activated during deliberate response to a
research survey (Bargh, 2002).
OVERVIEW OF IMPLICIT METHODS
In the field of experimental psychology, so-called
“implicit” or “indirect” testing methods have been
developed as an alternative to traditional
questionnaires in measuring attitudes and cognitions
(De Houwer, 2006). There are many such testing
methods, including the Implicit Association Test (IAT),
affective priming task, Approach Avoidance Test
(AAT), and affective Simon task. In these tests,
participants respond to stimulus items using a
keyboard, joystick, microphone, or other input device,
and their reaction times are measured. Participants
are generally slower to respond to “incompatible” trial
conditions (e.g. associating a positive stimulus with a
negative word or action) than “compatible” trial
conditions (e.g. associating a positive stimulus with a
positive word or action). Therefore, by assessing
reaction times for various trial conditions, researchers
can infer information about participants’ attitudes
towards the tested stimuli; in many cases, however,
participants may not be aware that reaction times are
the variable of interest to the researcher.
Implicit measurement techniques may overcome
some of the problematic elements of traditional self-
report measures of attitudes. Depending on the task
design, participants may be unaware of what is being
tested, unaware of the actual attitudes or cognitions
being measured, or unable to control outcomes (De
Houwer, 2006). Although few measures are truly
implicit in the sense of fulfilling all these conditions,
there is evidence that participants are less able to
consciously control the outcome of implicit measures
compared to self-report (De Houwer, 2006). Further,
implicit measures may be valuable in assessing
spontaneous or automatic attitudes towards stimuli,
whereas traditional surveys would target consciously
constructed and expressed attitudes. In turn, implicit
measures could possess particular predictive value in
areas focused on spontaneous behavior (De Houwer,
2006).
The implicit reaction time tasks discussed above are
not the only non-self-report methods available to
researchers. Other methods include
psychophysiological techniques such as eye tracking,
brain imaging, heart rate measurement, and voice
pitch analysis (for an overview of these methods
applied to marketing, see Wang & Minor, 2008). Such
methods measure variables that are even more
resistant to participant response control than reaction
times. However, they typically require specialized
2
PROCEEDINGS DE2012
equipment, whereas implicit tests can often be
inexpensively administered using standard personal
computers.
IMPLICIT METHODS IN CONSUMER RESEARCH
Implicit methods have been applied in psychology for
various purposes, ranging from investigation of
addictions and phobias to indication of racial bias.
However, due to the benefits outlined above, implicit
measures may also be useful in interpreting consumer
attitudes towards products. As with many real-world
situations, consumer judgments and behaviors are
often subject to nonconscious and automatic
influences (Bargh, 2002). For example, implicit
measures may be useful in detecting attitudes
affected by the perception of a product’s prototypical
user; this effect is not typically seen in explicit
measures (for a discussion of user prototypes and
collective self-esteem, see Dimofte, 2010). Moreover,
consumers may hold ambivalent attitudes towards
products, and implicit methods could be used to
predict behavior in those cases (Maison, Greenwald,
& Bruin, 2001).
Although implicit techniques seem to have potential
application in measuring consumer preferences for
different product designs, so far their application in
consumer research has been limited to tests focused
on brand effects. In an experiment using logos and
words to represent Mac and PC, Brunel & Greenwald
(2004) used the Implicit Association Test (IAT) to
measure significant effects for brand attitude and
brand relationship strength, and also found that IAT
scores correlated with explicit measures of these
constructs; in a second test with advertisements
featuring athletes of differing ethnicities, the IAT
displayed consumer attitudes that were not detected
by explicit measures. Another study found IAT effects
indicating consumer preference for brands of yogurt,
fast food restaurants, and soft drinks, as well as
evidence that the IAT increased the accuracy of
predicted behavior compared to explicit measurement
only (Maison, Greenwald, & Bruin, 2004). This
previous success with the IAT and consumers
provides promising evidence that implicit tests could
be used to assess product form, as well.
IMPLICIT METHODS FOR PRODUCTS
SELECTING A TESTING METHOD
The field of experimental psychology has developed a
large number of implicit testing methods and
techniques, many of which could be adapted to study
products (for an overview of various test types, see
De Houwer, 2003). One important factor that
influences the selection and adaptation of an
appropriate testing method is the requirement to
display images of products rather than verbal stimuli;
as in traditional consumer research studies, pictures
of various product forms would make up the stimuli
under investigation. With this in mind, possible
candidates include the IAT, affective priming task, and
various forms of approach-avoidance tasks.
To perform the IAT, participants independently
categorize items based on either a target concept
(such as good/bad) or attribute dimension (such as
male/female), followed by combined phases in which
the target concepts and attribute dimensions are
paired and mapped to key press responses
(Greenwald, McGhee, & Schwartz, 1998). The IAT
delivers a relatively large effect size, as well as
satisfactory reliability and predictive validity (Friese,
Hofmann, & Wänke, 2006; Nosek, Greenwald, &
Banaji, 2007; Greenwald, et al., 2009). These
benefits come with certain constraints, however:
stimuli must fall into one of two identifiable categories,
and assessments occur at the category level rather
than for individual exemplars or stimuli (Brunel &
Greenwald, 2004). (Variations of the IAT have been
developed to address some of these constraints,
including the Single-Category IAT and Go/no-go IAT.)
It has been noted that due to the sorting tasks that
make up the test, participants may become aware of
what is being assessed during the IAT, thereby
decreasing the extent to which the method can be
considered implicit in that sense (De Houwer, 2003;
Roefs et al., 2011).
In affective priming, an initial “prime” stimulus is
followed by a “target” stimulus that the participant
must categorize by valence (Fazio et al., 1986;
Hermans, De Houwer, & Eelen,1994). The affective
priming effect could be utilized in product research by
presenting images of products as the prime stimuli,
3
OUT OF CONTROL
followed by normatively positive and negative target
stimuli (such as the words “good” and “bad”).
Advantageously, this measure would assess
associations at the individual stimulus level and not for
relative categories (Brunel & Greenwald, 2004).
However, affective priming has exhibited low internal
consistency and reliability compared to other implicit
measures (Roefs et al., 2011).
The Approach Avoidance Test has been shown to
relate positive and negative evaluations with a
predisposition to approach or avoid the stimulus,
respectively (Chen & Bargh, 1999). While variants of
this method frequently utilize a joystick and zooming
images to reinforce the participant’s impression of
approaching and avoiding the stimulus, a keystroke
manikin version of the affective Simon task (described
below) has also been used to display a similar
approach-avoidance phenomenon (De Houwer et al.,
2001; Rinck & Becker, 2007). Like affective priming,
the affective Simon should measure global attitudes
towards a specific stimulus item, rather than a specific
feature or categorization of the stimulus (De Houwer,
2003). Moreover, unlike the IAT and affective priming
task, applying the manikin affective Simon in product
research would not require the use of additional words
to define categorizing tasks. This setup helps limit the
extent to which participants are aware of what is being
tested, thus increasing the implicitness of the method;
further, the lack of text could facilitate international
studies.
ADAPTING THE MANIKIN AFFECTIVE SIMON TASK
Due to the potential adaptation for including images
as stimuli, combined with the increased likelihood that
participants may not realize what is being tested, we
chose to further investigate the possibility of using the
manikin affective Simon task in product testing. The
task has previously been used to show significant
effects for normatively valenced stimuli and food-
related stimuli (De Houwer et al., 2001; Laane, 2011);
additionally, other approach-avoidance tasks have
been used frequently to study forms of addiction and
phobia (see Rinck & Becker, 2007; Cousijn,
Goudriaan, & Wiers, 2010; Wiers et al., 2010).
However, most implicit testing done with consumers
has employed the IAT rather than approach-
avoidance tasks.
To investigate the use of the affective Simon task for
consumer products, we devised two exploratory
studies. The primary aim of these studies was not to
measure a particular Simon effect of interest (i.e. to
answer a question about product preference), but to
identify the methodological concerns relevant to this
type of test, and to determine whether the affective
Simon can become a useful tool for future product
research.
Task Design
To participants, the manikin version of the affective
Simon task takes the form of a simple computer
game. Participants press keys to control the position
of a matchstick man character (the “manikin”) on the
screen. In each trial, first the manikin appears, and
then a stimulus appears; participants must move the
manikin towards or away from the stimulus based on
a non-affective stimulus feature such as screen
location or font color. Over the course of the
experiment, this process is repeated many times with
the manikin located randomly on either the left or right
of the stimulus.
To the experimenter, the assumption is that
participants self-identify with the manikin throughout
the course of the “game.” In this way, moving towards
the stimulus is associated with approach or positive
valence; moving away is associated with avoidance or
negative valence (De Houwer et al., 2001; Laane,
2011). Moreover, approaching positive stimuli and
avoiding negative stimuli creates a compatible
condition, while the opposite arrangement
(approaching negative stimuli and avoiding positive
stimuli) creates an incompatible condition. Participants
have been shown to respond faster to the compatible
condition than the incompatible condition, indicating
that stimulus valence biases the decision to move the
manikin towards or away (De Houwer et al., 2001).
In order for an implicit test to be considered a Simon
task, it must contain the following features: (i) a
“relevant” feature that defines the correct response;
(ii) an “irrelevant” feature that the participant must
ignore (or may not be fully aware of); and (iii) possible
responses that relate to the irrelevant feature only (De
Houwer et al., 2001). Further, in an affective version
of the Simon paradigm, stimulus valence serves as
4
PROCEEDINGS DE2012
the irrelevant feature; this valence is related to the
responses because both possess affective properties
(De Houwer, 1998). For our study of product designs,
therefore, stimulus assessment serves as both the
“irrelevant” feature and the variable of interest inferred
from measured reaction time results.
As in previous manikin designs (De Houwer et al.,
2001; Laane, 2011), the affective responses used
here were key presses to move towards or away from
the stimulus images. During experiments, a key on the
far left (‘z’) and a key on the far right (‘/’) of the
keyboard were labeled with stickers depicting left and
right arrows, respectively.
In previous manikin experiments that used vocabulary
words as stimuli, the relevant feature was grammatical
category (adjectives vs. nouns) or typography
(uppercase vs. lowercase) (De Houwer et al., 2001;
Laane, 2011). With images as stimuli, another
relevant feature must be manipulated; in order to
maintain the integrity of the test, however, altering this
feature should not be meaningfully related to the
correct response. For the first experimental study,
spatial location on the screen was chosen as the
relevant feature for product images. Specifically, each
image was presented approximately 1 centimeter
above or below the horizontal centerline. Depending
on its location (above or below center), participants
were instructed to make the manikin move towards or
away from the image. The stimulus image was
always presented on the vertical centerline of the
screen, but the manikin could appear to the left or
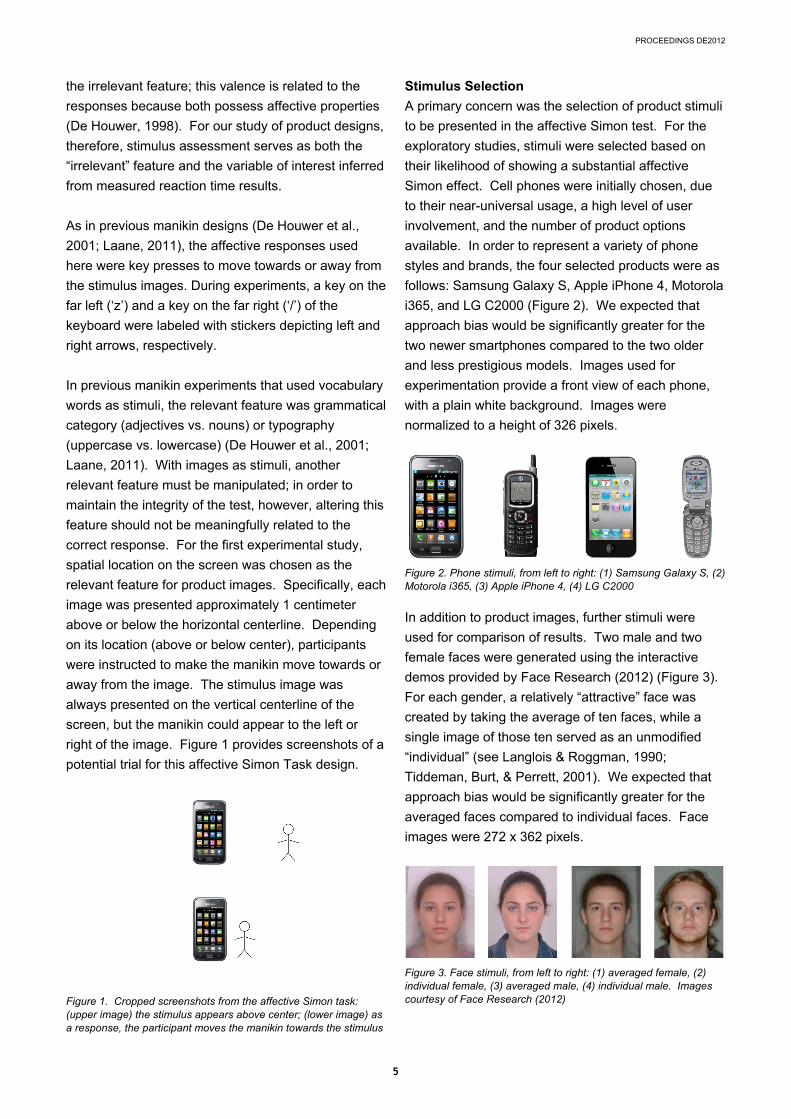
right of the image. Figure 1 provides screenshots of a
potential trial for this affective Simon Task design.
Figure 1. Cropped screenshots from the affective Simon task: (upper image) the stimulus appears above center; (lower image) as a response, the participant moves the manikin towards the stimulus
Stimulus Selection
A primary concern was the selection of product stimuli
to be presented in the affective Simon test. For the
exploratory studies, stimuli were selected based on
their likelihood of showing a substantial affective
Simon effect. Cell phones were initially chosen, due
to their near-universal usage, a high level of user
involvement, and the number of product options
available. In order to represent a variety of phone
styles and brands, the four selected products were as
follows: Samsung Galaxy S, Apple iPhone 4, Motorola
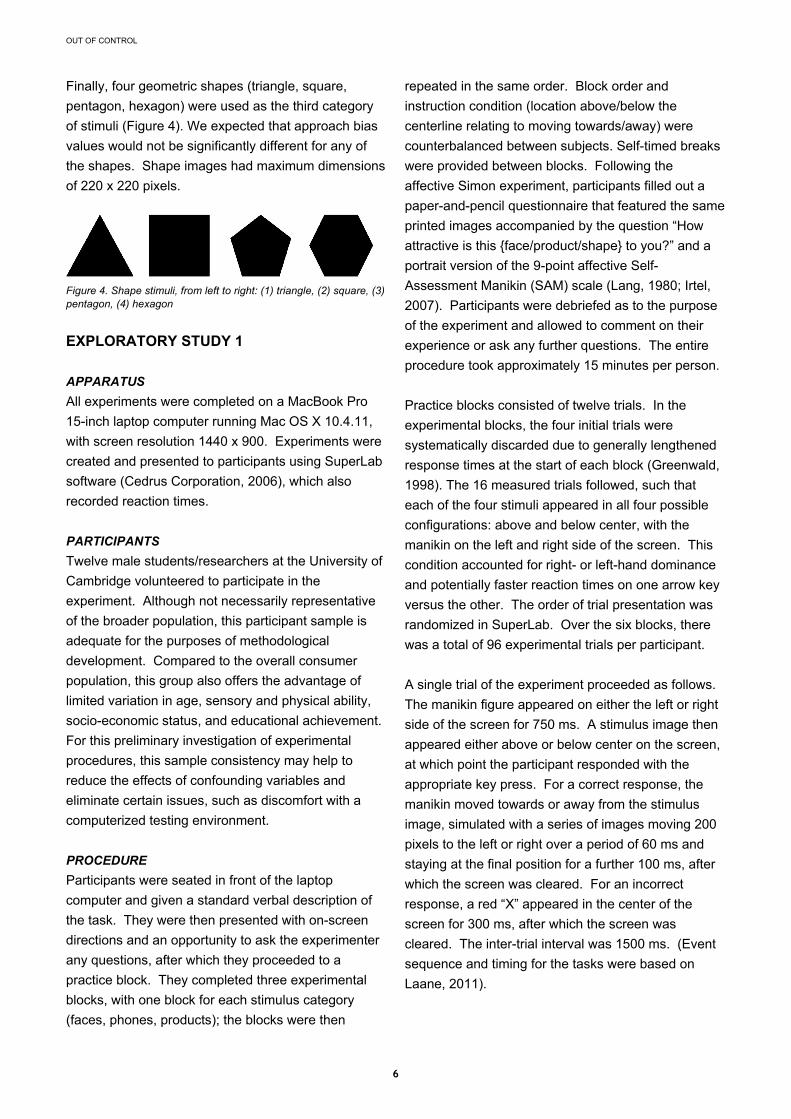
i365, and LG C2000 (Figure 2). We expected that
approach bias would be significantly greater for the
two newer smartphones compared to the two older
and less prestigious models. Images used for
experimentation provide a front view of each phone,
with a plain white background. Images were
normalized to a height of 326 pixels.
Figure 2. Phone stimuli, from left to right: (1) Samsung Galaxy S, (2) Motorola i365, (3) Apple iPhone 4, (4) LG C2000
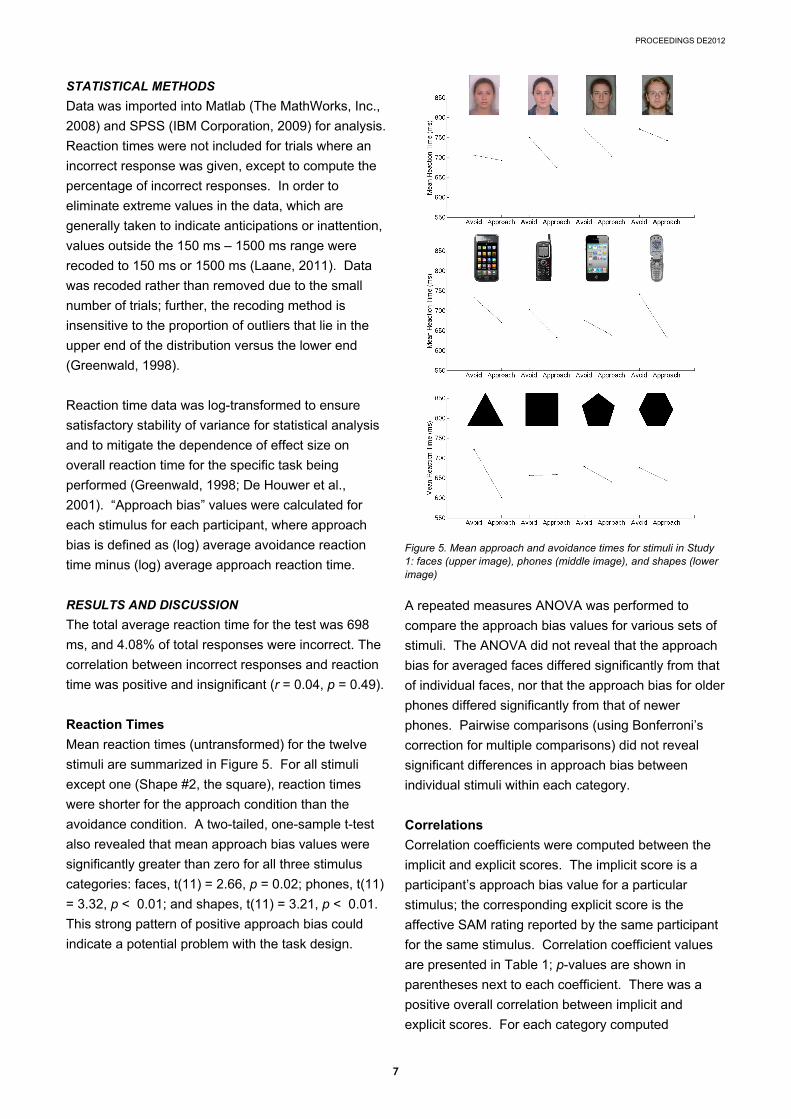
In addition to product images, further stimuli were
used for comparison of results. Two male and two
female faces were generated using the interactive
demos provided by Face Research (2012) (Figure 3).
For each gender, a relatively “attractive” face was
created by taking the average of ten faces, while a
single image of those ten served as an unmodified
“individual” (see Langlois & Roggman, 1990;
Tiddeman, Burt, & Perrett, 2001). We expected that
approach bias would be significantly greater for the
averaged faces compared to individual faces. Face
images were 272 x 362 pixels.
Figure 3. Face stimuli, from left to right: (1) averaged female, (2) individual female, (3) averaged male, (4) individual male. Images courtesy of Face Research (2012)
5
OUT OF CONTROL
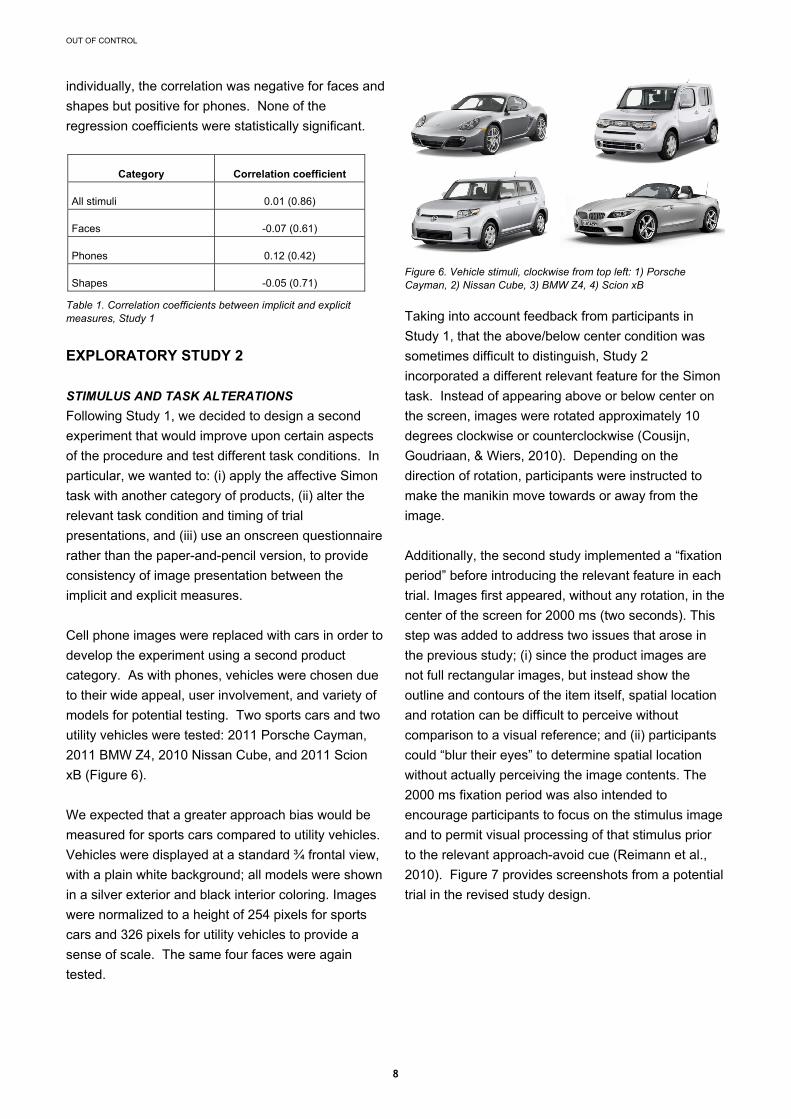
Finally, four geometric shapes (triangle, square,
pentagon, hexagon) were used as the third category
of stimuli (Figure 4). We expected that approach bias
values would not be significantly different for any of
the shapes. Shape images had maximum dimensions
of 220 x 220 pixels.
Figure 4. Shape stimuli, from left to right: (1) triangle, (2) square, (3) pentagon, (4) hexagon
EXPLORATORY STUDY 1
APPARATUS
All experiments were completed on a MacBook Pro
15-inch laptop computer running Mac OS X 10.4.11,
with screen resolution 1440 x 900. Experiments were
created and presented to participants using SuperLab
software (Cedrus Corporation, 2006), which also
recorded reaction times.
PARTICIPANTS
Twelve male students/researchers at the University of
Cambridge volunteered to participate in the
experiment. Although not necessarily representative
of the broader population, this participant sample is
adequate for the purposes of methodological
development. Compared to the overall consumer
population, this group also offers the advantage of
limited variation in age, sensory and physical ability,
socio-economic status, and educational achievement.
For this preliminary investigation of experimental
procedures, this sample consistency may help to
reduce the effects of confounding variables and
eliminate certain issues, such as discomfort with a
computerized testing environment.
PROCEDURE
Participants were seated in front of the laptop
computer and given a standard verbal description of
the task. They were then presented with on-screen
directions and an opportunity to ask the experimenter
any questions, after which they proceeded to a
practice block. They completed three experimental
blocks, with one block for each stimulus category
(faces, phones, products); the blocks were then
repeated in the same order. Block order and
instruction condition (location above/below the
centerline relating to moving towards/away) were
counterbalanced between subjects. Self-timed breaks
were provided between blocks. Following the
affective Simon experiment, participants filled out a
paper-and-pencil questionnaire that featured the same
printed images accompanied by the question “How
attractive is this {face/product/shape} to you?” and a
portrait version of the 9-point affective Self-
Assessment Manikin (SAM) scale (Lang, 1980; Irtel,
2007). Participants were debriefed as to the purpose
of the experiment and allowed to comment on their
experience or ask any further questions. The entire
procedure took approximately 15 minutes per person.
Practice blocks consisted of twelve trials. In the
experimental blocks, the four initial trials were
systematically discarded due to generally lengthened
response times at the start of each block (Greenwald,
1998). The 16 measured trials followed, such that
each of the four stimuli appeared in all four possible
configurations: above and below center, with the
manikin on the left and right side of the screen. This
condition accounted for right- or left-hand dominance
and potentially faster reaction times on one arrow key
versus the other. The order of trial presentation was
randomized in SuperLab. Over the six blocks, there
was a total of 96 experimental trials per participant.
A single trial of the experiment proceeded as follows.
The manikin figure appeared on either the left or right
side of the screen for 750 ms. A stimulus image then
appeared either above or below center on the screen,
at which point the participant responded with the
appropriate key press. For a correct response, the
manikin moved towards or away from the stimulus
image, simulated with a series of images moving 200
pixels to the left or right over a period of 60 ms and
staying at the final position for a further 100 ms, after
which the screen was cleared. For an incorrect
response, a red “X” appeared in the center of the
screen for 300 ms, after which the screen was
cleared. The inter-trial interval was 1500 ms. (Event
sequence and timing for the tasks were based on
Laane, 2011).
6
PROCEEDINGS DE2012
STATISTICAL METHODS
Data was imported into Matlab (The MathWorks, Inc.,
2008) and SPSS (IBM Corporation, 2009) for analysis.
Reaction times were not included for trials where an
incorrect response was given, except to compute the
percentage of incorrect responses. In order to
eliminate extreme values in the data, which are
generally taken to indicate anticipations or inattention,
values outside the 150 ms – 1500 ms range were
recoded to 150 ms or 1500 ms (Laane, 2011). Data
was recoded rather than removed due to the small
number of trials; further, the recoding method is
insensitive to the proportion of outliers that lie in the
upper end of the distribution versus the lower end
(Greenwald, 1998).
Reaction time data was log-transformed to ensure
satisfactory stability of variance for statistical analysis
and to mitigate the dependence of effect size on
overall reaction time for the specific task being
performed (Greenwald, 1998; De Houwer et al.,
2001). “Approach bias” values were calculated for
each stimulus for each participant, where approach
bias is defined as (log) average avoidance reaction
time minus (log) average approach reaction time.
RESULTS AND DISCUSSION
The total average reaction time for the test was 698
ms, and 4.08% of total responses were incorrect. The
correlation between incorrect responses and reaction
time was positive and insignificant (r = 0.04, p = 0.49).
Reaction Times
Mean reaction times (untransformed) for the twelve
stimuli are summarized in Figure 5. For all stimuli
except one (Shape #2, the square), reaction times
were shorter for the approach condition than the
avoidance condition. A two-tailed, one-sample t-test
also revealed that mean approach bias values were
significantly greater than zero for all three stimulus
categories: faces, t(11) = 2.66, p = 0.02; phones, t(11)
= 3.32, p < 0.01; and shapes, t(11) = 3.21, p < 0.01.
This strong pattern of positive approach bias could
indicate a potential problem with the task design.
Figure 5. Mean approach and avoidance times for stimuli in Study 1: faces (upper image), phones (middle image), and shapes (lower image)
A repeated measures ANOVA was performed to
compare the approach bias values for various sets of
stimuli. The ANOVA did not reveal that the approach
bias for averaged faces differed significantly from that
of individual faces, nor that the approach bias for older
phones differed significantly from that of newer
phones. Pairwise comparisons (using Bonferroni’s
correction for multiple comparisons) did not reveal
significant differences in approach bias between
individual stimuli within each category.
Correlations
Correlation coefficients were computed between the
implicit and explicit scores. The implicit score is a
participant’s approach bias value for a particular
stimulus; the corresponding explicit score is the
affective SAM rating reported by the same participant
for the same stimulus. Correlation coefficient values
are presented in Table 1; p-values are shown in
parentheses next to each coefficient. There was a
positive overall correlation between implicit and
explicit scores. For each category computed
7
OUT OF CONTROL
individually, the correlation was negative for faces and
shapes but positive for phones. None of the
regression coefficients were statistically significant.
Category Correlation coefficient
All stimuli 0.01 (0.86)
Faces -0.07 (0.61)
Phones 0.12 (0.42)
Shapes -0.05 (0.71)
Table 1. Correlation coefficients between implicit and explicit measures, Study 1
EXPLORATORY STUDY 2
STIMULUS AND TASK ALTERATIONS
Following Study 1, we decided to design a second
experiment that would improve upon certain aspects
of the procedure and test different task conditions. In
particular, we wanted to: (i) apply the affective Simon
task with another category of products, (ii) alter the
relevant task condition and timing of trial
presentations, and (iii) use an onscreen questionnaire
rather than the paper-and-pencil version, to provide
consistency of image presentation between the
implicit and explicit measures.
Cell phone images were replaced with cars in order to
develop the experiment using a second product
category. As with phones, vehicles were chosen due
to their wide appeal, user involvement, and variety of
models for potential testing. Two sports cars and two
utility vehicles were tested: 2011 Porsche Cayman,
2011 BMW Z4, 2010 Nissan Cube, and 2011 Scion
xB (Figure 6).
We expected that a greater approach bias would be
measured for sports cars compared to utility vehicles.
Vehicles were displayed at a standard ¾ frontal view,
with a plain white background; all models were shown
in a silver exterior and black interior coloring. Images
were normalized to a height of 254 pixels for sports
cars and 326 pixels for utility vehicles to provide a
sense of scale. The same four faces were again
tested.
Figure 6. Vehicle stimuli, clockwise from top left: 1) Porsche Cayman, 2) Nissan Cube, 3) BMW Z4, 4) Scion xB
Taking into account feedback from participants in
Study 1, that the above/below center condition was
sometimes difficult to distinguish, Study 2
incorporated a different relevant feature for the Simon
task. Instead of appearing above or below center on
the screen, images were rotated approximately 10
degrees clockwise or counterclockwise (Cousijn,
Goudriaan, & Wiers, 2010). Depending on the
direction of rotation, participants were instructed to
make the manikin move towards or away from the
image.
Additionally, the second study implemented a “fixation
period” before introducing the relevant feature in each
trial. Images first appeared, without any rotation, in the
center of the screen for 2000 ms (two seconds). This
step was added to address two issues that arose in
the previous study; (i) since the product images are
not full rectangular images, but instead show the
outline and contours of the item itself, spatial location
and rotation can be difficult to perceive without
comparison to a visual reference; and (ii) participants
could “blur their eyes” to determine spatial location
without actually perceiving the image contents. The
2000 ms fixation period was also intended to
encourage participants to focus on the stimulus image
and to permit visual processing of that stimulus prior
to the relevant approach-avoid cue (Reimann et al.,
2010). Figure 7 provides screenshots from a potential
trial in the revised study design.
8
PROCEEDINGS DE2012
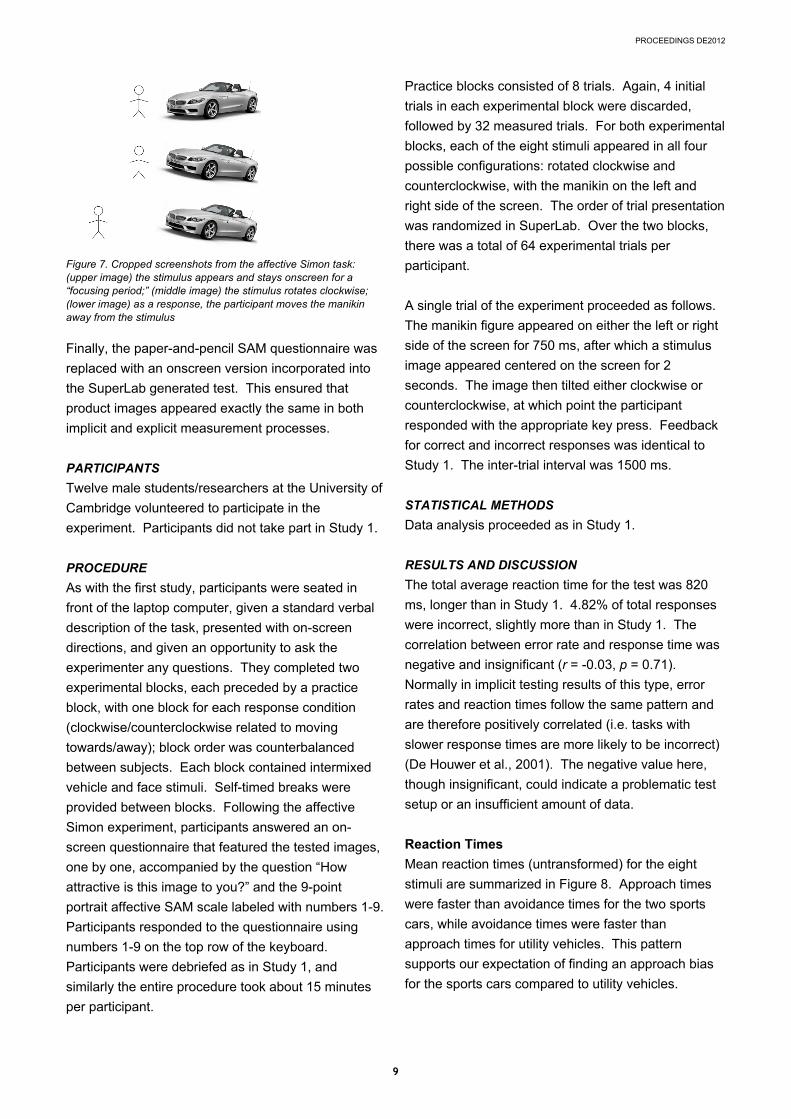
Figure 7. Cropped screenshots from the affective Simon task: (upper image) the stimulus appears and stays onscreen for a “focusing period;” (middle image) the stimulus rotates clockwise; (lower image) as a response, the participant moves the manikin away from the stimulus
Finally, the paper-and-pencil SAM questionnaire was
replaced with an onscreen version incorporated into
the SuperLab generated test. This ensured that
product images appeared exactly the same in both
implicit and explicit measurement processes.
PARTICIPANTS
Twelve male students/researchers at the University of
Cambridge volunteered to participate in the
experiment. Participants did not take part in Study 1.
PROCEDURE
As with the first study, participants were seated in
front of the laptop computer, given a standard verbal
description of the task, presented with on-screen
directions, and given an opportunity to ask the
experimenter any questions. They completed two
experimental blocks, each preceded by a practice
block, with one block for each response condition
(clockwise/counterclockwise related to moving
towards/away); block order was counterbalanced
between subjects. Each block contained intermixed
vehicle and face stimuli. Self-timed breaks were
provided between blocks. Following the affective
Simon experiment, participants answered an on-
screen questionnaire that featured the tested images,
one by one, accompanied by the question “How
attractive is this image to you?” and the 9-point
portrait affective SAM scale labeled with numbers 1-9.
Participants responded to the questionnaire using
numbers 1-9 on the top row of the keyboard.
Participants were debriefed as in Study 1, and
similarly the entire procedure took about 15 minutes
per participant.
Practice blocks consisted of 8 trials. Again, 4 initial
trials in each experimental block were discarded,
followed by 32 measured trials. For both experimental
blocks, each of the eight stimuli appeared in all four
possible configurations: rotated clockwise and
counterclockwise, with the manikin on the left and
right side of the screen. The order of trial presentation
was randomized in SuperLab. Over the two blocks,
there was a total of 64 experimental trials per
participant.
A single trial of the experiment proceeded as follows.
The manikin figure appeared on either the left or right
side of the screen for 750 ms, after which a stimulus
image appeared centered on the screen for 2
seconds. The image then tilted either clockwise or
counterclockwise, at which point the participant
responded with the appropriate key press. Feedback
for correct and incorrect responses was identical to
Study 1. The inter-trial interval was 1500 ms.
STATISTICAL METHODS
Data analysis proceeded as in Study 1.
RESULTS AND DISCUSSION
The total average reaction time for the test was 820
ms, longer than in Study 1. 4.82% of total responses
were incorrect, slightly more than in Study 1. The
correlation between error rate and response time was
negative and insignificant (r = -0.03, p = 0.71).
Normally in implicit testing results of this type, error
rates and reaction times follow the same pattern and
are therefore positively correlated (i.e. tasks with
slower response times are more likely to be incorrect)
(De Houwer et al., 2001). The negative value here,
though insignificant, could indicate a problematic test
setup or an insufficient amount of data.
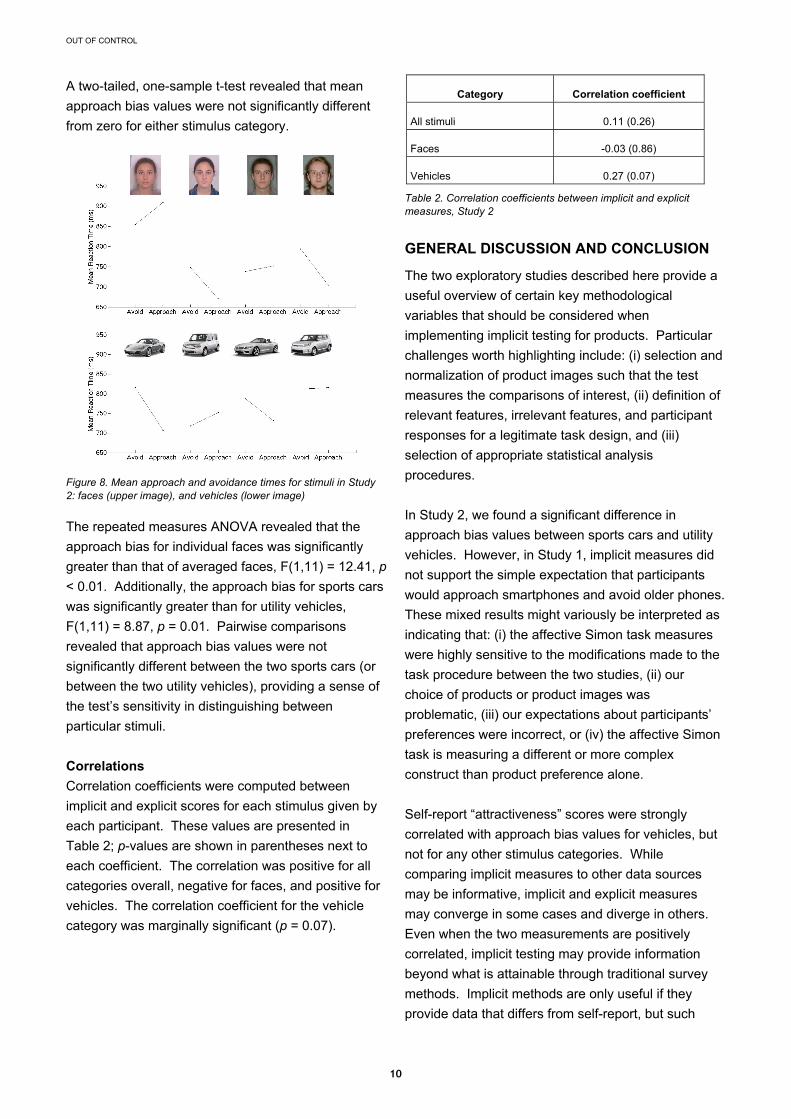
Reaction Times
Mean reaction times (untransformed) for the eight
stimuli are summarized in Figure 8. Approach times
were faster than avoidance times for the two sports
cars, while avoidance times were faster than
approach times for utility vehicles. This pattern
supports our expectation of finding an approach bias
for the sports cars compared to utility vehicles.
9
OUT OF CONTROL
A two-tailed, one-sample t-test revealed that mean
approach bias values were not significantly different
from zero for either stimulus category.
Figure 8. Mean approach and avoidance times for stimuli in Study 2: faces (upper image), and vehicles (lower image)
The repeated measures ANOVA revealed that the
approach bias for individual faces was significantly
greater than that of averaged faces, F(1,11) = 12.41, p
< 0.01. Additionally, the approach bias for sports cars
was significantly greater than for utility vehicles,
F(1,11) = 8.87, p = 0.01. Pairwise comparisons
revealed that approach bias values were not
significantly different between the two sports cars (or
between the two utility vehicles), providing a sense of
the test’s sensitivity in distinguishing between
particular stimuli.
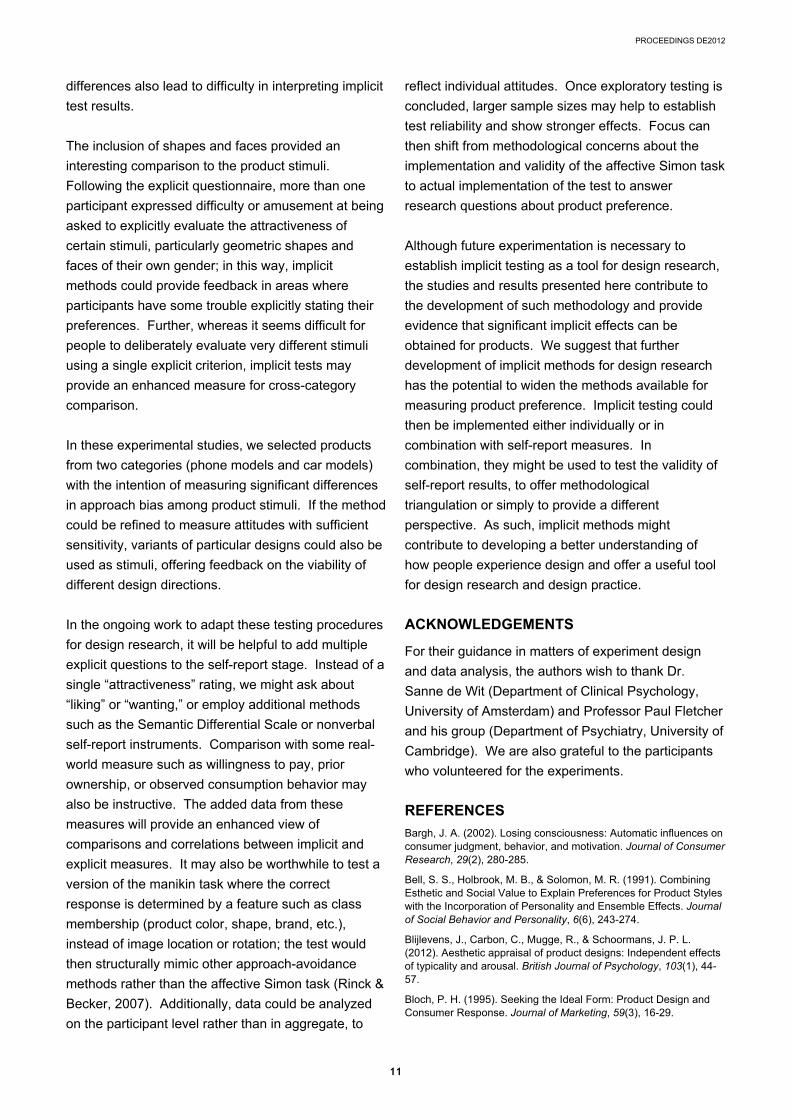
Correlations
Correlation coefficients were computed between
implicit and explicit scores for each stimulus given by
each participant. These values are presented in
Table 2; p-values are shown in parentheses next to
each coefficient. The correlation was positive for all
categories overall, negative for faces, and positive for
vehicles. The correlation coefficient for the vehicle
category was marginally significant (p = 0.07).
Category Correlation coefficient
All stimuli 0.11 (0.26)
Faces -0.03 (0.86)
Vehicles 0.27 (0.07)
Table 2. Correlation coefficients between implicit and explicit measures, Study 2
GENERAL DISCUSSION AND CONCLUSION
The two exploratory studies described here provide a
useful overview of certain key methodological
variables that should be considered when
implementing implicit testing for products. Particular
challenges worth highlighting include: (i) selection and
normalization of product images such that the test
measures the comparisons of interest, (ii) definition of
relevant features, irrelevant features, and participant
responses for a legitimate task design, and (iii)
selection of appropriate statistical analysis
procedures.
In Study 2, we found a significant difference in
approach bias values between sports cars and utility
vehicles. However, in Study 1, implicit measures did
not support the simple expectation that participants
would approach smartphones and avoid older phones.
These mixed results might variously be interpreted as
indicating that: (i) the affective Simon task measures
were highly sensitive to the modifications made to the
task procedure between the two studies, (ii) our
choice of products or product images was
problematic, (iii) our expectations about participants’
preferences were incorrect, or (iv) the affective Simon
task is measuring a different or more complex
construct than product preference alone.
Self-report “attractiveness” scores were strongly
correlated with approach bias values for vehicles, but
not for any other stimulus categories. While
comparing implicit measures to other data sources
may be informative, implicit and explicit measures
may converge in some cases and diverge in others.
Even when the two measurements are positively
correlated, implicit testing may provide information
beyond what is attainable through traditional survey
methods. Implicit methods are only useful if they
provide data that differs from self-report, but such
10
PROCEEDINGS DE2012
differences also lead to difficulty in interpreting implicit
test results.
The inclusion of shapes and faces provided an
interesting comparison to the product stimuli.
Following the explicit questionnaire, more than one
participant expressed difficulty or amusement at being
asked to explicitly evaluate the attractiveness of
certain stimuli, particularly geometric shapes and
faces of their own gender; in this way, implicit
methods could provide feedback in areas where
participants have some trouble explicitly stating their
preferences. Further, whereas it seems difficult for
people to deliberately evaluate very different stimuli
using a single explicit criterion, implicit tests may
provide an enhanced measure for cross-category
comparison.
In these experimental studies, we selected products
from two categories (phone models and car models)
with the intention of measuring significant differences
in approach bias among product stimuli. If the method
could be refined to measure attitudes with sufficient
sensitivity, variants of particular designs could also be
used as stimuli, offering feedback on the viability of
different design directions.
In the ongoing work to adapt these testing procedures
for design research, it will be helpful to add multiple
explicit questions to the self-report stage. Instead of a
single “attractiveness” rating, we might ask about
“liking” or “wanting,” or employ additional methods
such as the Semantic Differential Scale or nonverbal
self-report instruments. Comparison with some real-
world measure such as willingness to pay, prior
ownership, or observed consumption behavior may
also be instructive. The added data from these
measures will provide an enhanced view of
comparisons and correlations between implicit and
explicit measures. It may also be worthwhile to test a
version of the manikin task where the correct
response is determined by a feature such as class
membership (product color, shape, brand, etc.),
instead of image location or rotation; the test would
then structurally mimic other approach-avoidance
methods rather than the affective Simon task (Rinck &
Becker, 2007). Additionally, data could be analyzed
on the participant level rather than in aggregate, to
reflect individual attitudes. Once exploratory testing is
concluded, larger sample sizes may help to establish
test reliability and show stronger effects. Focus can
then shift from methodological concerns about the
implementation and validity of the affective Simon task
to actual implementation of the test to answer
research questions about product preference.
Although future experimentation is necessary to
establish implicit testing as a tool for design research,
the studies and results presented here contribute to
the development of such methodology and provide
evidence that significant implicit effects can be
obtained for products. We suggest that further
development of implicit methods for design research
has the potential to widen the methods available for
measuring product preference. Implicit testing could
then be implemented either individually or in
combination with self-report measures. In
combination, they might be used to test the validity of
self-report results, to offer methodological
triangulation or simply to provide a different
perspective. As such, implicit methods might
contribute to developing a better understanding of
how people experience design and offer a useful tool
for design research and design practice.
ACKNOWLEDGEMENTS
For their guidance in matters of experiment design
and data analysis, the authors wish to thank Dr.
Sanne de Wit (Department of Clinical Psychology,
University of Amsterdam) and Professor Paul Fletcher
and his group (Department of Psychiatry, University of
Cambridge). We are also grateful to the participants
who volunteered for the experiments.
REFERENCES
Bargh, J. A. (2002). Losing consciousness: Automatic influences on consumer judgment, behavior, and motivation. Journal of Consumer Research, 29(2), 280-285.
Bell, S. S., Holbrook, M. B., & Solomon, M. R. (1991). Combining Esthetic and Social Value to Explain Preferences for Product Styles with the Incorporation of Personality and Ensemble Effects. Journal of Social Behavior and Personality, 6(6), 243-274.
Blijlevens, J., Carbon, C., Mugge, R., & Schoormans, J. P. L. (2012). Aesthetic appraisal of product designs: Independent effects of typicality and arousal. British Journal of Psychology, 103(1), 44-57.
Bloch, P. H. (1995). Seeking the Ideal Form: Product Design and Consumer Response. Journal of Marketing, 59(3), 16-29.
11
OUT OF CONTROL
12
Brunel, F., Tietje, B., & Greenwald, A. (2004). Is the Implicit Association Test a Valid and Valuable Measure of Implicit Consumer Social Cognition? Journal of Consumer Psychology, 14(4), 385-404.
Cedrus Corporation. (2006). SuperLab (v4.5.1). San Pedro, CA: www.superlab.com
Chen, M., & Bargh, J. A. (1999). Consequences of automatic evaluation: Immediate behavioral predispositions to approach or avoid the stimulus. Personality and Social Psychology Bulletin, 25(2), 215.
Cousijn, J., Goudriaan, A. E., & Wiers, R. W. (2011). Reaching out towards cannabis: approach�bias in heavy cannabis users predicts changes in cannabis use. Addiction, 106(9), 1667-1674.
Creusen, M. E. H., & Schoormans, J. P. L. (2005). The Different Roles of Product Appearance in Consumer Choice. The Journal of Product Innovation Management, 22(1), 63-81.
Crilly, N., Moultrie, J., & Clarkson, P. J. (2004). Seeing things: consumer response to the visual domain in product design. Design Studies, 25(6), 547-577.
De Houwer, J. (2003). A Structural Analysis of Indirect Measures of Attitudes. In J. Musch & K. C. Klauer (Eds.), The Psychology of Evaluation: Affective Processes in Cognition and Emotion (pp. 219-244). Psychology Press.
De Houwer, J. (2006). What Are Implict Measures and Why Are We Using Them? In R. W. H. J. Wiers & A. W. Stacy (Eds.), Handbook of implicit cognition and addiction (pp. 11-28). Thousand Oaks, CA: SAGE.
De Houwer, J., & Eelen, P. (1998). An Affective Variant of the Simon Paradigm. Cognition & Emotion, 12(1), 45-62.
De Houwer, J., Crombez, G., Baeyens, F., & Hermans, D. (2001). On the generality of the affective Simon effect. Cognition & Emotion, 15(2), 189-206.
Desmet, P. M. A., Hekkert, P., & Jacobs, J. J. (2000). When a Car Makes You Smile: Development and Application of an Instrument to Measure Product Emotions. Advances in Consumer Research, 27, 111-117.
Desmet, P. M. A., Porcelijn, R., & Dijk, M. B. (2007). Emotional Design; Application of a Research-Based Design Approach. Knowledge, Technology & Policy, 20(3), 141-155.
Dimofte, C. V. (2010). Implicit measures of consumer cognition: A review. Psychology and Marketing, 27(10), 921-937.
Fazio, R. H., Sanbonmatsu, D. M., Powell, M. C., & Kardes, F. R. (1986). On the automatic activation of attitudes. Journal of Personality and Social Psychology, 50(2), 229-238.
Friese, M., Hofmann, W., & Wänke, M. (2009). The Impulsive Consumer: Predicting Consumer Behavior with Implicit Reaction Time Measurements. In M. Wänke (Ed.), Social Psychology of Consumer Behavior (pp. 335-364). New York, NY: Psychology Press.
Greenwald, A. G., McGhee, D. E., & Schwartz, J. L. K. (1998). Measuring individual differences in implicit cognition: The implicit association test. Journal of Personality and Social Psychology, 74, 1464-1480.
Greenwald, A. G., Poehlman, T. A., Uhlmann, E. L., & Banaji, M. R. (2009). Understanding and using the Implicit Association Test: III. Meta-analysis of predictive validity. Journal of Personality and Social Psychology, 97(1), 17-41.
Hermans, D., Houwer, J. D., & Eelen, P. (1994). The affective priming effect: Automatic activation of evaluative information in memory. Cognition & Emotion, 8(6), 515-533.
Face Research (2012) Demo: Make an Average. http://www. faceresearch.org/demos/average. Last accessed: 6 February 6, 2012.
IBM Corporation (2009). PASW Statistics (v. 18.0.0). Armonk, New York: http://www-01.ibm.com/software/analytics/spss/
Irtel, H. (2007). PXLab: The Psychological Experiments Laboratory. Version 2.1.11. Mannheim, Germany: University of Mannheim. http://www.pxlab.de. Last accessed: 6 February 2012.
Laane, K. (2011). The ins and outs of pleasure: roles and importance of hedonic value. Doctoral dissertation, University of Cambridge, Cambridge, United Kingdom.
Lang, P. J. (1980). Behavioral treatment and bio-behavioral assessment: computer applications. In J. B. Sidowski, J. H. Johnson, & T. A. Williams (Eds.), Technology in mental health care delivery systems (pp. 119-l37). Norwood, NJ: Ablex.
Langlois, J. H., & Roggman, L. A. (1990). Attractive Faces Are Only Average. Psychological Science, 1(2), 115 -121.
Maison, D., Greenwald, A. G., & Bruin, R. (2001). The Implicit Association Test as a measure of implicit consumer attitudes. Polish Psychological Bulletin, 32(1), 61-69.
Maison, D., Greenwald, A. G., & Bruin, R. H. (2004). Predictive Validity of the Implicit Association Test in Studies of Brands, Consumer Attitudes, and Behavior. Journal of Consumer Psychology, 14(4), 405-415.
Mugge, R., Govers, P. C. M., & Schoormans, J. P. L. (2009). The development and testing of a product personality scale. Design Studies, 30(3), 287-302.
Nagamachi, M. (2002). Kansei engineering as a powerful consumer-oriented technology for product development. Applied Ergonomics, 33(3), 289-294.
Nosek, B. A., Greenwald, A. G., & Banaji, M. R. (2007). The Implicit Association Test at Age 7: A Methodological and Conceptual Review. In J. A. Bargh (Ed.), Social psychology and the unconscious: The automaticity of higher mental processes. Frontiers of social psychology. (pp. 265-292). New York, NY: Psychology Press.
Orne, M. T. (1962). On the social psychology of the psychological experiment: With particular reference to demand characteristics and their implications. American Psychologist, 17(11), 776-783.
Oskamp, Stuart. (1977). Attitudes and Opinions. Englewood Cliffs, NJ: Prentice Hall.
Reimann, M., Zaichkowsky, J., Neuhaus, C., Bender, T., & Weber, B. (n.d.). Aesthetic Package Design: A Behavioral, Neural, and Psychological Investigation. Journal of Consumer Psychology, 20(4), 431-441.
Rinck, M., & Becker, E. S. (2007). Approach and avoidance in fear of spiders. Journal of Behavior Therapy and Experimental Psychiatry, 38(2), 105-120.
Roefs, A., Huijding, J., Smulders, F. T. Y., MacLeod, C. M., de Jong, P. J., Wiers, R. W., & Jansen, A. T. M. (2011). Implicit measures of association in psychopathology research. Psychological Bulletin, 137(1), 149-193.
Schifferstein, H. N. J., & Hekkert, P. (Eds.). (2008). Product experience. San Diego, CA: Elsevier.
Tiddeman, B., Burt, D., & Perrett, D. (2001). Computer graphics in facial perception research. IEEE Computer Graphics and Applications, 21(5), 42–50.
The MathWorks, Inc. (2008). Matlab (v. 7.6.0, R2008a). Natick, Massachusetts: www.mathworks.com
Wang, Y. J., & Minor, M. S. (2008). Validity, reliability, and applicability of psychophysiological techniques in marketing research. Psychology and Marketing, 25(2), 197-232.
Wiers, R. W., Rinck, M., Kordts, R., Houben, K., & Strack, F. (2010). Retraining automatic action-tendencies to approach alcohol in hazardous drinkers. Addiction, 105(2), 279-287.