implications of the biofuels boom for the global livestock industry
TRANSCRIPT

Implications of the Biofuels Boom for the Global Livestock Industry: A Computable General Equilibrium Analysis*
by
Farzad Taheripour
Thomas W. Hertel
Wallace E. Tyner
GTAP Working Paper No. 58 2010
* An earlier version of this paper was prepared as a background document for the FAO 2009 State of Food and Agriculture report. An earlier version was presented at the 2009 Applied and Agricultural Economics Association meeting in Milwaukee Wisconsin as well.
Farzad Taheripour is energy economist and Thomas H. Hertel and Wallace E. Tyner are professors, in the Department of Agricultural Economics at Purdue University.
Authors Affiliation
Farzad Taheripour, Department of Agricultural Economics, Purdue University, 403 West State State, Corresponding Author
West Lafayette, IN 47907-2056, Phone: +1 765 494 4612, Fax: +1 765 494 9176, E-mail: [email protected]

2
IMPLICATIONS OF THE BIOFUELS BOOM FOR THE GLOBAL LIVESTOCK
INDUSTRY: A COMPUTABLE GENERAL EQUILIBRIUM ANALYSIS
Farzad Taheripour, Thomas W. Hertel and Wallace E. Tyner
Abstract
The past decade has seen rapid growth in the global biofuels sector – particularly in the US and the EU. This has had important implications for the global livestock industry – both by raising the cost of feed grains and oilseeds and by forcing onto the market a large supply of biofuel by-products, many of which end up in livestock feed rations. This paper systematically investigates the impact of an expanding biofuels industry on the mix and location of global livestock production. Our results suggest that the impacts on specific livestock sectors in individual countries are quite varied. We estimate that growth in the US and EU biofuels industries actually results in larger absolute reductions in livestock production overseas, as opposed to in the biofuel producing regions themselves. This is due to the relatively greater transmission of grains prices into the overseas markets, as compared to the transmission of byproduct prices. We also find that the non-ruminant industry curtails its production more than other livestock industries, because it is less able to take advantage of low cost biofuel byproducts in its feed rations. Implementing biofuel mandates in the US and EU increases cropland area within the biofuel and non-biofuel producer regions. A large portion of this increase will be obtained from reduced grazing lands. The biofuel producing regions are expected to reduce their coarse grains exports and increase imports of oilseeds and vegetable oils, while they increase their exports of processed feed materials. Though biofuel mandates have important consequences for the livestock industry, they do not severely curtail these industries. This is largely due to the important role of byproducts in substituting for higher priced feedstuffs.
Keywords: General Equilibrium; Livestock, Feed Rations; Biofuel Mandate; Land Use

3
Table of Contents 1. Introduction and Literature Review .............................................................................4 2. Historical Links Between Biofuels, Feeds, and Livestock ...........................................7 3. Analytical Framework ..................................................................................................9 4. Modifications in GTAP-BIO Model and its Data Base .............................................11 5. Modeling Biofuel Mandates .......................................................................................13 6. Ex ante Simulations ....................................................................................................14 7. Ex ante Analyses ........................................................................................................14
7.1 Transition to a biofuel economy: Major implications for US and EU ..............14 7.2 Global implications of the US and EU biofuel mandates .................................18
8. Conclusion ..................................................................................................................24 References ..........................................................................................................................27 Tables ................................................................................................................................30 Figures................................................................................................................................32 Appendices .........................................................................................................................39

4
Implications of the Biofuels Boom for the Global Livestock Industry: A Computable General Equilibrium Analysis
1. Introduction and Literature Review
The global biofuel industry has experienced a period of extraordinary growth in recent years and
is expected to grow in the future. This has important consequences for the farms producing
biofuel feedstocks such as corn, sugarcane, and oilseeds, and most studies to date have focused
on these crop sector impacts as well as land cover changes (Birur et al., 2007; Hertel et al., 2010;
Searchinger et al., 2008; and Taheripour et al., 2009). However, the biofuel boom has significant
implications for the global livestock industries as well. The purpose of this paper is to delve
more carefully into the impacts of expanding of biofuel production for the global livestock
industries and their links to other industries and markets.
The most obvious consequence of large scale biofuel production for the livestock
industry is higher crop prices which increase input costs. Biofuel production also raises returns to
cropland, which, in turn, encourages conversion of some pastureland to crops, thereby further
increasing production costs for ruminant livestock. On the other hand, biofuels are produced in
conjunction with valuable byproducts which can be used in the livestock industry as animal feeds
and can substitute for the higher priced crops in animal rations. Production of biofuel byproducts
such as Distillers Dried Grains with Solubles (DDGS) and oilseed meals have significantly
increased in recent years following the boom in biofuel production.
However, not all livestock industries are well-placed to capitalize on the increased
availability of such byproducts. Ruminants (dairy and beef) are better able to make use of DDGS
in their feed rations and are therefore better positioned to gain from increased DDGS availability,

5
compared to other livestock that may not be able to adjust their feed rations as readily to absorb
the increased supply of DDGS.
Biofuel byproducts represent an important component of biofuel industry revenues. If the
livestock industry could not absorb these byproducts, their prices would fall sharply, thereby
limiting expansion of the biofuel industry. In addition, both industries compete for crop
feedstocks. The interactions between these industries become even more complicated when we
take into account other economy-wide linkages with energy and agricultural markets. For this
reason, a formal model is required in order to provide a comprehensive evaluation of
consequences of biofuel production for the global livestock industry.
Several aspects of biofuel production have been examined in the literature. Some studies
have used partial equilibrium models and examined impacts of biofuels on grain and livestock
industries. For example, Elobeid et al. (2006) and Tokgoz et al. (2007) have studied impacts of
US ethanol production on its grain and livestock industries using partial equilibrium models. The
former did not take into account the possibility of using ethanol byproducts as animal feed and
hence its results are not likely to be accurate. However, the latter did include distillers grains in
its analysis and shows moderate effects of ethanol production on the US livestock industry. Both
papers disregard the land market and the competition between crop, livestock, and ethanol
industries for land. They also ignored the EU biofuel mandates and paid no attention to the
interactions between the US and EU mandates and their implications for the global livestock
industry. We will incorporate these factors into our analyses.
Many studies have examined the use of biofuel byproducts and their suitability for
different types of animal species (Shurson and Spiehs, 2002; Anderson et al., 2006; Whitney et
al., 2006; Daley, 2007; Klopfenstein, Erickson, and Bremer, 2008a and 2008b; Schingoethe,
6
2008; Stein 2008; and Bregendahl, 2008). In general, these papers indicate that distillers grains
can be introduced in animal feed rations more extensively, compared to the existing feed rations,
at different rates across different types of species. A group of studies has also estimated huge
potential markets for these products based on purely theoretical feed rations (Cooper, 2005;
Dhuyvetter et al., 2005; Fox, 2008; Paulson, 2008). In this context, several papers calculated the
displacement ratios between DDGS and other feed ingredients for different types of animal
species. For example, Arora, Wu, and Wang (2008) have calculated displacement ratios for
different animal species using experimental feed rations, although they ignore the impact of
changes in feed prices on the optimal mix of feed ingredients1
Finally, several studies have used Computable General Equilibrium (CGE) models and
addressed the economy-wide consequences of producing biofuels at a large scale (Reilly and
Paltsev, 2007; Dixon, Osborne, and Rimmer, 2007; Banse et al., 2007; and Birur et al., 2007)
These papers have all ignored the role of byproducts resulting from the production of biofuels;
hence they do not provide an accurate evaluation of economic consequences of biofuel
production, in particular for the livestock industry, which is the main user of biofuel byproducts.
.
In a recent work, Taheripour et al. (2009) introduced biofuel byproducts into a special
purpose version of the Global Trade Analysis Project (GTAP) model (Hertel, 1997) of the global
economy and have shown that incorporating biofuel byproducts considerably dampens the
impacts on land use and commodity prices in the face of 2015 US and EU biofuel mandates (we
1 In calculating these displacement ratios, they consider impacts of displacing corn for distillers grains on the composition of feed rations and weight gains of animal species during their production lifecycles. These authors indicate that 1 kg of distiller grains could displace 1.19 kg corn and 0.06 kg urea used in the beef cattle sector of the US. Their displacement ratios for the US dairy sector are 0.73 kg corn and .63 kg soybean meal and for the swine industry are 0.89 kg of corn and 0.095 kg of soybean meal. Several factors such as changes in the relative prices of feed ingredients, livestock prices, and the mix of animal species held by the livestock industry could alter these displacement ratios. For example, Fabiosa (2009) has shown that 1 kg of DDGS could displace between 0.77 kg to 0.94 kg of corn in the swine feed rations, if we take into account impacts of changes in the feed prices on the optimal mix of feed ingredients.

7
will henceforth refer to this paper as THTBB). THTBB has included livestock industries in its
model. However, THTBB does not analyze the link between agriculture, livestock, vegetable oil,
food, and biofuel industries in the presence of biofuel byproducts. As a result, one cannot see
differential consequences of biofuel production for these activities.
This paper seeks to contribute to our understanding of the impacts of biofuel mandates in
the US and the EU on the global structure of the livestock industry. We adopt as our starting
point for this paper, the work reported in THTBB, and we extend it to highlight the impacts of
biofuel mandates for the global livestock industries. The framework which we develop in this
paper is global in scope and links global production, consumption, and trade. In addition, it
properly links energy, biofuel, and agricultural markets. Since biofuel, crop, and livestock
industries compete through the land market, the model links these activities through the land
market as well. Furthermore, biofuels byproducts, which can be used in animal feedstuffs, bridge
these industries through a triangular relationship to reflect the nature of competition among these
industries.
2. Historical Links Between Biofuels, Feeds, and Livestock
The literature review presented in the first section asserts that the livestock industry could use
biofuel byproducts to eliminate the cost consequences of higher crop prices. The historical
observation confirms this statement. As shown in Figure 1, the quantity share2
2 Quantity shares reported in this section are obtained from quantities of feedstuffs s used in livestock industry in metric ton.
of corn in the
main feedstuffs (corn, soybean meal, and DDGS) used in the US livestock industry has declined
from 82.4% to 74.2% during the time period of 2001-2008. On the other hand the quantity share
of DDGS has increased from 1.3% to 10.3%. During same time period, the US livestock industry

8
has displaced 15.5 million metric tons of corn with 16.2 million metric tons of DDGS. These
figures generate a historical displacement rate of 0.95 kg of corn for 1 kg of DDGS for this
period. Figure 1 also shows that the share of soybean meal in US feedstuffs has roughly
remained around 15%, which suggests that DDGS have not displaced soybean consumption in
this time period. From this aggregated historical observation one cannot conclude that DDGS
does not displace soybean consumption at the farm level, because the composition of livestock
industry has changed in this time period as well. During the time period of 2001-2008, the US
DDGS outputs and exports have increased by 19.9 and 3.7 million metric tons, respectively.
Figure 2 depicts the quantity shares of rapeseed, sunflower, and soybean meals in the
meals used by the EU livestock industry during the time period of 2001-2008. This figure shows
that the share of rapeseed meal (the main byproduct of producing biodiesel from rapeseed) has
increased from 13.8% to 23.8% in this time period, while the share of soybean meal has fallen
from 76.5% to 65.5%. During the same period, production of rapeseed meal – a byproduct of
rapeseed crushing for oil to be used in production of biodiesel – within the EU has doubled,
rising from 6 to 10 million metric tons.
The relative prices of these byproducts have declined, relative to other feedstuffs, and, as
a result, their importance in the feed mix has risen. For example, in the US, average price of
DDGS has increased by 46% during 2001-2008, while the average price of corn, a major
feedstuff, has increased by 84% during the same period. Due to the boom in biodiesel production
from rapeseed in the EU, the price of rapeseed meal has fallen relative to the prices of soybean
meal and wheat (a major feed in EU) during the same time period, as shown in figure 3. These
figures suggest that biofuel byproducts can help to offset some of the adverse cost implications
of the biofuels boom for the livestock industry. What implications have these important linkages

9
had for the global structure and composition of the livestock industry? How is this likely to
evolve as countries move to fulfill even more ambitious biofuel targets? To answer these
questions we need an analytical framework that is multi-sector and global in scope. The next
section introduces our modeling framework.
3. Analytical Framework
In this section we develop our methodology to explain links among crops, biofuels, livestock,
food, and feed industries and the competition between these industries in the primary input
markets for land, labor and capital.
A stylized representation of the links between food, feed livestock, and biofuel industries
and their competition for land is provided in Figure 4. There are four panels in this figure – each
successive one illustrating an additional linkage which we will seek to take into account. The
first panel of this figure depicts an economy with no biofuels such that the crop industry uses
land and supplies material to the food, feed, and livestock industries. In this case, the livestock
industry takes some feed materials from the food and feed industries and uses pastureland as an
input as well. In the second and third panels of this figure we assume that biofuel production
does not reduce demands for food. Hence, we ignore the consumption side of the economy in
these panels.
The second panel introduces the biofuel industry into the economy, while ignoring the
role of biofuels byproducts. In this case, in the absence of adjustment in food consumption, if the
size of biofuel industry is large, the demand for crop feedstocks to support biofuel production
may have a very large impact on crop prices. This increases the demand for land and may induce
the conversion of forest and pastureland to crop production. If that happens, then the livestock
industry needs more crops and processed feedstuffs to meet the demand for its products. Recall

10
that we assume biofuel production does not reduce food consumption. This could elevate forest
conversion to crop production.
Panel 3 takes into account the biofuel byproducts. In the presence of these byproducts,
the biofuel industry sends its byproducts to the livestock industry. The livestock producers can
substitute these byproducts for crops and use them in their animal feeds. This directly reduces the
livestock demand for crops. This reduction in the demand for crops will reduce conversion of
land to crop production. Including biofuel byproducts will reduce the prices of crops and
livestock products, compared with the cases of panel 2.
The final panel of Figure 4 introduces consumer demand and trade into the picture. As
shown in this panel, there is now a final destination for crops and food (including livestock and
processed livestock products) – both domestic and foreign. So far we were assuming that biofuel
production does not affect the final demand for crops and food products. In the real world,
production of biofuels from agricultural resources raises the prices of crops and food products.
In response to higher prices, ceteris paribus, the domestic and foreign users will reduce their
demands for crops and food products (including processed livestock products). This causes a
drop in the demand for land compare to the case of panel 3 and mitigates the pressure on land
conversion.
In this paper we move successively through the four panels in Figure 4 by undertaking a
set of successively less restrictive model simulations. Specifically, we first develop three
restricted simulations which represent transformation from panel 1 to panels 2, and 3. Results of
these simulations permit rigorous analysis of the role of byproducts and the competition for land
among biofuel, crops and livestock industries in the economic and environmental analyses of
biofuel and biofuel policies. Then we offer an unrestricted simulation which permits us to

11
analyze the full impacts of the US and EU biofuel mandates for the key industries discussed
above, in particular livestock, in the presence of biofuel byproducts and foreign trade.
4. Modifications in GTAP-BIO Model and its Data Base
To develop the experiments mentioned above we extend the work reported in THTBB in several
directions. First, we made a major revision in the demand side of the model for animal feeds.
THTBB have developed a two level nesting demand structure for the animal feeds. It first
considers substitutions between coarse gain and DDGS and between processed feed and oilseed
meals. Then it combines the mixes of (DDGS-Coarse grains) and (Oilseed meals-Processed feed)
with other feed ingredients. This is an appropriate way to model the demand for feed in a CGE
framework, but we extend it to be able to bundle homogeneous feed ingredients together and
then apply appropriate elasticities of substitution among them. Hence we defined a three level
nesting structure for the demand for feeds in the livestock industry. Figure 5 represents this
nesting structure. Following THTBB, at the lower level of this nesting structure DDGS and
coarse grains are combined to create an energy feed composite. At this level oilseeds and oilseed
meals are also combined to create a protein feed composite. At a higher level the protein and
energy feed ingredients are combined into an energy-protein composite input. At this level other
crops also are bundled together. The livestock industry purchases some inputs from processed
livestock industry as well these materials are bundled together at the second level too. Finally, all
feed ingredients are combined to create a feed composite.
Following THTBB we assigned elasticities of substitution to the different components of
the demand for feed to replicate historical changes in the prices of DDGS and meals in the US
and EU during the time period of 2001-2006. In addition, we did several experimental
simulations and sensitivity tests to match displacement ratios between DDGS, grains, oilseeds,

12
and oil seed meals according to the literature in this area. In general, oilseeds and oilseed meals
are close to perfect substitutes. Hence we applied a relatively high elasticity of substitution, 20,
between these two feed materials for all types of animal species. As mentioned earlier several
papers have shown that animal species are different in their ability to digest DDGS. Following
these papers, we used values of 25, 30, and 20 for the elasticities of substitution between coarse
grains and DDGS in the dairy farms, other ruminant, and non-ruminant feed structure,
respectively.
In general, there is a complementary relationship between the protein and energy
feedstuffs in the animal feed rations. We applied a small degree of substitution between these
two groups of feedstuffs (elasticity of substitution = 0.3) because DDGS could displace a portion
of meals in some feed rations, as shown in Arora, Wu, and Wang (2008) and Fabiosa (2009). In
the composite of other crops and composite of processed livestock inputs we applied elasticities
of substitution 1.5 for all types of livestock industry. Finally, following Keeney and Hertel
(2005) we used 0.9 for the elasticity of substitution at the higher level of the feed demand nest.
Taheripour et al. (2007) have introduced biofuels into the version 6 of GTAP data base
((Dimaranan, 2006). We will refer to this data base as GTAP-BIO. THTBB has made two major
modifications into this database. It has divided the vegetable oil industry into two distinct sectors
of crude and refined vegetable oil. The original GTAP data base represents all food and feed
industries under one sector, called other foods. THTBB also has split this aggregated sector into
two distinct feed and food industries. We revisit these splits to better represent the stream of
crude and refined vegetable oils and their byproducts among the food, feed, biodiesel, and
livestock industries. In this revision we used a very detailed input-output table of the US
economy of 1997 to define technologies of production and components of demands for the new

13
sectors. In the split processes, we iteratively compared the results of the split with independent
global data sets on oilseed, vegetable oil and their meals production and consumption (FAPRI,
2002) to make the final outcomes of the split processes consistent with the actual observations.
THTBB has aggregated the world economy into 28 sectors, 30 commodities, and 18
regions. In this paper we expand the sets of industries, commodities and regions into 31, 33, and
19, respectively. In addition, we redefined the geographic/political boundaries of the regions
according to their land type. Our data base aggregates commodities into: 6 groups of crops; 1
forestry product, 6 groups of livestock and processed livestock products; 3 groups of food and
beverages; 2 vegetable oil products, 3 animal feed commodities, 3 types of biofuels, 5 energy
commodities, and 4 groups of other goods and services. Appendix 1 shows the lists of sectors,
commodities, regions and their components.
5. Modeling Biofuel Mandates
Following Hertel et al. (2010) we first defined an experiment to incorporate the expansion in the
global biofuel industry during the time period of 2001-2006 into the GTAP data base. In this
simulation we only shocked the key economic variables that shaped the expansion of the global
biofuel economy in this time period. This approach reduces the need for information for
constructing a comprehensive baseline and isolates impacts of biofuel production from other
changes in the world economy in the time period of 2001-2006. Then we shocked the 2006
global economy with US and EU biofuels policies expected to be in place for 2015. In particular,
this paper examines the global impacts of the US Energy Independence and Security Act of 2007
and the European Union mandates for promoting biofuel production. These mandates are
discussed in detail in Hertel et al. (2010).

14
6. Ex ante Simulations
We undertake 4 different forward looking experiments in this paper. The first three experiments
simulate the transition from panel 1 to panels 2 and 3 of Figure 4. These 3 forward looking
simulations are designed to isolate key aspects of the linkages between crop, livestock, biofuel,
and land markets. We will henceforth refer to these simulations as restricted experiments. In all
three restricted cases we assume that consumption of crops and food products (including
livestock and processed livestock products) remain unchanged due to the shocks in biofuel
production.
Interested readers may obtain the full numerical results from these simulations from the
authors upon request. In presenting the results, we first analyze the consequences of the US and
EU biofuel mandates for the major crops and livestock industries of these two regions using the
results of the restricted and the full effect experiments. Then we expand our analyses to
investigate the global impacts of the US and EU biofuel mandates.
7. Ex ante Analyses
7.1 Transition to a biofuel economy: Major implications for US and EU
In this section we concentrate on the impacts of mandates on the outputs, prices, and trade
balances of three major crops (wheat, coarse grains, and oilseeds) and livestock products of the
US and EU economies. We also study changes in the areas under the production of these crops
and changes in pastureland areas in these two regions. We begin our analyses with experiment 1,
where we assume that the biofuel byproducts cannot be used in the livestock industry and that
the price of land for the livestock industry is fixed. Then in the second and the third experiments
we release these restrictions one by one. Finally, we release the constraint on the food
15
consumption in the full effect experiment. In presenting the results we compared the results of
each experiment with the case of no biofuel mandate.
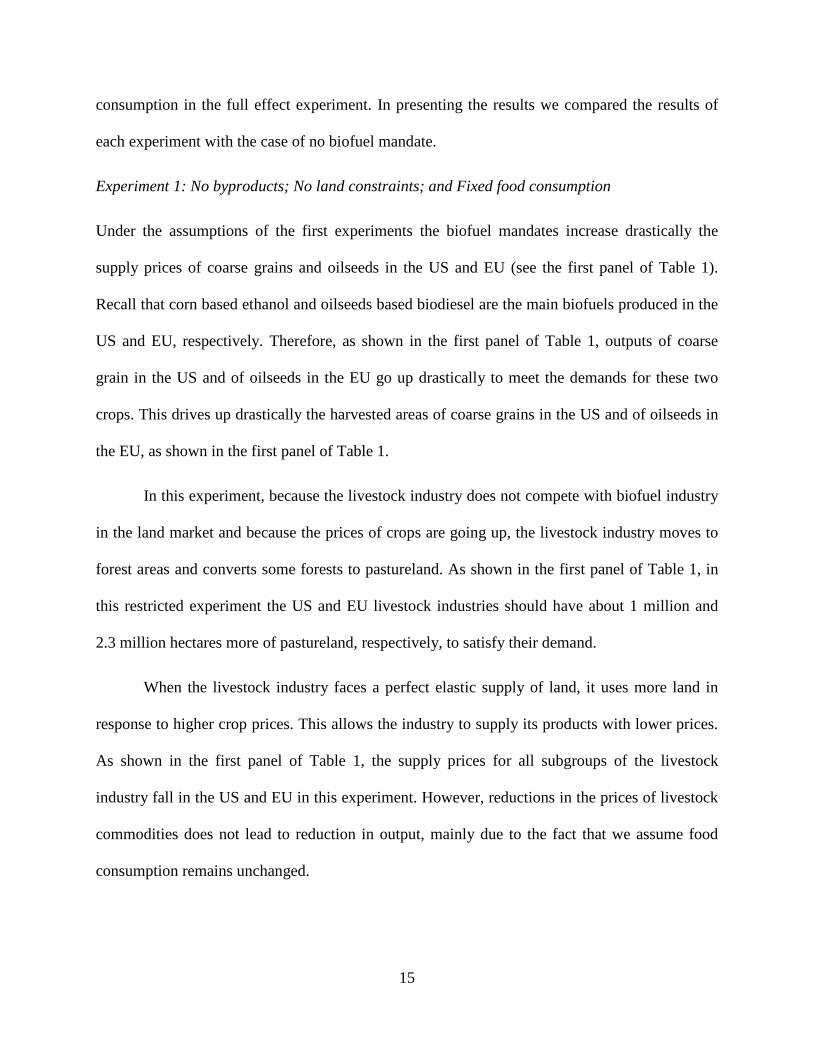
Experiment 1: No byproducts; No land constraints; and Fixed food consumption
Under the assumptions of the first experiments the biofuel mandates increase drastically the
supply prices of coarse grains and oilseeds in the US and EU (see the first panel of Table 1).
Recall that corn based ethanol and oilseeds based biodiesel are the main biofuels produced in the
US and EU, respectively. Therefore, as shown in the first panel of Table 1, outputs of coarse
grain in the US and of oilseeds in the EU go up drastically to meet the demands for these two
crops. This drives up drastically the harvested areas of coarse grains in the US and of oilseeds in
the EU, as shown in the first panel of Table 1.
In this experiment, because the livestock industry does not compete with biofuel industry
in the land market and because the prices of crops are going up, the livestock industry moves to
forest areas and converts some forests to pastureland. As shown in the first panel of Table 1, in
this restricted experiment the US and EU livestock industries should have about 1 million and
2.3 million hectares more of pastureland, respectively, to satisfy their demand.
When the livestock industry faces a perfect elastic supply of land, it uses more land in
response to higher crop prices. This allows the industry to supply its products with lower prices.
As shown in the first panel of Table 1, the supply prices for all subgroups of the livestock
industry fall in the US and EU in this experiment. However, reductions in the prices of livestock
commodities does not lead to reduction in output, mainly due to the fact that we assume food
consumption remains unchanged.

16
In the first experiment, the biofuel mandates negatively affect the trade balances of major
crops and livestock products (including livestock and processed livestock) of the US and EU,
with some exceptions for the US (the first panel of table 1).
Experiment 2: No byproducts and fixed food consumption
We now move to the second experiment, where the livestock industry cannot use the biofuel
byproducts but competes for land. In this experiment the livestock industry loses a portion of its
pastureland compared with the case of no biofuel mandates due to the competition for land (1.2
million hectares in the US and 0.9 million hectares in the EU). Therefore, the livestock industry
buys more crops for feed. This increases demands for crops, causes sharp increases in their
prices, and eventually leads to increases in outputs of crops. An immense land conversion (from
forest and pasture to crop production) is needed to support the massive demand for crops. As
shown in the second panel of Table 1, in this experiment the cropland areas in the US and EU
will increase by 1.9 and 3.7 million hectares due to the biofuel mandates.
Unlike the first experiment, in the second experiment we observe that the prices of
livestock products go up by around 5% to 6% percent in the US and EU regions. This is due to
the fact that in this experiment the livestock industry must pay higher prices for its inputs and for
land. In line with the results of the first experiment, in the second experiment we also observe
that the trade balances of the major crops and livestock products of the US and EU will suffer
from the biofuel mandates, with some exceptions for the US.
Experiment 3: Fixed food consumption
Introducing biofuel byproducts into the animal feed rations reduces the demands for crops
compared to the second experiment and causes lower percentage changes in the prices of crops
17
compared to what we observed in that experiment (compare the percentage changes in the prices
under experiments 2 and 3). This mitigates the demand for corn and oilseeds and in turn
moderates the motivation for land conversion. In this experiment, compared to the case with no
biofuels, the US and EU need about 1.3 and 2.8 million hectares more cropland, respectively, to
meet their biofuels targets. In the presence of biofuel byproducts, the US and EU loses only
about 0.8 and 0.7 million hectares of their pasturelands, respectively. We observe minor
increases in the prices of livestock and processed livestock commodities. Unlike the first two
experiments, in the third experiment we observe more positive items under the trade balance
section of Table 1.
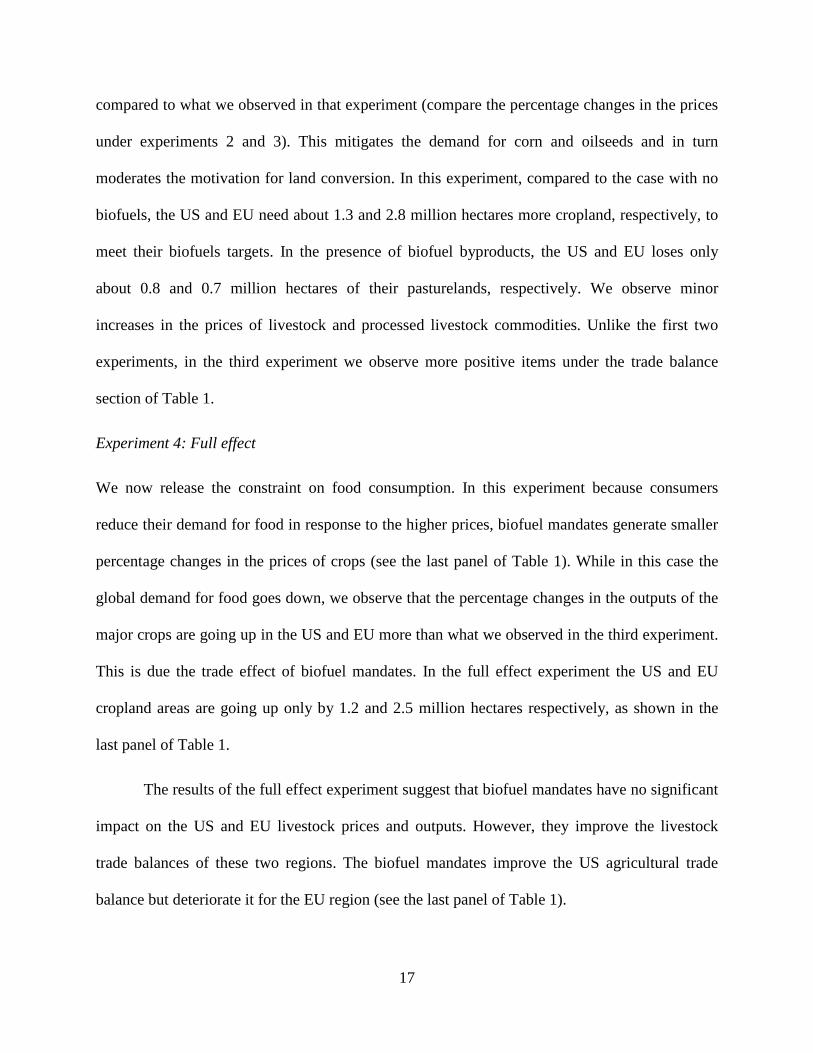
Experiment 4: Full effect
We now release the constraint on food consumption. In this experiment because consumers
reduce their demand for food in response to the higher prices, biofuel mandates generate smaller
percentage changes in the prices of crops (see the last panel of Table 1). While in this case the
global demand for food goes down, we observe that the percentage changes in the outputs of the
major crops are going up in the US and EU more than what we observed in the third experiment.
This is due the trade effect of biofuel mandates. In the full effect experiment the US and EU
cropland areas are going up only by 1.2 and 2.5 million hectares respectively, as shown in the
last panel of Table 1.
The results of the full effect experiment suggest that biofuel mandates have no significant
impact on the US and EU livestock prices and outputs. However, they improve the livestock
trade balances of these two regions. The biofuel mandates improve the US agricultural trade
balance but deteriorate it for the EU region (see the last panel of Table 1).

18
7.2 Global implications of the US and EU biofuel mandates
So far we were focused on the consequences of the US and EU biofuel mandates for the
economies of these two regions alone. We now analyze the global implications of these
mandates using the results obtained from the final (full effect) experiment. Here, we analyze
impacts on production, consumption, and trade of those commodities which are keys in
understanding the consequences of mandates for livestock industry (Appendix A provides
greater detail on these impacts). We also provide some simulation results which measure impacts
of the mandates on the cost and production structures of livestock industries. The global land use
implications of mandates will be discussed as well. In some illustrations we divide the whole
world into four regions: Biofuel producing regions including US, EU, and Brazil and Non-
biofuel producing region (including all other regions and counties which do not produce
biofuels) to summarize the results.
Impacts on outputs
Biofuel mandates are expected to sharply increase production of coarse grains in the US
(by $2.5 billion, or about 11.2%), sugarcane in Brazil (by $0.5 billion or 13.6%) and oilseeds in
EU (by $2.4 billion, or 42.8%), all at constant prices and measured relative to our baseline 2006
benchmark. On the other hand, the mandates significantly depress production of some other
crops in these biofuel producing countries as cropland is diverted to biofuel feedstocks. For
example, mandates are estimated to reduce production of other agricultural commodities in US
(by $1.8 billion, or about -2.8%), Brazil (by $0.4 billion, or -4%), and EU (by $3.6 billion, -
3.2%). This indicates that biofuel mandates alter the production pattern of agricultural
commodities within biofuel producing regions. The biofuel mandates induce changes in crop
production in many non-biofuel countries as well. For example, the US and EU mandates are

19
expected to increase production of oilseeds in the non-biofuel region by $3 billion (or 6.3%). In
general, mandates serve to boost production of agricultural commodities in non-biofuel regions
by about $7.3 billion (Appendix A, Table A1).
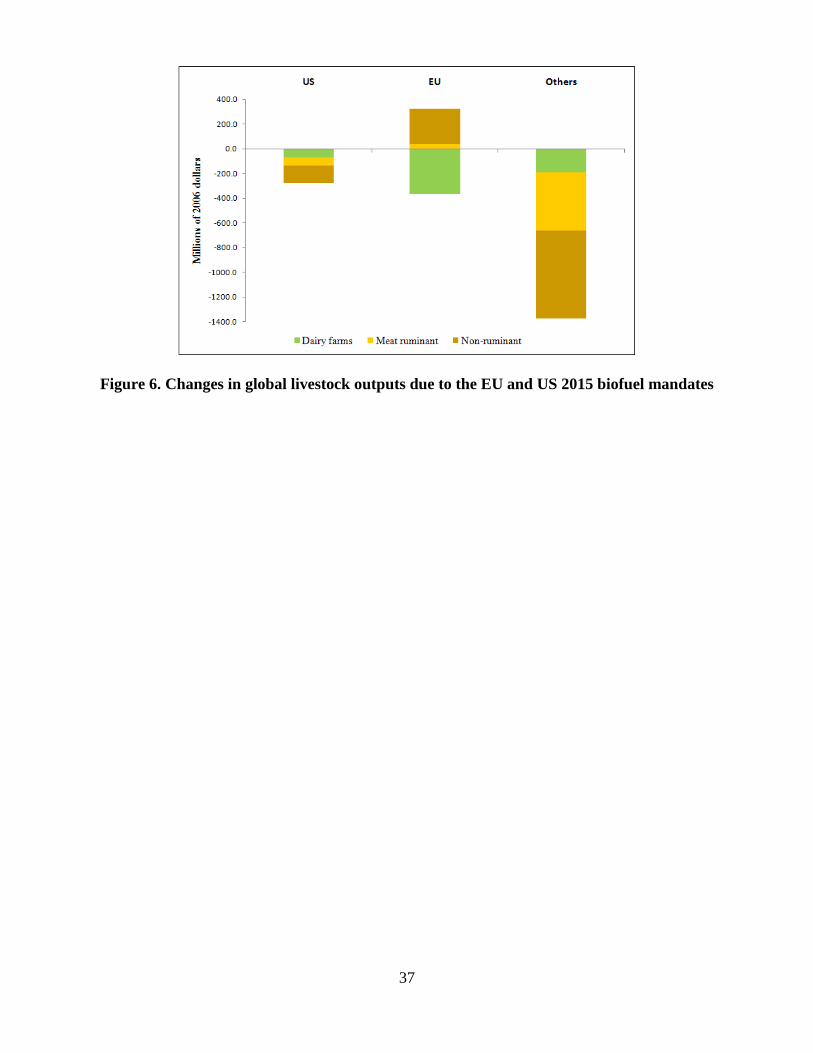
While mandates boost production of crop commodities globally, they serve to reduce the
global production of livestock and processed livestock products. The overall global volume of
livestock and processing livestock industries is expected to fall by about $3.7 billion. About
61.7% of this reduction will take place within non-biofuel producing regions. The US will
observe a minor reduction ($0.9 billion) in its livestock and processed livestock products, while
the EU will experience a negligible increase. In general, the livestock industries of the US and
EU do not suffer significantly from biofuel mandates, because they make use of the biofuel
byproducts to eliminate the cost consequences of higher crop prices. While, the livestock
industries of other regions (including Brazil) do not use the biofuel byproducts and therefore the
US and EU biofuel mandates curb their outputs. Figure 6 shows impacts of biofuel mandates on
the outputs (in $US millions at constant prices) of dairy farms, meat ruminant, and non-ruminant
activities by region. As shown in this figure the outputs of these industries fall in all regions
except for the EU. The outputs of the meat ruminant and non-ruminant activities of the EU
slightly grow due to biofuel mandates. At the global level the non-ruminant sector will
experience the greatest output volume reduction among all livestock sectors.
Biofuel mandates are also expected to increase productions of oilseed meals in EU by
$2.9 billion or 76.6% and of DDGS in US by $2.1 or 181.8%. Later on in this paper, we will
show that these sharp increases in byproducts induce major changes in feed rations.
Impacts on livestock inputs prices

20
The biofuel mandates significantly increase the price of cropland all across the world, and
in particular in US, EU and Brazil. This raises the price of pastureland everywhere as well. For
example, the results of the full effect experiment indicate that the biofuel mandates increase the
price of US and EU pasturelands by 16.7% and 28.8%. At the same time the livestock producers
must pay higher prices for crops in particular for coarse grains and oilseed. For example, the
prices of coarse grains and oilseeds go up by 12.6% and 19.1% in the US and EU, respectively,
as a result of the 2015 mandates (see appendix A, Table A2). On the other hand, massive biofuel
production drastically increases outputs of all types of processed feeds (including DDGS and
meals). This reduces the prices of these feed materials either in absolute term or relative to the
crop prices. For example, the price of oilseed meal in the US and EU and some other regions
significantly falls (see appendix A, Table A2). While in the US the price of DDGS increases less
than the price of coarse grain, 4% for DDGS versus 12.6% for coarse grains. For this reason, as
noted earlier in this paper, the livestock industries of the US and EU are able to escape the
adverse price impacts of the biofuel mandates. However, the livestock industries of other regions
which have limited or no access to low cost by-products will suffer from biofuel mandates.
Indeed, biofuel mandates put the livestock industries of the US and EU in a better relative
position in the world market.
Impacts on household demands
Here we consider impacts of biofuel mandates on household demands for major food
items such as processed dairy products, processed ruminant products, processed non-ruminant
products, edible oil, beverage-tobacco-sugar, processed rice, and other food products. In general,
biofuel mandates are expected to reduce household demands for items mentioned above across
the world (Appendix A, Table A3). However, magnitudes of reductions are not identical across

21
the world. The magnitudes of reductions in demands for food items mentioned above in the US
and EU are much higher compared to other regions. The overall reductions in food demands in
these two regions are about $1.9 and $2.6 billion at 2006 constant prices, respectively. The
overall reduction in the world demand for food products is about $7.2 billion of which 23.4% is
related to reduction in demands for processed livestock products. The overall reduction in
household demand for edible oil is about $1.8 billion (see Appendix A, Table A3).
While magnitudes of reductions in demands for food items mentioned above are
relatively high, in particular in US and EU, their percentage changes are usually small and less
than 1% across the world, except for the edible oil. Among food items, the highest rate of
reduction in household demand is related to edible oil all cross the world.
Impacts on trade
The biofuel mandates alter global trade pattern for crops, crude and refined vegetable
oils, livestock, and processed livestock products. We analyze changes in the trade balances of
these commodities evaluated at constant 2006 FOB prices for US, EU, Brazil, and non-biofuel
regions. In general, while mandates serve to reduce trade balances of US, EU, and Brazil by
$1,132.6, $572.3, and $107.5 million, they improve the combined trade balances of other regions
by $1,812.8 million (Appendix A, Table 4).
The EU members need to import significant amounts of these commodities to satisfy
their biofuel goals. The biofuel mandates increase the EU agricultural trade deficits by about
$6,606 million. On the other hand, biofuel mandates put their livestock and processed livestock
industries in a better position compared to other regions. The mandates increase the EU trade
balances of livestock and processed livestock products by $207.1 and $558.6 million,
respectively. The US and EU biofuel mandates improve the US trade balances for livestock (by

22
$18.4 million), processed livestock (by $90.4 million), and animal feed products (by $548.4
million), while they impose trade deficits on other commodities and services. The non-biofuel
producing regions are expected to get benefits from an increase in their trade balance for
agricultural products ($5517.8 million), while they suffer from increases in their trade deficits for
commodities and services. (Appendix A, Table 4).
Impacts on composite of animal feeds
The numerical results of the full effect experiments indicate that mandates mainly alter
the composition of animal feeds in the US and EU with marginal changes in other regions. These
numerical results also show that the processed feed industry also changes the composition of its
inputs to use more byproducts rather than crops. In what follows we illustrate the overall changes
in the composition of animal feeds (including changes in the composition of the processed
feedstuffs) used by the livestock industries of the US and EU. We calculate changes in cost
shares at constant prices and therefore they only reflect changes in feed intensity.
The mandates will significantly reduce the cost share of coarse grains in feed rations in
the US and EU and raise shares of DDGS and oilseed meals across all livestock industries (see
panels A, B, and C of Figures 7). The ruminant meats industry benefits more from the expansion
of DDGS than other livestock activities. The cost share of DDGS in the feed composition of
ruminant meats in the US is projected to increase from 4.8% to 12.5% due to mandates (Figure 7
panel B). The corresponding numbers for the dairy farms industry are 3.8% and 10.3% (Figure 7
panel A) and for the non-ruminant industry are 1% and 3% (Figure 7 panel C). This ability to
absorb biofuel byproducts cushions the decline in ruminant and dairy farm outputs in the US,
which fall by less than half of the amount of non-ruminants ($72.7 million and $62.9 million
versus $144.8 million, see Appendix A, Table A2).

23
One can see a similar pattern of byproduct use in the EU. In this region the share of
DDGS in the feed composite of ruminant meats industry increases from 1.4% to 7.4% (Figure 7
panel B) due to mandates. The corresponding numbers for the dairy sector are 1.1% and 4.7%
(Figure 7 panel A) and for the non-ruminant sector are 0.3% and 0.9% in the EU region (Figure 7
panel C). However, this does not translate into lesser output reductions in ruminants in the EU,
since the main biofuel product in the EU is biodiesel. Increased production of biodiesel results in
a reduction in oilseed meals prices and causes a strong increase in the feed intensity of this input
in the EU across all the livestock industries, including non-ruminants. On the other hand,
mandates reduce the use of other grains (mainly wheat) used in the EU livestock industry.
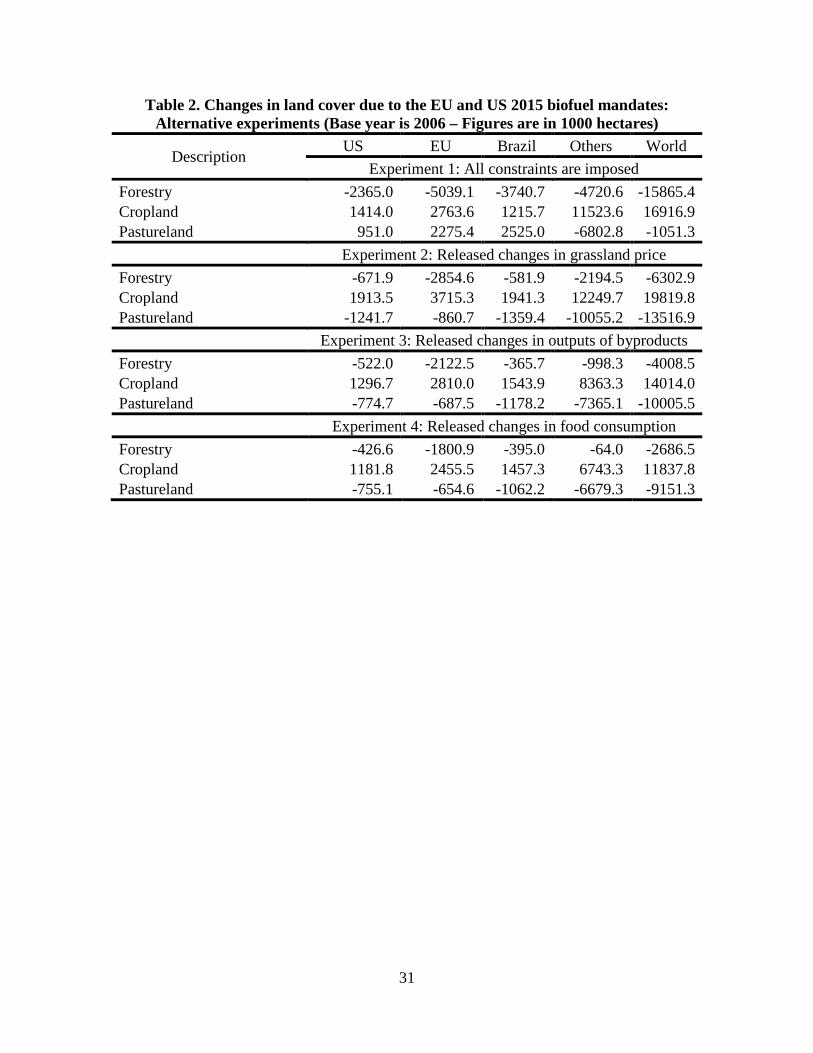
Land cover implications
Finally, we investigate the consequences of biofuel mandates for land cover across the world. In
analyzing land cover we use the results of the restricted and full effect experiments. Table 2
summarizes changes in the areas of croplands, forests, and pasturelands for the biofuel and non-
biofuel regions. Under the assumptions of the first experiment the biofuel mandates converts
about 16.9 million hectares of land, manly forests, to crop production. In the second experiment
where we allow competition between the livestock and biofuels industries in land market, the
size of global cropland increases by 19.8 million hectares (about 31.8% forest and 68.2%
pastureland). This is happening because pasturelands are less productive compare to forests. In
the third experiment, when we introduce biofuel byproducts into the model, the area of the global
cropland increases only by 14 million hectares (about 28.6% forest and 71.4% pastureland).
The difference between the areas of croplands obtained from the second and the third
experiments (5.8 million hectares) measures the contribution of byproducts in reducing the land
use impacts of biofuels. Finally, in the full effect experiment, when we allow changes in food

24
consumption in repose to the higher prices of crops, the size of land conversion falls to 11.8
million hectares (22.7% forest and 77.3% pastureland). The difference between the areas of
global croplands of the third and the full effect experiment (2.2 million hectares) shows savings
in land conversion due to reduction in food consumption. As shown in the last panel of Table 2,
about 5.1 million hectares of the new croplands are in the biofuel regions (US, EU, and Brazil)
and the rest (6.7 million hectares) is in other regions.
8. Conclusion
In this paper, we offer a general equilibrium analysis of the impacts of US and EU
biofuel mandates for the global livestock sector. Our experiments boost biofuel production in the
US and EU from 2006 levels to mandated 2015 levels. We developed several experiments to
decompose links between biofuel, livestock, crop, food, and feed industries and investigates
competition between them for land. We show that mandates will encourage crop production in
both biofuel and non biofuel producing regions, while reducing livestock and processed livestock
production in most regions of the world. The non-ruminant industry curtails its production more
than other livestock industries because it is less able to take advantage of biofuel byproducts.
An important finding of this study pertains to the relative impact of US and EU biofuel
programs on the livestock sectors in those regions, versus the rest of the world. Due to the
relatively undeveloped international trade in biofuel by-products, we estimate that the US-EU
mandates will result in larger absolute reductions in livestock production overseas, as opposed to
in the biofuel producing regions themselves. This is due to the relatively greater transmission of
grains prices into the overseas markets, as compared to the transmission of byproduct prices. Of
course, this result could change in the future with greater international integration of byproduct
markets.

25
The numerical results suggest that the biofuel mandates reduce food production in most
regions while they increase crude vegetable oil in almost all regions. Implementing biofuel
mandates in the US and EU will increase croplands within the biofuel and non-biofuel producer
regions. A large portion of this increase will be obtained from reduced grazing lands. The biofuel
producing regions are expected to reduce their coarse grains exports and raise imports of oilseeds
and vegetable oils. While all livestock industries use more biofuel byproducts in their animal
feed rations, the dairy and other ruminant industry benefit most from the expansion of DDGS.
We conclude that, while biofuel mandates have important consequences for the livestock
industry, they do not harshly curtail these industries. This is largely due to the important role of
byproducts in substituting for higher priced feedstuffs.

26
Acknowledgements
The research reported in this paper was partially supported by funding from the U.S.
Department of Energy, Argonne National Laboratory, and Food and Agricultural
Organization of the United Nations.

27
References
Anderson J.L., Schingoethe, D.J., Kalscheur, K.F., Hippen, A.R., 2006. Evaluation of Dried and Wet Distillers Grains Included at Two Concentrations in the Diets of Lactating Dairy Cows. J. of Dairy Sci. 89, 3133–3142.
Arora, S., Wu, M., Wand, M., 2008. Updated of Distiller Grains Displacement Rations for Corn Ethanol Life-Cycle Analysis. Center for Transportation Research, Energy System Division, Argonne National Laboratory.
Banse, M., van Meijl, H., Tabeau, A., Woltjer, G., 2007. Impact of EU Biofuel Policies on World Agricultural and Food Markets. Presented at the 10th Annual Conference on Global Economic Analysis, Purdue University.
Birur, D., Hertel, T., Tyner, W., 2007. Impact of Biofuel Production on World Agricultural Markets: A Computable General Equilibrium Analysis. GTAP Working Paper No 53, Center for Global Trade Analysis, Purdue University.
Bregendahl, K., 2008. Use of Distillers Co-products in Diets Fed to Poultry, Chapter 5 in Using Distillers Grains in the U.S. and International Livestock and Poultry Industries. B.A. Babcock, D.J. Hayes, J.D. (Eds.) Lawrence, Midwest Agribusiness Trade Research and Information Center.
Cooper, G., 2005. An Update on Foreign and Domestic Dry-Grind Ethanol Co-products Markets. National Corn Growers Association.
Daley, E., 2007. Impacts of ethanol on the cattle feeding industry. Thesis for master degree, Texas A&M University.
Dhuyvetter, K.C., Kastens, T.L., Boland, M., 2005. The U.S. Ethanol Industry: Where will it be located in the future? Agricultural Issues Center, University of California.
Dimaranan, B.V., 2006. Global Trade, Assistance, and Production: The GTAP 6 Data Base, Center for Global Trade Analysis, Purdue University.
Dixon, P., Osborne, S., Rimmer, M., 2007. The Economy-Wide Effects in the United States of Replacing Crude Petroleum with Biomass. Presented at the 10th Annual Conference on Global Economic Analysis, Purdue University.
Elobeid, A., Tokgoz, S., Hayes, D.J,. Babcock, B.A., Hart, C.E., 2006. The Long-Run Impact of Corn-Based Ethanol on the Grain, Oilseed, and Livestock Sectors: A Preliminary Assessment. Briefing Paper 06-BP 49, Center for Agricultural and Rural Development, Iowa State University.
Fabiosa, J.F., 2009. Land-Use Credits to Corn Ethanol: Accounting for Distillers Dried Grains with Solubles as a Feed Substitute in Swine Rations. Working paper 09-WP 489, Center for Agricultural and Rural Development , Iowa State University.
Food and Agricultural Policy Research Institute (FAPRI), 2002. World Agricultural Outlook, Iowa State University and the University of Missouri-Columbia.
Fox, N.D., 2008. The Value of Distillers Dried Grains in Large International Markets. Chapter 6 in Using Distillers Grains in the U.S. and International Livestock and Poultry Industries. B.A.

28
Babcock, Hayes, D.J., Lawrence, J.D. (Eds.), Midwest Agribusiness Trade Research and Information Center.
Hertel, T.W., 1997. Global Trade Analysis, Modeling and Applications. Cambridge University Press, Cambridge.
Hertel, T., Tyner W., Birur, D., 2010. The Global Impacts of Biofuels Mandates. The Energy Journal (forthcoming).
Keeney, R., Hertel, T., 2005. GTAP-AGR: A Framework for Assessing the Implications of Multilateral Changes in Agricultural Policies. GTAP Technical Paper No. 24, Center for Global Trade Analysis, Purdue University.
Klopfenstein, T.J., Erickson, G.E., Bremer, V.R., 2008a. BOARD-INVITED REVIEW: Use of Distillers By-Products in the Beef Cattle Feeding Industry. J. of Animal Sci. 86, 1223-1231.
Klopfenstein,T.J., Erickson, G.E., Bremer, V.R., 2008b. Use of Distillers Co-products in Diets Fed to Beef Cattle. Chapter 2 in Using Distillers Grains in the U.S. and International Livestock and Poultry Industries. B.A. Babcock, Hayes, D.J., Lawrence J.D. (Eds.), Midwest Agribusiness Trade Research and Information Center.
Paulson, N.D., 2008. International Demand for U.S. Distillers Dried Grains with Solubles: Small Markets. Chapter 7 in Using Distillers Grains in the U.S. and International Livestock and Poultry Industries. B. A. Babcock, Hayes, D. J., Lawrence, J. D. (Eds.), Midwest Agribusiness Trade Research and Information Center.
Reilly, J., Paltsev, S., 2007. Biomass Energy and Competition for Land. Presented at the 10th Annual Conference on Global Economic Analysis, Purdue University.
Schingoethe, D.J., 2008. Use of Distillers Co-products in Diets Fed to Dairy Cattle. Chapter 3 in Using Distillers Grains in the U.S. and International Livestock and Poultry Industries. B. A. Babcock, Hayes, D. J., Lawrence, J. D. (Eds.), Midwest Agribusiness Trade Research and Information Center.
Searchinger, T., Heimlich, R., Houghton, R., Dong, F., Elobeid, A., Fabiosa, J., Tokgoz, S., Hayes, D., Yu, T., 2008. Use of U.S. croplands for biofuels increases greenhouse gases through emissions from land use change. Science 319:1238–1240.
Shurson, G., Spiehs, M., 2002. Feeding Recommendations and Example Diets Containing Minnesota-South Dakota Produced DDGS for Swine. Dept. of Animal Science, University of Minnesota.
Stein, H.H., 2008. Use of Distillers Co-products in Diets Fed to Swine. Chapter 4 in Using Distillers Grains in the U.S. and International Livestock and Poultry Industries. B. A. Babcock, Hayes, D. J., Lawrence, J. D. (Eds.), Midwest Agribusiness Trade Research and Information Center.
Taheripour, F., Birur, D.K., Hertel, T.W., Tyner, W.E., 2007. Introducing Liquid Biofuel into the GTAP Database. GTAP Research Memorandum No. 11. Center for Global Trade Analysis, Purdue University.
Taheripour, F., Hertel, T.W., Tyner, W.E., 2009. Biofuels and their By-Products: Global Economic and Environmental Implications. Biomass and Bioenergy (forthcoming).

29
Tokgoz, S., Elobeid, A., Fabiosa, J., Hayes, D.J., Babcock, B.A., Yu, T., Dong, F., Hart, C.E., Beghin, J.C., 2007. Emerging Biofuels: Outlook of Effects on U.S. Grain, Oilseed, and Livestock Markets. Staff Report 07-SR 101, Center for Agricultural and Rural Development, Iowa State University.
Whitney, M.H., Shurson, G.C., Johnston, L.J., Wulf, D.M., Shanks, B.C., 2006. Growth Performance and Carcass Characteristics of Grower-Finisher Pigs Fed High-Quality Corn Distillers Dried Grain with Solubles Originating from a Modern Midwestern Ethanol Plant. J. of Animal Sci. 84, 3356–3363.

30
Table 1. Moving to biofuel economies: Impacts of the EU and US 2015 biofuel mandates on their economies - alternative experiments
Description % Change in
Prices % Changes in Outputs
Changes in Harvested Area (1000 Hectare)
Changes in Trade Balance ($ Million)*
USA EU27 USA EU27 USA EU27 USA EU27 Experiment 1: All constraints are imposed
Wheat -0.2 6.0 -5.5 -1.7 -1715 -586 -406 -1292 Coarse grains 12.3 4.8 15.1 -2.7 3941 -1024 -448 -104 Oilseeds 10.7 25.5 9.3 38.9 1517 4928 392 -4911 Dairy farms -6.3 -7.2 -0.1 0.4
951 2275 29 -483
Ruminant -6.8 -7.6 0.0 0.3 -33 296 Non-ruminant -4.8 -5.5 -0.8 -0.4 -649 -407 Change in cropland 1414 2764
Experiment 2: Released changes in grassland price Wheat 10.0 16.3 -5.4 -1.1 -1594 -309 -87 -1302 Coarse grains 23.7 14.9 15.4 -2.3 4163 -752 68 -85 Oilseeds 21.5 36.5 9.0 39.6 1523 5097 994 -5662 Dairy farms 5.8 6.5 -0.1 -0.1
-1242 -861 -4 -262
Ruminant 5.6 6.0 -0.4 -0.4 -250 -142 Non-ruminant 5.6 4.7 -0.8 -0.3 -255 -346 Change in cropland 1914 3715
Experiment 3: Released changes in outputs of byproducts Wheat 5.6 9.7 -4.4 -0.5 -1249 -154 -23 -790 Coarse grains 13.9 8.4 11.1 -2.9 3004 -917 137 -93 Oilseeds 12.7 22.6 6.5 33.4 1102 4294 1045 -3617 Dairy farms 0.9 2.2 0.0 -0.5
-775 -688 22 -95
Ruminant 1.2 1.1 0.1 0.3 128 172 Non-ruminant 0.8 -1.3 -0.1 0.5 -55 397 Change in cropland 1297 2810
Experiment 4: Released changes in food consumption Wheat 4.7 7.9 -3.8 0.2 -1125 71 -5 -627 Coarse grains 12.6 6.5 11.2 -2.7 3079 -790 99 -72 Oilseeds 11.2 19.1 6.4 32.6 1099 4226 1025 -3448 Dairy farms 0.6 1.3 -0.3 -0.8
-755 -655 14 32
Ruminant 0.8 0.3 -0.2 0.1 135 195 Non-ruminant 0.7 -1.9 -0.4 0.5 -40 539 Change in cropland 1182 2455
* Including livestock and processed livestock industries
31
Table 2. Changes in land cover due to the EU and US 2015 biofuel mandates: Alternative experiments (Base year is 2006 – Figures are in 1000 hectares)
Description US EU Brazil Others World
Experiment 1: All constraints are imposed Forestry -2365.0 -5039.1 -3740.7 -4720.6 -15865.4 Cropland 1414.0 2763.6 1215.7 11523.6 16916.9 Pastureland 951.0 2275.4 2525.0 -6802.8 -1051.3 Experiment 2: Released changes in grassland price Forestry -671.9 -2854.6 -581.9 -2194.5 -6302.9 Cropland 1913.5 3715.3 1941.3 12249.7 19819.8 Pastureland -1241.7 -860.7 -1359.4 -10055.2 -13516.9 Experiment 3: Released changes in outputs of byproducts Forestry -522.0 -2122.5 -365.7 -998.3 -4008.5 Cropland 1296.7 2810.0 1543.9 8363.3 14014.0 Pastureland -774.7 -687.5 -1178.2 -7365.1 -10005.5 Experiment 4: Released changes in food consumption Forestry -426.6 -1800.9 -395.0 -64.0 -2686.5 Cropland 1181.8 2455.5 1457.3 6743.3 11837.8 Pastureland -755.1 -654.6 -1062.2 -6679.3 -9151.3

32
Figure 1. Quantity shares of major feedstuffs in the US livestock feed

33
Figure 2. Quantity shares of major oilseed meals in the EU livestock meal

34
Figure 3. Price of rapeseed meal relative to the prices of soybean meal and wheat in the EU

35
Figure 4. Links between crop, food, feed, livestock, and biofuel industries and their
competition for land in the presence and absence of biofuel byproducts
Cropland Crop
Food
Feed
Livestock Panel 1 An economy
with no biofuels
Cropland Crop
Food
Feed
Livestock
Biofuels
Pastureland
Pastureland
Panel 4 An economy with biofuels
and their byproducts
with changes in final demand
Pastureland
Cropland
Livestock
Feed
Food
Byproducts
Crop
Domestic Demand
Net Foreign Demand
Production and intermediate demands Final demands
Forestland
Forestland
Forestland
Pastureland
Cropland
Forestland
Crop
Livestock
Feed
Food
Byproducts
Panel 2 An economy with
biofuels but no byproducts
Biofuels
Panel 3 An economy with biofuels and their
byproducts
Biofuels

36
Figure 5. Structure of nested demand for feed in livestock industry
Oilseed
Meals
Oilseed-Meal Other Grains
Other Agricultur
DDGS-Coarse Grains Sugar Crops
CROPS
Feed Composite
……
Livestock
Intermediate inputs from livestock and processed livestock Coarse Grains DDGS
Processed Feed Energy-Protein
37
Figure 6. Changes in global livestock outputs due to the EU and US 2015 biofuel mandates

38
Figure 7. Shares of coarse grains, DDGs, and oilseeds meals in total costs of animal feed rations without and with the EU and US 2015 biofuel mandates (figures represent cost
shares calculated at constant 2006 prices)
39
Appendix A Key numerical results obtained from the full effect experiment

40
Table A1. Changes in the outputs of agricultural and livestock industries due to the EU and US 2015 biofuel mandates: $ million at constant 2006 prices
Description USA UE27 Brazil Others World Volume changes: Paddy rice -36.9 -4.8 -20.7 -63.8 -127.5 Wheat -243.2 31.2 -10.5 809.7 581.3 Coarse grains 2500.7 -493.7 -45.2 459.2 2487.9 Oilseeds 825.5 2441.0 824.8 2957.4 7126.1 Sugar crops -7.6 13.0 459.3 18.3 498.1 Other crops -1812.5 -3639.8 -411.7 3104.8 -2843.8 Total crops 1226.0 -1653.0 796.0 7327.2 7895.1 Dairy farms -72.7 -365.6 4.0 -192.9 -626.8 Meat ruminant -62.9 40.0 -109.8 -360.2 -494.6 Non-ruminant -144.8 284.4 -102.0 -611.4 -578.7 Processed dairy -217.3 -421.5 -22.8 -211.9 -873.6 Processed meat ruminant -136.4 69.4 -177.7 -398.5 -645.1 Processed non-ruminant -220.8 481.5 -218.2 -493.8 -455.7 Total ruminant -854.9 88.2 -626.6 -2268.4 -3676.0 Percentage changes: Paddy rice -4.2 -0.5 -1.8 -0.1 -0.1 Wheat -3.8 0.2 -4.4 1.1 0.6 Coarse grains 11.2 -2.7 -1.9 0.7 2.4 Oilseeds 6.4 32.6 13.0 6.3 9.7 Sugar crops -0.3 0.3 13.6 0.1 1.4 Other crops -2.8 -3.2 -4.0 0.6 -0.4 Dairy farms -0.3 -0.8 0.1 -0.2 -0.4 Meat ruminant -0.2 0.1 -2.0 -0.4 -0.3 Non-ruminant -0.4 0.5 -1.9 -0.3 -0.2 Processed dairy -0.3 -0.4 -0.3 -0.2 -0.3 Processed meat ruminant -0.2 0.1 -1.9 -0.4 -0.3 Processed non-ruminant -0.3 0.4 -4.7 -0.4 -0.1

41
Table A2. Percentage changes in the prices of major feedstuffs and pastureland due to the EU and US 2015 biofuel mandates (Base year is 2006)
Regions Coarse Grains Oilseeds Processed
Feed Oilseed Meal DDGS* Pastureland
USA 12.6 11.2 -3.5 -23.4 4.1 16.7 EU27 6.5 19.1 -4.8 -75.3 -4.7 28.8 BRAZIL 6.4 10.8 5.7 7.5 NP 21.9 CAN 3.4 7.0 0.0 -9.4 NP 11.0 JAPAN 2.2 2.2 1.6 -2.1 NP 4.2 CHIHKG 1.5 3.8 1.9 7.6 NP 3.1 INDIA 2.1 3.9 2.1 1.0 NP 2.4 C_C_Amer 3.8 7.2 3.6 0.0 NP 6.0 S_o_Amer 4.4 9.8 3.2 4.7 NP 8.2 E_Asia 2.1 4.2 3.6 4.9 NP -0.7 Mala_Indo 3.4 18.6 1.1 -21.9 NP 4.1 R_SE_Asia 2.4 6.4 0.1 -24.2 NP 3.0 R_S_Asia 1.6 2.9 1.9 2.5 NP 2.2 Russia 2.1 8.3 1.1 3.9 NP 4.8 Oth_CEE_CIS 1.3 3.9 1.2 1.9 NP 9.9 Oth_Europe 3.3 7.9 0.6 -5.2 NP 7.0 MEAS_NAfr 2.2 4.7 3.1 1.9 NP 9.1 S_S_AFR 2.3 6.2 -1.0 -33.2 NP 9.1 Oceania 4.6 8.2 1.2 -4.7 NP 7.5
* Regions with NP either do not producer DDGS or produce only negligible amounts.

42
Table A3. Changes in the household demands for food product items due to the EU and US 2015 biofuel mandates (Base year is 2006 - volumes are in $US million at constant prices)
Regions Processed Dairy
Processed Ruminant
Processed Non-
Ruminant
Edible Vegetable
Oil
Tobacco, Beverage, and Sugar
Processed Rice
Other Processed
Food Volume changes: USA -139.5 -149.7 -132.6 -142.7 -484.5 -2.2 -891.6 EU27 -354.9 -181.8 -55.9 -484.8 -587.3 -6.8 -963.7 BRAZIL -6.9 -16.1 -2.8 -18.5 -28.3 -4.3 -22.7 CAN -15.9 -16.7 -7.7 -17.6 -16.6 -0.1 -33.7 JAPAN -25.1 -42.1 -16.2 -18.9 -86.4 -17.3 -214.2 CHIHKG -1.3 -3.3 -33.7 -2.6 -105.8 -36.2 -125.3 INDIA -6.1 -0.1 -0.2 -16.0 -15.0 -16.1 -11.1 C_C_Amer -20.2 -32.9 -43.8 -20.1 -72.2 -4.0 -122.2 S_o_Amer -22.4 -29.4 -12.1 -13.9 -31.0 -4.0 -53.2 E_Asia -8.3 -14.5 -26.0 -9.4 -19.6 -17.0 -69.2 Mala_Indo -1.2 -1.9 -1.6 -7.5 -13.7 -18.3 -15.1 R_SE_Asia -1.2 -0.7 -0.7 -4.0 -10.4 -15.5 -13.0 R_S_Asia -1.8 -0.8 -2.7 -7.1 -4.7 -11.8 -5.4 Russia -12.7 -11.3 -29.4 -8.2 -25.5 -1.1 -38.6 Oth_CEE_CIS -8.0 -2.8 -3.8 -4.8 -18.8 -1.7 -12.8 Oth_Europe -11.4 -7.3 -5.9 -7.6 -25.0 -0.1 -22.2 MEAS_NAfr -42.1 -42.0 -59.5 -27.4 -106.5 -21.4 -143.8 S_S_AFR -3.4 -7.3 -4.2 -11.5 -37.3 -11.1 -33.4 Oceania -3.6 -1.6 -0.8 -2.7 -10.0 -0.2 -7.2 Percentage changes: USA -0.3 -0.4 -0.3 -7.2 -0.4 -0.2 -0.5 EU27 -0.4 -0.3 -0.1 -1.9 -0.5 -0.3 -0.5 BRAZIL -0.1 -0.2 -0.1 -0.8 -0.4 -0.3 -0.1 CAN -0.3 -0.5 -0.2 -1.8 -0.2 -0.1 -0.2 JAPAN -0.2 -0.4 -0.2 -1.3 -0.1 -0.1 -0.2 CHIHKG -0.2 -0.4 -0.3 -0.1 -0.3 -0.2 -0.3 INDIA -0.1 0.0 -0.1 -0.3 -0.1 -0.1 -0.2 C_C_Amer -0.2 -0.2 -0.2 -1.2 -0.3 -0.4 -0.3 S_o_Amer -0.2 -0.3 -0.2 -0.4 -0.1 -0.3 -0.2 E_Asia -0.2 -0.4 -0.4 -1.2 -0.1 -0.3 -0.4 Mala_Indo -0.2 -0.2 -0.1 -0.5 -0.2 -0.3 -0.2 R_SE_Asia -0.1 -0.1 0.0 -0.4 -0.1 -0.2 -0.1 R_S_Asia -0.2 -0.2 -0.2 -0.4 -0.1 -0.1 -0.1 Russia -0.4 -0.4 -0.4 -0.9 -0.4 -0.4 -0.4 Oth_CEE_CIS -0.2 -0.1 -0.1 -0.4 -0.2 -0.1 -0.2 Oth_Europe -0.4 -0.4 -0.2 -2.4 -0.3 -0.1 -0.3 MEAS_NAfr -0.6 -0.6 -0.5 -1.0 -0.6 -0.5 -0.6 S_S_AFR -0.2 -0.2 -0.1 -0.6 -0.2 -0.2 -0.2 Oceania -0.1 -0.1 0.0 -0.4 -0.1 -0.1 -0.1

43
Table A4. Changes in trade balances due to the EU and US 2015 biofuel mandates (Base year is 2006 – Figures are in $US million at constant 2006 fob prices)
Description USA EU27 Brazil Others World Crops and other agriculture products -235.3 -6606.0 1127.7 5517.8 -195.7 Livestock 18.4 207.1 -9.8 -206.5 9.1 Processed livestock 90.4 558.6 -310.5 -315.6 22.8 All food products -625.9 -71.3 -181.2 929.2 50.8 Animal feeds (other than crops) 548.4 104.7 -122.5 -520.5 10.2 Other goods and services -928.5 5234.5 -611.4 -3694.5 0.0 Total -1132.6 -572.3 -107.8 1812.8 0.0

44
Appendix B Lists of Commodities, Industries, and Regions

45
Table B1. List of industries and commodities in the new model
Industry Commodity Description Name in the GTAP_BIOB
Paddy_Rice Paddy_Rice Paddy rice Pdr
Wheat Wheat Wheat Wht
CrGrains CrGrains Cereal grains Gro
Oilseeds Oilseeds Oil seeds Osd
OthAgri OthAgri Other agriculture goods ocr, pfb, v_f
Sugarcane Sugarcane Sugar cane and sugar beet c-b
DairyFarms DairyFarms Dairy Products Rmk
Ruminant Ruminant Cattle & ruminant meat production and Ctl, wol
NonRum Non-Rum Non-ruminant meat production oapl
ProcDairy ProcDairy Processed dairy products Mil
ProcRum ProcRum Processed ruminant meat production Cmt
ProcNonRum ProcNonRum Processed non-ruminant meat production Omt
Forestry Forestry Forestry Frs
Cveg_Oil Cveg_Oil Crude vegetable oil A portion of vol
VOBP Oil meals A portion of vol
Rveg_Oil Rveg_Oil Refined vegetable oil A portion of vol
Proc_Rice Proc_Rice Processed rice Pcr
Bev_Sug Bev_Sug Beverages, tobacco, and sugar b_t, sgr
Proc_Food Proc_Food Processed food products A portion of ofd
Proc_Feed Proc_Feed Processed animal feed products A portion of ofd
OthPrimSect OthPrimSect Other Primary products fsh, omn
Coal Coal Coal Coa
Oil Oil Crude Oil Oil
Gas Gas Natural gas gas, gdt
Oil_Pcts Oil_Pcts Petroleum and coal products p-c
Electricity Electricity Electricity Ely
En_Int_Ind En_Int_Ind Energy intensive Industries crpn, i_s, nfm, fmp
Oth_Ind_Se Oth_Ind_Se Other industry and services atp, cmn, cns, ele, isr, lea, lum, mvh, nmm, obs, ofi, ome, omf, otn, otp, ppp, ros, tex, trd, wap, wtp
NTrdServices BTrdServices Services generating Non-C02 Emissions wtr, osg, dwe
EthanolC Ethanol1 Ethanol produced from grains
DDGS Dried Distillers Grains with Solubles
Ethanol2 Ethanol2 Ethanol produced from sugarcane
Biodiesel Biodiesel Biodiesel produced from vegetable oil

46
Table B2. Regions and their members
Region Description Corresponding Countries in GTAP
USA United States Usa
EU27 European Union 27
aut, bel, bgr, cyp, cze, deu, dnk, esp, est, fin, fra, gbr, grc, hun, irl, ita, ltu, lux, lva, mlt, nld, pol, prt, rom, svk, svn, swe
BRAZIL Brazil Bra
CAN Canada Can
JAPAN Japan Jpn
CHIHKG China and Hong Kong chn, hkg
INDIA India Ind
C_C_Amer Central and Caribbean Americas mex, xna, xca, xfa, xcb
S_o_Amer South and Other Americas col, per, ven, xap, arg, chl, ury, xsm
E_Asia East Asia kor, twn, xea
Mala_Indo Malaysia and Indonesia ind, mys
R_SE_Asia Rest of South East Asia phl, sgp, tha, vnm, xse
R_S_Asia Rest of South Asia bgd, lka, xsa
Russia Russia Rus
Oth_CEE_CIS Other East Europe and Rest of Former Soviet Union xer, alb, hrv, xsu, tur
R_Europe Rest of European Countries che, xef
MEAS_NAfr Middle Eastern and North Africa xme,mar, tun, xnf
S_S_AFR Sub Saharan Africa Bwa, zaf, xsc, mwi, moz, tza, zmb, zwe, xsd, mdg, uga, xss
Oceania Oceania countries aus, nzl, xoc