implementing the market approach
TRANSCRIPT

7/28/2019 Implementing the Market Approach
http://slidepdf.com/reader/full/implementing-the-market-approach 1/33
IMPLEMENTING THE MARKET APPROACHTO ENTERPRISE SUPPORT
AN EVALUATION OF TEN MATCHING GRANT SCHEMES
David A. Phillips
for
Europe and Central Asia Region
Private and Financial Sectors Development Sector Unit
Delivered by The World Bank e-library to:arvin elatico
IP : 203.177.158.157Wed, 14 Oct 2009 04:29:21
(c) The International Bank for Reconstruction and Development / The World Bank

7/28/2019 Implementing the Market Approach
http://slidepdf.com/reader/full/implementing-the-market-approach 2/33
IMPLEMENTING THE MARKET APPROACH TO ENTERPRISESUPPORT: AN EVALUATION OF TEN MATCHING GRANT SCHEMES
TABLE OF CONTENTS
I. THE NEED FOR ENTERPRISE SUPPORT .............................................................................................. 1
ALTERNATIVE POLICY APPROACHES ........................................................................................................................ 1SME CONSTRAINTS AND DEVELOPMENT POLICY ...................................................................................................... 1E NTERPRISE DECLINE - THE TRANSITIONAL ECONOMIES........................................................................................... 2
II. ALTERNATIVE ENTERPRISE SUPPORT MECHANISMS AND THEIRDEVELOPMENTAL RATIONALE................................................................................................................... 3
EVOLUTION OF SUPPORT I NSTRUMENTS ................................................................................................................... 3PUBLIC GOODS, SUBSIDIES AND E NTERPRISE SUPPORT............................................................................................. 4MOVING FROM SUPPLY SIDE SUBSIDIES TO DEMAND SIDE GRANTS ........................................................................... 6
WHO GETS THE GRANTS? .......................................................................................................................................... 9SHOULD THERE BE SUBSIDIES FOR EQUIPMENT PURCHASE? ...................................................................................... 9R EDUCING I NVESTMENT COST BY U NBUNDLING EQUIPMENT LOANS..................................................................... 10I NITIAL COUNTRY CONDITIONS AND E NVIRONMENT.............................................................................................. 10
III. EXPERIENCE WITH VOUCHER PROGRAMS................................................................................ 10
CHARACTERISTICS OF VOUCHER SCHEMES ............................................................................................................ 10VOUCHER I NITIATIVES IN THE BANK ....................................................................................................................... 11
IV. IMPLEMENTING MATCHING GRANT FUNDS .............................................................................. 12
EXPERIENCE WITH MGFS ....................................................................................................................................... 12MGF IMPACT ASSESSMENT: THE ISSUE OF ADDITIONALITY.................................................................................... 13
V. A COMPARATIVE EVALUATION OF TEN MATCHING GRANT FUNDS.............................. 15THE PROJECTS SELECTED ....................................................................................................................................... 15MAIN MGF PROJECT DESIGN FEATURES ................................................................................................................ 15EVALUATION OF THE SIX COMPLETED MGF PROJECTS .......................................................................................... 17TABLE 3A COMPARATIVE COST EFFECTIVENESS OF MGF PROJECTS.................................................................... 18O NGOING MGF PROJECTS ...................................................................................................................................... 19
VI. CONCLUSIONS AND RECOMMENDATIONS.................................................................................. 21
OPTIMIZING THE DESIGN OF MGFS......................................................................................................................... 22
FIGURES
Figure 1. Real Industrial Output Trends in Transition Economies .............................................................. 2Figure 2. Stimulating the market for Business Services............................................................................... 7Figure 3. A Continuum of Enterprise Assistance Models............................................................................9Figure 4. MGF Project Approvals by Region and Time Period................................................................. 12Figure 5. Two Views of the Design of Matching Grant Funds ..................................................................14Figure 6. Financing and Technical Services: Parallel Channels of Assistance......................................... 21
Delivered by The World Bank e-library to:arvin elatico
IP : 203.177.158.157Wed, 14 Oct 2009 04:29:21
(c) The International Bank for Reconstruction and Development / The World Bank

7/28/2019 Implementing the Market Approach
http://slidepdf.com/reader/full/implementing-the-market-approach 3/33
TABLES
Table 3A. Comparative Cost Effectiveness of MGF Projects.................................................................... 18Table 3B. Comparative Cost-Effectiveness of MGF Projects....................................................................19
BOXES
Box 1. Traditional Export Promotion in Kenya ...........................................................................................4
Box 2. The Market Failure/Public Goods Rationale for Assistance withBusiness Development Services.....................................................................................................5
Box 3. Tanzania - State Support Bypassed Existing Local Capacity........................................................... 6
ANNEX Completed, Ongoing and Planned Matching Grant Schemes for
Enterprise Support................................................................................................................25
Delivered by The World Bank e-library to:arvin elatico
IP : 203.177.158.157Wed, 14 Oct 2009 04:29:21
(c) The International Bank for Reconstruction and Development / The World Bank

7/28/2019 Implementing the Market Approach
http://slidepdf.com/reader/full/implementing-the-market-approach 4/33
i
IMPLEMENTING THE MARKET APPROACH TO ENTERPRISESUPPORT: AN EVALUATION OF TEN MATCHING GRANT SCHEMES
EXECUTIVE SUMMARY
i. The development of viable new business, especially in transitional economies, is critical torecovery and long term growth. Yet in many economies the enterprise sector (especially SMEs) is faced with macroeconomic constraints, numerous regulatory and institutional hurdles, and operational bottlenecks. Enterprise support interventions try to address these problems. The menu of interventionsranges from macro-economic management through institutional and regulatory change, to firm-levelfinance, technical and management assistance. The Bank has used many types of interventions over manyyears, including enterprise-level support in rural and urban areas and at micro-, SME- and larger scale.The effectiveness of such micro-level interventions cannot be separated from the broader policy, and the broader policy cannot be successful without enterprise- level interventions. This study however focuses
on the micro level, i.e how to effectively provide enterprise development assistance.
ii. Public support to promote enterprise since the 1970s in developing countries has moved fromcentralized state development agency initiatives to decentralized market development instruments. It isnow increasingly agreed that, if it is to be economically efficient and practically effective, technicalassistance for the enterprise sector needs to be flexibly organized and demand-responsive. Whiletraditional centralized assistance may continue to be effective in some circumstances, assistance needs to be to a large extent moved out of the State or quasi-public agencies to competitive private service providers responding to the evolving needs of client enterprises, subject to service quality control.Stimulation of private service supply and upgrading its capacity to respond to the demands of new and expanding private enterprises is therefore a central task of public policy. Such concerns have been thefocus of a series of international workshops on business development services (BDS) held during 1999
and 2000 under the auspices of the Committee of Donor Agencies for Small Enterprise Development.1
iii. Public sector enterprise support has in the past been either free or heavily subsidized. But suchsubsidies can only be justified if it can be shown that the interventions efficiently supply public goods.Technical and management know-how provision is potentially likely to be a public good if it generatesexternalities - for example if its value can be increased through knowledge dissemination withoutincurring proportional additional financial cost. In such a case there may be a justification for subsidized intervention to support faster and more effective development of the market for business knowledge. In practice implicit subsidies have been provided through traditional State agency support, and to a lesser extent through the fee-for-service autonomous public agency model. While these models may continue to be valid in some cases, such interventions on the supply side have been problematic because, inter alia,they may run the risk of missing the main market needs while actually undercutting sustainable domestic
capacity and having only a weak effect on service demand. Such an outcome would be counter-developmental and would mean that, instead of providing a public good, the subsidy actually madematters worse.
1 The conferences were held in Hanoi, Rio De Janeiro and Harare. Their outcome is summarized in J. Levitsky
(ed) ‘Business Development Services; A Review of International Experience ITP 2000; implementation policy issummarized in : ‘Business Development Services for Small Enterprises: Guidelines for Donor Intervention’ – Committee of Donor Agencies for Small Enterprise Development. November 2000.
Delivered by The World Bank e-library to:arvin elatico
IP : 203.177.158.157Wed, 14 Oct 2009 04:29:21
(c) The International Bank for Reconstruction and Development / The World Bank

7/28/2019 Implementing the Market Approach
http://slidepdf.com/reader/full/implementing-the-market-approach 5/33

7/28/2019 Implementing the Market Approach
http://slidepdf.com/reader/full/implementing-the-market-approach 6/33
iii
the service-provider function focused on specific specialized services not available domestically, wasoriented to training and dissemination, and was to be phased out pari passu with the increase in domesticcapacity, according to a clear timetable and an agreed market development model.
Delivered by The World Bank e-library to:arvin elatico
IP : 203.177.158.157Wed, 14 Oct 2009 04:29:21
(c) The International Bank for Reconstruction and Development / The World Bank

7/28/2019 Implementing the Market Approach
http://slidepdf.com/reader/full/implementing-the-market-approach 7/33
1
IMPLEMENTING THE MARKET APPROACH TO ENTERPRISE SUPPORT:AN EVALUATION OF TEN MATCHING GRANT SCHEMES
I. THE NEED FOR ENTERPRISE SUPPORT
Alternative Policy Approaches
1.1 The Bank’s approach to assistance to the enterprise sector has increasingly focussed on thecompetitive and incentive environment and the institutional and regulatory framework. Interventions atthe firm level have moved away from fixed investment (e.g. through financial intermediary loans) toknowledge transfer and business support services.2 Firm-level interventions are justified if broader policyinterventions by themselves do not create conditions adequate for enterprise development, while, at thesame time, (i) private markets do not adequately provide the firm-level inputs needed and, (ii) enterprisesare able to use efficiently the public sector inputs that are provided.3
1.2 This paper is concerned with micro-interventions; it therefore makes the assumption that theabove two conditions hold, at least in a significant number of economies and in a significant number of situations. The paper is concerned with how such interventions can be made more cost effective in termsof sustainability and development impact by targeting the existing capacity within an economy to provide business services to enterprises.
SME constraints and development policy
1.3 Entrepreneurs in developing and transitional economies face a triple burden of macroeconomic,institutional/regulatory, and micro- (firm level) constraints. Many new enterprises fail as a result of theexcessive costs of entry relative to their fragile financial positions at startup, or inability to secure permits,
access finance or obtain business/ technical support, while others fail because of high costs of operation,such as the cost of servicing debt, inaccessible business information (e.g. how to export), and either burdensome state regulation (e.g. onerous tax compliance) or inadequate state regulation (e.g. weak contract enforcement). These hurdles are particularly problematic for SMEs. 4
1.4 Up to the 1960s the share of SMEs in output in OECD countries had been falling, a trend that wasseen generally as the inevitable and probably desirable consequence of the development of economies of scale. However, the start of the 1970s saw a reappraisal of their role, boosted as a result of the oil-priceled recession of the 1970s when SME entrants were considered to be playing an important role in therecovery of employment5. The re-appraisal showed that, despite the decline in share, they maintained animportant niche presence even in advanced technology sectors, and made major contributions to
2
See Kristin Hallberg “A market oriented strategy for small and medium scale enterprises” IFC Discussion Paper no 40. (Table 1).
3 This is discussed in “Post-privatization assistance; when is it justified and how can the World Bank help?” Syed Mahmood; ECSPF Occasional Paper No. 2, 1998.
4 The disadvantages faced by SMEs may be characterized as direct costs and compliance costs. Of the latter,Government planning regulations and tax administration are the most frequently cited burden. See e.g. GrahamBannock and Alan Peacock “Governments and Small Business” chapter 10. Chapman 1989.
5 The extent of the overall employment effect counting both births and deaths of small enterprises has however been debated e.g. see D. Snodgrass and T. Biggs “Industrialization and the small firm; patterns and policies”International Center for Economic Growth 1996.
Delivered by The World Bank e-library to:arvin elatico
IP : 203.177.158.157Wed, 14 Oct 2009 04:29:21
(c) The International Bank for Reconstruction and Development / The World Bank
7/28/2019 Implementing the Market Approach
http://slidepdf.com/reader/full/implementing-the-market-approach 8/33
2
0
20
40
60
80
100
120
140
1 9 8 9
1 9 9 0
1 9 9 1
1 9 9 2
1 9 9 3
1 9 9 4
1 9 9 5
1 9 9 6
1 9 9 7
1 9 9 8
Georgia
Moldova
Armenia
Russia
Kazakhstan
Ukraine
Czech Rep.
Hungary
Poland
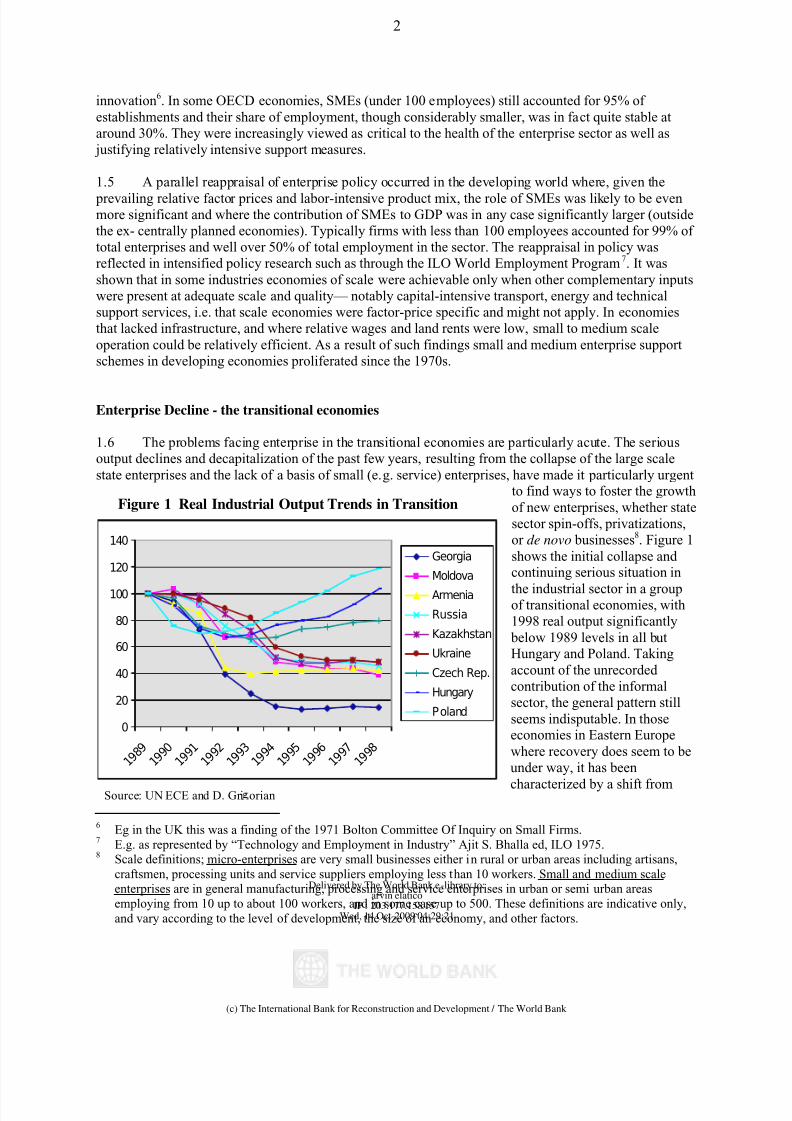
Figure 1 Real Industrial Output Trends in Transition
Source: UN ECE and D. Gri orian
innovation6. In some OECD economies, SMEs (under 100 employees) still accounted for 95% of establishments and their share of employment, though considerably smaller, was in fact quite stable ataround 30%. They were increasingly viewed as critical to the health of the enterprise sector as well as justifying relatively intensive support measures.
1.5 A parallel reappraisal of enterprise policy occurred in the developing world where, given the
prevailing relative factor prices and labor-intensive product mix, the role of SMEs was likely to be evenmore significant and where the contribution of SMEs to GDP was in any case significantly larger (outsidethe ex- centrally planned economies). Typically firms with less than 100 employees accounted for 99% of total enterprises and well over 50% of total employment in the sector. The reappraisal in policy wasreflected in intensified policy research such as through the ILO World Employment Program7. It wasshown that in some industries economies of scale were achievable only when other complementary inputswere present at adequate scale and quality— notably capital-intensive transport, energy and technicalsupport services, i.e. that scale economies were factor-price specific and might not apply. In economiesthat lacked infrastructure, and where relative wages and land rents were low, small to medium scaleoperation could be relatively efficient. As a result of such findings small and medium enterprise supportschemes in developing economies proliferated since the 1970s.
Enterprise Decline - the transitional economies
1.6 The problems facing enterprise in the transitional economies are particularly acute. The seriousoutput declines and decapitalization of the past few years, resulting from the collapse of the large scalestate enterprises and the lack of a basis of small (e.g. service) enterprises, have made it particularly urgent
to find ways to foster the growthof new enterprises, whether statesector spin-offs, privatizations,or de novo businesses8. Figure 1shows the initial collapse and continuing serious situation in
the industrial sector in a groupof transitional economies, with1998 real output significantly
below 1989 levels in all butHungary and Poland. Takingaccount of the unrecorded contribution of the informalsector, the general pattern stillseems indisputable. In thoseeconomies in Eastern Europewhere recovery does seem to beunder way, it has been
characterized by a shift from
6 Eg in the UK this was a finding of the 1971 Bolton Committee Of Inquiry on Small Firms.7 E.g. as represented by “Technology and Employment in Industry” Ajit S. Bhalla ed, ILO 1975.8 Scale definitions; micro-enterprises are very small businesses either in rural or urban areas including artisans,
craftsmen, processing units and service suppliers employing less than 10 workers. Small and medium scaleenterprises are in general manufacturing, processing and service enterprises in urban or semi urban areasemploying from 10 up to about 100 workers, and in some case up to 500. These definitions are indicative only,and vary according to the level of development, the size of an economy, and other factors.
Delivered by The World Bank e-library to:arvin elatico
IP : 203.177.158.157Wed, 14 Oct 2009 04:29:21
(c) The International Bank for Reconstruction and Development / The World Bank

7/28/2019 Implementing the Market Approach
http://slidepdf.com/reader/full/implementing-the-market-approach 9/33
3
large to smaller scale enterprises, with small enterprise shares rising steadily to over 50% of employmentsince 1992 in countries such as the Czech Republic, Hungary and Lithuania, whereas in the late-recoveryCIS economies (Russia, Ukraine, Kazakhstan) recorded small enterprise shares of sector employmentremain below 25%.
1.7 While the relative efficiency of small scale versus large scale production is not clear in all
conditions9, it is however likely that in appropriate factor price/ endowment conditions small scale production can be economic in many product areas, and in some sub-sectors small firms have been themost innovative, and dynamic. But leaving aside the efficiency arguments the existence of large proportions of the labor force in this sector in market economies means that the sector's development hasto be a central focus of economic policy for the transition economies and the current relative stagnation isa major problem.
II. ALTERNATIVE ENTERPRISE SUPPORT MECHANISMS AND THEIRDEVELOPMENTAL RATIONALE
Evolution of Support Instruments
2.1 SME assistance has been at three main levels – the macroeconomic, the ‘meso-economic’ (marketinstitutional, regulatory), and the micro (firm) level. As stated at the start of this paper, our concern iswith trying to identify cost-effective interventions at the level of inputs to firms.
2.2 Development policy in general until the 1970s tended to assume that Governments generallyacted in the public interest, to enhance welfare through eliminating market failures and throughredistribution of resources. Accordingly, the design of technical support for enterprise in general and SMEs in particular, in the Bank and outside, tended to be located centrally within the Government bureaucracy. Increasingly however, it was found that Government failure may be as or more importantthan market failure. For example, whether in the area of exports assistance through official trade
promotion agencies, or in the area of small business support through centralized Government enterprisedepartments, the experience of support to business was unsatisfactory 10. In the case of enterprise exportsupport, the use of public sector service suppliers is considered to have failed 11 in all but a few cases (e.g.in East Asia12). Even given an appropriate policy environment, experience suggests that State institutionsare only likely to be effective as long as they enjoy the support and participation of the businesscommunity, are well funded, have staff experienced in relevant technical areas, and have a significantdegree of autonomy from bureaucracy and political interference. These conditions have generally not been met. 13 The conclusions of one Bank study of the issues were that interventions should (a) support,
9 See Kristin Hallberg IFC Discussion Paper No 40, 1999; op cit.10 e.g. see “World Bank Lending for Small Enterprises 1989-93” L. Webster, R. Riopelle, and A. Chidzero World
Bank Technical Paper no. 311 (1996).11
Keesing and Singer for example reviewed 27 Bank enterprise development and export support projects approved between 1980 and 1990. With few exceptions (eg the Philippines Design Center) they found that staff themselves considered the results unsatisfactory both in terms of export achievement and institution building.See “Expanding manufactured exports through support services” Don B. Keesing and Andrew Singer, World Bank 1990.
12 E.g. in Hong Kong, Taiwan and Singapore. However in these cases State agencies were also helped byexceptionally strong export environments and a dynamic private sector, and attributability of State support isdifficult to assess.
13 Keesing and Singer strongly advocated a change in approach. See e.g. “Development assistance gone wrong:failures in services to promote and support manufactured Exports” World Bank, 1990.
Delivered by The World Bank e-library to:arvin elatico
IP : 203.177.158.157Wed, 14 Oct 2009 04:29:21
(c) The International Bank for Reconstruction and Development / The World Bank
7/28/2019 Implementing the Market Approach
http://slidepdf.com/reader/full/implementing-the-market-approach 10/33

7/28/2019 Implementing the Market Approach
http://slidepdf.com/reader/full/implementing-the-market-approach 11/33
5
2.5 Development assistance generally involves by definition some form of subsidy. In the case of technical assistance, whether local or foreign, the existence of a market failure may justify a subsidy if,for example, it can accelerate early stage market development. But the level of the subsidy has to be insome sense proportional to the market failure being addressed. Larger subsidies may be justified by larger failures. The greater the financial cost-revenue deficit, the larger must be the public goods (externality)
element in order to justify covering the deficit from public funds. In general, in terms of economicefficiency and growth, subsidies should be (a) small enough to just offset the distortion or market failure(which implies being well targeted); (b) they should achieve their objective within a limited time(otherwise the targeting may break down); (c) they should be transparent (to minimize abuse, and to allowtheir impact to be easily monitored); (d) they should not have significant macro/fiscal effects (which maycomplicate the incidence of the subsidy and the incentives arising from it); and (e) they should be feasiblewithout excessive administrative cost.16 17
2.6 Earlier schemes for centralized provision of business development services were relativelyinsensitive to demand and also tended to create a monopolistic service supplier that could undercut thedevelopment of competitive private suppliers, and might over-invest in services not necessarily in demand nor of high quality. Such approaches did not adhere to the rule of minimizing the distortion created by
16 The Bank’s OP 8.30 (para 8) states that subsidies should be (a) transparent, targeted and capped (b) funded
through Government budget or other sources subject to regular control and review, (c) fiscally sustainable, (d)they should not do not give an unfair advantage to some FIs over other qualified and directly competinginstitutions, and (e) they should be economically justified, or the least cost way of achieving poverty reduction.
17 See “The Banks Approach to Subsidies” CPD Discussion Paper no 1986-44. Robert Myers et al. Subsidies canimprove efficiency in two ways: first best, where they adjust prices directly to capture externalities or smooth price shocks; second best where they offset price distortions created by Government policies which cannot beremoved in the short term. Firm level interventions are mainly of the second type.
Box 2 The Market Failure/ Public Goods Rationale for Assistance with Business Development Services
The economic justification for public intervention to increase the supply and demand for business servicesdepends on the existence of failures in the private market. For example:
Demand side failures may result from lack of knowledge by firms of what is available in terms of businessservices., and how they can be of use. Such lack of knowledge is often caused by market segmentation with
information only flowing to certain firms (usually larger export/import firms). Information on export potential is particularly lacking for SMEs. There is also a problem of ‘short term-ism’ (excessively high discounts on the valueover time of outside advice due to perceived risk/uncertainty); low valuations of outside advice mean that access costsof services are likely to be seen as too high. In some poorer economy situations private valuation of training is reduced
because of lack of certainty about its benefits, so that its costs appear excessively high in relation to its benefits.1
Putting a value on training is particularly difficult because it is an ‘experience good’. The benefit received is difficultto value prior to completion of the training, at which point the incentive to pay is reduced.
Supply side failures are linked to the demand side—an underdeveloped market results in low expected returnsto business service provision. First mover transaction costs may also be relatively high. Market segmentation can beanother problem—if services are tied traditionally to certain sectors and there is a lack of knowledge about other sectors. Preemptive foreign competition (external trade, accounting and auditing services) may put up barriers to localentrants, or, on the other hand, protective policies may reduce the demonstration effects of foreign competition. Theremay also be a lack of/ inappropriate professional training infrastructure to produce advisors— or a relatively highthreshold investment in such training.
Linked market failures may occur in, for example, the financial sector—SMEs are seen as risky borrowers due partly to lack of a track record and bank knowledge and lack of access to finance could reduce activity and demand for business services . In the case of exporting firms, lack of pre-shipment and post shipment finance effectivelyconstrains roduction and indirectl reduces demand for business services.
Delivered by The World Bank e-library to:arvin elatico
IP : 203.177.158.157Wed, 14 Oct 2009 04:29:21
(c) The International Bank for Reconstruction and Development / The World Bank

7/28/2019 Implementing the Market Approach
http://slidepdf.com/reader/full/implementing-the-market-approach 12/33
6
Box 3 Tanzania - State Support Bypassed Existing Local Capacity.
Despite the hostile environment for private enterprise in the 1970s, thecommercial district of Dar Es Salaam still hosted many small private business service providers – bookkeepers and accountants, forwarding and courier agencies, marketing agents, and business training establishments.
These small businesses seemed to be invisible both to the donor agenciesand to the Government, both of whom preferred instead to set up high profilecentral promotion facilities. Yet these micro-firms were operating as profitable commercial businesses; they understood the market and the business environment. To the outside observer it seemed that the smallaccountants offices, for example, stimulated by increased demand and withsome technical help, could be the seed-corn of future accountancy, businessadvice and consultant service firms. But instead they had to compete withdonor-financed facilities working out of expensively staffed and equipped offices, and providing free services. Fortunately for them, the localknowledge and the marketing efforts of these state-sponsored bureaux wasweak, so that the local service suppliers were not seriously damaged and they largely retained their traditional ‘invisible’ customers. However, it wasan opportunity wasted because it was these existing fledgling service firmsthemselves that would have benefited from advice, training, and incentives
to upgrade to contribute to enterprise growth and improved governance.
intervention itself, and theywere neither temporary nor transparent. Even if theymanaged to effect an increasein services leading to anincrease in output, this was not
by itself an adequate justification for public technicalassistance intervention, and could actually be harmful if itdid not lead to sustainabledevelopment of the market. Anillustration of this is fromTanzania (see box).
2.7 To address the problem, a more recentapproach to enterprise support
has been to establish semi- public autonomous agencies 18.Such approaches may be moremarket-sensitive; services may be provided with some degree of cost recovery, and the agency may assist to some extent capacity building in service provision (e.g. outsourcing to local consultant firms) as well as itself providingservices to specific enterprises. However, these schemes are normally designed still to inject into themarket a donor-driven central provider; the central provider may have a mandate to upgrade localcapacity, but as a general rule such schemes do not address demand and market creation directly.
Moving from Supply side Subsidies to demand side grants
2.8 The market for business development services may be divided into strategic and operationalservices 19. Operational services are routine activities such as freight and mail forwarding, printing and publishing, and bookkeeping. The market does not generally fail for routine services. The failure is morelikely with strategic services which are outside the regular experience of small firms - such as diagnosticanalysis, financing, reorganization, specialized market planning (e.g. exports), identification of investment partners etc. It is in these areas that a subsidy may be justified.
2.9 If a subsidy is needed and justified then a more effective way to provide it than implicitly througha service-supply institution may be to target the subsidy in the form of an explicit grant for the purchaseof specific services - i.e. addressing the particular demand side failure20. A subsidy to the demand sidecould still be distorting if it failed to stimulate appropriate sustainable development of the market, but it is
18 Some alternative types of essentially supply-side instruments are summarized in Syed Mahmood; op cit. Recent
examples in transitional economies are the Lithuania Enterprise and Financial Sector Assistance Project, and theMoldova Private Sector Development Project.
19 It may also be divided up into several categories of service, each of which might face different marketconditions, but we are simply outlining the overall principle here.
20 It should be pointed out that who gets the subsidy depends on market conditions. Subsidies to purchasers are tosome degree ‘passed on’ to suppliers, and vice versa, depending on elasticities of demand and supply. But who isthe initial recipient may be important for incentive reasons.
Delivered by The World Bank e-library to:arvin elatico
IP : 203.177.158.157Wed, 14 Oct 2009 04:29:21
(c) The International Bank for Reconstruction and Development / The World Bank

7/28/2019 Implementing the Market Approach
http://slidepdf.com/reader/full/implementing-the-market-approach 13/33
7
more likely to stimulate a sustainable expansion than the imposition of a subsidized supplier on to aninfant services industry.
2.10 A subsidy to transactions (demand or supply) is less efficient in static terms than a non-transactional subsidy (e.g. a subsidy for public information or general technical upgrading) because itdirectly affects (distorts) selling and buying decisions. However, market creation is not a static but a
dynamic process in which incentives and sequencing mat be as important as resource allocation, and amarket transaction carries an inherent learning-by-doing benefit different from that of pure information provision ‘offline’. This is because the learning process may be delivered more effectively. If this is so,then giving incentives to directly boost demand and accelerate transactions may produce as great or greater benefits than non-transactional subsidies.
2.11 Figure 2 depicts the market creation process. Initially the market at A is small and insensitive tothe cost of services. A subsidy to demand for services (say through a grant) results in an upward shift indemand from D1 to D2. Service supply responds by initially expanding to point B (at a higher supply price). But if the grant both increases demand and reduces supplier’s risk, thereby changing the supplyconditions and encouraging new entrants, then the supply also shifts upwards, to S2, and the market to point C, at an average price equal to or below the starting level. The supply may also become more
competitive, shown by increased elasticity, reflecting a more active and liquid market .
Figure 2: Stimulating the market for business services
Average Priceof Services
S1
BB
S2
AA CC
D D2
D1
Initial 1st stage Expanded Number of Service Transactions Market (Demand Market
Position Shifts) Position
2.12 A fairly rapid change in conditions of supply (e.g. through better information and reduced
supplier's risk) is key to the development of the market. If a supply shift is not achieved and the supplycurve remains at about S1 (and the market at point B) then most of the subsidy would be captured byservice suppliers in higher profits, with little expansion of the market. The more the service supply shiftsoutwards, the greater the benefit will be for the users of services and greater the increase in marketactivity. A favorable shift in user-firm perception must also take place (e.g. through greater certaintyabout the value of services), such that demand remains elevated above D1 even after the subsidy (and itsincentives) has been removed. (If demand remains at D2 this would suggest that the subsidy exactlyeliminated a market failure). Otherwise, the market would contract back towards D, and then to A as
Delivered by The World Bank e-library to:arvin elatico
IP : 203.177.158.157Wed, 14 Oct 2009 04:29:21
(c) The International Bank for Reconstruction and Development / The World Bank

7/28/2019 Implementing the Market Approach
http://slidepdf.com/reader/full/implementing-the-market-approach 14/33
8
suppliers exit, and the whole exercise would have been a costly waste of resources. To help lock in theessential changes in market perception the subsidy should be phased out over time.
2.13 In contrast to the market-expansion scenario, the ‘traditional’ public sector enterprise service provider approach could conceivably result in a reduction in domestic service supply (because thesubsidized supply of services reduces the average price obtainable for services), or a contractionary shift
in supply (e.g. if existing service firms perceive that they can no longer compete and they have to exit themarket ). Its effect on demand is difficult to predict (it could reduce demand for existing services or itmight over time have a learning/demonstration effect from increased knowledge of available services). 21
2.14 Among the partial approaches to market development is one which fosters competitive supply.This occurred for example with business training services (used e.g. in Chile). The approach was to allow private service provision but to select providers centrally through a (donor or State-sponsored)competition process (an approach which retains a degree of central control of the supply side). This is partial because it supports competitive supply and price but it does not directly solve the problem of relevance and quality vis-à-vis client demand. The same procedure is used by one of the leadingconsulting agencies in this field.22
2.15 One method of targeting demand, through a partial subsidy, has been through a Matching GrantFund (MGF) instrument, which has been used by the Bank increasingly (though still infrequently) for delivering consulting and training assistance to business enterprises, as well as inputs into other sectorssuch as education and social services. The MGF has up to now been used mainly to boost demand but itcould be also used to expand and upgrade service providers to meet more sophisticated demand by user firms. It could fund both non-transactional and transactional services ranging from simply freeinformation provision to financing the purchase of a business service.
2.16 Another demand-side approach is to use vouchers. Vouchers are a partial transactional subsidylike a matching grant, but they provide a currency of payment for services.23 This feature can further reduce the risk of the transaction to both service supplier and user. Some voucher projects have had good results. For example the evaluation of a Paraguay training voucher project claimed that “instead of the
empty classrooms and lack of enthusiasm for the supply side approach even with private providers,demand for training services picked up strongly.”
2.17 Figure 3 depicts a continuum of assistance approaches, from the traditional centralized supplyside method to the most decentralized demand-driven method. In practice there are many variations onthese models and there is no case for saying that one approach is necessarily superior to another; specificconditions are critical. For example some facilities are not intended to be part of a local service market, but are temporary donor agency outreach or coordination offices, supplying specific services to supportdonor projects. But theory and experience suggest that a demand-driven approach if it can be adequatelymanaged, will give superior capacity building results and a stronger development impact.
21 These issues are also explored in ‘East Africa – Non-Policy Instruments for Private Sector development’ World
Bank 199422 SwissContact have designed many projects around the idea of local firms bidding to become preferred providers.23 It should be noted that the value of the voucher ‘grant’ still depends on the ability of service supply capacity to
shift. If supply is inelastic then the increased demand would simply cause prices to rise.
Delivered by The World Bank e-library to:arvin elatico
IP : 203.177.158.157Wed, 14 Oct 2009 04:29:21
(c) The International Bank for Reconstruction and Development / The World Bank

7/28/2019 Implementing the Market Approach
http://slidepdf.com/reader/full/implementing-the-market-approach 15/33
9
Figure 3. A continuum of Enterprise Assistance ModelsSupply Driven Demand DrivenState Development Autonomous Assistance Fund Assistance Fund Voucher programPromotion Agency Public agency Public agency Pvt/Contract mngmt Pvt/Contract mngmtGovernment Mngmt Private/Contract Mgt Govt control Decentralized Decentralized
Centralized Part decentralized Part decentralized Private SPs Co-paymentGovernment SP a/ Private/public SPs Private SPs Co-payment Private (?local) SPsFull subsidy Some service fees Co-payment (Small/micro ents)
a/ SP = service provider
Who gets the grants?
2.18 In trying to maximize social benefits all grant programs face a rationing problem. That is, if services are supplied at below free market price then there is by definition ‘excess’ demand, which leadsto queuing, and thus the potential for arbitrary/corrupt behavior on the part of those in control of thefunds. This problem has to be guarded against by designing a market-like rationing method. In practiceMatching Grant projects have used simple objective eligibility criteria, and firm self-selection throughFIFO and partial co-payments. Those eligible firms that are first in the queue are not necessarily the most
efficient firms, but selecting the fastest respondents may have momentum benefits, which might be called X-efficiency effects. If the primary objective is institution building (e.g. making a market for businessservices) and if this is most likely with rapid momentum, then rapid disbursement of funding (FIFO) withlow selection discretionality might be X-efficient. Nevertheless, the use of grants should best involvecriteria which approximate to efficient selection.
Should there be subsidies for equipment purchase?
2.19 To assist small firms to invest there may be a case for subsidizing the cost of equipment. (Thishas been done in some micro-enterprise projects). However the case is not strong. A market failure infinancing of fixed assets is less likely than for financing of know-how. Know-how benefits are more
diffusable than is the case with equipment, yielding a benefit potentially considerably higher than themarket cost24. For example know-how embodied in workers can move between jobs, or to people outsidethe workforce, while equipment tends to remain proprietary and inaccessible to other firms. Thus for equipment the benefits are generally fully captured by the purchasing enterprise whereas for knowledgeacquisition they may not be. There may also be a market failure in access to finance which penalizesknow-how purchasers. For equipment loans banks have norms for asset valuation and loan security (e.g.collateral), which reduce the uncertainty of lending. For investment in knowledge such norms may notexist.
2.20 The case for equipment subsidies is stronger in some special cases. For example, with collectiveinvestments there may be external knowhow benefits. This might for example apply to a design center or a common repair facility. Collective investment arrangements have been promoted for this reason by
business associations in countries such as Italy and Germany, or public-private assistance centers (Japan,Denmark, Korea). In South Africa business partnerships were encouraged to prepare joint programs for outside assistance25. Nevertheless, a collective investment that captures these external benefits is more
24 A prime example of positive knowledge diffusion externalities is the mass acquisition of internet capability
throughout the population which may be considered to produce social benefits far greater than the financial costs(e.g. salaries of IT workers) or the price of software and IT products.
25 See “South Africa; Industrial Competitiveness and Job Creation Project” World Bank Appraisal Report 1997.
Delivered by The World Bank e-library to:arvin elatico
IP : 203.177.158.157Wed, 14 Oct 2009 04:29:21
(c) The International Bank for Reconstruction and Development / The World Bank

7/28/2019 Implementing the Market Approach
http://slidepdf.com/reader/full/implementing-the-market-approach 16/33
10
likely to access adequate private loan finance. A more important exception to the rule is perhaps where afixed investment generates clear externalities such as environmental improvement (e.g. pollution control).
Reducing Investment Cost by Unbundling Equipment Loans
2.21 Pressure to help firms by subsidizing investment has resulted from the very high real interest rates(between 20% and 50%) that have prevailed in some transitional economies countries (e.g. Armenia,Georgia, Kyrgyz, Russia, and Ukraine and Moldova) due to macroeconomic adjustment difficulties. Away of addressing this need may be to unbundle loans into know-how finance and fixed investmentfinance, using grant finance for know-how in parallel with credits for fixed investment. Most ICRs and PARs for the Bank’s matching grant projects have cited as a main lesson the need to coordinate enterprisegrants and credits in the form of an assistance package that could address both the hardware and thesoftware needs of firms.
2.22 Unbundling of finance according to the public goods characteristics of the assets financed would not compromise the financial system since the bank loans would continue to be made for bankableinvestments at market rates while the grants would be from parallel windows financed outside the
banking system. Nevertheless, the grant windows should conform to norms (limited fiscal effects,transparency, temporary and should not pervert incentives to borrow). Grants should not be for knowledge assets which are integral and proprietary to the equipment, should not distortlending/borrowing behavior by being made contingent on loans e.g. ‘teaser grants’ purely to attract business, and, finally should not be used to reduce general lending risk by leveraging the free funds.
Initial Country Conditions and Environment
2.23 The generation of externalities (e.g. through accelerating market development) may require particular economic conditions. In the case of enterprise technical assistance these conditions must beones that promote the dissemination of know-how beyond the confines of the immediate recipient
enterprise. A principal condition is adequate capacity and motivation of the productive sector to absorbinnovative know-how. An economy which is in restructuring and recovery mode, but which possessesexisting (if obsolescent) underutilized technical skills in the enterprise sector, may be more likely to reaplong term benefits from a short term resource injection into the market for technical services than aneconomy that is trying to overcome long term structural constraints on the development of the technicalservices industry. An environment (e.g. a transitional economy) in which existing skills are being wasted may also generate stronger incentives to make the market work than an environment in which skills are being developed ab initio. The public goods case for intervention in the technical services market maytherefore be clearer in transitional economies.
III. EXPERIENCE WITH VOUCHER PROGRAMS
Characteristics Of Voucher Schemes
3.1 To develop the market for business services by addressing demand, training and technicalassistance voucher schemes have been tried in several countries26, usually as part of wider projects.
26 See “voucher programs; potential, problems and prospects” Gabriel Schor and Lara Goldmark, IDB March 1999
(paper for Rio conference). The IADB is financing eight voucher programs in Latin America.
Delivered by The World Bank e-library to:arvin elatico
IP : 203.177.158.157Wed, 14 Oct 2009 04:29:21
(c) The International Bank for Reconstruction and Development / The World Bank

7/28/2019 Implementing the Market Approach
http://slidepdf.com/reader/full/implementing-the-market-approach 17/33
11
Vouchers are subsidies to transactions that are expected to promote demand by lowering service cost inrelation to its expected value, and by providing liquidity direct to the user. They promote service supplysince the currency (redeemable vouchers) used for payment in advance eliminates a part of the supplier’s payment risk (compared with ex post reimbursement) while the fact that the vouchers have to be endorsed by the user on completion of training reduces the purchaser’s risk. Voucher schemes require closemanagement because of their relative administrative complexity and because vouchers are convertible to
cash, resulting in greater exposure to possible collusion and fraud which could be counter-productive for the sustainable development of the services market
3.2 One of the first pilots was an IDB project initiated in 1995 in Paraguay 27. Service providers werescreened and registered, with the register remaining continuously open during the project life to promotenew entries and competition. Vouchers had a fixed monetary amount that was set to partially cover thecost of the training courses. The voucher received from the trainee was exchangeable by the service provider for cash only on the trainee’s completion of the course. Prevention of fraud was handled throughscreening of training providers and clients, personalization of vouchers, attendance records and site visits,and potential disqualification of providers. Initial assessments in 1999 show that after a learning period there was strong growth in voucher use and in the number of service providers. In some cases enterprisedirectors themselves started training programs for other enterprises. The diversity and convenience of
training provision also improved. However, problems lay in the administration of the schemes.
3.3 A scheme in Peru was less successful. This was because vouchers were distributed to a limited number of donor clients, and their face value was set as a percentage of total cost so that larger enterprisestended to receive larger grants, building in a bias against smaller firms. Fraud was not adequatelycontrolled (especially collusion between trainers and clients ) and a secondary market grew up whichdistorted the planned pattern of voucher usage. The percentage valuation of voucher may also have led,via collusion, to increases in training course fees. Technical assistance services proved difficult tostandardize and control for quality and fraud. The project demonstrated the major importance of publicityand control, and a credible, autonomous managing institution. In other projects low uptake of vouchershas been a problem suggesting the need to carefully identify the target market, set the value of vouchersto provide an adequate incentive to user firms in relation to average service expenditures, simplify
voucher acquisition and redemption, and ensure wide publicity28
.
Voucher Initiatives in the Bank
3.4 The Bank initiated a voucher project in Kenya in1994,29 under a scheme known as the Jua Kali(hot sun) program. Tracer studies prior to completion showed that assets, sales, product range and employment were all significantly greater in the grant recipient firms than a control group.30 Earlyindications show mobilization of the apprenticeship market and training by entrepreneurs of other entrepreneurs. The mobilization of this previously ‘invisible’ source of enterprise technical support is keyto successful local market development as it provides domestic learning and empowerment.Complications of voucher allocation and collusion are being addressed. The use of Jua Kali associations
themselves to allocate vouchers has mobilized additional ‘invisible’ capacity as the JKAs become participants and not simply beneficiaries in the project. This may be regarded as a critical element of
27 See “Paraguayan vouchers revisited: strategies for the Development of Training Markets” Caren. Botelho and
Lara Goldmark DAI/ USAID. Hanoi conference paper, April 2000.28 “Developing Performance Indicators for Voucher Programs: The Cordoban Experience, Caren Addis and Linda
Fitzgerald.” Draft, August 2000.29 Kenya—Micro and Small Enterprise Project 1994.30 “Kenya—micro and small enterprise development project—tracer study for phase one” Netcom Jan 1999.
Delivered by The World Bank e-library to:arvin elatico
IP : 203.177.158.157Wed, 14 Oct 2009 04:29:21
(c) The International Bank for Reconstruction and Development / The World Bank

7/28/2019 Implementing the Market Approach
http://slidepdf.com/reader/full/implementing-the-market-approach 18/33
12
successful decentralization and demand-orientation. The overall cost-benefit performance of the projecthas yet to be assessed.
3.5 As in other interventions an important issue is the need to identify what if any market failuresactually apply, the implicit assumption being an information failure in the market for business services. If this is correct then provision of information should result in an upsurge in sustainable services which will
continue after the project ends, rather than finishing when the temporary injection of voucher-based liquidity ends.
3.6 Voucher schemes have to overcome relatively complex design issues and managementrequirements and they incur high operation costs to provide successful coordination, guard against fraud,and ensure high quality service provision. The Bank has not implemented enough of these projects todraw firm lessons, and none have yet been completed. Careful evaluations should be made of the initial projects while new projects are under preparation, including an urban micro-business project in Mexicoand a proposed Rural Investment Fund in Zambia, which is expected to include agricultural input and technology dissemination vouchers.
IV. IMPLEMENTING MATCHING GRANT FUNDS
Experience with MGFs
4.1 Matching grant funds (MGFs) have been increasingly used to finance know-how services and training in the enterprise sector (see figure 4). MGFs promote demand by lowering the cost of businessservices compared to the user’s (risk-adjusted) valuation of the service, and increased demand in turninduces expanded supply. They may be less effective than vouchers in reducing the service provider’s risk but the MGFs are administratively simpler than voucher schemes while probably promoting more qualitycontrol over the supply of services as part of a sustainable market for business services.
4.2 One of the first MGFs was setup in 1961by the Irish Export Board asa marketing development fund. Grantfunds have also been set up for business advisory services in Europe,including the UK, France, Italy, and Norway. A scheme set up by theBritish DTI in 1988 was designed toencourage firms of less than 400employees to use managementconsultants. A review of that project in1991 showed that 21,000 programs had
been started for firms, 90% of beneficiaries stated that they had received value for money, and 74% of beneficiaries planned to use consultantsagain paying full market price.31
31 Cited in the SAR for “Mauritius—Technical Assistance to Enhance Competitiveness” Page 15.
0
12
3
4
5
6
7
8
9
1986-90 1991-95 1996-2000
LCR
ECA
MENA
Africa
E. Asia
S. Asia
Figure 4 MGF Project Approvals by Regionand Time Period
Delivered by The World Bank e-library to:arvin elatico
IP : 203.177.158.157Wed, 14 Oct 2009 04:29:21
(c) The International Bank for Reconstruction and Development / The World Bank

7/28/2019 Implementing the Market Approach
http://slidepdf.com/reader/full/implementing-the-market-approach 19/33
13
4.3 Since 1986, about 16 Bank MGF projects for business development and/or export support have been completed or are ongoing (one cancelled) (as shown in the annex). The total value of these funds isUS$216.5 million or on average US$ 13.5 million per fund. and approximately 6,000 subprojects have been implemented so far. The rate of implementation has accelerated along with geographicaldiversification.
4.4 The earliest significant Bank scheme was the 1986 India Engineering Export DevelopmentProject, which contained a consultant fund and a productivity fund, each of $10 million. Both weremanaged by State banks (ICICI and Eximbank). They required 50% matching funds and single firms or groups of firms could receive up to $200,000 in subsidy. The managing banks kept staff to a minimumand used decentralized, streamlined approval procedures. The project was rated a success, though therewere implementation delays and not all (80%) of the funds were disbursed. Estimated export growth ratesof beneficiaries following the grants far exceeded the national average. This was the model for a follow-up project in India in 1989, with four funds totaling $20 million and maximum grants of $500,000 per firm. This project was also rated a success with significant incremental export achievement. A significantfeature of the Indian project was the use of banks as administrators of the funds; this facilitated parallelloan activity to finance fixed assets and working capital alongside the grant financing of advisoryservices.
4.5 A similar project, for export development and small medium enterprise assistance, was started inIndonesia in 1986, although in this case the managing agency was a State-sponsored entity—the ExportSupport Board. Total funds were $8 million supporting exports through marketing, productionmanagement, training, technical assistance and including small equipment purchases. The co-payment percentages were 50% or above. Grants for advisory services were linked to a credit line and maximumgrant amounts were relatively small at $10,000 per assignment. Processing delays caused slowdisbursement (68% at closure) but the advisory services were considered successful and exports increased by a large multiple of the grant amount. Nevertheless firms were not prepared to pay full price for theservices after project completion, which suggests that the market creation impact may have been limited.
4.6 Among the principal lessons of implementation from these early schemes was the need for a
supportive enterprise policy regime (e.g. export policy), autonomous management unencumbered byGovernment or political pressures and good internal controls. Despite implementation problems theevaluation of these schemes was positive and similar projects went ahead in Latin America from 1990,and in Africa from 1991 starting in Kenya.
4.7 A recent study on MGFs in Chile and Mauritius32 states: “the programs offer evidence that privatesector operations of BDS support programs with maximum autonomy and accountability of theimplementing agents offer significant benefits in cost effectiveness versus previous State executed regimes. In addition to reduced cost, the private operators offer increased flexibility, improved responsiveness and a more entrepreneurial attitude in meeting client needs than public sector providers.”The keys to success were arms-length management, low discretionality, and private sector service supply.
MGF Impact Assessment: the issue of additionality
4.8 The study of Mauritius and Chile also pointed out that it has been very difficult to assess theimpact of MGFs, partly as a result of lack of systematic data on the market development impact. Thequestion of impact is critical to the case for MGFs, as it is for all public interventions. Despite the
32 Dan Crisafulli “Matching Grant Schemes for Enterprise Upgrading: A Comparative Analysis” Paper presented at
Rio De Janeiro Conference on Small Enterprises, March 1999.
Delivered by The World Bank e-library to:arvin elatico
IP : 203.177.158.157Wed, 14 Oct 2009 04:29:21
(c) The International Bank for Reconstruction and Development / The World Bank

7/28/2019 Implementing the Market Approach
http://slidepdf.com/reader/full/implementing-the-market-approach 20/33
14
apparent improvement in design relative to traditional approaches, there remains the central concern aboutwhether MGFs are helping to create additionality, i.e. benefits beyond what the private sector would otherwise be able to produce, in the form of economically efficient enterprises in a sustainable market for services. If for example the constraint on enterprise demand for business services is simply lack of finance, rather than high risk aversion due to lack of information, then market activity stimulated by atemporary injection of liquidity will most likely fizzle out when the source of funding ends.
4.9 Another study of the Mauritius project33 focused on enterprise efficiency. Additionality required that enterprises were economically efficient, capable of creating spillover benefits, and able to absorbassistance effectively. If the wrong enterprises were targeted then the rationale of the assistanceintervention was in doubt, so an appropriate enterprise appraisal procedure was needed. The ideal targets
were firms that did not show financial profits (so could not get market finance) but were economicallyefficient and could achieve maximum benefits per assistance input. (The worst-case recipients were onesthat were both financially and economically unprofitable and needed subsidies just to stay afloat).
4.10 The contrary view34 is that the momentum of activity itself is critical for the development of themarket (reducing transaction costs for all players), and that a first-in-first-out approach to subprojectswith minimum transaction costs is essential to build the services market. Detailed appraisal procedures
introduce bureaucracy and discretionality. The strength of the Mauritius project was its flexibility,simplicity in operation, management autonomy, and simple subproject selection.
4.11 Figure 5 is a stylized representation of the two views.
Figure 5 Two views of the design of matching grant funds
4.12 On the one hand the appraisal approach may reap externalities but it may be more discretionary, bureaucratic and slow disbursing, thereby running the risk of failure to develop the momentum to create amarket. On the other hand the non-targeting approach avoids discretionary approvals, has higher rates of disbursement - but is potentially less able to target the externalities. In reality these are not mutuallyexclusive. Without creating a sustainable market the targeting approach cannot achieve additionality in
the longer run. Without creating additionality the non-targeting approach cannot maintain a sustainablemarket in the long run.
4.13 In practice both approaches could also fail to meet their objectives if they are not designed and managed properly. In the case of targeting there is risk that the wrong projects are selected, or that initial
33 See Tyler Biggs “a microeconometric evaluation of the Mauritius Technology Diffusion Scheme” World Bank,
RPED discussion paper November 1999.34 See Dan Crisafulli: op cit, and Andrew Singer’s comments on the Biggs study (Jan 2000).
A. Enterprises selected
through appraisal
B. Enterprises selected
first-come-first-served
• higher transaction costs
• lower market momentum
• higher subproject additionality• more economically efficient
• lower transaction costs
• higher market-momentum
• higher market additionality
• more x- efficient
Delivered by The World Bank e-library to:arvin elatico
IP : 203.177.158.157Wed, 14 Oct 2009 04:29:21
(c) The International Bank for Reconstruction and Development / The World Bank

7/28/2019 Implementing the Market Approach
http://slidepdf.com/reader/full/implementing-the-market-approach 21/33
15
targeting is too inflexible. In the non-targeting case there have been many instances where fastdisbursement has not been achieved. Delays and interference, which are characteristic of schemes thatreceive subsidies, could damage rather than develop a nascent market for business services. Optimaldesign should aim to find a way of combining the best of both approaches, retaining the good access and ease of disbursement but paying more attention to economics, possibly by including broad target groupsof firms and products and by pre-identifying clusters of promising enterprises.
V. A COMPARATIVE EVALUATION OF TEN MATCHING GRANT FUNDS
The Projects Selected
5.1 Ten projects were examined which had significant matching grant fund components for generalor export assistance. Six of the projects were selected because they have been completed and have ICRsand/or PARs, and four are more recent projects in varying stages of work-in-progress. The inclusion of more recent incomplete projects helps us to assess what changes in design have resulted from pastexperience, although it is too soon to assess the impact of the evolved design.
5.2 The completed projects are from India (2), Indonesia, Argentine, Mauritius and Kenya. The two projects in India were the pioneer funds, focussing on export services. Indonesia, Kenya and Argentinealso focussed on exports, while Mauritius was concerned with the broader provision of business servicesto boost productivity. The other four projects selected are from Mexico, South Africa, Bangladesh and Uganda, all of which have the broader business services focus. The Uganda project is nearing completionand has been the subject of tracer studies.
Main MGF Project Design Features
5.3 The major features of the ten different MGF projects implemented by the Bank were as follows.
5.4 General principles. All ten projects subscribed to the principle of client-driven, decentralized service provision, with a subsidy, via a matching grant, paying for services from private local, and foreign, providers, with the central purpose of stimulating the market for expert services.
5.5 Uses of grants. All the projects offered grants for knowledge-based services, combined in twocases with training. In the case of export development these included: marketing research and plans,quality testing and certification, product adaptation, export fairs and national/international marketingtours. In the case of business support they included business strategy and planning, productionmanagement, product design, quality standards and control, productivity studies, information systems,and training. Grants were not available for equipment and in some cases (e.g. South Africa) wereexplicitly excluded.
5.6 Grant size and payment arrangements. The size of grant funds (the Bank's contribution) varied widely, from US$2.0 million (Kenya) to US$30.0 million (Mexico), approximately related to the size of the respective enterprise sectors. Individual grants were subject to a maximum ranging from US$50,000to US$200,000 and, exceptionally, above. The actual average grants paid varied from about US$8,000(Kenya) to US$64,000 (Indonesia). Payment arrangements were 50% grant and 50% co-payment by therecipient enterprises (except in Indonesia where it was 25% co-payment). Grants were all on areimbursement basis, subject to proof of eligible expenditure. (This latter arrangement is necessary for
Delivered by The World Bank e-library to:arvin elatico
IP : 203.177.158.157Wed, 14 Oct 2009 04:29:21
(c) The International Bank for Reconstruction and Development / The World Bank

7/28/2019 Implementing the Market Approach
http://slidepdf.com/reader/full/implementing-the-market-approach 22/33
16
internal control purposes although it does create some uncertainty in the client firm, which may tend todepress demand for grants).
5.7 Fund Governance. All projects had multi-tier governance with a Government agency or autonomous Government entity (e.g. a Foundation) in overall control, usually complemented by a steeringcommittee or consultative council that approved larger grants. Where a non-Government institution was
in overall charge (e.g. Mexico and Uganda) there was an additional layer of administration which wasintended to act in place of the Government entity. The type of fund managing agency varied; in India thefund was managed by State and private banks; in Mexico by the National Science Foundation throughmultiple individual managing agents, and in Indonesia by a specially created Government office (theExport Support Board). In other projects, management was provided by a single external specialistconsultant firm selected under international bidding rules. The autonomy of the managing agent, bothfrom political pressure and from ties to the service providers it was accrediting and paying, was thought to be critical in achieving a streamlined and market-credible mechanism
5.8 Management Capacity building. The indigenisation of fund management varied. In the case of India for example participating banks staffed special ‘cells’ to develop in-house expertise in exportadvisory services. In other cases (e.g. Uganda) a foreign specialist management firm appointed a manager
and assistant manager plus local staff. The foreign consultant might act either as manager or asmanagement advisor. The local capacity building impact of the two approaches was different. In the firstcase sustainable local capacity was put in place while, in the second case, the foreign managementapproach did not aim to build fund management capacity, on the grounds that MGFs were supposed to betemporary channels of support.
5.9 Service providers and quality control. The managing entities took responsibility for the qualitychecking of service providers. The extent of supervision varied from on the one hand proactive assistancefor firms to develop proposals and select providers, to on the other hand more hands-off support such assimply development of lists of registered providers or checks on providers selected independently by the beneficiary firms.
5.10 Firm eligibility. All projects focused on individual or collective private sector SMEs, someexport oriented, some with broader business orientation. In a few cases (especially for exports) the fundswere also open to larger firms, and in one case (South Africa) micro-firms were included. Apart from thefirst project in India (focused on engineering goods) there has been no product targeting, although theactual sub-sectors supported were mainly in manufacturing, or (e.g. in South Africa) tradable services and manufacturing.
5.11 Subproject eligibility. The eligibility of subprojects was in all cases based on the first-come-first-served principle (FIFO) subject to set eligibility criteria, usually including provision of an agreed marketing/business plan and, in the more recent projects, monitorable deliverables. In most casesrestrictions were put on the number of grants per firm over the life of the project. Beyond establishingeligibility, past practice has been not to conduct more detailed appraisals, but the thinking on this is
shifting (see section 4).
5.12 Monitoring and evaluation. Earlier projects did not contain rigorous procedure but the later projects incorporated explicit performance targets, deliverables targets, a double-funding safeguard, and amonitoring agreement between the fund manager and the recipient firm to provide evaluation data.
5.13 Indicators of Output and Impact. This was addressed unevenly, because some projects wereimplemented prior to the introduction of mandatory indicators, and also because impact, as opposed tooutput, indicators, were not included except in very general terms (e.g. under development objectives).
Delivered by The World Bank e-library to:arvin elatico
IP : 203.177.158.157Wed, 14 Oct 2009 04:29:21
(c) The International Bank for Reconstruction and Development / The World Bank

7/28/2019 Implementing the Market Approach
http://slidepdf.com/reader/full/implementing-the-market-approach 23/33
17
The most commonly used indicator was the number of subprojects completed and the sales or exportmultiple (the ratio of sales/ export growth to grant value), and many projects were highly successful onthese criteria. These are unreliable measures for project impact as they do not measure efficiency or additionality, nor market development performance.
Evaluation of The Six Completed MGF projects
5.14 Measurement issues The benefits of the projects are difficult to measure in the absence of sensitive output, sustainability and impact indicators. This section makes an attempt to draw someconclusions from indicators of cost-effectiveness that were created ex post. 35
5.15 MGF operating costs. Measurement of fund operating is available for the completed projects,with the exception of India where local banks took the management role and costs were not reported. TheMGF operating cost divided by value of grants disbursed gives an indicator of the efficiency with whichthe MGF was implemented. This ranged from 18% (Argentine) to 57% (Kenya). The burden of this costis high compared with a typical fund management charges in other types of funds (e.g. in managed venture capital funds the norm is about 3% of gross assets per annum). There are also overall governance
costs (e.g. project advisory committees and Government implementation units) that in principle should beincluded.
5.16 Operating cost per grant approved ranged from US$1,326 per subproject (Kenya) to US$6,047 per subproject (Argentine36). This was because Kenya gave a lot of small grants (average size US$2,320)while Argentine gave few larger ones (average size US$16,792). Nevertheless, the Kenyan cost was amuch higher (and seemingly excessive) proportion of the value of each subproject. If governance costsand Bank preparation and supervision costs are added to these figures there is certainly a presumption of excessive overhead costs.
5.17 Momentum effect - speed of Implementation. The speed of implementation is a rough indicator of the momentum effect thought to be important to developing the services market. The disbursement lag,
where it can be isolated for the MGF alone, is a possible indicator of the momentum effect. The mostdelayed disbursement over the project life was in the case of the Indian Engineering Export project, whilethe most on-track performance was Kenya. In the case of the first India project, disbursements weregreatly delayed (and closing was put back by 2.5 years) as the participating banks took time to understand the procedures of the MGF. The follow-up project in India was more successful in disbursing as the initial participating banks had learned the procedures (although two new participating banks were somewhatslower). In the case of Kenya, despite the good recorded disbursement performance, measured by thesmall average disbursement lag, the ICR reported six-month average delays in the processing of individual grants which soured relations with clients. Start-up delays were also reported for Indonesia; inArgentine there were problems because of subproject cancellations, Government interference and weak management follow-up. In Mauritius initial disbursement was reported as slow but then picked up. In
35 A relevant part of the cost of a project, not accounted for by the Bank, is the cost of Bank and Government
preparation and supervision effort, especially in relation to loan size. Staff inputs ranged from 120 SW(Argentina) to 354 SW (Indonesia). However it is not possible to disaggregate the MGF component from theremainder of the project, except in Argentina where the MGF (US$32 million) was the principal component.Thus in Argentina 120 SW plus the real cost of Government staff would amount to over US$ 600,000 or over 2% of project cost.
36 However, many approved subprojects were not completed and some were cancelled because of adverse macroeconomic changes.
Delivered by The World Bank e-library to:arvin elatico
IP : 203.177.158.157Wed, 14 Oct 2009 04:29:21
(c) The International Bank for Reconstruction and Development / The World Bank

7/28/2019 Implementing the Market Approach
http://slidepdf.com/reader/full/implementing-the-market-approach 24/33
18
Uganda a mid-term report suggested that implementation was slowing because of bureaucratization of the process (lack of site visits).
5.18 Project Benefits. Project output was measured in terms of sales and/or export multiples. Asdiscussed, this is not necessarily a good measure mainly because it is not an efficiency or profitabilitymeasure and because of attributability questions, but it can provide some indicative measure. The
achieved export and sales multiple was calculated for five projects and gave fairly uniform measures,ranging between 37:1 and 50:1, except in the case of Mauritius where a remarkably high ratio of 163:1 for revenue and 124:1 for export sales was apparently achieved. If these sales were (a) economically profitable, and (b) largely attributable to the grant funding, then these indicators would suggest that theMGFs performed very well. With regard to impact (both institutional impact and sustainability) no usablequantified indicators were provided for the projects complete. A proxy indicator was speed of disbursement, representing market stimulation. However, the Bank’s ICRs and PARs made some non-quantified assessments. The ICR/ PARs for the six completed projects rated outcomes as satisfactory infive cases, and highly satisfactory in Mauritius; institutional development impact was rated partial or modest in three cases, satisfactory in two cases, and highly satisfactory in Mauritius. Sustainability wasrated weak in Kenya, likely in four cases, and highly likely in Mauritius.
5.19 Table 3A shows the evaluation for five of the ten projects, all of them completed and closed.
Table 3A Comparative Cost Effectiveness of MGF Projects1. Project Name INDIA Industrial
Export (Engg)Project 1986
INDIA ExportDevelopmentProject 1989
INDONESIA -1st
Exportdevelopmentproject 1986
KENYAExportDevelopmentProject 1991
MAURITIUSTA to EnhanceCompetitivenessProject 1994
Appraised cost($million)
MGF 20.0Total Bank 250.0Tot proj 1000.0
MGF 20.0Total Bank 295.0Tot project 730.0
MGF 5.7Total Bank 68.7Project total 115.9
MGF 2.0Tot Bank 90.3Tot Project 109.2
MGF 3.2Total Bank 7.7Total proj 13.3
Cost of prep/ sup ($ million)
Total project250.2 SW
Total project 225.7SW
Total project353.6 SW
Total project165.5 SW
Total project214 SW
Number of
subprojects
359 449 685 603 266
disbursed($ million)
15.6 (77% of appraisal)
16.48 (82% of appraisal)
5.17 (91% of appraisal)
2.0 (100% of appraisal)
2.52 (95% of appraisal)
oper. cost ($million)
Operated by PFIs- No data
Operated by PFIs- No data
Apprsd cost = 2.5Actual = 2.42
Apprsd cost = 0.8Actual = 0.8
Apprsd cost = 0.4Actual = 0.49 ?
Avg annualactual/ apprsddisbursement
45% 68% 70% 90% (est.) N/ACum. total atclosure = 91%
% oper cost/ grant value apsd
Unknown Unknown 44% 57% 18.1
% op. cost /grant
value- actl
Unknown – bank internal cost
Unknown – bank internal cost
47%(with training)
57% 19.4%
Actual op cost/
No of projectsActl grant value/ no of projects
Unknown Unknown $3,518 per
subproject$7,547 per subproject
$1326 per
subproject$2,320 per subproject
$1,842 per
subproject$9,479 per subproject
Sales or exportmultiple
37:1 50:1 36:1 42:1 163:1 (revenue)124:1 (exports
ICR/PARPerformanceRating
Outcome SInstit developmt SSustainability L
Outcome SInstit developmt SSustainability L
Outcome S.Instit dev el partialsustainability L,
Outcome S.Instit devt modestSustainability weak
Outcome HSInstit dev HSSustainablity HLDelivered by The World Bank e-library to:
arvin elaticoIP : 203.177.158.157
Wed, 14 Oct 2009 04:29:21
(c) The International Bank for Reconstruction and Development / The World Bank

7/28/2019 Implementing the Market Approach
http://slidepdf.com/reader/full/implementing-the-market-approach 25/33
19
Ongoing MGF Projects
5.20 Table 3B shows a sixth completed project (Argentina) and the four ongoing projects. Theongoing projects have moved away from export advisory services to general business support services,which is characteristic of other more recent projects. Not much can be said prior to project completiondata. But one issue is that the designs are widely divergent; e.g. the expected management-intensity of
each project differs greatly. Planned operating costs as a percentage of the expected value of grantsranged from only 6.2% in the case of South Africa, to nearly 50% in the case of Uganda. Sincemanagement quality is so critical to the success of these projects, while at the same time the operatingcost of grant funds has to be kept in check, this suggests that good practice models for management and governance of the MGFs have not been followed.
Table 3B Comparative Cost-effectiveness of MGF ProjectsProject name ARGENTINE
ExportDevelopmentproject 1995
UGANDAPrivate SectorCompetitivenessProject 1996
SOUTH AFRICAIndustrialcompetitivenessproject 1997
MEXICOKnowledge/ InnovationProject 1998
BANGLADESHExport diversific-ation project 1999
Project cost ($million)
MGF 32.0
Total Bank 38.5Total proj 74.2
MGF 3.0
Total Bank 14.5Tot. Project 20.9
MGF 24.4
Tot Bank 46.0Total Proj 88.6
MGF 30.0
Tot Bank 300.0Tot Proj 663.0
MGF 15.8
Tot Bank 32.0Tot project 48.0
Cost of projectprep/ supn ($mn)
Total project 0.5(119.8 SW)
Project notcomplete
Project not complete Project notcomplete
Project notcomplete
Grants disbursed($mn)
17.8(26.6 approved).
1.5(at 3/31/00)
N/a N/a N/a
Number of subprojects
1060 570 (at 12/99 -after three years)
MGF operating costover project life ($million)
Appraised cost =5.80Actual = 6.41
Appraised cost =1.3 (approx)
Appraised tot projadmin cost = 1.5
n/a. (fund managed by NatSci Foundation)
Appraised cost =4.46
Avg annual actual/ appraiseddisbursement %
N/aCum. Disbursed at closure = 66%
N/a N/a N/a N/a
MGF appraisedoperating cost/ grant value %
18.1% 40% to 50%expected (midterm est)
Tot project op cost/grant value = 6.2%
N/a 18.5%
MGF actualoperating cost/ grantvalue %
36% (higher if partial programsaccounted)
N/a. Not complete Not complete Not complete
Actual oper. Cost/ No of subprojectsActual Grant value /no of subprojects
$6,047
$16,792
N/a.
$2,631 (interim – approvals only).
N/a. N/a. N/a
Sales/exportmultiple
N/a (Beneficiaryfirms increased exports relative tocontrol group)
N/a. Significantincrease in sales(mid-term)
N/a N/a N/a
Bank PerformanceRating
Outcome SInstitutional MSustainability L
PSR ratingssatisfactory
Project not yetcompleted
Project not yetcompleted
Project not yetcompleted
5.21 As stated in section 4, the benefits of the Mauritius project (table 3a) have been reevaluated 37; theefficiency of the enterprises selected was in doubt since only 10% of initial proposals were rejected and because, to speed up disbursement, 80% of subprojects were approved after they were already under way.
37 Tyler Biggs; op cit
Delivered by The World Bank e-library to:arvin elatico
IP : 203.177.158.157Wed, 14 Oct 2009 04:29:21
(c) The International Bank for Reconstruction and Development / The World Bank

7/28/2019 Implementing the Market Approach
http://slidepdf.com/reader/full/implementing-the-market-approach 26/33
20
One quarter of the grants were found to have gone to enterprises that did not produce additionality. Whilethe project may have deepened the market and reduced its riskiness, three quarters of the firms assisted had previously used consultants and were not new to the market. While there were some new suppliers,repeat business was low. Grants went almost entirely to users rather than service suppliers, and only a fewgrants went to subprojects that generated increased demand for local consulting services. The evaluationalso found that nearly half of the firms assisted would have carried out their projects without the grant
funding. The net impact on smaller firms was better but still one quarter could have gone ahead withoutthe grants. If the reevaluation is correct then the market development impact was less than satisfactory.
MGF Project Evaluation summary
5.22 There was no clear indication that the different kinds of governance methods systematicallyaffected project performance. Rather performance was more a function of the quality of individual fund management and its relationship with outside Government and non-Government bodies.
5.23 The measured output of the MGF projects was overall very satisfactory. But there are severalcaveats which have been discussed – questions about additionality, and about attributability. With regard
to the latter, the relatively and absolutely high sales and export multiples may be inflated by variousfactors - e.g. that the grant was only a small part of a wider enterprise investment program, that theenterprises selected were already higher-than-average performers (selection bias), or that there was asecular/cyclical upswing in output and exports affecting all enterprises. 38
5.24 The operating costs of the MGFs as a proportion of the total fund were high, and variable. Thisraises a question about how far project design focused on cost-effectiveness, and how far good practicenorms are followed in designing the management structures.
5.25 The momentum effect of the projects, insofar as it can be determined by speed of disbursement,was not good. In some cases major disbursement lags occurred, amounting to years. In no case wasdisbursement as rapid as planned, even with the use of the first-in-first-out selection of projects. If the
market building case for MGFs rests on their momentum effects, then it is difficult to conclude from thismeasure that the projects evaluated have met this goal.
5.26 The institution building and market development impact was not measured directly for these projects. According to the Bank’s own evaluations, based on qualitative judgements, the impact wasmodest for five of the projects, and only one project, Mauritius, had high scores on these criteria. But thereevaluation of the Mauritius project has shed some doubt on its market development impact as well.
5.27 From the mixed results found in this project evaluation and in other studies and reports for these projects, it is clear that, if MGFs are to fulfil the market creation and institution building potential that wehave argued should be achievable, their design needs to be much more carefully worked out than it has been up to now, and their implementation and management carried out under clearer and more
appropriate guidelines.
38 In the first India project export gains were impressive but concentrated in a few firms with existing strong
international connections (e.g. Cummins, Ingersoll-Rand) which raises doubts about additionality. A further point is that exports were maintained in a time of export decline - was this therefore assistance to ‘newexporters’? In Indonesia the success was at a time of major export expansion - how far did the MGF trulycontribute to export increase?.
Delivered by The World Bank e-library to:arvin elatico
IP : 203.177.158.157Wed, 14 Oct 2009 04:29:21
(c) The International Bank for Reconstruction and Development / The World Bank

7/28/2019 Implementing the Market Approach
http://slidepdf.com/reader/full/implementing-the-market-approach 27/33
21
VI. CONCLUSIONS AND RECOMMENDATIONS
6.1 Support to the enterprise sector needs to be flexibly organized and demand-responsive. Whiletraditional centralized assistance may continue to be effective in some circumstances, it is generally better to use competitive private service providers responding to the evolving needs of client enterprises, subjectto good overall project coordination. The main task is to stimulate this private services sector, upgrading
its capacity to respond to the demands of new and expanding private enterprises.
6.2 There is likely to be a window of time in which the public external benefits of intervention aregreatest - i.e. when the market is in its infancy and its development is constrained by uncertainty and lack of information. The subsidy should be temporary and be phased out as the market takes off.
6.3 Grants should generally be for know-how and not for equipment. However there may be a casefor unbundling the know-how component of loans (e.g. feasibility studies, installation services and follow-up expert services) for grant funding. A combined loan/grant package, either through a singlefinancial institution or through separate institutions, may be feasible provided safeguards can be put in place to prevent perverse use of grants.
6.4 Whether the grant window is combined with lending, or free standing, best practice grant modelsare needed. The MGF model, which is increasingly used in the Bank and outside, may be a solution butneeds to be carefully justified and carefully designed. Above all, because the more decentralized is theapproach the greater the overall project coordination burden, it has to have competent management withclear operating procedures.
6.5 The sustainable skills-market-based approach to enterprise technical support may be conceived asthe parallel of the sustainable financial market-based approach to enterprise investment finance that has
been increasingly accepted by donor agencies over the past few years.39
Figure 6 Parallel financing channels: Investment and Technical Services
Investment Resources Technical resources
fixed/working business services/capital finance knowledge provision
39 This was spelled out in the Bank's OP 8.30 .
BANK/ DONOR
market for financeand financial
services
market for skilledmanpower and
technical services
ENTERPRISESDelivered by The World Bank e-library to:
arvin elaticoIP : 203.177.158.157
Wed, 14 Oct 2009 04:29:21
(c) The International Bank for Reconstruction and Development / The World Bank

7/28/2019 Implementing the Market Approach
http://slidepdf.com/reader/full/implementing-the-market-approach 28/33
22
Optimizing the Design of MGFs
6.6 MGFs have faced problems in terms of the selection procedure for subprojects, managementcomplexity, and slow disbursement. To take advantage of the benefits that the MGF should be able to provide, especially compared with central, supply-side interventions, they must address the problems of the enterprise sector and be cost-effective. The following are some essential steps to be taken and
questions to be asked in setting up a MGF.
Step 1. Establish the economic need for the project.
6.7 What is the public goods case for assistance? Is there a knowledge gap constraining provider and user enterprises by increasing market uncertainty? a lack of internal management/technical know-how, alack of information about the use/value of particular outside business advisory services, a failure in provision of advisory services? Is there an information gap constraining access to and granting of marketfinance for technical services?
6.8 Are there other more important problems constraining enterprises - e.g. (a) projects may not be bankable for reasons of uncompetitive technology or products; (b) Government regulations may prevent
or deter private sector entrants or harass existing companies; (c) tax, trade and exchange rate policy might be putting more of a burden on local than foreign companies. These types of problems require a differentapproach (e.g. macroeconomic and trade policy reform, regulatory and administrative reform). MGFassistance in an adverse policy environment may be able to produce an output, but is likely to have aweak or negligible market impact.
Step 2.Establish local ownership
6.9 A special effort is needed to bring the Government counterparts into the picture because this is anunfamiliar and possibly controversial instrument40. In particular an understanding should be reached on(a) the rationale of the services market-building approach to enterprise assistance when managed properly, (b) the need for autonomous, streamlined management and decision-making, (c) the
implications of grants for the Government budget, and (d) the internal controls and safeguards againstgrant abuse, including last-resort Government oversight procedure.
Step 3. Develop a cost-effective design
• The Fund managers role. The management team's terms of reference are key to the success of the project. The team’s principal business is to promote market knowledge. It must be proactivein market-making, identifying and forecasting the needs and resources of firms, to upgrade themaccording to a market development model, and to bring together the providers and the usersusing various information media. The management team should split its resources and its grantawards between supplier and users. The team should have general business consultant and training skills and experience, but should use this experience to market the skills of the firms in
the market , not to provide its own formal advisory services. It should not be enmeshed inmonitoring and reporting requirements, but should be left to work towards generally agreed targets.
40 The Armenia Enterprise Development Project MGF component ran into difficulties because, despite initial
agreement, a new Government backed away from explicit grants (even though they were not in cash) because,inter alia, there was a concern about the perception of potential for corruption. The fund has been very slow todisburse (12 projects in three years) and has thus essentially failed to meet the objectives of opening up themarket.
Delivered by The World Bank e-library to:arvin elatico
IP : 203.177.158.157Wed, 14 Oct 2009 04:29:21
(c) The International Bank for Reconstruction and Development / The World Bank

7/28/2019 Implementing the Market Approach
http://slidepdf.com/reader/full/implementing-the-market-approach 29/33
23
• Fund life. The life of the fund must have a built-in sunset provision, with its limit tied to
indicators of domestic market expansion and capacity development.
• The fund size, costs and grant level; the size should be based on the estimated value of demand expressed by firms over and above normal willingness to pay for services in the absence of a
fund, and the likely upgrading needs of new/existing service providers to meet demand. A larger fund (with a broader eligible product range) may be advisable to minimize unit managementcosts; fund management internal and outreach work program should maximize cost-effectiveness. A simple norm is advisable for grants, reimbursing 50% of costs subject toindicative maximum per firm (allowing multiple grants per firm).
• Provider or user grants? Grants should be available for both sides of the market, to enableservice providers to provide the upgraded services demanded by new and upgraded users and toenable a complete-market matchmaking approach by the facilitating entity and fund managers.
• The types of services; the services should normally be strategic rather than operational, and they
should be defined on the basis of an up-front needs study, including both transactional services
(mainly addressing demand) and non-transactional services (mainly addressing supply). Concernwith economies of scale may justify opening up the fund to combine both training and knowledge services for general business and specialized services for export/import and international contracting, depending on the availability of an appropriate combination of fund expertise.
• Governance and management; last-resort Government oversight should be included through a policy committee with limited power (e.g. general fund policy, and approval of above-threshold grants); autonomous fund management should be established either through a market entity (e.g.a financial institution) or through a specialized fund management company, allowing autonomyof decisions. Oversight by a quasi-public entity such as a Foundation may increase layers of supervision if it has to report to a Government department, so its autonomy must be ensured.
• The approval process; generally a reasonably streamlined FIFO process should be used, but itshould be subject to a set of carefully designed and clear enterprise and subproject eligibilitycriteria including broad (flexible) product group targets.
• Firm and subproject eligibility; the focus should generally be on SMEs and microenterprises41; both user-firms and service providers should be eligible; criteria should target (a) firms thatrequire but are not willing to pay for services; (b) product areas and technologies most likely togenerate spillover benefits; and (c) types of assistance most likely to stimulate demand for localservice provision. Grants should comprise a significant part of the business plan provided byapplicant firm. The development of eligibility criteria will require up-front research into thesources of growth of the enterprise sector and functioning of the market for services.
• Managing Service provision; the fund manager should be responsible for developing a register of local and foreign providers, conducting quality checks and giving upgrading grants to service
41 Some MGFs have included larger firms. However evidence (from Mauritius) suggests that the additionality
benefit from assisting large firms is especially weak. This is not surprising considering that large firms have gotlarge because they are already well aware of how to access needed resources on their own, are accustomed to paying for it, and because the available grant finance is likely to be marginal to their investment expenditure plans.
Delivered by The World Bank e-library to:arvin elatico
IP : 203.177.158.157Wed, 14 Oct 2009 04:29:21
(c) The International Bank for Reconstruction and Development / The World Bank

7/28/2019 Implementing the Market Approach
http://slidepdf.com/reader/full/implementing-the-market-approach 30/33
24
providers according to its market development model; subject to limiting overhead cost of the project, the manager should work actively with user firms to identify providers.
• Performance indicators and criteria: output and impact indicators may be built into the projectdesign via a ‘project score-sheet’ 42; monitorable deliverables and obligations of the fund manager, service provider and user firms to provide performance data can be spelled out in
project agreements; performance measures require output indicators, institutional developmentindicators and market development indicators 43. The indicators must allow for selection bias and non-attributability. Additionality indicators would require information on whether proposalwould have been undertaken in the absence of a grant, how it would be improved with grantsupport, and what external (spillover) benefits can be expected from the subproject. It would alsorequire information on the quality and speed of development of the services market. However, progress reporting should not become a bureaucratic burden on the fund manager that adverselyaffects the objective of market-making.
Providers vs. Facilitators - Mixed projects
6.10 This paper has argued that facilitation and not service provision is the role of public support. Nevertheless, many public sector service providers, sponsored both by donor organization and byGovernments, are in operation, and the question is how to best utilize their services to continue to transfer know-how. One solution is to combine facilitation with provision. One reason this may not work is the possibility of a conflict of interest between the service provider role and the capacity building role thattries to develop outside service providers. The way to avoid such a conflict may be to arrange service provision so that it (i) focuses only on specialized types of expertise not likely to be available locally inthe near future (e.g. advanced information technology services, corporate finance, or export facilitation innew markets), (ii) adopts a training and dissemination program for such expertise in the course of its provision, and (iii) phases out its service provision pari passu with the development of local capacity,according to a timetable and a market development model agreed by both sides and the donor organization.
6.11 Combination provider/facilitator projects would include a management team that had the skills to both provide these services and manage a market facilitation/ development fund, accessible by both providers and user firms. As the provider role is phased out the team would be adjusted to a pure marketdevelopment fund management role, which would itself be phased out according to a market developmenttimetable.
42 This is being developed for the proposed Mozambique Private Sector Development project.43 The Donor Committee on Small Enterprise development is supporting work on a Performance Measurement
Framework for BDS which would develop ways of measuring market development and sustainability.
Delivered by The World Bank e-library to:arvin elatico
IP : 203.177.158.157Wed, 14 Oct 2009 04:29:21
(c) The International Bank for Reconstruction and Development / The World Bank

7/28/2019 Implementing the Market Approach
http://slidepdf.com/reader/full/implementing-the-market-approach 31/33
25
ANNEX 1COMPLETED, ONGOING AND PLANNED MATCHING GRANT SCHEMES FOR
ENTERPRISE SUPPORT
Country Project Name Fund Value 44 Start Date Close Date
ARGENTINA Export Development Project 32.0 1995 2000INDIA Engg Export Development 20.0 1986 1991INDIA Export development project 20.0 1989 1996INDONESIA 1st Export Development Project 5.7 1986 1992KENYA Export development program 2.0 1991 1995MAURITIUS TA Competitiveness 2.7 1994 1999COLOMBIA Export Development Project 36.6 1993 cancelled
ONGOING
ARMENIA Enterprise Development Project 3.5 1997 2002BANGLADESH Export Diversification Project 15.8 1999 2003JAMAICA Private Investment and Export 4.4 1994 2001MEXICO Knowledge & Innovation Project 30.0 1998SOUTH AFRICA Industrial Competitiveness Project 24.4 1997 2001TUNISIA Export Development Project 13.5 1999UGANDA Pvt Sec Competitiveness Project 3.0 1996 2001ZAMBIA Enterprise Development Project 2.5 1997 2002ZIMBABWE Enterprise Development Project 0.42 1996 2001
PLANNED
MOZAMBIQUE Private Sector Development Project 2000
44 MGF component of IBRD/IDA loan (excluding local contribution and cofinancing)
Delivered by The World Bank e-library to:arvin elatico
IP : 203.177.158.157Wed, 14 Oct 2009 04:29:21
(c) The International Bank for Reconstruction and Development / The World Bank

7/28/2019 Implementing the Market Approach
http://slidepdf.com/reader/full/implementing-the-market-approach 32/33
26
REFERENCES
Policy papers, monographs, and books
Addis, Caren and Fitzgerald, Linda “Developing performance indicators for voucher programs: theCordoban Experience” DAI August 2000Bannock, Graham and Peacock, Alan “Governments and Small Business” Chapman 1989.Bhalla “Technology and Employment in Industry” Ajit S. ed, ILO 1975Biggs, Tyler “a micro-econometric evaluation of the Mauritius Technology Diffusion Scheme”
RPED discussion paper November 1999Bolton Committee Of Inquiry on Small Firms HMSO 1971.Botelho, C. and Goldmark, Lara. “Paraguayan vouchers revisited: strategies for the Development of
Training Markets” USAID. Hanoi conference paper, April 2000.Committee of Donor Agencies for Small Enterprise Development. October 1995, Business
Development Services for Small Enterprises; Guidelines for Donor Intervention World Bank 2000
Crisafulli, Dan “Matching Grant Schemes for Enterprise Upgrading: A Comparative Analysis” Paper presented at Rio De Janeiro Conference on Small Enterprises, March 1999
Djankov, Simeon and Nenova, Tatiana “Constraints to Entrepreneurship in Kazakhstan”. World Bank (forthcoming).
Forster, Sarah “Are Social Funds an Effective Mechanism to Deliver Credit for Micro-enterpriseDevelopment?” World Bank 1996 (Draft).
Grigorian, D. (World Bank forthcoming)Hallberg, Kristin “A market oriented strategy for small and medium scale enterprises” IFC
Discussion Paper no 40.Itoh M. and Urata, S. “Small and Medium Size Enterprise Support Policies in Japan”, World Bank
Policy Research Working Paper 1403, Dec 1994.Keesing, Don and Singer, Andrew. “Expanding manufactured exports through support services”
World Bank 1990.Keesing, D. and Singer, A. “Development Assistance Gone Wrong; :failures in services to promote
and support manufactured Exports” World Bank, 1990Levitsky, J. ed. “Business Development Services; A Review of International Experience” I.T.P 2000Levy, Brian et al. “Technical and Marketing Support Systems for Successful Small and Medium Size
Enterprises in Four Countries” World Bank Policy Research Working Paper #1400. Dec 1994Mahmood, Syed “Post privatization assistance; when is it justified and how can the World Bank
help?” ECSPF Occasional Paper No. 2, 1998Myers, Robert et al “The Banks Approach to Subsidies” CPD Discussion Paper 1986-44. .Riley, Thyra and Steel, William . “Kenya voucher program for training and business development
services” World Bank 1999
Schor Gabriel and Goldmark, Lara “Voucher programs; potential, problems and prospects”, IDBMarch 1999 (paper for Rio conference)
Snodgrass, D. and Biggs, T. “Industrialization and the small firm; patterns and policies”Webster L., Riopelle, R. and Chidzero, A. “World Bank Lending for Small Enterprises 1989-93”
Delivered by The World Bank e-library to:arvin elatico
IP : 203.177.158.157Wed, 14 Oct 2009 04:29:21
(c) The International Bank for Reconstruction and Development / The World Bank

7/28/2019 Implementing the Market Approach
http://slidepdf.com/reader/full/implementing-the-market-approach 33/33
27
Bank projects cited and consulted
Argentine Enterprise Export Development ProjectArmenia Enterprise Development ProjectBulgaria Regional Initiatives Fund ProjectColombia Export Development ProjectIndia Engineering Products Export ProjectIndia Export Development ProjectIndonesia First Export Development ProjectJamaica Private Investment and Export Development ProjectKenya Export Development ProjectKenya—Micro and Small Enterprise Training and Technology ProjectLithuania Enterprise and Financial Sector Assistance ProjectMauritius—Technical Assistance to Enhance Competitiveness ProjectMexico Knowledge and Innovation ProjectMexico Rural Finance Technical Assistance and Pilot Project
Mexico Urban Micro-business ProjectMoldova Private Sector Development Project.Mozambique Private Sector Development ProjectSouth Africa Industrial Competitiveness and Job Creation ProjectSouth Africa; Industrial Competitiveness and Job Creation ProjectTunisia Export Development ProjectUganda Private Sector Competitiveness ProjectZambia Enterprise Development ProjectZimbabwe Enterprise Development Project
Delivered by The World Bank e-library to:arvin elatico
IP : 203.177.158.157Wed 14 Oct 2009 04:29:21