implementing a gap analysis framework to improve quality of care
TRANSCRIPT

JUNE 2010
This workshop participant manual was prepared by University Research Co., LLC, for review by the United States Agency for International Development (USAID) and was authored by Shawn Dick, Suzanne Gaudreault, and Fazila Shakir.. The USAID Health Care Improvement Project is made possible by the generous support of the American people through USAID.
Implementing a Gap Analysis Framework to Improve Quality of Care for Your Patients
2010 Global Health Council Annual Conference Workshop
CASE STUDY: IMPROVING CARE FOR PATIENTS ON ART

2010 Global Health Council Annual Conference Workshop
Implementing a Gap Analysis Framework to Improve Quality of Care for Your Patients Case Study: Improving Care for Patients on ART
Shawn Dick, Associate Director Suzanne Gaudreault, Sr. QI Advisor, HIV, TB, Malaria, and Other Infectious Diseases Fazila Shakir, Quality Improvement Specialist USAID Health Care Improvement Project (HCI) Quality and Performance Institute (QPI) University Research Co., LLC (URC) June 2010
DISCLAIMER The views expressed in this publication do not necessarily reflect the views of the United States Agency for International Development or the United States Government. The data presented in this case study are from a facility assisted by the HCI Project site. The names and locations have been changed for confidentiality purposes.

Acknowledgements This training case study was developed by University Research Co., LLC (URC) through the Health Care Improvement (HCI) Project, which is made possible by the generous support of the American people through the United States Agency for International Development (USAID). Support for the development of this case study was provided by the President’s Emergency Plan for AIDS Relief (PEPFAR) through USAID. The USAID HCI Project is managed by URC under the terms of Contract Number GHN-I-03-07-00003-00. URC’s subcontractors for the HCI Project include EnCompass LLC, Family Health International, Health Research Inc., Initiatives Inc., Institute for Healthcare Improvement, Johns Hopkins University Center for Communication Programs, and Management Systems International. For more information on applying the Gap Analysis Framework to improving quality of care for patients on ART, please visit www.hciproject.org/improvinghivcare. Recommended citation: Dick S, Gaudreault S, and Shakir F. 2010. Implementing a Gap Analysis Framework to Improve Quality of Care for Your Patients. Case Study: Improving Care for Patients on ART. Published by the USAID Health Care Improvement Project. Bethesda, MD: University Research Co., LLC (URC).
How to Implement a Gap Analysis Framework to Improve Quality of Care for Your Patients
Introduction: Quality Improvement Overview and Introduction to the Gap Analysis Framework
Section 1: Identify Your Target Population and Improvement Aim Case Study Part 1: Welcome to the Basabasa Clinic Example and Exercise 1: Establishing your quality improvement aim
Section 2: Who falls through the gaps? Case Study Part 2: What goals must people with HIV/AIDS reach in order to achieve good health outcomes? Example and Exercise 2: What are the gaps and who falls through them?
Section 3: Collecting the Data Case Study Part 3: How many potential patients are out there and how many do we have coming to the clinic? Example and Exercise 3: How will you determine your patient numbers? Section 4: The Gap Analysis Time Series Plot Case Study Part 4: Collecting and plotting the data Example and Exercise 4: Create your own time series chart
Section 5: Understand Causes Behind the Gaps Case Study Part 5: Why do patients miss appointments? Example and Exercise 5: What barriers decrease quality of care for your patients? Section 6: Identify Changes to Close the Gaps Case Study Part 6: What should we change about our clinic? Example and Exercise 6: What can you change to improve services at your facility?
Section 7: Test and Implement Changes with PDSA Cycles Case Study Part 7: Making a difference and keeping track of changes Example and Exercise 7: Prepare your PDSA journal Section 8: Monitor Results and Continue to Act Case Study Part 8: Try, try, and try again Example 8: Continuing to close the gaps
*Nolan Model Diagram; Associates in Process Improvement (API)
Model for Improvement
What are we trying to
accomplish?
How will we know that a
change is an improvement?
What changes can we make that will result in
improvement?
Act Plan
Study Do
1

2

Introduction: Quality Improvement Overview
and Introduction to the Gap Analysis Framework
3

Implementing a Gap Analysis Framework to Improve Quality of
1
p Q yCare for your Patients
OBJECTIVES - By the end of the workshop participants will be able to:
• Define a high quality ART program• Identify a few data points which, when
analyzed together, reveal gaps in ART program qualityG th d t t l th lit
USAID HEALTH CARE IMPROVEMENT PROJECT
• Gather data to reveal the quality gaps • Identify causes of the gaps• Generate and test changes to close the gaps• Provide ongoing monitoring of the data
points and gaps to drive continuous improvement in program quality
QI Overview
“Crossing the Quality Chasm” IOM 2001: “Between the health care we have and the care we can have lies not only a gap, but a chasm ….. the problems come from poor systems – not bad people”
From an Improvement Perspective: “Every system is perfectly designed to achieve exactly the results it achieves”
USAID HEALTH CARE IMPROVEMENT PROJECT
designed to achieve exactly the results it achieves
Guiding Principles of Improvement:– Analyze patient care in terms of processes and systems
– Patient-centeredness is essential
– Solutions should be developed by teams of providers, patients, and support staff as appropriate
– Changes are tested and results measured to drive improvement
4
4*Nolan Model Diagram; Associates in Process Improvement (API)
What is Quality Care for Patients on ART?
• Everyone who needs treatment receives it.
USAID HEALTH CARE IMPROVEMENT PROJECT
• Everyone who receives treatment is retained in care.
• Everyone in care has a good clinical outcome.
Gaps Analysis Framework for Improving Care for Patients on ART
1,200
1,400
1,600
1,800
s
# PLWHAs Eligible for ART(Should be)
Cummulative # of PLWHAsever started on ART
Expected # Picking up ARTthi th
Coverage Gap
USAID HEALTH CARE IMPROVEMENT PROJECT
-
200
400
600
800
1,000
Jan Feb Mar Apr May Jun Jul Aug Sep Oct Nov Dec Jan
Time (Month)
# of
PLW
HA
s this month
Actual # Picking up ART thismonth (Current PatientLoad)
# with Good ClinicalOutcome
Wellness Gap
Retention Gap
5

Where else can a Gaps Analysis Framework for improvement be applied?
Situations in which the potential number of patients reaching a certain healthcare goal can be measured or closely estimated, then compared to the actualnumber of patients reaching this goal.
USAID HEALTH CARE IMPROVEMENT PROJECT
Examples include situations in which patients receive:• care for chronic conditions
• long-term treatment, especially in outpatient and community-based programs
• periodic follow up over time
• short term follow up to verify status or success of treatment
6
Section 1: Identify Your Target Population and Improvement Aim
7

Section 1: Identify Your Target Population
1
Identify Your Target Population and Improvement Aim
2*Nolan Model Diagram; Associates in Process Improvement (API)
What are we trying to accomplish?
Compose a good Aim Statement:
• Aim Statement: a measurable, and time-sensitive description of the accomplishments expected to be made from improvement efforts
USAID HEALTH CARE IMPROVEMENT PROJECT
• A good aim statement includes: a timeframe, a defined target population (eg. catchment area or district), a brief description of the work to be performed, and numerical performance/outcomes measures
8

Example Aim Statement
• Using gaps analysis to guide quality improvement activities, our clinic will: provide ART for 90% of the estimated 2500 ART - eligible patients in our catchment area, retain 95% of patients started and expected to continue on ART, and achieve good clinical outcomes for 95% of patients retained on ART These targets will
USAID HEALTH CARE IMPROVEMENT PROJECT
for 95% of patients retained on ART. These targets will be achieved by the end of 18 months.
9
Case Study Part 1: Welcome to the Basabasa Clinic The Basabasa clinic provides antiretroviral therapy (ART) for patients in a rural district of a country with a high HIV prevalence. The clinic has over 1,000 patients receiving HIV services and is continuously putting new patients on ART as they become eligible for treatment. The clinic serves the district population by: 1) identifying and enrolling HIV-infected patients in care, 2) starting patients on ART when they become eligible for it, 3) helping patients adhere to their ARV regimens, and 4) providing proper treatment and prevention for HIV/AIDS-related conditions and infections and for medication side effects. The clinic team leader, Dr. Fazil knows that there are some problems with each of these services. She knows that some people in the community who should be on treatment have not been to the clinic. She also knows that many patients miss appointments or are not always adhering to their medications, and that some patients have improperly treated opportunistic infections (OI’s), medication side effects, and other AIDS-related conditions. As a result, patients in the clinic are not always doing as well as the clinic staff would like. Dr. Fazil and the staff of the clinic want better outcomes for the HIV-infected people in their catchment area. This means getting people who need ARVs on treatment (improving coverage), helping patients remain in care (improving retention), and helping patients become and stay healthy (improving outcomes). The clinic team agreed to work on improving services for HIV-infected people in their district and developed the following aim statement: The team decided that their aim should be:
“In the Basabasa clinic, we will implement changes aimed at reducing the gaps in coverage, retention, and wellness in order to increase the number of ART-eligible patients in our catchment area enrolled in ART who are enrolled on ART, retained in care, and have either stable or improving health status. “
10

Example 1: Establishing your Quality Improvement Aims If you provide ART services for a population and would like to increase the number of HIV-infected persons with positive outcomes, you can develop a clear aim statement by answering the following questions. Where will your improvement project be implemented: ___ the Basabasa clinic_ ___________________________________________________________________________(A) - Your site such as a district, town or clinic. Who are your potential patients (catchment population): __all HIV-positive________
____persons in our catchment area who are eligible for ART____(B) - What health problem are you trying to address? Where are the people with this health problem located? What characteristics of people with this health problem set them apart from others? What outcome do you want to see for your patients: ___enrolled on ART, retained in
care, and either stable or improving health
status_____________________________________________________________________(C) - What aspects of health care or patient health are you trying to improve? What does a patent need to receive or achieve in order for you to consider your services fully successful?
Put together your responses to complete the aim statement for your improvement project: In (A)_______ the Basabasa clinic __________, we will implement changes aimed at reducing the gaps in coverage, retention, and wellness in order to increase the number of (B)_ART-eligible patients in our catchment area enrolled in ART
who are (C) enrolled on ART, retained in care, and have either stable or
improving health status.________________________________________________
11
Exercise 1: Establishing your Quality Improvement Aims If you provide ART services for a population and would like to increase the number of HIV-infected persons with positive outcomes, you can develop a clear aim statement by answering the following questions. Where will your improvement project be implemented: _____________________________ ___________________________________________________________________________(A) - Your site, such as a district, town, or clinic. Who are your potential patients (catchment population): ___________________________ ___________________________________________________________________________(B) - What health problem are you trying to address? Where are the people with this health problem located? What characteristics of people with this health problem set them apart from others? What outcome do you want to see for your patients: _______________________________ ___________________________________________________________________________(C) - What aspects of health care or patient health are you trying to improve? What does a patent need to receive or achieve in order for you to consider your services fully successful? Put together your responses to complete the aim statement for your improvement project: In (A)___________________________________________, we will implement changes aimed at reducing the gaps in coverage, retention, and wellness in order to increase the number of (B)___________________________________________________________________________ _____________________________________________________________________________ who (C)_______________________________________________________________________ _____________________________________________________________________________
12

Section 2: Who falls through the gaps?
13

Section 2: Who falls through the gaps?
1
Who falls through the gaps?
2*Nolan Model Diagram; Associates in Process Improvement (API)
Exercise 2: Where are the HIV service gaps which prohibit some HIV-infected people from achieving good health?
In your workbook:
1) Referring back to your aim statement, consider that ART- eligible patients in the community must be identified and supported to ultimately achieve
d i t i d h lth
USAID HEALTH CARE IMPROVEMENT PROJECT
and maintain good health.
2) The HIV services that are in place allow many HIV-infected people to achieve and maintain good health, but many others do not benefit from these services, and ultimately get very sick and die. Where are the gaps in services?
14

Case Study Part 2: What goals must people with HIV/AIDS reach in order to achieve good health outcomes? The staff of the Basabasa clinic outlined the goals that must be reached as ART-eligible people progress from being identified as needing services to achieving good treatment outcomes. The first steps for any HIV-infected person is to be tested and present to the clinic for care. The clinic staff knows that many ART-eligible patients in the community have never been tested and/or have never come to the clinic for care. This is the coverage gap. Once patients take those first steps of being tested and coming to the clinic, they are registered and started on ART. The next step is to continue treatment by keeping regular appointments. However, many patients do not come back to the clinic consistently, return late for appointments, become lost or discontinue treatment altogether. The difference between those who have started ART and the number still in care at any point in time is the retention gap. Not all patients who are on ART achieve good health outcomes. Some patients suffer from malnutrition, ineffectively treated opportunistic infections, or other health problems. The wellness gap is revealed by the number of patients who come to the clinic for their appointments yet whose health status is still not good.
15

Example 2: What are the gaps and who falls through them? Referring back to your aim statement, consider the population that you are trying to reach and the people who could potentially benefit from the services you are trying to improve. Starting at the top of this page, consider all the patients who should benefit from ART and how many of them are truly accessing services. Then consider how many of those who access ART are actually maintained on ART. Finally, consider how many of the patients retained in care actually have good clinical outcomes. By recognizing the gaps in numbers of patients achieving each of these goals, you will identify and can measure the major gaps in services.
Total population in your area
Your potential patients are: all HIV-positive patients in our
catchment area eligible for ART____(measure 1)
Gap A: Coverage Gap________________________________________ The patients who have actually accessed needed services are: All
patients we ever started on
ART____________________________________( measure 2) The patients who could potentially be retained in care are: all
patients we expect to continue on ART (those not
transferred or deceased)________________ ( measure 3) Gap B:__ Retention Gap_______________________________________
The patients you have actually retained on ART and who could potentially achieve and maintain good clinical outcomes are: those
who regularly return for their appointments and are
able to get all their prescribed ARVs (measure 4) Gap C:__ Wellness Gap_______________________________________ The patients who have actually achieved the goal of the ART services you provide are: those whose health status improves or
remains stable_________ ( measure 5)
16

Example 2: What are the gaps and who falls through them?
Referring back to your aim statement, consider the population that you are trying to reach and the people who could potentially benefit from the services you are trying to improve. Starting at the top of this page, consider all the patients who should benefit from ART and how many of them are truly accessing services. Then consider how many of those who access ART are actually maintained on ART. Finally, consider how many of the patients retained in care actually have good clinical outcomes. By recognizing the gaps in numbers of patients achieving each of these goals you will identify and can measure the major gaps in services.
The people potentially needing ART services are: _____________________________________________________ ___________________________________________(measure 1) Gap A: _____________________________________________________ The patients who have actually accessed needed services are: _____________________________________________________
___________________________________________( measure 2) The patients who could potentially be retained on ART at your facility are: _____________________________________________________ _________________________________________ _ ( measure 3) Gap B:_________________________________________________________
The patients you have actually retained on ART and who could potentially achieve and maintain good clinical outcomes are:__ _____________________________________________________ ____________________________________ _____ (measure 4) Gap C:__________________________________________________________ The patients who have actually achieved the goal of the ART services you provide are: _____________________________________________________ ___________________________________________( measure 5)
17

18

Section 3: Collecting the Data
19

Section 3: Collecting the Data
1
Collecting the Data
2*Nolan Model Diagram; Associates in Process Improvement (API)
Why measure?
• If you don’t measure the results of your changes, how will you know if your changes are improvements?
3
are improvements?
• Always ask: What is the minimum amount of measurement that you need in order to determine that a change is an improvement?
20

Considerations in choosing a good indicator• The meaning is clear and unambiguous.
It i dil tifi bl
4
• It is readily quantifiable.• When using percentages the numerator and
denominator are clear and well-defined.
• The source of the data and the person collecting it are identifiable.
• The frequency with which the data should be collected is practical for the chosen indicator.
Measurement of Quality Indicators: #1 - CoverageCoverage: Percentage of people who actually receive ART compared to those who are eligible for it
Measurement of eligible/potential ART patients (an estimate):
• Catchment Population = 100,000
• HIV Prevalence = 5.0% --> 5,000 PLWHAs
USAID HEALTH CARE IMPROVEMENT PROJECT
• Annual Progression from HIV-infected to ART-eligible = 10%
• ART Mortality = 5% of people on ART die
• Children needing ART=15% of total ART need
Measurement of number of patients actually starting ART:
• From new ART visits or doses dispensed
Coverage:
• Numerator: # patients actually started on ART
• Denominator: # patients eligible for ART
Measurement of Quality Indicators: #2 - RetentionRetention: Percentage of patients who are actually on ART at any given time compared to those who would be expected to be on ART
Measurement of patients started on ART:
– This could be calculated from:
USAID HEALTH CARE IMPROVEMENT PROJECT
• Number of people on ART seen during a specified period
• Number of ART doses dispensed last month
– Retention:
• Numerator: # of patients actually on ART
• Denominator: # of patients ever started on ART minusdeaths & transfers (potential number on ART)
21
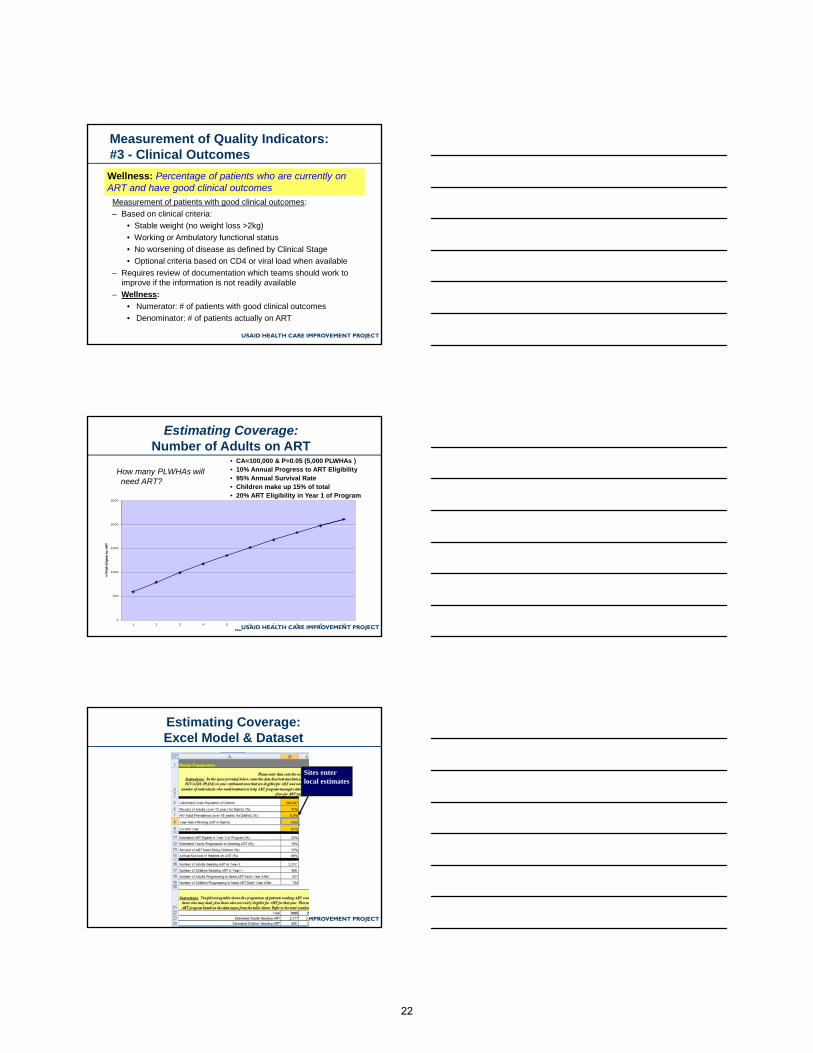
Measurement of Quality Indicators: #3 - Clinical OutcomesWellness: Percentage of patients who are currently on ART and have good clinical outcomes
Measurement of patients with good clinical outcomes:
– Based on clinical criteria:
• Stable weight (no weight loss >2kg)
W ki A b l t f ti l t t
USAID HEALTH CARE IMPROVEMENT PROJECT
• Working or Ambulatory functional status
• No worsening of disease as defined by Clinical Stage
• Optional criteria based on CD4 or viral load when available
– Requires review of documentation which teams should work to improve if the information is not readily available
– Wellness:• Numerator: # of patients with good clinical outcomes
• Denominator: # of patients actually on ART
How many PLWHAs will need ART?
• CA=100,000 & P=0.05 (5,000 PLWHAs )• 10% Annual Progress to ART Eligibility• 95% Annual Survival Rate• Children make up 15% of total• 20% ART Eligibility in Year 1 of Program
Estimating Coverage: Number of Adults on ART
2000
2500
USAID HEALTH CARE IMPROVEMENT PROJECT
0
500
1000
1500
1 2 3 4 5 6 7 8 9 10
Year
# PL
WH
Elig
ible
for A
RT
Estimating Coverage: Excel Model & Dataset
Sites enter local estimates
USAID HEALTH CARE IMPROVEMENT PROJECT
22

Estimating Coverage: Excel Model & Dataset
USAID HEALTH CARE IMPROVEMENT PROJECT
Calculates # Eligible for ART each year
Estimating Coverage: Excel Model & Dataset
Cumulative (Ever started on ART)
Monthly estimates for patients needing ART
USAID HEALTH CARE IMPROVEMENT PROJECT
80000
100000
120000
of P
eo
ple
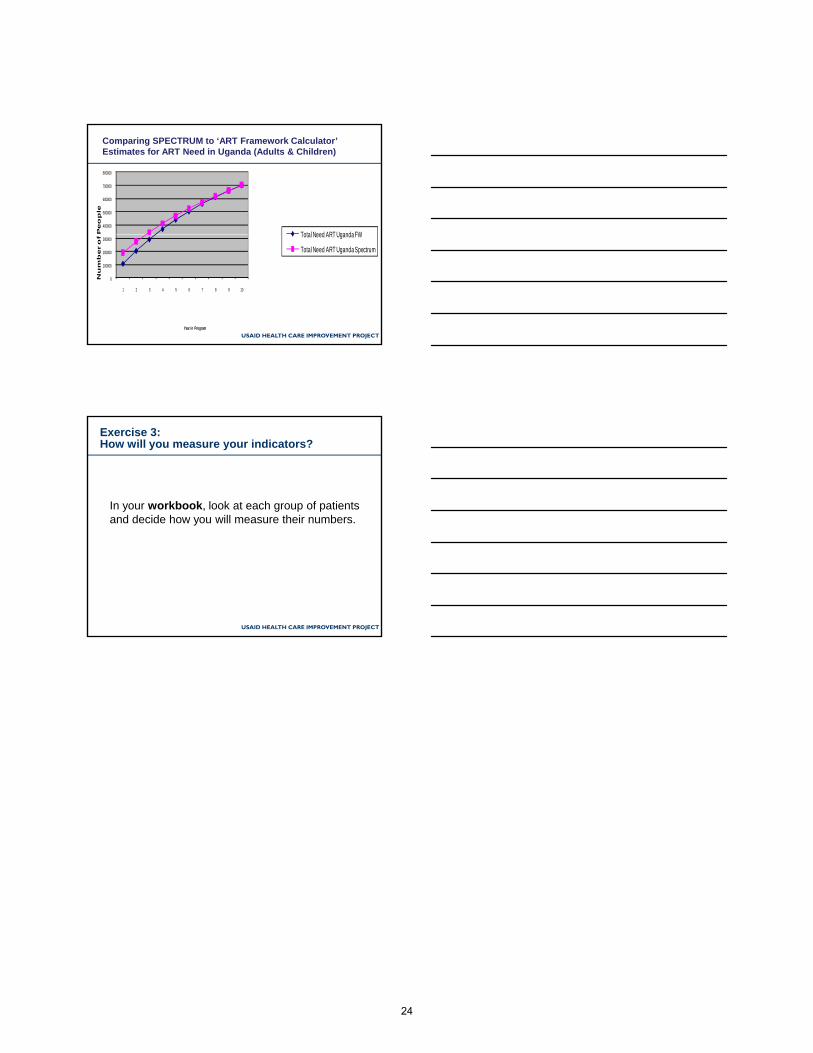
Total Need for ART (Adults & Children) in SwazilandComparing SPECTRUM to ‘ART Framework Calculator’ Estimates for ART Need in Swaziland (Adults & Children)
USAID HEALTH CARE IMPROVEMENT PROJECT
0
20000
40000
60000
1 2 3 4 5 6 7 8 9 10
Nu
mb
er o
Year in Program
Total Need for ART in Swaziland FW
Total Need for ART Spectrum
23
400000
500000
600000
700000
800000
Peo
ple
Total Need for ART in Uganda (Adults & Children)
Total Need ART UgandaFW
Comparing SPECTRUM to ‘ART Framework Calculator’ Estimates for ART Need in Uganda (Adults & Children)
USAID HEALTH CARE IMPROVEMENT PROJECT
0
100000
200000
300000
1 2 3 4 5 6 7 8 9 10
Nu
mb
er o
f
Year in Program
Total Need ART Uganda FW
Total Need ART Uganda Spectrum
Exercise 3: How will you measure your indicators?
In your workbook, look at each group of patients and decide how you will measure their numbers.
USAID HEALTH CARE IMPROVEMENT PROJECT
24
Case Study Part 3: How many potential patients are out there and how many do we have coming to the clinic? Dr. Fazil and the rest of the team know that all quality improvement projects are driven by data, relying on measurement and monitoring of indicators, both to identify gaps in services and to know whether the changes implemented are improving outcomes. Having identified the service gaps that they would like to address and the indicators that will reveal these gaps, the team plans how to collect their baseline data. The first measure, which is the number of potential patients in the catchment area, is the most difficult to calculate. It is only possible to estimate their numbers based upon population and prevalence data. Fortunately, the clinic has recently hired a new data clerk, Ms. Malia, who is familiar with the regional data on HIV prevalence. She devised a simple way to calculate expected patients in the clinic’s catchment area using data she had readily available. Starting with the local population estimate, she knows that the prevalence in her region averages 22%. Of those 22%, she knows that approximately 20% would have been eligible for ART the year her clinic began offering ART services, with an increase of 10% needing ART each year. Using these figures, she is able to calculate the estimated number of ART-eligible people in the clinic’s catchment area. Through further research, she discovered an excel-based ART-framework coverage calculator available online. This calculator uses similar data as her original simple method, but also factors in statistical growth models and the length of time the clinic has been offering ART services. This allows a facility or district to estimate how many people should be on ART now and in the future. The second measure that needs to be collected is the number of patients the clinic has started on ART. Data on patients started on ART each month is readily available in the patient records and regularly reported to the Ministry of Health. It was decided that Mr. Robinson, the reception clerk, would count the number of new patients started on ART and patients transferring in on ART each month and add it to the number of existing patients. He then reports that figure monthly to Ms. Malia as the cumulative number of patients who have ever started ART. Mr. Robinson also records the number of patients who have died or who have been transferred to another clinic. The number of patients that the clinic expects to continue on ART is thus the total number of patients ever started on ART minus the number who have been transferred or who have died. The clinic keeps an appointment book and registers the date of next appointment for each patient before they leave. Patients listed as having appointments on any given clinic day are checked off as they arrive. Mr. Robinson reviews the appointment book at the end of each week and records the number of patients who have kept their appointments. Sometimes patients miss their appointments but come to the clinic in time to refill their prescriptions so that they do not miss any ARV doses. This practice is discouraged, but these patients are recorded as having kept their appointments since the main objective is not to miss ARV doses. The final measure, number of patients whose health status is stable or improving, was obtained by the nurses by reviewing the ART patient files in which weight, clinical stage, and functional status are recorded for each visit. After the baseline data was collected, a register of “patients with worsening clinical status” was established. This greatly facilitated future monthly data collection and patient follow up.
25

Example 3: How will you determine your patient numbers? Refer back to the previous exercise in which you identified the relevant data points and the gaps in services. The number of patients at each step must be measured at baseline and monitored as changes are implemented. This will allow you to measure whether changes lead to improvement. Group/Measure Data Collection 1 Who are the potential patients? persons eligible for ART in the
catchment area .
Where will you get the data? from official health and
demographic surveys .
Who will collect this data? ___Ms. Malia, the data clerk________
How often will it be collected? monthly________________________
How will it be calculated? population and prevalence data will be
entered into the excel-based coverage calculator . 2
Who are the actual patients? all patients ever started on ART
Where will you get the data? from the official ART register .
Who will collect this data? reception clerk____________________.
How often will it be collected? monthly . 3
Who is potentially maintained on ART ? patients expected to
continue ART
Where will you get data on their numbers? patient files that have .
not been archived due to death or transfer .
How often will it be collected? monthly .
4 Who is actually maintained on ART? patients who keep their
appointments and refill their ARV prescriptions on time.
Where will you get data on their numbers? appointment register.
Who will collect this data? the reception clerk .
How often will it be collected? monthly . 5
Who actually has good clinical outcomes on ART? patients with stable
or improving health status . Where will you get data on their numbers? patient files initially,
then the registry of patients “not doing well” once it is
developed .
Who will collect this data? the nursing staff .
How often will it be collected? monthly .
26

Exercise 3: How will you determine your patient numbers? Refer back to the previous exercise in which you identified the relevant data points and the gaps in services. The number of patients at each step must be measured at baseline and monitored as changes are implemented. This will allow you to measure whether changes lead to improvement.
Group/Measure Data Collection 1
Who are the potential patients? __________________________________. Where will you get the data?_____________________________________ Who will collect this data? _______________________________________ How often will it be collected?____________________________________ How will it be calculated?________________________________________ ____________________________________________________________
2 Who are the actual patients?_____________________________________ Where will you get the data?_____________________________________ Who will collect this data? _______________________________________ How often will it be collected?____________________________________
3 Who is potentially maintained on ART? __________________ ________ Where will you get data on their numbers?__________________________ Who will collect this data? _______________________________________ How often will it be collected?____________________________________
4 Who is actually maintained on ART? _____________________________ Where will you get data on their numbers?__________________________ Who will collect this data? _______________________________________ How often will it be collected?____________________________________
5 Who actually has good clinical outcomes on ART? _______________ _ Where will you get data on their numbers?__________________________ Who will collect this data? _______________________________________ How often will it be collected?____________________________________
27

28

Section 4: The Gap Analysis Time Series Plot
29

Section 4: The Gap Analysis Time Series
1
The Gap Analysis Time Series Plot
2*Nolan Model Diagram; Associates in Process Improvement (API)
Elements of a simple Time-Series Chart
Increasing Triage of Children <5 upon Arrival at Kollo Hospital, Niger (2006-2007)
50
60
70
80
90
100
dren
<A
ge 5
Tria
ged
ll Pr
esen
ting
Chi
ldre
n Triage Training
Policy to treat emergencies before administrative paperwork
Clear and well-defined title that includes what
and when
X and Y axes have clear scale and include
indicator label
T t d h
USAID HEALTH CARE IMPROVEMENT PROJECT
0
10
20
30
40
Perc
enta
ge o
f Chi
ldU
pon
Arr
ival
out
of A
l
% of children <5 triaged at arrival 50 69 61 36 67 91 88 79 74 95 85 77 93 85 94 83 88 94 76 97 96
# of children <5 coming to the hospital 80 75 112 119 150 164 130 159 184 170 177 131 105 84 108 120 112 160 623 256 114
# of children <5 triaged (U,P,NP) at arrival 40 52 68 43 100 150 114 125 136 161 150 101 98 71 101 100 99 150 471 248 110
J F M A M J J A S O N D J F M A M J J A S
2006 2007
Numerator Definition: number of children <5 years of age who were triaged monthly U=urgent, P=priority, NP=not priority [Source: Triage forms ]Denominator Definition: number of children <5 years of age that arrived for a consultation at the hospital [Source: Hospital Register ]Sampling Strategy --> data are not a sample.
administrative paperwork
Staff roles defined and Triage Forms introduced
Denominator defined, including data source and
sampling strategy
Numerator defined, including data source and
sampling strategy
Numerator and
denominator values
shown for each month
Tested changes are annotated
30
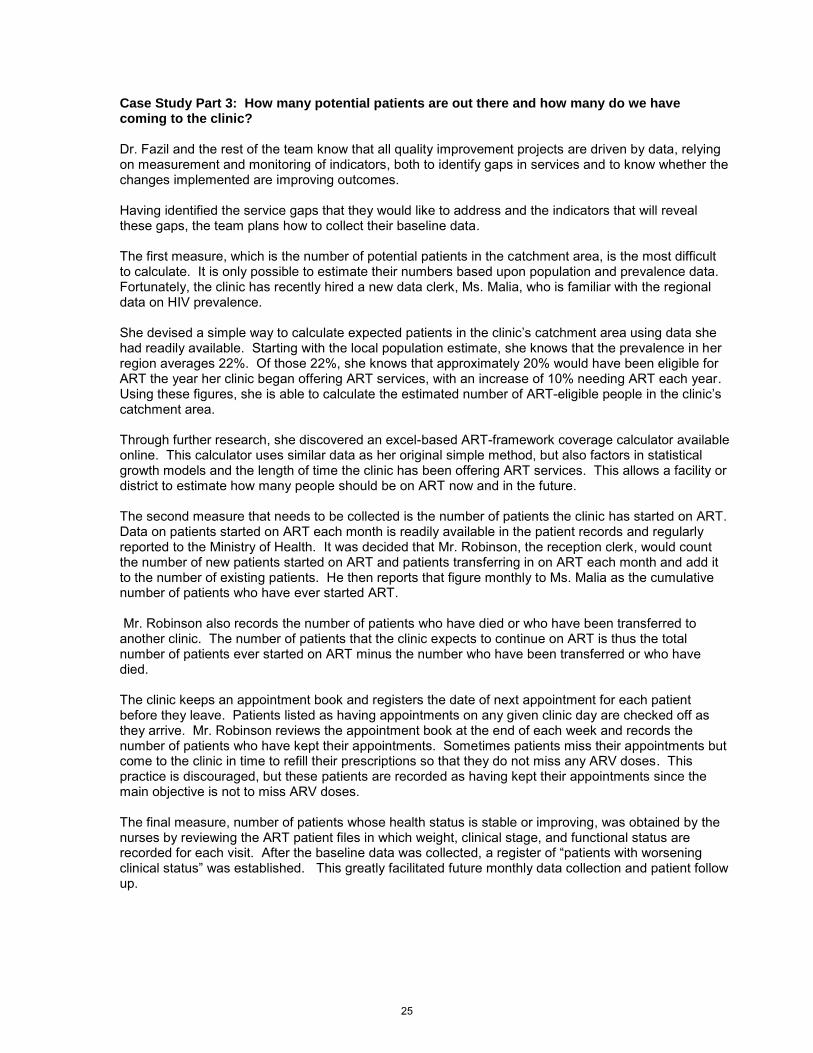
Using Time Series Charts in Gaps Analysis
• In Gaps Analysis: two or more data points are plotted together. These data points must be subsets of each other, representing potential and actual numbers of persons achieving specified healthcare goals
USAID HEALTH CARE IMPROVEMENT PROJECT
specified healthcare goals.
• The differences between the potential and the actual numbers along the time series lines represent the “gaps”.
Gap Analysis Framework for Improving Care for Patients on ART
1,200
1,400
1,600
1,800
s
# PLWHAs Eligible for ART(Should be)
Cummulative # of PLWHAsever started on ART
Expected # Picking up ARTthi th
Coverage Gap
USAID HEALTH CARE IMPROVEMENT PROJECT
-
200
400
600
800
1,000
Jan Feb Mar Apr May Jun Jul Aug Sep Oct Nov Dec Jan
Time (Month)
# of
PLW
HA
s this month
Actual # Picking up ART thismonth (Current PatientLoad)
# with Good ClinicalOutcome
Wellness Gap
Retention Gap
Exercise 4:Create a Gaps AnalysisTime Series Chart
Sample Data for Time-Series Charts:
Jan Feb Mar Apr May Jun
1 patients eligible for ART in the catchment area
800 810 820 830 840 850
2 Patients registered and started on ART
500 506 515 522 523 528
USAID HEALTH CARE IMPROVEMENT PROJECT
ART
3 patients expected to continue on ART
476 481 488 498 500 507
4 Patients that have attended their appointments
352 359 365 374 381 392
5 Patients with stable or improving health status
285 292 299 314 321 329
31

Case Study Part 4: Collecting and plotting the data The staff at the clinic began collecting data for the gap analysis so that they could discover the size of the gaps and consider the reasons for them before implementing changes. This also helped them establish a baseline so that they could determine whether their changes would actually lead to improvement. Because most of the data was readily available in the clinic, and staff worked together to collect it, they were able to collect six months worth of data before beginning their improvement activities. The data clerk prepared a time series chart using this first six months of data. She set up the chart with time running along the X-axis in increments of one month to match the frequency at which they planned to collect and plot data. Then she marked the Y-axis from zero up to the estimated number of potential patients, leaving room for that figure to grow over time. Each measure was then added to the bottom of the chart in the order originally identified, and the data was transferred here. After plotting all of the points and tracing a line showing the trend for each measure, a time series chart was created showing all the lines, each one running slightly below the last. Between these lines, the three critical gaps, coverage, retention, and wellness are clearly seen. After reviewing the data, Dr. Fazil and her team decided to make their aim statement more specific by quantifying targets for each critical gap:
“By the end of 6 months we will: 1) provide ART for 80% of those ART - eligible patients in our catchment area; 2) retain 80% patients started and expected to continue on ART; and 3) achieve good clinical outcomes for 90% patients retained on ART”
32
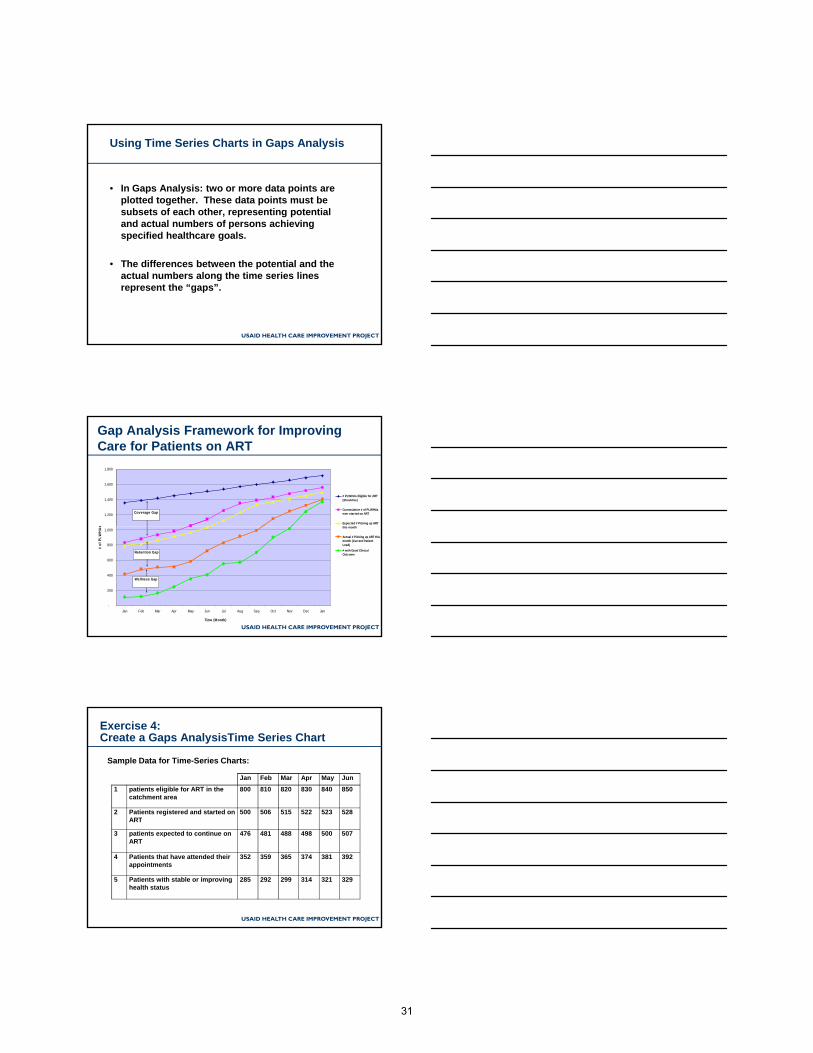
Example 4: Create your own time series chart
J F M A M J J A S O N D
1 patients eligible for
ART in the
catchment area
800 810 820 830 840 850 860 870 880 890 900 910
2 Patients registered
and started on ART 500 506 515 522 523 528
3 patients expected to
continue on ART 476 481 488 498 500 507
4 Patients that have
attended their
appointments
352 359 365 374 381 392
5 Patients with stable
or improving health
status
285 292 299 314 321 329
Once you plot your baseline data, you should be able to clearly see each of the critical gaps in the graph as the distance between each measure’s line:
Coverage gap (A): exists between the top-most line (measure 1) and the second line (measure 2)
Retention gap (B): exists between the middle line (measure 3) and the one below it (measure 4)
Wellness gap (C): exists between the second line from the bottom (measure 4) and the bottom line (measure 5)
Numbers of HIV-positive patients eligible for ART and in treatment at the
Basabasa clinic
1000
900
800
700
600
500
400
300
200
100
0
Coverage gap
Retention gap
Wellness gap
33

Exercise 4: Create your own time series chart Complete the blanks below with real or theoretical data to create the run chart for your improvement project. This can be done at your facility if you would like to use real data.
1
2
3
4
5
Once you plot your baseline data, you should be able to clearly see each of the critical gaps in the graph as the distance between each measure’s line:
Coverage gap (A): exists between the top-most line (measure 1) and the second line (measure 2)
Retention gap (B): exists between the middle line (measure 3) and the one below it (measure 4)
Wellness gap (C): exists between the second line from the bottom (measure 4) and the bottom line (measure 5)
(Title: Using your aim statement; try to include as much information as possible)
Mark your Y axis with patient numbers, remember to leave room for population/prevalence growth
Fill in your time periods in this row to mark the X-axis (months, weeks, days, etc.)
Fill in the name of each measure you identified earlier
34

Section 5: Understand Causes Behind the Gaps
35

Section 5:
1
Understand Causes Behind the Gaps
2*Nolan Model Diagram; Associates in Process Improvement (API)
Considerations in prioritizing which gaps to address first
• Size of gap
• Ease with which a change designed to address gaps can be implemented:– Are new resources needed?
USAID HEALTH CARE IMPROVEMENT PROJECT
– Is the necessary infrastructure in place?
– Do the problems leading to the gap need to be addressed at a higher level of the healthcare system?
• Urgency of reducing the gap
• Etc….
36

How to understand barriers to quality care
• Brainstorm individually and as a team• Review records (especially to understand gaps
in clinical outcomes)• Discuss with community-based organizations
and other members of the community
USAID HEALTH CARE IMPROVEMENT PROJECT
and other members of the community• Map patient journey through the health care
process • Discuss with patients, individually and in focus
groups• Etc....
EXAMPLE: To address the retention gap, the Basabasa clinic team brainstormed together then spoke with patients who had missed their appointments and with those who regularly kept their appointments
5
Why did you miss your last ART visit?
Examples of reasons reported: Total # %
•Transportation / distance barriers 27 56
•Conflicts with work schedule 11 23
•Too many visits 4 8
USAID HEALTH CARE IMPROVEMENT PROJECT
•Too many visits 4 8
•Too sick to travel to clinic 3 6
•“Feel fine” 1 2
•Death of loved one 1 2
•Moved to a different region 1 2
37

Pareto Chart of Reasons for Missing Visits
60
80
100
USAID HEALTH CARE IMPROVEMENT PROJECT
0
20
40
Distance WorkConflict
Too ManyVisits
Too Sick “Feel Fine" Death Moved
Percent Reporting Cumulative Percent
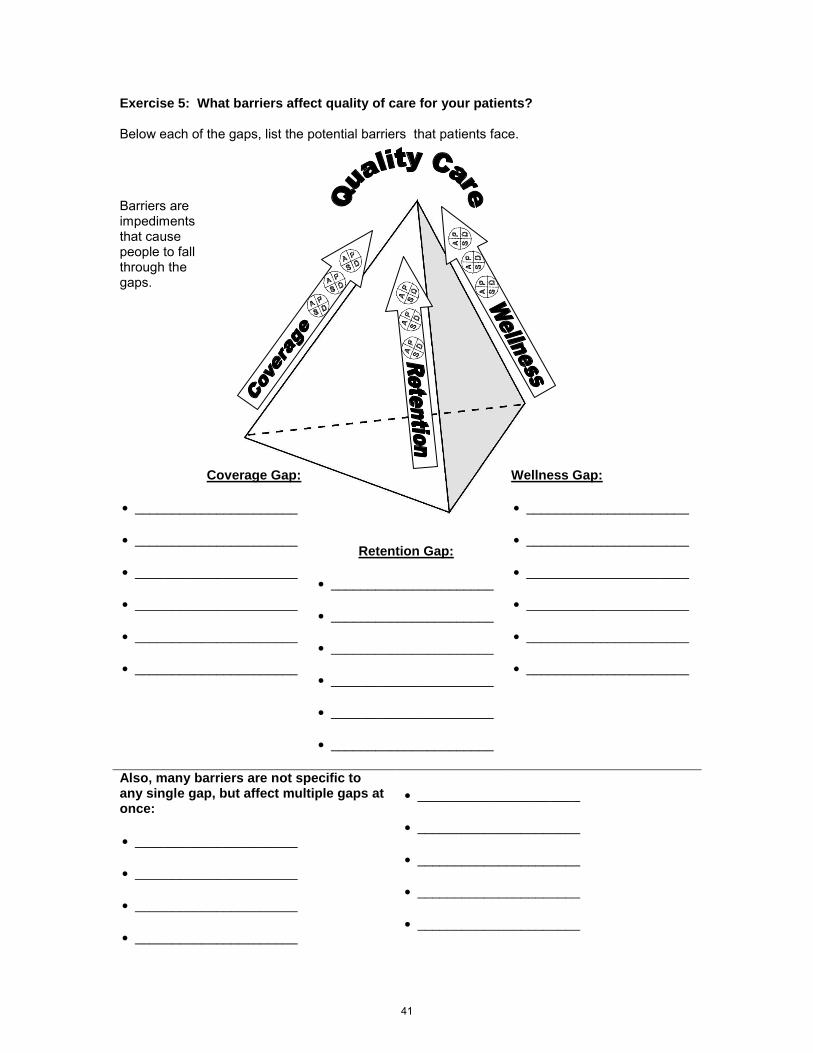
Exercise 5: What barriers affect quality of care for your patients?
In your workbook, below each of the gaps, list barriers that patients may face in accessing and
USAID HEALTH CARE IMPROVEMENT PROJECT
receiving quality ART services.
38

Case Study Part 5: Why do patients miss appointments? The staff of the Basabasa clinic reviewed the gaps together. Surprised at the size of the retention gap, they decided to focus on this one first. They brainstormed together to identify reasons for patients missing appointments. The consensus was that many of their patients do not fully understand the importance of keeping appointments and of not running out of ARVs. Most of the staff felt that they did not have the skills to effectively teach all of their patients about the importance of attending clinic regularly. They decided to request training on patient education from the District Health Management Team. The “expert patients” who worked in the clinic missed the brainstorming session. They did hear about it later, however, and they did not agree with the conclusions from the rest of the staff. They convinced the rest of the staff that the patients themselves should be given a voice in identifying the barriers that cause them to miss their own appointments. They then contacted patients who had missed their appointments and asked them to attend a focus group on barriers to coming to clinic for appointments. They gained much information from the patients attending this session about the true barriers to coming to clinic. Other patients who did regularly attend their appointments were asked what challenges they faced in coming to the clinic and what factors most helped them overcome these barriers. Through these voluntary patient interviews, the staff gained much knowledge on what barriers their patients face and on what interventions could potentially help them get past those barriers.
39

Example 5: What barriers affect quality of care for your patients? Below each of the gaps, list the potential barriers that patients face.
Barriers are impediments that cause people to fall through the gaps.
Coverage Gap:
transportation costs
stigma concerns
cost of treatment
knowledge of status
lack of community
awareness
limited hours that the
clinic is open
Wellness Gap:
Sharing medications
Cost of medication
Lack of clinical decision
making guidance
Lack of patient knowledge
of regimen / schedule
medication stock-outs
Poor linkage to TB care
Retention Gap:
Lack of reminders of
appointment dates
transportation costs
contact information
unavailable
inconvenient
scheduling
stigma concerns Also, many drivers and barriers are not specific to any single gap, but affect multiple gaps at once:
transportation costs
cost of treatment
CD4 test result availability
limited hours that the clinic is open
40
Exercise 5: What barriers affect quality of care for your patients? Below each of the gaps, list the potential barriers that patients face.
Barriers are impediments that cause people to fall through the gaps.
Coverage Gap:
______________________
______________________
______________________
______________________
______________________
______________________
Wellness Gap:
______________________
______________________
______________________
______________________
______________________
______________________
Retention Gap:
______________________
______________________
______________________
______________________
______________________
______________________
Also, many barriers are not specific to any single gap, but affect multiple gaps at once:
______________________
______________________
______________________
______________________
______________________
______________________
______________________
______________________
______________________
41

42

Section 6: Identify Changes to Close the Gaps
43

Section 6: Identify Strategies to Close the
1
Identify Strategies to Close the Gaps
2*Nolan Model Diagram; Associates in Process Improvement (API)
Considerations in prioritizing which barriers/problems to address first
• How much does it contribute to the overall problem?
• Is fixing it under your control?
USAID HEALTH CARE IMPROVEMENT PROJECT
• Does it require new resources?
• Are there feasible and sustainable solutions?
• Etc..
44

Developing Changes
• What change will you make?
• Why will this change result in an improvement? How will it work?
USAID HEALTH CARE IMPROVEMENT PROJECT
improvement? How will it work?
• What improvement will we expect to see as a results of this change? What do you think the result will be?
Retention example: What can we do to help you go to your next ART visit? (n=48)
Suggestions given by patients: # Reporting*
•Make drugs available closer to my community 22•Allow someone else to pick up drugs for me 15•Make clinic hours more convenient to my work 13
USAID HEALTH CARE IMPROVEMENT PROJECT
Make clinic hours more convenient to my work schedule
13
•Shorten my waiting time at clinic 9•Help me with transportation 7•Less frequent visits 4
*More than one answer possible; all answers tabulated above
Who can most influence these barriers to retention?
ART Clinic/
Hospital
Policy/ Ministry of
Health
Community/CHW
Partners/NGOs
Local govt/health district
Transportation / distanceX X X X
Conflicts with other bli ti ( k f il
X X
USAID HEALTH CARE IMPROVEMENT PROJECT
obligations (work, family crises, etc)
Too many visitsX X
Too sick to travel to clinicX X X X X
“Feel fine”X X X
Moved to a different region
X X
45

What can we do to help you go to your next ART visit? (n=48)
Suggestions given by patients: # Reporting*
•Make drugs available closer to my community
22
•Allow someone else to pick up drugs for me 15
USAID HEALTH CARE IMPROVEMENT PROJECT
•Make clinic hours more convenient to my work schedule
13
•Shorten my waiting time at clinic 9•Help me with transportation 7•Less frequent visits 4
*More than one answer possible; all answers tabulated above
More convenient clinic hours •Add evening & Saturday clinics
Drugs closer to community •Dispense treatment to health posts•Mobile clinics
Help with transportation •Work with NGO or community groups to set up weekly shuttle
Possible Solutions for Testing:
USAID HEALTH CARE IMPROVEMENT PROJECT
groups to set up weekly shuttle service•Arrangement with taxi company
Shorter waiting times •Elective appointment system•Triage system
Allow others to pick up drugs •Change policy to allow third party dispensing
Less frequent visits •Dispense three month supply per visit for eligible patients
Exercise 6: What can you change to improve services at your facility?
In your workbook, fill in the changes table with at least three proposed changes.
USAID HEALTH CARE IMPROVEMENT PROJECT
46

Case Study Part 6: What should we change about our clinic? Now that the clinic staff clearly understood the gaps and identified the most common barriers that patients face at each gap, they decided to brainstorm about what changes they could implement to try to close the critical gaps. Also, once they realized the value of patient input in identifying barriers, they engaged many patients in identifying changes to overcome these barriers. The team listed a number of potential changes, including changing the clinic setup to protect the privacy of patients and setting up a tracking system for patients who miss visits. The team analyzed each change by looking at the barrier it directly affected and the gap that it was intended to close. The team also listed who was responsible and which stakeholders may be necessary to help implement the changes. At the end of their meeting together, staff identified the most significant changes that they would be able to implement quickly within their existing resources. They circled those changes on their list.
47

Example 6: What can you change to improve services at your facility? Use the tables below to help you brainstorm about possible changes and link them to the barriers they affect and the gaps that they are designed to close. Change proposed What barriers does it
affect? What gap(s) will it reduce?
Who are the stakeholders and who can implement this change?
Make clinic
entrance more
private
Stigma
concerns
Coverage and
retention
Clinic director,
admin staff,
district
administrator
Improve clinic
record keeping
Contact
information and
scheduling
ability
Retention Data clerk and
reception nurse
Give patients a
longer supply of
medicine
Too frequent
visits leading to
high transport
costs
Retention Doctors, nurses,
pharmacist
Stay open
longer hours
Limited hours
that the clinic is
open
Coverage,
retention, and
wellness
All clinic staff,
district
administrator The following table is intended as a parking lot for you to keep track of future potential changes and barriers that need more research on how to best affect them. Barrier or suggested change that needs more research or resources
What additional information or resources are needed?
Who can take charge of this and where could they find the additional information or resources?
Transportation costs a shuttle vehicle or
funds to pay for
private transportation
The clinic director can
request assistance
and funds from the
ministry
Availability of medicine
in the community
vendors or mobile
clinic to distribute
meds
The district health
team can appeal to the
ministry or donors
48

Exercise 6: What can you change to improve services at your facility? Use the tables below to help you brainstorm about possible changes and link them to the barriers they affect and the gaps that they are designed to close. Change proposed What barriers does it
affect? What gap(s) will it reduce?
Who are the stakeholders and who can implement this change?
The following table is intended as a parking lot for you to keep track of future potential changes and barriers that need more research on how to best affect them. Barrier, or suggested change that needs more research or resources
What additional information or resources are needed?
Who can take charge of this and where could they find the additional information or resources?
49

50

Section 7: Test and Implement Changes using PDSA Cycles
51
Section 7: Test and Implement Changes
1
Test and Implement Changes using PDSA Cycles
2*Nolan Model Diagram; Associates in Process Improvement (API)
Why test? Act Plan
The PDSA CycleThe PDSA Cycle
USAID HEALTH CARE IMPROVEMENT PROJECT
Study Do
52

QIQI methodologymethodologyTest and Implement Changes
Analysis - Collect and analyze data to answers the questions:
USAID HEALTH CARE IMPROVEMENT PROJECT
Is the change significant?Is the change significant?
Did the changes lead to Did the changes lead to improvement?improvement?
YesYes
YesYesNoNo
NoNoDevelop Develop OtherOther ChangesChanges
Adapt the change Adapt the change and conduct anotherand conduct another
testtest
Keep the changesKeep the changesDevelop new Develop new
changeschanges
Testing a changeTesting a change
1. Test BIG changes on an initially small scale (for example with one or a few patients), then ramp up.
2. Test individual changes separately when possible.
USAID HEALTH CARE IMPROVEMENT PROJECT
3. Negative results are an opportunity to learn.
4. Think about how conditions change over time (monthly, seasonal patterns, external variables).
Exercise 7: Prepare your PDSA journal
In your workbook, fill in the details that will help you establish a complete and useful PDSA journal for your improvement project
USAID HEALTH CARE IMPROVEMENT PROJECT
PDSA journal for your improvement project.
53

Case Study Part 7: Making a difference and keeping track of changes After this work, the staff of the Basabasa clinic were able to implement changes and test the results of each change. The first set of changes that they decided to implement was to relocate the clinic entrance and increase privacy for visitors and to add more hours and flexibility for appointments. As they started their first round of PDSA cycles to test these changes, the team decided to keep track of the changes and their results in a PDSA journal. This journal records the details of each change, how it was implemented, how well it worked, what the results were, and other important information for their team to know. Each month when the team gathered to review their time series charts, this journal helped them link the effects they saw on the time series chart with the actual changes made at the clinic.
54

Example 7: Prepare your PDSA journal For the PDSA journal to be useful, it must be regularly maintained by team members familiar with the changes being implemented. How will your journal be maintained? Who will write it? How will it be written? How often will it be
updated? What resources are needed to write it?
The supervising
nurse
In a notebook to
be kept in
central files
Every
improvement
team meeting
and PDSA cycle
A notebook and
one hour time for
the nurse after
team meetings For a PDSA journal to be worthwhile, it must be reviewed and used in a regular fashion by the team. How will your PDSA journal be used? How/where will it be shared with staff?
Who will be responsible for sharing it?
How often will it be shared/discussed?
What is the agenda/purpose of sharing it?
Previous entries
will be read
during
improvement
team meetings
The clinic
director
Improvement
team meetings
will happen once
every three
months
Discuss previous
changes in
relation to new
data and use to
suggest new
changes For a PDSA journal to be complete, it must contain certain qualitative details about what is going on in the clinic. The following format illustrates a typical PDSA journal: What change was implemented
When was it implemented
How was it implemented
What results or other important lessons were learned in the process
What do you plan to do next?
Make clinic
entrance
more private
July The entrance
was relocated
to a back
door of the
facility, not
in view of the
street
The waiting
room should
also be
shielded
from the
street
Put up an
additional
wall or
privacy
screen
55

Exercise 7: Prepare your PDSA journal For the PDSA journal to be useful, it must be regularly maintained by team members familiar with the changes being implemented. How will your journal be maintained? Who will write it? How will it be written? How often will it be
updated? What resources are needed to write it?
For a PDSA journal to be worthwhile, it must be reviewed and used in a regular fashion by the team. How will your PDSA journal be used? How/where will it be shared with staff?
Who will be responsible for sharing it?
How often will it be shared/discussed?
What is the agenda/purpose of sharing it?
For a PDSA journal to be complete, it must contain certain qualitative details about what is going on in the clinic. The following format illustrates a typical PDSA journal: What change was implemented
When was it implemented
How was it implemented
What results or other important lessons were learned in the process
What do you plan to do next?
56

Section 8: Monitor Results and Continue to Act
57

Section 8: Monitor Results and Continue to
1
Monitor Results and Continue to Act
2*Nolan Model Diagram; Associates in Process Improvement (API)
– There is always room for improvement
– There are always more changes or updates to the system
QI is not a finite processQI is not a finite process
USAID HEALTH CARE IMPROVEMENT PROJECT
– We can all learn from others’ experiences
– A stagnant system develops new inefficiencies over time
58
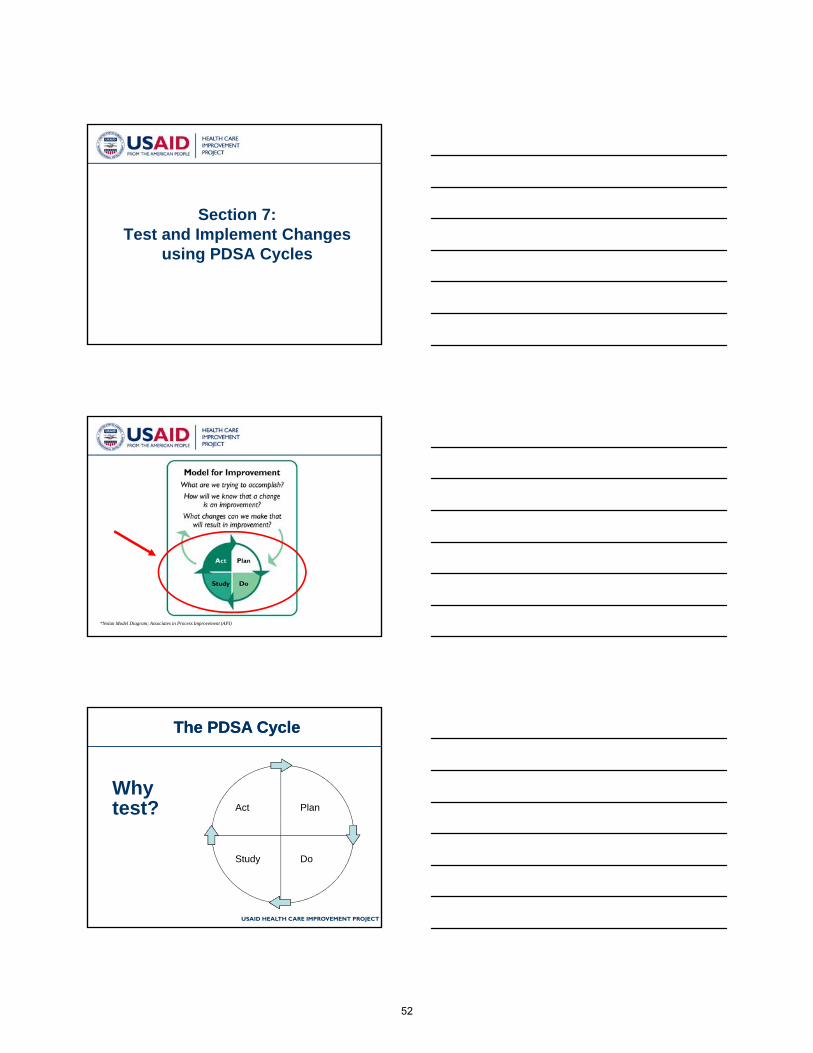
1200
1400
1600
1800
Elective Appointment System
Mobile clinics / ART Drugs made available at health posts
nts
4
0
200
400
600
800
1000
Jan Feb Mar Apr May Jun Jul Aug Sep Oct Nov Dec Jan
Cumulative # of PLWHAs ever started onARTExpected # Picking up ART this month
Actual # Picking up ART this month(Current Patient Load)
Third Party Dispensing
Dispensed 3 month supply of ART meds at a time instead of 1 month
Taxi / Shuttle Service
Added evening & Saturday clinics
Time (Months)
# Pa
tien
Findings from Nicaragua
5
g
ART Framework Data: Chinandega, NicaraguaBaseline, January - September 2008
80
100
120
140
160
180
Num
ber o
f PLW
HA
on
AR
T
USAID HEALTH CARE IMPROVEMENT PROJECT
0
20
40
60
Jan Feb Mar Apr May Jun Jul Aug Sep
Months in 2008
Estimated ART Eligible (0.20% National Prevalence) Ever Started on ART
Patients Expected Patients Retained on ART
Healthy Clinical Outcomes
59

Chinandega: Time to Death after Initiating ART (n=166)
USAID HEALTH CARE IMPROVEMENT PROJECT
Table 3. Mortality for Patients on ART at Hospital Espana (n=33)
Deaths of patients <3 months on ART, n (%) 25 (75.8)
Death of patients >3 to <6 months on ART, n (%) 3 (9.1)
Death of patients >6 to <12 months on ART, n (%) 2 (1.2)
Death of patients 12 months on ART, n (%) 3 (9.1)
Causes Reported by ART Patients for Poor CoverageNicaragua, July 2009 (n=9)
10
12
14
16
18
20
50%
60%
70%
80%
90%
100%
USAID HEALTH CARE IMPROVEMENT PROJECT
0
2
4
6
8
Lack of Knowledge EmploymentDiscrimination
Not offered test untilsick
Not starting ART Stigma &Discrimination
Poor testcounseling
Not receiving testresults
0%
10%
20%
30%
40%
Causes for Poor Coverage Cumulative Percent
Data from the real story behind the
t d
9
case study
60
Causes Reported by ART Patients for Missing Clinic Visits (n=23)Sabasaba Health Center in Tanzania, April 2009
15
20
25
ts R
epor
ting
50
60
70
80
90
100
ativ
e Pe
rcen
t
USAID HEALTH CARE IMPROVEMENT PROJECT
0
5
10
Transportation Stimga /Discrimination
Lack of SocialSupport
Economic Factors Family / SocialObligations
Work Schedule Lack of HIVEducation
Causes
# Pa
tient
0
10
20
30
40
% C
umul
Frequency Reporting Cumulative Percent
250
300
350
400
450
500Gaps Analysis Framework for Improving ART Care
Relocate clinic in hospital
Counsel patients to
keep follow-up appt.s
ctiv
ities
, Apr
il, 2
009
.
D
SA
PP = Plan, D = Do, S = Study, A = Act
Added clinic day for ART appt.s
D
SA
P D
SA
P
D
SA
P
DP
USAID HEALTH CARE IMPROVEMENT PROJECT
0
50
100
150
200
J F M A M J J A S O N D J F M A M J J A S O N D J F M A M J J A S O N D J F M A M J J A S O N D
Patients Ever Started on ART at this Facility
Patients expected to continue ART
Patients on ART keeping appointments as scheduled and continuing treatment
Patients on ART with stable or improving clinical outcome
Star
t of Q
I A
Increased documentation of clinical status
Full-time physician available
Volunteers follow-up with missed appt.s
Follow-up missed appt.s
by phone
D
SA
PD
SA
P
D
SA
P D
SA
P
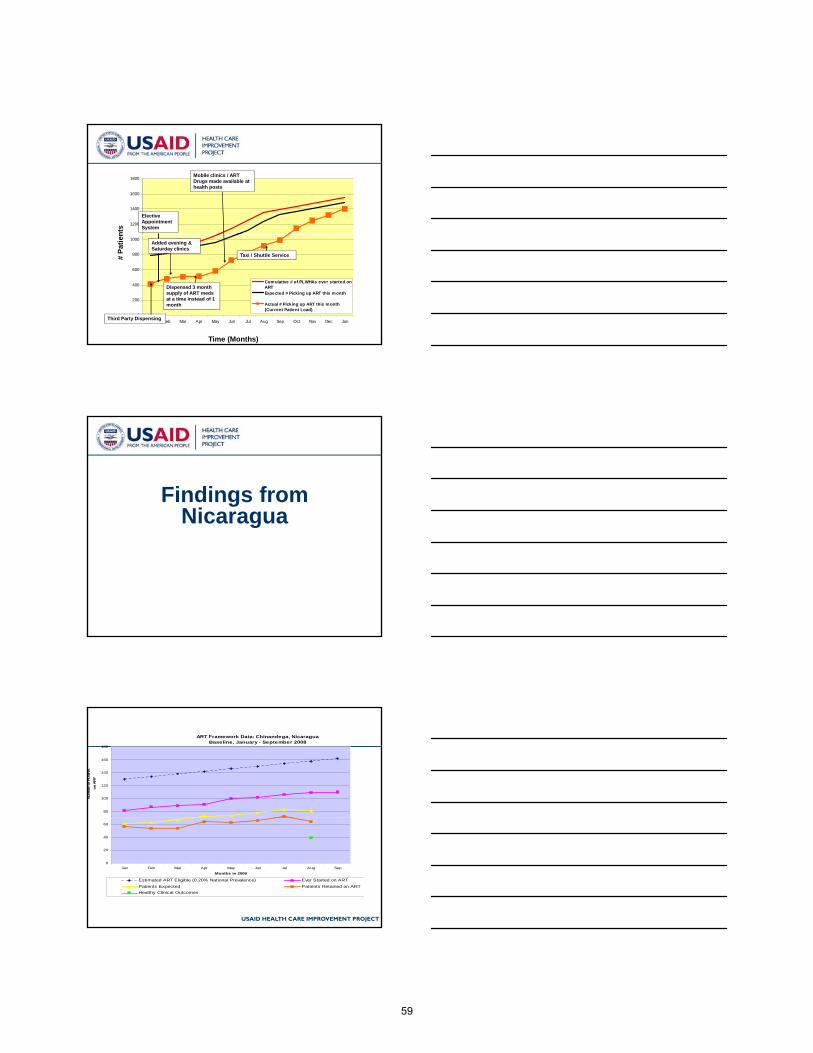
Next Steps…– Connect with the HCI Knowledge
Management Website and online community of practice:
12
community of practice:www.hciproject.org/improvinghivcare
– Share Contact Information
– Explore the Available MaterialsImplement Your Project
61
8000
10000
12000
14000
16000
18000
Num
ber
1st Ante natal visits # Pre test counseled # Tested # Post-test counseled # Tested +
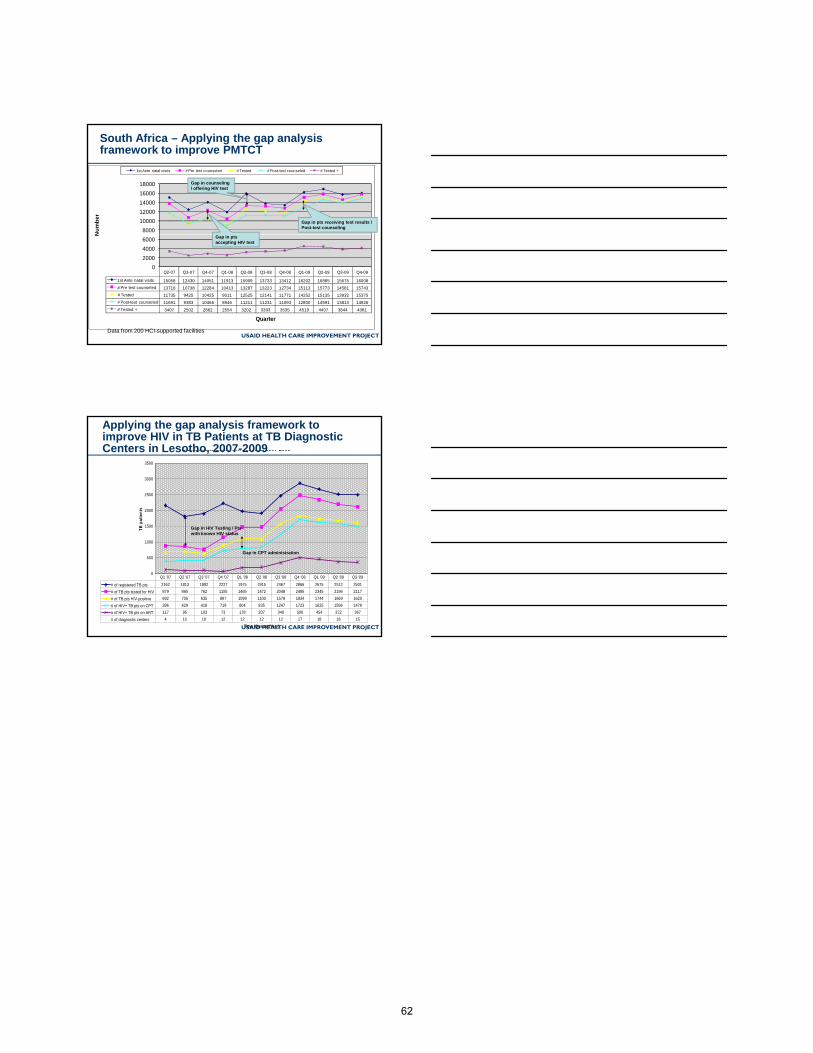
South Africa – Applying the gap analysis framework to improve PMTCT
Gap in counseling / offering HIV test
Gap in pts receiving test results / Post-test counseling
USAID HEALTH CARE IMPROVEMENT PROJECT
Q2-07 Q3-07 Q4-07 Q1-08 Q2-08 Q3-08 Q4-08 Q1-09 Q2-09 Q3-09 Q4-09
1st Ante natal visits 15058 12430 14051 11913 15909 13733 13412 16202 16885 15675 16008
# Pre test counseled 13718 10738 12284 10413 13287 13223 12734 15113 15773 14581 15743
# Tested 11735 9425 10425 9011 12525 12141 11771 14252 15135 13932 15375
# Post-test counseled 11691 9383 10466 8946 11211 11231 11093 12800 14591 13813 14926
# Tested + 3407 2502 2862 2554 3202 3393 3535 4519 4407 3844 4081
0
2000
4000
6000
N
Quarter
Data from 200 HCI-supported facilities
Gap in pts accepting HIV test
Trend of TB patients tested for HIV, testing positive, on CPT and on ART TB Diagnostic Centers in Lesotho, 2007-2009
1500
2000
2500
3000
3500
B p
atie
nts
Applying the gap analysis framework to improve HIV in TB Patients at TB Diagnostic Centers in Lesotho, 2007-2009
USAID HEALTH CARE IMPROVEMENT PROJECT
0
500
1000
1500
Time (Quarter/Year)
TB
# of registered TB pts 2162 1813 1892 2227 1975 1915 2467 2866 2675 2512 2501
# of TB pts tested for HIV 879 865 762 1155 1465 1472 2048 2485 2345 2196 2117
# of TB pts HIV-positive 692 705 635 897 1099 1100 1578 1834 1744 1669 1620
# of HIV+ TB pts on CPT 396 429 418 719 804 835 1247 1723 1625 1596 1479
# of HIV+ TB pts on ART 117 95 103 73 178 207 340 500 454 372 367
# of diagnostic centers 4 10 10 12 12 12 12 17 18 18 15
Q1 '07 Q2 '07 Q3 '07 Q4 '07 Q1 '08 Q2 '08 Q3 '08 Q4 '08 Q1 '09 Q2 '09 Q3 '09
Gap in HIV Testing / Pts with known HIV status
Gap in CPT administration
62

Case Study Part 8: Try, try, and try again Part 1 – The first round of changes After the first round of changes, the team met three months later and discussed the results on their time series chart and what exactly led to those results as recorded in their PDSA journal. While some possible improvements were visible in the time series chart, the team wanted to see more improvement and decided to continue implementing changes. The existing changes were kept because there appeared to be an improvement in both coverage and retention as a result of the new entrance location. To address more of the gaps and their drivers and barriers, the team agreed upon two new changes during their meeting. They would first add new clinic hours on Thursdays and Saturdays (the clinic was previously not open on those days), and they would add a schedule of appointments to each patient’s file. The decisions on existing and new changes and the effects that the staff expect to see were noted in their PDSA journal.
63

Example 8: Continuing to close the gaps Part 1 – The first round of changes
J F M A M J J A S O N D
1 Patients eligible for
ART in the catchment
area
800 810 820 830 840 850 900 910 920
2 Patients registered and
started on ART 500 506 515 522 523 528 556 602 630
3 Patients expected to
continue on ART 476 481 488 498 500 507 527 568 599
4 Patients that have
attended their
appointments
352 359 365 374 381 392 436 476 502
5 Patients with stable or
improving status 285 292 299 314 321 329 349 377 404
What change was implemented
When was it implemented
How was it implemented
What results or other important lessons were learned in the process
What do you plan to do next?
Make clinic
entrance more
private
July The entrance was
relocated to a
back door of the
facility
The waiting room
should also be
shielded from the
street
Put up an
additional wall
or privacy
screen
Extended
clinic hours
October Added Thursday
and Saturday
hours
Staff time needs to be
rescheduled
Adjust work
schedules
Improved
record
keeping
October Added contact
and schedule
sheets
Resources needed to
contact patients
find funds to
cover phone
calls
Numbers of HIV patients eligible for ART and in treatment at the Basabasa clinic
1000
900
800
700
600
500
400
300
200
100
0
Coverage gap
reduced
Retention gap
reduced
Wellness gap
remains the same
64

Case Study Part 8: Try, try, and try again Part 2 – Learning and continuing to implement changes When the team met again, they had a lot more data and changes to discuss, along with a time series plot that started to show a clear improvement in the number of patients with stable or improving health status. As a result of this data, the staff agreed to keep in place the changes made to date. Two new changes that the team wanted to try were making ART medications available at community health posts and mobile clinics and establishing a taxi/shuttle service to overcome transportation problems. Initially, the clinic was not able to influence the availability of ART medications as health posts and mobile clinics were not allowed to dispense ART. Since that time, the district health team has accredited some health posts so the clinic staff decided to partner with them to distribute more ART medications closer to patients. For those patients who still did not have access to the health posts or mobile clinics, a small amount of funding was secured from a partner to finance taxi shuttle services to bring those patients to the clinic. These changes were also recorded in the PDSA journal so that the next time the team met, they would be able to compare the changes implemented against the results in their time series chart. Also, as a result of the changes already in place, it was time for the team to reevaluate the process that patients follow and the barriers they encounter along the way. A new analysis of their situation at this point will generate a new set of priorities and possible changes that the team will continue to implement using the gap analysis framework.
65
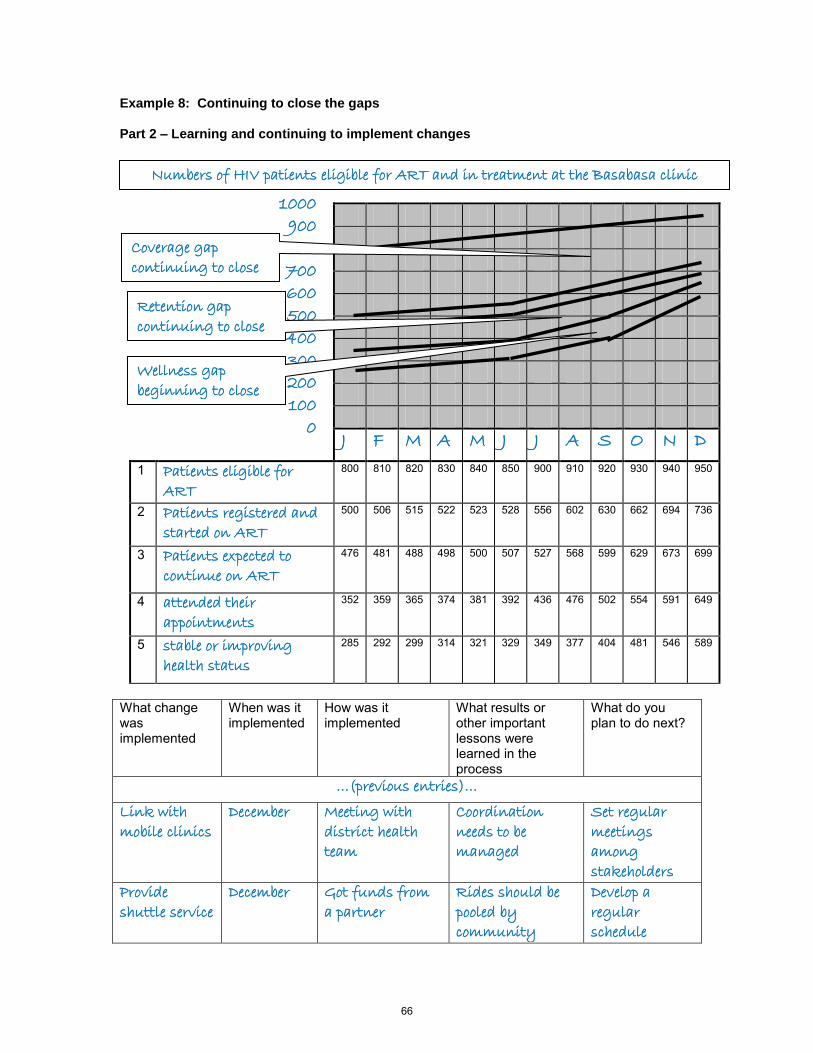
Example 8: Continuing to close the gaps Part 2 – Learning and continuing to implement changes
J F M A M J J A S O N D
1 Patients eligible for
ART 800 810 820 830 840 850 900 910 920 930 940 950
2 Patients registered and
started on ART 500 506 515 522 523 528 556 602 630 662 694 736
3 Patients expected to
continue on ART 476 481 488 498 500 507 527 568 599 629 673 699
4 attended their
appointments 352 359 365 374 381 392 436 476 502 554 591 649
5 stable or improving
health status 285 292 299 314 321 329 349 377 404 481 546 589
What change was implemented
When was it implemented
How was it implemented
What results or other important lessons were learned in the process
What do you plan to do next?
…(previous entries)…
Link with
mobile clinics
December Meeting with
district health
team
Coordination
needs to be
managed
Set regular
meetings
among
stakeholders
Provide
shuttle service
December Got funds from
a partner
Rides should be
pooled by
community
Develop a
regular
schedule
Numbers of HIV patients eligible for ART and in treatment at the Basabasa clinic
1000
900
800
700
600
500
400
300
200
100
0
Coverage gap
continuing to close
Retention gap
continuing to close
Wellness gap
beginning to close
66

Case Study Epilogue: The Real Story The small clinic described in this case study actually exists and continues to work on improving their ability to treat more patients by closing the coverage, retention, and wellness gaps. The specific changes they implemented and the results they obtained were far more extensive and detailed than this case study suggests, however their ability to improve the quality of services at their clinic and increase the number of patients successfully treated. Their ongoing work continues to generate more changes and effective results. They recently developed additional algorithms for AIDS management, together with the tangible results from the completed relocation and privacy walls. During the latest visit to the clinic, the staff said they were all very motivated by the work and the results they are seeing. The actual time series chart from the clinic is below. While the real clinic was new and did not begin with the higher patient numbers used in the fictional case study, they did use and are continuing to use the Gap Analysis Framework to monitor their progress as described in the case study. The gaps, some of the interventions, and the real results that they have been achieving are noted below:
0
50
100
150
200
250
300
350
400
450
500
J F M A M J J A S O N D J F M A M J J A S O N D J F M A M J J A S O N D J F M A M J J A S O N D
Patients Ever Started on ART at this Facility
Patients expected to continue ART
Patients on ART keeping appointments as scheduled and continuing treatment
Patients on ART with stable or improving clinical outcome
Gaps Analysis Framework for Improving ART Care
Relocate clinic in hospital
Counsel patients to
keep follow-up appt.s
Sta
rt o
f Q
I A
ctiv
itie
s, A
pri
l, 2
00
9
.
D
SA
P
P = Plan, D = Do,
S = Study, A = Act
Increased documentation of clinical status
Full-time physician available
Volunteers follow-up with missed appt.s
Added clinic day for ART appt.s
Follow-up missed appt.s
by phone
D
SA
P D
SA
P
D
SA
P
D
SA
PD
SA
P
D
SA
P D
SA
P
67


USAID HEALTH CARE IMPROVEMENT PROJECTUniversity Research Co., LLC
7200 Wisconsin Avenue, Suite 600Bethesda, MD 20814
Tel: (301) 654-8338Fax: (301) 941-8427www.hciproject.org