implementation study of smaller learning … study of smaller learning communities final report by...
TRANSCRIPT

U.S. Department of Education
Implementation Study of Smaller Learning Communities
Final Report

Implementation Study of Smaller Learning Communities
Final Report
By Lawrence Bernstein
Mary Ann Millsap Jennifer Schimmenti
Lindsay Page Abt Associates, Inc. Cambridge, Mass.
Prepared for U.S. Department of Education
Office of Planning, Evaluation and Policy Development Policy and Program Studies Service
2008

This report was prepared for the U.S. Department of Education under Contract No. ED-00-CO-0085 by Abt Associates, Inc. James Maxwell served as the contracting officer's representative. The views expressed herein do not necessarily represent the positions or policies of the Department of Education. No official endorsement by the U.S. Department of Education of any product, commodity, service or enterprise mentioned in this publication is intended or should be inferred.
U.S. Department of Education Margaret Spellings Secretary
Office of Planning, Evaluation and Policy Development Bill Evers Assistant Secretary
Policy and Program Studies Service Alan L. Ginsburg Director
Program and Analytic Studies Division David Goodwin Director May 2008 This report is in the public domain. Authorization to reproduce it in whole or in part is granted. While permission to reprint this publication is not necessary, the citation should be: U.S. Department of Education, Office of Planning, Evaluation and Policy Development, Policy and Program Studies Service, Implementation Study of Smaller Learning Communities, Final Report. Washington, D.C., 2008. This report is available on the Department’s Web site at: http://www.ed.gov/about/offices/list/opepd/ppss/reports.html. On request, this publication is available in alternate formats, such as Braille, large print, or computer diskette. For more information, please contact the Department’s Alternate Format Center at 202-260-0852 or 202-260-0818.

iii
Contents
List of Exhibits.......................................................................................................................vii Acknowledgments ...................................................................................................................xi Executive Summary ............................................................................................................................. 1
Smaller Learning Communities Program .................................................................................... 1 SLC Early Implementation Study Design.................................................................................... 3 Major Study Findings .................................................................................................................. 4
Implementation Findings................................................................................................... 4 APR Data on Outcomes................................................................................................... 12
Sustainability of SLCs ............................................................................................................... 16
Chapter 1 Introduction ...................................................................................................................... 17 Organization of the Report......................................................................................................... 17 Federal Smaller Learning Communities Program...................................................................... 17 The Implementation Study of Smaller Learning Communities ................................................. 19
Conceptual Framework.................................................................................................... 19 Related Research........................................................................................................................ 22
School Size ...................................................................................................................... 22 School Restructuring, Reorganization, and Smaller Learning Communities .................. 22 Facilitators and Challenges in Implementing Smaller Learning Community Reforms... 24
Chapter 2 Study Design and Sample ................................................................................................ 25 Overview of the Study Design and Measures ............................................................................ 25
Annual Performance Report ............................................................................................ 26 Periodic Implementation Survey ..................................................................................... 27 Case Studies..................................................................................................................... 28
School and Student Characteristics in Cohort 1 SLC Schools................................................... 30 Generating National Comparisons................................................................................... 30 Geographical Location .................................................................................................... 30 School Size ...................................................................................................................... 33 Ethnicity .......................................................................................................................... 34 Other Demographic Characteristics: Limited English Proficiency and Students With Disabilities.................................................................................................................. 36
Chapter 3 Implementation of Smaller Learning Communities, 2000–03: Survey Results......... 39 Introduction................................................................................................................................ 39
Note on Interpreting Implementation Findings ............................................................... 40 Why Have Schools Chosen to Apply for Federal SLC Funds and Implement an SLC? ........... 40
Student Academic Performance ...................................................................................... 41 Student Behavior ............................................................................................................. 42 School and External Goals .............................................................................................. 42
What Structures and Strategies Have SLC Schools Implemented? ........................................... 43 Changes in SLC Structures Implemented Over Time ..................................................... 44 Types of SLC Schools ..................................................................................................... 47 Student Participation in SLC Structures .......................................................................... 48 SLC Strategies Implemented and Student Participation.................................................. 49

iv
Meeting the Other Goals of SLC Legislation............................................................................ 52 Increasing Personalization .............................................................................................. 52 Providing Professional Development to Teaching Staff ................................................. 58 Including Community Representatives and Parents to Facilitate Activities ................... 61
Facilitating and Inhibiting Factors in SLC Implementation ...................................................... 66 Facilitating Factors in SLC Implementation ................................................................... 66 Inhibiting Factors in SLC Implementation ..................................................................... 70
Chapter 4 Implementation of Two Common SLC Structures: Career and Freshman Academies...................................................................................................................................... 73
Introduction ............................................................................................................................... 73 Key Features of Career Academy Implementation ................................................................... 74
Separate Identity for Career Academies ......................................................................... 74 Autonomy Over SLC Program Policies .......................................................................... 76 Integration of Academic and Vocational Instruction ...................................................... 79 Work-Based Learning Opportunities .............................................................................. 83 Common Planning Time for Teachers ............................................................................ 85 Demographics of Student Enrollment ............................................................................. 86
Levels of Career Academy Implementation .............................................................................. 88 “High Implementing” Career Academies ....................................................................... 89 “Moderately Implementing” Career Academies ............................................................. 89 “Low Implementing” Career Academies ........................................................................ 91
Key Features of Freshman Academy Implementation .............................................................. 93 Common Planning Time in Freshman Academies.......................................................... 94 Separate Identity for Freshman Academies .................................................................... 95 Autonomy for Freshman Academy Programs................................................................. 96 Demographics of Student Enrollment ............................................................................. 98
Levels of Freshman Academy Implementation....................................................................... 100 “High Implementing” Freshman Academies ................................................................ 100 “Moderately Implementing” Freshman Academies...................................................... 101 “Low Implementing” Freshman Academies ................................................................. 101
Career Academies and Freshman Academies: Variation in Program Features ...................... 102 Decision-Making in Career and Freshman Academies................................................. 102 Separate Identity in Career and Freshman Academies.................................................. 103 Common Planning Time ............................................................................................... 104
Factors Affecting the Implementation of Career and Freshman Academies........................... 105 Reform Leadership at the School Level........................................................................ 106 Staff Buy-In................................................................................................................... 107 District Leadership for SLC Changes ........................................................................... 107 The Role of Professional Development ........................................................................ 109 Graduation Requirements and State Assessments ........................................................ 109 Managing Limited Resources ....................................................................................... 110
Chapter 5 Changes in Student Outcomes: Analysis of Annual Performance Reports............. 111 Introduction ............................................................................................................................. 111
Data Requirements ........................................................................................................ 112 Methodology ................................................................................................................. 112 Caveats to Interpreting Trends ...................................................................................... 113
v
Student Academic Achievement Outcomes............................................................................. 115 Statewide Assessment.................................................................................................... 115 College Entrance Exams................................................................................................ 119
Achievement of Academic Milestones .................................................................................... 123 Ninth-Grade Promotion Rate......................................................................................... 123 Graduation Rate (Based on 9th-Grade and 12th-Grade Enrollment of Graduating Cohort) .................................................................................................................. 124 Participation in Postsecondary Education ..................................................................... 125
School-Related Behaviors........................................................................................................ 127 Average Daily Attendance............................................................................................. 127 Involvement in Extracurricular Activities ..................................................................... 127 Incidence of Student Violence, Drug or Alcohol Use, and Disciplinary Action........... 129
Chapter 6 Summary Findings and Future Directions .................................................................. 133 Major Study Findings .............................................................................................................. 133
SLC Schools Compared to Large High Schools Nationwide ........................................ 133 Overview of SLC Implementation ................................................................................ 133 Factors Affecting Overall Implementation.................................................................... 134 Implementation of Career and Freshman Academies.................................................... 135 Changes in Student Outcomes....................................................................................... 136 Overall Extent of SLC Implementation......................................................................... 137
Where Do SLCs Go From Here? ............................................................................................. 137 Sustainability of School- and Classroom-Level Changes ............................................. 138 Lessons Learned for Districts and Schools.................................................................... 140 Implications for the SLC Program................................................................................. 142
Next Steps for the Implementation Study ................................................................................ 143
References ......................................................................................................................................... 145

vi

vii
Exhibits
Exhibit ES.1 Minority Enrollment of SLC Cohort 1 Schools, Compared With Large U.S. High Schools.....................................................................................................................
4
Exhibit ES.2 Percentages of SLC Schools Implementing Each Type of SLC Structure.............. 5Exhibit ES.3 Percentage of SLC Schools Implementing Each Type of SLC Strategy, Alone or
in Combination With a Comprehensive “Structure”................................................
6Exhibit ES.4 Percentage of SLC Schools Reporting Specific Mechanisms to Foster
Personalization.........................................................................................................
7Exhibit ES.5 Percentage of Students Involved in Extracurricular Activities in Average SLC
School.......................................................................................................................
13Exhibit ES.6 Promotion Rate from 9th to 10th Grade in Average SLC School............................ 14Exhibit ES.7 Incidence of School Violence per 100 Students in Average SLC School............... 15Exhibit ES.8 Percentage of Graduates Intending to Attend Two- or Four-Year Colleges in
Average SLC School................................................................................................
16Exhibit 1.1 Conceptual Model, Implementation Study of Smaller Learning Communities…... 20Exhibit 1.2 Allowable Smaller Learning Community Structures and Strategies as Defined by
SLC Program...........................................................................................................
21Exhibit 2.1 Timeline for Implementation Study of Smaller Learning Communities by Data
Collection Method....................................................................................................
26Exhibit 2.2 SLC Grantees—Cohort 1......................................................................................... 31Exhibit 2.3 Geographical Regions of SLC Schools Compared to Large U.S. High Schools…. 32Exhibit 2.4 Urbanicity of SLC Schools Compared to Large U.S. High Schools…………….... 32Exhibit 2.5 Demographic Characteristics of SLC Schools and National Comparisons With
Large U.S. High Schools.................................................................................
33Exhibit 2.6 Total Student Enrollment of SLC Cohort 1 Schools, Compared With Large U.S.
High Schools............................................................................................................
34Exhibit 2.7 Percentage of Students by Race or Ethnicity in Cohort 1 SLC Schools, 2000–01.. 35Exhibit 2.8 Minority Enrollment of SLC Cohort 1 Schools, Compared With Large U.S. High
Schools.....................................................................................................................
35Exhibit 2.9 LEP Enrollment of SLC Cohort 1 Schools, Compared With Large U.S. High
Schools.....................................................................................................................
36Exhibit 2.10 Students With Disabilities Enrollment of SLC Cohort 1 Schools, Compared With
Large U.S. High Schools..........................................................................................
37Exhibit 3.1 Percentage of Schools Indicating That Academic Factors Were Very Important
in Deciding to Apply for SLC Funds.......................................................................
41Exhibit 3.2 Percentage of Schools Indicating That Behavioral and Attitudinal Factors Were
Very Important in Deciding to Apply for SLC Funds………………….................
42Exhibit 3.3 Percentage of Schools Indicating That School and External Factors Had a Major
Influence on Their Decision to Implement an SLC Program...................................
43Exhibit 3.4 Number of SLC Structure Types Implemented Across SLC Schools in
SY 2002–03..............................................................................................................
44Exhibit 3.5 Percentages of SLC Schools Implementing Each Type of SLC Structure……….. 45Exhibit 3.6 Changes in SLC Structures Over Time.................................................................... 46Exhibit 3.7 Types of SLC Schools, Categorized by Combination of SLC Structures
Implemented...............................................................................................
48

viii
Exhibit 3.8 Average Percentage of Eligible Student Enrollment in SLC Structures, in Schools Implementing Each Type of Structure…………………………………...
49
Exhibit 3.9 Percentage of SLC Schools Implementing Each Type of SLC Strategy, Alone or in Combination With a Comprehensive “Structure”………………………...
50
Exhibit 3.10 Average Percentage of Total Student Enrollment in SLC Strategies, Where Strategies Are Being Implemented………………………………………………..
51
Exhibit 3.11 PIS Items Used to Measure Three Components of Personalization……………… 53Exhibit 3.12 Percentage of SLC Schools Reporting Specific School- and Classroom-Level
Changes to Foster Smallness as a Result of SLC Funding………………………..
54Exhibit 3.13 Distribution of SLC School Involvement in Efforts to Personalize Education
Through Strategies Fostering Individual Student and Staff Relationships………..
56Exhibit 3.14 Distribution of SLC School Involvement in Efforts to Personalize Education
Through Individual Assessment Strategies and Classroom Practices………..……
57Exhibit 3.15 Distribution of SLC School Involvement in Efforts to Personalize Education
Through Teacher Teaming and Class-Size Reduction………..…………………...
58Exhibit 3.16 Distribution of Average Number of Hours of Teacher Participation in SLC
Program Professional Development Across SLC Schools………..……………….
59Exhibit 3.17 Percentages of Schools Reporting a Majority (50 percent or more) of SLC
Teachers Participating in Various Professional Development Opportunities…….
61Exhibit 3.18 Percentage of SLC Schools Reporting External Partners Working Within Their
SLC Programs…………………………………………………… ……………….
62Exhibit 3.19 Percentage of SLC Schools Reporting Various Benefits Provided to Their SLC
Programs Through External Partnerships (of those whose external partners work with their SLC programs)…………………………………………………...
63Exhibit 3.20 Percentage of SLC Schools Reporting the Availability of Various Career or
Community Opportunities at the School Level………...………………………….
64Exhibit 3.21 Percentage of Schools Reporting Parental and Family Involvement Within
Their SLCs and the School as a Whole………..…………………………………..
65Exhibit 3.22 Percentage of SLC Schools and Students Involved in SLC Structures and
Strategies, Before and After Federal Funding……………………………………..
67Exhibit 3.23 Percentage of SLC Schools Engaged in Other School Reform Efforts………..…. 68Exhibit 3.24 Percentage of SLC Schools Reporting Positive Influence of Selected Factors on
Implementation of SLC………..…………………………………………………..
69Exhibit 3.25 Percentage of SLC Schools Reporting Negative Influence of Selected School-
Level Factors on Implementation of SLC……...………………………………..
71Exhibit 3.26 Percentages of SLC Schools Reporting Various Staffing Needs………..………... 72Exhibit 4.1 PIS Variables Describing Key Features of Career Academy Implementation
(number of schools with career academies responding to each item)……………..
75Exhibit 4.2 Percentage of Schools With Career Academies Reporting Separate Features for
Academy Program…………………………………………………………………
76Exhibit 4.3 Percentage of Schools With Career Academies Reporting Autonomy Over
Program Features……….………………………………………………………….
77Exhibit 4.4 Percentage of Schools With Career Academies Reporting Sole or Shared
Decision-Making Power With School…………………………………………...
78Exhibit 4.6 Percentage of Schools With Career Academies Reporting Integration of
Academic and Vocational Instruction……………………………………………..
80Exhibit 4.7 Curricular Offerings in One SLC Grantee School………………………………... 82

ix
Exhibit 4.8 Percentage of Schools With Career Academies That Offer Work-Based
Learning Opportunities……………………………………………………………
83Exhibit 4.9 Percentage of Schools With Career Academies That Have Implemented Career-
Related Graduation Requirements………………………………………………...
85Exhibit 4.10 Percentage of Schools With Career Academies Reporting Common Planning
Time and the Frequency of Its Use………………………………………………..
86Exhibit 4.11 Percentage of Schools Implementing Career Academies in Which the
Demographics of Each Career Academy Group Matched the Demographics of the School as a Whole in Terms of Race, Gender, and LEP………………………
88Exhibit 4.12 Number of Schools With Career Academies, by Levels of Implementation and
Defining Characteristics…………………………………………………………...
90Exhibit 4.13 PIS Variables Describing Key Features of Freshman Academy Implementation... 93Exhibit 4.14 Percentage of Schools With Freshman Academies Reporting Common
Planning Time and the Frequency of Its Use……….……………………………..
94Exhibit 4.15 Percentage of Schools With Freshman Academies Reporting Separate Features
for Academy Program……………………………………………………………..
96Exhibit 4.16 Percentage of Schools With Freshman Academies Reporting Autonomy Over
Program Features……….………………………………………………………….
97Exhibit 4.17 Percentage of Schools With Freshman Academies Reporting Sole or Shared
Decision-Making Power With School…………………………………………...
98Exhibit 4.18 Percentage of Schools With Freshman Academies in Which the Demographics
of Each Freshman Academy Matched the Demographics of the Entire Freshman Class in Terms of Race, Gender, and LEP………………………………………...
99Exhibit 4.19 Number of Schools With Freshman Academies, by Levels of Implementation
and Defining Characteristics………………………………………………………
101Exhibit 4.20 Percentage of Schools With Career or Freshman Academies Reporting Sole or
Shared Decision-Making Power With School…………………………………….
103Exhibit 4.21 Percentage of Schools With Career or Freshman Academies Reporting Separate
Features for Academy Program……………………………………………………
104Exhibit 4.22 Percentage of Schools With Career or Freshman Academies Reporting
Common Planning Time and the Frequency of Its Use…………………………... 105Exhibit 5.1 Percentage of 11th-Grade Students At or Above Proficiency in Reading in
Average SLC School (excluding California)……………………………………... 116Exhibit 5.2 Percentage of 11th-Grade Students At or Above Proficiency in Mathematics
in Average SLC School (excluding California)…………………………………... 117Exhibit 5.3 Percentage of 11th-Grade Students At or Above 50th Percentile on SAT9
Reading in Average SLC School (California only)………………………………. 118Exhibit 5.4 Percentage of 11th-Grade Students At or Above 50th Percentile on SAT9
Mathematics in Average SLC School (California only)………………………….. 119Exhibit 5.5 Percentage of Students in Grades 11 and 12 Taking ACT Test in Average SLC
School……………………………………………………………………………... 120Exhibit 5.6 Percentage of Students in Grades 11 and 12 Taking SAT Test in Average SLC
School……………………………………………………………………………... 121Exhibit 5.7 Average Total SAT Score in Average SLC School………………………………. 122Exhibit 5.8 Average Total ACT Score in Average SLC School………………………………. 123Exhibit 5.9 Promotion Rate from 9th to 10th Grade in Average SLC School………...………. 124

x
Exhibit 5.10 Graduation Rates in Average SLC School, Based on 9th- and 12th-Grade
Enrollment of Graduating Cohort…………………………………………………
125Exhibit 5.11 Percentage of Students Simultaneously Enrolled in Secondary and College-
Level Courses in Average SLC School……………………………………………
126Exhibit 5.12 Percentage of Graduates Intending to Attend Two- or Four-Year Colleges in
Average SLC School………………………………………………………………
127Exhibit 5.13 Average Daily Attendance in Average SLC School……….……………………… 128Exhibit 5.14 Percentage of Students Involved in Extracurricular Activities in Average SLC
School……………………………………………………………………………...
129Exhibit 5.15 Incidence of School Violence per 100 Students in Average SLC School………... 130Exhibit 5.16 Incidence of Alcohol and Drug Use per 100 Students in Average SLC School….. 131Exhibit 5.17 Incidence of Disciplinary Action per 100 Students in Average SLC School…….. 132Exhibit 6.1 Percentages of SLC Schools Making School-Level Changes and Expecting to
Sustain These Changes After Federal SLC Funding…………..…………………..
139Exhibit 6.2 Average Daily Attendance in Average SLC School……………………………… 140

xi
Acknowledgments
The implementation study of Smaller Learning Communities has benefited from the input and support of a wide number of individuals. We would first like to thank the more than 100 school principals who completed the two administrations of the implementation survey sent to their schools. We also appreciate the cooperation and goodwill of the 18 schools who participated in our case study site visits and whose staff were so generous with their time as we visited their schools and classrooms. We would also like to acknowledge the critical contribution made to this study by our subcontracting partner, the CDM Group, which was responsible for collection of annual performance report data from the schools, and which also participated in our site visits. Several staff members at Abt Associates contributed their efforts to this report, including Carolyn Layzer, Susan Paxson, Elizabeth Umbro, and Natasha Zotov. Sheila Rosenblum of Rosenblum Brigham Associates was also a key member of our site visit team. Alan Werner served as Abt’s technical reviewer for this report and provided many invaluable comments in this capacity. We also appreciate the advice, support, and guidance of our federal project officer, James Maxwell in the U.S. Department of Education, as well as program and research staff, including Andrew Abrams and Braden Goetz, in the Office of Vocational and Adult Education. Kevin Cramer and David Goodwin, earlier federal project officers on this study, were critical to getting this study off in the right direction.

xii
Executive Summary 1
Executive Summary
The Smaller Learning Communities (SLC) program was established in response to growing national concerns about students too often lost and alienated in large, impersonal high schools, as well as concerns about school safety and low levels of achievement and graduation for many students. Authorized under the Elementary and Secondary Education Act (Title V, Part D, Subpart 4, Section 5441(b)), the SLC program was designed to provide local education agencies with funds to plan, implement, or expand SLCs in large high schools of 1,000 students or more. The SLC legislation allows local education agencies to implement the most suitable structure or combination of structures and strategies to meet their needs. The U.S. Department of Education (ED) contracted with Abt Associates to conduct the Implementation Study of Smaller Learning Communities. The primary purpose of the study was to evaluate the implementation of the federal education law that authorizes funding for the SLC program, by describing the strategies and practices used in implementing SLCs. The report is based on findings from the first group (first cohort) of grantee schools funded under this program in 2000. This first cohort of 119 SLC schools was surveyed at two points in time (spring 2002 and fall 2003). From among those freshman and career academies with the highest student participation and degree of SLC implementation, 18 schools were purposively selected for case studies.1 The study addresses three major research questions:
• How are schools implementing SLCs—what are the principal strategies, models, and practices implemented?
• What are the factors facilitating and inhibiting implementation in SLC schools?
• How do outcomes for SLC schools, as measured by student achievement and school
behavior, change over time? This study relied on three major sources of data: (1) Annual Performance Reports (APRs), completed by all grantees and schools funded through the SLC program; (2) Periodic Implementation Survey (PIS); and (3) in-depth case studies of 18 SLC schools who reported they were implementing a freshman or career academy. The following sections provide more detail about the SLC program, the study design, and major study findings. Smaller Learning Communities Program
The SLC program serves multiple purposes, namely: (1) testing the feasibility of creating SLCs; (2) researching, developing, and implementing strategies for creating or expanding SLCs; (3) implementing strategies for effective and innovative changes in curriculum and instruction; 1 This report does not include findings from the second cohort of 222 SLC schools funded in 2002. These schools were
surveyed at only one time and did not have any case study visits. Findings for this cohort of SLC schools are summarized in the unpublished Cohort 2 Follow-up Report (Bernstein, Millsap, and Schimmenti, 2005) available upon request.

Executive Summary 2
(4) providing professional development for school staff in the teaching methods that would be used in the SLCs; and (5) developing and implementing strategies to include parents, business organizations, and other community members in the activities of the SLCs.2 The legislation authorizing the SLC program was broad and gave grantees considerable latitude to determine how to implement SLCs. Programs responding to the SLC legislation were free to choose from a range of methods including “structures”(comprehensive restructuring), as well as “strategies” used either alone or to complement these new structures. Several restructuring methods were encouraged under the program, including small learning clusters, “houses,” career academies, magnet programs, or schools-within-a-school. Strategies that complement such a restructured large high school include block scheduling, freshman transition academies, advisory or adult advocate systems, academic teaming, multiyear groupings, and other innovations designed to create a more personalized high school experience for students, and thus improve student achievement. The SLC program asks each grantee for the number of students in each of the structures and strategies included in the box below from their Annual Performance Report (APR). Smaller Learning Community Structures and Strategies SLC Structures (Comprehensive Restructuring) Career Academies are one type of school-within-a-school that organizes curricula around one or more careers or occupations. They integrate academic and occupation-related classes.
Freshman Academies, also called Ninth Grade Academies, are designed to bridge middle and high school. They respond to the high ninth-grade dropout rate in some high schools.
House Plans are composed of students assembled across all grades or by grade level (e.g., all 11th- and 12th-graders) with their own disciplinary policy, student activity program, student government, and social activities.
Schools-Within-a-School break large schools into individual schools, which are multiage and may be theme-oriented; they are separate and autonomous units with their own personnel, budgets, and programs.
Magnet Schools generally have a core focus (e.g., math and science, the arts). They usually draw their students from the entire district. SLC Strategies (Complement Structures or Implemented Alone) Block Scheduling: Class time is extended to blocks of 80–90 minutes, allowing teachers to provide individual attention and to work together in an interdisciplinary fashion on a greater variety of learning activities.
Career Clusters, Pathways and Majors: These are broad areas that identify academic and technical skills students need as they transition from high school to postsecondary education and employment.
Adult Advocates or Mentors: Trained adult advocates meet with students individually or in small groups on a regular basis over several years, providing support and academic and personal guidance.
Teacher Advisory Program: The homeroom period is changed to a teacher advisory period, assigning teachers to a small number of students for whom they are responsible over three or four years of high school.
Teacher Teams: Academic teaming organizes teachers across subjects so that teacher teams share responsibility for curriculum, instruction, evaluation, and discipline for the same group of 100 to 150 students.
2 Title V, Part D, Subpart 4, Section 5441(b) of the Elementary and Secondary Education Act.
Executive Summary 3
The first grants were awarded in FY 2000 and are the subject of this report. In January 2002, the No Child Left Behind legislation (PL 107-110, Section 5441) reauthorized the program. SLC Early Implementation Study Design
This executive summary addresses the major implementation findings on the first cohort of 119 schools funded under the federal SLC program, which received three-year implementation grants in the first year of funding (fall 2000). The SLC study relies on three major sources of data: (1) The Annual Performance Reports (APRs), completed by all grantees or schools funded through the SLC program, provided data on a number of student outcome measures, as well as district and school background information, the number and type of SLC approaches, and general student background information;3 (2) The Periodic Implementation Survey (PIS), administered to all Cohort 1 SLC schools at two time points (spring 2002 and fall 2003) provided detailed information on the implementation of various SLC strategies across all schools;4 (3) and In-depth case studies of 18 Cohort 1 SLC schools helped illuminate the survey findings. Site visits to these 18 schools were completed in fall 2002, and follow-up telephone interviews were conducted in spring 2004. Both the APR and PIS contained self-reported data. The APR contained data submitted to ED by each SLC grantee. Although instructions were given to each grantee defining how the APR should be filled out, considerable variation existed among grantees in terms of how certain outcomes were defined and reported, such as planned postsecondary attendance and extracurricular activities. The PIS responses, based primarily on self-reported perceptions of progress in implementing SLCs, may have reflected varying definitions of SLC implementation maintained by principals from school to school. Compared with other large high schools (schools with at least 1,000 students), the SLC schools in the first cohort of grantees are distinctly different. The SLC schools are larger (median enrollments of 1,874 students vs. 1,554 in large high schools), have a much higher percentage of minority enrollment (median of 60 percent vs. 22 percent), and are much more likely to be located in large or mid-size central cities (60 percent vs. 33 percent). We note that this study examined implementation issues for the first cohort funded by the program. As such it reflects only early implementation issues.
3 Response rates for SY 1996–97 through SY 2002–03 APR data ranged from 97 to 100 percent. 4 Response rates for the spring 2002 and fall 2003 PIS data collections for Cohort 1 were 97 percent and 90 percent,
respectively.

Executive Summary 4
Exhibit ES.1
Minority Enrollment of SLC Cohort 1 Schools, Compared With Large U.S. High Schools
10%
28%
45%
17%
31%
43%
17%
8%
0%
20%
40%
60%
<10% 10–49.9 50–89.9% 90–100%
Minority Enrollment
Perc
ent o
f Sch
ools
SLC schools Large U.S. high schools
Exhibit reads: Ten percent of SLC schools have minority enrollments of less than 10 percent, compared to 31 percent of large U.S. high schools.
Source: Implementation Study of Smaller Learning Communities, SLC Annual Performance Report, SY 2000–01; Common Core of Data, Public Elementary and Secondary School Universe Survey, 2000–01.
Major Study Findings
The study findings primarily concern the status of SLC implementation in the Cohort 1 schools and factors facilitating and inhibiting implementation. The study also examined in a limited manner how outcomes as self-reported in the APR data changed for Cohort 1 schools over time. Implementation Findings
How are schools implementing SLCs—what are the principal strategies, models, and practices implemented?
• By the end of two to three years of receiving their SLC grants (depending on when grantee districts made funds available to schools), the first group of SLC schools (Cohort 1) had reported success in responding to congressional intent to implement varied approaches. In general, schools tended to implement a combination of SLC “structures” and less-comprehensive “strategies,” with schools averaging 1.3 structures and 2.3 strategies. The most prevalent structures were freshman and career academies. More than one-half (55 percent of schools) reported that they implemented freshman academies, and more than one-third (42 percent) reported that they implemented career academies. Twenty-one percent of schools implemented freshman and career academies in combination.
• Schools also changed over time, in both the number and types of SLC structures
they were implementing. Freshman academies showed the most growth. In 2001–02,

Executive Summary 5
38 percent of SLC schools had freshman academies; by 2002–03, the number had risen to 55 percent. Career academies showed some growth (from 38 percent of schools to 42 percent), whereas the overall proportion of other structures remained unchanged. Schools with freshman academies, career academies, or schools-within-schools were more likely than schools with other structures to continue to implement the same SLC structures across both school years.
Exhibit ES.2
Percentages of SLC Schools Implementing Each Type of SLC Structure (n=105)
6%
10%
16%
55%
42%
38%
38%
7%
10%
14%
0% 20% 40% 60%
Magnet Schools
House Plans
Schools-within-a-School
Freshman Academies
Career Academies
Percent of Schools
2001–022002–03
Schools with:
Exhibit reads: Thirty-eight percent of SLC schools reported implementing career academies in the 2001–02 school year. Forty-two percent reported implementing career academies in the 2002–03 school year.
Notes: Percentages exceed 100 percent within a school year because schools may implement more than one SLC structure. Percentages based on number of respondents completing survey module corresponding to each type of SLC structure
Source: Implementation Study of Smaller Learning Communities, Periodic Implementation Surveys, 2002 and 2003.

Executive Summary 6
• Cohort 1 schools with freshman academies, house plans, and career academies reported success in involving a majority of their eligible students. Schools with freshman academies reported a high level of participation (78 percent on average) among their ninth-grade students. For house plans, average student participation was 77 percent during the 2002–03 school year.
• In addition to, or in place of, SLC structures, schools also chose to implement one or
more SLC strategies, with block scheduling (58 percent of schools) and teacher teams (52 percent) the most popular choices. However, schools over time were gradually shifting from the use of SLC strategies to a greater use of SLC structures.
Exhibit ES.3
Percentage of SLC Schools Implementing Each Type of SLC Strategy, Alone or in Combination With a Comprehensive “Structure” (n=105)
34%
37%
52%
47%
58%
37%
46%
60%
65%
67%
0% 20% 40% 60%
Teacher Advisory Programs
Adult Advocates/Mentors
Teacher Teams
Career Clusters/Pathways
Block Scheduling
Percent of Schools
2001–022002–03
Exhibit reads: Sixty-seven percent of SLC schools reported implementing block scheduling in the 2001–
02 school year, and 58 percent reported implementing block scheduling in the 2002–03 school year.
Source: Implementation Study of Smaller Learning Communities, Periodic Implementation Surveys, 2002 and 2003, Other SLC Strategies Module, Question A: “Are you implementing this strategy/Were you implementing this strategy in 2002–03?”
Note: Percentages do not add up to 100 percent within a school year due to schools implementing more than one SLC strategy.

Executive Summary 7
• Although SLCs can take a variety of forms—career academies, house plans, and strategies such as block scheduling—they all share the common goal of making the high school experience for all students more personalized. All but two Cohort 1 schools reported undertaking efforts to increase personalization. The most popular mechanisms for enhancing personalization were school or classroom-based and involved providing individual assessments (76 percent), a cooperative learning focus (63 percent) or formal mentoring programs (47 percent).
Exhibit ES.4
Percentage of SLC Schools Reporting Specific Mechanisms to Foster Personalization (n=103)
21%
22%
32%
36%
37%
47%
60%
63%
64%
76%
19%
0% 20% 40% 60% 80% 100%
Independent study is available in core academic courses
Student evaluations of teachers are being used
Students keep same homeroom teacher throughout highschool
Classes are smaller than before
Each teacher teaches a smaller number of students thanbefore
Students are taught by the same cluster of teachers for multipleyears
Students are formally paired with mentors
Teachers serve as advisors/mentors
A cooperative learning focus has been integrated into thecurriculum
Individualized assessments required for graduation
Individualized assessments used
Percent of Schools
Exhibit reads: Seventy-six percent of SLC schools reported that they used individualized assessment throughout their school.
Source: Implementation Study of Smaller Learning Communities: Periodic Implementation Survey, 2003
• Providing professional development for school staff in innovative teaching methods that
challenge and engage students is another goal of the SLC legislation. SLC-related professional development, although provided by nearly all Cohort 1 schools, was not very extensive. SLC teachers received a little more than three days of professional development per year. In close to half of Cohort 1 schools (45 percent) teachers received less than 16 hours of SLC-specific professional development during the 2002–03 school year. But although the time dedicated to these activities was limited, Cohort 1 schools reported providing a wide range of professional development activities for their teaching staff. This included tailoring instruction to individual student needs (95 percent of

Executive Summary 8
schools), subject matter content/curriculum (95 percent), problem solving and reasoning (93 percent), and strategies for helping low-achieving students (90 percent).
• A third goal of the SLC legislation was to include parents, business representatives,
institutions of higher education, and other community resources as facilitators of schools’ SLC activities and as links between students and their communities. Cohort 1 schools generally reported success in involving community representatives in their SLC activities, with four-fifths of schools (82 percent) working with an external partner in 2002–03, up from two-thirds of schools (65 percent) in the previous year. Partners included businesses, institutions of higher education, and community based organizations. Most schools used partners on advisory committees and as in-school volunteers. Those schools engaging external partners with their SLCs reported that they derived specific benefits for their students, including a range of career-related opportunities such as community service learning, internships, and job shadowing.
• Schools were also able to involve parents in school activities, and to a lesser extent in
the SLC program. Over three-fourths of Cohort 1 schools generally reported parents’ being involved in such school level activities as the PTA and school governance. More than two-thirds of schools (70 percent) reported some form of parental input into their SLC program after two years of funding.
• Career academy programs were likely to develop some independence. Career
academies are likely to have autonomy over staff decisions (77 percent) and the creation of instructional leadership teams (77 percent).
The demographics of career and freshman academies often did not match the demographics of the school or freshman class. For example, about half of the schools with either career or freshman academies had race or ethnicity demographics that matched the class or school as a whole. About 29, percent of the career academies matched by gender, compared with three-fourths of the freshman academies. What was the level of SLC implementation? Using the self reported data from the PIS survey to assess the extent to which schools in the first cohort sample were able to implement career and freshman academies, the study developed a heuristic classification scheme of “high,” “moderate,” and “low” implementation based on specific criteria developed from the responses to the survey items. Career Academy Implementation Using data from the PIS survey and the criteria presented below, the study found that the largest number of schools had “moderate” implementation (26 of the 44 career academies). Eight were deemed to have “high” levels and 10 had “low” levels.
Executive Summary 9
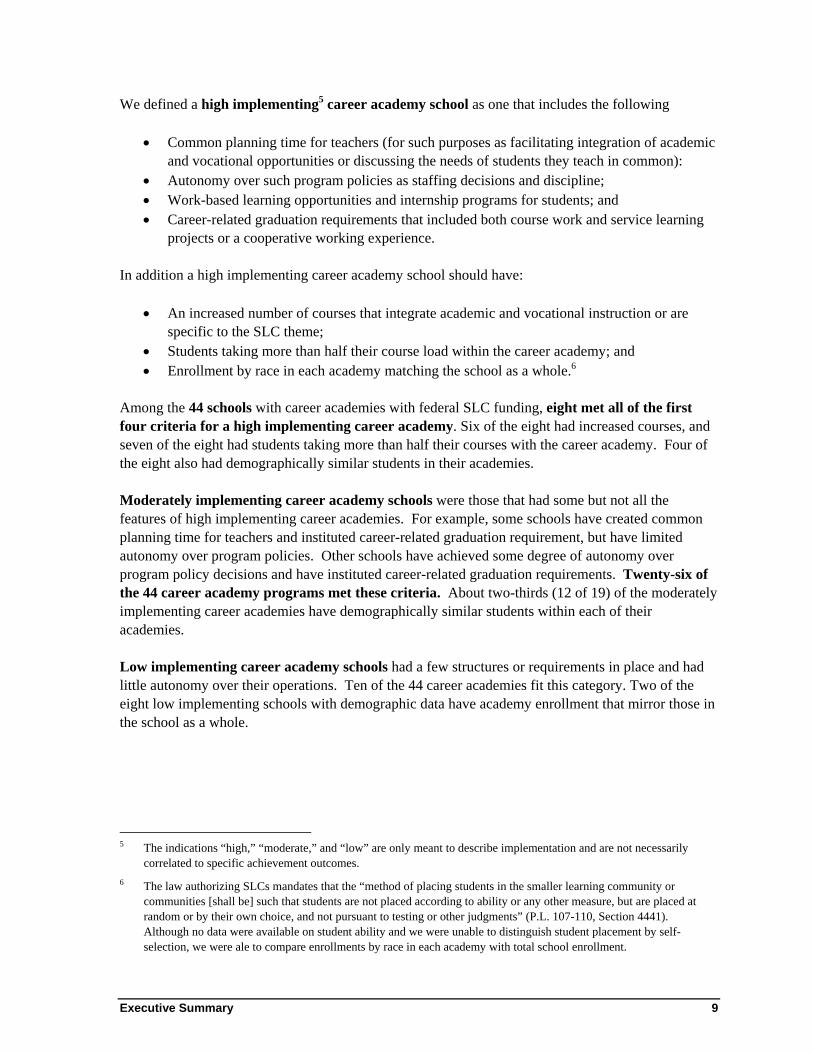
We defined a high implementing5 career academy school as one that includes the following
• Common planning time for teachers (for such purposes as facilitating integration of academic and vocational opportunities or discussing the needs of students they teach in common):
• Autonomy over such program policies as staffing decisions and discipline; • Work-based learning opportunities and internship programs for students; and • Career-related graduation requirements that included both course work and service learning
projects or a cooperative working experience. In addition a high implementing career academy school should have:
• An increased number of courses that integrate academic and vocational instruction or are specific to the SLC theme;
• Students taking more than half their course load within the career academy; and • Enrollment by race in each academy matching the school as a whole.6
Among the 44 schools with career academies with federal SLC funding, eight met all of the first four criteria for a high implementing career academy. Six of the eight had increased courses, and seven of the eight had students taking more than half their courses with the career academy. Four of the eight also had demographically similar students in their academies. Moderately implementing career academy schools were those that had some but not all the features of high implementing career academies. For example, some schools have created common planning time for teachers and instituted career-related graduation requirement, but have limited autonomy over program policies. Other schools have achieved some degree of autonomy over program policy decisions and have instituted career-related graduation requirements. Twenty-six of the 44 career academy programs met these criteria. About two-thirds (12 of 19) of the moderately implementing career academies have demographically similar students within each of their academies. Low implementing career academy schools had a few structures or requirements in place and had little autonomy over their operations. Ten of the 44 career academies fit this category. Two of the eight low implementing schools with demographic data have academy enrollment that mirror those in the school as a whole.
5 The indications “high,” “moderate,” and “low” are only meant to describe implementation and are not necessarily
correlated to specific achievement outcomes. 6 The law authorizing SLCs mandates that the “method of placing students in the smaller learning community or
communities [shall be] such that students are not placed according to ability or any other measure, but are placed at random or by their own choice, and not pursuant to testing or other judgments” (P.L. 107-110, Section 4441). Although no data were available on student ability and we were unable to distinguish student placement by self-selection, we were ale to compare enrollments by race in each academy with total school enrollment.

Executive Summary 10
Freshman Academy Implementation Freshman academies had fewer requirements to meet than career academies. Specifically, using the available PIS data, a high implementing freshman academy school had the following features:
• At least weekly common planning time for teachers, so that teachers may discuss the needs of students whom they have in common;
• Autonomy over select program policy areas; and • Enrollment by race in each academy matching the freshman class as a whole.
Of the 58 schools with freshman academies, 33 meet the first two criteria. They reported common planning time for teachers on at least a weekly basis and reported autonomy on at least four program policy areas, typically over staff and instructional leadership teams. Just half of the schools providing data, however (that is, 11 of 22), have each of their freshman academies matching the racial composition of the entire freshman class. Moderately implementing freshman academy schools were those that have some but not all the features of high implementing freshman academy school. Thirteen freshman academy programs meet these criteria. They have autonomy over fewer program policies than high implementing schools. They are similar to high implementing freshman academies in that just over half (five of eight) have enrollments that mirror the freshman class as a whole. The remaining 12 schools in the freshman academy sample had a low level of implementation. None have implemented common planning time, and they all reported having limited autonomy over school-level program policy decisions. Too few schools provided demographic data to compare academy enrollments to the entire freshman class. What were the demographics of participation? The law authorizing SLCs mandates that the “method of placing students in the smaller learning community or communities [shall be] such that students are not placed according to ability or any other measure, but are placed at random or by their own choice, and not pursuant to testing or other judgments” (P.L. 107-1010, Section 4441). If students were placed at random, on average they should mirror the demographics of the total population of the school or class; however, the law also allows student choice as the placement criteria. As noted above, about half of the schools with either career or freshman academies had their enrollments in each academy match the racial composition of the school (for career academies) or the freshman class as a whole (for the freshman academies). About half the schools with freshman academies had matched enrollments for limited English proficient students (LEP) and 38 percent of schools had similar LEP demographics for career academies. Three-quarters of the freshman academies had matched enrollments by gender, compared to just over a quarter (29 percent) of schools with career academies, As the data reported in the APR do not distinguish between enrollments based on school random assignment or student’s choices, it is not possible to ascertain the extent to which the differences in demographics are based on student choice rather than school assignment; however, these comparisons suggest that schools are clearly challenged to create academies that match the population from which the academies are drawn. As the data reveal, schools find it less difficult to have freshman academy groupings similar to the freshman class than to have career academies that mirror the demographics of the school.

Executive Summary 11
What are the factors facilitating and inhibiting implementation in SLC schools? • Cohort 1 SLC respondents reported a set of factors that appeared to facilitate
implementation of an SLC initiative, including professional development specifically focused on SLCs; the availability of resources, including instructional materials; and a variety of teacher-related variables (e.g., attitudes toward reform, pedagogical practices, and expertise). Other factors may be linked with SLC reform efforts, including a school’s prior involvement in SLC activities, the availability of external funding, and involvement in other SLC-related reform efforts.
• Schools also perceived a number of factors to have a negative influence on SLC
implementation, including scheduling and logistical issues, physical space, and school staffing needs, especially in terms of core academic teachers and guidance counselors.
• A common set of factors affecting academy implementation emerged from case study visits
and follow-up telephone interviews with a sample of Cohort 1 schools implementing career or freshman academies. Facilitating factors included strong school leadership, involved and supportive districts, high levels of staff buy-in, and sufficient space to make programs separate. Inhibiting factors included staff and administrative turnover, weak school leadership, prescriptive district oversight of SLC reforms, and limited resources on the part of the school.
• Most career academy programs in the case study reported facing significant obstacles.
Ninth-grade students typically took only academic courses and most schools crafted one initial course in ninth grade to have students start thinking about career choices. Offering English language instruction for the non-English-speaking LEP populations within each academy is nearly impossible. The number of staff qualified to teach these courses is limited and for smaller academies there won’t be enough students to meet minimum enrollment requirements.

Executive Summary 12
APR Data on Outcomes
The section below presents a comparison of the reported APR data related to key program outcomes in the period just prior to program implementation and just after program implementation. The data are based on the SLC schools’ self reported data through Annual Performance Reports (APR). Schools first completed the APR during the 2000–01 school year, at which time they also provided retrospective data for school years 1996–97 through 1999–2000. APR data were also collected annually for school years 2001–02 and 2002–03. The APR data includes information on academic achievement, school-related behaviors, and the achievement of academic milestones at the school level. Limitations of the APR Outcome Analysis While analysis of the APR data give some self-reported information on how schools were trending over time before receiving SLC funding and whether or not there was a measured shift in trends when schools received SLC funds, absent a valid comparison group, any inferences from this data about the impacts of SLC funding and implementation on those outcomes are clearly inappropriate. In addition, there are a number of very important caveats and limitations that also make use of this data for evaluation of outcomes or impact analysis inappropriate. These are summarized below.
• Many schools were engaged in implementing SLCs structures and strategies prior to receiving their federal grants, which could potentially have affected their pre-grant outcomes.
• APR school-level outcomes were based on both SLC participants and nonparticipants, potentially attenuating the results. That is, in many cases the SLC feature being implemented only directly affected a subset of students in the school, while outcomes were reported for the school as a whole.
• The data collection period did not cover a sufficient period of time to adequately capture changes in end of high school outcomes where implementation activities may have focused primarily on ninth-grade students.
• The dynamics of the SLC implementation process may have affected short-term school outcomes as schools adjusted to the task of restructuring. That is, restructuring such a large institution as a high school may not only lead to no immediate changes, but there may actually be a temporary worsening of outcomes as school staff take on and become accustomed to their new roles.
• Results are based on school-reported data, which varied greatly in quality and accuracy; specifically there is a serious measurement issue in terms of the lack of data comparability (both between districts and states).
Keeping in mind these limitations the APR data revealed the following with regard to short-term outcomes.

Executive Summary 13
How do short-term outcomes for SLC schools, as measured by school-related behaviors, change over time?
• As measured by APR data, early changes in schoolwide reported outcomes after receiving SLC funding were modest or neutral, with a good deal of variation between schools. • Where there is evidence of change, however, trends appear to be moving in the right
direction for school-related behaviors. Specifically, the APR data suggest an upward trend in student extracurricular participation and promotion rates from 9th to 10th grades. The trend for extracurricular involvement in SLC schools showed a substantial and statistically significant increase of five percentage points in participation after receipt of SLC funding.
Exhibit ES.5
Percentage of Students Involved in Extracurricular Activities in Average SLC School (n=78)
41% 42% 42% 43%49% 49% 50%
20%
40%
60%
80%
1996–97 1997–98 1998–99 1999–2000 2000–01 2001–02 2002–03
Perc
ent o
f Stu
dent
s
Receipt of federal SLC funds
Exhibit reads: During the 1996–97 school year, 41 percent of students were involved in extracurricular activities in the average SLC school.
Source: Implementation Study of Smaller Learning Communities: Annual Performance Report, SY 1996–97 through SY 2002–03.
Executive Summary 14
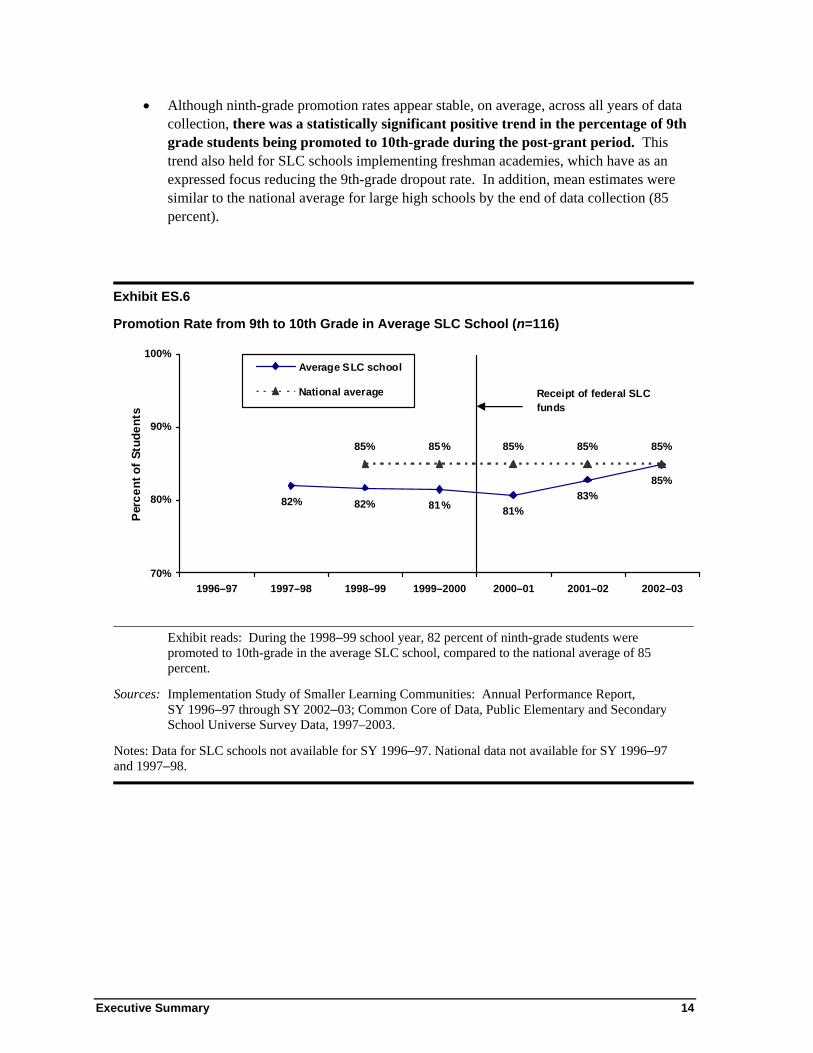
• Although ninth-grade promotion rates appear stable, on average, across all years of data collection, there was a statistically significant positive trend in the percentage of 9th grade students being promoted to 10th-grade during the post-grant period. This trend also held for SLC schools implementing freshman academies, which have as an expressed focus reducing the 9th-grade dropout rate. In addition, mean estimates were similar to the national average for large high schools by the end of data collection (85 percent).
Exhibit ES.6
Promotion Rate from 9th to 10th Grade in Average SLC School (n=116)
82% 82% 81% 81%83%
85%
85% 85% 85% 85%85%
70%
80%
90%
100%
1996–97 1997–98 1998–99 1999–2000 2000–01 2001–02 2002–03
Per
cent
of
Stud
ents
Average SLC school
National average Receipt of federal SLC funds
Exhibit reads: During the 1998–99 school year, 82 percent of ninth-grade students were promoted to 10th-grade in the average SLC school, compared to the national average of 85 percent.
Sources: Implementation Study of Smaller Learning Communities: Annual Performance Report, SY 1996–97 through SY 2002–03; Common Core of Data, Public Elementary and Secondary School Universe Survey Data, 1997–2003.
Notes: Data for SLC schools not available for SY 1996–97. National data not available for SY 1996–97 and 1997–98.

Executive Summary 15
• There was also a downward trend in the incidence of violence in SLC schools over time. The three most recent years of data collection following the receipt of the SLC grant suggest that incidence of negative behaviors such as student violence may be on the decline. The data suggest that, on average, SLC schools experienced a statistically significant 1.4-point drop in the number of violent incidents (per 100 students) during the post-grant period.
Exhibit ES.7
Incidence of School Violence per 100 Students in Average SLC School (n=100)
5.6 5.7 5.7 5.8
4.5 4.7 4.8
0
2
4
6
8
10
1996–97 1997–98 1998–99 1999–00 2000–01 2001–02 2002–03
Num
ber o
f inc
iden
ts
Receipt of federal SLC funds
Exhibit reads: During the 1996–97 school year there were 5.6 incidents of school violence per 100 students in the average SLC school.
Source: Implementation Study of Smaller Learning Communities: Annual Performance Report, SY 1996–97 through SY 2002–03.
How do longer-term outcomes for SLC schools, as measured by attainment of academic milestones and student academic achievement, change over time?
• As measured by APR data, early changes in schoolwide academic outcomes after receiving SLC funding were modest or neutral, with a good deal of variation between schools. In particular, there were no significant trends in academic achievement, as measured by either scores on statewide assessments or college entrance exams.
• Where there is evidence of change, however, trends appear to be moving in the right direction
for attainment of academic milestones. For example, the data suggest increases in the percentage of graduating students planning to attend either two- or four-year colleges. Between the pre- and post-grant periods, this percentage increased by about four percentage points, which is statistically significant. The absence of comparative national data, however, makes it difficult to infer whether this is due to receipt of the SLC grant rather than part of a more general national trend.

Executive Summary 16
Exhibit ES.8
Percentage of Graduates Intending to Attend Two- or Four-Year Colleges in Average SLC School (n=77)
65% 65% 65% 65%
69% 69% 69%
60%
70%
80%
1996–97 1997–98 1998–99 1999–00 2000–01 2001–02 2002–03
Perc
ent o
f Gra
duat
es
Receipt of federal SLC funds
Exhibit reads: During the 1996–97 school year, 65 percent of graduates intended to attend two- or four-year colleges in the average SLC school.
Source: Implementation Study of Smaller Learning Communities: Annual Performance Report, SY 1996–97 through SY 2002–03.
Sustainability of SLCs
The data suggest a serious commitment on the part of most SLC schools to sustain structural changes in the way their school and classrooms are organized. Specifically, close to three-quarters of those schools that report having made changes using SLC funding expect to sustain those changes after their grants end. For example, almost all (96 percent) of the schools that reported making their schoolwide core curricula more academically rigorous are committed to sustaining those changes even after their SLC funding has run out. Similarly, 94 percent of the schools that reported using more varied student assessments for grading and promotion decisions expect to sustain those changes in the future. Although schools were less likely to report classroom-level changes with the federal SLC funding, at least 80 percent of the schools that had implemented classroom-level changes also reported that they would sustain them. One exception is reduced class size, a change that may not be within the power of the school to sustain.
Chapter 1: Introduction 17
Chapter 1 Introduction
This final report presents the findings from the implementation study of the Smaller Learning Communities (SLC) program. This introduction first describes the federal law, which defines the scope of the SLC program. Next, the study is briefly described through a presentation of the research objectives and the conceptual model underlying the implementation study. Finally, previous research on smaller learning communities and small schools is summarized. Organization of the Report
This first chapter presents an overview of the SLC program, the study, and related research. Chapter 2 presents an overview of the study design, as well as a summary of the demographic characteristics of the SLC schools described in this report. The remainder of this report describes the implementation of the federal SLC initiative. Chapter 3 focuses on what schools are actually doing as well as the factors facilitating and inhibiting implementation of SLCs. Chapter 4 is devoted to a discussion of the unique implementation features of the two most widely used SLC structures, career academies and freshman academies. Because there is so much interest in how SLC schools are performing, we devote Chapter 5 to a discussion of student outcomes as reported by schools. Finally, Chapter 6 provides a summary of the findings from the previous chapters, and implications for further SLC implementation and research as well as further analyses for the follow-up report to be completed later this year. Federal Smaller Learning Communities Program
The federal SLC program was established in response to the growing nationwide concern that students are too often lost and alienated in large, impersonal school structures leading to less effective learning environments. Large numbers of students attend large high schools. In 2001, 64 percent of the country’s high school students attended schools of 1,000 or more students, with 42 percent attending schools enrolling more than 1,500 students (Common Core of Data, Public Elementary, Secondary School Universe Survey (2000–01)). Furthermore, larger high schools tend to serve disproportionately low-income (as measured by free and reduced-price lunch eligibility), urban, and minority youths—those most at risk of academic failure. Little rigorous research exists, but among the few studies available, findings suggest that students who attend small schools or who participate in SLCs earn higher scores on standardized tests than students who attend larger institutions (Wasley et al., 2000). Authorized under Title V, Part D, Subpart 4, Section 5441(b) of the Elementary and Secondary Education Act, the SLC program was designed to allow grantees:
To study the feasibility of creating the smaller learning community or communities as well as effective and innovative organizational and instructional strategies that will be used in the smaller learning community or communities; To develop and implement strategies for creating or expanding the smaller learning community or communities, as well as effective and innovative changes in curriculum and instruction, geared to high state content standards and state student performance standards;

Chapter 1: Introduction 18
To provide professional development for school staff in innovative teaching methods that challenge and engage students to be used in the smaller learning community or communities; and To develop and implement strategies to include parents, business representatives, local institutions of higher education, community-based organizations, and other community members in the smaller learning communities, as facilitators of activities that enable teachers to participate in professional development activities, as well as to provide links between students and their communities (Section 10105 (b)).
Under this program, a large high school is defined as a school that includes grades 11 and 12 and enrolls at least 1,000 students in grades 9 and above. The legislation did not describe what structures or strategies could be used to create smaller learning communities within large high schools, although several methods were included in the Conference Report for the Consolidated Appropriations Act of 2000 (P.L. 106-113, H.R. Conference Report No. 106-479, at 1240 (1999)). The restructuring methods include small learning clusters, “houses,” career academies, magnet programs, or schools-within-a-school. Strategies that complement a restructured large high school include block scheduling, freshman transition academies, advisory or adult advocate systems, academic teaming, multiyear groupings, and other innovations designed to create a more personalized high school experience for students, and thus improve student achievement. Local education agencies were encouraged to implement the most suitable structure or combination of structures and strategies to meet their needs. In FY 2000, Congress appropriated $45 million for the SLC program, and appropriated an additional $125 million in FY 2001. In January 2002, the No Child Left Behind legislation (P.L. 107-110, Section 5441) reauthorized the program. Appropriations in FY 2002 totaled $142 million. In addition, Congress has appropriated $161 million in FY 2003 and $174 million in FY 2004 for the SLC program. Federal SLC funding is provided on a competitive basis to local education agencies (LEA). An LEA can submit an application either on behalf of a single school or multiple schools in the district. Funding is awarded to the districts, which then make the funds available to the school(s) on whose behalf they applied. In 2000, the U.S. Department of Education (ED) received a total of 149 applications for this grant competition. All eligible applicants (i.e., those districts with schools of 1,000 or more students) were rated by a team of reviewers and ordered by rank. In 2000, a total of 65 three-year implementation grants were awarded to districts on behalf of 125 schools enrolling over a quarter of a million students. These grants averaged approximately $500,000 per school. In addition to the federally funded SLC program, several national and local foundation-based initiatives have encouraged the implementation of smaller learning environments in large high schools. Since 2000, the Bill and Melinda Gates Foundation has invested more than $600 million in small schools initiatives. The cornerstone of this funding is the National School District and Network Grants Program, which is directed at the creation of new, small high schools and the conversion of large high schools into smaller learning communities. The Carnegie Foundation of New York has joined forces with the Gates Foundation in this effort by pledging over $40 million toward the redesign of some of the nation’s largest comprehensive high schools in eight cities. Other foundations have provided funding for reform efforts in the form of school downsizing, including the Annenberg Foundation, the Joyce Foundation, the Pew Charitable Trust, and the Annie E. Casey

Chapter 1: Introduction 19
Foundation. At the state or local level, Knowledgeworks (Ohio), Lumina Foundation (Indiana) and the Boston Private Industry Council (Massachusetts) are a small sample of the types of organizations undertaking similar work. The Implementation Study of Smaller Learning Communities
In order to increase our understanding of the implementation of SLC’s the Department of Education has contracted with Abt Associates to conduct the Implementation Study of Smaller Learning Communities. The primary purpose of the study is to evaluate the implementation of the federal education law that authorizes funding for the federal SLC program, by describing the strategies and practices used in implementing SLCs. The research questions addressed in this study are presented at the beginning of Chapter 2. Conceptual Framework
Exhibit 1.1 presents a conceptual framework summarizing the major groupings of variables in this study. The major conceptual groupings include: (1) facilitating and inhibiting factors comprising variables hypothesized to influence implementation, (2) intervention strategies and structures comprising the SLC program in each school, and (3) school-reported student outcomes that are the goals of the SLC program. The elements of the model are described below. Factors Influencing Implementation Implementation of the SLC program is facilitated and inhibited by a range of factors, including the context of federal and state policies and initiatives. The federal policy context establishes legislative objectives together with regulations, guidelines and provisions for meeting those objectives. The federal SLC legislation specifies criteria that grantees must meet to be eligible for participation in the program, and the Grants Announcement provides guidelines that they must follow in implementation. State-level priorities for assessment and accountability, and other initiatives targeted at secondary school reform, are relevant contextual factors in understanding how SLC grants are put into action. District priorities and policies, as well as school-level factors, also shape the subsequent implementa-tion of SLC plans. At the district level, these include the degree of autonomy afforded to schools and the resources allocated to schools for restructuring, as well as district-level accountability and assess-ment practices. Implementation of the SLC model is further mediated by a host of school-level factors, including school organizational features (e.g., degree of tracking or availability of advanced placement courses), school policies, and school climate, as well as prior or current participation in other SLC reform initiatives.

Chapter 1: Introduction 20
Exhibit 1.1 Conceptual Model, Implementation Study of Smaller Learning Communities
Note: It should be noted, however, that a broken arrow represents the line between school process and student outcomes. As the study is not designed to measure impacts, we cannot say unequivocally that implementation of an SLC will necessarily lead to more positive student outcomes.
Source: Abt Associates, Inc., 2007.
SLC Intervention—Structures and Strategies The federal legislation authorizing the SLC program gave broad latitude to grantees in terms of how to direct their funding. Funds could be used to provide training and professional development opportunities for school staff in curricular and instructional practices to be implemented in the newly created school environment, as well as to devise strategies to include other stakeholders such as parents, local businesses, and community-based organizations in the activities of the SLCs. Grantees were encouraged by the program guidance to use their funds to implement any combination of SLC structures involving actual restructuring of their schools and strategies designed to enhance personalization. Exhibit 1.2 summarizes the various allowable SLC structures and strategies as defined by the SLC program.7 Outcomes of SLC The model posits that as schools begin to implement structures and strategies designed to bring about increased personalization, various student-level outcomes should also begin to undergo change. Measured at the school level, these changes might take the form of improved student behavioral
7 These definitions were provided to grantees as part of their instructions for filling out their Annual Performance
Reports. They are also available on the SLC Program Web page: http://www.ed.gov/programs/slcp/strategies.html.
Changes in Student-
Level Outcomes
Federal Context
State Policies and
Programs
District Priorities
and Policies
School-Level
Factors
•Enhancing personalization
•Providing professional development
• Including external partners
Factors Influencing
Implementation
SLC Intervention—Structures and
StrategiesOutcomes

Chapter 1: Introduction 21
outcomes (including increased attendance and promotion rates), improved school climate (such as decreased disciplinary incidents, decreased incidences of alcohol and tobacco abuse or school violence), as well as changes in longer-term outcomes, including overall improvement in student academic achievement and academic milestones, such as improved graduation rates.
Exhibit 1.2 Allowable Smaller Learning Community Structures and Strategies as Defined by SLC Program
(In the APR schools were asked to list their activities according to the list below)
SLC Structures (More Comprehensive Restructuring) Career Academies are one type of school-within-a-school that organize curricula around one or more careers or occupations. They integrate academic and occupation-related classes.
Freshman Academies, also called Ninth-Grade Academies or Freshman Transition Activities, are designed to bridge middle and high school. They respond to the high ninth-grade dropout rate experienced by some high schools.
House Plans are comprised of students assembled across all grades or by grade level (e.g., all 11th- and 12th-graders) and assigned to groups of a few hundred each. Each house has its own disciplinary policy, student activity program, student government, and social activities. Students take some or all courses with their house members and from their house teachers.
Schools-Within-a-School break large schools into individual schools. Individual schools are multi-age and may be organized around a theme; they are separate and autonomous units with their own personnel, budgets and programs. Schools-within-a-school operate within a larger school, sharing resources and facilities. Students and faculty typically affiliate with only one of the schools-within-a-school.
Magnet Schools generally have a core focus (e.g., math and science, the arts). They usually draw their students from the entire district. SLC Strategies (Complement Structures or Implemented Alone) Block Scheduling: Class time is extended from 45- or 50-minute periods to blocks of 80 to 90 minutes. The added time allows teachers to provide individual attention and work together in an interdisciplinary fashion and permits a greater variety of learning activities.
Career Clusters, Pathways and Majors: These are broad areas that address all careers within the area, from technical through professional. Career clusters identify academic and technical skills needed by students as they transition from high school to postsecondary education and employment.
Adult Advocates or Mentors: This model of personalization ensures that each student is known well by at least one staff member. Teachers, counselors, other staff, and community volunteers—all of whom must be trained—can fulfill this “caring adult” role. Adult advocates meet with 15 to 20 students individually or in small groups on a regular basis over several years, providing support and academic and personal guidance.
Teacher Advisory Program: This model of personalization changes homeroom period to a teacher advisory period. Typically, administrators and teachers are assigned to a small number of students for whom they remain responsible over three or four years of high school.
Teacher Teams: Academic teaming organizes groups of teachers across departments so that teachers share the same students rather than the same subject. Teachers who teach different subjects form a team that shares responsibility for curriculum, instruction, evaluation and discipline for a group of 100 to 150 students.
Chapter 1: Introduction 22
Related Research
School Size
The movement to develop SLCs has emerged from advocacy research and practice that suggests the superiority of smaller schools.8 Since the 1950s there has been a debate about the effects of school size, with proponents of both larger (Conant, 1959) and smaller schools (Barker and Gump, 1964), advancing social and economic arguments to support their views. For example, larger schools have been hypothesized to provide more opportunities for advanced courses and to be more cost-efficient, whereas smaller schools have been expected to offer more individualized learning opportunities. During the past 40 years, as the average size of high schools has increased dramatically, the proponents in favor of smaller school settings have grown more vocal in their arguments. Practitioners have not waited for solid empirical research evidence to address the perceived problems of large schools (Dynarski, Gleason, Rangarajan and Wood, 1998; McMullan and Wolf, 1991). In 1996, the National Association of Secondary School Principals (NASSP) clearly endorsed the SLC approach by publishing Breaking Ranks: Changing an American Institution, a manifesto calling for a greater level of personalization in education. School Restructuring, Reorganization, and Smaller Learning Communities
In the absence of the resources necessary to build new, smaller schools, a variety of approaches have been developed to make large schools seem smaller.9 By breaking large schools into smaller subunits, practitioners hope to create more personal environments despite the actual enrollment. The body of research on restructuring schools has yielded the following general findings:
• Small schools and larger schools that have restructured may produce similar student outcomes (Raywid, 1996).
• Positive outcomes of restructured schools include increased academic achievement, increased academic equity, increased student engagement, more positive teacher-student relations, and a decreased dropout rate (Raywid, 1996).
Much of the literature on SLCs consists of case studies and evaluations of individual schools. Studies could not be found that include large numbers of schools or focus on a whole-school model in which all students are included in some form of SLC. Certain strategies, such as freshman academies, are typically used in combination with other strategies, which means that little published research is
8 The research findings cited here are drawn from Page et al., National Evaluation of Smaller Learning Communities:
Literature Review, Abt Associates Inc., 2002 (unpublished manuscript). It must be noted that the small schools research findings are merely suggestive of possible outcomes of SLC restructuring given that small schools may possess student- or school-level characteristics other than school size alone that contribute to their effectiveness.
9 Education reformers strongly support creating smaller schools, based on extant research, but as Raywid (1996) points out, there are also a considerable number of large schools that are already functioning well, and logistical issues and financial costs argue for maintaining the physical site of large high schools. Consequently, schools turn toward the creation of within-school subunits.

Chapter 1: Introduction 23
available addressing these strategies in isolation.10 Research findings, drawn from an extensive review of the literature for other SLC structures, are grouped together below:
• Career academies: Career academies organize curricula around one or more careers or occupations. The most rigorous research using an experimental design has been conducted on this strategy. Studies found moderate positive economic outcomes. For example, career academy graduates exhibit better employment outcomes, including earnings, work attendance, and work performance, than other graduates (Elliot, Hanser and Gilroy, 2000; Kemple, 1997, 2001; Kemple and Snipes, 2000).11
• Schools-within-a-school: These are multi-grade, separate, autonomous individual subunits organized around a theme, each with its own personnel, budget and program. Less rigorous nonexperimental studies have found modest improvement in academic, behavioral, attitudinal and process outcomes for school-within-a-school students (Oxley, 1997; Wasley et al., 2000).
• Houses: House plans assign students within the high school to groups of a few hundred each across grades. Each house has its own discipline policies, student activity program, student government, and social activities. Individual houses, however, are less autono-mous than school-within-a-school programs. Research on this strategy, unfortunately, has been quite limited.
• Magnet schools: These have a core focus (e.g., math and science, or arts), recruit students from the entire district, and sometimes select students meeting their selection criteria. Consequently, nonexperimental study findings of improvement in outcomes are potentially confounded by selection bias. Much of the research on magnet schools has focused on their effectiveness as a desegregation tool, but some of it has focused on outcomes of interest for SLCs. Some studies with the above limitations did find indications of greater student achievement and greater educational equity in magnet schools than in non-magnets (Gamoran, 1996; Duax, 1992).
In addition, the literature has reported on the effectiveness of strategies such as alternative scheduling. The most common form of this strategy, block scheduling, changes the way time is used in school by lengthening class periods and altering daily or annual schedules. Studies reviewed yielded insufficient evidence to support generalizations about effects of alternative scheduling on students. Finally, a recent research effort has been launched to study the implementation process of converting large high schools into smaller learning communities as part of the Gates Foundation National School District and Network Grants Program (American Institutes for Research, 2003). The early findings from this study have highlighted the initial difficulties schools face in creating new learning environments focused on smallness and increased personalization. The study further contrasts the more challenging task schools face in converting large schools as opposed to starting new schools. In
10 Freshman academies take a variety of forms, but are generally designed to help ease the transition from middle school
to high school. 11 More recent evaluations of two comprehensive high school reform models that include SLC components—High
Schools That Work and Talent Development High Schools—have reported enhanced outcomes for students; only two of these, however, are third-party evaluations (one of which has not yet been completed), and none is experimental.
Chapter 1: Introduction 24
these conversion schools, there was typically a longer planning process and start-up period involved than in the new small schools. Moreover, the findings from this study has confirmed the difficulty one faces in measuring “outcomes” on schools as they are immersed in the early stages of reconstituting an existing school structure and procedures. Facilitators and Challenges in Implementing Smaller Learning Community Reforms
Research on what factors contribute to effective implementation of SLCs consists primarily of anecdotal evidence, relying for the most part on the small schools research. For example, Raywid (1998) attributes the success of small schools to strong commitment on the part of teachers, a coherent mission on the part of school administrators, and a relative level of autonomy for the smaller school units. Ancess (1997), in a report offering strategies on how to launch small schools, cites commitment on the part of staff, students, and parents and sufficient financial resources, among others, as important components critical to their success. In her 2001 review of literature on smaller learning communities, Kathleen Cotton, late of the Northwest Regional Educational Laboratory, cites several factors, in addition to broad community support, that are critical to successful SLC implementation. Among factors mentioned are autonomy, programmatic separateness and distinctiveness, and the self-selection of students and teachers. Other key factors identified include a mission or vision supported by careful planning; schools—both students and staff—need to know where they are going, why, and how they are going to get there. Implementation must be accompanied by professional development to support teachers in the transition to SLCs and in developing skills of collaboration. Finally, efforts to sustain support over a period of time are critical so that implementation may be thorough rather than shallow (Cotton, 2001). Challenges to creating SLCs arise from both districts and schools. District reluctance to change can undermine schools’ efforts. In schools, problems can arise from logistical issues such as bell schedules or cafeteria space. Wasley et al. (2000) cite several other issues, including enrollment or student assignment procedures, principal support and turnover, and staff conflict and turnover. If principals are reluctant to share power, there is likely to be conflict with teachers and sub-unit heads (Pribesh, Lee and Osuna-Currea, 2001). Another challenge is the possibility of inadvertently creating hierarchies that segregate or resegregate students as they gradually choose some units over others, based on academic demand or existing membership (Ready, Lee and LoGerfo, 2001). It has also been noted that implementation of SLCs may require increases in budget, planning time, or staff in order to be successful (Legters, 1999).

Chapter 2: Study Design and Sample 25
Chapter 2 Study Design and Sample
This chapter begins with the presentation of the study design and measures used in describing implementation of the first group (cohort) of grantees funded through the SLC program. This group includes 119 schools funded through 63 three-year implementation grants awarded to school districts in fall 2000.12 The chapter concludes with a description of the schools and students in this first cohort of funded schools. The Implementation Study of Smaller Learning Communities addresses three major research questions:
• How are schools implementing SLCs—what are the principal strategies, models and practices implemented? In particular, do the SLC activities undertaken by schools meet some of the goals of the SLC legislation, such as: − Increasing personalization of the high school experience for all students, to counter
the effects of large, impersonal school structures? − Providing professional development for school staff in innovative teaching methods
that challenge and engage students? − Including parents, business representatives, institutions of higher education, etc. as
facilitators of activities and to provide links between students and their communities?
• How does implementation vary by approach and type of school, specifically with respect to freshman and career academies?
• What are the factors influencing (i.e., facilitating and inhibiting) implementation in SLC schools in general, and specifically with respect to freshman and career academies?
In addition, because there is an interest in determining the feasibility of using school performance data for estimating student impacts, an additional research question for this study is:
• How do outcomes for SLC schools change over time? Overview of the Study Design and Measures
The Implementation Study of Smaller Learning Communities provides the first comprehensive description of federally funded SLCs as implemented, and also provides data that will aid in understanding SLC school outcomes. To assess program implementation and to describe school outcomes, data have been collected on two groups of SLC schools: the 63 grantees (119 schools) that received three-year implementation grants in the first year of funding (fall 2000) and the 88 grantees (222 schools) that received funding in the second cycle (fall 2002).13
12 Cohort 1 originally consisted of 65 grantees (125 schools) receiving SLC funding. Program attrition, however, has
reduced this sample to a total of 63 grantees and 119 schools. A complete list of the Cohort 1 SLC grantees included in this study is presented in Appendix A.
13 This report does not include findings from the second cohort of 222 SLC schools funded in 2002. These schools were surveyed at only one time and did not have any case study visits. Findings for this cohort of SLC schools are summarized in the unpublished Cohort 2 Follow-up Report (Bernstein, Millsap, and Schimmenti, 2005, unpublished) available upon request.

Chapter 2: Study Design and Sample 26
This report includes data for only the first cohort of 63 grantees and relies on three major sources of data: Annual Performance Reports (APRs) completed by all Cohort 1 grantees or schools funded through the SLC program; a Periodic Implementation Survey (PIS), administered to all 119 Cohort 1 schools at two time points; and in-depth case studies of 18 Cohort 1 SLC schools. Site visits to these 18 schools were completed in fall 2002 and follow-up telephone interviews were conducted during spring 2004. Each of these measures is defined below. The timeline for collecting data for Cohort 1 is summarized below in Exhibit 2.1. Exhibit 2.1 Timeline for Implementation Study of Smaller Learning Communities by Data Collection Method 2001–02 2002–03 2003–04
Measures/Samples Fall Spring Fall Spring Fall Spring Annual Performance Report (APR)a
Cohort 1 (n=119) Periodic Implementation Survey (PIS)b
Cohort 1 (n=119) Case Studiesc Cohort 1 (n=18)
(site visit)
(telephone follow-up)
Notes: a APR data collected in the fall of each year relate to the previous school year.
b PIS data cover period through time of data collection. Spring 2002 PIS covers school years 2000–01 and 2001–02. Fall 2003 PIS covers school year 2002–03.
c Case study data cover period through time of data collection. Fall 2002 site visit covers school years 2000–01 and 2001–02. Spring 2004 telephone follow up covers school years 2002–03 and 2003–04.
Source: Abt Associates, Inc., 2007.
Annual Performance Report
The APR is collected by ED on an annual basis from all SLC grantees or schools to assess schools in terms of both implementation of their SLC as well as on several indicators of educational performance. These data are required by ED for program monitoring purposes and were not specifically designed to address the research questions for this study. The information is obtained at the grantee level (e.g., grants director, SLC project director) for each school with assistance from school principals. The data are measured at the school level for all students, so may not necessarily reflect outcomes attributable only to that portion of students involved in SLCs. The APR first

Chapter 2: Study Design and Sample 27
provides district and school background information, the number and type of SLC approaches, and general background information on the students. The APR also asks grantees to provide narrative text on project status, including any changes that have been or will be made to SLC approaches; these data were not analyzed as part of the evaluation. The APR includes a number of student outcome measures, such as:
• State-level assessment scores,
• College entrance exam data,
• Attendance,
• Graduation rates,
• Planned postsecondary enrollments,
• Dual enrollments (i.e., simultaneous enrollment in secondary and college-level courses),
• Participation in extracurricular activities, and
• Disciplinary indices, such as incidences of student violence, alcohol or tobacco use, and suspensions and expulsions.
These student outcome data are reported at the school level, broken out by grade. In the first round of APR data collection (fall 2001), schools were asked to provide data for the first implementation year after applying for SLC funds (SY 2000–01) as well as for the preceding four years. Subsequent administrations of the APR cover the most recently completed school year only. The APR is based on self-reported data submitted to ED by each SLC grantee. These data were collected through 2003 with the assistance of Abt’s subcontractor, the CDM Group, which was also responsible for entry and review of the data for each responding school.14 In the case of missing or out-of-range values, the data were verified either through callbacks with the grantee or via external data sources, such as Web sites maintained by state-level departments of education. Although instructions were given to each grantee defining how the APR should be filled out, considerable variation exists among grantees in terms of how certain outcomes, such as planned postsecondary attendance and extracurricular activities were interpreted. Moreover, measures of student academic performance on reading and mathematics tests are strictly state-specific, according to the varying definitions of proficiency used by each state. A copy of the APR can be found in Appendix B. Periodic Implementation Survey
The Periodic Implementation Survey (PIS), specifically designed for this study, provides substantially more detailed information on the implementation of various SLC strategies across all schools. The school principal or a designee such as the school’s SLC director typically completes the PIS. There were two administrations of PIS data collection (spring 2002 and fall 2003).15 This survey of the SLC schools addresses the following topics at the school level: 14 Response rates for the SY 1996–97 through SY 2002–03 administrations of the APR have ranged from 97 to 100
percent. 15 Response rates for the spring 2002 and fall 2003 PIS data collections were 97 percent and 90 percent, respectively. For
this report, however, we only present results on the 105 Cohort 1 schools responding to both administrations of the PIS.

Chapter 2: Study Design and Sample 28
• SLC structure: Timing of funding; student eligibility, selection, and demographics;
degree of SLC autonomy in a number of areas; and other reform efforts that are underway.
• SLC program implementation: SLC structures and strategies implemented, reasons for implementing SLCs, and teacher participation in deciding to implement an SLC.
• Factors affecting implementation: Ratings of a number of factors, such as available resources, physical space, faculty expertise, and parental support; ratings of other funds available that are used to support program goals.
• Faculty and Staff information: Degree of staff involvement in SLC, how teachers were assigned to SLC, and staffing needs.
• Student-staff relationships: Mentoring programs and advisories.
• Parental influence: Type and degree of parental involvement.
• Academic and nonacademic aspects of the SLC or school: Changes (if any) in course offerings and student course-taking patterns, types of student assessment used, and graduation requirements for SLC and other students.
• Background information about the respondent and the school: Principal’s experience, current school involvement in other reform efforts, decision-making responsibility in areas such as curriculum and school organization, graduation requirements, staffing needs, parent involvement, and external partners.
In addition to this school-level information, the survey also provides detailed information at the SLC structure level. To obtain a more detailed understanding of SLC implementation, the survey was structured to provide separate “modules” for each of the five major SLC structural approaches: career academies, freshman academies, house plans, magnet schools, and schools-within-a-school. Schools were instructed to complete modules for each SLC structure implemented. In addition, schools were asked to characterize, if applicable, their implementation of other common SLC approaches: block scheduling, career clusters, pathways or majors, adult advocates or mentors, teacher advisory programs, and teacher teams. The data by structure include student participation, degree of autonomy, teacher assignment, assessments, and level of decision-making. Copies of the two administered PIS surveys can be found in Appendix C. It should be noted that the PIS survey data are also based primarily on self-reported perceptions, and thus may reflect varying definitions of SLC implementation maintained by principals from school to school filling out the survey. As was the case with the APR, missing data from the survey were minimized by callbacks to the schools, requesting the information needed. Case Studies
The case studies, based on two-day site visits conducted in fall 2002 with telephone follow-up interviews conducted in spring 2004, involved a total of 18 Cohort 1 schools that implemented their planned SLC programs in the form of either freshman or career academies. Information was

Chapter 2: Study Design and Sample 29
collected primarily in individual and group interviews with district and school program staff, teachers, parents, and students, and also by classroom observations.16 The case studies were designed to provide in-depth information about the implementation of restructuring practices in a sample of the SLC sites, as well as the factors facilitating or inhibiting successful implementation. The set of site visits provides answers to questions tailored to each school about its progress in SLC implementation, and elaborates upon topics covered more broadly in the PIS, such as the strengths and challenges schools face in their implementation of different SLC strategies; contextual data about the host districts and communities; and rationales and background information about why grantees have selected specific approaches for their own high schools. Freshman academies and career academies were selected for more intensive study because they are the most commonly reported SLC structures among Cohort 1 schools. In selecting schools, we wanted to focus on those schools that were far along in the implementation process and who were involving all of their students eligible for participation (e.g., all ninth-graders in a freshman academy). Thus, two important criteria were initially adopted for the site selection process:
• Student participation: Schools report that 100 percent of their ninth-graders were participating in a freshman academy program, or, in the case of career academies, schools report that 100 percent of students were participating in a career academy in at least one grade level.
• Degree of SLC implementation: Schools report making considerable progress toward full implementation. In the case of freshman and career academies, the selection process initially stipulated that schools report on the PIS a 75 percent or greater level of progress towards full implementation based on their plans for their federally funded SLC program implementation.
Unfortunately, the site selection criteria were too rigorous for most schools to meet. Of those employing career academies, only five schools met the above two criteria. We were able, however, to recruit an additional three schools adopting career academy approaches with participation rates of at least 75 percent in one or more grades and implementation rates of 50 percent or greater. In the case selected had a participation rate of 100 percent in its freshman academy, and reported that it had made 65 percent progress toward full implementation. Thus, after an extensive recruitment process, we were able to include in the case studies a total of eight schools adopting career academy approaches and ten schools with freshman academies. It should be noted here that the schools reported on in this study only represent those schools receiving federal SLC funding in the first cohort. Thus, any results reported here pertain only to these schools and should not be used to make generalizations about implementation strategies being used in other restructuring schools that are not receiving federal SLC funding. This report focuses on the cohort of SLC schools that were eligible to start receiving funding in fall 2000.17 Data included in the analyses are based on the fall 2001, fall 2002 and fall 2003
16 A copy of the site-visit format that guided the content of the case studies can be found in Appendix D. 17 All the schools received funds in FY2000 but only 60 percent of their award; the remaining 40 percent was awarded in
FY2001 from FY2001 funds. Because schools will normally only expend 30 percent of the award in the first year this should not delay initiating the grant.
Chapter 2: Study Design and Sample 30
administrations of the APR, the spring 2002 and fall 2003 administrations of the PIS, and the case studies of 18 schools implementing either freshman or career academies. School and Student Characteristics in Cohort 1 SLC Schools
This section of the report describes school and student characteristics in Cohort 1 SLC schools compared to demographic characteristics of large schools nationwide for SY 2000–01.18 The data sources for Cohort 1 SLC schools are the APR and the SLC Awards Database (www.sedl.org/slc/), prepared by Southwest Educational Development Laboratory. We begin our discussion with a description of how the national comparisons were generated. Generating National Comparisons
Data from the Common Core of Data, Public Elementary, Secondary School Universe Survey, 2000–01 were used to generate a national comparison for the group of Cohort 1 SLC schools. Beginning with all schools in the sample (n=96,570), the dataset was first screened to include only those schools classified as regular, vocational, or other alternative, and only those schools classified as high schools or other. Next, the dataset was further restricted to match the SLC grant application stipulation that SLC grantees have students in grades 11 and 12 and have 1,000 or more students in grades 9 through 12. Further, schools with grades 9–12 enrollments of 1,000 or greater that also enrolled students in elementary and middle school grades were excluded from the national comparison group because none of the Cohort 1 SLC schools had this configuration. The resulting national comparison group of large high schools is based on 4,733 schools.19 Variation in cell sizes is the result of missing data. Geographical Location
The Cohort 1 SLC schools are located in 27 states across the country, depicted in Exhibit 2.2. As the map indicates, these schools represent all geographical regions in the U.S. Specifically, as shown in Exhibit 2.3, the schools are primarily concentrated in the West, representing one-third of the sample (the state of California alone accounts for 23 percent of the Cohort 1 schools). Over a fourth (27 percent) of the schools are located in the South, with the remaining 40 percent of schools divided equally between the Midwest and Northeast. Compared to other large high schools nationwide, the sample of SLC schools is more heavily represented in the West, and conversely less heavily in the South (Exhibit 2.3). Almost all of the Cohort 1 schools (96 percent) are located either in or near urban areas. As Exhibit 2.4 indicates, 60 percent of the Cohort 1 schools are located in either large or mid-size central cities (compared to a third of large U.S. high schools), with an additional large group of schools (36 percent) located in suburban areas. Only 4 percent of the Cohort 1 schools are located in a rural or town setting (compared to 21 percent of large U.S. high schools).
18 Appendix E, Exhibit E.1, contains summary demographic characteristics for Cohort 1 SLC schools from 1996–97
through 2002–03. 19 This group of large U.S. high schools also includes the SLC schools in our study.

Chapter 2: Study D
esign and Sample
31
Exhibit 2.2 SLC Grantees—Cohort 1
Shaded states indicate states containing SLC Cohort 1 grantees. Individual grantees indicated by “*” symbol.
Source: Abt Associates, Inc., 2007.

Chapter 3: Implementation of Smaller Learning Communities 32
Exhibit 2.3 Geographical Regions of SLC Schools Compared to Large U.S. High Schools
34%
27%
20% 19%
25%
36%
22%
17%
0%
20%
40%
West South Midwest Northeast
Perc
ent o
f Sch
ools
SLC schools Large U.S. high schools
Exhibit reads: Thirty-four percent of SLC schools are located in the west, compared to 25 percent of large U.S. high schools.
Source: Southwest Educational Development Laboratory–SLC Awards Database; Common Core of Data, Public Elementary and Secondary School Survey, 2000–01.
Exhibit 2.4 Urbanicity of SLC Schools Compared to Large U.S. High Schools
3%1%
3%
33%
24%
36%
12%9% 10%
36%
18%15%
0%
20%
40%
Rural,inside/outside MSA
Large/Small town Urban fringe ofmid-size city
Urban fringe oflarge city
Mid-size centralcity
Large central city
Perc
ent o
f Sch
ools
SLC schools Large U.S. high schools
Exhibit reads: Three percent of SLC schools are located in a rural setting, compared to 12 percent of large U.S. high schools.
Source: Southwest Educational Development Laboratory–SLC Awards Database; Common Core of Data, Public Elementary and Secondary School Survey, 2000–01.

Chapter 3: Implementation of Smaller Learning Communities 33
School Size
The 117 Cohort 1 SLC schools that completed an APR served a total of 228,944 students during the 2000–01 school year. The average size of these high schools during that year was 1,957 students (median = 1,874), which, as shown in Exhibit 2.5, is larger than their reference group of large U.S. high schools (mean = 1,697, median = 1,554). Exhibit 2.6 summarizes the distribution of SLC schools in terms of school size and provides comparison data for all large U.S. high schools. As the exhibit shows, the majority of schools (54 percent) fall within the range of 1,500 to 2,500 students. Exhibit 2.5 Demographic Characteristics of SLC Schools and National Comparisons With Large U.S. High Schoolsa SLC Schools Large U.S. High Schools n Mean Median 25th
Percentile 75th
Percentile n Mean Median 25th
Percentile 75th
Percentile Total enrollmentb
117 1,957 1,874 1,402 2,216 4,733 1,697 1,554 1,251 1,983
Percent of minority enrollmentc
117 57% 60% 29% 87% 4,492 33% 22% 7% 51%
Percent of LEP enrollment
117 11% 6% <1% 17% 3,897 9% 4% 1% 12%
Percent of students with disabilities enrollment
117 10% 10% 6% 14% 4,591 13% 12% 11% 14%
Notes: a National comparisons of limited English proficiency (LEP) and students with disabilities enrollment information were not available at the school-level. Rather, data were available at the district-level through the Common Core of Data, Local Education Agency Universe Survey, 2000–01. In order to generate estimates of percentage of student population that is LEP or is disabled, the district-level dataset was linked to the school-level dataset, restricted to contain only large high schools. In the case of multiple schools within one district, district-level data is present in the dataset for each school. Further, LEP or disabilities estimates were not able to be determined for high school students only. Rather, national estimates were created based on total district membership. That is, percentage of student body that is LEP was created by dividing the number of LEP students served in appropriate programs by the calculated total student membership of the local education agency. The estimate of percentage of students with disabilities was created similarly, using the number of students having a written Individual Education Plan as the numerator.
b National comparison calculated by summing total student enrollments in grades 9–12. Source: Common Core of Data, Public Elementary, Secondary School Universe Survey, 2000–01.
c Minority enrollment defined as the sum of the following race or ethnic categories: American Indian or Alaska Native, African-American, Hispanic, and Native Hawaiian or Pacific Islander. National comparison calculated by summing total minority student enrollments in grades 9–12 and dividing by total student enrollment for which ethnicity was known.
Source: Abt Associates, Inc., 2007

Chapter 3: Implementation of Smaller Learning Communities 34
Exhibit 2.6 Total Student Enrollment of SLC Cohort 1 Schools, Compared With Large U.S. High Schools
30%
54%
11%5%
46% 45%
8%2%
0%
20%
40%
60%
1,000–1,499 1,500–2,499 2,500–3,499 3,500+
Number of students
Per
cen
t of S
choo
ls
SLC schools Large U.S. high schools
Source: Implementation Study of Smaller Learning Communities, SLC Annual Performance Report,
SY 2000–01; Common Core of Data, Public Elementary and Secondary School Universe Survey, 2000–01.
Exhibit reads: Thirty percent of SLC schools have between 1,000 and 1,500 students, compared to 46 percent of large U.S. high schools.
Ethnicity
As displayed in Exhibit 2.7, across all Cohort 1 schools, over one-third of students are white, over one-fourth of students are Hispanic or Latino, and one-fourth are African-American or black. There is considerable variation among the Cohort 1 SLC schools in terms of minority enrollment. As indicated by Exhibit 2.8, the majority of schools are fairly heterogeneous with respect to minority enrollment. Close to two-thirds of the Cohort 1 schools (62 percent) are majority minority, that is, they have minority enrollments of 50 percent or higher. In contrast, only 10 percent of the schools have minority enrollments of less than 10 percent, whereas 17 percent are predominantly minority (90 percent or higher). Exhibit 2.8 also displays the contrast with all large U.S. high schools, indicating that SLC schools have higher concentrations of minority students.

Chapter 3: Implementation of Smaller Learning Communities 35
Exhibit 2.7 Percentage of Students by Race or Ethnicity in Cohort 1 SLC Schools, 2000–01
38%
30%25%
5%2%
0%
20%
40%
60%
White Hispanic African-American Asian Other
Perc
ent o
f Stu
dent
s
Exhibit reads: Thirty-eight percent of students in SLC schools are white.
Source: Implementation Study of Smaller Learning Communities, SLC Annual Performance Report, SY 2000–01.
Exhibit 2.8 Minority Enrollment of SLC Cohort 1 Schools, Compared With Large U.S. High Schools
10%
28%
45%
17%
31%
43%
17%
8%
0%
20%
40%
60%
<10% 10–49.9% 50–89.9% 90–100%
Minority Enrollment
Perc
ent o
f Sch
ools
SLC schools Large U.S. high schools
Exhibit reads: Ten percent of SLC schools have minority enrollments of less than 10 percent, compared to 31 percent of large U.S. high schools.
Source: Implementation Study of Smaller Learning Communities, SLC Annual Performance Report, SY 2000–01; Common Core of Data, Public Elementary and Secondary School Universe Survey, 2000–01.

Chapter 3: Implementation of Smaller Learning Communities 36
Other Demographic Characteristics: Limited English Proficiency and Students With Disabilities
According to Exhibit 2.5, the Cohort 1 SLC schools serve, on average, somewhat fewer students with disabilities, but slightly more students who were classified as LEP or as English Language Learners (ELL) than large U.S. high schools. Exhibits 2.9 and 2.10 further present the distributions of LEP students and students with disabilities for SLC schools and large high schools nationwide. SLC schools are more likely than large U.S. high schools to have at least 10 percent of their student enrollment be classified as LEP. On the other hand, they are more likely to have fewer than 10 percent students with disabilities. Exhibit 2.9 LEP Enrollment of SLC Cohort 1 Schools, Compared With Large U.S. High Schools
16%
43%
27%
14%
3%
67%
20%10%
0%
20%
40%
60%
80%
0% 1–9.9% 10–24.9% 25%+
Limited English Proficiency Enrollment
Perc
ent o
f Sch
ools
SLC schools Large U.S. high schools
Exhibit reads: Sixteen percent of SLC schools have no LEP students enrolled, compared to 3 percent of large U.S. high schools.
Source: Implementation Study of Smaller Learning Communities, SLC Annual Performance Report, SY 2000–01; Common Core of Data, Public Elementary and Secondary School Universe Survey, 2000–01.

Chapter 3: Implementation of Smaller Learning Communities 37
Exhibit 2.10 Students With Disabilities Enrollment of SLC Cohort 1 Schools, Compared With Large U.S. High Schools
13%
34% 36%
17%
1%
17%
61%
21%
0%
20%
40%
60%
<5% 5–9.9% 10–14.9% 15%+
Students with Disabilities Enrollment
Perc
ent o
f Sch
ools
SLC schools Large U.S. high schools
Exhibit reads: Thirteen percent of SLC schools have students with disabilities enrollments of less than 5 percent, compared to 1 percent of large U.S. high schools.
Source: Implementation Study of Smaller Learning Communities, SLC Annual Performance Report, SY 2000–01; Common Core of Data, Public Elementary and Secondary School Universe Survey, 2000–01.
The data in this chapter indicate that Cohort 1 SLC schools are not necessarily representative of other large U.S. high schools. Namely, these schools are more likely to be located in western states and urban areas, are somewhat larger, and enroll higher percentages of minority and LEP students, but enroll smaller percentages of students with disabilities. The following chapter presents a detailed discussion of the implementation of SLCs across all Cohort 1 schools.

Chapter 3: Implementation of Smaller Learning Communities 38

Chapter 3: Implementation of Smaller Learning Communities 39
Chapter 3 Implementation of Smaller Learning Communities, 2000–03: Survey Results
Introduction
This chapter focuses on how high schools have used their federal funding to plan and develop SLC structures and strategies.20 Specifically, the chapter focuses on the following key implementation questions:
• Why did schools decide to apply for SLC funding and to implement an SLC?
• What structures and strategies have SLC schools implemented—e.g., freshman academy, career academy, block scheduling, mentors, etc.?
• To what extent do the SLC activities undertaken by schools meet some of the goals of the SLC legislation,21 such as:
− Developing strategies to create a more personalized high school experience for students to counter the effects of large, impersonal school structures?
− Providing professional development for school staff in innovative teaching methods that challenge and engage students?
− Including parents, business representatives, institutions of higher education, etc., as facilitators of activities and to provide links between students and their communities?
• What factors have facilitated or inhibited implementation of SLCs?
Data for this chapter come primarily from the Periodic Implementation Survey (PIS) administered in the fall of 2003, and focus on those activities taking place in the 2002–03 school year. 22 When reporting the reasons for applying for SLC funding or change over time (as in schools changing structures and strategies over time), we also use survey data from the 2001–02 school year, using the PIS administered in the spring of 2002.
20 The findings in this chapter are reported, for the most part, at the school level. More detailed implementation findings,
broken down by types of SLC structures employed, are presented in Appendix F. 21 Public Law 107-110, the No Child Left Behind Act of 2001, Section 5441. 22 The Annual Performance Reports (APR) completed in the fall of 2001, 2002, and 2003 are a supplementary source of
data on which SLC structures and strategies schools are implementing.

Chapter 3: Implementation of Smaller Learning Communities 40
Note on Interpreting Implementation Findings
As in every evaluation of comprehensive school reform efforts, change is best modeled as a dynamic incremental process, often requiring a gradual start-up period while schools develop and put into place an intervention. Therefore, results from implementation of these reform efforts often do not show up for several years, often after data collection has ended. For this reason, the results presented in this chapter should be viewed with caution, recognizing that implementation is a dynamic process and that it may take longer than a three-year period for structural changes to emerge. Why Have Schools Chosen to Apply for Federal SLC Funds and Implement an SLC?
Most schools reported applying for SLC funds to increase overall student academic achievement (95 percent of schools), academic achievement of at-risk students (90 percent), and student motivation (87 percent). Schools were far more likely to cite student academic or behavioral issues as major influences in their decision to implement an SLC program than issues external to the school (e.g., responding to state or district initiated testing or school reforms). The range of major influences on seeking SLC funding is discussed in detail below.

Chapter 3: Implementation of Smaller Learning Communities 41
Student Academic Performance
The single factor deemed “very important” by nearly all respondents (95 percent) in applying for a federal SLC grant was student academic achievement, with at-risk students being a key focus of many respondents’ efforts (Exhibit 3.1). Eighty-one percent of schools applied for federal SLC funds in order to increase graduation rates, and nearly as many (77 percent) aimed to improve promotion rates—particularly 9th- to 10th-grade promotion—through some sort of personalization-oriented reform. Thus, although increasing student academic achievement motivated most schools, subsets of schools were focused on specific strategies (e.g., academic course-taking) as a means of encouraging achievement. Exhibit 3.1 Percentage of Schools Indicating That Academic Factors Were Very Important in Deciding to Apply for SLC Funds (n=103)
49% 48% 46%
74%77%
95%90%
81%
0%
20%
40%
60%
80%
100%
Studentacademic
achievement
Academicachievement
of at-riskstudents
High schoolgraduation
rates
Promotionrates
Academiccourse-taking
SAT/ACT test-taking rates
Vocationalcourse-taking
Acquisition oftechnical
skills
Perc
ent o
f Sch
ools
Exhibit reads: Ninety-five percent of SLC schools indicated that student academic achievement was a very important academic factor in deciding to apply for SLC funds.
Source: Implementation Study of Smaller Learning Communities, Periodic Implementation Survey, 2002, Section IA, Question 6: “How important were each of the following factors in your decision to apply for a federal SLC grant? Student academic factors”

Chapter 3: Implementation of Smaller Learning Communities 42
Student Behavior
Increasing student motivation and morale, improving student-teacher relationships, and reducing dropout and absenteeism rates were the student behaviors most often cited as being very important to schools in deciding to apply for SLC funding. At least three-fourths of the SLC schools identified these as key reasons (Exhibit 3.2). Exhibit 3.2 Percentage of Schools Indicating That Behavioral and Attitudinal Factors Were Very Important in Deciding to Apply for SLC Funds (n=102)
52%
43%
32%
76%
85%87%
75% 75%
0%
20%
40%
60%
80%
100%
Studentmotivation
Student-teacherrelationships/
interaction
Dropout rates Student morale Absenteeism Incidence ofstudent tardiness
Incidence ofstudent violence
Participationrates in
extracurricularactivities
Perc
ent o
f Sch
ools
Exhibit reads: Eighty-seven percent of SLC schools indicated that student motivation was a very important attitudinal factor in deciding to apply for SLC funds.
Source: Implementation Study of Smaller Learning Communities: Periodic Implementation Survey, 2002, Section IA, Question 6: “How important were each of the following factors in your decision to apply for a federal SLC grant? Student behavioral/attitudinal factors”
School and External Goals
In addition to student goals, schools reported other goals within the school in their decision-making process. Nearly half of the PIS respondents (44 percent) indicated that teacher support for SLC reform was a major influence in the school’s decision to implement an SLC program (Exhibit 3.3). The decision to implement an SLC program was also often driven by broader influences outside of the school, such as the district or state. For example, more than half (54 percent) of the schools indicated that better preparation for state assessments was a major influence in their decision to implement an SLC program, and nearly half (49 percent) cited district-initiated school reform as the impetus for their decision (Exhibit 3.3).

Chapter 3: Implementation of Smaller Learning Communities 43
Exhibit 3.3 Percentage of Schools Indicating That School and External Factors Had a Major Influence on Their Decision to Implement an SLC Program (n=103)
8%14%
18%
54%49%
44%
0%
20%
40%
60%
80%
100%
Need for better studentpreparation for
mandated assessments
District-initiated schoolreform
Teacher support State-initiated schoolreform
Local employer interest City/town governmentinterest
Perc
ent o
f Sch
ools
Exhibit reads: Fifty-four percent of SLC schools indicated that the need for better student preparation for mandated assessments had a major influence on the decision to implement an SLC program.
Source: Implementation Study of Smaller Learning Communities: Periodic Implementation Survey, 2002, Section IB, Question 1: “How influential were the following factors in your decision to implement an SLC program?”
What Structures and Strategies Have SLC Schools Implemented?
The discussion in this section makes a distinction between SLC structures—innovations that require a substantial change to a school’s organization, such as assigning students and staff to subunits for much or all of the school day—and SLC strategies that reflect other less comprehensive approaches to personalizing education. SLC structures include career academies, freshman academies, house plans, magnet programs, and schools-within-a-school. The other personalization strategies include block scheduling, career clusters, pathways, adult advocates or mentors, teacher advisory programs, and teacher teams. The federal legislation allows and program guidance encourages, SLC grantees to implement the structures and strategies most applicable to their needs. Schools tended to implement multiple structures and strategies, with the most prevalent structures being career and freshman academies. Schools also changed over time, both in the number and types of SLC structures they were implementing. In the case of freshman academies, house plans, and career academies, schools involved a majority of their eligible students. Schools also chose to implement one or more SLC strategies, with block scheduling and teacher teams being the most popular choices. In almost all of these instances, a majority of a school’s students were involved in the strategies chosen by the school.

Chapter 3: Implementation of Smaller Learning Communities 44
Changes in SLC Structures Implemented Over Time
The number of structures being implemented varied across SLC schools (Exhibit 3.4). Eighty-four percent of schools chose to implement some type of structure in the 2002–03 school year, with close to one-half of the schools (47 percent) implementing one structure, and over another third (37 percent) implementing two or more structures. In contrast, 16 percent of schools did not implement any SLC structures in 2002–03 (down from 23 percent in 2001–02).23 On average, schools implemented 1.3 structures. This represented an increase over the previous school year, where schools reported implementing an average of 1.1 SLC structures.24 Exhibit 3.4 Number of SLC Structure Types Implemented Across SLC Schools in SY 2002–03 (n=105)
Three or Four Structures
7%
No Structures16%
One Structure47%
Two Structures30%
Exhibit reads: Thirty percent of SLC schools reporting implementing two SLC structures in the 2002–03 school year.
Source: Implementation Study of Smaller Learning Communities, Periodic Implementation Survey, 2003. Percentages based on number of respondents completing survey module corresponding to each type of SLC structure.
Particularly noteworthy are the changes schools undertook in their implementation of SLC structures across the years of their grant. Exhibit 3.5 summarizes the types of SLC structures adopted by schools in both SY 2001–02 and 2002–03, taking into account that some schools were implementing 23 Although these schools did not report implementing any SLC structures, they were involved in one or more SLC-
allowable strategies. 24 It is also noteworthy that over two-thirds of the SLC schools (70 percent) either maintained or expanded their SLC
programs over time.

Chapter 3: Implementation of Smaller Learning Communities 45
more than one structure. Across Cohort 1 schools, the most commonly implemented structures in SY 2002–03 were academies, with more than one-third of schools (42 percent) reporting that they implemented career academies and more than one-half (55 percent) reporting that they implemented freshman academies. This represented an increase (17 percentage points) in the number of schools that had been implementing freshman academies in SY 2001–02. In terms of the other structures that schools could implement (schools-within-a-school, house plans, magnet schools), there was little change between the two school years, with only a small number of schools implementing these structures.
Exhibit 3.5 Percentages of SLC Schools Implementing Each Type of SLC Structure (n=105)
6%
10%
16%
55%
42%
38%
38%
7%
10%
14%
0% 20% 40% 60%
Magnet Schools
House Plans
Schools-within-a-School
Freshman Academies
Career Academies
Percent of Schools
2001–02
2002–03
Schools with:
Exhibit reads: Thirty-eight percent of SLC schools reported implementing career academies in the 2001–02 school year. Forty-two percent reported implementing career academies in the 2002–03 school year.
Note: Percentages exceed 100 percent within a school year because schools may implement more than one SLC structure.
Source: Implementation Study of Smaller Learning Communities, Periodic Implementation Surveys, 2002 and 2003. Percentages based on number of respondents completing survey module corresponding to each type of SLC structure.

Chapter 3: Implementation of Smaller Learning Communities 46
Exhibit 3.6 presents a breakdown, by SLC structure, of the number of schools continuing, dropping or adding SLC structures from SY 2001–02 to SY 2002–03. In the case of schools that had in place career academies, freshman academies, or schools-within schools in SY 2001–02, most continued those structures through SY 2002–03. For example, 83 percent (33 out of 40) of schools implementing freshman academies in SY 2001–02 continued implementing them during the following school year. In the case of schools that had started implementing house plans and magnet schools in SY 2001–02, however, fewer than half of them had continued implementing these structures in SY 2002–03.25 Exhibit 3.6 Changes in SLC Structures Over Time
SY 2001–02 SY 2002–03 Career Academies (n=40)
Continued (n=29) + New (n=15) = Total (n=44) Dropped (n=11)
Freshman Academies (n=40)
Continued (n=33) + New (n=25) = Total (n=58) Dropped (n=7)
Schools-Within-a-School (n=15)
Continued (n=11) + New (n=6) = Total (n=17) Dropped (n=4)
House Plans (n=11) Continued (n=4) + New (n=6) = Total (n=10)
Dropped (n=7) Magnet Schools (n=7) Continued (n=3) + New (n=3) = Total (n=6)
Dropped (n=4) Exhibit reads: Of the 40 schools implementing career academies in SY 2001–02, 29 continued implementing them in SY 2002–03. In addition, 15 schools not previously implementing career academies began to do so, and 11 schools dropped their academies.
Source: Implementation Study of Smaller Learning Communities, Periodic Implementation Surveys, 2002 and 2003.
As Exhibit 3.6 shows, a number of schools began implementing structures in SY 2002–03.26 For example, of those schools implementing career academies in SY 2002–03, 34 percent (15 out of 44) of these schools were implementing new structures. These findings indicate, therefore, a good deal of continuity in their SLC implementation on the part of schools with freshman academies, career academies, or schools-within-a-school. Schools that reported implementing house plans and magnet plans were more fluid in their implementation.
25 It should be pointed out, however, that these percentages are based on relatively small sample sizes. 26 In fact, of the 24 schools that had reported not implementing any structures in SY 2001–02, 62 percent of them reported
implementing one or more SLC structures in SY 2002–03. Conversely, there were nine Cohort 1 schools (8 percent) that were implementing structures in SY 2001–02 but were no longer implementing them the following school year.

Chapter 3: Implementation of Smaller Learning Communities 47
Types of SLC Schools
As we can see from Exhibit 3.5, the percentages of Schools implementing SLC structures exceed 100 percent because schools may implement more than one SLC structure. When categorizing schools in terms of the unique combination of SLC structures implemented, the Cohort 1 schools broke down into five main groups:
• Career academy schools. These are schools that report that they are implementing career academies, alone or in combination with other SLC structures excluding freshman academies.
• Freshman academy schools. These are schools that report that they are implementing freshman academies, alone or in combination with other SLC structures excluding career academies.
• Career academy or freshman academy combination schools. These are schools that report that they are implementing both career and freshman academies, alone or with combination with other structures.
• Other structures. These are schools that report that they are only implementing other SLC structures such as house plans, schools-within-schools, or magnet schools, either alone or in combination with each other.
• No structures. These are schools that report they are not implementing any SLC structures, but are involved in one or more SLC allowable strategies.
Exhibit 3.7 displays the distribution of school types, broken down by combination of SLC structures, for Cohort 1 schools during the 2001–02 and 2002–03 school years. As presented in Exhibit 3.7, there was a marked increase from SY 2001–02 to 2002–03 both in the number of freshman academy schools (8 percentage point increase) and career academy or freshman academy combination schools (9 percentage point increase), in line with the dramatic increase in the number of schools adopting freshman academies in SY 2002–03 (see Exhibit 3.5). It is also noteworthy that schools with no SLC structures decreased in number from 23 to 16 percent between the two school years.
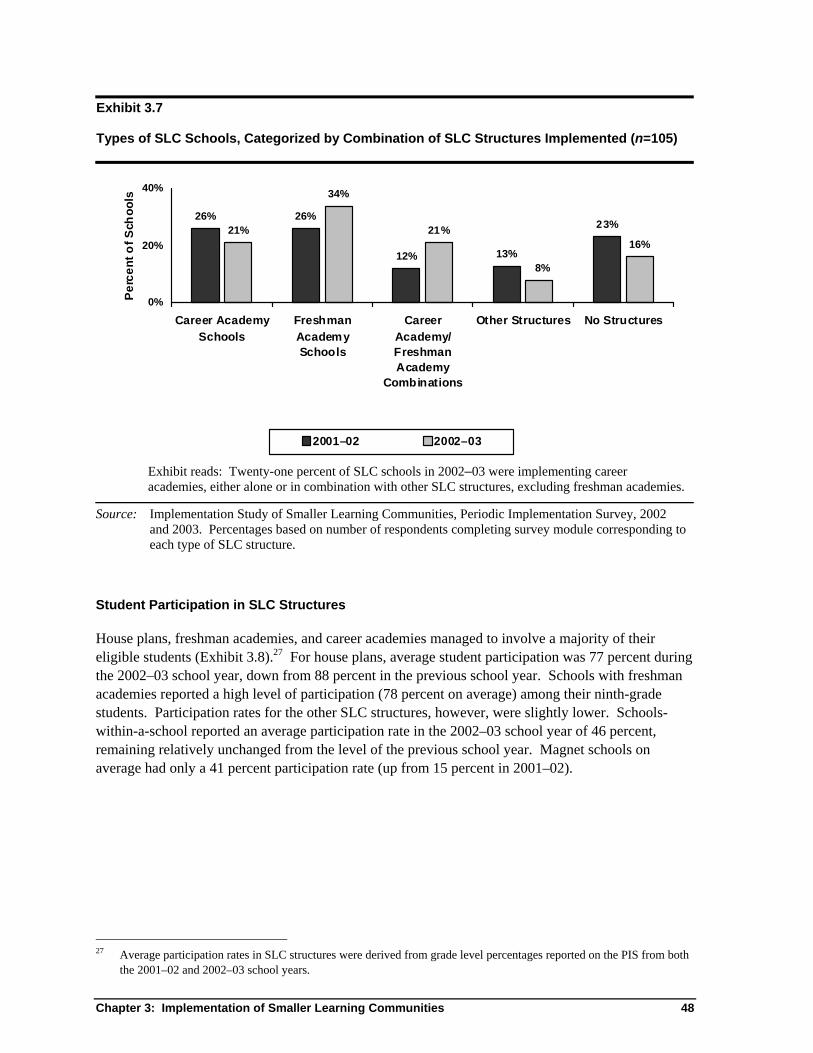
Chapter 3: Implementation of Smaller Learning Communities 48
Exhibit 3.7 Types of SLC Schools, Categorized by Combination of SLC Structures Implemented (n=105)
26% 26%
12% 13%
23%21%
34%
21%16%
8%
0%
20%
40%
Career AcademySchools
FreshmanAcademySchools
CareerAcademy/FreshmanAcademy
Combinations
Other Structures No Structures
Per
cent
of S
choo
ls
2001–02 2002–03
Exhibit reads: Twenty-one percent of SLC schools in 2002–03 were implementing career academies, either alone or in combination with other SLC structures, excluding freshman academies.
Source: Implementation Study of Smaller Learning Communities, Periodic Implementation Survey, 2002 and 2003. Percentages based on number of respondents completing survey module corresponding to each type of SLC structure.
Student Participation in SLC Structures
House plans, freshman academies, and career academies managed to involve a majority of their eligible students (Exhibit 3.8).27 For house plans, average student participation was 77 percent during the 2002–03 school year, down from 88 percent in the previous school year. Schools with freshman academies reported a high level of participation (78 percent on average) among their ninth-grade students. Participation rates for the other SLC structures, however, were slightly lower. Schools-within-a-school reported an average participation rate in the 2002–03 school year of 46 percent, remaining relatively unchanged from the level of the previous school year. Magnet schools on average had only a 41 percent participation rate (up from 15 percent in 2001–02).
27 Average participation rates in SLC structures were derived from grade level percentages reported on the PIS from both
the 2001–02 and 2002–03 school years.

Chapter 3: Implementation of Smaller Learning Communities 49
Exhibit 3.8 Average Percentage of Eligible Student Enrollment in SLC Structures, in Schools Implementing Each Type of Structure
88%
80%
47%43%
15%
77% 78%
46%52%
41%
0%
20%
40%
60%
80%
100%
(n=11) (n-11)House Plans
(n=40) (n=54)FreshmanAcademies
(n=15) (n=17)Schools-Within-
a-School
(n=40) (n=44)Career
Academies
(n=7) (n=6)Magnet Schoolsa
Per
cent
of
Stud
ents
2001–02
2002–03
b
Exhibit reads: In SLC schools implementing house plans, 88 percent of students, on average, participated in a house plan during the 2001–02 school year.
Source: Implementation Study of Smaller Learning Communities, Periodic Implementation Survey, 2002, Module Question 4, and 2003, Module Question 5: “What percentage of the students at your school at each grade level participated in Career Academies?”
Notes: a n refers to the number of schools implementing each SLC structure and reporting student enrollment data for that year.
b Due to changes to the PIS from 2001–02 to 2002–03, comparable data were not available on freshman academies from this source. The participation rate for freshman academies is based on data from the APR and was calculated by dividing the reported number of ninth-grade students involved in freshman academies by the total number of students enrolled in the ninth-grade, in schools implementing freshman academies.
SLC Strategies Implemented and Student Participation
In addition to SLC structures, schools used various SLC strategies. On average, schools reported using an average of 2.3 strategies during school year 2002–03, down from an average of 2.7 the previous year. Half of the SLC schools used a total of three or more strategies during school year 2002–03, down from 60 percent of the schools the previous year. Schools thus appeared to be gradually shifting from the use of SLC strategies to a greater use of SLC structures over time, especially freshman academies. Exhibit 3.9 shows that the most frequently utilized strategies in 2002–03 were block scheduling (58 percent of schools) and teacher teams (52 percent). Even the least frequently used strategy, teacher advisory programs, was used by a third of the schools. All of these strategies, however, decreased in their use compared to the previous school year.

Chapter 3: Implementation of Smaller Learning Communities 50
Exhibit 3.9 Percentage of SLC Schools Implementing Each Type of SLC Strategy, Alone or in Combination With a Comprehensive “Structure” (n=105)
34%
37%
52%
47%
58%
37%
46%
60%
65%
67%
0% 20% 40% 60%
Teacher Advisory Programs
Adult Advocates/Mentors
Teacher Teams
Career Clusters/Pathways
Block Scheduling
Percent of Schools
2002–03 2001–02
Exhibit reads: Sixty-seven percent of SLC schools reported implementing block scheduling in the 2001–02 school year. Fifty-eight percent reported implementing block scheduling in the 2002–03 school year.
Source: Implementation Study of Smaller Learning Communities, Periodic Implementation Surveys, 2002 and 2003, Other SLC Strategies Module, Question A: “Are you implementing this strategy/Were you implementing this strategy in 2002–03?”
Note: Percentages do not add up to 100 percent within a school year due to schools implementing more than one SLC strategy.
The highest percentages of students were involved in teacher advisory programs and block scheduling in 2002–03 (88 and 84 percent of the students in those schools implementing these strategies

Chapter 3: Implementation of Smaller Learning Communities 51
respectively).28 These percentages represented increases over what was reported in 2001–02. Each of the other strategies reached close to or more than half of the students in the schools implementing those strategies in 2002–03, also showing slight increases over reported percentage rates in the previous year (Exhibit 3.10). Exhibit 3.10 Average Percentage of Total Student Enrollment in SLC Strategies, Where Strategies are Being Implemented
80%76%
58% 58%
41%
60%
88%84%
60%
46%
0%
20%
40%
60%
80%
100%
(n=70) (n=61)Block Scheduling
(n=39) (n=36)Teacher Advisory
Programs
(n=48) (n=39) AdultAdvocates
(n=68) (n=49)Career
Clusters/Pathways
(n=63) (n=55)Teacher Teams
Perc
ent o
f Stu
dent
s
2001–022002–03
Exhibit reads: In SLC schools implementing block scheduling, 80 percent of students, on average, participated in block scheduling in 2001–02.
Source: Implementation Study of Smaller Learning Communities, Periodic Implementation Surveys, 2002 and 2003, Other SLC Strategies Module, Question E: “What percentage of each grade participates in this SLC strategy?”
Note: a n refers to the number of schools implementing each SLC structure and reporting student enrollment data for that year.
28 Average participation rates in SLC strategies were derived from grade level percentages reported on the PIS from both
the 2001–02 and 2002–03 school years.
Chapter 3: Implementation of Smaller Learning Communities 52
Meeting the Other Goals of SLC Legislation
In this section, we consider the extent to which SLC activities undertaken by Cohort 1 schools meet some of the goals of the SLC legislation such as:
• Increasing personalization of the high school experience for all students to counter the effects of large, impersonal school structures;
• Providing professional development for school staff in innovative teaching methods that challenge and engage students; and
• Including parents, business representatives, institutions of higher education, and others as facilitators of activities and to provide links between students and their communities.
In addressing the goals of the SLC legislation, schools made a variety of choices depending on the specific purposes set for their SLC restructuring reforms, as well as on existing factors, which are discussed later in this chapter. Increasing Personalization
Introduction A concern among schools is that student anonymity leads to a lack of student connection to or investment in learning, which in turn leads to student underachievement and dropping out. To combat student anonymity, schools commonly set as a goal that each student is known well by at least one adult within the school. As reported on in the previous section, large high schools employ a variety of SLC structures and strategies to personalize the learning experiences of their students. Although SLCs can take a variety of forms—career academies, house plans, and strategies such as block scheduling—they all share the common goal of enhancing personalization. SLC schools currently employ a number of mechanisms to achieve the goal of increased personalization, such as:
• Formal mentoring programs linking students with faculty or other adults;
• Individualized assessment strategies, such as the use of culminating projects and portfolios; and
• Other changes made at the classroom or school level to foster smallness, such as changes in scheduling so that students maintain the same teachers across multiple years.
All but two schools reported undertaking efforts to increase personalization. More schools were engaged in individualizing assessments and reducing class size (or reducing the total number of students for which a teacher was responsible) than creating intensive mentoring efforts. Half of the schools reported making significant efforts on at least one dimension of personalization. Of these, most schools were high on a single dimension (34 schools), but another 17 schools were high on two dimensions. A single school reported making significant efforts on all three dimensions. To measure personalization efforts within SLC schools, the PIS included a number of items to explore strategies currently being implemented. Exhibit 3.11 presents the group of PIS items used to

Chapter 3: Implementation of Smaller Learning Communities 53
measure the three mechanisms of fostering personalization. One set of questions collected information on the implementation and scope of formal mentoring programs within SLC schools. Teachers serve as advisors or mentors in 60 percent of the schools (as a result of SLC funding), whereas almost half (47 percent) of the SLC schools formally paired students with adult mentors with whom they meet individually (Exhibit 3.12). Within these latter schools, an average of two-thirds of students (67 percent) are formally paired with their mentors. These students meet with their mentors, on average, about twice a month, with half of these students meeting on at least a weekly basis. Exhibit 3.11 PIS Items Used to Measure Three Components of Personalization Formal mentoring programs linking students with faculty or other adults
• Teachers serve as advisors or mentors • School has formal mentoring program • Percentage of students assigned to mentor • Frequency of student or mentor meetings
Individualized assessment strategies, such as the use of culminating projects and portfolios • More varied student assessments used • Individualized assessments used throughout school • Individual assessments required for graduation
Changes made at the classroom or school level to foster smallness, such as changes in scheduling so that students maintain the same teachers across multiple years
• Students keep same homeroom teacher throughout high school • Independent study available in core academic classes • Cooperative learning focus integrated into curriculum • Student evaluations of teachers being used • Students taught by same cluster of teachers for multiple years • Classes smaller than before • Teachers responsible for smaller number of students than before
Source: Implementation Study of Smaller Learning Communities, Periodic Implementation Survey, 2003.
Another set of questions collected additional information on the extent to which individualized assessments, such as portfolios and student exhibitions, are being used in SLC schools, generally and as requirements for graduation. As shown in Exhibit 3.12, individualized assessments are being used in three-quarters of the schools (76 percent). In close to two-thirds of the schools (64 percent), individual assessments are required for graduation, and in half of the schools, more varied student assessments are being used for grading or promotion decisions as a result of SLC funding. Lastly, respondents were asked whether as a result of federal SLC program funding, certain changes had been made at the school or classroom level to foster more faculty or student interaction. According to Exhibit 3.12, almost two-thirds of the schools (63 percent) reported integrating a “cooperative learning”29 focus into their curriculum as a result of SLC funding. More than one-third 29 Although the PIS did not define the term “cooperative learning,” the term is generally understood among educators to
refer to activities that involve students working together as partners or in small groups on defined tasks.

Chapter 3: Implementation of Smaller Learning Communities 54
of the schools reported students being taught by the same cluster of teachers for multiple years, and their teachers teaching a smaller total number of students than before (37 and 36 percent respectively). Exhibit 3.12 Percentage of SLC Schools Reporting Specific Mechanisms to Foster Personalization (n=103)
21
22
32
36
37
47
60
63
64
76
19
0 20 40 60 80 100
Independent study is available in core academic courses
Student evaluations of teachers are being used
Students keep same homeroom teacher throughout high school
Classes are smaller than before
Each teacher teaches a smaller number of students than before
Students are taught by the same cluster of teachers for multipleyears
Students are formally paired with mentors
Teachers serve as advisors/mentors
A cooperative learning focus has been integrated into thecurriculum
Individualized assessments required for graduation
Individualized assessments used
Percent of Schools
Exhibit reads: Seventy-six percent of SLC schools reported that they used individualized assessment throughout their school.
Source: Implementation Study of Smaller Learning Communities: Periodic Implementation Survey, 2003, Section A, Questions 3 and 4: “Indicate school-level and classroom-level SLC-type changes that have occurred as a result of federal SLC program funding.” Section D, Question 1: “During the 2002–03 school year, did students within the SLC program have adult mentors with whom they were formally paired?” AND Section E, Question 2: “Was individualized assessment used throughout your whole school in 2002–03? and Question 3: “Was individualized assessment required for graduation from your school in 2002–03?”
The remainder of the discussion on personalization moves beyond individual strategies to develop a model of an overall measure of personalization. The discussion is primarily descriptive, with a technical summary of the statistical methods included in Appendix G.

Chapter 3: Implementation of Smaller Learning Communities 55
Identifiable Personalization Strategies Schools tended to focus their efforts as part of receiving the SLC grant on only one of the areas of personalization. For example, a school might attempt to create more personalized learning for students through implementing a formal student-mentoring program while leaving classroom strategies relatively unchanged. Or, a school might implement block scheduling and cross-grade “looping”30 to affect how students are organized into classrooms, but not implement a formal mentoring program on top of this time-consuming endeavor. This hypothesis is supported by the finding that of the 12 dichotomously measured personalization strategies from Exhibit 3.11,31 schools, on average, implemented only between four and five discrete strategies, suggesting that schools may focus on one “pathway” to personalization rather than committing resources to all twelve. In addition, correlations (see Appendix G, Exhibit G.1) run among the variables measuring personalization suggested three substantive groupings:
• Fostering individual student or staff relationships • Individualized assessment and classroom practices • Teacher teaming and class-size reduction
Examination of the correlation matrix supported the hypothesis that variables should be grouped to create three different constructs for personalization. A variant of factor analysis called variable cluster analysis was subsequently used to separate variables into optimal groupings, confirming the three groupings identified in the correlation matrix. The final step of the analysis entailed the use of principal components analysis to optimally weight the contribution of each variable to its respective cluster in creating three continuous composite variables. These weights from the principal components analysis were then used to create composite variables to represent the three distinct types of personalization strategies in which schools could be invested. The process for creating the values for these composite variables is described in Appendix G. Distribution of School Personalization Efforts With the construction of these composite scores, subsequent analyses were conducted to examine the extent to which schools were working toward more personalized schools through any or all of the three pathways identified above. These analyses are captured in Exhibits 3.13 to 3.15, where the distribution of SLC schools is displayed on each of the three personalization composite variables. The distribution of SLC schools implementing formal mentoring strategies, as well as other strategies designed to foster student or staff relationships, is displayed in Exhibit 3.13. As noted earlier in this discussion, fewer than half of the schools had adopted formal mentoring arrangements as a way of fostering personalization. Exhibit 3.13 displays the range of involvement in mentoring strategies, from no involvement up to a high level of involvement. These labels reflect the relative scores attained by schools on this composite variable. As shown in the exhibit, close to half of the SLC schools (49 percent) have either little or no involvement in efforts to personalize education through either formal mentoring strategies, or other strategies designed to enhance student or staff
30 “Looping” refers to an arrangement where students are scheduled with the same core of academic teachers for at least
two years of instruction. 31 Two of the 14 personalization indicators were not measured dichotomously: percentage of students assigned to
mentors and frequency of student or mentor meetings.

Chapter 3: Implementation of Smaller Learning Communities 56
relationships. In contrast, less than one-fifth (19 percent) of the schools have a high level of involve-ment in this area. Exhibit 3.13 Distribution of SLC School Involvement in Efforts to Personalize Education Through Strategies Fostering Individual Student and Staff Relationships (n=105)
6% 7%
19% 19%
49%
0%
10%
20%
30%
40%
50%
No Involvement ModerateInvolvement
High Involvement
Perc
ent o
f Sch
ools
Exhibit reads: Forty-nine percent of SLC schools have no or low involvement in efforts to personalize education through formal-mentoring strategies.
Source: Multiple items from the Implementation Study of Smaller Learning Communities, Periodic Implementation Survey, 2003. See Appendix F for details of analysis.
Exhibit 3.14 shows the distribution of SLC schools in terms of their efforts to personalize education through classroom restructuring and assessment strategies, such as making independent study available in core academic classes or using more varied student assessments for grading and promotion decisions. According to Exhibit 3.14, half (50 percent) of the schools have a moderate or higher level of involvement in this area. Although there are not many schools (5 percent) with a high level of involvement, there are also few schools (12 percent) that report no or low involvement in using these personalization strategies.

Chapter 3: Implementation of Smaller Learning Communities 57
Exhibit 3.14 Distribution of SLC School Involvement in Efforts to Personalize Education Through Individual Assessment Strategies and Classroom Practices (n=105)
12%
19% 19%22%
18%
5% 5%
0%
10%
20%
30%
40%
50%
NoInvolvement
ModerateInvolvement
HighInvolvement
Perc
ent o
f Sch
ools
Exhibit reads: Twelve percent of SLC schools have no or low involvement in efforts to personalize education through classroom structure and assessment strategies.
Source: Multiple items from the Implementation Study of Smaller Learning Communities, Periodic Implementation Survey, 2003. See Appendix F for details of analysis.
Finally, Exhibit 3.15 shows the distribution of SLC schools on efforts to personalize education through more structural strategies such as creating smaller classes and having students taught by the same cluster of teachers for multiple years. Close to half (47 percent) of the schools report at least a moderate level of involvement in this realm. Over a third, however (37 percent), report having no involvement in implementing these types of reforms.

Chapter 3: Implementation of Smaller Learning Communities 58
Exhibit 3.15 Distribution of SLC School Involvement in Efforts to Personalize Education Through Teacher Teaming and Class-Size Reduction (n=105)
37%
16%
21%
16%
10%
0%
10%
20%
30%
40%
50%
No Involvement ModerateInvolvement
High Involvement
Perc
ent o
f Sch
ools
Exhibit reads: Thirty-seven percent of SLC schools have no or low involvement in efforts to personalize education through school structural and scheduling strategies.
Source: Multiple items from the Implementation Study of Smaller Learning Communities, Periodic Implementation Survey, 2003. See Appendix F for details of analysis.
Providing Professional Development to Teaching Staff
Another goal of the SLC legislation was that schools provide professional development for school staff in innovative teaching methods that challenge and engage students. Providing SLC-related professional development was a key strategy used by schools for bringing about school change, as schools offered a wide range of professional development activities for their teaching staff. Most schools (89 percent) reported the availability of SLC-specific professional development for their instructional staff during the 2002–03 school year. This figure was down slightly from 99 percent of the schools in the previous school year.32 There was a broad range, however, in the amount of SLC-related professional development schools actually provided for teachers (Exhibit 3.16). Across all SLC schools, teachers received, on average, a total of 26 hours of SLC-specific related professional development during the 2002–03 school year (down from 34 hours in 2001–02). Teachers in close to half of Cohort 1 schools (45 percent) received less than 16 hours of SLC-specific professional development. 32 Some schools may have used up all their funding set aside for professional development by school year 2002–03.

Chapter 3: Implementation of Smaller Learning Communities 59
Exhibit 3.16 Distribution of Average Number of Hours of Teacher Participation in SLC Program Professional Development Across SLC Schools (n=100)
0 hours11%
16–30 hours32%
31–45 hours10%
46–60 hours5%
>60 hours8%
1–15 hours34%
Exhibit reads: During the 2002–03 school year, 11 percent of schools offered no professional development specific to SLCs.
Source: Implementation Study of Smaller Learning Communities, Periodic Implementation Survey, 2003, Section C, Question 2a: “On average, in 2002–03, how many hours of professional development specific to the SLC program did the teachers involved in your SLC program receive?”
Note: Schools reported hours in terms of whole numbers.
There was also great variety in the content of professional development offered, with the four most prevalent subjects being:33
• Tailoring instruction to individual student needs (95 percent of schools reported offering); • Subject matter content or curriculum (95 percent); • Problem solving and reasoning instructional methods (93 percent); and • Strategies for helping low-achieving students (90 percent).
Also interesting to note is the professional development that was not available. More than one-third of the schools responded that they did not offer professional development in the areas of conflict 33 These percentages represent schools that reported at least some percentage of SLC teachers involved in professional
development.

Chapter 3: Implementation of Smaller Learning Communities 60
resolution (39 percent) and mentoring strategies (37 percent), with more than one-fourth also not offering professional development in the areas of team teaching (31 percent), adoption of SLC-specific curricula (30 percent), or interdisciplinary projects (26 percent). Exhibit 3.17 shows the distribution of professional development opportunities available to SLC teachers during the 2001–02 and 2002–03 school years. In 2002–03, professional development opportunities in which more than half of the staff was involved was more likely to be in one of four areas: subject-matter curriculum (56 percent of schools), strategies for helping low-achieving students (47 percent), new approaches to student assessment (43 percent), and tailoring instruction to individual needs (43 percent). This latter area represented an increase over 2001–02, when only 33 percent of schools reported more than half of their staff involved.

Chapter 3: Implementation of Smaller Learning Communities 61
Exhibit 3.17 Percentages of Schools Reporting a Majority (50 percent or more) of SLC Teachers Participating in Various Professional Development Opportunities (n=105)
21%
28%
47%
24%
56%
32%
30%
29%
43%
40%
39%
43%
24%
38%
42%
34%
55%
36%
30%
32%
33%
33%
36%
41%
0% 20% 40% 60%
Conflict resolution
Mentoring strategies
Strategies for helping low-achieving students
SLC-specific curriculum
Subject-matter curriculum
Interdisciplinary projects
Project-based instruction
Team-teaching methods
Tailoring instruction to individual needs
Cooperative learning techniques
Problem-solving/reasoning instructional methods
New approaches to student assessment
Percent of Schools
2001–02
2002–03
PEDAGOGICAL TECHNIQUES
CONTENT
STUDENT SUPPORT
Exhibit reads: In 41 percent of SLC schools the majority of SLC teachers were involved in professional development opportunities regarding new approaches to student assessment during the 2001–02 school year. During the 2002–03 school year, the majority of SLC teachers in 43 percent of SLC schools were involved.
Source: Implementation Study of Smaller Learning Communities, Periodic Implementation Surveys, 2002, Section C, Question 3, and 2003, Section C, Question 2b: “Please indicate the percentage of SLC teachers who participated in each professional development opportunity listed below during 2002–03 (including summer 2002).”
Including Community Representatives and Parents to Facilitate Activities
A third goal of the SLC legislation stipulated including parents, business representatives, institutions of higher education, and other community resources as facilitators of schools’ SLC activities, as well as providing links between students and their communities. Schools reported having success in

Chapter 3: Implementation of Smaller Learning Communities 62
involving community representatives in their SLC activities. Those schools engaging external partners with their SLCs reported that they derived specific benefits for their students, including a range of career-related opportunities. Schools were also able to involve parents in school activities, and to a lesser extent, in the SLC program. Role of External Partnerships Schools have established external partnerships to work actively with their SLC programs. Eighty-two percent of schools reported having external partners working with their SLC during the 2002–03 school year. This represented a significant increase over the previous year, when less than two-thirds of the schools (65 percent) reported having external partnerships. Exhibit 3.18 displays the various external-partnering arrangements made by schools over the last two school years of their SLC grant. About two-thirds of SLC schools reported establishing partnerships with businesses (74 percent), institutions of higher education (68 percent), community-based organizations (71 percent), and individual community members (64 percent). These figures all represent significant increases over what schools reported in the previous year.34 Exhibit 3.18 Percentage of SLC Schools Reporting External Partners Working With Their SLC Programs (n=102)
74%68% 71%
64%
41%44%
54%
40%
0%
20%
40%
60%
80%
100%
Businesses/LocalEmployers
Higher EducationInstitutions
Community-basedOrganizations
Individual CommunityMembers
Per
cent
rep
ortin
g ex
tern
al p
artn
ers
2001–02 2002–03
Exhibit reads: Seventy-four percent of SLC schools reported that businesses or local employers worked with their SLC programs in 2002–03, versus 54 percent in 2001–02.
Source: Implementation Study of Smaller Learning Communities: Periodic Implementation Surveys, 2002, Question E6a, and 2003, Question F1a: “Who were the external partners that worked with your SLC program?”
34 This may be partly attributable to the 2002 PIS asking schools whether they had external partners working
“exclusively” with their SLCs, as opposed to the 2003 PIS, which only asked whether partners worked with their SLC programs, i.e., they also may have been working with the schools as a whole.

Chapter 3: Implementation of Smaller Learning Communities 63
Of the schools working with external partners, virtually all report that their SLC program receives one or more benefits from the partnership (Exhibit 3.19). Chief among the most frequently reported benefits are serving on school improvement teams or advisory committees (60 percent); serving as in-school volunteers (57 percent); sponsoring or participating in special events at school, such as career days (51 percent); and serving as mentors or career advisors (45 percent). Exhibit 3.19 Percentage of SLC Schools Reporting Various Benefits Provided to Their SLC Programs Through External Partnerships (of those whose external partners work with their SLC programs) (n=84)
45%
51%
57%
60%
20%
15%
7%
33%
36%
0% 20% 40% 60% 80%
Collaborate with schools on post-secondary education andtraining transition
Provide professional development (either on- or off-site)
Donate equipment/supplies, including curricular materials
Provide post-secondary scholarships
Provide school-to-work experiences (e.g., workplace visits,internships, job opportunities)
Serve as mentors or career advisors
Sponsor or participate in special events held at school (e.g.,career days)
Serve as in-school volunteers (e.g., classroom volunteers,schoolwide volunteers)
Serve on school improvement teams and advisory committees
Percent of Schools
Exhibit reads: Sixty percent of schools reported their external partners serving on school improvement teams and advisory committees in 2002–03.
Source: Implementation Study of Smaller Learning Communities: Periodic Implementation Survey, 2003, Section F, Question 1b: “For each of the following, please indicate which benefits were provided to your SLC program by your school through partnership(s) with external entities in 2002–03.”
Career-Related Opportunities for Students As a result of their external partnerships, schools were able to offer their students a number of career-related opportunities, most often on a schoolwide basis. Close to nine out of ten schools (88 percent) reported that they offered career-related opportunities on a schoolwide basis to students. The most prevalent form of career opportunity is community service learning, offered by over three-fourths of

Chapter 3: Implementation of Smaller Learning Communities 64
schools (77 percent) to their students (Exhibit 3.20). In addition, two-thirds of schools offer either internships (69 percent) or job shadowing (65 percent) on a schoolwide basis. Exhibit 3.20 Percentage of SLC Schools Reporting the Availability of Various Career or Community Opportunities at the School Level (n=105)
77%
69%65%
23%
0%
20%
40%
60%
80%
100%
Community ServiceLearning
Internships Job Shadowing Residency/Apprenticeship
Perc
ent o
f Sch
ools
Exhibit reads: In 77 percent of SLC schools, community service learning opportunities are available to students schoolwide.
Source: Implementation Study of Smaller Learning Communities, Periodic Implementation Survey, 2003, Section E, Question 1: “During the 2002–03 school year, were the following opportunities available to students school-wide?”
Role of Parents When asked about the extent of parent and family involvement in their schools and SLC programs during the 2001–02 school year, more than two-thirds of responding schools (70 percent) reported some form of parental input in their SLC program.35 As shown in Exhibit 3.21, parent and family involvement was generally targeted at the school as a whole, as opposed to being specific to the SLC program. During this second year of implementation, schools reported high levels of parental and family involvement school wide, with over three-fourths of the schools reporting parents and families participating in the parent-teacher organization (78 percent) and school governance (76 percent). Parental involvement in the SLC programs was much lower. The most frequently cited areas of involvement were parents participating in SLC student-centered events (54 percent) and student course plans (31 percent). 35 This question was asked only for the 2001–02 school year.

Chapter 3: Implementation of Smaller Learning Communities 65
Exhibit 3.21 Percentage of Schools Reporting Parental and Family Involvement Within Their SLCs and the School as a Whole (n=105)
78% 76% 72%
57%53%
27%
13%13%
25%
54%
31% 30%24% 20%
0%
20%
40%
60%
80%
100%
PTA Schoolgovernance
Student-centeredevents
Studentcourse plan
In-schoolvolunteers
Permissionfor child's
assignments
Mentors
Perc
ent o
f Sch
ools
Schoolwide Within SLC
Exhibit reads: Seventy-eight percent of schools reported that parents or families participated in a parent-teacher organization, such as the PTA, within the school as a whole, as opposed to only 13 percent of schools reporting involvement only with their SLC program.
Source: Implementation Study of Smaller Learning Communities, Periodic Implementation Survey, 2002, Section E, Question 5: “How have parents/families been involved with your SLC program and/or your school?”
In summary, although most schools reported success in meeting some of the goals of the SLC legislation, only a minority was able to address all of the goals discussed in this chapter. In Chapter 6, we discuss further the overall extent of SLC implementation based on criteria tied to SLC legislative goals.

Chapter 3: Implementation of Smaller Learning Communities 66
Facilitating and Inhibiting Factors in SLC Implementation
The previous section in this chapter described various implementation features of the Cohort 1 SLC schools in this study. This section first looks at a number of factors that could potentially be linked with implementation of a school’s SLC initiative, including a school’s prior involvement in SLC activities, the availability of external funding, and involvement in other SLC-related reform efforts. In addition, we look at a variety of organizational, instructional, and student and parent factors, which schools in general perceive as facilitating the implementation of their SLCs.36
Facilitating Factors in SLC Implementation
Prior Involvement with SLCs The concept of SLCs was not new for a majority of the Cohort 1 SLC schools when they first became eligible to receive funding in SY 2000–01. Prior experience with SLCs is expected to facilitate the implementation of a new SLC grant. Exhibit 3.22 tracks the respective percentages of schools and students involved in SLCs over the time period of 1996 through 2003. Over three-fourths of these schools indicated that they had some form of SLC involvement (structure or strategy) prior to the initial funding year. Among those schools with prior involvement, upwards of two-thirds of their students were continuously involved in SLCs. External Funding Schools also reported the availability of other sources of funding to help support the goals of their SLC programs. For the 2002–03 school year, almost two-thirds (65 percent) of schools reported the existence of external funding. Moreover, schools reported receiving external funding from multiple sources: federal money other than SLC (82 percent of schools) and state and local funding (73 and 76 percent, respectively). In addition, 59 percent of these schools reported external funding from private sources (e.g., philanthropic, foundation, for-profit, etc.). Given an expressed need by schools to expand existing staff and create additional space to accommodate their SLCs, the receipt of external funding in addition to SLC funds could have a positive effect on the implementation of their programs. Coordination with Other High School Reform Efforts Across all SLC schools, close to nine out of ten schools (88 percent) reported participating in other reforms as well. In particular, as shown in Exhibit 3.23, two-thirds of SLC schools report partici-pating in standards-based reform (70 percent) and curriculum reforms (66 percent). Less than half of the schools (42 percent) were concurrently participating in one or more comprehensive high school reform models.37
36 This section reports on a number of facilitating and inhibiting factors in implementation across all Cohort 1 SLC
schools. In Chapter 4 we elaborate on facilitating and inhibiting factors as they pertain specifically to career and freshman academies.
37 The specific names of comprehensive school reform models were also requested in the 2003 version of the PIS. Among the schools engaged in other comprehensive school reform efforts (n = 44), the most commonly mentioned reform models were Talent Development (16 percent), High Schools That Work (16 percent) and First Things First (14 percent). However, 36 percent of these schools did not specify an easily recognizable school reform model name.

Chapter 3: Implementation of Smaller Learning Communities 67
Exhibit 3.22 Percentage of SLC Schools and Students Involved in SLC Structures and Strategies, Before and After Federal Fundinga
68 68
7377
57
64 6367 67 68
73
100100100
0
20
40
60
80
100
1996–97 1997–98 1998–99 1999–00 2000–01 2001–02 2002–03
Per
cent
Percent schools reporting SLCinvolvement
Percent students involved in SLC inschools reporting SLC involvement
Receipt of federal SLC funds
Exhibit reads: During the 1996–97 school year, 68 percent of schools were involved in SLC structures and strategies even prior to receiving federal SLC funds in 2000 or 2001. Beginning in 2000–01, all schools were involved in SLC structures and strategies.
Source: Implementation Study of Smaller Learning Communities, Annual Performance Report, 1996–03, Section 2: Data collected on the number of students enrolled in the school and the number of students involved in SLCs. (Data for school years 1996–97 through 1999–00 were collected on a retrospective basis in fall 2001.)
Note a: Ns range from a low of 112 in 1996–97 to a high of 117 in 2000–01.
Given that multiple reform efforts in a school may have competing agendas and may conflict with each other, the extent to which other reform efforts are coordinated with the SLC initiative could be important in facilitating SLC implementation. In fact, coordination of other reforms with the SLC program was generally quite high, ranging from a low of 61 percent for standards-based reforms to a high of 77 percent of schools instituting other comprehensive high school reform models (Exhibit 3.23).
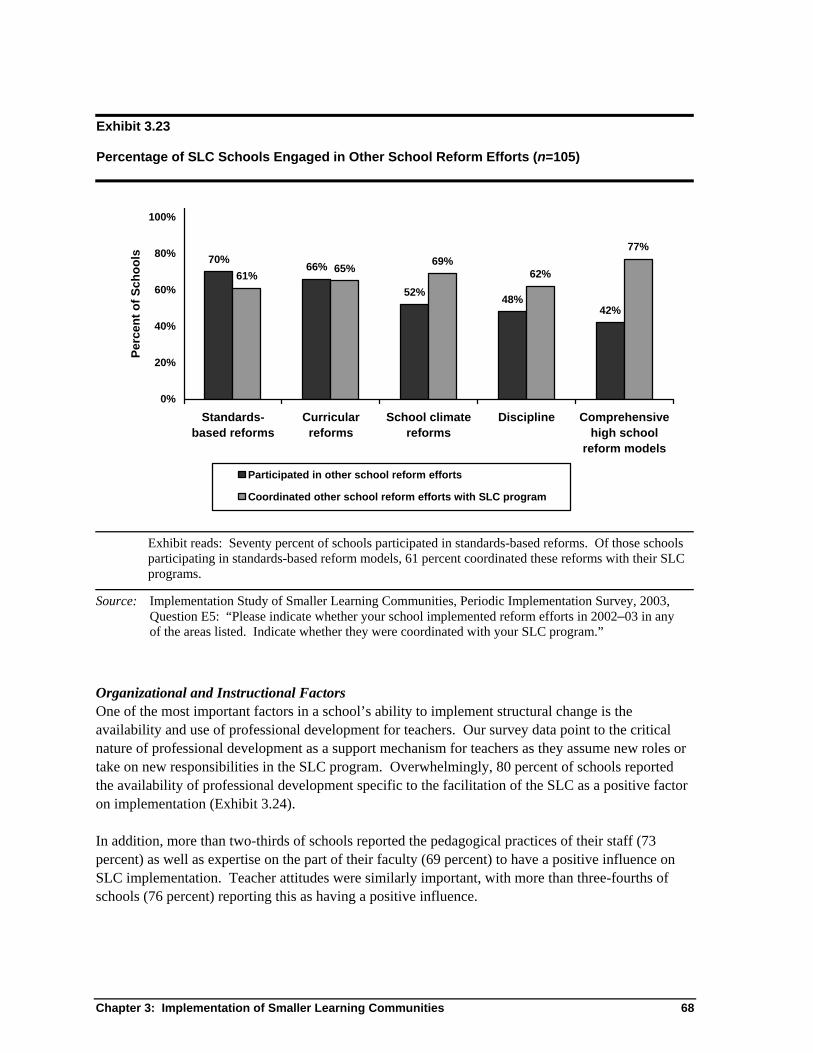
Chapter 3: Implementation of Smaller Learning Communities 68
Exhibit 3.23 Percentage of SLC Schools Engaged in Other School Reform Efforts (n=105)
70% 66%
52% 48%42%
61% 65% 69%62%
77%
0%
20%
40%
60%
80%
100%
Standards-based reforms
Curricularreforms
School climatereforms
Discipline Comprehensivehigh school
reform models
Perc
ent o
f Sch
ools
Participated in other school reform efforts
Coordinated other school reform efforts with SLC program
Exhibit reads: Seventy percent of schools participated in standards-based reforms. Of those schools participating in standards-based reform models, 61 percent coordinated these reforms with their SLC programs.
Source: Implementation Study of Smaller Learning Communities, Periodic Implementation Survey, 2003, Question E5: “Please indicate whether your school implemented reform efforts in 2002–03 in any of the areas listed. Indicate whether they were coordinated with your SLC program.”
Organizational and Instructional Factors One of the most important factors in a school’s ability to implement structural change is the availability and use of professional development for teachers. Our survey data point to the critical nature of professional development as a support mechanism for teachers as they assume new roles or take on new responsibilities in the SLC program. Overwhelmingly, 80 percent of schools reported the availability of professional development specific to the facilitation of the SLC as a positive factor on implementation (Exhibit 3.24). In addition, more than two-thirds of schools reported the pedagogical practices of their staff (73 percent) as well as expertise on the part of their faculty (69 percent) to have a positive influence on SLC implementation. Teacher attitudes were similarly important, with more than three-fourths of schools (76 percent) reporting this as having a positive influence.

Chapter 3: Implementation of Smaller Learning Communities 69
Exhibit 3.24 Percentage of SLC Schools Reporting Positive Influence of Selected Factors on Implementation of SLC (n=105)
50%
58%
63%
65%
67%
69%
70%
73%
76%
80%
0% 20% 40% 60% 80% 100%
State/District standard(s) or curricululm requirements
Characteristics of student population
Adequacy of curriculum
Parental/Family attitudes
Time for common teacher planning
Faculty expertise
Resources, including instructional materials
Pedagogical practices of existing staff
Teacher attitudes
Professional development specific to facilitation of SLC
Percent of Schools
Exhibit reads: The availability of professional development specific to the facilitation of the SLC was reported by 80 percent of the schools as having a positive influence on implementation of their SLCs.
Source: Implementation Study of Smaller Learning Communities: Periodic Implementation Survey, 2003, Section B, Question 1: What influence did each of the following factors have on your school’s implementation of the SLC program in the 2002–03 school year?”
Schools cited state or district standards or curriculum requirements as having a positive influence on the implementation of their SLCs.38 As reported earlier in this chapter, more than half of these schools (53 percent) cited district- or state-initiated school reform as having a major influence on their decision to implement an SLC. When these schools were in their third year of implementation, one-half (50 percent) cited state or district requirements as having a positive influence on implementation of their SLC programs (Exhibit 3.24). Close to or more than two-thirds of schools reported the availability of resources, including instructional materials (70 percent), having time for common teacher planning (67 percent), and adequacy of their curricula (63 percent) as having a positive influence on their SLC implementations.
38 In Chapter 4 we elaborate further on the separate roles of the state and district in influencing implementation in schools
with career or freshman academies.

Chapter 3: Implementation of Smaller Learning Communities 70
Student and Parent Factors Schools also see parental involvement as a facilitating factor in SLC implementation. As shown in Exhibit 3.24, close to two-thirds of SLC schools (65 percent) reported parental or family attitudes as having a positive influence on implementation of their SLC programs.39 In addition, the characteristics of a school’s student population is seen by more than half of the SLC schools (58 percent) as having a positive influence on the implementation of their SLC programs. Inhibiting Factors in SLC Implementation
Schools also report a number of factors that they perceived to have a negative influence on SLC implementation. These inhibitors include structural challenges, such as issues with physical space as well as school staffing needs, especially in terms of core academic teachers and guidance counselors. Over one-third of schools (37 percent) perceived scheduling or logistics issues around the operation of their SLCs to be a negative influence on SLC implementation. More than one-fourth of schools (27 percent) reported issues with physical space or facilities as potentially inhibiting the implementation of their SLC programs (Exhibit 3.25).40 Finally, 16 percent of the schools report the departmental organization of the school as negatively affecting their SLC implementation.41 Most schools reported that district hiring policies and teachers union attitudes neither helped nor hindered implementation, but they were cited as negative factors by a small number of schools Exhibit 3.25). These factors could have serious implications in terms of school staffing needs.
39 In contrast, as reported earlier in this chapter, when asked about the extent of parental and family involvement in their
schools, 30 percent of responding schools reported no formal parental input in their SLC. 40 In Chapter 4 we discuss further the issue of physical space and facilities issues as they specifically pertain to career and
freshman academies. 41 Although 86 percent of schools report maintaining subject-based departments as part of their school organization, it
appears as if only a small minority of schools report that this organizational structure impedes their ability to reorganize student and teacher populations effectively.

Chapter 3: Implementation of Smaller Learning Communities 71
Exhibit 3.25 Percentage of SLC Schools Reporting Negative Influence of Selected School-Level Factors on Implementation of SLC (n=105)
37%
27%
17% 16%13%
0%
10%
20%
30%
40%
50%
Scheduling/logistics issuesabout operation
of an SLC
Physicalspace/facilities,
capacity tooperate an SLC
program
Teachers' unionattitudes
Departmentalorganization of
the school
District hiringpolicies
Perc
ent o
f Sch
ools
Exhibit reads: Thirty-seven percent of schools reported that scheduling or logistics issues had a negative influence on implementation of their SLCs.
Source: Implementation Study of Smaller Learning Communities: Periodic Implementation Survey, 2003, Section B, Question 1: What influence did each of the following factors have on your school’s implementation of the SLC program in the 2002–03 school year?”
Almost universally, schools reported that even without the additional demands of an SLC program, they do not have enough staff. As shown in Exhibit 3.26, two-thirds (68 percent) of schools reported that they need more core subject teachers, and almost two-thirds (64 percent) reported a need for guidance counselors and other professional support staff integral to the operation of the SLC. As shown in the exhibit, however, only a small minority of those schools reporting staffing needs indicated that their needs were “great.” In addition, of those schools indicating at least some staffing need in general, fewer than half attributed an increased staffing need to their SLC programs.

Chapter 3: Implementation of Smaller Learning Communities 72
Exhibit 3.26 Percentages of SLC Schools Reporting Various Staffing Needs (n=101)
52% 49% 49%45% 45%
35%
16%12% 13%
19%12% 13%
0%
20%
40%
60%
80%
Core academicsubject teachers
Elective academicsubject teachers
Special education Guidancecounselors and/orother professional
support
Vocational subjectteachers
Bilingualeducation
Perc
ent
Some staffing need Great staffing need
Exhibit reads: Fifty-two percent of SLC schools reported having some need in the area of core academic subject teachers in 2002–03.
Source: Implementation Study of Smaller Learning Communities: Periodic Implementation Survey, 2003, Section C, Question 4: “Please indicate the extent to which your school had staffing needs in each of the following areas in 2002–03.”
The discussion in this chapter has provided a comprehensive look at the diversity in the types of structures and strategies that Cohort 1 SLC schools have chosen to implement, the extent to which schools have tried to meet some of the goals of the SLC legislation, and the factors reportedly influencing SLC implementation. In the following chapter we present a detailed discussion of the implementation of career and freshman academy programs in SLC schools.

Chapter 4: Implementation of Career and Freshman Academies 73
Chapter 4 Implementation of Two Common SLC Structures: Career and Freshman Academies
Introduction
This chapter focuses on the two most commonly found SLC structures—career and freshman academy programs. The discussion centers on three research questions:
• To what extent do career academies funded under the federal legislation include key elements described in the federal program guidance and reflect the overall program model?
• To what extent do freshman academies funded under the federal legislation include key elements described in the federal program guidance and reflect the overall program model?
• Given the variability in implementation of career and freshmen academies, what factors have affected implementation?
When discussing implementation, we have focused on the extent to which career and freshman academy programs have implemented key structural and programmatic features consistent with federal SLC program guidance. We identified career and freshman academy programs based upon the section(s) of the 2003 PIS that they completed. Schools were asked to identify the number of students in each academy program as well as other structures and strategies in their Annual Performance Report. The PIS definitions are the same as those in the APR. Because these academies were pulled into the sample based upon their survey responses, schools may have implemented these structures alone, in combination with strategies (e.g., block scheduling), or in tandem with another academy type.42 Survey data for this chapter are drawn from the 2003 PIS, describing the sample of 44 Cohort 1 schools with career academies and 58 schools with freshman academies. We are using the 2003 PIS because it provides the most recent data on implementation. The survey data are supplemented with data obtained during site visits and through telephone calls with ten SLC schools with freshman academies and eight schools with career academies. Overviews of schools visited are contained in Appendix H. In assessing the degree to which SLCs achieved desired implementation, we specify three categories: high implementing schools, moderately implementing schools, and low implementing schools. The categories are specified below and are based on schools’ reported success in implementing a combination of the key features of career and freshman academies. Among the 44 career academies with federal funding, eight are high implementers, 26 are moderate implementers, and ten are low implementers. Among the 58 freshman academies in the study, 33 are high implementers, 13 are moderate implementers, and 12 are low implementers.
42 A number of schools (n=22) have both career and freshman academy programs. Therefore, these schools appear in our
descriptions of both career and freshman academy programs.

Chapter 4: Implementation of Career and Freshman Academies 74
Key Features of Career Academy Implementation
The following discussion focuses on the extent to which the following key features of career academies have been implemented across the 44 career academy schools in Cohort 1:
• Some separate identity from the rest of the high school; • Integrated academic and vocational instruction; • Work-based learning for students; • Common planning time for teachers; and • Enrollments that reflect the demographics of the overall student body.
We have judged these implementation features to be at the center of the career academy definition provided by the Department of Education. Using PIS data, we identified several variables that align with this definition of career academies (Exhibit 4.1). We present descriptive data from the 2003 PIS for all Cohort 1 schools with career academies, supported with examples from the eight career academy case studies. Separate Identity for Career Academies
Career academies have tried to establish a distinct identity for the entire program, as well as for individual career academy groups. Schools have crafted this separate identity by creating separate physical space for the career academy program, and scheduling students to take the majority of their courses within a career academy. Schools are more likely to create separate space for academy groups than to schedule students into career academy-exclusive groups. According to PIS data, 86 percent of schools have created some separate instructional areas for their career academy groups (Exhibit 4.2). Only 14 percent of schools, however, have created a master schedule to allow students to take all their courses within the academy group. Overall, 11 percent of career academies have been able to create separate instructional space and a schedule for students to take all their courses within the academy structure. In addition, students in career academy programs, on average, take approximately two-thirds (62 percent) of their academic courses within the academy structures. In the case study schools, career academies have tried to build a program separate from the rest of the school by creating communities of teachers and students that are interested in common topic areas, and creating separate instructional areas for these teachers and students.
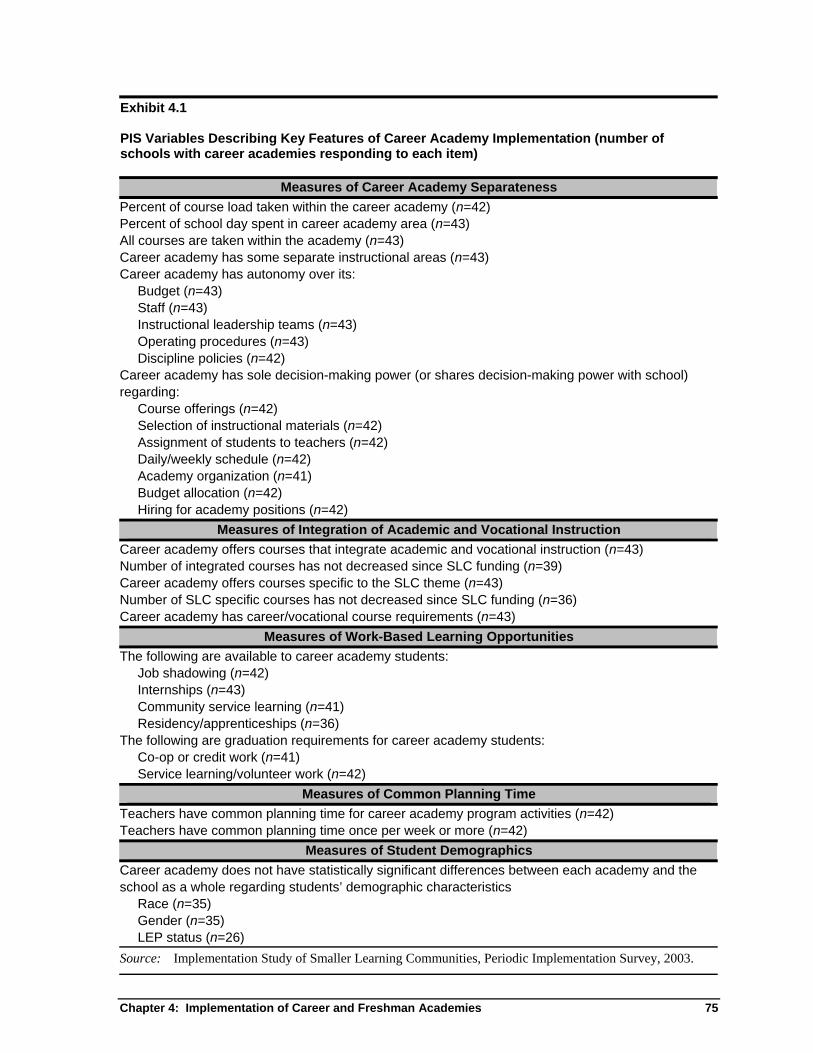
Chapter 4: Implementation of Career and Freshman Academies 75
Exhibit 4.1 PIS Variables Describing Key Features of Career Academy Implementation (number of schools with career academies responding to each item)
Measures of Career Academy Separateness Percent of course load taken within the career academy (n=42) Percent of school day spent in career academy area (n=43) All courses are taken within the academy (n=43) Career academy has some separate instructional areas (n=43) Career academy has autonomy over its:
Budget (n=43) Staff (n=43) Instructional leadership teams (n=43) Operating procedures (n=43) Discipline policies (n=42)
Career academy has sole decision-making power (or shares decision-making power with school) regarding:
Course offerings (n=42) Selection of instructional materials (n=42) Assignment of students to teachers (n=42) Daily/weekly schedule (n=42) Academy organization (n=41) Budget allocation (n=42) Hiring for academy positions (n=42)
Measures of Integration of Academic and Vocational Instruction Career academy offers courses that integrate academic and vocational instruction (n=43) Number of integrated courses has not decreased since SLC funding (n=39) Career academy offers courses specific to the SLC theme (n=43) Number of SLC specific courses has not decreased since SLC funding (n=36) Career academy has career/vocational course requirements (n=43)
Measures of Work-Based Learning Opportunities The following are available to career academy students:
Job shadowing (n=42) Internships (n=43) Community service learning (n=41) Residency/apprenticeships (n=36)
The following are graduation requirements for career academy students: Co-op or credit work (n=41) Service learning/volunteer work (n=42)
Measures of Common Planning Time Teachers have common planning time for career academy program activities (n=42) Teachers have common planning time once per week or more (n=42)
Measures of Student Demographics Career academy does not have statistically significant differences between each academy and the school as a whole regarding students’ demographic characteristics
Race (n=35) Gender (n=35) LEP status (n=26)
Source: Implementation Study of Smaller Learning Communities, Periodic Implementation Survey, 2003.

Chapter 4: Implementation of Career and Freshman Academies 76
Exhibit 4.2 Percentage of Schools With Career Academies Reporting Separate Features for Academy Program (n=43)
86%
14% 11%
0%
20%
40%
60%
80%
Separate Instructional Areas All Courses Taken withinCareer Academy
Separate InstructionalSpace and Students Taking
All Courses within theAcademyPe
rcen
t of S
choo
ls w
ith C
aree
r Aca
dem
ies
Exhibit reads: During the 2002–03 school year, 86 percent of schools with career academy programs reported a separate instructional space for the academy.
Source: Implementation Study of Smaller Learning Communities, Periodic Implementation Survey, 2003, Career Academy Module, Question 10: “In 2002–03, was there a separate physical space set aside for students in the career academy program at your school?” AND Question 13: “In the 2002–03 school year, did students enrolled in each career academy take all of their courses within their own career academy?”
Autonomy Over SLC Program Policies
To allow career academy programs to develop and grow with some independence, schools have granted academies some degree of discretion over policies and operations. Career academies are likely to have autonomy over staff decisions and the creation of instructional leadership teams. They are less likely to have autonomy over decisions related to operating procedures, the program’s budget, and discipline policies. Very few career academies have been able to garner autonomy over all the program features measured; only 17 percent of career academies have gained autonomy over all five of these program features (Exhibit 4.3). We should note that complete autonomy may be neither desirable nor needed. If a high school has effective disciplinary policies, for example, there may be no need for career academies to create their own.

Chapter 4: Implementation of Career and Freshman Academies 77
Exhibit 4.3 Percentage of Schools With Career Academies Reporting Autonomy Over Program Features (n=42)
79% 77%
63%56%
45%
17%
0%
20%
40%
60%
80%
Staff InstructionalLeadership
Teams
OperatingProcedures
Budget DisciplinePolicies
All ProgramFeatures
Perc
ent o
f Sch
ools
with
Car
eer A
cade
mie
s
Exhibit reads: During the 2002–03 school year, 79 percent of schools with career academy programs had autonomy over staffing decisions.
Source: Implementation Study of Smaller Learning Communities, Periodic Implementation Survey, 2003, Career Academy Module, Question 9: “In 2002–03, did your school’s career academy program have its own: budget, staff, instructional leadership teams, operating procedures, discipline policies?”
Career academy programs were likely to develop combinations of autonomous features. For example, 30 percent of career academies have autonomy over all program features, except for the program’s budget. An additional 23 percent of programs have autonomy over three of the five program features; the most common combination of these autonomous features is schools reporting autonomy over staff, instructional leadership teams, and budget. Still other career academies report autonomy over two of these program features. If the career academy program does not have exclusive decision-making power, it often shares decision making with the school administration. According to PIS data, career academies are most likely to be exclusively responsible, or hold joint responsibility with the school’s administration, for decisions related to the program’s budget allocation, academy organization, the selection of instruc-tional materials, and the assignment of teachers to students. Career academies and schools are less likely to hold decision-making authority for course offerings and hiring staff for academy positions. Overall, 20 percent of career academy programs report exclusive or shared decision-making power over all of the program decisions we tracked (Exhibit 4.4). Similar to the autonomy programs have gained over program features, career academies have also developed patterns of combinations in terms of decision-making authority with schools. For example, 43 percent of career academies have sole or shared decision-making power over at least four of these program features, typically academy

Chapter 4: Implementation of Career and Freshman Academies 78
organization, the selection of instructional materials, the assignment of students to teachers, and allocation of funds within the program’s budget. Exhibit 4.4 Percentage of Schools With Career Academies Reporting Sole or Shared Decision-Making Power With School (n=41)
67% 65% 64%57%
52%45% 45%
20%
0%
20%
40%
60%
80%
Budget Allocation AcademyOrganization
Selection ofInstructional
Materials
Assignment ofStudents to
Teachers
Daily/WeeklySchedule
Course Offerings Hiring forAcademyPositions
All ProgramDecisionsPe
rcen
t of S
choo
ls w
ith C
aree
r Aca
dem
ies
Exhibit reads: During the 2002–03 school year, 67 percent of schools with career academy programs had sole or shared decision-making power with the school regarding budget allocation.
Source: Implementation Study of Smaller Learning Communities, Periodic Implementation Survey, 2003, Career Academy Module, Question 18: “For each of the following, at which level were decisions made during 2002–03?”
Our case study data reinforce the critical importance of autonomy in a school’s ability to restructure into career academies. School officials reported that they must have a substantial degree of control over their own reform process to achieve effective implementation. Teachers’ perceptions that reforms are externally mandated can alienate staff and reduce teacher buy-in, often leaving staff feeling that they have no voice in the future direction of the school. Second, each academy needs a certain degree of autonomy to establish its own thematic identity and create a sense of belonging for students and teachers. The following example illustrates one school’s attempt to establish theme-based academies.
Chapter 4: Implementation of Career and Freshman Academies 79
Establishing Themes One Midwestern school with 1,200 students has divided into four themed SLCs: Health and Sciences, Community and Culture (Humanities), Performing and Visual Arts, and ROTC and Business. Each SLC has both unthemed academic core courses (English, math, science, and social studies and history) and elective courses linked to career pathways. The SLC units themselves are still in the process of establishing themed identities, using events and SLC activities in place of curricular changes. For example, the Community and Culture SLC held two events during our two-day visit: bringing in an invited speaker, author Kent Haruf, after the entire SLC had read one of his novels (Plainsong); and holding a dedication of a Vietnam memorial in the C and C hallway, with speeches by local dignitaries and the unveiling of a commemorative plaque students had made. Meanwhile, the Visual and Performing Arts SLC attended a performance by the Alvin Ailey Dance Company. Many students and staff commented that the SLCs are still struggling with the theme identities and figuring out how to work together. Their approach seeks to build on the success and cohesiveness of these events to make more substantial changes to the SLC program.
Integration of Academic and Vocational Instruction
Career academy programs have begun to integrate traditional academic courses and more innovative career courses that may be related to the academy theme. According to PIS data, a high percentage of career academy programs report that they offer courses that integrate academic and vocational instruction. In addition, a lower percentage of programs report courses specific to the SLC theme are offered. An even smaller, but still substantial, number of career academies have implemented career and vocational course graduation requirements (Exhibit 4.6). Fifty-seven percent of career academies report having implemented courses that integrate academic and vocational instruction, are specific to the SLC theme, and require career courses for graduation (Exhibit 4.6). An additional 36 percent of career academy programs have implemented two of these three types of integrated courses. These schools are most likely to have implemented courses that integrate academic and vocational instruction and courses that are specific to the SLC theme, but have not implemented graduation requirements that include career and vocational course requirements. Data from the case study visits reveal that career academies have taken one of two approaches to integrating academic and vocational instruction: (1) career-related courses as electives, or (2) integrating career themes in core academic courses. Most schools tended to offer core academic courses at each grade that cross career academy boundaries; they then organized career-specific or career-related courses as a set of electives from which students could choose to specialize in one area. Very few career academies in the case study sample have actually infused career-related themes into core academic classes.

Chapter 4: Implementation of Career and Freshman Academies 80
Exhibit 4.6 Percentage of Schools With Career Academies Reporting Integration of Academic and Vocational Instruction (n=43)
95%88%
79%
57%
0%
20%
40%
60%
80%
100%
Courses IntegrateAcademic/Vocational
Instruction
Courses Specific toSLC Theme
Career/VocationalCourse Graduation
Requirements
All IntegratedCourses
Perc
ent o
f Sch
ools
with
Car
eer A
cade
mie
s
Exhibit reads: During the 2002–03 school year, 95 percent of schools with career academy programs offered courses that integrate academic and vocational instruction.
Source: Implementation Study of Smaller Learning Communities, Periodic Implementation Survey, 2003, Career Academy Module, Question 14: “In column A, please indicate whether the following types of courses were offered in your career academy in 2002–03. In column B, please indicate whether the number of course offerings for students in the career academy has changed since SLC funding began.” AND Career Academy Module, Question 16: “Were any of the following required for graduation within the career academy in 2002–03?”
Although teachers reported wanting to introduced career-related applications from related careers into the core academic courses and provides themed electives in the upper grades: only one school did. At that school, students began to learn high technology skills in both their core academic and technical classes with Internet-based assignments, and completed assignments using Microsoft Office Suite and industry-specific technology. In the school’s 10th-grade Pathways class (a licensed, project-based learning curriculum), students produced portfolios in multimedia technology, digital manufacturing, business presentation, and desktop publishing. The school was able to provide such a focused curriculum because it was becoming a small autonomous high school and was not required to duplicate the broad range of curricular opportunities available at the two comprehensive high schools in its district. It also had a relatively small staff and student body and a limited scope of curricular offerings.

Chapter 4: Implementation of Career and Freshman Academies 81
High Standards and Cutting-Edge Technology for All
One stand-alone career academy has been able to combine college-prep level courses with high-level relevant technical skills. The school’s mission is “to prepare our students for a future in which expanded core knowledge in digital and visual literacy, inventive problem solving, critical thinking, and teaming will combine with traditional foundations of academics.” Teachers and administrators actively reinforce their expectation that students will graduate and attend college. The school has been able to achieve this by making several strategic decisions. First, the administration chose to hire highly qualified technology professionals to teach any computer-based application courses that the school offered. Next, the director of the school made high academic expectations the first order of business; he has established a public expectation that “all students will graduate, and all graduates will attend college.” Thus far, of the two previous classes, 100 percent of the students have graduated, and 100 percent have gone on to college (the director estimates that only about 30 percent were planning to go to college when they entered as underclassmen). Finally, the school made a significant investment in technology to afford access to all teachers and students. The school has equipped every teacher with a laptop, every classroom with a printer, and the school with its own e-mail system. It has also become the beta test-site for technology in the district, and is often afforded the opportunity to receive new technology. As noted above, the integration of technical knowledge and applied skills has been infused to the strong academic curriculum—a significant challenge that remains for schools developing and implementing their career academy programs.
School-level respondents from nearly all the career academy programs we visited reported facing significant obstacles in making curricular change. For ninth-grade, students typically took only academic courses. All career academy programs in the case study sample have crafted an initial course in ninth grade to have students start thinking about career choices. These are aimed at introducing a variety of possible careers and indicating the connection between high school courses and particular careers. For grades 10–12, schools have introduced collections of electives with designations indicating the careers for which they might be most appropriate. For example, one school’s Health, Consumer, and Environmental Sciences pathway was the administrative home for the Culinary Arts career cluster and the Culinary Arts Academy, which was a sequence of courses aimed at developing competency in the culinary arts, as well as the Nursing Assistant career academy. Their Fine Arts and Humanities pathway contained the Construction career cluster, within which the Welding Co-Op was located; and the Business and Hospitality pathway contained the Finance career cluster, within which was a Finance Academy. Each of the above pathways included three career clusters enrolling 75 to 100 students each (so that each pathway’s enrollment was approximately 300 to 350 students). The curriculum offerings of this school are displayed in Exhibit 4.7. Students could choose to take all the required courses in the cluster, resulting in a relatively significant amount of course work in one specialized area (e.g., culinary arts), or they could sample more widely from electives offered in one (or more) pathway(s).

Chapter 4: Im
plementation of C
areer and Freshman A
cademies
82
Exhibit 4.7 Curricular Offerings in One SLC Grantee School
Source: Case study program information.
Freshman Transition At end of 9th grade students must select a career pathway
Career Pathways
Career Clusters Students may apply to enroll in:
Academies
(apply at end of junior year; co - op or intern - ship during senior year)
Programs
Business & Hospitality
Business & Hospitality Fine Arts &
HumanitiesFine Arts & Humanities Health, Consumer &
Environmental SciencesHealth, Consumer &
Environmental Sciences
Finance Finance Hospitality &Tourism
Hospitality &Tourism
Business Administration
Business Administration
FineArts
FineArts HumanitiesHumanities ConstructionConstruction Health
OccupationsHealth
OccupationsCulinary
ArtsCulinary
Arts EngineeringEngineering
Finance Academy
Hospitality &Tourism Academy
Cooperative Office
Education/ Distributive Education
Visual Talented
Art Program (VTAP)
Theater Talented
Art Program (TTAP)
Welding Co - op
Nursing Assistant Academy
Culinary Arts
Academy
Engineering Academy
Freshman Success AcademyFreshman Success AcademyFreshman Transition
students must select a career pathway
Career Pathways
Career Clusters Students may apply to enroll in:
Academies
Internships & Co-ops (apply at end of junior year; co - op or intern - ship during senior year)
Programs
Business & Hospitality
Business & Hospitality Fine Arts &
HumanitiesFine Arts & Humanities Health, Consumer &
Environmental SciencesHealth, Consumer &
Environmental Sciences
Finance Finance Hospitality &Tourism
Hospitality &Tourism
Business Administration
Business Administration
FineArts
FineArts HumanitiesHumanities ConstructionConstruction Health
OccupationsHealth
OccupationsCulinary
ArtsCulinary
Arts EngineeringEngineering
Finance Academy
Hospitality &Tourism Academy
Cooperative Office
Education/ Distributive Education
Visual Talented
Art Program (VTAP)
Theater Talented
Art Program (TTAP)
Welding Co - op
Nursing Assistant Academy
Culinary Arts
Academy
Engineering Academy
Freshman Success AcademyFreshman Success Academy

Chapter 4: Implementation of Career and Freshman Academies 83
Work-Based Learning Opportunities
Career academies also report a significant number of career-related, or work-based, learning opportunities available to their students. Most common among the work-based opportunities for students are job shadowing and community service learning projects. A high percentage of career academies also report the availability of internships to their students. Far fewer career academy programs offer residencies or apprenticeships (Exhibit 4.8). Exhibit 4.8 Percentage of Schools With Career Academies That Offer Work-Based Learning Opportunities
93% 93% 91%
47%
15%
0%
20%
40%
60%
80%
100%
Job Shadowing(n=42)
CommunityService Learning
(n=41)
Internships(n=43)
Residency/Apprenticeships
(n=36)
All Work-BasedLearning
Opportunities(n=36)Pe
rcen
t of S
choo
ls w
ith C
aree
r Aca
dem
ies
Exhibit reads: During the 2002–03 school year, 93 percent of schools with career academy programs offered job shadowing opportunities to students.
Source: Implementation Study of Smaller Learning Communities, Periodic Implementation Survey, 2003, Career Academy Module, Question 17: “During the 2002–03 school year, were any of the following opportunities available solely to students in your career academy?”
Note: Not all of the 44 schools with career academies responded to each question. The n refers to the number that provided information. That is, 42 schools responded to the question on job shadowing, but only 36 schools responded to the question on apprenticeships.
Fifteen percent of career academies have implemented all of these work-based learning opportunities: job shadowing, community service learning, internships, and residency or apprenticeships. An additional 53 percent of career academy programs have implemented three of these opportunities in combination. Schools that have done so have been likely to implement job shadowing, community service learning, and internships. Another 53 percent of career academies have implemented two of the four opportunities; half of these schools offer job shadowing and internships. Data from case study visits provides more detailed information about the types of work-based learning opportunities available, and how they have been implemented with career academies. In

Chapter 4: Implementation of Career and Freshman Academies 84
most career academies, internships have been linked to specific academy groups, in an effort to provide work experience to students with a defined career interest. A smaller number of schools have crafted articulation agreements with local higher education institutions to provide access to college-level courses in career-related topics. As noted, some schools developed internships to align with specific career academy groups. One school had established a variety of concrete opportunities for students, beginning with specific business partnerships for each academy or program in the school (Exhibit 4.7). For example, its welding and nursing academies have standing partnerships with local businesses and hospitals, respectively, and these entities offer students the opportunity for an internship. Ten to twelve students annually participate in the nursing assistantship program; an additional ten to twelve intern with local employers as part of the cooperative office education program. Other schools’ internship programs are more widely available to the general student population, and are not a facet of a career academy theme. At the career academy program with the most widespread internship program, the school-to-career director is the key person in the school’s 11th- to 12th-grade career opportunities program, in part because of the strong relationships he has forged over many years as a member of the local Chamber of Commerce. Students typically spend one period during the school day at the internship site and are evaluated by an on-site supervisor. The director also arranges numerous job-shadowing opportunities for students considering various careers. This program serves a dual role: providing opportunities for students while forging bonds between the community and the school. Only one other school has forged such extensive partnerships with the business community; the school has members of the local business community on its board of directors, which helped in advocating for the school’s inception and remains active in providing leadership. Articulation agreements with local colleges and universities are rare among schools with career academy programs in the case study sample. Two schools we visited, however, have been able to establish these relationships and provide significant career opportunities through them. For example, one of the case study schools has established a formal articulation agreement with the local technical college for its welding program, enabling students to receive a trade certificate in welding by the time of high school graduation. Although many of these programs predate the current federal SLC funding, the school aims to expand offerings to make opportunities available for all students by the time the current 10th-graders are seniors. According to survey data, a significant number of schools have made work-based learning opportunities a graduation requirement. Approximately half of the schools with career academy programs have implemented graduation requirements that require students to participate in a co-op program or provide credit for work or a service-learning project. A majority of schools have implemented career courses as a graduation requirement (Exhibit 4.9). Twenty-eight percent of career academy programs have implemented all three of the career-related graduation requirements (Exhibit 4.9). An additional 14 percent of career academies have implemented two out of three of these career-related graduation requirements; the most common combination being career academies that have implemented career courses and service learning requirements.

Chapter 4: Implementation of Career and Freshman Academies 85
Exhibit 4.9 Percentage of Schools With Career Academies That Have Implemented Career-Related Graduation Requirements (n=41)
70%
52%46%
28%
0%
20%
40%
60%
80%
Career Courses Service Learning/Volunteer Work
Co-op Program orCredit for Work
All Three Career-Related Graduation
Requirements
Perc
ent o
f Sch
ools
with
Car
eer
Aca
dem
ies
Exhibit reads: During the 2002–03 school year, 70 percent of schools with career academy programs had implemented career courses as a graduation requirement.
Source: Implementation Study of Smaller Learning Communities, Periodic Implementation Survey, 2003, Career Academy Module, Question 6: “Were any of the following required for graduation within the career academy in 2002–03?”
Common Planning Time for Teachers
Common planning time has been employed as a strategy to improve communication between teachers, and allow teachers who share the same students to meet on a regular basis. Many SLC structures have chosen to cluster teachers to allow for a greater percentage of shared students, making the use of common planning time an effective tool to achieve personalization, and “smallness” for students. Although a relatively high percentage of career academy programs (65 percent) report that teachers have been afforded common planning time for academy activities, only slightly more than one-quarter (29 percent) of teachers meet for common planning time at least once a week (Exhibit 4.10).

Chapter 4: Implementation of Career and Freshman Academies 86
Exhibit 4.10 Percentage of Schools With Career Academies Reporting Common Planning Time and the Frequency of Its Use (n=42)
Exhibit reads: (Left-hand chart) During the 2002–03 school year, 65 percent of schools with career academy programs provided common planning time for program activities. (Right-hand chart) In 29 percent of programs with common planning time, teachers meet at least weekly.
Source: Implementation Study of Smaller Learning Communities, Periodic Implementation Survey, 2003, Career Academy Module, Question 11: “During the 2002–03 school year, did teachers have common planning time for career academy program activities?” AND Question 11a: “If yes, about how often did teachers in your school participate in common planning time related to the career academy program?”
Demographics of Student Enrollment
Previous research and the SLC program are both concerned with the placement of students in less academically rigorous programs. The SLC program states that students “not be placed according to ability or any other measure.” Although no data were available on student ability and we were unable to distinguish student placement from student selection, we were able to compare enrollments by race, gender, and LEP status in each academy with total school enrollment as a proxy for the degree to which schools were making an effort to achieve the spirit of the law. These analyses should be seen as exploratory. A substantial proportion of schools with career academies did not provide complete data. We have data on 35 of 44 schools (80 percent) on race and gender, but only 26 of 44 schools (60 percent) on LEP status. Schools implementing career academy programs have found it difficult to create academy groups that are demographically similar to the school as a whole. According to PIS and APR data collected during the 2002–03 school year on the demographic characteristics (i.e., race, gender and students with LEP) of academy subgroups and on the school as a whole, schools are struggling to create
Academies with common planning
time
Academies without common planning
time
Academies with common planning
time whose teachers meet less than
weekly
Academies with common planning
time whose teachers meet weekly or more
35%
65%
29%
71%Academies with
common planning time
Academies without common planning
time
Academies with common planning
time whose teachers meet less than
weekly
Academies with common planning
time whose teachers
Academies with common planning Academies with
common planning time whose teachers meet weekly or more
35%
65%
29%
71%

Chapter 4: Implementation of Career and Freshman Academies 87
groups that match the school as a whole.43 In 51 percent of the schools with career academies, the racial composition of each career academy program in the school matched the racial composition of the school as a whole (Exhibit 4.11). In addition, another 20 percent of schools had only one academy among all its career academies not matching the racial demographics of the whole school. Among the 20 schools with four separate academies, for example, six had all four academies mirroring the school as a whole, and an additional five schools had a significant difference with only one of the four academies. In the 26 schools for which we had LEP enrollment data, ten schools (38 percent of the total) had each career academy matching the school as a whole on the proportion of students with LEP. The greatest disparity in enrollments is found by gender. In ten schools (29 percent of the schools with available data) each career academy matched the distribution by gender in the school. In fact, in the 20 schools with four separate academies, only one school had all four of its academies mirroring the gender distribution of the school. Case study data illuminate the difficulties career academy programs have experienced. Serving the needs of learners—especially a school’s LEP population—is particularly difficult. Offering English language instruction within each academy is nearly impossible, given the limited number of staff qualified to teach these courses. Also, depending on the size of the academy, there may not be enough students to fulfill minimum enrollment requirements for one section of any particular course. A few case study schools with large LEP populations have opted to run separate courses for these students (e.g., English as a second language courses), while including them in a few regular education classes within a particular academy group, maximizing their benefit from participation in the SLC structure. Among the case study schools, many school respondents also reported that allowing students choice about academy enrollment often introduced segregation by race, gender, SES, or even academic performance into these groups. Some teachers and administrators whom we interviewed also spoke of students’ perceptions of the prestige of particular academy groups (e.g., either as higher performing, or more socially desirable) as a factor in choosing one academy over another. Schools are still struggling with the trade-off of allowing student choice in academy themes with the risk of student resegregation, versus arbitrarily assigning students to academies (and thereby jeopardizing student engagement around the theme) to maintain balanced enrollments within and across academies.
43 We compared the demographic composition of academy groups (where this information was complete) using a one-
sample t-test. To conduct this analysis we needed a minimum amount of data, including data on race, gender and LEP composition within each academy group as well as for the whole school. We performed a t-test between each academy group and the whole school. APR data was used for school-level race and LEP composition. The APR, however, does not collect school-level gender data, so we assumed that the total school enrollment was evenly divided between female and male students.

Chapter 4: Implementation of Career and Freshman Academies 88
Exhibit 4.11 Percentage of Schools Implementing Career Academies in Which the Demographics of Each Career Academy Group Matched the Demographics of the School as a Whole in Terms of Race, Gender, and LEP
51%
38%
29%
0%
20%
40%
60%
Race (n=35) LEP (n=26) Gender (n=35)Perc
ent o
f Sch
ools
with
Car
eer A
cade
mie
s
Exhibit reads: During the 2002–03 school year, 51 percent of schools with career academies had each career academy match the racial composition of the school as a whole.
Source: Implementation Study of Smaller Learning Communities, Periodic Implementation Survey, 2003, Career Academy Module, Question 6: “Below we ask you to describe each of your career academy groups. There is space to describe up to four. . . . In section B, please estimate the number of students in each career academy group. In section C, please provide the demographic characteristics of students in each career academy. If exact percentages are not available, please estimate as well as you can, giving a single number and not a range.” AND Annual Performance Report, School Year 2002–03, Question 2: “School Background, Student Race Categories, 9th Grade, 10th Grade, 11th Grade, 12th Grade.”
Note: The n represents the number of schools with career academies for which we had data. Forty-four schools reported having career academies.
Levels of Career Academy Implementation
The Department of Education defined career academies as “integrating academic and vocational opportunities for students, and preparing students for postsecondary education and employment—with the personalized learning environment of a small, focused learning community. Teachers and students integrate academic and occupation-related classes as a way to enhance real-world relevance and maintain high academic standards. Local employer partnerships provide program planning guidance, mentors, and work internships. Career academies share with other restructuring initiatives an emphasis on building relationships between students and adults.” This section of the report describes the extent to which career academies funded under the federal program have reported success in implementing all of the key features of implementation, as described in federal program guidance.

Chapter 4: Implementation of Career and Freshman Academies 89
“High Implementing” Career Academies (n=8)
Using the available PIS data, we define a high implementing career academy as one that includes the following:
• Common planning time for teachers (for such purposes as facilitating integration of academic and vocational opportunities or discussing the needs of students they teach in common);
• Autonomy over SLC-level program policies;
• Work-based learning opportunities and internship programs for students; and
• Career-related graduation requirements that included both course work and service learning projects or a cooperative working experience.
In addition, a high implementing career academy should have:
• An increased number of courses that integrate academic and vocational instruction or are specific to the SLC program theme;
• Students taking more than half their course load within the career academy; and
• Similar enrollments by race across each academy.44 Among the 44 schools with career academies, eight met all of the first four criteria. Six of the eight had increased courses, and seven of the eight had students taking more than half their courses within the career academy. Four of the eight had demographically similar students in their academies. Exhibit 4.12 summarizes the data as levels of implementation for schools with career academies. “Moderately Implementing” Career Academies (n=26)
Moderately implementing career academies are defined as those that have some but not all the features of high implementing career academies. For example, some schools created common planning time for teachers and instituted career-related graduation requirements, but have limited autonomy over program policies. Other schools have achieved some degree of autonomy over program policy decisions and have instituted career-related graduation requirements, but have not implemented common planning time. Still others have common planning time and have gained a significant level of autonomy but have not implemented career-related graduation requirements. Twenty-six career academy programs met these criteria. Most have common planning time for teachers, but just less than half (12 of 26) report autonomy over budgetary decisions and discipline policies. Four-fifths (21 of 26) have implemented work-based learning opportunities. Two-thirds (17 of 26) have implemented career-related graduation requirements, typically both course work and job shadowing.
44 We have limited this analysis to differences by race because more schools had complete data on this variable.
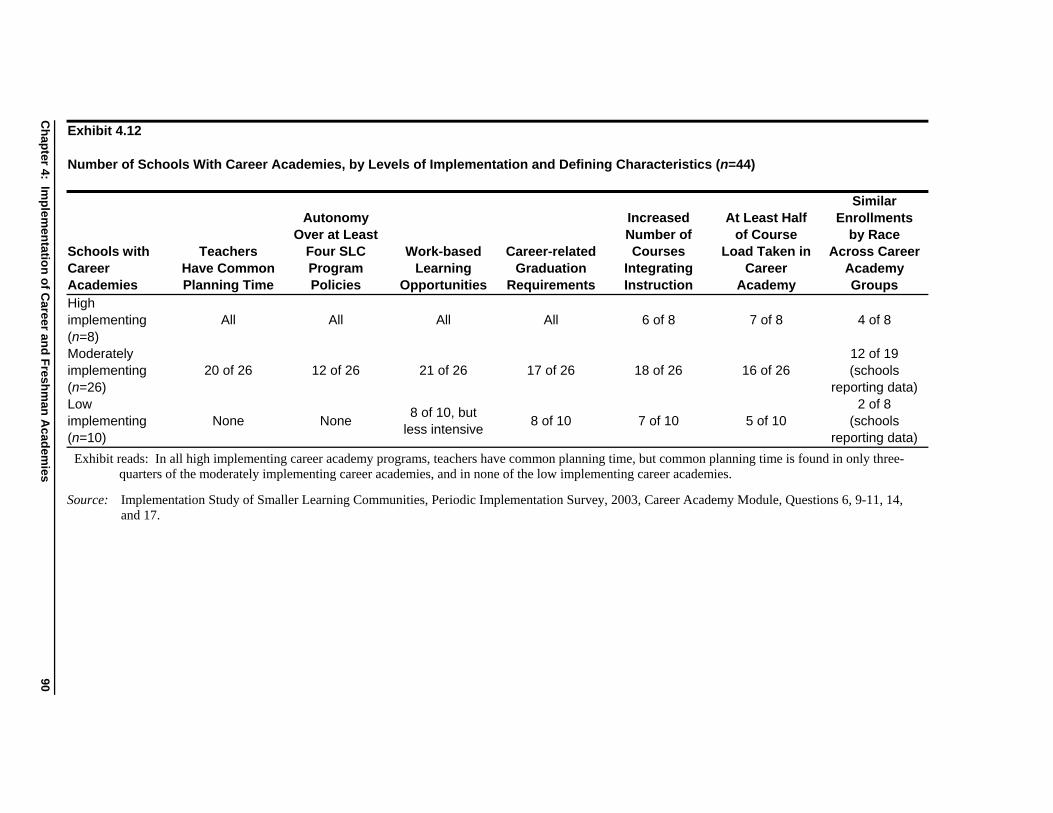
Exhibit 4.12 Number of Schools With Career Academies, by Levels of Implementation and Defining Characteristics (n=44)
Schools with Career Academies
Teachers Have Common Planning Time
Autonomy Over at Least
Four SLC Program Policies
Work-based Learning
Opportunities
Career-related Graduation
Requirements
Increased Number of Courses
Integrating Instruction
At Least Half of Course
Load Taken in Career
Academy
Similar Enrollments
by Race Across Career
Academy Groups
High implementing (n=8)
All All All All 6 of 8 7 of 8 4 of 8
Moderately implementing (n=26)
20 of 26 12 of 26 21 of 26 17 of 26 18 of 26 16 of 26 12 of 19 (schools
reporting data) Low implementing (n=10)
None None 8 of 10, but less intensive 8 of 10 7 of 10 5 of 10
2 of 8 (schools
reporting data) Exhibit reads: In all high implementing career academy programs, teachers have common planning time, but common planning time is found in only three-
quarters of the moderately implementing career academies, and in none of the low implementing career academies.
Source: Implementation Study of Smaller Learning Communities, Periodic Implementation Survey, 2003, Career Academy Module, Questions 6, 9-11, 14, and 17.
Chapter 4: Im
plementation of C
areer and Freshman A
cademies 90

Chapter 4: Implementation of Career and Freshman Academies 91
Moderately implementing career academies are similar to high implementing ones on course load taken within the academy and enrollments by race matching the schools’ distribution. Just under two-thirds (16 of 26) have students taking more than half their course load in the career academy. Over three-fifths (63 percent) of the moderately implementing career academies have demographically similar students across their academies. “Low Implementing” Career Academies (n=10)
Low implementing schools are defined as those having few structures or requirements in place and having little autonomy over their operations. Ten career academies fit this category. These programs have not implemented common planning time, and none has autonomy over at least four SLC program policies. Few report control of decisions concerning operating procedures and instructional leadership teams, and almost no schools report making exclusive decisions about student discipline policy or operating budget. They are also more likely than higher implementing career academies to have racial imbalances among students; only two of the eight schools with available data have enrollments in career academies that mirror the racial distribution of the school as a whole. Although eight of the ten schools have implemented career-related graduation requirements, the requirements are for course taking, not for service learning or cooperative work experiences. Furthermore, although eight schools offer students work-based learning opportunities, the oppor-tunities are less intensive than those offered by high implementing career academies. The schools that do offer work-based learning opportunities for their students are more likely to provide job shadowing, for example, than service learning projects and apprenticeships. Seven schools have increased the number of integrated (e.g., academic and vocational) courses or courses related to the SLC theme. Unlike the high and moderately implementing career academies, students in the low implementing schools are less likely to take most of their courses within the academy structure. On average, students take 41 percent of their course load within the career academy. In the following vignette, we present a description of a high-implementing career academy program, focusing on the interrelationships among the structures, content, and requirements in action in a well-implemented program.

Chapter 4: Implementation of Career and Freshman Academies 92
A Well-Implemented Career Academy One case study school implementing a career academy is located in a rural area of a southern state and serves a student population of 1,300; approximately 30 percent of students are white, and about 70 percent are black. The school has adopted the Talent Development High School model, developed by Johns Hopkins University, and has implemented both a freshman and career academy program. The school has divided the upper grades into three pathways: Fine Arts, Industrial Technology, and Humanities; Business, Hospitality, and Finance; and Health, Engineering, and Consumer Science. Students self-select into pathway groups at the end of the ninth grade; students take their core courses within their pathway, leaving for courses that the school has found harder to schedule (e.g., courses that have only one section). The school underwent a spatial reorganization to create a distinct hallway for each pathway⎯allowing all students from a particular pathway to take all classes in that space. The administration has been designing activities for students to do by pathway; once a month students have an extended homeroom period, a time set aside for pathway-specific activities (e.g., career-related advising). Teachers have also been grouped into study group teams by pathway, and they meet three times a month. One teacher from each study group meets monthly with the Instructional Council⎯an administrative structure that makes key decisions in the school. In addition, teachers also meet by pathway once a month to discuss pathway-wide issues, as well as particular student issues. At present, the school is wrestling with how to make progress on career infusion into the curriculum within each pathway. According to one respondent, “Teachers are still teaching in a traditional way even if their pathway is ‘pure’.” The school’s goals include career infusion in core academic classes and the further development of career elective classes. For example, the administration would like to turn the portfolio project that students do in English 4 into a project that reflects their career interests and pathway choice. The school also hopes to use extensive professional development for teachers and other staff as a strategy to infuse career-specific curriculum into existing classes. Specific to work-based learning opportunities, the school has continued to develop specific business partnerships for its academy groups. For example, the nursing and welding academies have partnerships with local hospitals and businesses, offering students the opportunity for an internship. The school has also developed an articulation agreement with a local technical college to support its welding program; students can complete a trade certificate in welding by high school graduation. Although some of these opportunities pre-dated the start of the pathway program, the school is continuing to build internship opportunities, with the goal of having internship opportunities aligned with each academy.
The next section of this chapter analyzes implementation in freshman academy program, using both PIS data and descriptive data on individual program features of freshman academy programs from our case studies.

Chapter 4: Implementation of Career and Freshman Academies 93
Key Features of Freshman Academy Implementation
This section describes the extent to which freshman academies have created:
• Common planning time for teachers; • At least some separate identity from the rest of the high school; and • Enrollments that reflect the demographics of the overall student body.
We used data from the 2003 PIS to analyze freshman academy implementation of these critical features. For this analysis, Exhibit 4.13 displays the various survey items and the number of schools responding to each item. Exhibit 4.13 PIS Variables Describing Key Features of Freshman Academy Implementation
Measures of Common Planning Time Teachers have common planning time for freshman academy program activities (n=58) Teachers have common planning time once per week or more (n=58)
Measures of Freshman Academy Separateness Percent of course load taken within the freshman academy (n=57) Percent of school day spent in freshman academy area (n=56) All courses are taken within the academy (n=58) Freshman academy has some separate instructional areas (n=58) Freshman academy has autonomy over its:
Budget (n=56) Staff (n=56) Instructional leadership teams (n=56) Operating procedures (n=55) Discipline policies (n=57)
Freshman academy has sole decision making power or shares decision-making power with school regarding:
Course offerings (n=58) Selection of instructional materials (n=57) Assignment of students to teachers (n=58) Daily/weekly schedule (n=58) Academy organization (n=58) Budget allocation (n=56) Hiring for academy positions (n=57)
Measures of Student Demographics Freshman academy does not have statistically significant differences between each academy and the freshman class as a whole regarding students’ demographic characteristics
Race (n=32) Gender (n=33) LEP status (n=20)
Source: Implementation Study of Smaller Learning Communities, Periodic Implementation Survey, 2003.

Chapter 4: Implementation of Career and Freshman Academies 94
Common Planning Time in Freshman Academies
A hallmark of freshman academies is the organization of students among teams of teachers, with common planning time provided so that teachers can discuss and resolve various student issues. Within over three-quarters of freshman academy programs, teachers have common planning time to discuss the students they share. Almost two-thirds of freshman academies also allow teachers to meet at least weekly (Exhibit 4.14). Exhibit 4.14 Percentage of Schools With Freshman Academies Reporting Common Planning Time and the Frequency of Its Use (n=58)
Exhibit reads: (Left-hand chart) During the 2002–03 school year, 79 percent of schools with freshman academy programs provided common planning time for program activities. (Right-hand chart) In 74 percent of academy programs with common planning time, teachers met at least weekly.
Source: Implementation Study of Smaller Learning Communities, Periodic Implementation Survey, 2003, Freshman Academy Module, Question 9: “During the 2002–03 school year, did teachers have common planning time for freshman academy program activities?” AND Question 9a: “If yes, about how often did teachers in your school participate in common planning time related to the freshman academy program?”
The case studies provided information about the central role that teacher teams play in the implementation of freshman academy programs. Eight out of the ten freshman academy programs visited employed (or were trying to implement) a teaming structure. These teams are typically comprised of one teacher from each of the four “core” subject areas (i.e., English, math, social studies and science), and share the same students. In most schools implementing teaming, the teacher teams are a sub-structure within the academy group. Within the team, teachers are afforded the opportunity to communicate regularly about the performance and behavior of students that they share, as well as consult with a larger group of colleagues who are grappling with similar instructional and classroom management issues. These opportunities for regular communication among team members have been
79%
21%
64%
36%
Academies with common planning time whose
teachers meet weekly or more
Academies whose teachers meet for common planning
time less than weekly
Academies with common planning
time
Academies without common planning
time
79%
21%
64%
36%
Academies with common planning time whose
teachers meet weekly or more
Academies whose teachers meet for common planning
time less than weekly
Academies with common planning
time
Academies without common planning
time

Chapter 4: Implementation of Career and Freshman Academies 95
expanded through the existence of common planning time. Most schools have also attempted to cluster teacher teams in the same space, easing the transition for ninth-graders from middle school to a larger school campus by reinforcing the “smallness” of the group of individuals whom they see on a daily basis. Some teacher teams have been able to design and implement interdisciplinary activities with other team members, but this has been a relatively rare curriculum change. Six of the schools visited (all with teacher teams) are utilizing common planning time to discuss individual students’ learning needs, interdisciplinary units, new curriculum, and effective teaching practices. Anecdotal evidence from our site visits indicates that sharing knowledge about the individual students made teachers aware of the students’ strengths and special traits. Students concurred; many students in the focus groups said they felt teachers in the team knew them better, understood them, or believed in them as a result of the enhanced communication among teachers.
Teams That Care
In one SLC school implementing a freshman academy, four teachers from the “core four” academic subjects team together and share students in two to three of their four classes. They meet during common planning time twice weekly to plan lessons together (including cross-disciplinary applications and tie-ins) and to discuss the needs of individual students. They also meet weekly with the four other teachers in the academy group and the associated elective, special programs, and ESOL teachers to discuss academy-wide issues and plan joint community events. Teachers of ninth-grade students will “loop” with those students and teach them in the 10th grade as well, providing continuity of care. In addition, each student is assigned to an advisor (for their extended homeroom period) who will work with him or her throughout the four years of high school. Teachers have flexibility to design the advisory period curriculum as they wish, tailoring it to the needs of the students. Students told us that they notice the difference that structures like these make in teachers’ ability to monitor them. In a focus group, one student told us, "Last year, I was goofin’ off, and I flunked my final and two classes. They [the team of teachers in her academy] gave me the opportunity to attend summer school without paying. The teachers stayed after the end of the year for two weeks to help us, and then we re-took our finals.” Another chimed in, “We journal every day. Everybody’s good at that. I failed all four quarters last year, but [the teacher stuck with her, told her she had potential], and this year, I’m doing better—I got all As and Bs on my last report card!” Beaming with pride, she produced her report card from a bag with a flourish, and the group dissolved into friendly laughter. The school is characterized by this friendly climate in which all students are expected to succeed academically and socially with each other’s help.
Separate Identity for Freshman Academies
Freshman academies, like career academies, have also attempted to create a separate identity for their academies, typically by establishing separate physical space for the program. Nearly all freshman academies (90 percent) have a separate instructional area, and have crafted schedules so that students take the majority of their courses within the academy (Exhibit 4.15). Over one-quarter of freshman academy programs (29 percent) have been able to schedule all of their 9th-grade students’ courses within the freshman academy. In addition, on average, ninth-grade students take nearly three-quarters of their courses (73 percent) within the freshman academy (students in career academies take, on average, 62 percent of their courses within a career academy). Nearly one-quarter (24 percent) of freshman academies have created separate (or somewhat separate) instructional space and have

Chapter 4: Implementation of Career and Freshman Academies 96
crafted a schedule that allows ninth-grade students to take all of their courses within the academy structure (Exhibit 4.15). Exhibit 4.15 Percentage of Schools With Freshman Academies Reporting Separate Features for Academy Program (n=57)
90%
29% 24%
0%
20%
40%
60%
80%
100%
Separate Instructional Areas All Courses Taken WithinFreshman Academy
Separate Instructional Areasand Students Taking All
Courses Within theAcademy
Per
cent
of S
choo
ls W
ith
Fre
shm
an
Aca
dem
ies
Exhibit reads: During the 2002–03 school year, 90 percent of schools with freshman academy programs reported a separate instructional area for the academy.
Source: Implementation Study of Smaller Learning Communities, Periodic Implementation Survey, 2003, Freshman Academy Module, Question 11: “In 2002–03, was there a separate physical space for students in the freshman academy program at your school?” AND Question 11a: What percentage of students’ courseload, on average, was taken within the freshman academy?”
Autonomy for Freshman Academy Programs
As a strategy for greater program autonomy, freshman academies have gained a significant level of control over program policies. Freshman academies are likely to have autonomy over the creation of instructional leadership teams and other staffing issues. Fewer schools, however, have autonomy over decisions related to operating procedures, discipline policies, and the program’s budget (Exhibit 4.16). Fifteen percent of freshman academies report autonomy over all program features. An additional 27 percent of academy programs have gained autonomy over four program policies. Academy programs are less likely to have gained autonomy over their budgets than other program features. An additional 20 percent of freshman academies have gained autonomy over instructional leadership teams, staff, operating procedures, and discipline policies.

Chapter 4: Implementation of Career and Freshman Academies 97
Exhibit 4.16 Percentage of Schools With Freshman Academies Reporting Autonomy Over Program Features (n=55)
91%84%
51%
40% 36%
15%
0%
20%
40%
60%
80%
100%
InstructionalLeadership
Teams
Staff OperatingProcedures
DisciplinePolicies
Budget All ProgramFeatures
Per
cent
of S
choo
ls W
ith
Fre
shm
an
Aca
dem
ies
Exhibit reads: During the 2002–03 school year, 91 percent of schools with freshman academy programs had autonomy over the program’s instructional leadership teams.
Source: Implementation Study of Smaller Learning Communities, Periodic Implementation Survey, 2003, Freshman Academy Module, Question 8: “Does your school’s freshman academy program have its own: budget, staff, instructional leadership teams, operating procedures, discipline policies?”
Freshman academies are most likely to have exclusive or shared decision-making with the school on academy organization, budget allocation, and the daily or weekly schedule. At least half the academy programs reported having a decision-making role in those areas. Fewer academies have sole or collaborative decision-making processes concerning assignment of students to teachers, the selection of instructional materials, and hiring of teachers. Freshman academies are least likely to have a significant decision-making voice over course offering decisions (Exhibit 4.17). Thirteen percent of academies have sole or shared decision-making power over all of the program policies that we tracked. Twenty-nine percent of freshman academies make sole or shared decisions over four of these program policies. These schools are most likely to make exclusive or shared decisions concerning instructional materials, academy organization, and allocation of spending within the programs’ budgets.

Chapter 4: Implementation of Career and Freshman Academies 98
Exhibit 4.17 Percentage of Schools With Freshman Academies Reporting Sole or Shared Decision-Making Power With School (n=57)
64%54% 50%
41% 40% 39%31%
13%
0%
20%
40%
60%
80%
Aca
dem
yO
rgan
izat
ion
Bud
get
Allo
catio
n
Dai
ly/W
eekl
yS
ched
ule
Ass
ignm
ent
of S
tude
nts
to T
each
ers
Sel
ectio
n o
fIn
stru
ctio
nal
Mat
eria
ls
Hir
ing
for
Aca
dem
yP
osi
tions
Cou
rse
Offe
ring
s
All
Prog
ram
Feat
ures
Perc
ent o
f Sch
ools
With
Fr
eshm
an A
cade
mie
s
Exhibit reads: During the 2002–03 school year, 64 percent of schools with freshman academy programs had sole or shared decision-making power with the school regarding academy organization.
Source: Implementation Study of Smaller Learning Communities, Periodic Implementation Survey, 2003, Freshman Academy Module, Question 16: “For each of the following, at which level were decisions made during 2002–03?”
Demographics of Student Enrollment
Previous research and the SLC program are both concerned with the placement of students in less academically rigorous programs. Although no data were available on student ability and we were unable to distinguish student placement from student selection, we were able to compare enrollments by race, gender, and LEP status in each academy with the freshman class as a whole as a proxy for the degree to which schools were making an effort to achieve the spirit of the law. These analyses of freshman academies should be seen as exploratory. A substantial proportion of schools did not provide complete demographic data for each of its academies. In addition, a large proportion (15 schools) reported that they had only one freshman academy, and that its enrollment was at least 90 percent (and usually all) of the freshman class. We have excluded these schools from this analysis. Among the 58 schools with freshman academies, we have data by gender on 33 schools, data on race for 32 schools, and data on students with LEP for only 20 schools. In 76 percent of the schools with freshman academies, the gender composition of each freshman academy program in the school matched the gender composition of the entire freshman class (Exhibit 4.18). Among the ten schools with four separate academies, for example, seven had all four academies mirroring the school as a whole. In just over half (53 percent) of the schools, the racial composition of each freshman academy in the school matched the racial composition of the entire

Chapter 4: Implementation of Career and Freshman Academies 99
freshman class. In the 20 schools for which we had LEP enrollment data, ten schools (50 percent of the total) had each freshman academy matching the freshman class as a whole on the proportion of students with LEP. Exhibit 4.18 Percentage of Schools With Freshman Academies in Which the Demographics of Each Freshman Academy Matched the Demographics of the Entire Freshman Class in Terms of Race, Gender, and LEP
76%
53% 50%
0%
20%
40%
60%
80%
100%
Gender (n=33) Race (n=32) LEP (n=20)
Per
cent
of S
cho
ols
With
Fre
shm
an
Aca
dem
ies
Exhibit reads: During the 2002–03 school year, 76 percent of schools with freshman academy programs had each freshman academy match the gender composition of the entire freshman class.
Source: Implementation Study of Smaller Learning Communities, Periodic Implementation Survey, 2003, Freshman Academy Module, Question 6: “Below we ask you to describe each of your freshman academy groups. There is space to describe up to four. . . . In section B, please estimate the number of students in each career academy group. In section C, please provide the demographic characteristics of students in each career academy. If exact percentages are not available, please estimate as well as you can, giving a single number and not a range.” AND Annual Performance Report, School Year 2002–03, Question 2: “School Background, Student Race Categories, 9th Grade.”
Note: The n represents the number of schools with freshman academies for which we had data. Fifty-eight schools with freshman academies were in Cohort 1, so there was significant non-response on this item.

Chapter 4: Implementation of Career and Freshman Academies 100
Levels of Freshman Academy Implementation
Freshman academies are classified as a type of house plan as defined in the Annual Performance Report:
House plans divide students in a large school into groups of several hundred, either across grade levels or by grade levels. Students take some or all courses with their house members and from their house teachers. House arrangements may be yearlong or multi-year arrangements. House plans personalize the high school experience, but usually have limited effect on curriculum or instruction. Each house usually has its own discipline plan, student government, social activities, and other extracurricular activities, although students may also participate in activities of the larger schools. Grouping ninth-graders into a separate house is one way to ease the freshman transition to high school.
This section of the report addresses the extent to which freshman academies funded under the federal program have implemented all of the key elements described in the federal program guidance. “High Implementing” Freshman Academies (n=33)
Using the available PIS data, one could define a high implementing freshman academy as one that includes the following characteristics:
• At least weekly common planning time for teachers, so that teachers may discuss the needs of students whom they have in common;
• Autonomy over select program policies; and
• Similar enrollments by race across each academy.45 Of the 58 schools with freshman academies, 33 meet the first two criteria. They reported common planning time for teachers on at least a weekly basis, and reported autonomy on at least two program policy areas, typically over staff and instructional leadership teams. Just half of the schools providing data, however (that is, 11 of 22), have created racially mixed groupings within their freshman academies that match the freshman class as a whole. Note that we did not include a separate identity as a criterion for freshman academies because virtually all freshman academies have created at least some separate identity. Exhibit 4.19 summarizes the data on levels of implementation for schools with freshman academies.
45 We limited the comparison to enrollment by race because differences were more likely to be found by racial groupings.

Chapter 4: Implementation of Career and Freshman Academies 101
Exhibit 4.19 Number of Schools With Freshman Academies, by Levels of Implementation and Defining Characteristics (n=58)
Schools With Freshman Academies
Teachers Have Common Planning
Time at Least Weekly
Autonomy Over at Least Four SLC
Program Policies
Similar Enrollments by Race Across
Freshman Academies
High implementing (n=33) All All
11 of 22 (schools reporting data)
Moderately implementing (n=13) 9 of 13 3 of 13
5 of 8 (schools reporting data)
Low implementing (n=12) None 3 of 12
NA (only two schools reported data)
Exhibit reads: In all high implementing freshman academy programs, teachers have common planning time at least weekly, but weekly common planning time is found in only 70 percent of the moderately implementing freshman academies and in none of the low implementing freshman academies.
Source: Implementation Study of Smaller Learning Communities, Periodic Implementation Survey, 2003, Freshman Academy Module, Questions 6, 8, 9, 9a, and 11.
“Moderately Implementing” Freshman Academies (n=13)
Moderately implementing freshman academies are defined as those that have some but not all the features of high implementing career academies. Thirteen freshman academy programs meet these criteria. They have less autonomy over program policies than high implementing freshman academy programs, and fewer of them have common planning time for teachers as often as high implementing schools. Like high implementing schools, just over half of these schools (five of eight) have been able to create racially mixed freshman academies that mirror the freshman class as a whole. “Low Implementing” Freshman Academies (n=12)
The remaining 12 schools in the freshman academy sample have more limited implementation. None of these freshman academy programs have implemented common planning time. In addition, all schools report that the freshman academies have limited autonomy over school-level program policy decisions. Academies with low levels of implementation also report more program decisions made without their involvement; instead, decisions are made either by the school or district, or a combina-tion of the two. Regarding enrollment by race, six of the eight schools providing data defined their one freshman academy as the entire freshman class, so we did not include them in the analysis. Too few schools remained to complete this analysis by race. In the following vignette, we present a full description of a well-implemented freshman academy program. This example provides information concerning the interrelated nature of program components.

Chapter 4: Implementation of Career and Freshman Academies 102
A Well-Implemented Freshman Academy This freshman academy program is in a school located in a mixed urban and suburban neighborhood in a Western city. The school has designed its freshman academy program to include block scheduling, flex scheduling, and a total of five teacher teams. The freshman academy has its own space in a separate building, which it has renovated. The school initially faced scheduling dilemmas; to ameliorate the situation, the school instituted flex days—teachers spend one day teaching only three classes and getting professional development, and then teach a double period another day. This afforded the opportunity to create teacher teams that meet twice a week for a common prep period and a period used for curriculum development issues and student management issues. The teacher teams that the school has created are made up of English, math, science, and health or geography; they share common planning time to work on curriculum and monitor student progress. Students have been grouped into academies so as to spread both gifted and special education students across the teams; special education, ELL, and classes for gifted students are all offered within freshman academy groups. Although the school has been able to integrate specific groups of students with special needs into the academy structure, the administration is still working to create more “cross-fertilization” among teams—to create a successful academy experience for all students. Career Academies and Freshman Academies: Variation in Program Features
A greater percentage of career academies than freshman academies report exclusive—or shared—decision-making control over SLC program policies, whereas freshman academies are more likely to have students taking all their classes within the academy structure, and are more likely to provide common planning time—and more frequent common planning time—for faculty. Decision-Making in Career and Freshman Academies
Career and freshman academies exert sole or shared decision-making capabilities over different aspects of program policy. A much greater percentage of schools with career academy programs report the academy’s ability to make decisions about the selection of the program’s instructional materials, budget allocation, assignment of students to teachers, and course offerings. Schools with career academies are also more likely than freshman academies to exert decision-making power over the hiring process for academy positions. These data reinforce the perspective that as career academy programs need to implement a greater number of customized program features (e.g., a separate substantive identity for students and teachers in academy groups), these programs may choose to do so through exercising a greater degree of decision-making capability over SLC-level program decisions. Similar numbers of career and freshman academies report decision-making control over academy organization and the program’s daily or weekly schedule (Exhibit 4.20).

Chapter 4: Implementation of Career and Freshman Academies 103
Exhibit 4.20 Percentage of Schools With Career or Freshman Academies Reporting Sole or Shared Decision-Making Power With School
67%64% 64%
57%52%
45% 45%
54%
65%
40% 41%
50%
31%
39%
0%
20%
40%
60%
80%
BudgetAllocation
AcademyOrganization
Selection ofInstructional
Materials
Assignment ofStudents toTeachers
Daily/WeeklySchedule
CourseOfferings
Hiring forAcademyPositionsPe
rcen
t of S
choo
ls W
ith C
aree
r or F
resh
man
Aca
dem
ies
Career Academies Freshman Academies
Exhibit reads: During the 2002–03 school year, 67 percent of schools with career academy programs and 54 percent of schools with freshman academy programs had sole or shared decision-making power with the school regarding budget allocation.
Source: Implementation Study of Smaller Learning Communities, Periodic Implementation Survey, 2003, Career Academy Module, Question 18: “For each of the following, at which level were decisions made during 2002–03?” AND Freshman Academy Module, Question 16: “For each of the following, at which level were decisions made during 2002–03?”
Separate Identity in Career and Freshman Academies
A high percentage of schools implementing either career or freshman academies, or both, have created separate instructional spaces for their academy programs (Exhibit 4.21). Freshman academies, however, have been able to craft school schedules that have allowed students to take all of their courses within the academy structure at double the rate of career academies making the same change. In addition, students in freshman academies take a higher percentage (73 percent) of their courseload within the academy structure than do students in career academies (62 percent). This may represent an important difference in career and freshman academy implementation. As schools implementing either a freshman or career academy have been able to establish a separate physical space for their program, career academies, seemingly, have had a greater difficulty in scheduling students for courses within the academy structure. This relatively low rate of student course load taken within career academies may reflect a conscious choice for schools implementing career
(n=41) (n=57)

Chapter 4: Implementation of Career and Freshman Academies 104
academy programs. For example, many school respondents for site visit interviews related that the career academy structure reflected the opportunity for students to select among electives. The academy groups were not designed for students to take their core academic courses within these structures. Exhibit 4.21 Percentage of Schools With Career or Freshman Academies Reporting Separate Features for Academy Program
86%
14%
62%
90%
29%
73%
0%
20%
40%
60%
80%
100%
Separate InstructionalAreas
All Courses TakenWithin the Academy
Average Percent ofStudents Course load
Taken Within theAcademy Structure
Perc
ent o
f Sch
ools
With
Car
eer
or F
resh
man
Aca
dem
ies Career Academies (n=43)
Freshman Academies (n=57)
Exhibit reads: During the 2002–03 school year, 86 percent of schools with career academy programs and 90 percent of schools with freshman academy programs reported a separate instructional space for the academy.
Source: Implementation Study of Smaller Learning Communities, Periodic Implementation Survey, 2003, Career Academy Module, Question 10: “In 2002–03, was there a separate physical space set aside for students in the career academy program at your school?” AND Question 8: “In 2002–03, was there a separate physical space for students in the freshman academy program at your school?”
Common Planning Time
Schools implementing a career or freshman academy often offer teachers common planning time (Exhibit 4.22). There has been a marked difference, however, in how often teachers in each type of academy meet together. As noted below, only 29 percent of schools whose career academies have common planning time report that teachers meet weekly or more. Sixty-four percent of schools whose freshman academies have common planning time, however, report that teachers meet weekly or more. Clearly, common planning time—and the rate at which it is used—among teachers in freshman academy programs is a central feature of implementation. Freshman academy programs have been designed to support freshman in the transition to secondary school, and to reinforce the feeling of a supportive (and often “smaller”) school environment. Regular teacher interaction—often about a group of students that they share—has been the mechanism by which this support has been created at the ninth-grade level.

Chapter 4: Implementation of Career and Freshman Academies 105
Exhibit 4.22 Percentage of Schools With Career or Freshman Academies Reporting Common Planning Time and the Frequency of Its Use
65%79%
36%
35% 29%21%
64%
71%
0.00%
20.00%
40.00%
60.00%
80.00%
100.00%
SeparateInstructional Areas
All Courses TakenWithin the Academy
Perc
ent o
f Sch
ools
With
Car
eer o
r Fr
eshm
an A
cade
mie
s
Exhibit reads: During the 2002–03 school year, 65 percent of schools with career academy programs and 79 percent of schools with freshman academy programs provided common planning time for program activities. Of those with common planning time, 29 percent of schools with career academies reported their teachers met at least weekly compared to 64 percent of schools with freshman academies.
Source: Implementation Study of Smaller Learning Communities, Periodic Implementation Survey, 2003, Career Academy Module, Question 11: “During the 2002–03 school year, did teachers have common planning time for career academy program activities?” AND Question 9: “During the 2002–03 school year, did teachers have common planning time for freshman academy program activities?”
The next section of this chapter discusses the factors—both facilitating and inhibiting—that affect implementation in both freshman and career academies. Factors Affecting the Implementation of Career and Freshman Academies
This section on critical factors in the implementation of academies is based upon site visits to 18 schools (ten with freshman academies and eight with career academies) conducted during fall or winter 2002 and follow-up interviews completed during February 2004. Although the number of schools visited was small, a common set of factors has emerged that have facilitated implementation of career and freshman academies in SLC schools, including strong school leadership, a supportive district, staff buy-in, and sufficient space to make programs separate. Identified challenges to implementation include staff (and administrative) turnover, weak school leadership, prescriptive district oversight of SLC changes, and limited resources. The factors influencing implementation mirror those we found in the literature review completed for this study. For example, Dynarski et al. (1998) found that school restructuring is most successful when it is consistent with and supports a
Academies without common planning time
Academies with common planning time
Academies with common planning time whose teachers meet weekly or more
Academies with common planning time whose teachers meet less than weekly
Academies without common planning time
Academies with common planning time
Academies with common planning time whose teachers meet weekly or more
Academies with common planning time whose teachers meet less than weekly
Career Academies Freshman Academies (n=42) (n=58)

Chapter 4: Implementation of Career and Freshman Academies 106
district’s desire to change. McQuillan and Muncey (1991) wrote about the importance of staff buy-in for successful implementation and the negative consequences of faculty divisiveness. Many of these factors have remained paramount in schools’ implementation processes throughout the SLC grant period. The factors discussed below from case study data are similar to those detailed in Chapter 3, although the PIS survey data relate to SLC implementation at the school level, not to implementation of individual SLC structures. There is one major difference. For example, school leadership did not emerge as a factor in implementation survey data, because the principal (as the key respondent to the PIS) was not asked to critique his or her own influence. School leadership, however, consistently emerged as a critical factor from case study data.
Reform Leadership at the School Level
Strong school leadership appears to be important for a successful implementation process in both career and freshman academies. During the initial case study visits, 14 of the 18 schools identified school leadership as a major facilitating factor in restructuring. When conducting follow-up interviews with schools, eight of the 18 schools reported that a strong school leader remains a major facilitator for the school’s implementation process. Leadership at the school level is often able to facilitate high levels of staff buy-in for reforms and is able to “make SLC changes happen.” One school respondent described the school principal’s leadership style: “She empowers teachers and allows them to take risks…. there is substantial ownership on the part of a growing number of teachers.” A respondent at another school noted that their principal “has created a great niche for the program, facilitating the extra meetings that are needed.” School leadership does not exclusively rest in the role of school principal. Rather, three schools reported that having a full-time SLC director responsible for the implementation process has been a major facilitator in the SLC implementation process. A Leader Among Peers One district superintendent told us, “Without her [the school principal], we would not be here.” This principal of a career academy program school led the reform movement by establishing teacher buy-in first. She developed a critical mass of support among her faculty by holding weekly meetings about how to develop a career academy structure before applying for the grant, and has continued with the weekly meetings as implementation has progressed. As could be expected, she credits the work of her colleagues, “No fewer than 35 staff members (out of a total faculty of 87) have been at every meeting held to discuss these changes.” Teachers recognize the collaborative process, having been given the opportunity to provide continuous feedback on the change process. In addition, teachers were encouraged to conduct site visits with other schools developing career academy programs to understand the school-level structural changes that are needed in implementation. As a by-product, teachers report feeling less isolated, and report being in contact with a greater number of colleagues than before. The principal has been identified by the superintendent and the intermediary agency that helped the high school acquire the federal SLC funds as the main driver of reforms at the school. Now parents and the local community have added their support as the SLC program continues to grow and even receives coverage from the local media.

Chapter 4: Implementation of Career and Freshman Academies 107
Staff Buy-In
Strong school leadership and the high levels of staff buy-in for school change are consistently linked in our case study findings.46 In all six of the schools with career academies and seven of the eight schools with freshman academies that were characterized by strong school leadership, high levels of staff buy-in were also present. Staff buy-in has played a key role in a school’s ability to implement changes, as teachers have become responsible for new roles in restructured schools (e.g., teaming partners, collaborators for curriculum reform, student advisors). Overall, nine of the case study schools—both freshman and career academies—reported high levels of staff buy-in for their implementation process. The follow-up telephone interviews yielded parallel findings. There remains a high level of staff buy-in in five out of the eight schools where their implementation process is still characterized by strong school leadership. In addition, respondents from all three of the high schools that have restructured into small schools report high levels of staff buy-in as a major facilitator in the conversion to small schools. There is a higher degree of staff buy-in for change in freshman academy programs than in career academy programs. Respondents at six out of the ten freshman academy programs report a high level of staff buy-in for the SLC program, compared to three of eight career academy programs. For many schools, the reforms required to implement a career academy have been more complex than those changes needed for freshman academy programs, thus making teachers more hesitant to support changes. In addition, schools have been more likely to see more immediate changes in desired outcomes (e.g., student behavior) with the implementation of a freshman academy. For example, one school implementing both a freshman and career academy program had an easier time in recruiting teachers to remain on a freshman academy team than maintaining teachers within particular career academy groups. Ninth-grade teachers reported anecdotal evidence of improved freshman behavior and an increased focus on academics after just a year of freshman academy implementation. This early success made teachers more willing to work toward continued SLC changes within the freshman academy program, as the model seemed to have immediate benefits for the school. The absence of school-level leadership and the lack of staff buy-in have impeded implementation in several case study schools. At one school whose implementation process has been previously characterized by weak school leadership and a lack of buy-in, administrators have had to “cajole” teachers into taking on additional responsibility or new roles that have been created by the SLC model. In fact, according to the new principal, there is a small group of teachers that would like to dismantle the SLC changes that have already been made. In his words, “There is a small but determined group of teachers that still operates like it is 1975.” District Leadership for SLC Changes
The district role in school-level SLC implementation has varied along two dimensions: the intensity of involvement and the amount of direction given to schools. More than half of the 18 schools in the case study sample reported receiving support from their districts throughout their SLC implementation process. The kind of support that districts have offered
46 These schools in their PIS survey responses also noted the important roll of staff buy-in.

Chapter 4: Implementation of Career and Freshman Academies 108
schools, however, represents an important difference. In five of these schools, the district has played an active and supportive role in the implementation process. Some district staff, for example, facilitated staff meetings to implement change. Another district conducted technical assistance with schools to produce school-specific recommendations for continued implementation progress. In schools where the district office has been an active and supportive player in the SLC reform process, the district is seen as a facilitator. Other districts, although still verbally supportive of SLC reforms, have not been as involved. For example, several districts have only been responsible for approving SLC expenditures or reform plans. Respondents from schools in these districts viewed their autonomy as a mixed blessing. Three schools in the case study sample characterize their reform process as being actively prescribed by the district office. All three schools have experienced difficulty in getting and maintaining school staff buy-in. In one of these schools, the district has continued to mandate changes to the school’s SLC plan. Most recently, in response to district directives, the school changed its freshman academy and vertical house plan (with four houses) into six career academies with themes. Staff buy-in had to be secured for each set of changes that the district required. Even in schools where there is a conver-gence between district and school designs for SLC reform, a prescriptive district’s activities were described as “annoying.” The prescriptive role of the district often made school administrators and staff feel that they no longer had a substantial voice in reform, and therefore were less likely to support SLC changes. The example below elaborates on school responses to a prescriptive district policy.
One Size Fits All? One school district approved a commercially developed comprehensive reform plan in 1996, formally adopting it a year later. The plan called for implementation of the reform model to be phased in “wall-to-wall” within schools (i.e., whole-school), cluster-by-cluster, districtwide, beginning with the cluster that contained the poorest and worst-off schools. The plan for phasing-in implementation included an initial planning year prior to the first year of implementation in each cluster. Although the model itself included many sound features (e.g., providing “continuity of care” through looping, and increasing personalization by developing career academy-like structures called themed houses), staff and administration at the two schools we visited felt they had been excluded from the decision-making process and that the model itself was too much like a “cookie cutter” plan, that their schools’ individual contexts and characteristics demanded adaptations that the district would not permit. At one of the two schools, teachers felt that the reform plan was just the latest in several rounds of district-initiated reforms. This perpetuated the lack of buy-in for the district’s reforms; teachers seemed to have a “this too shall pass” attitude about restructuring. The other SLC school visited in the district illustrated the other side of the same problem. Through a collaborative process, this school’s principal and staff made thoughtful choices about which components of the district’s restructuring plan worked best for the school. Teachers and administrators expressed anxiety that the district would crush the school’s own initiative and expertise by requiring them to implement all aspects of the model, when the school was already working through its own solutions. In both schools, the process was frustrating for the administrators and teaching staff alike as they struggled to keep up with mandates that seemed arbitrary.

Chapter 4: Implementation of Career and Freshman Academies 109
The Role of Professional Development
The case study visits show professional development as a critical factor in the SLC implementation process in several sites. Respondents from six of the 18 case study schools reported that professional development played a vital role in the development of SLCs. The professional development programs of these schools shared a number of characteristics. Professional development offerings were typically comprised of topics directly related to a school’s SLC program. For example, schools were likely to provide teachers and other staff with information about why they had chosen to implement SLCs, as well as more specific content related to classroom-level implementation. Common topics offered included teaming and team-building, interdisciplinary curriculum, and developing learning communities within a school. Professional development was conducted over a sustained period of time (e.g., the professional development program was carried out over the course of one academic year). Schools were also likely to send teachers and other staff on site visits to schools implementing SLC programs to learn about how to make SLC changes to their school. In those schools in which professional development was not a major facilitator to SLC program implementation, the school-level professional development offerings were less likely to be sustained over time, and professional development topics were less likely to be SLC-specific. Seven schools reported that professional development did not meet the needs of SLC program implementation. For example, respondents in these schools often reported that professional development opportunities were great in number during initial implementation of the SLC program (e.g., a weeklong planning and professional development session prior to their planning and first implementation years) but did not continue throughout the academic year. In many cases, teachers reported that professional development was not specific enough to the classroom-level implementation of SLCs to be useful. In addition, school respondents commented that professional development offerings were insufficient to encompass the number of SLC issues about which teachers needed to be trained. Schools whose respondents found relatively little value in the professional development offerings were often characterized by other inhibiting factors, such as limited (or no) teacher buy-in. In addition, these schools often did not build a professional development plan to align with SLC implementation. Graduation Requirements and State Assessments
The graduation requirements facing most high school students typically come in two forms—a certain number or sequence of courses to be completed and an externally mandated assessment. For most case study schools, graduation course requirements have remained unchanged throughout school reorganization (as these are often district- or state-created). When the school is divided into smaller student population units without changing graduation course requirements, the school must provide students with access to all core academic courses. This usually leaves schools with two imperfect choices: schools must either offer required courses in each academy (a hardship given staffing shortages, discussed below) or allow students to enroll in required courses across academies, abandoning the goal of academy “purity” (i.e., the extent to which class sections are comprised of students from the same academy, and teaming teachers, share the same students). In addition, themed academies must provide applied or modified courses to reflect the theme, necessitating a greater variety of courses even if the total number of courses offered remains unchanged. Therefore, many schools are struggling with curriculum revisions and how to differentiate academies from each other, especially in light of mandated graduation requirements.

Chapter 4: Implementation of Career and Freshman Academies 110
While course requirements have remained unchanged in most case study schools, externally mandated student assessments were reported to have inhibited implementation in five of the 18 case study schools (four with career academies and one with freshman academies). The five schools were all “moderately implementing” and were trying to be responsive to state testing requirements and their own efforts to more fully implement their programs. In one school with career academies, developing career infusion modules for core academic courses and career elective classes was delayed to give students more time to prepare for the state-level test. Although passing the test was not required for graduation, the results were used to determine the school’s AYP status so was cited as very important to school staff. In a second school with career academies, field trips and job shadowing (and other examples of “real life experiences” for students) were cancelled to provide students with more test preparation time. School respondents noted that they had taken these actions because the state each year raised the cut-off score for passing this test, required for high school graduation. Managing Limited Resources
School Staffing Needs Several case study schools have experienced staffing shortages, both at the school and district levels. One school with very critical staffing shortages resorted to hiring long-term substitute teachers. The implementation of an academy program can exacerbate these schools’ needs for staff. Simply put, dividing the students into smaller groups increases the number of classes to be staffed. For example, one case study school admitted that finding certified core teachers to assign to each career academy group was a near impossibility. Space For many schools, creating a separate identity for each academy is an integral part of their restructuring plan. A distinct physical space aids in crafting a separate and cohesive identify for its SLC program and academies. For career academy programs, the specialization into academy themes creates the need for specialized equipment and space (e.g., media production facilities, darkrooms, science labs, and weather stations, etc.). Given the limited resources and the other needs in restructuring, these expenditures can be among the last that a school finances, making curricular changes more difficult. Three case study schools report that the physical structure of the school building was seen as a major facilitator in the creation of freshman academies. The hub-and-spokes design of one building allowed for a well-defined academy space in one of the four spokes, or wings. In the two other schools, a newly completed construction project included a brand new wing devoted to the freshman academy. The ability to provide adequate space for the freshman academy was considered critical in these schools. Most schools, however, due to their size and possible overcrowding, do not have the luxury of affording each SLC subunit its own space. This chapter has focused on the implementation of career and freshman academies, and on the extent to which program components as described in the federal program legislation have been put in place. We also discussed factors affecting freshman and career academy implementation. The next chapter looks at change in school-level student outcomes over time.

Chapter 5: Changes in Student Outcomes 111
Chapter 5 Changes in Student Outcomes: Analysis of Annual Performance Reports
Introduction
The purpose of this study is to report on the implementation of SLCs as supported by federal SLC grant funds, rather than on outcomes associated with such school reform efforts. Nevertheless, given the longitudinal data collected through the APR, we are able to report on a broad array of outcomes that SLC programs are intended to improve.47 As discussed in Chapter 3, SLC schools provided self-reported data through the APR. Schools first completed the APR during the 2000–01 school year, at which time they also provided retrospective data for school years 1996–97 through 1999–00. APR data were also collected annually for school years 2001–02 and 2002–03. Therefore, the APR provides longitudinal data with which we are able to track trends in academic achievement, school-related behaviors, and the achievement of academic milestones at the school level. This chapter presents changes in school-level outcomes as reported by Cohort 1 SLC schools for school years 1996–97 through 2002–03, the four years preceding and three years during receipt of federal SLC funds. Our analyses explored a wide range of outcomes, which fall into three major categories: Academic Achievement:
• Statewide assessments − Percentage of students reaching proficiency in reading or language arts − Percentage of students reaching proficiency in mathematics
• College entrance exams − Percentage of students in grades 11 and 12 taking the SAT − Percentage of students in grades 11 and 12 taking the ACT − Average SAT score − Average ACT score
Achievement of Academic Milestones:
• Promotion rate from ninth grade • Graduation rate
− Based on ninth-grade enrollment four years prior of graduating cohort − Based on 12th-grade enrollment of graduating cohort
47 Although we use the term “outcomes” throughout this chapter, the reader should be reminded that these APR measures
were not designed as evaluation outcomes, but rather as measures of student progress over time for program monitoring purposes.
Chapter 5: Changes in Student Outcomes 112
• Percentage of high school students simultaneously enrolling in secondary and college-level courses
• Percentage of graduates intending to enroll in a two- or four-year college School-Related Behaviors:
• Average daily attendance • Participation in extracurricular activities • Incidence of violence • Incidence of drug use • Incidence of disciplinary action
Data Requirements
In general, schools were not able to provide complete longitudinal data on all of the variables listed above. Retrospective data (school years 1996–97 through 1999–00) on outcomes such as the percentage of students proficient in either mathematics or reading were especially sparse. Nevertheless, because the goal of this analysis was to examine trends before and after SLC funds were received, schools needed to have at least one pre-SLC grant (i.e., 1996–97 through 1999–00) data point and at least one post-SLC grant (i.e., 2000–01 through 2002–03) data point to be included in the analysis of each outcome. For this reason, the number of schools included in the analyses varies across APR outcomes. Methodology
The school-level APR outcome data represent aggregate measures across all students in each school. In this section, we outline our approach to modeling school-level APR outcomes using longitudinal growth curve analysis. Our analysis was based on a mixed model approach used to examine change over time in school outcomes at two levels: within school and between school (see Appendix I for further discussion). The analysis consisted of several steps. First, a trend line was estimated for each school, based on the data available for that school. The next step involved looking across these estimates to understand the trend associated with the “average” SLC school. Last, school-level trend lines were compared to explore whether or not there was significant variation among schools in terms of how they were changing over the seven-year data collection period. Thus, with these analyses we are modeling not only how schools are trending over time but also whether or not there is a shift in trends when schools receive SLC funds. This allows us to examine whether or not there is a “jump” in outcomes after SLC funds are introduced, and whether or not there is a change in the trend line of each outcome over time after SLC funds are introduced. The mixed model approach, therefore, allows us to answer the following questions:
1. How does each school change over time with respect to each outcome of interest?
2. Is there a difference in school-level performance before and after federal SLC funds were received?
3. Do trajectories of change vary among schools?

Chapter 5: Changes in Student Outcomes 113
These analyses produce two sets of results—an average trend (i.e., fixed effects) and estimates of variation across schools (i.e., random effects). That is, the fixed effects portion of the model estimates a trend over time across schools for the average SLC school, and the random effects portion reveals whether or not there is significant variation among individual schools around the estimated average. Both components contain equally valuable pieces of information. For example, even if an average trend line is flat overall, schools may vary significantly from each other in terms of their individual trend lines. Additional predictors can then be added to the model to examine whether or not this between-school variation is systematically related to features of the SLCs being implemented. Where significant between-school variation was found, we examined whether or not this variation was related to specific SLC structures (i.e., career or freshmen academies) or personalization strategies (as discussed in Chapter 3). The results of these analyses, however, showed that neither SLC structure types nor personalization strategies were significant predictors of variation in average trends for any of the outcomes examined in this chapter. A series of models was examined for each outcome, exploring whether or not a significant trend existed in the pre- or post-funding periods, and whether or not there was a significant “jump”, either positive or negative, between the two periods. “Best” fitting models were selected for each outcome, based on the statistical significance of the fixed and random effects (Appendix I, Exhibit I.1) contains details on the specific parameter estimates generated for each outcome). That is, the model underlying the presentation of each outcome was based on the most parsimonious representation of the shape of each trend line over time. Average trends, or the fixed effects, for each APR outcome are presented graphically in Exhibits 5.1 through 5.17. The emphasis of the discussion for each outcome is on apparent average trends in data over time, as well as any shifts in the data following receipt of SLC funding. Although the data displays focus on the average shifts and trends, we also indicate where significant variation exists among schools in terms of their individual trend lines. In this case, the average values plotted in the exhibits in this chapter do not necessarily represent the range of values among all schools. Appendix I (Exhibit I.2) contains additional information on the range in values for those parameter estimates where statistically significant variation was detected. Although statistical tests have been conducted on these trends, we first discuss a number of caveats to the data before presenting our results. These caveats are extremely important in interpreting the trends of APR outcomes discussed in this chapter. Caveats to Interpreting Trends
Data Issues and Measurement Error As mentioned previously in Chapter 2, the APR is based on self-reported data submitted to ED by each SLC grantee. The first round of APR data collection in fall 2001 provided data for the first implementation year after receiving SLC funds (SY 2000–01) as well as for the preceding four years. Subsequent administrations of the APR covered the most recently completed school year only. Thus, the pre-grant period data based on retrospective data collection may not be as accurate as post-grant data, depending on the data archiving capacity of each school district. In addition, the fact that the APR outcome data are collected from schools in different districts and states presents some challenges in terms of data comparability. One potential problem is that measures may not be calculated in a uniform manner across schools and districts. For instance, schools may vary in how they define “disciplinary action,” so that counts of the numbers of disciplinary actions may not be comparable across schools. Thus, although specific instructions were

Chapter 5: Changes in Student Outcomes 114
given to each grantee defining how the APR should be filled out, considerable variation exists among grantees in terms of how certain outcomes, such as disciplinary actions, postsecondary attendance or participation in extracurricular activities were interpreted. A related problem is the comparability of state assessment scores across states. The APR collects school-level measures of students’ performance on statewide assessments from schools across a large number of states, such as the number of students scoring at the “proficient” level in reading and language arts. Because many states design their own statewide assessments in response to some predetermined standard of competence, scoring at the “proficient” level has different meanings in different states. This limits our ability to compare performance on statewide tests across states. We can still measure the relative improvement of a school over time, however, assuming the same state tests are used and standards of competence have not changed. In addition to issues of potential non-comparability among schools, the APR outcome data are also limited in that they are measured at the level of the school, rather than the SLC itself. If only a fraction of the students are participating in an SLC program, any outcome data will include participants and nonparticipants alike. Therefore, it may be hard to detect changes in outcomes for SLC structures or strategies that affect just some students, as any such impact would be diluted across a larger number of students with the availability of data only at the school level. For example, many schools only implemented freshman academies as part of their SLC program. As these academies only enroll ninth-grade students, any outcomes measuring student progress will be attenuated by the fact that only a minority of the school’s population are affected by the intervention. Lack of Appropriate Comparison Group Given the lack of an appropriate comparison group for these data, trends should not necessarily be attributed to the SLC program. Without randomly assigning students to SLC schools coupled with appropriate controls, there is no way of conclusively determining whether observed trends are due to implementation of the SLC or to other alternative explanations (e.g., change in student population, presence of other concurrent reform efforts in schools, etc.). To facilitate this discussion and provide a general benchmark, however, national comparative data are also presented, when available. These data are provided with several caveats. First, data were obtained from several sources, including the Common Core of Data, other ED-sponsored datasets, and reports from the College Board and other sources, resulting in a lack of comparability. For certain variables, such as promotion rates, school-level values could be computed. In the case of other variables, such as average daily attendance, the only data available were aggregated to the state level. When data were available at the school level, the comparison could in some cases be restricted to include only high schools with grade 9 to 12 enrollments of more than 1,000 students. This is obviously not the case for state- or even district-level data, which may include data on elementary schools and schools of all sizes. In addition, in the case of variables such as average SAT score, estimates of national averages include both public and private schools. The national comparisons provided should be used as a general benchmark, but not for reaching any definitive conclusions about the performance of Cohort 1 SLC schools, especially given the lack of comparability with our data. Prior SLC Involvement Second, in examining the findings presented here on change in student outcomes over time, it is important to note that the majority of schools had already begun implementing their SLC prior to
Chapter 5: Changes in Student Outcomes 115
receiving grant funds. As reported in Chapter 3, upward of three-fourths of the Cohort 1 SLC schools had already begun some form of SLC implementation prior to the 2000–01 school year. Thus, any possible variation in changes in outcomes may only relate to the receipt of the SLC grant rather than to the implementation of an SLC. Dynamics of Implementation Process A possible cause of lack of change, or even negative change may be the implementation process itself. That is, restructuring such a large institution as a high school may not only lead to no immediate changes, but there may actually be a dip in outcomes as school staff take on and become accustomed to their new roles. Thus, although positive trends in outcomes should not necessarily be attributed to SLC implementation, negative or flat trends should also be viewed with caution as schools adjust to the task of restructuring. Student Academic Achievement Outcomes
In order to measure trends in academic achievement, 11th grade school-level mathematics and reading or language arts outcomes (as measured by statewide proficiency-based assessments) were examined. It is important to note that the 11th-grade data dealing with proficiency levels were particularly sparse. In fact, these data were mostly unavailable for schools located in California. Because the California schools make up approximately one-quarter of the Cohort 1 sample, we obtained school level Stanford 9 (SAT9) achievement test data for this portion of the sample.48 As these data were not comparable to data reported by other SLC schools, results are presented separately for all 27 California schools. As for non-California schools, based on our decision rule for including a school in the analysis of a particular outcome, a school had to have at least one data point in both the pre-funding and post-funding periods for trend lines in each period to be estimated. Because a number of schools lacked either pre- or post-funding data for these variables, a total of only 35 non-California schools were included in the examination of proficiency in reading or language arts, and only 31 were included in the examination of proficiency in mathematics. Also included in this section is an exploration of trends in school-level SAT and ACT participation rates and score averages. Statewide Assessment
Average scores for reading showed a statistically significant slight downward trend overall in the percentage of students at or above proficiency (Exhibit 5.1). In addition, there was a statistically significant variation shown across schools in the increase in reading proficiency made by schools during 2001–02. No relationship was found, however, between this variation among schools and SLC structure types or personalization strategies being implemented.49 For mathematics, on the other hand, although there was a statistically significant slight downward trend over time in the percentage of students at or above proficiency in mathematics, there was also a statistically significant increase
48 U.S. Department of Education, National School-Level State Assessment Score Database, 1997–98 to 2001–02. 49 In fact, neither SLC structures nor personalization strategies were significant predictors of average trends or variation
among schools for any of the outcomes examined in this chapter; full test information is provided in Appendix I.

Chapter 5: Changes in Student Outcomes 116
shown in the percentage of students at or above proficiency during the post-SLC grant period (Exhibit 5.2). Exhibit 5.1 Percentage of 11th-Grade Students At or Above Proficiency in Reading in Average SLC School (excluding California) (n=35)
62% 61% 60% 58%61% 59% 58%
20%
40%
60%
80%
1996–97 1997–98 1998–99 1999–00 2000–01 2001–02 2002–03
Per
cent
of S
tude
nts
Receipt of federal SLC funds
Exhibit reads: During the 1996–97 school year, 62 percent of students were at or above proficiency in reading in the average (non-California) SLC school.
Source: Implementation Study of Smaller Learning Communities: Annual Performance Report, Section 4A (Statewide Assessments), SY 1996–97 through SY 2002–03.
Note: The values presented in this exhibit were estimated with a mixed model analytical approach that is discussed in the methods section of this chapter and fully presented in Appendix I. Post-receipt values may not reflect SLC effectiveness given delays in implementation and other uncontrolled factors.

Chapter 5: Changes in Student Outcomes 117
Exhibit 5.2 Percentage of 11th-Grade Students At or Above Proficiency in Mathematics in Average SLC School (excluding California) (n=31)
59%55%
52%48%
57%54%
50%
20%
40%
60%
80%
1996–97 1997–98 1998–99 1999–00 2000–01 2001–02 2002–03
Per
cent
of S
tude
nts
Receipt of federal SLC funds
Exhibit reads: During the 1996–97 school year, 59 percent of students were at or above proficiency in mathematics in the average (non-California) SLC school.
Source: Implementation Study of Smaller Learning Communities: Annual Performance Report, Section 4A (Statewide Assessments), SY 1996–97 through SY 2002–03.
Note: The values presented in this exhibit were estimated with a mixed model analytical approach that is discussed in the methods section of this chapter and fully presented in Appendix I. Post-receipt values may not reflect SLC effectiveness given delays in implementation and other uncontrolled factors.
Exhibits 5.3 and 5.4 present the percentage of 11th-grade students at or above the 50th percentile on the SAT9. The exhibits suggest that statewide assessment scores for California schools changed for both reading and mathematics over this five-year period. The model for reading (Exhibit 5.3) reveals that although schools do not appear to be trending significantly over time in either the pre- or post- periods, there was a statistically significant small positive jump between the two periods of about two percentage points. For mathematics, on the other hand (Exhibit 5.4), there was a statistically significant slightly positive trend in the percentage of students at or above proficiency in mathematics over time, with no abrupt signal of change when schools received their SLC grants.

Chapter 5: Changes in Student Outcomes 118
Exhibit 5.3 Percentage of 11th-Grade Students At or Above 50th Percentile on SAT9 Reading in Average SLC School (California only) (n=27)
30% 30% 30%32% 32%
20%
40%
60%
80%
1996–97 1997–98 1998–99 1999–2000 2000–01 2001–02
Perc
ent o
f Stu
dent
s
Receipt of federal SLC funds
Exhibit reads: During the 1997–98 school year, 30 percent of 11th-grade students were at or above the 50th percentile on the Stanford 9 reading assessment in the average California SLC school.
Source: U.S. Department of Education, National School-Level State Assessment Score Database, 1997–98 to 2001–02.
Notes: a Data not available for SY 1996–97 or 2002–03.
b The values presented in this exhibit were estimated with a mixed model analytical approach that is discussed in the methods section of this chapter and fully presented in Appendix I. Post-receipt values may not reflect SLC effectiveness given delays in implementation and other uncontrolled factors.
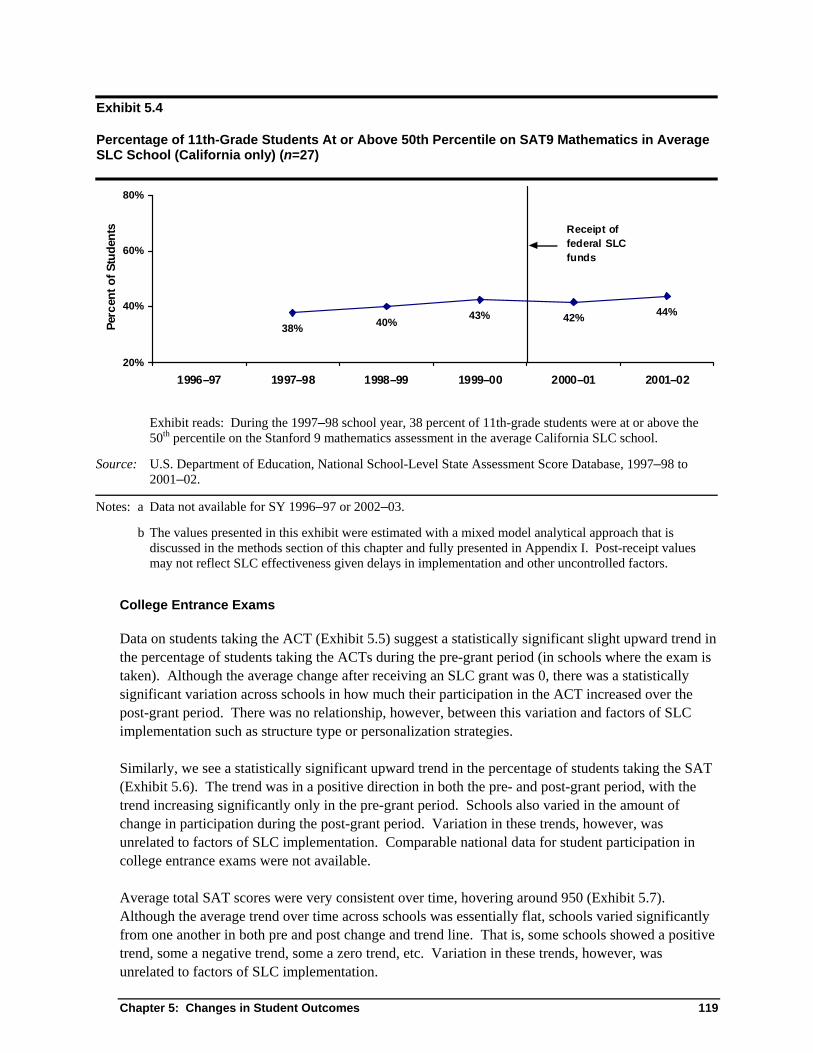
Chapter 5: Changes in Student Outcomes 119
Exhibit 5.4 Percentage of 11th-Grade Students At or Above 50th Percentile on SAT9 Mathematics in Average SLC School (California only) (n=27)
38% 40% 43% 42% 44%
20%
40%
60%
80%
1996–97 1997–98 1998–99 1999–00 2000–01 2001–02
Perc
ent o
f Stu
dent
s Receipt of federal SLC funds
Exhibit reads: During the 1997–98 school year, 38 percent of 11th-grade students were at or above the 50th percentile on the Stanford 9 mathematics assessment in the average California SLC school.
Source: U.S. Department of Education, National School-Level State Assessment Score Database, 1997–98 to 2001–02.
Notes: a Data not available for SY 1996–97 or 2002–03.
b The values presented in this exhibit were estimated with a mixed model analytical approach that is discussed in the methods section of this chapter and fully presented in Appendix I. Post-receipt values may not reflect SLC effectiveness given delays in implementation and other uncontrolled factors.
College Entrance Exams
Data on students taking the ACT (Exhibit 5.5) suggest a statistically significant slight upward trend in the percentage of students taking the ACTs during the pre-grant period (in schools where the exam is taken). Although the average change after receiving an SLC grant was 0, there was a statistically significant variation across schools in how much their participation in the ACT increased over the post-grant period. There was no relationship, however, between this variation and factors of SLC implementation such as structure type or personalization strategies. Similarly, we see a statistically significant upward trend in the percentage of students taking the SAT (Exhibit 5.6). The trend was in a positive direction in both the pre- and post-grant period, with the trend increasing significantly only in the pre-grant period. Schools also varied in the amount of change in participation during the post-grant period. Variation in these trends, however, was unrelated to factors of SLC implementation. Comparable national data for student participation in college entrance exams were not available. Average total SAT scores were very consistent over time, hovering around 950 (Exhibit 5.7). Although the average trend over time across schools was essentially flat, schools varied significantly from one another in both pre and post change and trend line. That is, some schools showed a positive trend, some a negative trend, some a zero trend, etc. Variation in these trends, however, was unrelated to factors of SLC implementation.

Chapter 5: Changes in Student Outcomes 120
Exhibit 5.5 Percentage of Students in Grades 11 and 12 Taking ACT Test in Average SLC School (n=64)
13% 14% 15% 15% 17% 16% 15%
0%
20%
40%
60%
1996–97 1997–98 1998–99 1999–00 2000–01 2001–02 2002–03
Perc
ent o
f Stu
dent
s
Receipt of federal SLC funds
Exhibit reads: During the 1996–97 school year, 13 percent of 11th- and 12th-grade students were taking the ACT test in the average SLC school.
Source: Implementation Study of Smaller Learning Communities: Annual Performance Report, Section 4B (College Entrance Exams), SY 1996–97 through SY 2002–03.
Note: The values presented in this exhibit were estimated with a mixed model analytical approach that is discussed in the methods section of this chapter and fully presented in Appendix I. Post-receipt values may not reflect SLC effectiveness given delays in implementation and other uncontrolled factors.

Chapter 5: Changes in Student Outcomes 121
Exhibit 5.6 Percentage of Students in Grades 11 and 12 Taking SAT Test in Average SLC School (n=90)
18% 19% 19% 19% 21% 23% 25%
0%
20%
40%
60%
1996–97 1997–98 1998–99 1999–00 2000–01 2001–02 2002–03
Perc
ent o
f Stu
dent
s
Receipt of federal SLC funds
Exhibit reads: During the 1996–97 school year, 18 percent of 11th- and 12th-grade students were taking the SAT test in the average SLC school.
Source: Implementation Study of Smaller Learning Communities: Annual Performance Report, Section 4B (College Entrance Exams), SY 1996–97 through SY 2002–03.
Note: The values presented in this exhibit were estimated with a mixed model analytical approach that is discussed in the methods section of this chapter and fully presented in Appendix I. Post-receipt values may not reflect SLC effectiveness given delays in implementation and other uncontrolled factors.
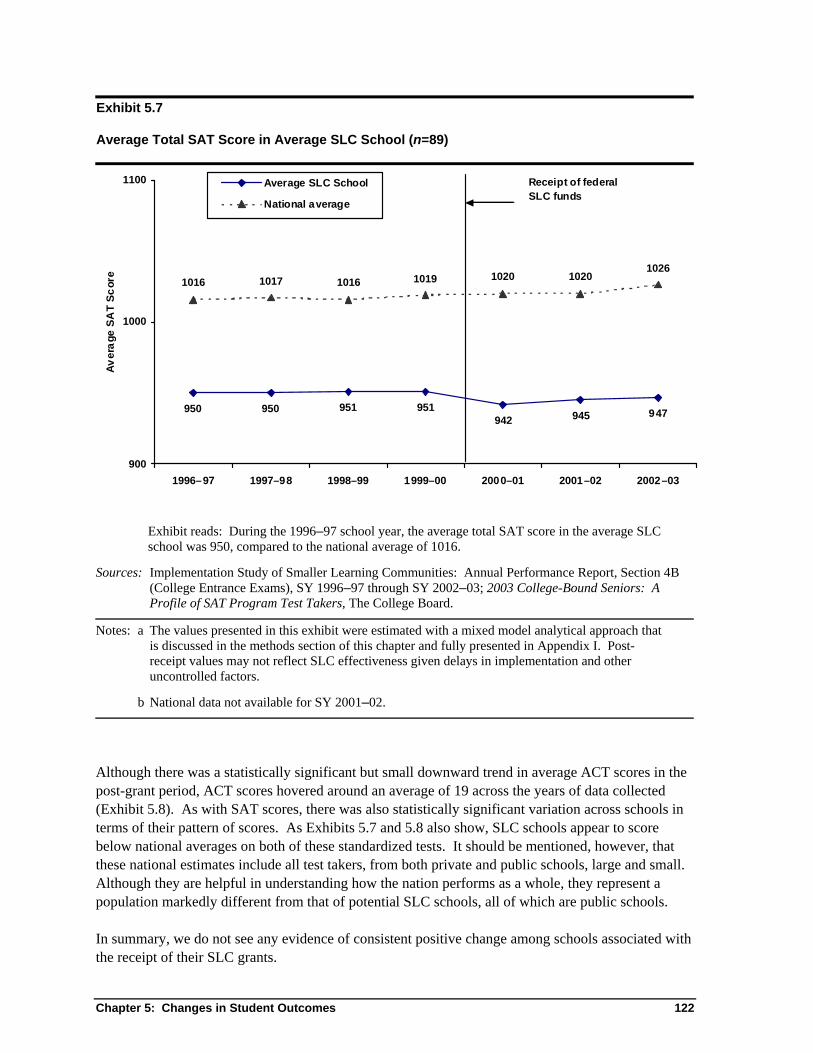
Chapter 5: Changes in Student Outcomes 122
Exhibit 5.7 Average Total SAT Score in Average SLC School (n=89)
950 950 951 951942 945 947
1016 1017 1016 1019 1020 10201026
900
1000
1100
1996–97 1997–98 1998–99 1999–00 2000–01 2001–02 2002–03
Aver
age
SAT
Scor
e
Average SLC School
National average
Receipt of federal SLC funds
Exhibit reads: During the 1996–97 school year, the average total SAT score in the average SLC school was 950, compared to the national average of 1016.
Sources: Implementation Study of Smaller Learning Communities: Annual Performance Report, Section 4B (College Entrance Exams), SY 1996–97 through SY 2002–03; 2003 College-Bound Seniors: A Profile of SAT Program Test Takers, The College Board.
Notes: a The values presented in this exhibit were estimated with a mixed model analytical approach that is discussed in the methods section of this chapter and fully presented in Appendix I. Post- receipt values may not reflect SLC effectiveness given delays in implementation and other uncontrolled factors.
b National data not available for SY 2001–02.
Although there was a statistically significant but small downward trend in average ACT scores in the post-grant period, ACT scores hovered around an average of 19 across the years of data collected (Exhibit 5.8). As with SAT scores, there was also statistically significant variation across schools in terms of their pattern of scores. As Exhibits 5.7 and 5.8 also show, SLC schools appear to score below national averages on both of these standardized tests. It should be mentioned, however, that these national estimates include all test takers, from both private and public schools, large and small. Although they are helpful in understanding how the nation performs as a whole, they represent a population markedly different from that of potential SLC schools, all of which are public schools. In summary, we do not see any evidence of consistent positive change among schools associated with the receipt of their SLC grants.

Chapter 5: Changes in Student Outcomes 123
Exhibit 5.8 Average Total ACT Score in Average SLC School (n=70)
19.3 19.4 19.4 19.5 19.4 19.2 19
21 21 21 21 21 21 21
15
20
25
1996–97 1997–98 1998–99 1999–00 2000–01 2001–02 2002–03
Ave
rage
AC
T Sc
ore
Average SLC school
National average
Receipt of federal SLC funds
Exhibit reads: During the 1996–97 school year, the average total ACT score in the average SLC school was 19.3, compared to the national average of 21.
Sources: Implementation Study of Smaller Learning Communities: Annual Performance Report, Section 4B (College Entrance Exams), SY 1996–97 through SY 2002–03; 2001, 2003 ACT National Score Reports.
Note: The values presented in this exhibit were estimated with a mixed model analytical approach that is discussed in the methods section of this chapter and fully presented in Appendix I. Post-receipt values may not reflect SLC effectiveness given delays in implementation and other uncontrolled factors.
Achievement of Academic Milestones
Ninth-Grade Promotion Rate
Although ninth-grade promotion rates appear stable, on average, across all years of data collection (Exhibit 5.9), there is a statistically significant positive trend in the percentage of ninth-grade students being promoted to 10th grade during the post-grant period. It is noteworthy that this trend also held for SLC schools implementing freshman academies, which have as an expressed focus reducing the ninth-grade dropout rate. In addition, mean estimates were similar to the national average for large high schools by the end of data collection (85 percent).

Chapter 5: Changes in Student Outcomes 124
Exhibit 5.9 Promotion Rate from 9th to 10th Grade in Average SLC School (n=116)
82% 82% 81% 81%83%
85%
85% 85% 85% 85%85%
70%
80%
90%
100%
1996–97 1997–98 1998–99 1999–00 2000–01 2001–02 2002–03
Per
cent
of S
tude
nts
Average SLCschool
National average
Receipt of federal SLC funds
Exhibit reads: During the 1998–99 school year, 82 percent of 9th grade students were promoted to 10th grade in the average SLC school, compared to the national average of 85 percent.
Sources: Implementation Study of Smaller Learning Communities: Annual Performance Report, Section 2 (School Background), SY 1996–97 through SY 2002–03; Common Core of Data, Public Elementary, Secondary School Universe Survey Data, 1997–2003.
Notes: The values presented in this exhibit were estimated with a mixed model analytical approach that is discussed in the methods section of this chapter and fully presented in Appendix I. Post-receipt values may not reflect SLC effectiveness given delays in implementation and other uncontrolled factors. Data for SLC schools not available for SY 1996–97. National data not available for SY 1996–97 and 1997–98.
Graduation Rate (Based on 9th-Grade and 12th-Grade Enrollment of Graduating Cohort)
Graduation rate was calculated via two different ways for these analyses—based both on the ninth-grade enrollment four years prior of the graduating cohort and on the 12th-grade enrollment of the graduating cohort (Exhibit 5.10). Graduation rate based on ninth-grade enrollment provides a better picture of the prevalence of failure to complete a secondary education. Nevertheless, because we were limited to seven years of SLC school data, we were only able to calculate graduation rate based on ninth-grade enrollment for four years, school years 1999–00 through 2002–03. In contrast, using 12th-grade enrollment provides more information about the shape of the trend line across all seven years for which we have data. In examining Exhibit 5.10, we notice first that there was a discrepancy of approximately 33 percentage points between the estimates based on 9th- and 12th-grade enrollments—indicating that a large proportion of students, indeed, leave high school before entering the 12th grade. Nevertheless, the shapes of the trend lines are similar. Although there was a slight jump downward after SLC funding (statistically significant where graduation rate is based on ninth-grade enrollment), data over time revealed a statistically significant slight upward trend in graduation rate, based on ninth-grade enrollment.

Chapter 5: Changes in Student Outcomes 125
Exhibit 5.10 Graduation Rates in Average SLC School, Based on 9th- and 12th-Grade Enrollment of Graduating Cohort (n=114)
87% 88% 88% 89% 88% 89%91%
55%53%
55%57%
50%
60%
70%
80%
90%
100%
1996–97 1997–98 1998–99 1999-2000 2000–01 2001–02 2002–03
Per
cent
of
Stud
ents
Based on 12th gradeenrollmentBased on 9th gradeenrollment
Receipt of federal SLC funds
Exhibit reads: During the 1999–2000 school year, the graduation rate based on 12th-grade enrollment was 89 percent and the graduation rate based on 9th-grade enrollment four years prior was 55 percent in the average SLC school.
Source: Implementation Study of Smaller Learning Communities: Annual Performance Report, Section 4C (Other Outcome Measures), SY 1996–97 through SY 2002–03.
Note: The values presented in this exhibit were estimated with a mixed model analytical approach that is discussed in the methods section of this chapter and fully presented in Appendix I. Post-receipt values may not reflect SLC effectiveness given delays in implementation and other uncontrolled factors.
Participation in Postsecondary Education
Although simultaneous enrollment in secondary and college-level courses remains rather uncommon among students in SLC schools (Exhibit 5.11), there is about a statistically significant 2 percentage-point increase in participation post-SLC grant. The data also suggest increases in the percentage of graduating students intending to attend either two- or four-year colleges (Exhibit 5.12). That is, there is an average statistically significant increase of about 4 percentage points between the pre- and post-grant periods. The absence of comparative national data, however, makes it difficult to infer whether this is due to receipt of the SLC grant rather than part of a more general national trend.

Chapter 5: Changes in Student Outcomes 126
Exhibit 5.11 Percentage of Students Simultaneously Enrolled in Secondary and College-Level Courses in Average SLC School (n=86)
3%4% 4%
5%6%
5%4%
0%
5%
10%
1996–97 1997–98 1998–99 1999–00 2000–01 2001–02 2002–03
Perc
ent o
f Stu
dent
s
Receipt of federal SLC funds
Exhibit reads: During the 1996–97 school year, 3 percent of students were simultaneously enrolled in secondary and college-level courses in the average SLC school.
Source: Implementation Study of Smaller Learning Communities: Annual Performance Report, Section 4C (Other Outcome Measures), SY 1996–97 through SY 2002–03.
Note: The values presented in this exhibit were estimated with a mixed model analytical approach that is discussed in the methods section of this chapter and fully presented in Appendix I. Post-receipt values may not reflect SLC effectiveness given delays in implementation and other uncontrolled factors.
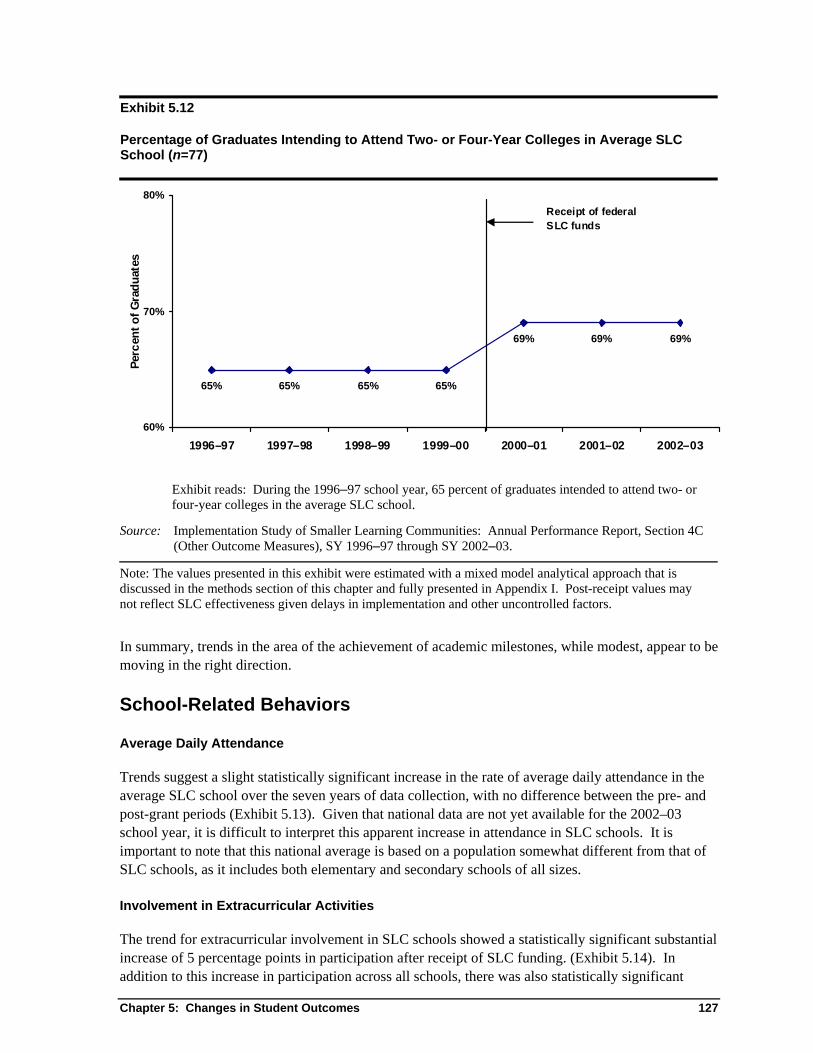
Chapter 5: Changes in Student Outcomes 127
Exhibit 5.12 Percentage of Graduates Intending to Attend Two- or Four-Year Colleges in Average SLC School (n=77)
65% 65% 65% 65%
69% 69% 69%
60%
70%
80%
1996–97 1997–98 1998–99 1999–00 2000–01 2001–02 2002–03
Perc
ent o
f Gra
duat
es
Receipt of federal SLC funds
Exhibit reads: During the 1996–97 school year, 65 percent of graduates intended to attend two- or four-year colleges in the average SLC school.
Source: Implementation Study of Smaller Learning Communities: Annual Performance Report, Section 4C (Other Outcome Measures), SY 1996–97 through SY 2002–03.
Note: The values presented in this exhibit were estimated with a mixed model analytical approach that is discussed in the methods section of this chapter and fully presented in Appendix I. Post-receipt values may not reflect SLC effectiveness given delays in implementation and other uncontrolled factors.
In summary, trends in the area of the achievement of academic milestones, while modest, appear to be moving in the right direction. School-Related Behaviors
Average Daily Attendance
Trends suggest a slight statistically significant increase in the rate of average daily attendance in the average SLC school over the seven years of data collection, with no difference between the pre- and post-grant periods (Exhibit 5.13). Given that national data are not yet available for the 2002–03 school year, it is difficult to interpret this apparent increase in attendance in SLC schools. It is important to note that this national average is based on a population somewhat different from that of SLC schools, as it includes both elementary and secondary schools of all sizes. Involvement in Extracurricular Activities
The trend for extracurricular involvement in SLC schools showed a statistically significant substantial increase of 5 percentage points in participation after receipt of SLC funding. (Exhibit 5.14). In addition to this increase in participation across all schools, there was also statistically significant

Chapter 5: Changes in Student Outcomes 128
variation across schools in how much they increased in the post-grant period. This variation, however, was unrelated to factors of SLC implementation. Exhibit 5.13 Average Daily Attendance in Average SLC School (n=88)
89% 89%
90% 90% 90%
91% 91%
92%
93% 93% 93% 93% 93%
85%
90%
95%
1996–97 1997–98 1998–99 1999–2000 2000–01 2001–02 2002–03
Perc
ent o
f Stu
dent
s
Average SLC school
National average
Receipt of federal SLC funds
Exhibit reads: During the 1996–97 school year, the average daily attendance in the average SLC school was 89 percent, compared to the national average of 92 percent.
Sources: Implementation Study of Smaller Learning Communities: Annual Performance Report, Section 4C (Other Outcome Measures), SY 1996–97 through SY 2002–03; National Public Education Financial Survey and State Nonfiscal Public Elementary, Secondary Education Survey, 1996–2002.
Notes: The values presented in this exhibit were estimated with a mixed model analytical approach that is discussed in the methods section of this chapter and fully presented in Appendix I. Post-receipt values may not reflect SLC effectiveness given delays in implementation and other uncontrolled factors. National data not available for SY 2002–03.

Chapter 5: Changes in Student Outcomes 129
Exhibit 5.14 Percentage of Students Involved in Extracurricular Activities in Average SLC School (n=78)
41% 42% 42% 43%
49% 49% 50%
20%
40%
60%
80%
1996–97 1997–98 1998–99 1999–00 2000–01 2001–02 2002–03
Perc
ent o
f Stu
dent
s
Receipt of federal SLC funds
Exhibit reads: During the 1996–97 school year, 41 percent of students were involved in extracurricular activities in the average SLC school.
Source: Implementation Study of Smaller Learning Communities: Annual Performance Report, Section 4C (Other Outcome Measures), SY 1996–97 through SY 2002–03.
Note: The values presented in this exhibit were estimated with a mixed model analytical approach that is discussed in the methods section of this chapter and fully presented in Appendix I. Post-receipt values may not reflect SLC effectiveness given delays in implementation and other uncontrolled factors.
Incidence of Student Violence, Drug or Alcohol Use, and Disciplinary Action
The three most recent years of data collection following the receipt of the SLC grant suggest that incidence of negative behaviors such as student violence (Exhibit 5.15) may be on the decline. The data suggest that, on average, SLC schools experienced a statistically significant 1.4-point drop in the number of violent incidents (per 100 students) during the post-grant period. Although the average rate of change was not significantly different from zero in either the pre- or post-grant periods, the rates of change did vary significantly across schools. This variation, however, was not explainable by SLC implementation factors.

Chapter 5: Changes in Student Outcomes 130
Exhibit 5.15 Incidence of School Violence per 100 Students in Average SLC School (n=100)
5.6 5.7 5.7 5.8
4.5 4.7 4.8
0
2
4
6
8
10
1996–97 1997–98 1998–99 1999–00 2000–01 2001–02 2002–03
Num
ber o
f inc
iden
ts
Receipt of federal SLC funds
Exhibit reads: During the 1996–97 school year there were 5.6 incidents of school violence per 100 students in the average SLC school.
Source: Implementation Study of Smaller Learning Communities: Annual Performance Report, Section 4C (Other Outcome Measures), SY 1996–97 through SY 2002–03.
Note: The values presented in this exhibit were estimated with a mixed model analytical approach that is discussed in the methods section of this chapter and fully presented in Appendix I. Post-receipt values may not reflect SLC effectiveness given delays in implementation and other uncontrolled factors.
There was little change, however, in the incidence of alcohol and drug use in SLC schools across this seven-year period (Exhibit 5.16). That is, there was no evidence of statistically significant differences between the pre-and post-grant period across schools. National comparative data (for the 1998–99 school year only) suggest that SLC schools may have a higher-than-average incidence of violence and drug or alcohol use. Based on a subsample of large high schools (n=104), data from the School Health Policies and Programs Study 2000 (SHPPS) estimate an average of 2.14 incidents of violence per 100 students (median = 1.41) and 1.09 incidents of drug or alcohol use per 100 students (median = 0.85), although these estimates, based on only 104 schools, are subject to sampling error. National longitudinal data can help identify if these apparent dips in student violence and drug and alcohol use may be the result of SLC implementation or are simply a mirror of national trends.

Chapter 5: Changes in Student Outcomes 131
Exhibit 5.16 Incidence of Alcohol and Drug Use per 100 Students in Average SLC School (n=93)
1.8 1.8 1.7 1.6 1.6 1.5 1.4
0
1
2
3
4
5
1996–97 1997–98 1998–99 1999–00 2000–01 2001–02 2002–03
Num
ber o
f inc
iden
ts
Receipt of federal SLC funds
Exhibit reads: During the 1996–97 school year there were 1.8 incidents of alcohol or drug use per 100 students in the average SLC school.
Source: Implementation Study of Smaller Learning Communities: Annual Performance Report, Section 4C (Other Outcome Measures), SY 1996–97 through SY 2002–03.
Note: The values presented in this exhibit were estimated with a mixed model analytical approach that is discussed in the methods section of this chapter and fully presented in Appendix I. Post-receipt values may not reflect SLC effectiveness given delays in implementation and other uncontrolled factors.
Although, on average, there is a very slight but not statistically significant downward trend in the number of disciplinary incidents per 100 students in SLC schools, the rate of change was not significantly different in the post-grant period (Exhibit 5.17). There was statistically significant variation, however, in both the amount and rate of change across schools, which was unrelated to any factors of SLC implementation. Unfortunately, national comparative data for these estimates are not available, and thus interpretations of this time trend must be made with caution.

Chapter 5: Changes in Student Outcomes 132
Exhibit 5.17 Incidence of Disciplinary Action per 100 Students in Average SLC School (n=113)
31.129.7
28.326.9 27.1
25.624.2
0
10
20
30
40
50
1996–97 1997–98 1998–99 1999–00 2000–01 2001–02 2002–03
Num
ber
of in
cide
nts
Receipt of federal SLC funds
Exhibit reads: During the 1996–97 school year there were 31.1 incidents of disciplinary action per 100 students in the average SLC school.
Source: Implementation Study of Smaller Learning Communities: Annual Performance Report, Section 4C (Other Outcome Measures), SY 1996–97 through SY 2002–03.
Note: The values presented in this exhibit were estimated with a mixed model analytical approach that is discussed in the methods section of this chapter and fully presented in Appendix I. Post-receipt values may not reflect SLC effectiveness given delays in implementation and other uncontrolled factors.
In sum, early changes in academic outcomes, as measured by APR data, are modest at best. When there is evidence of change, trends appear to be moving in the right direction, especially in the area of behavioral outcomes. Specifically, trends in APR data suggest an upward trend in student extracurricular participation and downward trends in incidence of school violence, disciplinary action, and alcohol and drug use. Increases in the percentage of students taking the SAT and the percentage of students intending to continue to postsecondary education suggest a possible greater interest by students in SLC schools in postsecondary education. The following chapter summarizes the findings on Cohort 1 SLC schools as presented in this report.

Chapter 6: Summary of Findings and Future Directions 133
Chapter 6 Summary of Findings and Future Directions
This chapter summarizes the findings on Cohort 1 schools from the Implementation Study of Smaller Learning Communities. In the last section of this chapter we discuss the future of Cohort 1 schools and lessons learned for prospective SLC districts and schools. Major Study Findings
SLC Schools Compared to Large High Schools Nationwide
The SLC schools in the first group of grantees are distinctly different from other large high schools (that is, schools with at least 1,000 students). The SLC schools are larger (median enrollment of 1,874 students vs. 1,554 in large high schools), have a much higher percentage of minority enrollment (median of 60 percent vs. 22 percent), and are more likely to be located in urban areas (60 percent vs. 33 percent). Overview of SLC Implementation
Most schools reported applying for SLC funds to increase overall student academic achievement (95 percent of schools), academic achievement of at-risk students (90 percent), and student motivation (87 percent). Schools were more likely to cite student academic or behavioral issues as major influences in their decision to implement an SLC program than issues external to the school, such as state or district mandates. More than half (54 percent) of the schools, however, highlighted the need for better student preparation for mandated assessments, and about half (49 percent) cited district-mandated school reform, as major influences in implementing an SLC. Schools responded to congressional intent to implement varied approaches, and they tended to implement more than one SLC structure or strategy, with schools averaging 1.3 structures and 2.3 strategies. The most prevalent structures were career and freshman academies. Schools also changed over time, both in the number and types of SLC structures they were implementing. Freshman academies showed the most growth. In 2001–02, 38 percent of SLC schools had freshman academies; by 2002–03, the number had risen to 55 percent. Career academies showed some growth (from 38 percent of schools to 42 percent), whereas the overall proportion of other structures remained relatively unchanged. Schools with freshman academies, career academies, or schools-within-schools were more likely than schools with other structures to continue to implement the same SLC structures across both school years. Schools with freshman academies, house plans, and career academies reported success in involving a majority of their eligible students. Schools with freshman academies reported a high level of participation (78 percent on average) among their ninth-grade students. For house plans, average student participation was 77 percent during the 2002–03 school year. In addition to, or in place of, SLC structures, schools also chose to implement one or more SLC strategies, with block scheduling (58 percent of schools) and teacher teams (52 percent) the most popular choices. Schools appeared to be gradually shifting from the use of SLC strategies to a greater

Chapter 6: Summary of Findings and Future Directions 134
use of SLC structures over time. The percent of schools implementing only strategies dropped from 23 percent to 16 percent over the two years. Although SLC schools may implement a variety of structures and strategies, they all share the common goal of enhancing personalization of the high school experience for all students. We measured personalization along three separate dimensions:
• Individualized assessment and classroom practices (e.g., individualized assessments, independent study, and cooperative learning);
• Teacher teaming and class-size reduction (e.g., students taught by clusters of teachers, teachers responsible for fewer students, and class-size reduction); and
• Fostering individual student and staff relationships (e.g., existence and frequency of use of informal or formal mentoring programs).
All but two schools reported undertaking efforts to increase personalization. Most schools used individualized assessments (76 percent of schools), and about two-thirds (63 percent) reported reducing class size (or reducing the total number of students for which a teacher was responsible). Close to half of the schools (47 percent) were active in fostering individual student and staff relationships through the establishing of a formal mentoring program. Half of the schools reported making significant efforts on at least one dimension of personalization. Of these, most schools were high on a single dimension (34 schools), but another 17 schools were high on two dimensions. Only a single school reported making significant efforts on all three dimensions. Another goal of the SLC legislation was providing professional development for school staff in innovative teaching methods that challenge and engage students, a key strategy used by schools for bringing about school change. Schools reported providing a wide range of professional development activities for their teaching staff, including tailoring instruction to individual student needs (95 percent of schools), subject matter content and curriculum (95 percent), problem solving and reasoning (93 percent), and strategies for helping low-achieving students (90 percent). SLC teachers received a little more than three days of professional development per year. A third goal of the SLC legislation was to include parents, business representatives, institutions of higher education, and other community resources as facilitators of schools’ SLC activities and as links between students and their communities. Four-fifths of schools (82 percent) reported working with external partners, such as businesses, institutions of higher education, and community based organizations in 2002–03. Most schools used partners on advisory committees and as in-school volunteers. Those schools engaging external partners with their SLCs reported that they derived specific benefits for their students, including such career-related opportunities as community service learning, internships, and job shadowing. Schools also reported parents involved in such school-level activities as the PTA and school governance. Involvement by parents in SLC activities was less common and cited by fewer schools (never more than 54 percent of schools for any one activity). Factors Affecting Overall Implementation
The literature review on small schools and SLCs identified several factors that can facilitate or hinder implementation of SLCs. SLC respondents reported a similar set of factors, including professional development specifically focused on SLCs; the availability of resources, including instructional

Chapter 6: Summary of Findings and Future Directions 135
materials; and a variety of teacher-related variables (e.g., attitudes toward reform, pedagogical practices, and expertise). Other factors could also be linked with implementation of a school’s SLC initiative, including a school’s prior involvement in SLC activities, the availability of external funding, and involvement in other SLC-related reform efforts. Schools also perceived a number of factors to have a negative influence on SLC implementation. These inhibitors include structural challenges, such as issues with scheduling or physical space, as well as school staffing needs, especially in terms of core academic teachers and guidance counselors. Implementation of Career and Freshman Academies
Using the available PIS data, a high implementing career academy was defined as having the following characteristics:
• Common planning time for teachers (for such purposes as facilitating integration of academic and vocational opportunities or discussing the needs of students they teach in common);
• Autonomy over such program policies as staffing decisions and operating procedures;
• Work-based learning opportunities and internship programs for students; and
• Career-related graduation requirements that included both course work and service learning projects or a cooperative working experience.
In addition, a high implementing career academy should have:
• An increased number of courses that integrate academic and vocational instruction or specific to the SLC program them;
• Students taking more than half their course load within the career academy; and
• Demographically similar enrollments by race between career academies and the school as a whole.
Among the 44 schools with career academies with federal SLC funding, eight met all of the first four criteria for a high implementing career academy. Twenty-six career academy programs met the criteria for moderately implementing defined as having some but not all the features of high implementing career academies. A total of ten schools with career academies were classified as low implementing defined as having few structures or requirements in place and having little autonomy over their operations. Freshman academies had fewer requirements to meet than career academies. Using the available PIS data, a high implementing freshman academy was defined as having the following characteristics:

Chapter 6: Summary of Findings and Future Directions 136
• At least weekly common planning time for teachers, so that teachers may discuss the needs of students whom they have in common;
• Autonomy over select program policies; and
• Demographically similar enrollments by race between career academies and the school as a whole.
Of the 58 schools with freshman academies, 33 meet the first two criteria. Thirteen freshman academy programs met the criteria for moderately implementing as having some but not all the features of high implementing career academies. The remaining 12 schools in the freshman academy sample have more limited implementation. Note that having a separate space for freshman academies does not distinguish high and low implementing freshman academies; almost all freshman academy programs have at least some separate identify for their freshmen. A common set of factors affecting implementation in both freshman and career academies has emerged from case study visits and follow-up telephone interviews with a sample of schools. Facilitating factors include strong school leadership, a supportive district, staff buy-in, and sufficient space to make programs separate. Identified challenges to implementation include staff (and administrative) turnover, weak school leadership, prescriptive district oversight of SLC changes, and limited resources. Changes in Student Outcomes
Changes in academic outcomes, as measured by APR data, were modest at best. Where there is evidence of change, trends appear to be moving in the right direction. Specifically, trends in APR data suggest upward trends in student extracurricular participation, ninth-grade promotion rates and downward trends in incidence of school violence, disciplinary action, and alcohol and drug use. In addition, trends in outcomes such as increases in the percentage of students taking the SAT and the percentage of students intending to continue to postsecondary education suggest a possible greater interest by students in SLC schools in postsecondary education.

Chapter 6: Summary of Findings and Future Directions 137
Overall Extent of SLC Implementation
The question naturally remains, how successful were the Cohort 1 SLC schools in reaching a significant level of program implementation after three years of SLC funding? By the schools’ own accounts, most schools had rated themselves as having made significant progress toward full implementation of their SLC program as of the end of the 2002–03 school year, on average ranging from a low of 83 percent for career academies to a high of 91 percent for house plans. Admittedly, this measure is a flawed one, as it is based on a school’s initial plans for their federally funded SLC program implementation, some of which could have been quite modest. In this report, we have attempted to provide some indications of how “successful” schools have been in their SLC implementation. In earlier chapters, we reported on how well individual schools had performed on various indicators tied to SLC legislative goals. In this summary we report how well schools performed in terms of full implementation across a set of implementation criteria tied to the goals of the SLC legislation. Following each indicators listed below is our definition of full implementation.
• Extent of personalization efforts: Schools needed to report making significant efforts on at least one dimension of increasing personalization.
• Providing professional development: Schools needed to report the availability of SLC specific professional development for their SLC instructional staff. In addition, schools needed to report that their SLC teachers received at least 16 hours of SLC-specific professional development during the 2002–03 school year.
• Including community representatives and parents: Schools needed to report having external partners working directly with their SLCs during the 2002–03 school year. In addition, schools needed to report some form of parental involvement specific to the SLC program.
The results from this analysis showed that a little over a quarter (27 out of 105) of the Cohort 1 SLC schools met all of the criteria tied to the goals of the SLC legislation. That is, they reported making significant efforts on at least one dimension of increasing personalization, their instructional staff received at least 16 hours of SLC-specific professional development to their instructional staff, and they reported success in involving external partners and parents directly in SLC activities. In addition, close to three-fourths of these “well implemented” schools (20 out of 27) had either moderately or highly implemented academies (freshman or career). Although only a minority of Cohort 1 schools reached a full level of implementation by the criteria stated by the SLC legislation, many schools were able to enact important SLC-related changes in the way they organized their schools and classrooms as a result of their SLC funding. The following section reviews the sustainability of these changes, as well as the implications of these findings for schools and districts wishing to implement SLCs in the future. Where Do SLCs Go From Here?
Interest in high school reform in general, and in SLCs in particular, has increased dramatically over the past five years. To facilitate an expanded discussion of the future of these reforms, this section of the chapter addresses three topics:

Chapter 6: Summary of Findings and Future Directions 138
• The extent to which Cohort 1 schools reported that schoolwide and classroom-level
reforms undertaken under the federal SLC program will be sustained;
• The lessons learned from the Cohort 1 SLC grantees that may be of use to potential districts and SLC schools; and
• The implications for further research and support for SLCs and other high school reform efforts.
Sustainability of School- and Classroom-Level Changes
Many schools have relied on their SLC funding to enact important structural changes in their school organization and classroom practices. At the school level, the vast majority of schools reported introducing staff development specific to their SLCs (88 percent), reorganizing their curricula or instructional staff based upon the content and structure of their SLCs (80 percent), or making structural changes to student cohort organizations (72 percent) as a result of receiving their SLC grants (Exhibit 6.1). Changes at the classroom level were made by fewer schools; over half of schools, however, reported either integrating a cooperative learning focus into their curricula (63 percent) or having teachers serve as advisors or mentors (60 percent) as a result of their SLC funding (Exhibit 6.2). In looking ahead, a key question concerns the extent to which SLC schools expect to sustain the changes they have made at both the school and classroom levels after their SLC funding has run out. The data collected on these schools suggest a serious commitment on the part of many schools to sustain structural changes in the way their school and classrooms are organized. Specifically, close to or more than three-quarters of those schools reporting having made changes using SLC funding expect to sustain those changes after their grants end. For example, almost all (96 percent) of the schools that reported making their schoolwide core curricula more academically rigorous are committed to sustaining those changes even after their SLC funding has run out (Exhibit 6.1). Similarly, 94 percent of the schools that reported using more varied student assessments for grading and promotion decisions expect to sustain those changes in the future. Although schools were less likely to report classroom-level changes with the federal SLC funding, at least 80 percent of the schools that had implemented classroom-level changes also reported that they would sustain them. The exception is reduced class size, a change that may not be within the power of the school to sustain.

Chapter 6: Summary of Findings and Future Directions 139
Exhibit 6.1 Percentages of SLC Schools Making School-Level Changes and Expecting to Sustain These Changes After Federal SLC Funding (n=103)
97%
78%
82%
90%
92%
96%
87%
90%
88%
74%
52%
63%
72%
88%
50%
40%
30%
36%
38%
80%
0% 20% 40% 60% 80% 100%
Local assessment (e.g., school- or district-level) options havebeen altered to reflect SLCs (e.g., use of projects/portfolios
Because of block scheduling or other changes, each teacherteaches a smaller total number of students than before.
School governance/administrative structure has beenreconstructed (e.g., site-based management)
School physical space has been changed to accommodate SLCs
The manner in which students are placed in courses haschanged (e.g., elimination of tracking)
School-wide core curriculum has been made more academicallyrigorous
New courses specific to SLCs have been introduced
Structural changes have been made to student cohortorganization (e.g., by grade, by house, by duties of teachers)
Curriculum and/or instructional staff have been reorganizedbased upon content/structure of SLCs
Staff development and training specific to SLCs have beenintroduced
Percent of SchoolsSchools making chanages
Schools intending to sustain changes
Exhibit reads: Eighty-eight percent of schools reported making changes in staff development and training as a result of federal SLC funding. Of these schools, 74 percent expect to sustain those changes after funding ends.
Source: Implementation Study of Smaller Learning Communities: Periodic Implementation Survey, 2003, Section A, Question 3: “In Column A, indicate school-level SLC-type changes that have occurred as a result of federal SLC program funding. In column B, indicate changes that you expect to sustain after federal SLC funding (check all that apply).”
School-level changes designed to foster SLCs

Chapter 6: Summary of Findings and Future Directions 140
Exhibit 6.2 Percentages of SLC Schools Making Classroom-Level Changes and Expecting to Sustain These Changes After Federal SLC Funding (n=103)
92%
95%
82%
72%
89%
85%
92%
94%
83%
90%
40%
48%
50%
63%
37%
32%
12%
19%
22%
60%
0% 20% 40% 60% 80% 100%
Student evaluations of teachers are being used
Independent study is available in core academic courses
Students keep same homeroom teacher throughout high school
Classes are smaller than before
Students are taught by the same cluster of teachers for multipleyears
There is flexible time for classes and additional study
Mixed-ability classes are available in core academic subjects
More varied student assessments are used for grading andpromotion decisions
Teachers serve as advisors or mentors
A cooperative learning focus has been integrated into thecurriculum
Percent of SchoolsSchools making changes
Schools intending to sustain changes made
Exhibit reads: Sixty-three percent of schools reported implementing a cooperative learning focus as a result of federal SLC funding. Of these schools, 90 percent expect to sustain those changes after funding ends.
Source: Implementation Study of Smaller Learning Communities Periodic Implementation Survey, 2003, Section A, Question 4: “In column A, indicate classroom-level changes that have occurred as a result of federal SLC program funding. In column B, indicate changes that you expect to sustain after federal SLC funding (check all that apply).” See 6.1 (Section A, Question 4).
Lessons Learned for Districts and Schools
The experiences of the first cohort of SLC grantees provide useful information for subsequent cohorts about what schools have implemented and what factors influence implementation (especially those factors influencing implementation of career and freshman academies). For potential districts and schools to assess their readiness to undertake SLC implementation, we have organized lessons learned into a series of questions and answers. We hope the self-reflective questions help guide districts and schools in their decision to implement SLCs.
Classroom-level changes designed to foster SLCs

Chapter 6: Summary of Findings and Future Directions 141
To What Extent Are the High Schools Ready for Reform? Schools need to have a welcoming attitude toward change, be well managed, and have autonomy over select program activities. Both teachers and students are affected. Career academies and (to a lesser extent) freshman academies are radical reforms for high schools. When such reforms are seen as the most appropriate solution for the school’s problem and when schools have sufficient authority to allocate resources and transfer teachers, then reforms can be implemented with considerable enthusiasm. If at the outset only a few teachers are interested, or student placement would be difficult, or if overall interest is lukewarm, districts and schools may wish to pursue additional planning. What Magnitude of Change Can the High School(s) Undertake? Implementation varies with the intended magnitude and scope of the SLC effort on the structure of the school and the content of the curriculum. Among the Cohort 1 schools (and in other reform efforts as well), structural changes were typically easier to implement than changes in the core curriculum. It was less difficult to reorganize teachers into teams than it was to integrate career content into core courses. In preparing to implement SLCs, districts and schools may wish to assess the magnitude of change that they can realistically undertake, and the sequencing of proposed changes as well. What Is the Time Frame for High School Reform? Schools appear to need a greater amount of time to both plan and prepare for their SLCs than they typically project. Although many Cohort 1 schools had already been involved in some degree of SLC restructuring prior to receiving their federal SLC grants, for many others this was the first opportunity to actively implement SLC structures or strategies. By the end of the third year, many SLC schools had yet to become school wide programs, even though that is the stated intention of the federal program. What Are the Supports for SLC Structures and Strategies within the School(s)? Districts and schools would be well served by inventorying the internal supports for reform. The principal’s visible commitment is needed to implement a program throughout a grade or school, and to provide the managerial and scheduling support that teachers need. Even such relatively simple strategies as block scheduling require scheduling changes for all participating students; otherwise, teachers must continue with the traditional 42- to 47-minute class period. The principal’s support is also needed to counter the inactivity of reluctant or opposing teachers, a critical concern in reforms that are designed to transform content as well as structure. Teacher buy-in is essential to any change effort; the translation and implementation of the program is in their hands. Data from our case studies indicate that schools benefit greatly from strong school leadership and staff buy-in. As with any comprehensive school reform, continuity on the part of school leadership and staff is critical to seeing the reforms carried out. To minimize principal and staff turnover, districts may wish to request staff to commit themselves to staying in the school for the grant period. Similarly, districts must agree not to transfer supportive staff elsewhere during the same time period. What Is the Support for SLC Structures and Strategies within the District? Districts and schools need to assess their own managerial relationships. Where districts and schools were in agreement on SLC goals and strategies, and where districts assisted schools in implementation rather than mandated changes, implementation was more likely to have been reported

Chapter 6: Summary of Findings and Future Directions 142
as successful. In pursuing SLCs, districts and schools need to be mindful of what they are requesting teachers and other staff to undertake, because restructuring high schools occurs on top of the regular school day. At a minimum, districts need to coordinate other district- and state-mandated reform efforts with schools’ SLC reform efforts. For school staff to become sufficiently acquainted with the new school culture under SLCs, staff need professional development opportunities specifically targeted toward the principles of school restructuring. Although the data showed that most schools offered professional development on a variety of SLC-related topics, the average amount of training SLC teachers received may have been too low to effect dramatic changes in how teachers interact with students or adapt their instruction. Finally, schools need far more direction and assistance in how to alter their instructional techniques to meet the needs of the new school structure. For example, although many schools adopted block scheduling as a means of accommodating changes in scheduling, it is unclear whether schools also used that time to provide for more individual attention, interdisciplinary lessons, and a greater variety of learning activities, which are SLC goals. Our data show that changes made in SLC schools tended to be structural or organizational rather than pedagogical or content focused. The renewed emphasis in recent grant notices from the federal SLC program directing future grantees to increase their commitment to greater academic rigor is a step in the right direction because it encourages schools to move beyond changes in school structure and organization. What Resources Are Available to the School(s) and District(s)? Prospective districts and schools need to assess the visible and less visible costs of high school reform. These costs are reflected not only in real dollar expenditures for staff time and materials but also in the hidden costs of extensive volunteer time that principals, teachers, and others devote to making substantial changes in their schools. Reform has cost implications that need to be further examined. Questions that need to be asked are what is needed to facilitate scheduling curriculum changes, to fund extra time that allows teachers to have common planning time, to provide for teacher time (and substitute teacher time) for professional development, and to support a reduced student-teacher ratio (if that is one of the school’s SLC goals). These cost questions have implications not only for schools considering restructuring, but for further research on high school restructuring in general. Implications for the SLC Program
Further Research As we noted in our Review of the Literature (Page et al., 2002), although little rigorous research has been completed to date on SLC programs, there is a renewed emphasis on research. A recent grant notice from the SLC program required that programs use “research-based strategies, services, and interventions to accelerate learning by students who enter high school with reading, language arts or mathematics skills that are below grade level.”50 It would be useful within the content of randomized controlled trials to assess the effectiveness of freshman academies. Is the reorganization of courses and staff into self-contained groups sufficient to increase promotion rates and reduce dropout rates? Is weekly common planning time sufficient for teachers to address the needs of struggling students and foster curriculum improvements? Or, do freshman academies need other program features (e.g., focused counseling for all students not only those most at risk, extended time for core subjects) to 50 Federal Register, Vol. 69, No. 50, March 15, 2004, Department of Education, Smaller Learning Communities Program.

Chapter 6: Summary of Findings and Future Directions 143
overcome the shortcomings of the traditional organization of the freshman class? Similar questions could be asked regarding other SLC structures. These efforts will aid our understanding of what makes SLCs effective for students in the long run. Next Steps for the Implementation Study
This report has summarized the major implementation findings on the first cohort of schools funded under the federal SLC program. Findings were primarily based on surveys of SLC schools on the status of implementation in these schools during the third year of operation of their SLC programs. A follow-up report coming out later this year will include survey data on a second cohort of SLC grantees, describing their SLC implementation since they started to receive funding during SY 2002–03. The findings in this follow-up report, with data on an additional 222 SLC schools, will serve to broaden the findings reported on here.

Chapter 6: Summary of Findings and Future Directions 144

References 145
References
Ancess, J. Urban Dreamcatchers: Launching and Leading New Small Schools. New York: National Center for Restructuring Education, Schools, and Teaching (NCREST). Teachers College Press, Columbia University, 1997. Barker, R.G., and Gump, P.V., eds. Big School, Small School: High School Size and Student Behavior. Palo Alto, Calif.: Stanford University Press, 1964. Bernstein, L., Millsap, M.A., and Schimmenti, J. Implementation Study of Smaller Learning Communities: Cohort 2 Follow-up Report. Cambridge, Mass.: Abt Associates, Inc., 2005. Bernstein, L., Millsap, M.A., Schimmenti, J., and Page, L. Implementation Study of Smaller Learning Communities: Final Report. Cambridge, Mass.: Abt Associates, Inc., 2005. Conant, J.B. The American High School Today. New York, N.Y.: McGraw-Hill, 1959. Cotton, K. New Small Learning Communities: Findings from Recent Literature. Portland, Oreg.: Northwest Regional Educational Laboratory, 2001. Duax, T. Attrition at a nonselective magnet elementary school: A case study of a Milwaukee public school. Journal of Research and Development in Education, 25(3): 173-81, 1992. Dynarski, M., Gleason, P., Rangarajan, A., and Wood, R. Impacts of School Restructuring Initiatives. Final Report. Princeton, N.J.: Mathematica Policy Research, Inc., 1998. Elliot, M.N., Hanser, L.M., and Gilroy, C.L. Evidence of Positive Student Outcomes in JROTC Career Academies. Washington, D.C.: National Defense Research Institute, 2000. Prepared for the Office of the Secretary of Defense. Gamoran, A. Student achievement in public magnet, public comprehensive and private city high schools. Educational Evaluation and Policy Analysis, 18(1): 1-18, 1996. Kemple, J.J. Career Academies: Communities of Support for Students and Teachers: Further Evidence from a 10-Site Evaluation: Executive Summary. New York, N.Y.: Manpower Research Development Corporation, 1997. Kemple, J.J. Career Academies: Impacts on Students’ Initial Transitions to Post-Secondary Education and Employment: Executive Summary. New York, N.Y.: Manpower Demonstration Research Corporation, 2001. Kemple, J.J., and Snipes, J.C. Career Academies: Impacts on Students' Engagement and Performance in High School. New York, N.Y.: Manpower Demonstration Research Corporation, 2000. Legters, N.E. Small Learning Communities Meet School-to-Work: Whole School Restructuring for Urban Comprehensive High Schools. Report #31. Baltimore, Md.: CRESPAR, 1999.

References 146
McMullan, B.J., and Wolf, W.C. The Philadelphia Schools Collaborative: An Assessment of Its First Three Years. Bala Cynwyd, Pa.: Center for Assessment and Policy Development, 1991. McQuillan, P.J., and Muncey, D.E. School-Within-a-School Restructuring and Faculty Divisiveness: Examples from a Study of the Coalition of Essential Schools. Working Paper #6. Providence, R.I.: Brown University, School Ethnography Project, 1991. National Center for Education Statistics. Common Core of Data, Public Elementary, Secondary School Universe Survey (2000–01). Washington, D.C.: U.S. Department of Education. Oxley, D. Theory and practice of school communities. Educational Administration Quarterly, 33 (suppl.): 624-643, 1997. Page, L., Layzer, C., Schimmenti, J., Bernstein, L., and Horst, L. National Evaluation of Smaller Learning Communities: Literature Review. (Unpublished). Cambridge, Mass.: Abt Associates, Inc., 2002. Pribesh, S., Lee, V.E., and Osuna-Currea, F. Governance in Schools-Within-Schools. (Unpublished). Paper received with authors’ permission, July 20, 2001. Raywid, M.A. Small schools: A reform that works. Educational Leadership, 55(4): 34-38, 1997. Raywid, M.A. Taking Stock: The Movement to Create Mini-Schools, Schools-Within-Schools, and Separate Small Schools. Commissioned by the Center on Organization and Restructuring of Schools, supported by the Office of Educational Research and Improvement, U.S. Department of Education, and by the Wisconsin Center for Education Research, 1996. Eric Clearinghouse on Urban Education ED396045. Ready, D.D., Lee, V.E., and LoGerfo, L.F. Social and Academic Stratification in High Schools Divided into Schools-Within-Schools. (Unpublished). Paper received with authors’ permission, 2001. U.S. Department of Education, National Center for Education Statistics, Schools and Staffing Survey, 1993–94. Wasley, P., Fine, M., Gladden, M., Holland, N.E., King, S.P., Mosak, E., and Powell, L.C. Small Schools: Great Strides: A Study of New Small Schools in Chicago. New York, N.Y.: Bank Street College of Education, 2000.

The Department of Education’s mission is to promote student achievement and preparation for global competitiveness by fostering educational excellence and ensuring equal access
www.ed.gov