implementation proposal narrative - west los … proposal page 1 april 2012 implementation proposal...
TRANSCRIPT
Implementation Proposal Page 1 April 2012
Implementation Proposal Narrative Narrative due: April 27 (draft) and May 15 (final)
Name of Institution: West Los Angeles College
Submission Date: April 27, 2012 (draft)
Achieving the Dream Funder (if applicable): LA Community College District
Grant Number (if applicable):
Name, e-mail, and telephone number of contact person regarding this proposal:
Name and Title: Clare Norris, Achieving the Dream Faculty Coordinator
Telephone: 310-287-4590
E-mail: [email protected]
BEGIN PROPOSAL NARRATIVE
A. Principles for Increasing Student Success through Institutional Improvement Briefly describe how the college will make progress on the following principles and corresponding practices.
For a description of the four principles please go to: http://www.achievingthedream.org/institutional_change/four_principles
1. Committed Leadership
The College President clearly stated that student success is a priority and initiated and chaired a number of Achieving the Dream (ATD) meetings before the faculty coordinator was identified. He established the college’s ATD framework: ATD Core and Data Team and identified ATD Faculty Leader with release time. The President and Leadership Retreat Planning Committee chairperson supported the college leadership retreat date and theme change to support the ATD Kickoff occuring at the annual Leadership Retreat.
ATD is a component of the college’s Student Success Committee, which is committee of the Academic Senate. The Academic Senate President is an active member of the Student Success Committee/Core Team.
A Los Angeles Community College District (LACCD)-funded grant has supported the college’s participation in ATD and the team’s attendance of the D.R.E.A.M. conference. The LACCD Vice Chancelor for Educational Programs and Institutional Effectiveness is applying for other grants to support the colleges’ ATD efforts. The LACCD Dean of Student Success has organized two District-wide events to gather ATD leaders from each college to share their ATD planning-year progress.
West’s Vice President of Student Services and Associate Dean of Student Services have been consistently active in the data team and in their coach visit participation. The Vice President of Academic Affairs has consulted regularly with the Core Team leadership and has attended some core team meetings.
The Dean of Teaching and Learning has been and will continue to be an active co-chair of the ATD Core team and has contributed her exptertise to the ATD newsletters and student focus group planning and
Implementation Proposal Page 2 April 2012
implementation. The Dean of General Education and Transfer has been and will continue to be an active co-chair of the Student Success Committee, attending and providing leadership at every meeting.
The Dean of Research and Planning, as co-chair of the Data Team, took an immediate leadership role even before the faculty coordinator was hired and has remained fully engaged with ATD activities.
The ASO President has been a consistent supporter of Achieving the Dream and has attended numerous meetings and functions. The teams are committed to maintain ASO participation after the election of each new executive board.
The chair of the Mathematics Division has participated in extensive dialog with the core and data team leaders and scheduled and attended a math division meeting with those leaders. The chair of the Language Arts Division has maintained unfailingly supportive of the college’s student success efforts and added an ATD discussion to the division’s last meeting agenda.
The transfer committee chair has been an active member of the core team, and the transfer committee goals are aligned with the college’s ATD intervention strategies ensuring that committee’s participation in the implementation of the strategies.
2. Use of Evidence to Improve Policies, Programs, and Services
The college teams have been and will continue to use a mixed method approach to evaluating information: quantitative data and qualitative data (focus groups, Fishbone cause-and-effect analysis, surveys) – to understand student opinion. The teams will compile, summarize, and share the data from the six focus groups that have already been conducted. That data will then be available for other entities on campus to use for decision-making. The teams will also continue to conduct focus groups to gather more data.
Recently completed Accreditation Process included a commendation for the college’s institutional efforts to address equity gaps in student achievement through such programs as Umoja and Puente, and participation in ATD.
Data has been widely distributed on student equity issues and performance on math and English courses; that information is becoming more widely available.
ATD Core Team and Data Team members interviewed staff and faculty to discuss priorities and potential strategies and are preparing to conduct a College Culture survey among the college faculty and staff members to inform professional development activities.
3. Broad Engagement
The Core Team has identified the following six engagement strategies for the college to implement as part of the process of addressing the college priorities.
1. Make sure ATD is a standing agenda item in all related meetings including division and council meetings.
2. Conduct faculty-student dialogues.
3. Develop and distribute a monthly ATD newsletter.
4. Plan and organize professional development activities.
5. Create a structure for team members to talk with faculty and staff members one-on-one about ATD especially those who missed the ATD kickoff at the Leadership Retreat.
6. Break down data by divisions and share at division meetings.
The team has already begun to implement these strategies and will continue in that process.
The teams are also are preparing to conduct a College Culture survey among the college faculty and staff members to inform professional development activities.
Finally, the team plans to identify leaders from different college areas to lead certain components of the intervention strategies.
Implementation Proposal Page 3 April 2012
4. Systemic Institutional Improvement
Achieving the Dream is housed in the college’s Student Success Committee, a permanent committee of the Academic Senate, which assures continuance of this effort of systemic improvement even after the ATD term has ended.
The college plans (Educational Master Plan, Student Services Plan, Foundation Skills Plan, Technology Plan) have been used to inform the selection of ATD priotiries and intervention strategies to ensure college alignment with ATD efforts and the continuation of long-term, systemic institutional improvement.
In addition, college goals on its master plans and annual plans will be specified in measurable terms so that the degree to which they are achieved can be assessed, discussed, and applied to decisions regarding the improvement of institutional effectiveness.
B. Data Analysis, Results, and Resulting Priorities Achieving the Dream Colleges begin their journey by:
• establishing core and data teams; • analyzing longitudinal cohort data disaggregated by race/ethnicity, gender, age, and other
characteristics relevant to the college; • engaging stakeholders in problem-solving activities; and • using all the information collected to set at least two but not more than four “priorities” for action.
Note: In this context, “priority” means a desired result. Priorities emerge as you identify causes of low student success and define targets for maximizing student success efforts. Priorities should be measurable. Examples include:
• Increasing the percent of new students successfully completing their developmental sequence; • Decreasing the average number of developmental classes incoming students test into; • Increasing matriculation from developmental English to college level English; • Improving the term to term retention rate of students; and • Closing the achievement gaps among Latino, African American, and Caucasian students in
developmental and college level math.
Complete a table for each priority using the chart provided. Priorities can be combined if the data and stakeholders overlap significantly.
Briefly describe the following:
1. Quantitative Data Analyzed:
The Office of Research and Planning in conjunction with the data team examined college persistence, retention, graduation, outcome measures. The college Office of Research and Planning in conjunction with the Data Team generated reports based on equity using the five ATD Student success indicators: Demographics, Who Are West's Students?, Enrollment Sources, Student Success Metrics, Data Template for Achieving the Dream: Developmental & Gateway Courses, Degrees and Certificates, Student Survey-Fall 2009, ATD Readiness Assessment
2. Qualitative Data Analyzed:
The office of research and planning in conjunction with the data team and core team reviewed the Fall 2009 Student Survey, 6 Student Focus Groups, Colleague Feedback, ATD Readiness Assessment, Service Level Outcomes surveys; cause-and-effect Fishbone Diagrams completed at the 2011 Leadership retreat and at a March 2012 Language Arts Division meeting; 2011
Implementation Proposal Page 4 April 2012
Campus Climate Survey; Chronicle Great Colleges to Work For – 2009; College Plans; Fall 2011 Learning Skills and Tutor Program Student Satisfaction Survey; and the Policy and Procedure Analysis conducted among core team members and members of the College Council.
3. Major Findings of Data Analysis:
The ATD Data Team identified the following nine problem areas:
1. West’s math foundation (basic skills) students have low successful course completion rates.
2. West’s English foundation (basic skills) students have low successful course completion rates.
3. West has statistically the lowest enrollment of full-time students in the District.
4. 60% of West students complete at least 30 units in 6 years.
5. 57% of West students persist from fall to fall.
6. 40% of West students obtain a degree/certificate/transfer within 6 years.
7. A majority of West students are high school graduates and identify English as their primary language, but only 23% assess in college-level English and 2% in college-level math.
8. African American students have lower success rates in math and English.
9. West has a large percentage of adjunct faculty.
4. Stakeholders Engaged in Priority-Setting:
ATD Core and Data Teams, Student Success Committee, Academic Senate, English faculty, Math faculty, Student Services, District Student Success Initiative Steering Committee, Divisional Council, College Council, ASO, Learning Skills faculty/staff
5. Other Information Regarding the Decision-Making Process:
The data team conducted a fishbone causal analysis activity with a group of faculty members, staff members, and students at the college leadership retreat and Achieving the Dream kickoff event. Team leaders conducted a policy and procedure analysis with a broad group of campus community members during a coach visit. Core and data team leaders engaged in dialog with and met with math and language arts faculty members to get their feedback on potential priorities and intervention strategies. After months of review and discussion, the Academic Senate approved the college’s three priorities.
6. Resulting Priority:
Successful completion of the English sequence from English 21 through English 101 for West students
Increasing by 3% (low) - 6% (high) (from 19% to 22%-25%) within three years (Basic Skills Progress Tracker: Data Mart California Community Colleges Chancellor's Office, Fall 2006-Spring 2009 Baseline).
Equity indicator - achieving equity in student completion of the English sequence across racial, ethnic, and income groups
These indicators include the rates at which students: 1) successfully complete remedial or developmental instruction and advance to credit-bearing courses; 2) enroll in and successfully complete the initial college-level or gatekeeper courses in subjects such as math and English; 3) complete the courses they take with a grade of C or better; 4) persistence from one term to the next
Implementation Proposal Page 5 April 2012
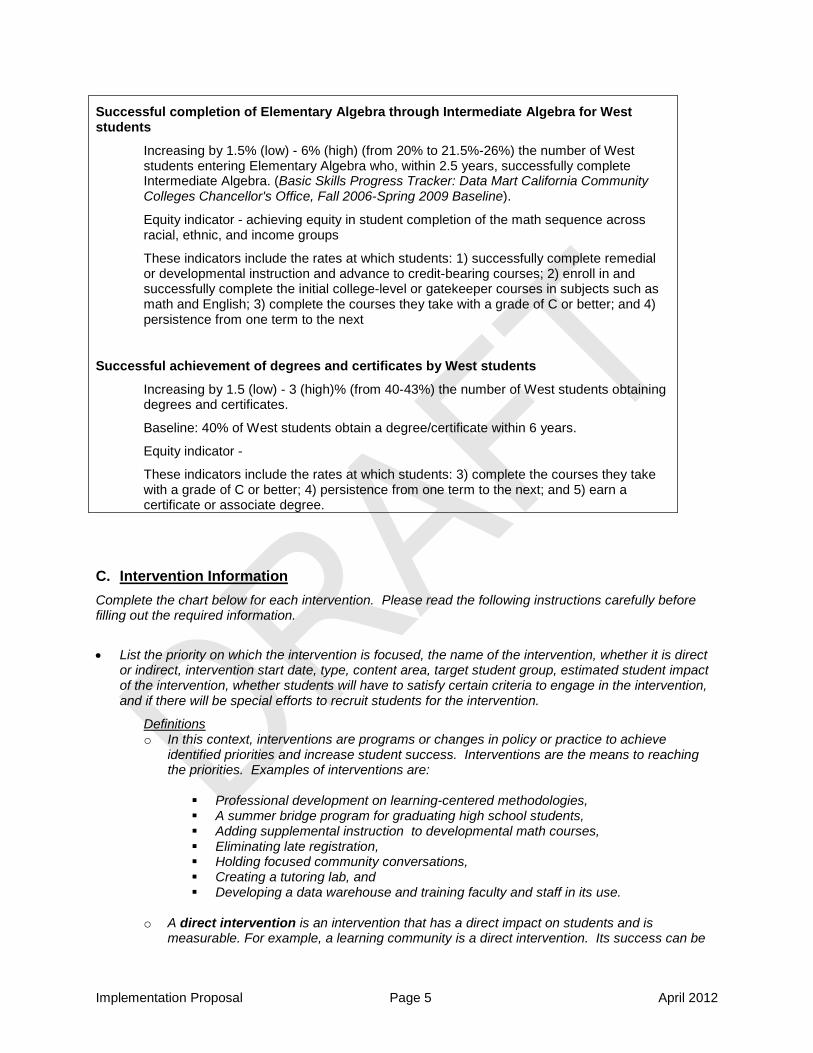
Successful completion of Elementary Algebra through Intermediate Algebra for West students
Increasing by 1.5% (low) - 6% (high) (from 20% to 21.5%-26%) the number of West students entering Elementary Algebra who, within 2.5 years, successfully complete Intermediate Algebra. (Basic Skills Progress Tracker: Data Mart California Community Colleges Chancellor's Office, Fall 2006-Spring 2009 Baseline).
Equity indicator - achieving equity in student completion of the math sequence across racial, ethnic, and income groups
These indicators include the rates at which students: 1) successfully complete remedial or developmental instruction and advance to credit-bearing courses; 2) enroll in and successfully complete the initial college-level or gatekeeper courses in subjects such as math and English; 3) complete the courses they take with a grade of C or better; and 4) persistence from one term to the next
Successful achievement of degrees and certificates by West students
Increasing by 1.5 (low) - 3 (high)% (from 40-43%) the number of West students obtaining degrees and certificates.
Baseline: 40% of West students obtain a degree/certificate within 6 years.
Equity indicator -
These indicators include the rates at which students: 3) complete the courses they take with a grade of C or better; 4) persistence from one term to the next; and 5) earn a certificate or associate degree.
C. Intervention Information Complete the chart below for each intervention. Please read the following instructions carefully before filling out the required information.
• List the priority on which the intervention is focused, the name of the intervention, whether it is direct
or indirect, intervention start date, type, content area, target student group, estimated student impact of the intervention, whether students will have to satisfy certain criteria to engage in the intervention, and if there will be special efforts to recruit students for the intervention.
Definitions o In this context, interventions are programs or changes in policy or practice to achieve
identified priorities and increase student success. Interventions are the means to reaching the priorities. Examples of interventions are:
Professional development on learning-centered methodologies, A summer bridge program for graduating high school students, Adding supplemental instruction to developmental math courses, Eliminating late registration, Holding focused community conversations, Creating a tutoring lab, and Developing a data warehouse and training faculty and staff in its use.
o A direct intervention is an intervention that has a direct impact on students and is
measurable. For example, a learning community is a direct intervention. Its success can be

Implementation Proposal Page 6 April 2012
measured by analyzing the performance and retention data of students in the learning community.
o An indirect intervention supports student success improvements that cannot be attributed to the intervention alone. For example, improving a college’s institutional research capacity is an indirect intervention that could improve institutional effectiveness. However, it would be difficult to associate an increase in student success with the implementation of such an intervention.
(Note: Asterisks indicate fields that are not required for indirect interventions.)
Briefly describe each of the following:
• The intervention and how it will help close achievement gaps. (For the purpose of this question,
an achievement gap is a disparity in outcomes among student subgroups. Subgroups may be defined by a variety of characteristics, including race/ethnicity, gender, enrollment status, Pell grant eligibility, or other characteristics pertinent to your student population.)
• Annual measurable goals for the intervention and how you plan to evaluate your efforts to
determine if you meet those goals.
• The plan to take the intervention to scale should it prove effective in increasing student success • A sustainability/institutionalization plan and a communications plan for each intervention
• Institutional policies that will need to be changed for the intervention to be successful and any challenges you foresee in implementing and institutionalizing the intervention
• Resources needed for the intervention over the course of four years. This list will serve as a
budget narrative and should correspond with the budget submitted in the Excel file.
Implementation Proposal Page 7 April 2012
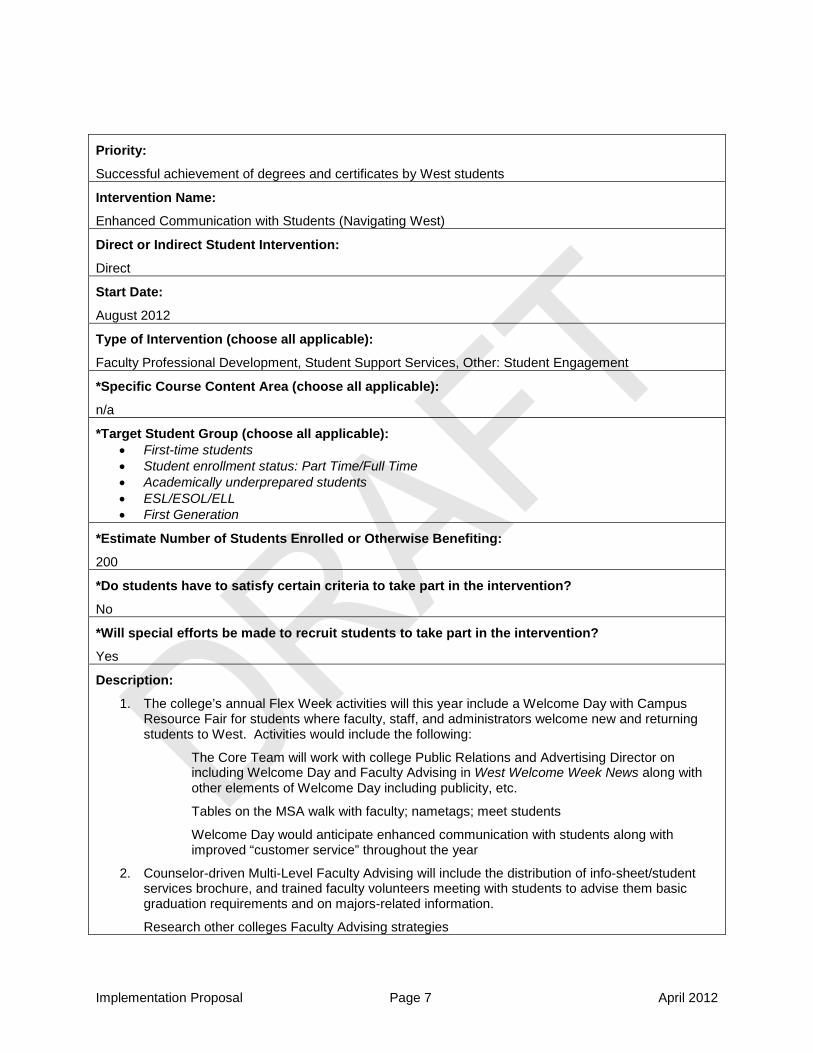
Priority:
Successful achievement of degrees and certificates by West students
Intervention Name:
Enhanced Communication with Students (Navigating West)
Direct or Indirect Student Intervention:
Direct
Start Date:
August 2012
Type of Intervention (choose all applicable):
Faculty Professional Development, Student Support Services, Other: Student Engagement
*Specific Course Content Area (choose all applicable):
n/a
*Target Student Group (choose all applicable): • First-time students • Student enrollment status: Part Time/Full Time • Academically underprepared students • ESL/ESOL/ELL • First Generation
*Estimate Number of Students Enrolled or Otherwise Benefiting:
200
*Do students have to satisfy certain criteria to take part in the intervention?
No
*Will special efforts be made to recruit students to take part in the intervention?
Yes
Description:
1. The college’s annual Flex Week activities will this year include a Welcome Day with Campus Resource Fair for students where faculty, staff, and administrators welcome new and returning students to West. Activities would include the following:
The Core Team will work with college Public Relations and Advertising Director on including Welcome Day and Faculty Advising in West Welcome Week News along with other elements of Welcome Day including publicity, etc.
Tables on the MSA walk with faculty; nametags; meet students
Welcome Day would anticipate enhanced communication with students along with improved “customer service” throughout the year
2. Counselor-driven Multi-Level Faculty Advising will include the distribution of info-sheet/student services brochure, and trained faculty volunteers meeting with students to advise them basic graduation requirements and on majors-related information.
Research other colleges Faculty Advising strategies
Implementation Proposal Page 8 April 2012
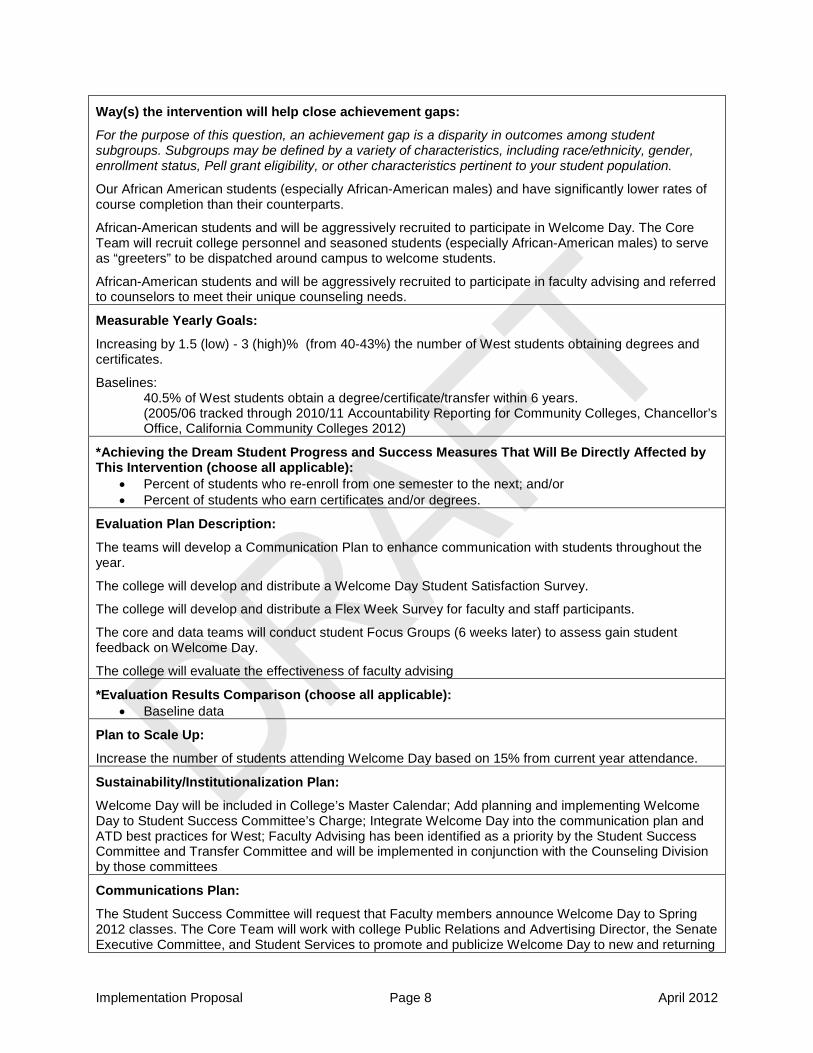
Way(s) the intervention will help close achievement gaps:
For the purpose of this question, an achievement gap is a disparity in outcomes among student subgroups. Subgroups may be defined by a variety of characteristics, including race/ethnicity, gender, enrollment status, Pell grant eligibility, or other characteristics pertinent to your student population.
Our African American students (especially African-American males) and have significantly lower rates of course completion than their counterparts.
African-American students and will be aggressively recruited to participate in Welcome Day. The Core Team will recruit college personnel and seasoned students (especially African-American males) to serve as “greeters” to be dispatched around campus to welcome students.
African-American students and will be aggressively recruited to participate in faculty advising and referred to counselors to meet their unique counseling needs.
Measurable Yearly Goals:
Increasing by 1.5 (low) - 3 (high)% (from 40-43%) the number of West students obtaining degrees and certificates.
Baselines: 40.5% of West students obtain a degree/certificate/transfer within 6 years.
(2005/06 tracked through 2010/11 Accountability Reporting for Community Colleges, Chancellor’s Office, California Community Colleges 2012)
*Achieving the Dream Student Progress and Success Measures That Will Be Directly Affected by This Intervention (choose all applicable):
• Percent of students who re-enroll from one semester to the next; and/or • Percent of students who earn certificates and/or degrees.
Evaluation Plan Description:
The teams will develop a Communication Plan to enhance communication with students throughout the year.
The college will develop and distribute a Welcome Day Student Satisfaction Survey.
The college will develop and distribute a Flex Week Survey for faculty and staff participants.
The core and data teams will conduct student Focus Groups (6 weeks later) to assess gain student feedback on Welcome Day.
The college will evaluate the effectiveness of faculty advising
*Evaluation Results Comparison (choose all applicable): • Baseline data
Plan to Scale Up:
Increase the number of students attending Welcome Day based on 15% from current year attendance.
Sustainability/Institutionalization Plan:
Welcome Day will be included in College’s Master Calendar; Add planning and implementing Welcome Day to Student Success Committee’s Charge; Integrate Welcome Day into the communication plan and ATD best practices for West; Faculty Advising has been identified as a priority by the Student Success Committee and Transfer Committee and will be implemented in conjunction with the Counseling Division by those committees
Communications Plan:
The Student Success Committee will request that Faculty members announce Welcome Day to Spring 2012 classes. The Core Team will work with college Public Relations and Advertising Director, the Senate Executive Committee, and Student Services to promote and publicize Welcome Day to new and returning
Implementation Proposal Page 9 April 2012
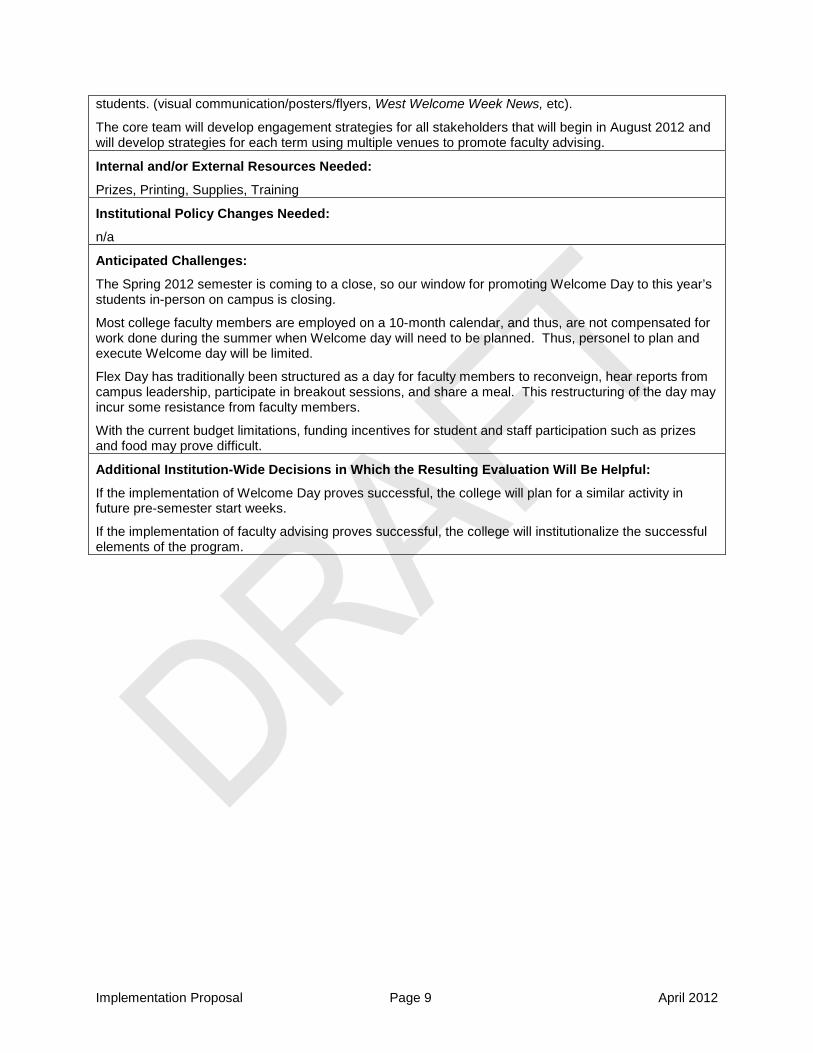
students. (visual communication/posters/flyers, West Welcome Week News, etc).
The core team will develop engagement strategies for all stakeholders that will begin in August 2012 and will develop strategies for each term using multiple venues to promote faculty advising.
Internal and/or External Resources Needed:
Prizes, Printing, Supplies, Training
Institutional Policy Changes Needed:
n/a
Anticipated Challenges:
The Spring 2012 semester is coming to a close, so our window for promoting Welcome Day to this year’s students in-person on campus is closing.
Most college faculty members are employed on a 10-month calendar, and thus, are not compensated for work done during the summer when Welcome day will need to be planned. Thus, personel to plan and execute Welcome day will be limited.
Flex Day has traditionally been structured as a day for faculty members to reconveign, hear reports from campus leadership, participate in breakout sessions, and share a meal. This restructuring of the day may incur some resistance from faculty members.
With the current budget limitations, funding incentives for student and staff participation such as prizes and food may prove difficult.
Additional Institution-Wide Decisions in Which the Resulting Evaluation Will Be Helpful:
If the implementation of Welcome Day proves successful, the college will plan for a similar activity in future pre-semester start weeks.
If the implementation of faculty advising proves successful, the college will institutionalize the successful elements of the program.
Implementation Proposal Page 10 April 2012
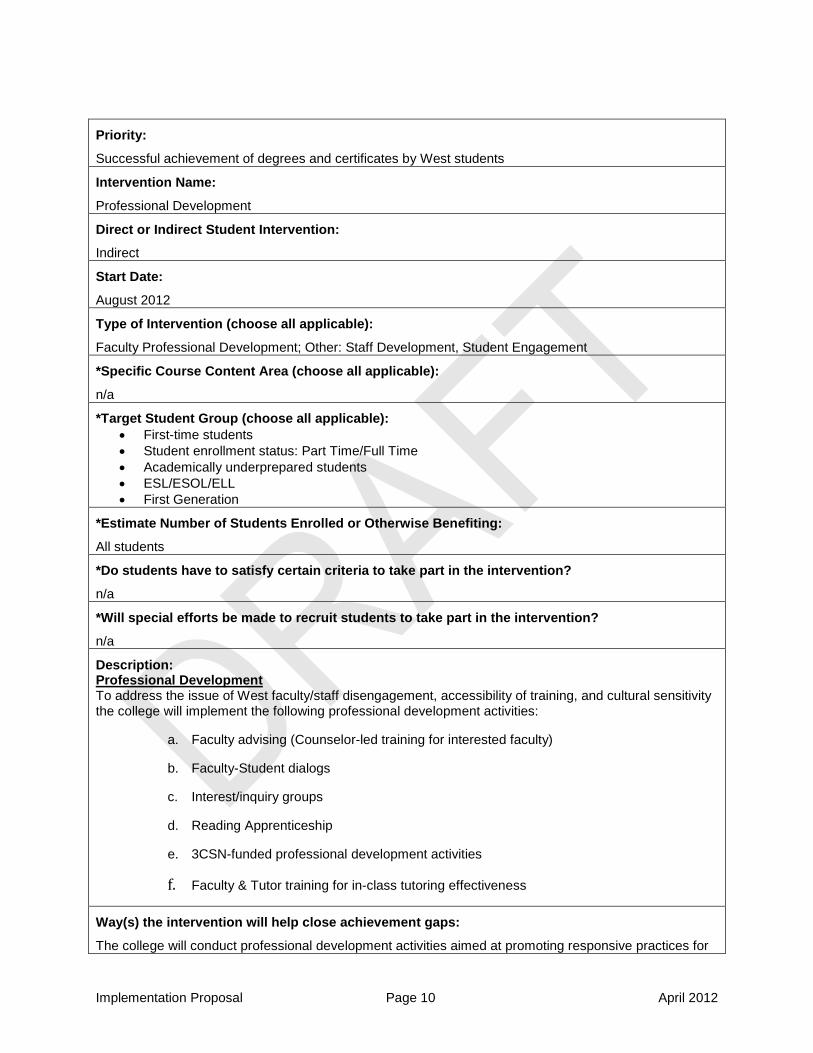
Priority:
Successful achievement of degrees and certificates by West students
Intervention Name:
Professional Development
Direct or Indirect Student Intervention:
Indirect
Start Date:
August 2012
Type of Intervention (choose all applicable):
Faculty Professional Development; Other: Staff Development, Student Engagement
*Specific Course Content Area (choose all applicable):
n/a
*Target Student Group (choose all applicable): • First-time students • Student enrollment status: Part Time/Full Time • Academically underprepared students • ESL/ESOL/ELL • First Generation
*Estimate Number of Students Enrolled or Otherwise Benefiting:
All students
*Do students have to satisfy certain criteria to take part in the intervention?
n/a
*Will special efforts be made to recruit students to take part in the intervention?
n/a
Description: Professional Development To address the issue of West faculty/staff disengagement, accessibility of training, and cultural sensitivity the college will implement the following professional development activities:
a. Faculty advising (Counselor-led training for interested faculty)
b. Faculty-Student dialogs
c. Interest/inquiry groups
d. Reading Apprenticeship
e. 3CSN-funded professional development activities
f. Faculty & Tutor training for in-class tutoring effectiveness
Way(s) the intervention will help close achievement gaps:
The college will conduct professional development activities aimed at promoting responsive practices for
Implementation Proposal Page 11 April 2012
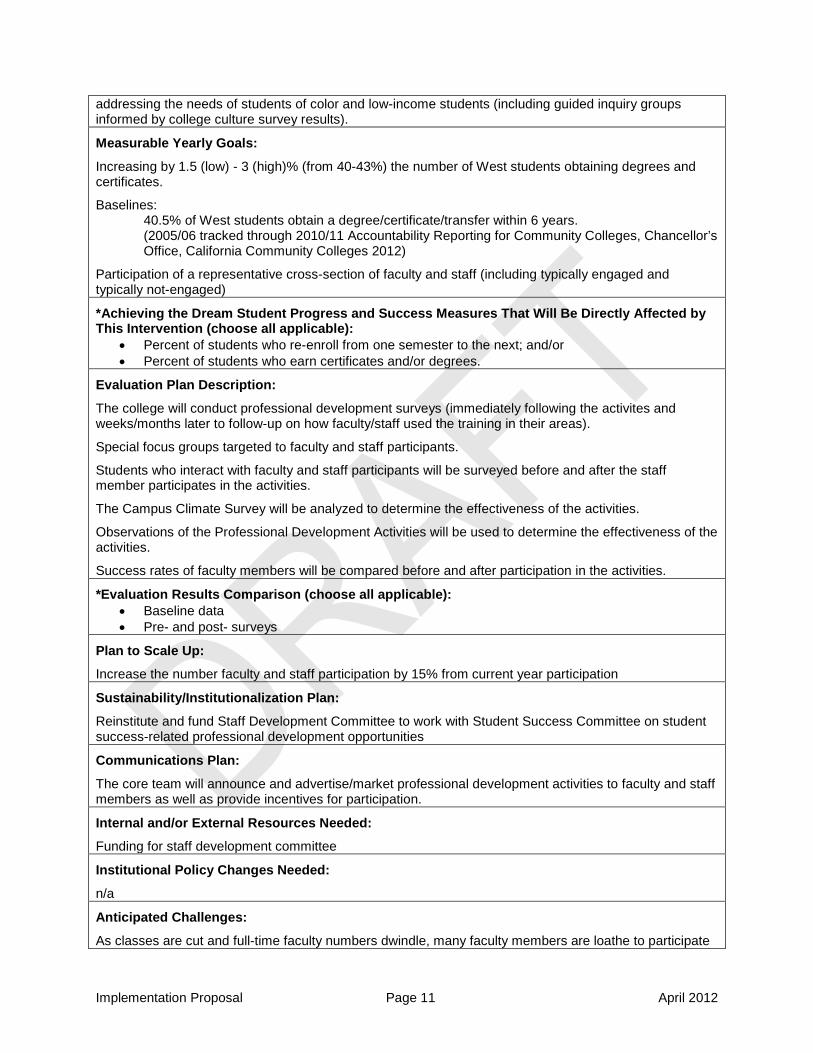
addressing the needs of students of color and low-income students (including guided inquiry groups informed by college culture survey results).
Measurable Yearly Goals:
Increasing by 1.5 (low) - 3 (high)% (from 40-43%) the number of West students obtaining degrees and certificates.
Baselines: 40.5% of West students obtain a degree/certificate/transfer within 6 years. (2005/06 tracked through 2010/11 Accountability Reporting for Community Colleges, Chancellor’s Office, California Community Colleges 2012)
Participation of a representative cross-section of faculty and staff (including typically engaged and typically not-engaged)
*Achieving the Dream Student Progress and Success Measures That Will Be Directly Affected by This Intervention (choose all applicable):
• Percent of students who re-enroll from one semester to the next; and/or • Percent of students who earn certificates and/or degrees.
Evaluation Plan Description:
The college will conduct professional development surveys (immediately following the activites and weeks/months later to follow-up on how faculty/staff used the training in their areas).
Special focus groups targeted to faculty and staff participants.
Students who interact with faculty and staff participants will be surveyed before and after the staff member participates in the activities.
The Campus Climate Survey will be analyzed to determine the effectiveness of the activities.
Observations of the Professional Development Activities will be used to determine the effectiveness of the activities.
Success rates of faculty members will be compared before and after participation in the activities.
*Evaluation Results Comparison (choose all applicable): • Baseline data • Pre- and post- surveys
Plan to Scale Up:
Increase the number faculty and staff participation by 15% from current year participation
Sustainability/Institutionalization Plan:
Reinstitute and fund Staff Development Committee to work with Student Success Committee on student success-related professional development opportunities
Communications Plan:
The core team will announce and advertise/market professional development activities to faculty and staff members as well as provide incentives for participation.
Internal and/or External Resources Needed:
Funding for staff development committee
Institutional Policy Changes Needed:
n/a
Anticipated Challenges:
As classes are cut and full-time faculty numbers dwindle, many faculty members are loathe to participate

Implementation Proposal Page 12 April 2012
in yet-another activity. Although in many surveys conducted on campus, faculty members request more professional development activities, demands on faculty members’ time continue to increase. Thus, many full time faculty members find themselves too busy to participate in events they may be interested in even those funded by outside sources. With the current budget limitations, funding incentives for faculty and staff participation such as stipends and food will prove difficult.
Additional Institution-Wide Decisions in Which the Resulting Evaluation Will Be Helpful:
If the implementation of enhanced professional development proves successful, the college will institutionalize the successful elements of the program.
Priority:
Successful completion of the English sequence from English 21 through English 101 for West students
Successful completion of Elementary Algebra through Intermediate Algebra for West students
Intervention Name:
Enhanced Tutoring Program
Direct or Indirect Student Intervention:
Direct
Start Date:
August 2012
Type of Intervention (choose all applicable):
Developmental Education, Supplemental Instruction, Tutoring
*Specific Course Content Area (choose all applicable):
Math and English
*Target Student Group (choose all applicable): • First-time students • Student enrollment status: Part Time/Full Time • Academically underprepared students • ESL/ESOL/ELL • First Generation • Developmental Math and English students
*Estimate Number of Students Enrolled or Otherwise Benefiting:
All English 21 students (Fall 2012: 7 sections x 40 students) = 280
All Math 115 and 117 students (Fall 2012: 13 sections x 60 students) = 780
*Do students have to satisfy certain criteria to take part in the intervention?
Be enrolled in English 21 or Math 115 or Math 117
*Will special efforts be made to recruit students to take part in the intervention?
Yes
Description: The college will establish a Tutoring Redesign Team to Facilitate the Following:
Recruit English and math faculty to collaborate with Learning Center faculty and staff on Learning Center tutor training and tutor training handbook
Implementation Proposal Page 13 April 2012
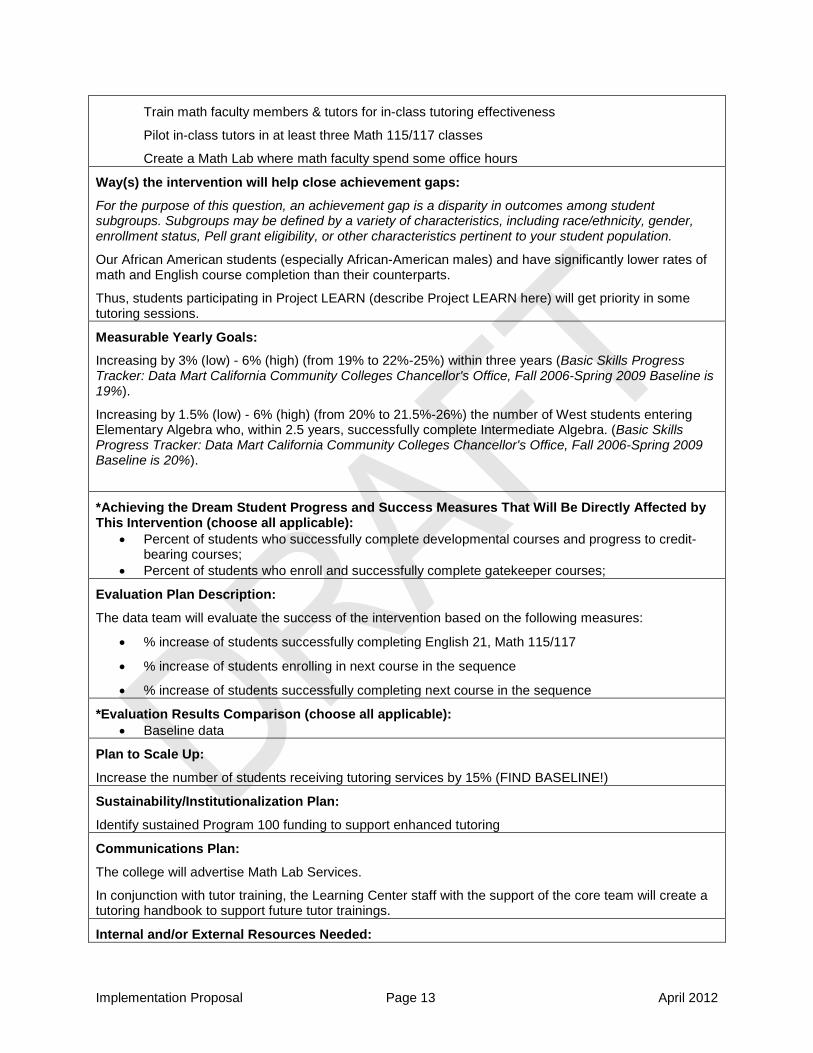
Train math faculty members & tutors for in-class tutoring effectiveness
Pilot in-class tutors in at least three Math 115/117 classes
Create a Math Lab where math faculty spend some office hours
Way(s) the intervention will help close achievement gaps:
For the purpose of this question, an achievement gap is a disparity in outcomes among student subgroups. Subgroups may be defined by a variety of characteristics, including race/ethnicity, gender, enrollment status, Pell grant eligibility, or other characteristics pertinent to your student population.
Our African American students (especially African-American males) and have significantly lower rates of math and English course completion than their counterparts.
Thus, students participating in Project LEARN (describe Project LEARN here) will get priority in some tutoring sessions.
Measurable Yearly Goals:
Increasing by 3% (low) - 6% (high) (from 19% to 22%-25%) within three years (Basic Skills Progress Tracker: Data Mart California Community Colleges Chancellor's Office, Fall 2006-Spring 2009 Baseline is 19%).
Increasing by 1.5% (low) - 6% (high) (from 20% to 21.5%-26%) the number of West students entering Elementary Algebra who, within 2.5 years, successfully complete Intermediate Algebra. (Basic Skills Progress Tracker: Data Mart California Community Colleges Chancellor's Office, Fall 2006-Spring 2009 Baseline is 20%).
*Achieving the Dream Student Progress and Success Measures That Will Be Directly Affected by This Intervention (choose all applicable):
• Percent of students who successfully complete developmental courses and progress to credit-bearing courses;
• Percent of students who enroll and successfully complete gatekeeper courses;
Evaluation Plan Description:
The data team will evaluate the success of the intervention based on the following measures:
• % increase of students successfully completing English 21, Math 115/117
• % increase of students enrolling in next course in the sequence
• % increase of students successfully completing next course in the sequence
*Evaluation Results Comparison (choose all applicable): • Baseline data
Plan to Scale Up:
Increase the number of students receiving tutoring services by 15% (FIND BASELINE!)
Sustainability/Institutionalization Plan:
Identify sustained Program 100 funding to support enhanced tutoring
Communications Plan:
The college will advertise Math Lab Services.
In conjunction with tutor training, the Learning Center staff with the support of the core team will create a tutoring handbook to support future tutor trainings.
Internal and/or External Resources Needed:
Implementation Proposal Page 14 April 2012
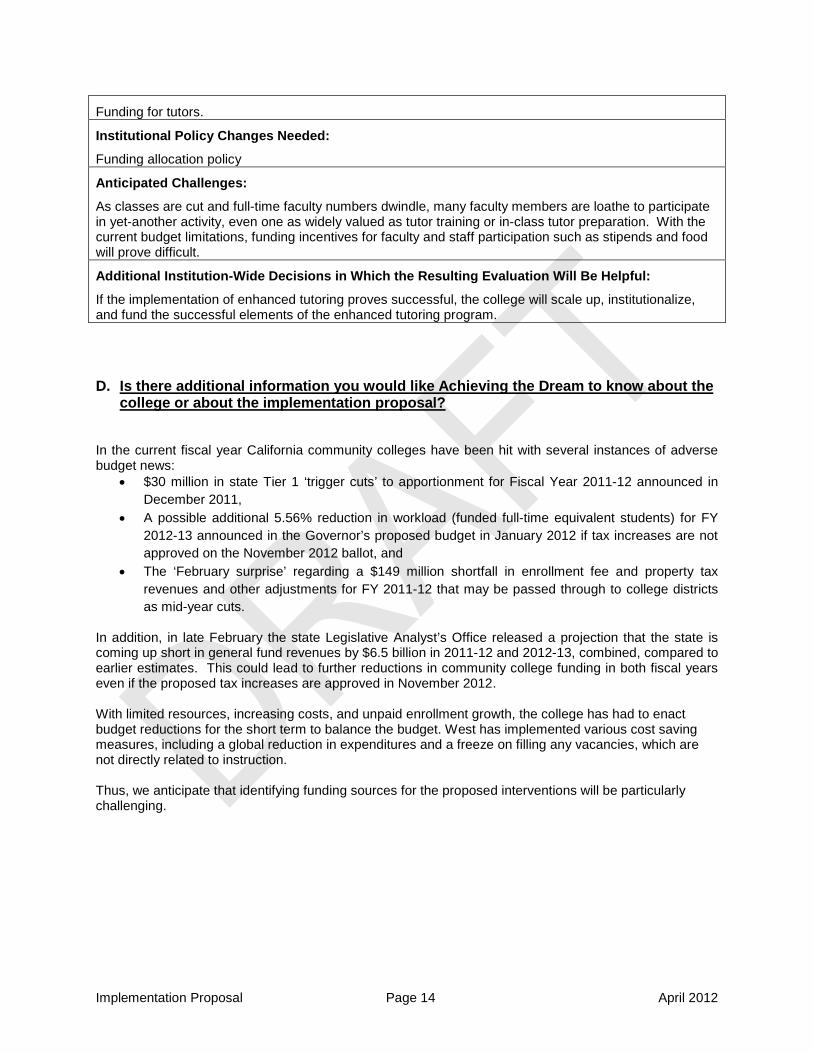
Funding for tutors.
Institutional Policy Changes Needed:
Funding allocation policy
Anticipated Challenges:
As classes are cut and full-time faculty numbers dwindle, many faculty members are loathe to participate in yet-another activity, even one as widely valued as tutor training or in-class tutor preparation. With the current budget limitations, funding incentives for faculty and staff participation such as stipends and food will prove difficult.
Additional Institution-Wide Decisions in Which the Resulting Evaluation Will Be Helpful:
If the implementation of enhanced tutoring proves successful, the college will scale up, institutionalize, and fund the successful elements of the enhanced tutoring program.
D. Is there additional information you would like Achieving the Dream to know about the college or about the implementation proposal?
In the current fiscal year California community colleges have been hit with several instances of adverse budget news:
• $30 million in state Tier 1 ‘trigger cuts’ to apportionment for Fiscal Year 2011-12 announced in December 2011,
• A possible additional 5.56% reduction in workload (funded full-time equivalent students) for FY 2012-13 announced in the Governor’s proposed budget in January 2012 if tax increases are not approved on the November 2012 ballot, and
• The ‘February surprise’ regarding a $149 million shortfall in enrollment fee and property tax revenues and other adjustments for FY 2011-12 that may be passed through to college districts as mid-year cuts.
In addition, in late February the state Legislative Analyst’s Office released a projection that the state is coming up short in general fund revenues by $6.5 billion in 2011-12 and 2012-13, combined, compared to earlier estimates. This could lead to further reductions in community college funding in both fiscal years even if the proposed tax increases are approved in November 2012. With limited resources, increasing costs, and unpaid enrollment growth, the college has had to enact budget reductions for the short term to balance the budget. West has implemented various cost saving measures, including a global reduction in expenditures and a freeze on filling any vacancies, which are not directly related to instruction. Thus, we anticipate that identifying funding sources for the proposed interventions will be particularly challenging.
Implementation Proposal Page 15 April 2012
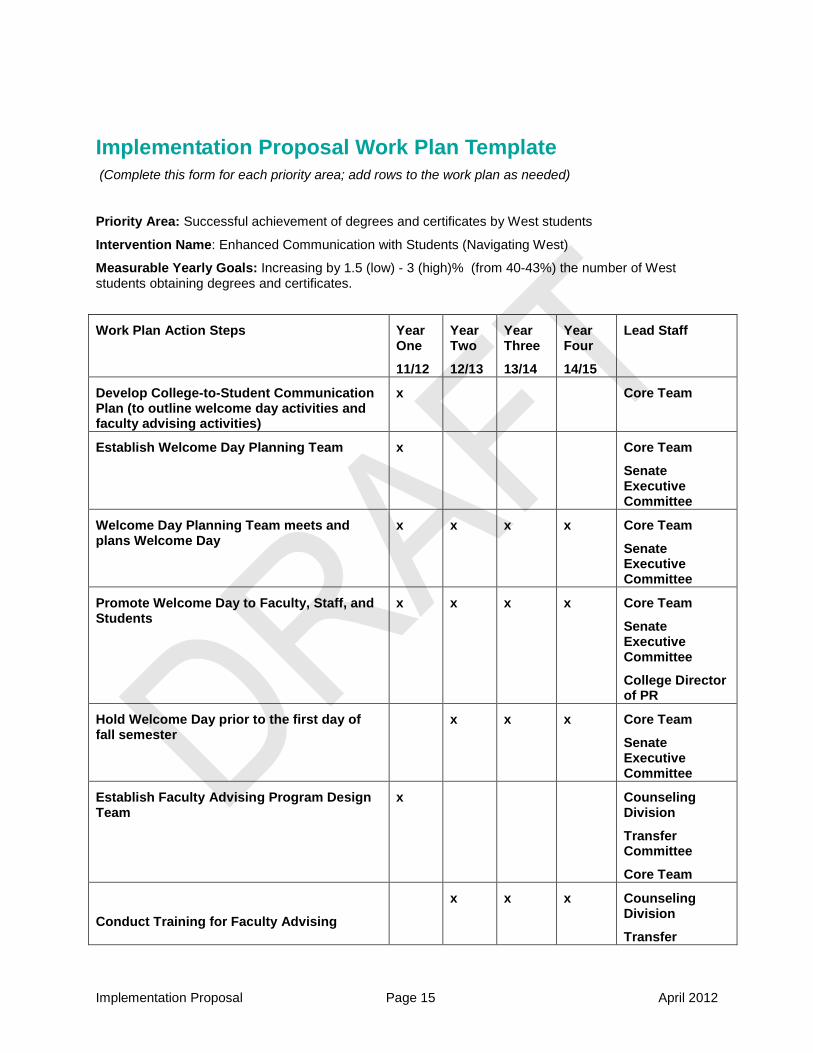
Implementation Proposal Work Plan Template (Complete this form for each priority area; add rows to the work plan as needed)
Priority Area: Successful achievement of degrees and certificates by West students
Intervention Name: Enhanced Communication with Students (Navigating West)
Measurable Yearly Goals: Increasing by 1.5 (low) - 3 (high)% (from 40-43%) the number of West students obtaining degrees and certificates.
Work Plan Action Steps Year One
11/12
Year Two
12/13
Year Three
13/14
Year Four
14/15
Lead Staff
Develop College-to-Student Communication Plan (to outline welcome day activities and faculty advising activities)
x Core Team
Establish Welcome Day Planning Team
x Core Team
Senate Executive Committee
Welcome Day Planning Team meets and plans Welcome Day
x x x x Core Team
Senate Executive Committee
Promote Welcome Day to Faculty, Staff, and Students
x x x x Core Team
Senate Executive Committee
College Director of PR
Hold Welcome Day prior to the first day of fall semester
x x x Core Team
Senate Executive Committee
Establish Faculty Advising Program Design Team
x Counseling Division
Transfer Committee
Core Team
Conduct Training for Faculty Advising
x x x Counseling Division
Transfer

Implementation Proposal Page 16 April 2012
Committee
Core Team
Evaluate activities to enhance communication with students
x x x Core Team
Data Team
Implementation Proposal Page 17 April 2012
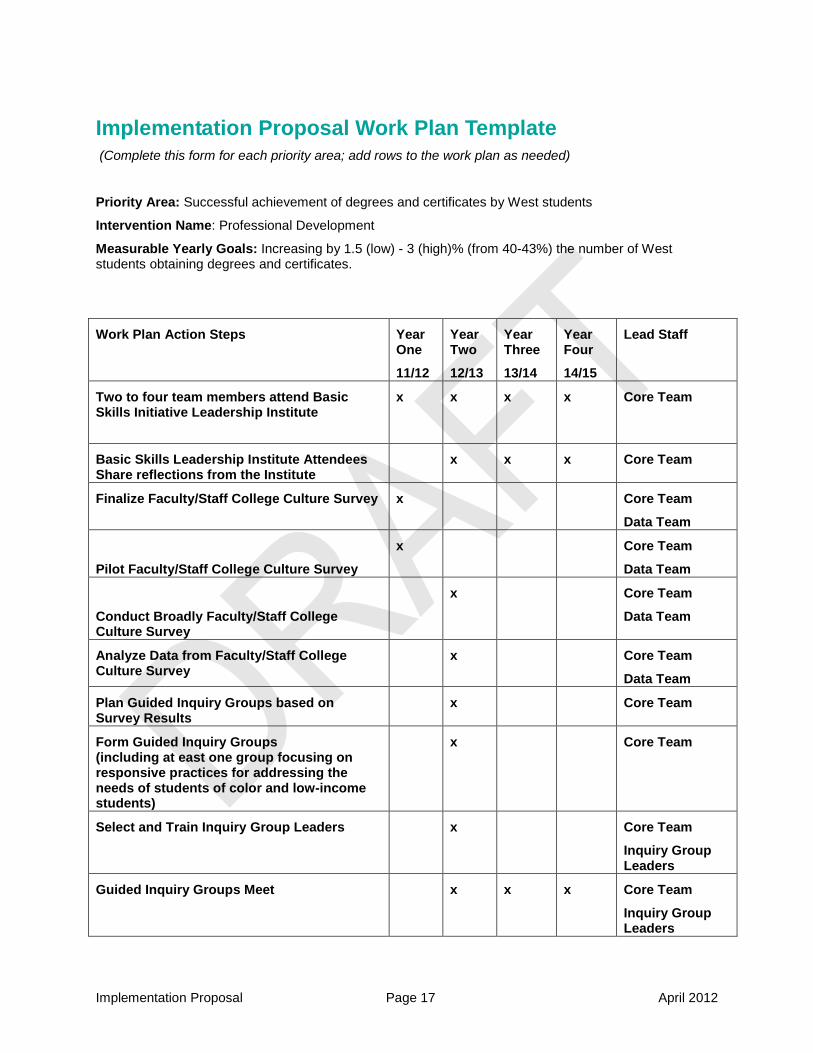
Implementation Proposal Work Plan Template (Complete this form for each priority area; add rows to the work plan as needed)
Priority Area: Successful achievement of degrees and certificates by West students
Intervention Name: Professional Development
Measurable Yearly Goals: Increasing by 1.5 (low) - 3 (high)% (from 40-43%) the number of West students obtaining degrees and certificates.
Work Plan Action Steps Year One
11/12
Year Two
12/13
Year Three
13/14
Year Four
14/15
Lead Staff
Two to four team members attend Basic Skills Initiative Leadership Institute
x x x x Core Team
Basic Skills Leadership Institute Attendees Share reflections from the Institute
x x x Core Team
Finalize Faculty/Staff College Culture Survey
x Core Team
Data Team
Pilot Faculty/Staff College Culture Survey
x Core Team
Data Team
Conduct Broadly Faculty/Staff College Culture Survey
x Core Team
Data Team
Analyze Data from Faculty/Staff College Culture Survey
x Core Team
Data Team
Plan Guided Inquiry Groups based on Survey Results
x Core Team
Form Guided Inquiry Groups (including at east one group focusing on responsive practices for addressing the needs of students of color and low-income students)
x Core Team
Select and Train Inquiry Group Leaders x Core Team
Inquiry Group Leaders
Guided Inquiry Groups Meet x x x Core Team
Inquiry Group Leaders
Implementation Proposal Page 18 April 2012
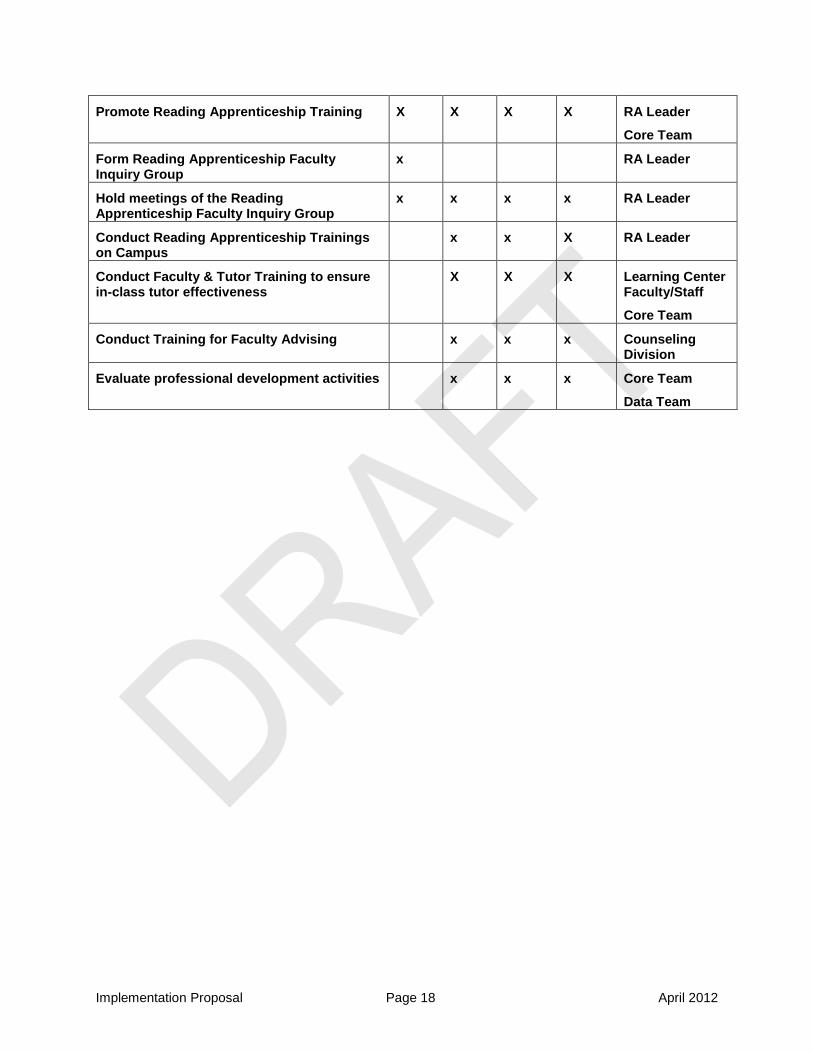
Promote Reading Apprenticeship Training X X X X RA Leader
Core Team
Form Reading Apprenticeship Faculty Inquiry Group
x RA Leader
Hold meetings of the Reading Apprenticeship Faculty Inquiry Group
x x x x RA Leader
Conduct Reading Apprenticeship Trainings on Campus
x x X RA Leader
Conduct Faculty & Tutor Training to ensure in-class tutor effectiveness
X X X Learning Center Faculty/Staff
Core Team
Conduct Training for Faculty Advising x x x Counseling Division
Evaluate professional development activities x x x Core Team
Data Team
Implementation Proposal Page 19 April 2012
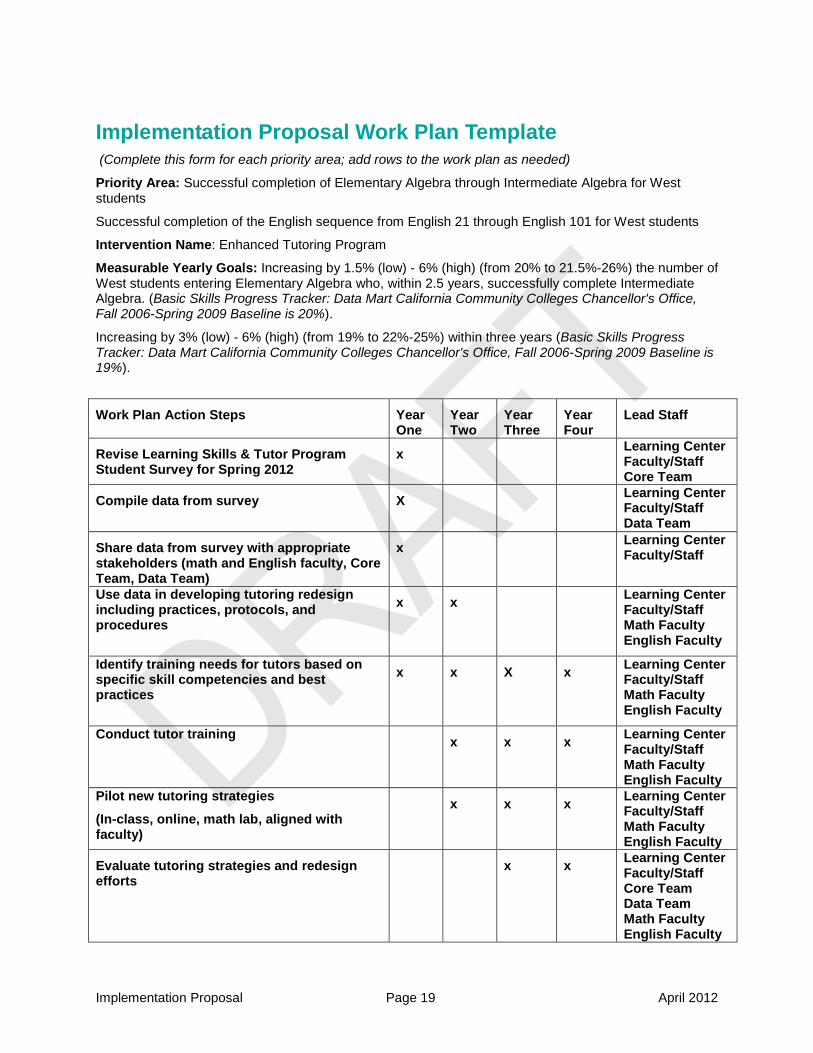
Implementation Proposal Work Plan Template (Complete this form for each priority area; add rows to the work plan as needed)
Priority Area: Successful completion of Elementary Algebra through Intermediate Algebra for West students
Successful completion of the English sequence from English 21 through English 101 for West students
Intervention Name: Enhanced Tutoring Program
Measurable Yearly Goals: Increasing by 1.5% (low) - 6% (high) (from 20% to 21.5%-26%) the number of West students entering Elementary Algebra who, within 2.5 years, successfully complete Intermediate Algebra. (Basic Skills Progress Tracker: Data Mart California Community Colleges Chancellor's Office, Fall 2006-Spring 2009 Baseline is 20%).
Increasing by 3% (low) - 6% (high) (from 19% to 22%-25%) within three years (Basic Skills Progress Tracker: Data Mart California Community Colleges Chancellor's Office, Fall 2006-Spring 2009 Baseline is 19%).
Work Plan Action Steps Year One
Year Two
Year Three
Year Four
Lead Staff
Revise Learning Skills & Tutor Program Student Survey for Spring 2012
x Learning Center Faculty/Staff Core Team
Compile data from survey
X Learning Center Faculty/Staff Data Team
Share data from survey with appropriate stakeholders (math and English faculty, Core Team, Data Team)
x Learning Center Faculty/Staff
Use data in developing tutoring redesign including practices, protocols, and procedures
x x Learning Center Faculty/Staff Math Faculty English Faculty
Identify training needs for tutors based on specific skill competencies and best practices
x x X x Learning Center Faculty/Staff Math Faculty English Faculty
Conduct tutor training x x x Learning Center Faculty/Staff Math Faculty English Faculty
Pilot new tutoring strategies
(In-class, online, math lab, aligned with faculty)
x x x Learning Center Faculty/Staff Math Faculty English Faculty
Evaluate tutoring strategies and redesign efforts
x x Learning Center Faculty/Staff Core Team Data Team Math Faculty English Faculty
Implementation Proposal Page 20 April 2012
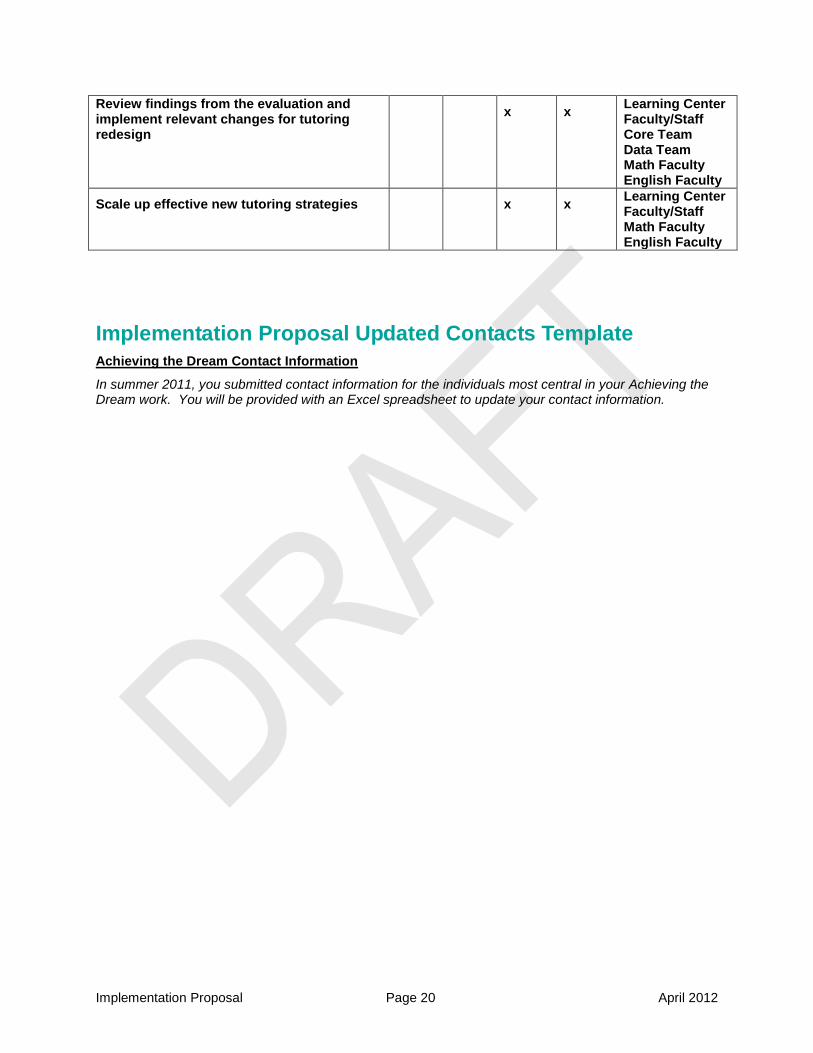
Review findings from the evaluation and implement relevant changes for tutoring redesign
x x Learning Center Faculty/Staff Core Team Data Team Math Faculty English Faculty
Scale up effective new tutoring strategies x x Learning Center Faculty/Staff Math Faculty English Faculty
Implementation Proposal Updated Contacts Template Achieving the Dream Contact Information
In summer 2011, you submitted contact information for the individuals most central in your Achieving the Dream work. You will be provided with an Excel spreadsheet to update your contact information.
Implementation Proposal Page 21 March 2012
Implementation Proposal Budget Template
Below is an example implementation budget template. Please complete the Excel version that will be sent to you separately. In the Excel version, complete the highlighted columns with projected Achieving the Dream expenditures. We ask that all colleges - even those that are self-funding their interventions - submit a budget and report expenditures against it while with Achieving the Dream. We use your budgets and expense reports to learn more about how much it costs colleges to “do” Achieving the Dream and to see how your work is progressing. We require budgeting for two years of implementation (three years for WA colleges) and recommend budgeting for a total of four years as we find that it usually takes about four years for interventions to be piloted, evaluated, brought to scale, and institutionalized.
Expenditures that colleges may find necessary to support the Achieving the Dream implementation work include but are not limited to:
• personnel • materials and supplies • stipends for faculty/staff • consultants • professional development • meetings and conferences • community, faculty, and student engagement activities • travel to other colleges for professional development or other learning opportunities • travel and lodging for four complimentary participants to each D.R.E.A.M. Achieving the
Dream’s Annual Meeting on Student Success (budget three nights of lodging per participant) • travel, lodging and registration fees for extra participants at D.R.E.A.M. Achieving the Dream’s
Annual Meeting on Student Success. Anticipate a registration fee of $550 per person for extra participants.
Please note: Only complete the highlighted columns now; other columns will be completed later. Formulas have been inserted into the Excel file to help you calculate totals. The example budget categories are not mandatory and should be edited and expanded upon to fit
your college’s needs.
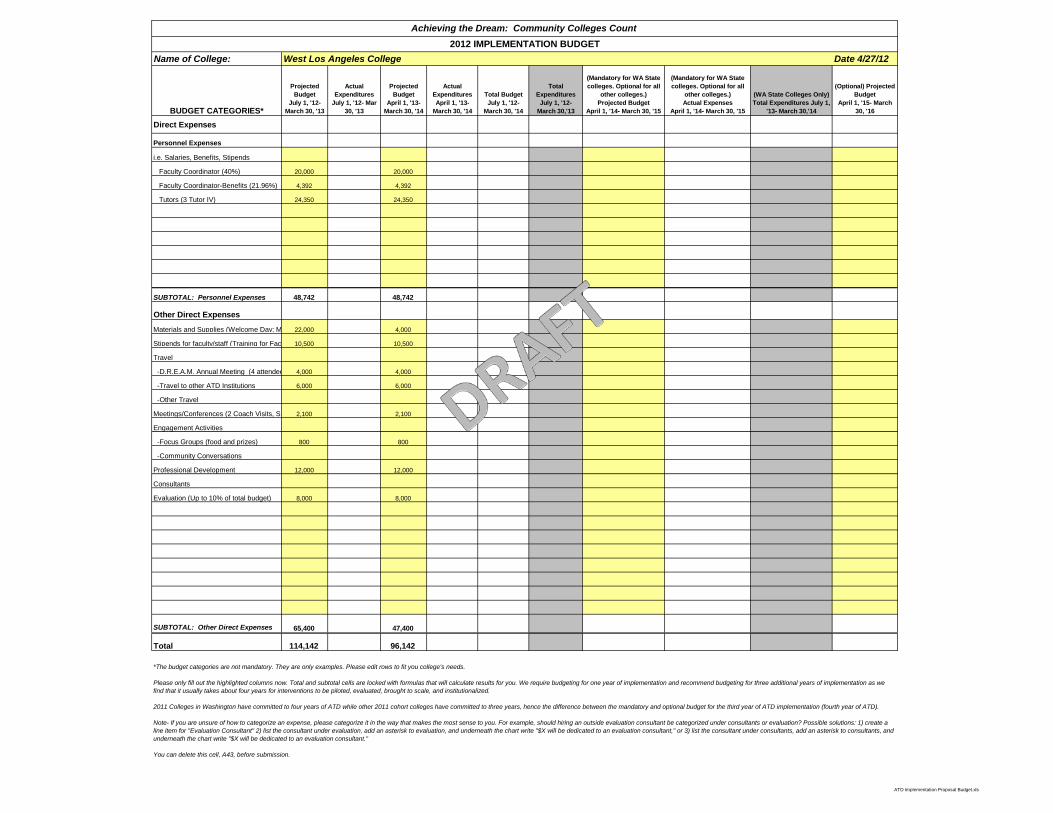
ATD Implementation Proposal Budget.xls
Name of College: West Los Angeles College Date 4/27/12
BUDGET CATEGORIES*
Projected Budget
July 1, '12- March 30, '13
Actual Expenditures
July 1, '12- Mar 30, '13
Projected Budget
April 1, '13- March 30, '14
Actual Expenditures April 1, '13-
March 30, '14
Total Budget July 1, '12-
March 30, '14
Total Expenditures
July 1, '12- March 30,'13
(Mandatory for WA State colleges. Optional for all
other colleges.) Projected Budget
April 1, '14- March 30, '15
(Mandatory for WA State colleges. Optional for all
other colleges.)Actual Expenses
April 1, '14- March 30, '15
(WA State Colleges Only)Total Expenditures July 1,
'13- March 30,'14
(Optional) Projected Budget
April 1, '15- March 30, '16
Direct Expenses
Personnel Expenses
i.e. Salaries, Benefits, Stipends
Faculty Coordinator (40%) 20,000 20,000
Faculty Coordinator-Benefits (21.96%) 4,392 4,392
Tutors (3 Tutor IV) 24,350 24,350
SUBTOTAL: Personnel Expenses 48,742 48,742
Other Direct Expenses
Materials and Supplies (Welcome Day; M 22,000 4,000
Stipends for faculty/staff (Training for Fac 10,500 10,500
Travel
-D.R.E.A.M. Annual Meeting (4 attendee 4,000 4,000
-Travel to other ATD Institutions 6,000 6,000
-Other Travel
Meetings/Conferences (2 Coach Visits, S 2,100 2,100
Engagement Activities
-Focus Groups (food and prizes) 800 800
-Community Conversations
Professional Development 12,000 12,000
Consultants
Evaluation (Up to 10% of total budget) 8,000 8,000
SUBTOTAL: Other Direct Expenses 65,400 47,400
Total 114,142 96,142
Achieving the Dream: Community Colleges Count2012 IMPLEMENTATION BUDGET
*The budget categories are not mandatory. They are only examples. Please edit rows to fit you college's needs.
Please only fill out the highlighted columns now. Total and subtotal cells are locked with formulas that will calculate results for you. We require budgeting for one year of implementation and recommend budgeting for three additional years of implementation as we find that it usually takes about four years for interventions to be piloted, evaluated, brought to scale, and institutionalized.
2011 Colleges in Washington have committed to four years of ATD while other 2011 cohort colleges have committed to three years, hence the difference between the mandatory and optional budget for the third year of ATD implementation (fourth year of ATD). Note- If you are unsure of how to categorize an expense, please categorize it in the way that makes the most sense to you. For example, should hiring an outside evaluation consultant be categorized under consultants or evaluation? Possible solutions: 1) create a line item for "Evaluation Consultant" 2) list the consultant under evaluation, add an asterisk to evaluation, and underneath the chart write "$X will be dedicated to an evaluation consultant," or 3) list the consultant under consultants, add an asterisk to consultants, and underneath the chart write "$X will be dedicated to an evaluation consultant."
You can delete this cell, A43, before submission.