implementation of a novel pigment recovery process for a
TRANSCRIPT
IMPLEMENTATION OF A NOVEL PIGMENT RECOVERY PROCESS FOR A PAPER MILL
PIRJOJORTAMA
Department of Process andEnvironmental Engineering,
University of Oulu
OULU 2003

PIRJO JORTAMA
IMPLEMENTATION OF A NOVEL PIGMENT RECOVERY PROCESS FOR A PAPER MILL
Academic Dissertation to be presented with the assent ofthe Faculty of Technology, University of Oulu, for publicdiscussion in Raahensali (Auditorium L10), Linnanmaa, onDecember 19th, 2003, at 12 noon.
OULUN YLIOPISTO, OULU 2003
Copyright © 2003University of Oulu, 2003
Supervised byDoctor Olli Dahl
Reviewed byProfessor Kari EdelmannProfessor Juha Kallas
ISBN 951-42-7222-6 (URL: http://herkules.oulu.fi/isbn9514272226/)
ALSO AVAILABLE IN PRINTED FORMATActa Univ. Oul. C 194, 2003ISBN 951-42-7221-8ISSN 0355-3213 (URL: http://herkules.oulu.fi/issn03553213/)
OULU UNIVERSITY PRESSOULU 2003

Jortama, Pirjo, Implementation of a novel pigment recovery process for a paper mill Department of Process and Environmental Engineering, University of Oulu, P.O.Box 4300, FIN-90014 University of Oulu, Finland Oulu, Finland2003
Abstract
The objective of this study is to demonstrate an ecological and economic recovery process, which wasdeveloped and implemented at Stora Enso Oyj Fine Paper Oulu mill during the period 2000 to 2002.The ECO plant recovers the material called ECO pigment from the effluent treatment sludge and itcan be used as a filler in multicoated fine paper production for art printing purposes.
The ECO plant process consists of the following process stages. First, there is a separating phasefor the recoverable material from fibres and other rejects, which is done with a wire washer. Then thefractionating of the recoverable material is performed with two-stage centrifugal cleaners. Chemicaltreatment with peracetic acid is used as a preservative and to increase the brightness of the ECOpigment a little. Then the recoverable material is stored in the pigment storage area and dosed to thepaper machines as a filler. The rejects from the ECO plant are thickened in belt filter presses and thentransferred to the bark storage area, where they are mixed with bark and combusted in a solid fuelboiler.
The majority of the particles of the recovered ECO pigment were less than 45 µm; this size ofparticle accounted for 96.4% (on average) according to the studies made between June and December2002.
The use of ECO pigment is not found to cause more web defect problems on the base paper thanbefore, according to the studies of the number of total web defects with the achieved particle sizedistribution and because the microbe content has been controlled.
There are three sources from which the ash content of the base paper is composed after the start-up of the ECO plant, i.e. the broke, the virgin filler and ECO pigment. Therefore the use of ECOpigment partly decreases the need to use virgin filler. The ECO pigment was tested in the coatingcolour in pilot tests, and based on these results it could be used in the coating colour. The dry solidcontent of the ECO pigment has to be increased from the present level for the coating application.
Keywords: ecological, effluent treatment, filler, paper mill effluent, pigment, recovery, reuse


To Timo and Laura


Acknowledgements The research work on the recovery process handled in this thesis was carried out between 2000 and 2003 for Stora Enso Oyj Fine Paper Oulu mill, where I have been working as a development engineer. I would like to express my gratitude to Stora Enso Oyj Fine Paper Oulu mill for giving me the opportunity of doing this thesis. I was allowed to implement the results of the research work on the mill scale and so the benefits of the developed process could be seen in practice. I wish to thank Mr. Mauri Koivuranta for his helpful comments during my research work and reading and for commenting on the manuscript of this thesis.
I wish to express my thanks to everybody who participated in the implementation phase known as the ECO plant project between 2001 and 2002.
I have been a postgraduate student in the Industrial Environmental Engineering Laboratory of the Department of Process and Environmental Engineering, University of Oulu, Finland. I would like to express my gratitude to the supervisor of my thesis, Dr. Olli Dahl. I have been in the Graduate School of Environment at Oulu University, which has supported my research.
I wish to express my thanks to Professor Juha Kallas and Research Professor Kari Edelmann for reviewing the manuscript of this thesis. Ms. Sue Pearson is acknowledged for revising the English of the manuscript.
Finally, I am greatly indebted to my husband, Timo, and my daughter, Laura, for all the patience and understanding they have shown throughout the project.
Kempele, November 2003 Pirjo Jortama


List of symbols and abbreviations Latin Letters a annum; year d day g gram k kilo l litre m metre min minute M mega (million) t metric ton, 1 t = 1000 kg T temperature [ºC] Abbreviations abs. absolutely Al2O3 aluminium oxide av. average BAT best available technique CaCO3 calcium carbonate cfu colony forming unit, [cfu/ml] using measuring plate counts for the
microbe contents CM6 coating machine number 6 CM7 coating machine number 7 cP the unit of viscosity is the Poise (1 P = 1 gcm-1s-1) which is subdivided
into 100 centipoise (cP) dev. deviation ECC the complete name of the company: ECC International Ltd. ECF elemental chlorine free ECO pigment recovered pigment from the effluent treatment sludge at the ECO plant ECO plant ecological and economic recovery system at Stora Enso Oyj Fine
Paper Oulu mill

EDX Energy dispersive X-ray microanalysis ePAA equilibrium peracetic acid GW Gap Washer, a wire washer HC90 calcium carbonate, fine particle size HC60 calcium carbonate, coarse particle size H2SO4 sulphuric acid ISO International Standards Organisation IPPC Integrated Pollution Prevention and Control KCL The Finnish Pulp and Paper Research Institute Ltd. Limited LUMI 7 the name of the implementation project for PM7 at Enso Oy mill (the
previous name of the present Stora Enso Oyj Fine Paper Oulu mill), in Oulu, 1995 - 1997
LWC paper light weight coated paper mesh the size of the sieve (used in the USA and England), tells how many
wires there are per the inch in sieve, dependent on the size of the holes and the thickness of the wire
MgCO3 magnesium carbonate NaOH sodium hydroxide NGO non-governmental organization OPA the name of the implementation project for PM6 at Veitsiluoto mill (the
previous name of the present Stora Enso Oyj Fine Paper Oulu mill), in Oulu, 1989 - 1991
PAC poly aluminium chloride pH logarithm of the reciprocal of the hydrogen ion concentration of a
solution PM6 paper machine number 6 PM7 paper machine number 7 PPS Parker Print-Surf, method for roughness measurement pre-coating coating the first layers in the coating machine RB Richard Berg, the Swedish company that originally designed the
Andritz cleaners. Andritz acquired the RB technology through its acquisition of Ahlstrom Machinery and has improved it.
ref. Reference SCAN Scandinavian Pulp, Paper and Board Testing Committee SCWO supercritical water oxidation SEM scanning electron microscopy Sym-coating coating with Sym Sizer film coating machine in the paper machine UK United Kingdom WAO Wet Air Oxidation
Contents Abstract Acknowledgements List of symbols and abbreviations Contents 1 Introduction............................................................................................................. 15
1.1 Towards minimising solid waste in paper production .................................... 15 1.2 Methodology .................................................................................................. 17 1.3 Outline of the thesis........................................................................................ 18
2 Previous approaches for pigment recovery from the effluents of a paper mill ....... 19 2.1 Wet Air Oxidation (WAO)............................................................................. 19
2.1.1 High Pressure Wet Air Oxidation ....................................................... 19 2.1.2 Supercritical water oxidation (SCWO) ............................................... 22
2.2 Trenntechnik................................................................................................... 23 2.3 Pigment separation of effluents by Caledonian Paper .................................... 24 2.4 Fibre and filler recovery of effluents by Wiggings Teape Group Ltd. ........... 25 2.5 Recovery of solid wastes derived from the wet end and the coater by ECC
International Ltd. ............................................................................................ 26 2.5.1 RECClaim process .............................................................................. 26 2.5.2 Controlled temperature incineration.................................................... 27 2.5.3 Forced evaporation.............................................................................. 28
2.6 Ultrafiltration.................................................................................................. 29 2.7 FilRec ............................................................................................................. 30
3 Background of problem .......................................................................................... 32 3.1 Possibility of using recoverable material in multicoated fine paper production....................................................................................................... 32
3.1.1 Utilisation potential of recoverable material ......................................... 33 3.1.2 Quality requirements of recoverable material ....................................... 36
3.1.2.1 Quality requirements of present filler and pigment sources.. 36 3.1.2.2 Quality requirements of recoverable material in different
applications ........................................................................... 37 3.1.3 Utilisation of combustible rejects in energy production...................... 38
3.2 Properties of different effluent flows.............................................................. 40 3.3 Present effluent treatment process ................................................................. 50
3.3.1 Process description.............................................................................. 50 3.3.2 Properties of different sludges at various treatment stages ................. 51
3.4 Properties of sludge transferred to landfill and its present applications ......... 53 3.5 Results of the evaluation of a concept for recovering material from effluent
treatment sludge ............................................................................................. 54 4 Principles of the ECO plant process and its process equipment ............................. 56
4.1 Driving forces................................................................................................. 56 4.2 Preliminary assumptions ................................................................................ 57 4.3 Hypothesis...................................................................................................... 58 4.4 Viewpoints for selecting the separation process............................................. 58 4.5 Dimensioning data.......................................................................................... 63 4.6 Process description ......................................................................................... 63
4.6.1 Collecting sludge fractions.................................................................. 65 4.6.2 Separating recoverable material with a wire washer ........................... 66 4.6.3 Fractioning with centrifugal cleaners .................................................. 70 4.6.4 Chemical treatment with peracetic acid .............................................. 71 4.6.5 pH control of ECO pigment ................................................................ 76 4.6.6 Storing recoverable material ............................................................... 76 4.6.7 Dosing recoverable material to PM6 and PM7 ................................... 76 4.6.8 Collecting combustible rejects ............................................................ 77 4.6.9 Thickening combustible rejects........................................................... 77 4.6.10 Transferring combustible rejects to solid fuel boiler ........................... 78
4.7 Volume flows of the ECO plant ..................................................................... 79 5 Properties of ECO plant products and efficiencies of separating and fractioning
stages ...................................................................................................................... 81 5.1 Wire washer accept ........................................................................................ 81 5.2 Accept of centrifugal cleaners ........................................................................ 86
5.2.1 Particle size distribution...................................................................... 86 5.2.2 Dry solid and ash content .................................................................... 93
5.3 Abrasiveness of ECO pigment ....................................................................... 95 5.4 Dry solid content and ash content of belt filter press feed.............................. 96
6 End use of ECO plant products............................................................................... 99 6.1 Using ECO pigment as filler in PM6 and PM7 .............................................. 99 6.2 Replacing virgin filler .................................................................................... 104 6.3 Combustion of residual sludge ....................................................................... 105
7 Further alternatives for using ECO plant products ................................................. 108 7.1 Usability of the recovered pigment in coating colour..................................... 108 7.2 Pilot tests for using ECO pigment in coating colour ..................................... 109 7.3 Possibility of increasing the dry solid content of pigment slurry for the
coating application ......................................................................................... 110 7.3.1 Full-scale test using decanter centrifuge with coating colour effluents and ultrafiltrate concentrate................................................................. 110 7.3.2 Pilot tests of decanter centrifuge with pre-screened effluent treatment
sludge .................................................................................................. 113

7.4 Conclusion...................................................................................................... 114 8 Ecology of the ECO plant ....................................................................................... 115
8.1 Main results of study ...................................................................................... 115 8.2 Discussion ...................................................................................................... 117 8.3 Conclusions .................................................................................................... 118
9 Summary................................................................................................................. 119 References .................................................................................................................... 121 Appendix 1: Wet sieving method for studying particle sizes

1 Introduction
1.1 Towards minimising solid waste in paper production
There are a number of issues that may be characterised as driving forces in minimising solid waste in paper production. Examples include legislative and regulative factors as well as taxation and fee systems, utilisation aspects (energy, raw materials), cost factors, environmental management systems, and the environmental opinion as presented by media, political parties, NGOs and other groups (Lilja et al. 1997).
The European Union has a set of common rules on permitting for industrial installations. These rules are set out in the IPPC Directive of 1996, which came into force on 1 March 2000 in Finland, when the new environmental protection law and statute were made. IPPC stands for Integrated Pollution Prevention and Control. In essence, the IPPC Directive is about minimising pollution from various point sources throughout the European Union. Therefore installations covered in the Directive are required to obtain an authorisation (permit) from the authorities in the European Union countries. “Integrated” means that the permits must take into account the whole environmental performance of the plant, i.e. emissions to air, water and land, generation of waste, use of raw materials, energy efficiency, noise, prevention of accidents, risk management, etc. The permits must be based on the concept of Best Available Techniques (BAT) defined in the Directive. In many cases BAT means quite radical environmental improvements and sometimes it will be very costly for companies to adapt their plants to BAT. The imposition of new and considerably tougher BAT rules on all existing installations in the European Union could jeopardise many European jobs, and therefore the Directive grants these installations an eleven-year long period counting from the day that the Directive entered into force (The IPPC Directive 96/61/EC).
On a worldwide basis, one may assume an average amount of 100 kg of solid waste (abs. dry) per tonne of paper is landfilled. So, the total quantities of solid waste in the world from the pulp and paper industry amount to about 30 million t/a (abs. dry) (Lilja et al. 1997). In Finland, the total solid waste taken for disposal from pulp and paper mill to landfill sites was 423 000 t (abs. dry) in a total pulp production of 11.1 million tonnes and paper and board production of 12.5 million tonnes in 2001. The total solid waste taken to landfill sites in the Finnish pulp and paper industry decreased by 15% compared with the previous year (2001). The focus for solid waste management was on reducing the volume
16
of waste taken to landfill sites and on making waste sorting more efficient. Efforts were also made to promote the reuse of waste and to generate useful products from it (Siekki et al. 2002).
The solid waste in paper production includes mainly raw materials used in paper production, and they normally are in sludge form. Sludge reduction and reuse within the papermaking process are key components required of paper mills as part of the IPPC Directive (Kay 2003). The main solid waste sources of paper production in sludge form are the rejects from filters and sieves, the coating residues and the sludge originating in the effluent treatment process of the paper mill. Concerning the amounts of solid waste in paper production, there were 39 000 t of fibre and coating colour sludge and 27 000 t sludge from wastewater treatment in 2001, comprising 15.6% of the total amount of landfilled solid waste from pulp and paper production (Siekki et al. 2002). Because all the above-mentioned solid waste sources in paper production contain re-useable raw materials, attempts could be made to recover these solid wastes for better material efficiency in paper production. So in this study, the target focused on the said sludges.
The other solid waste from the pulp and paper mill included in the amount of 423 000 t (abs. dry), were ash from energy generation (153 000 t), soda dregs and lime sludge (68 000 t), de-inking sludge (50 000 t), wood waste (22 000 t), non-recyclable waste paper (346 t) and other wastes (domestic waste, metal, soil and stones) totalling 63 000 t (Siekki et al. 2002).
Many of the waste fractions can be utilised and should not actually be classed as waste. Today it is normal to use paper and board broke effectively as raw material, and its recovery rate in Finland in 2001 was 99%. Over 90% of sludge from wastewater treatment is also utilised, and the figure for fibre sludge exceeds 70% (Siekki et al. 2002).
The most common applications for solid waste have been energy production by combustion. The sludge may also be used in land applications, when it is used e.g. for barriers, support walls and roads, and for fertilising purposes. Inorganic substances in solid waste are suitable for spreading in the forest or for use in the lime used in the brick and cement industry. Composted sludge in particular has the potential to be used as raw material in landscaping soil. (Lilja et al. 1997).
Some of the solids e.g. fibres, are recovered and utilised in pulp and paper production. Economically, this is the best way to utilise the recovered material.
The objective of this study is to demonstrate an ecological and economic recovery process by building a pigment recovery process, the ECO plant, which has the capability to recover material, which could be utilised as a filler in the manufacture of multicoated fine paper used for art printing purposes.
The author of this thesis started the research work on the recovery process handled in this thesis at the beginning of 2000 for Stora Enso Oyj Fine Paper Oulu mill. After pre-studies the author was allowed to work on making the investment proposal for the ECO recovery plant, which was ready on 13 November 2000. The investment decision on this was approved at the end of the year. The process and its machinery and equipment were chosen based on the results of the pilot tests during 2001 and the author worked as the main process specialist during the project. The ECO plant was started up on 12 March 2002. The author has collected and analysed all the studies and the results concerning the new recovery process, which are presented in this study. Since then, the author has
17
clarified the further alternatives for using ECO plant products, which have been presented in this study.
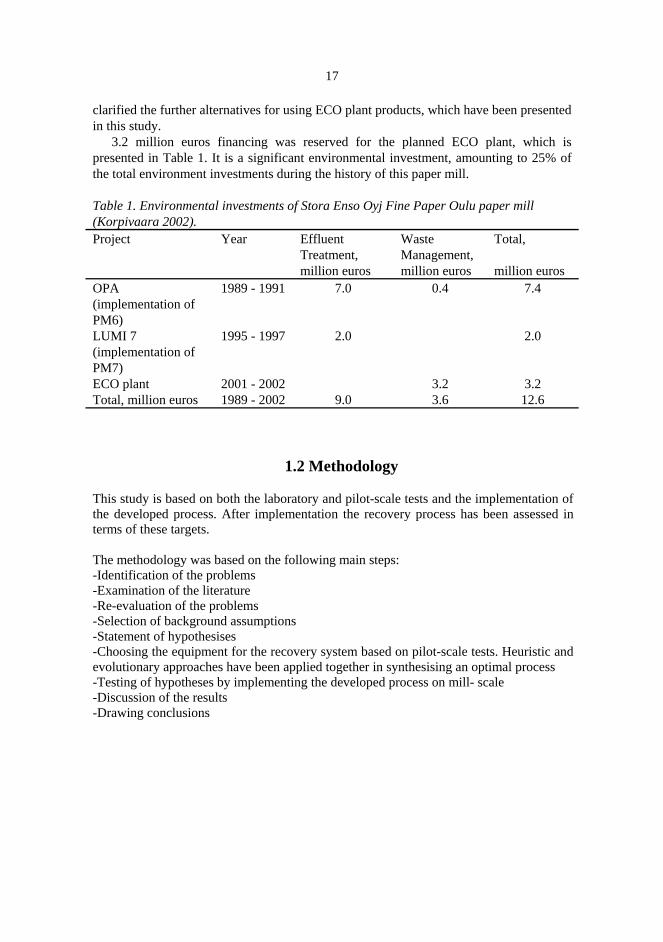
3.2 million euros financing was reserved for the planned ECO plant, which is presented in Table 1. It is a significant environmental investment, amounting to 25% of the total environment investments during the history of this paper mill.
Table 1. Environmental investments of Stora Enso Oyj Fine Paper Oulu paper mill (Korpivaara 2002). Project Year Effluent
Treatment, million euros
Waste Management, million euros
Total, million euros
OPA (implementation of PM6)
1989 - 1991 7.0 0.4 7.4
LUMI 7 (implementation of PM7)
1995 - 1997 2.0 2.0
ECO plant 2001 - 2002 3.2 3.2 Total, million euros 1989 - 2002 9.0 3.6 12.6
1.2 Methodology This study is based on both the laboratory and pilot-scale tests and the implementation of the developed process. After implementation the recovery process has been assessed in terms of these targets. The methodology was based on the following main steps: -Identification of the problems -Examination of the literature -Re-evaluation of the problems -Selection of background assumptions -Statement of hypothesises -Choosing the equipment for the recovery system based on pilot-scale tests. Heuristic and evolutionary approaches have been applied together in synthesising an optimal process -Testing of hypotheses by implementing the developed process on mill- scale -Discussion of the results -Drawing conclusions

18
1.3 Outline of the thesis The aim of this research was to plan an environmentally optimum recovery process, through which the solid waste of the paper mill can be utilised by separating re-useable material from the effluent treatment sludge of the paper mill and reusing it as a filler. The residue, fibres and inseparable pigment can be combusted in a solid fuel boiler.
The basic idea of the new recovery process is as follows. The sludge from the clarification and reject tanks of the paper machines will be handled in a new way. Instead of collecting them in the sludge tank to be fed to the belt filter presses, the sludge is routed to the feed tank of the new recovery process. The scope of the main processes of the study is presented in Fig. 1.
Collecting the sludge fractionsSeparating and fractioning the recoverable material from the combustible rejects
Chemical treatment of the recoverable materialStoring it in existing pigment tankDosing it to the paper machines
Collecting the combustible rejectsThickening
Transferring to the power plantDosing with bark to the solid fuel boiler
Fig. 1. The scope of the main processes of the study. The idea of this recovery process is feasible for all paper mills using fillers and/or
pigments as a raw material. Environmentally the best effect could be achieved in integrated pulp and paper mill complexes with a power plant including a solid fuel boiler.
The structure of the thesis is as follows: Chapter 2 discusses the previous approaches to pigment recovery from paper mill
effluents and evaluates the possibilities of utilising the earlier processes and their separation methods in developing a new recovery process.
Chapter 3 concerns the background of the situation: virgin filler and pigment consumption and use, the amounts of effluent treatment sludge from a paper mill that are transferred to landfill and the suspended solid discharges, the different effluent flows and their volume flows and contents, the present effluent treatment process and the properties of the different sludge from the treatment stages and the properties of the sludge transferred to landfill and its present conventional applications and amounts.
Chapter 4 considers the driving forces behind this study, the preliminary assumptions and hypothesis of this study, the viewpoints for selecting the separation process, the principles behind the developed ECO plant process and the chosen process equipment for producing an ECO pigment and using it as a filler in the paper mill.
Chapter 5 introduces the results of the separation process stages of the ECO plant process and evaluates them.
Chapter 6 considers the effects of the use of an ECO pigment in the paper mill. Chapter 7 previews further possibilities and the required facilities to expand the use of
ECO pigment in coating applications. Chapter 8 discusses the newly developed ECO plant process and its effects. Chapter 9 sums up the most important findings.

2 Previous approaches for pigment recovery from the effluents of a paper mill
Sludge, originating from the effluent treatment of paper mill, often represents the majority of the total solid waste in paper mills. Reducing generation of sludge is one of the most important ways of minimising the total solid waste in the paper industry. Some cases and techniques have been presented in literature, whereby the material is recovered from effluents for reuse as a filler or a pigment in paper production.
2.1 Wet Air Oxidation (WAO)
2.1.1 High pressure wet air oxidation The first patent for wet air oxidation was obtained 1950 and nowadays, there are more than 200 wet air oxidation plants in the world that are operated for the treatment of different types of waste (US Filter/Zimpro 2002). E.g. Biberist, a Swiss fine paper mill has been using Zimpro (the Zimmermann Process) for the treatment of paper mill effluent and recovery of fillers since 1977. The wet air oxidation is also called Zimpro process (Karin Lilja et al. 1997)
A wet air oxidation unit consists of a pump to supply the solution or organic material to the process¸ an air compressor to supply the oxygen-containing gas, and a pressure vessel or oxidation tower called a reactor to hold the waste materials and air in intimate contact. Dewatering is not required. The oxidation reaction is exothermic and produces heat energy from the potential chemical energy contained in the organic matter. Heat exchangers recover the heat contained in the outgoing oxidised material, and use it to heat the raw incoming waste and air. Where the heat liberated by the reaction exceeds process requirements, it may be recovered either as process steam by heat exchange against boiler feed water, or as mechanical energy by expanding the process exhaust gases through an expander. The heat exchanger configuration will vary with the energy content of the material being processed (Flynn 1976). The method can be applied to both

20
deinked and non-deinked sludges. One advantage is that there is no odour problem. Trials to use the Zimpro process as an alternative to the recovery boiler in chemical pulp mills have also been performed but they have not been successful due to severe corrosion problems. (Karin Lilja et al. 1997).
Almost 90% of the organic material in the sludge is oxidised in the reactor to carbon dioxide and water. The degree of oxidation depends mainly on the temperature, pressure, residence time and organic resistance with respect to chemical oxidation (Mishira et al. 1995). The rest is solubilised. Oxidised products are drawn off through the process heat exchanger to a cooler where the cooling water is used to reduce the temperature of the oxidised sludge prior to its return to the mill clay system. The insoluble organic material is removed from the sludge, leaving behind the inorganic materials, primarily clay and titanium oxide. In the case of Biberist, screening is necessary to remove coarse foreign material from the recovered filler. Because reaction temperatures are maintained below 315 ºC, the clay is not re-calcined and its structure is not changed. The filler material is restored to an acceptable brightness (Flynn 1976). Pressures are kept between 0.5 to 30 MPa in wet air oxidation applications (Kolaczkowski et al. 1999). .Wet air oxidation does not remove inorganic contaminants, so in filler recovery steps should be taken to keep inorganic materials that might affect the colour or brightness out of the sludge (Flynn 1976). The wet air oxidation has relatively high investment costs (Karin Lilja et al. 1997).
The wet air oxidation process also was started at Midtec Paper Corporation, located in Kimberly, Wisconsin, USA in 1982 for a similar fibrous, filler containing sludge as in Biberist, in Switzerland. After installing secondary wastewater treatment facilities in 1977, Midtec was faced with disposal of approximately 65 000 t of wet sludge per a year. Then Midtec Paper Corporation produced 875 t/d of coated paper for the printing industry and so their WAO unit was designed to oxidise 42 t/d of waste activated sludge and to recover the 20 t/d of clay residue for reuse as a filler in the base sheet of the paper. (Evans 1985 and Ichinose 1984).
The process is presented in Fig. 2. The process feed is the sludge from the effluent treatment and its dry solid content is about 8%. The feed rate is 5.4 l/s, with about one half of the solids being volatile organics and almost all of the balance being filler clay. A high-pressure pump delivers the sludge to the oxidation system at 14.5 MPa. At pump discharge, high-pressure air is injected into the sludge stream by a process compressor. The sludge-air mixture then enters a heat exchanger where the temperature is elevated to 175 °C by the discharge from the system. The temperature is then raised to 230 °C by condensing 620 kPa steam in a second heat exchanger. The hot mixture then goes to a reactor where it is held for 30 to 35 min, during the time the organics material in the sludge is oxidised, i.e. burned at a high temperature by the excess oxygen present. The reactor contents then overflow to a heat exchanger re-boiler, which produces 900 kg/h of 210 kPa process steam use in the mill. The material from the reactor then passes through the heat exchanger, which elevates the temperature of the sludge entering the system. The treated sludge exits at 50 to 60 °C through a pressure-control valve to a vapour-liquid separator. The vapour is scrubbed with water and sent to the boiler house stack. The slurry containing the filler clay goes to three Sweco screens in parallel (125, 165 and 325 mesh) and then to an Eimco decanter-settler washing system. The washed clay goes to a

21
storage tank at 12 to 14% solids. The effluent is recycled to the oxidation basin in the effluent treatment system. The reaction in the reactor is controlled through temperature and pressure instrumentation and manual control of the amount of residual oxygen in the vapour from the reactor effluent (Evans 1983 and 1985).
Fig. 2. Sludge oxidation and filler recovery system at Midtec’s Kimberly mill (Evans 1985).
Some start-up problems with the process were observed at Midtech: Although scaling
of the heat exchangers was expected, this occurred faster than had been anticipated, requiring more frequent washing with hot nitric acid. Calcium sulphate and calcium oxalate scale deposition require washing every four to five days. A large accumulation of calcium oxalate sand in the reactor had been experienced in the four to five days’ operation time. To remove this sand, the reactor was cooled to 90 ºC, pressurised to 4.1 MPa, blown out and dewatered on some 325 mesh screens (Evans 1985 and Mertz et al. 1984).
The brightness and colour of the recovered clay are below that of standard clay but quite usable as a filler clay. The colour of the recovered clay is primarily due to the iron in the mill effluent. Biberist mill made a substantial improvement in its clay brightness by converting to the use of a low-iron alum. Some iron may also originate from the corrosion in the mill (Evans 1985 and Mertz et al. 1984).
High pressure wet air oxidation was omitted from the further alternative separation methods studied here. The main reason for this was that further opportunities to utilise the fibres of the effluent sludge are hindered when using wet air oxidation for separation pigments and fibres. The sludge in the studied mill consists of fibres that can be chosen for utilisation in the mill’s own paper production or for other purposes (e.g. recycled paper) in the future. The possibility of using screened fibres from the effluent sludge was investigated during this study by making a refining test of screened fibres and tests with
22
hand sheets and the results indicate future potential. The results also show the needs for additional separation steps and the thickening of the sludge if the recovered fibre is transported away from the mill. The utilisation of the fibres in this phase was omitted from these studies and no investments were planned for that point, since all the logistic viewpoints (user(s) of the recovered fibres, transportation etc.) were not determined in this phase. Firstly, it was decided to prove the recovery of the pigments from the effluent sludge. After all, the mill had made pre-studies on the combustion of the effluent treatment sludge in the solid fuel power plant in the mill area and the idea was to develop this further for the reject of the new process in the first phase.
2.1.2 Supercritical water oxidation (SCWO) Supercritical water oxidation (SCWO) is a new and more advanced option of wet oxidation for sludges and dissolved organic substances. In the SCWO process, organics are effectively oxidised in water at supercritical temperature 400 to 600 °C and the pressure applied is as high as 25 MPa. The reaction products are carbon dioxide and inorganic acids and salts, which may sometimes be used as paper filler. Supercritical water oxidation is not yet in commercial use in the pulp and paper industry (Karin Lilja et al. 1997).
Sludge and oxygen are mixed and pressurised to 25 MPa at room temperature in a concentration of 94% waste and 6% oxygen. In the reactor the sludge and oxygen are heated to 300 - 400 °C, depending on the concentration of oxidisable material in the waste. After reaching approximately 360 °C, the mixture is in vapour phase, where the mixing of oxygen and organics is through. In the insulated reactor most of the organic material is broke down in just a few seconds as the peak temperature reaches 600 °C. The mixture is cooled back to room temperature in a heat exchanger. The liquid phase contains all of the particulate matter, all of the acid gases, and some carbon dioxide. The effluent is separated by phase and the oxygen, once separated from the carbon dioxide, is recycled to the process. The recovery of excess oxygen and steam should make the process cost-competitive. About 45% of the heat value in the sludge can be recovered as steam (Karin Lilja et al. 1997).
The supercritical wet air oxidation method was also left out from the further studied alternative separation methods in this study in a similar way to high pressure wet air oxidation, because further possibilities of utilising the fibres of the effluent sludge would be hindered when using that method for separation of pigments and fibres.
As white water systems and entire mills become increasingly closed, the pulp and
paper industry might quite well adapt to using these waste reaction alternatives mentioned in Chapter 2.1. In the closed system the amounts of contaminants that are released during pulp and production, increases and accumulates. Their presence in process waters can lead to the deterioration of paper quality and runnability problems in paper production. Therefore new technologies in water treatment are needed for the development of closed-loop systems.

23
2.2 Trenntechnik Trenntechnik is a filler recovery system connected to the effluent treatment at Stora Enso Uetersen mill, which started up in 1992. The effluents of two paper machines and one coating machine are collected for recovering the filler and re-using it in the paper machine. This is also the pre-treatment method for the effluents before these waters are led to the municipal wastewater treatment plant (Templer 1993). The Trenntechnik process is illustrated in Fig. 3.
The first phase is to separate the large particles, such as pieces of paper and bigger coating particles from the wastewater with a drum screen. After that there is a sand trap before the wastewater is routed to the Fourdrinier wire, with which the pigments are separated from the filtrate. Then the pigment- containing filtrate is channelled to the sedimentation and flotation phase, from where the sludge is pumped to the vibration screens. The last separation phase of the pigment recovery process is done with centrifugal cleaners (Pelikan et al. 1997).
The excess of the sedimentation and flotation phase is pumped through the condensing tower to the municipal wastewater treatment plant. The rejects of the process are utilised in cement/brick work (Pelikan et al. 1997).
According to the experiences of the Uetersen mill, the use of the recovered filler does not noticeably affect the paper quality. However, the results indicate that the brightness and opacity could decrease, the roughness could increase and the strength properties (e.g. breaking length) could decrease, but the effects are not so significant that they would inhibit reuse (Pelikan et al. 1997).
The Trenntechnik has been developed to handle the mix of paper mill waste water before the effluent treatment process. The mill of this study has its own effluent treatment department, which it is useful to utilise before the new recovery process. It minimises volume flows and removes e.g. phosphorus and oxygen- eliminating matter, which are not wanted back in the process, with its chemical flotation treatment, and these viewpoints are therefore included in process planning.
The Trenntechnik utilises a flotation phase. In this case, on the basis of the results of the studies on the settling properties of the effluents flows, the amount of the flocculation chemical needed is known to be quite considerable. It was assumed to be better not to use that kind of chemical at all, because the recovered solids will be returned back to the process and no harmful effects are acceptable in its utilisation in the paper mill.
The Trenntechnik also consists of mechanical separation phases, which were thought through carefully for this study. After due consideration, the target of this study was set as the minimisation of the numbers of separation steps needed in Trenntechnik for a new recovery process. This was concerned with the careful selection process of the separation equipment for a new recovery process and optimising the use of the separation equipment.
The reject from the Trenntechnik is utilised in cement/brick work. The fibres of the reject of the new recovery process may be chosen for utilisation in the mill’s own paper production or for other purposes (e.g. recycled paper) in the future. The utilising of fibres in this phase was omitted in these studies and no investments were planned for that point, because e.g. all the logistic viewpoints (user(s) of the recovered fibres, transportation

24
etc.) were not determined in this phase. As mentioned before, the mill had made pre-studies on combustion of the effluent treatment sludge in the solid fuel power plant in the mill area and it was thought this could be developed further for the reject of the new process in the first phase.
Fig. 3. Trenntechnik (Pelikan et al. 1997).
2.3 Pigment separation of effluents by Caledonian Paper The effluent treatment process with the recovery system of pigments started in 1995 in Caledonian Paper in Irvine, UK. The mill produced 200 000 t/a of LWC paper. The recovery process separates paper clay from latex. The paper clay is returned to the coated broke line and the latex is sent to the fluidised bed boiler, where it is burned with bark and fibrous material from the final stage of effluent treatment and thus produces steam for the mill. The boiler consumes the solid waste of the mill and decreases the need for solids disposal in a landfill; only ash is removed from the mill (Paper Technology 1995 36(3): 3).
10 000 m3/d of liquid effluents are generated, containing 13 to 15 t/d of suspended solids. About half of the effluents, in which there is a low suspended solids contents e.g. the clear filtrate from the paper machine, is sent directly to the local sewage pumping station for disposal straight out to sea. So the solids-bearing effluent is processed in the new effluent treatment plant. At first the mixture of water, china clay and latex is piped to a series of settling tanks for chemical pre-treatment and thence into a lamella clarifier. Here it is mechanically separated and the clay is precipitated out of the solution onto a series of sloping metal plates before being recovered from the bottom of the lamella (Frette 1995).

25
The advantages of the recovery process for Caledonian Paper are the savings in the consumption of china clay (approximately 1800 t/a) and the costs of transferring solid waste to the landfill (Frette 1995).
The Caledonian Paper idea was studied for this case. The settling properties of the different effluent flows were clarified, but according to the results, the sizing of the sedimentation clarifier would have been so large that the investment costs would have been too expensive. It was not wished to use any flocculation chemicals, because the recovered material is used as a filler and no additional chemicals should be pumped with the recovered material to the paper mill. For these reasons, separation methods other than sedimentation were thought to be more suitable in this case.
2.4 Fibre and filler recovery of effluents by Wiggings Teape Group
Ltd. In 1995, the Wiggins Teape Group Ltd. patented a fibre and filler recovery system, whereby the recovered material from the effluents is reused in paper production. The process is as follows: 1. screening and/or cleaning the sludge 2. thickening and heating the resulting sludge 3. passing the thickened heated dispersion through a disperser to break up dirt and other debris; and 4. re-using the resulting sludge in a papermaking operation
The first step is the screening and/or cleaning of the paper mill waste sludge from the mechanical primary clarifier to remove large contaminants. This is done at a relatively low dry solids content within the range of 2 to 6% by weight. It is accomplished using a high-density cyclone cleaner to remove the large dense contaminants followed by the further treatment of the accept by means of a high consistency rotating screen to remove lightweight contaminants. The rejects from both the cyclone cleaner and the rotating screen are then further treated by means of a pressurized vibrating tailing screen. Accepts from this are recycled back to an earlier process, whilst the rejects are discharged to landfill (Pat U.S. 5478441).
The second step is the thickening and heating of the resulting sludge. Thickening of the sludge is accomplished using a series of screw thickeners followed by one or more screw presses, effectively to raise the consistency from around 4 to 30% by weight. The thickened sludge is then passed through a plug screw to produce a seal and thereby a closed system. From the plug screw the fibre/sludge is fed to a ´´fluffer´´, which transforms the compressed fibre sludge into ´´crumbs´´ before it passes into the heating chamber. By fluffing more quickly and evenly heating is accomplished. Heating is conveniently made by the injection of superheated steam to a temperature of 125 ºC. The bleach addition is made at the point between the thickeners and the plug screw (Pat U.S. 5478441).

26
Once the fibre/sludge mixture has emerged from the disperser and has been diluted, typically with white water, it is suitable for use in a conventional papermaking stock, normally when combined with additional papermaking fibre, which can be fresh virgin pulp or a different broke. Additional filler may be added if necessary, although filler is present in the sludge and in various types of broke. This additional papermaking fibre can be mixed with the sludge prior to the screening and/or cleaning step or to a dispersion step and/or the sludge can be treated on its own before being mixed with the additional papermaking fibre (Pat U.S. 5478441).
The presented process was considered thoroughly for this case, but finally, it was thought too complicated and therefore too expensive. The aim was to simplify the process, but the mechanical separation steps were recognized also in this application to be implemented as basic separation methods. Thickening of the recovered pigment was considered, but because an increase in the solids content of recovered material was not needed for use as a filler, thickening equipment was not considered due to economic reasons in the first phase. The use of dispersion technology increases the yield of the separation process, and consequently that phase was applied in the new developed process. After due consideration, the right position to get the most benefit from the sludge disintegrator unit was ahead of all the separation stages.
2.5 Recovery of solid wastes derived from the wet end and the coater by ECC International Ltd.
2.5.1 RECClaim process
ECC International has developed the RECClaim process in which fine fibres and fillers that escape from machine save-alls and clarifiers can be converted into a composite filler material by co-precipitation with calcium carbonate (Toivonen 1996).
In the process, an alkaline earth metal carbonate precipitate may be formed by introducing a source of alkaline earth metal ions and a source of carbonate ions into a suspension comprising used water. The source of alkaline earth metal ions is conveniently the alkaline earth metal hydroxide (known as lime milk) when the alkaline earth metal is calcium, and the source of carbonate ions is carbon dioxide gas. This will form the desired precipitate of alkaline earth metal carbonate in situ, which will entrain the fine solids in the used water. The production of calcium carbonate in the scalenohedral form is favoured by maintaining the temperature of the mixture of used water and calcium hydroxide in the range of 40 to 60 ºC. The carbon dioxide containing gas contains from 5% to 50% by volume of carbon dioxide, the remaining being air or nitrogen. The quantity of the source of alkaline earth metal ions and the source of carbonate ions used is such as to precipitate sufficient alkaline earth metal carbonate to give a weight ratio of alkaline earth metal carbonate to fine solids in the range of 1:99 to 90:10 (Pat. U.S: 5558782 1996).
The suspension containing the alkaline earth metal carbonate precipitate and entrained fine solids may be recycled to supplement the filler. Alternatively the suspension
27
containing the precipitate may be dewatered by e.g. sedimentation, by pressure filter, or in a centrifuge, because it is found to be very much easier to dewater than the original suspension of fine solids alone; the water permeability is improved by about 50 to 100 fold. The precipitate has also been found to have advantageous light scattering properties (Pat. U.S: 5558782 1996).
The stage in which an alkaline earth metal carbonate is precipitated in the used water may replace either the first or the second save-all of a conventional secondary circulation loop of a paper production process. Alternatively the precipitation stage may take as its feed suspension the solids fraction supplied by the second save-all stage (Pat. U.S: 5558782 1996).
The carefully mentioned method above was not easy to apply in the case of this study. The effluent treatment sludge needs separation phases, because it consists of material, which is too large as to its particle size, and which cannot be returned to the process. The method presented is suitable for paper machine waters. Because of the targets of this study, a different solution is needed.
2.5.2 Controlled temperature incineration Sludge combustion has been studied for recovering pigments and fillers from waste sludges already before the studies of ECC International. In one case, the combusted sludge consisted of over 50% clay and the sludge was combusted in different kinds of furnaces. Because of the high temperature (800 to 1000 ºC) the clay was altered irreversibly and was not re-useable in papermaking. The sludge included titanium dioxide, which was not altered by combustion, but it could not be separated from ash by simple separation methods (Göttsching 1976).
The fibre component releases a large amount of heat when it is ignited, and this typically leads to localised temperatures in excess of 900 ºC during sludge combustion. Under these conditions the calcium carbonate component decomposes completely to calcium oxide, and this then combines with the clay components in reactions analogous to those occurring in cement manufacture. This leads to sintering or fusion of the particles into coarse, hard glassy agglomerates that are highly abrasive and resistant to further processing. As a result, ashes from normal sludge combustion operations are unsuitable for reuse in papermaking (Phipps et al. 1998). Because of the presented earlier experiences in literature, sludge combustion was not studied as an alternative for pigment recovery in this study.
ECC International has developed technology to incinerate de-inking sludges under closely-controlled temperature conditions, so that the decomposition of calcium carbonate is minimised and the reactions between the minerals are prevented. The incineration is split into two stages. In the first stage the majority of the organic material is burned rapidly and efficiently, and the potential of the sludge for generating high local temperatures is eliminated. The ash from the first stage is then subjected to a more extended calcination in the second stage, in which all remaining traces of char and organic material are eliminated. These are then subjected to conventional mineral
28
processing techniques to produce the desired filling or coating without the necessity of adding any further materials (Phipps et al. 1998).
There are no requirements for substantial sludge drying prior to the incineration stage and indeed a certain moisture content is beneficial in controlling the localised temperature of the combustion. It is advantageous for the sludge to be burned alone, as typical support fuels such as bark, wood or coal may lead to contamination of the products (Phipps et al. 1998).
The pigments, which were recovered from the de-inking sludge, have been evaluated as fillers in newsprint as SC magazine grade paper in laboratory studies. Based on these results, the recovered material is suitable for these grades of paper. The recovered pigment gave good sheet opacity at acceptable brightness. The results of the pilot tests at ECC International Technicentre in Lixhe, Belgium for using recovered pigment in paper coating formulation for both offset and rotogravure LWC papers also indicated an increase in opacity, and in some cases improved printability, however sheet gloss and brightness were sometimes slightly reduced (Phipps et al. 1998).
When this method was considered, it was omitted from the further studied alternative separation methods in this study in a similar way to e.g. the wet air oxidation method above, because further possibilities of utilising of the fibres of the effluent sludge would be hindered when using that method for separation pigments and fibres.
On the other hand, one noteworthy point was that the method has not been tested on mill scale, and so it needs development work.
2.5.3 Forced evaporation
ECC International has applied the technique of forced evaporation to the recovery of diluted coating colours, which have been studied using laboratory and pilot scale tests. The research system included a screening system, a stirred storage tank, a heat exchanger and a forced circulation design evaporator unit. In a typical experiment, the waste colour was screened, and then it was placed in the stirred tank and recirculated through the evaporator via the heat exchanger. The evaporator was operated at 5 to 10 kPa and 50 to 70 ºC. The apparatus ran continually until the desired solids lift had been achieved. The recovered colours could then be blended with fresh colour and used for their original duty with no significant decrease in performance (Skuse et al. 1999).
The capital cost of the mill-scale equipment is said to be relatively low, and since only very lowgrade heat is needed, a lot of the energy requirement of the process may be readily available in the paper mill. The process produces very clean water as a by-product, leaves no wastes requiring treatment, and can raise the solids level of the split colour to above 60%. In addition, the majority of the soluble components of the colour, such as thickeners, optical brightening agents and dispersants are also recovered (Phipps et al. 1998).
In the laboratory and pilot scale test at the ECC International Technicentre, the coating performance of the recovered colours was the same as that of the fresh material. The evaporation process had no effect on the efficiency of the optical brightening agents

29
used. Some changes in the viscosity of the recovered colours were observed, but once they were blended with fresh colour for the coating work no significant differences in viscosity or runnability were encountered (Phipps et al. 1998).
This method was not studied further in this study. One important reason for that was the fact that the method has not been tested on mill scale. The other reason was that there was no compelling need to raise the solid content of the recovered material when it is used as a filler in this case.
2.6 Ultrafiltration Ultrafiltration as a method is presented here, because it is state-of-the-art technology for handling diluted coating effluents, which is utilised in the paper mill where this study has been made. Ultrafiltration technology was not considered for the new recovery process, because in this case the need for thickening the recovered pigment slurry e.g. by ultrafiltration is not necessary when utilising it as a filler.
Ultrafiltration has recently been introduced for treating diluted coating effluent in order to reuse the concentrate in part of the coating colour. This effluent originates mainly from flushing of the coating stations and supply systems at web breaks, and there have been attempts to use these waters as fillers in the paper machine, often resulting in runnability problems (Nygård et al. 1998). Ultrafiltration is gaining widespread usage as a means of molecular separation and for the concentration of macromolecular solutions (Svarovsky 1990). Ultrafiltration has also been applied in the paper industry for the purpose of recycling a larger amount of the paper machine water, and thereby to reduce the water consumption in papermaking.
In ultrafiltration, the fraction remaining on the membrane, the concentrate, has a composition close to the original coating colour. The pore size range is from 0.001 to 0.1 micrometers, which allows separation of coating pigments, lattices, macromolecular compounds such as carbohydrates and other compounds forming anionic trash. Therefore the concentrate has lost small amounts of its low molecular weight dispersing agents, optical brightener and starch residues, if these materials include the coating colour. The permeate (filtrate water) that passes through the membrane contains some dissolved material. It can also be reused in the process. The quality of the permeate and the filtering capacity (flux) are dependent on the coating colour composition and temperature, and the pressure differential across the membrane (Nygård et al. 1998).
The ultrafiltration membranes are made of either ceramics or polymer materials and the cross-section of the pores is usually asymmetric, the pores being smallest at the surface of the membrane (Tiilikka 1997). Materials commercially made into membranes include cellulose nitrate, cellulose acetate, polysulfone, aramids, polyvinylidene fluoride, and acrylonitrile polymers and copolymers. Inorganic membranes of hydrous zirconium oxide deposited on a tubular carbon backing are also commercially available (Eykamp et al. 1987). There are different configurations for arranging the membranes into usable modules. These include a flat sheet ultrafilter made by Raisio Flootek, and a tubular one made by e.g. GAW, Cellier in full-scale industrial coating applications (Tiilikka 1997).
30
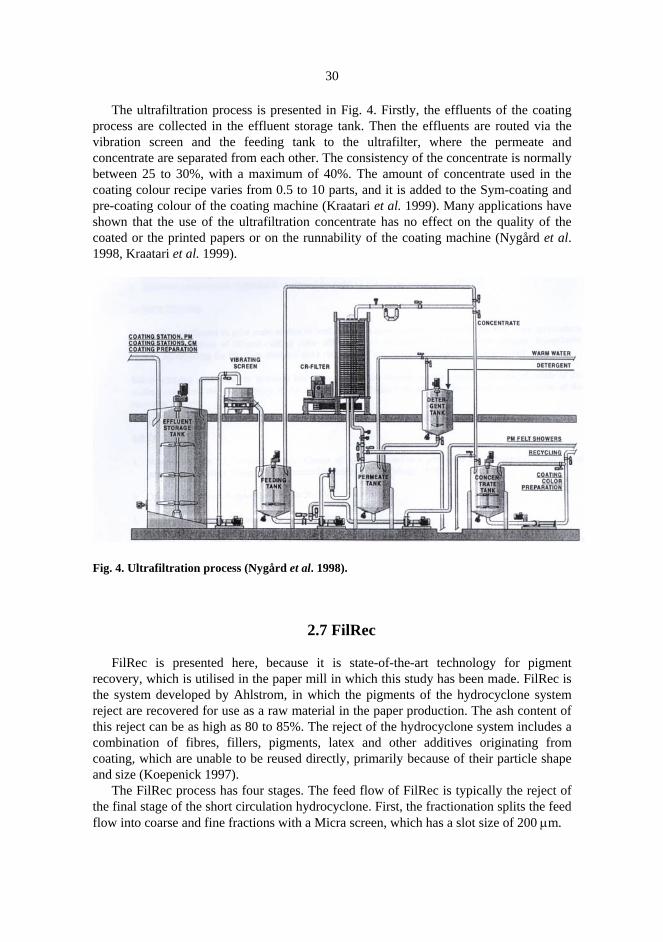
The ultrafiltration process is presented in Fig. 4. Firstly, the effluents of the coating process are collected in the effluent storage tank. Then the effluents are routed via the vibration screen and the feeding tank to the ultrafilter, where the permeate and concentrate are separated from each other. The consistency of the concentrate is normally between 25 to 30%, with a maximum of 40%. The amount of concentrate used in the coating colour recipe varies from 0.5 to 10 parts, and it is added to the Sym-coating and pre-coating colour of the coating machine (Kraatari et al. 1999). Many applications have shown that the use of the ultrafiltration concentrate has no effect on the quality of the coated or the printed papers or on the runnability of the coating machine (Nygård et al. 1998, Kraatari et al. 1999).
Fig. 4. Ultrafiltration process (Nygård et al. 1998).
2.7 FilRec
FilRec is presented here, because it is state-of-the-art technology for pigment recovery, which is utilised in the paper mill in which this study has been made. FilRec is the system developed by Ahlstrom, in which the pigments of the hydrocyclone system reject are recovered for use as a raw material in the paper production. The ash content of this reject can be as high as 80 to 85%. The reject of the hydrocyclone system includes a combination of fibres, fillers, pigments, latex and other additives originating from coating, which are unable to be reused directly, primarily because of their particle shape and size (Koepenick 1997).
The FilRec process has four stages. The feed flow of FilRec is typically the reject of the final stage of the short circulation hydrocyclone. First, the fractionation splits the feed flow into coarse and fine fractions with a Micra screen, which has a slot size of 200 µm.

31
The coarse fraction consists of stiff fibres and coarse solids, while the fine fractions contain mainly pigment flakes, filler and water. Secondly, the filler recovery stage classifies the solids according to particle size with an Ahlcleaner RB 77 Eliminator. The accept includes fine filler as particle size mainly below10 micrometers, which is returned to paper production as recovered filler. Pigment flakes and coarse filler are concentrated to 20 to 50% solid content and directed to the mineral dispersion stage. During dispersion the pigment flakes and coarse filler are subjected to turbulent shear forces. These forces, together with a crushing effect, break down the coarse particles. The pigment flakes and coarse filler particles are circulated in the dispersion loop, on average three to six times, until they are small enough to be accepted as fillers. However, a small outlet flow from the dispersion loop is taken with the coarse fraction from the Micra screen to be classified in the reject stage of the Ahlcleaner RB 77. From this stage re-useable fibres and fine fillers are returned to the paper production. Recovery of filler by Filrec is said not to have any effect on paper machine runnability or paper quality (Koepenick 1997).
3 Background of the problem This study applies to Stora Enso Oyj Fine Paper Oulu mill, which has a paper production capacity of 915 000 t/a (2003), making it one of the world’s biggest manufacturers of graphic paper. The paper mill covers about 4% of the global demand. The integrated mill consists of a fully bleached (ECF) softwood and hardwood producing pulp mill, two paper production lines: PM6 (start up in August 1991, rebuilt in 2001, production capacity: 515 000 t/a) and PM7 (start up in April 1997, production capacity: 400 000 t/a) and a sheeting plant. The paper mill produces multicoated fine paper under the product names LumiArt and LumiSilk. The low grammages from 90 to 118 g/m2 are produced in paper production line 7 and the heavy grammages from 130 to 250 g/m2 are produced in paper production line 6.
The subject mill of this study is located two kilometres from the town centre, at the mouth of the Oulujoki River. With a paper production capacity of 915 000 t/a, about 25 200 t/a (abs. dry) sludge from the paper mill effluent treatment is formed which would account for 55% of the landfill needs of the Oulu site, if all this sludge were transferred to the landfill. In recent years applications have been found for this sludge in land construction and in old landfill closing processes, but there was a need to find a more effective solution for ecological and economic reasons.
3.1 Possibility of using the recoverable material in multicoated fine paper production
The calculations for recovery and utilisation potential were evaluated at the beginning of this research work by using the recoverable material as a filler in base paper. The goal of this study is to use the recoverable solid material as a filler in paper production. Using the recoverable solid material in coating pigment is more challenging in terms of quality targets and the need for a higher dry solid content. The amounts of virgin filler used are less than the amounts of virgin coating pigment used, as is shown in Table 2. After it has proven that the recoverable material could be used as a filler, it will be possible to develop the recovery process later, so that the material could also be used in other applications such as in coating colour.
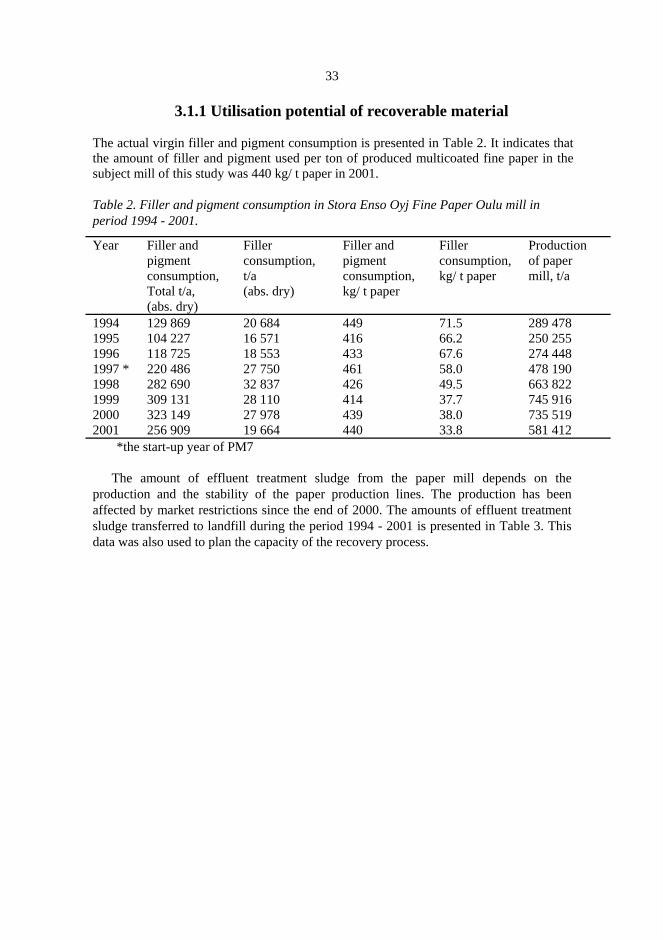
33
3.1.1 Utilisation potential of recoverable material The actual virgin filler and pigment consumption is presented in Table 2. It indicates that the amount of filler and pigment used per ton of produced multicoated fine paper in the subject mill of this study was 440 kg/ t paper in 2001. Table 2. Filler and pigment consumption in Stora Enso Oyj Fine Paper Oulu mill in period 1994 - 2001.
Year Filler and pigment consumption, Total t/a, (abs. dry)
Filler consumption, t/a (abs. dry)
Filler and pigment consumption, kg/ t paper
Filler consumption, kg/ t paper
Production of paper mill, t/a
1994 129 869 20 684 449 71.5 289 478 1995 104 227 16 571 416 66.2 250 255 1996 118 725 18 553 433 67.6 274 448 1997 * 220 486 27 750 461 58.0 478 190 1998 282 690 32 837 426 49.5 663 822 1999 309 131 28 110 414 37.7 745 916 2000 323 149 27 978 439 38.0 735 519 2001 256 909 19 664 440 33.8 581 412
*the start-up year of PM7
The amount of effluent treatment sludge from the paper mill depends on the production and the stability of the paper production lines. The production has been affected by market restrictions since the end of 2000. The amounts of effluent treatment sludge transferred to landfill during the period 1994 - 2001 is presented in Table 3. This data was also used to plan the capacity of the recovery process.
34
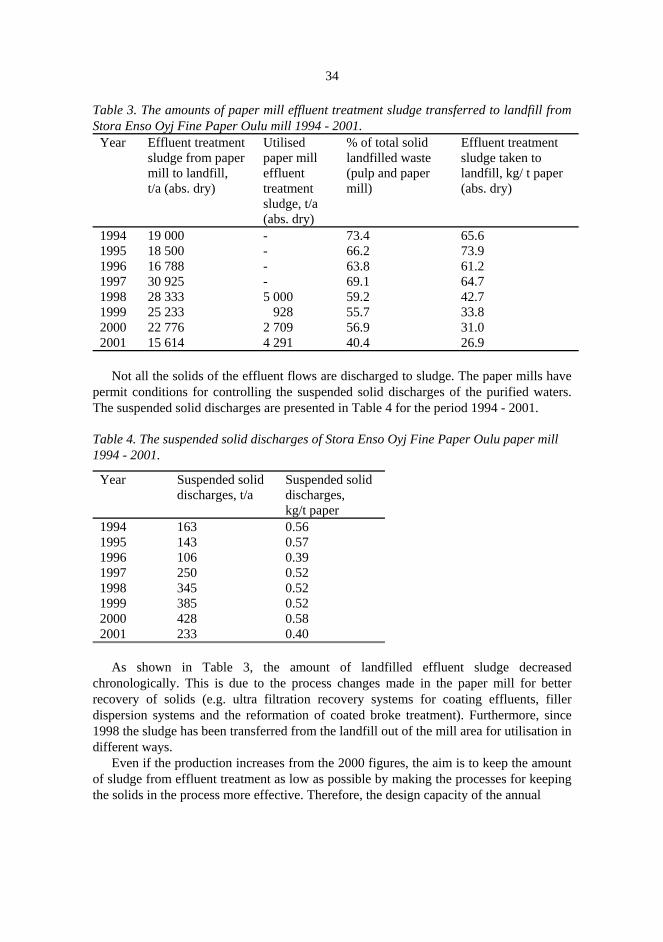
Table 3. The amounts of paper mill effluent treatment sludge transferred to landfill from Stora Enso Oyj Fine Paper Oulu mill 1994 - 2001.
Year Effluent treatment sludge from paper mill to landfill, t/a (abs. dry)
Utilised paper mill effluent treatment sludge, t/a (abs. dry)
% of total solid landfilled waste (pulp and paper mill)
Effluent treatment sludge taken to landfill, kg/ t paper (abs. dry)
1994 19 000 - 73.4 65.6 1995 18 500 - 66.2 73.9 1996 16 788 - 63.8 61.2 1997 30 925 - 69.1 64.7 1998 28 333 5 000 59.2 42.7 1999 25 233 928 55.7 33.8 2000 22 776 2 709 56.9 31.0 2001 15 614 4 291 40.4 26.9
Not all the solids of the effluent flows are discharged to sludge. The paper mills have
permit conditions for controlling the suspended solid discharges of the purified waters. The suspended solid discharges are presented in Table 4 for the period 1994 - 2001. Table 4. The suspended solid discharges of Stora Enso Oyj Fine Paper Oulu paper mill 1994 - 2001.
Year Suspended solid discharges, t/a
Suspended solid discharges, kg/t paper
1994 163 0.56 1995 143 0.57 1996 106 0.39 1997 250 0.52 1998 345 0.52 1999 385 0.52 2000 428 0.58 2001 233 0.40
As shown in Table 3, the amount of landfilled effluent sludge decreased
chronologically. This is due to the process changes made in the paper mill for better recovery of solids (e.g. ultra filtration recovery systems for coating effluents, filler dispersion systems and the reformation of coated broke treatment). Furthermore, since 1998 the sludge has been transferred from the landfill out of the mill area for utilisation in different ways.
Even if the production increases from the 2000 figures, the aim is to keep the amount of sludge from effluent treatment as low as possible by making the processes for keeping the solids in the process more effective. Therefore, the design capacity of the annual

35
effluent treatment sludge from the paper mill will be 25 200 t/a (abs. dry) which is an average of 70 t/d (abs. dry). The assumption that nearly half of the material in the effluent treatment sludge is recyclable means that 12 240 t/a (abs. dry) is reusable. If the ash content of the recoverable material is about 85%, it means that about 10 400 t/a (abs. dry) is suitable for recovery and use as a filler.
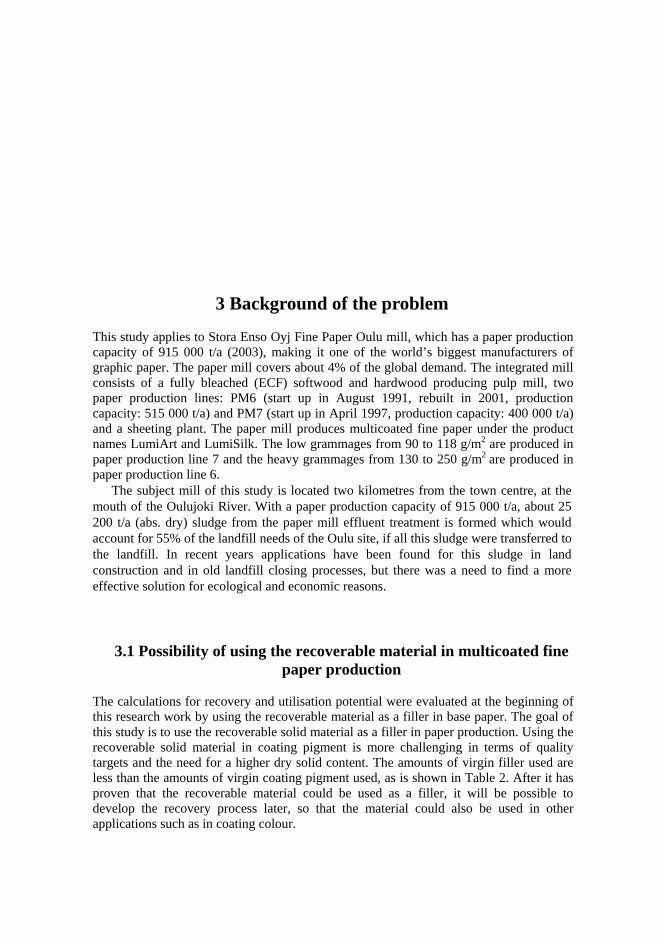
The operational stability of the new recovery process also depends on the production of both paper production lines and on the stock preparation. When there are any standstills in PM6 and/or PM7, the need for recycled material is lower and simultaneously, the input and output of the recovery process is also lower than average. Also, there are situations when there is no need even for using virgin filler, usually more often when producing the lowest grammages in each line, and when there is enough broke to achieve the ash targets of the paper product. The virgin filler dosage, kg/s (wet kilos; dry solid content 63.5%) by grammage of uncoated base paper in PM6 and PM7 is presented in Figs. 5 and 6. Virgin filler dosage has varied between 0 and 4 kg/s (wet) in PM6 and between 0 and 1 kg/s (wet) in PM7. According to these amounts, it is obvious that PM6 is the major user of the recovered pigment because of its bigger need for virgin filler.
00.5
11.5
22.5
33.5
44.5
70 90 110 130 150 170 190
Grammage, g/m2
Virg
in fi
ller d
osag
e, k
g/s
Fig. 5. Virgin filler dosage, kg/s (wet) by grammage of the base paper in PM6 before start-up of the pigment recovery process between 28 October 2000 and 28 February 2002.
36
0
0.2
0.4
0.6
0.8
1
1.2
46 51 56 61 66
Grammage, g/m2 (by online measurement)
Virg
in fi
ller d
osag
e, k
g/s
Fig. 6. Virgin filler dosage, kg/s (wet) by grammage of the base paper in PM7 before start-up of the pigment recovery process between 28 October 2000 and 28 February 2002.
3.1.2 Quality requirements of recyclable material
3.1.2.1 Quality requirements of present filler and pigment sources The target of this study is to develop and implement a recovery process, in which the recovered material is utilised as a filler in the production of the base paper of multicoated fine paper and in which the recovered material brings fillers and pigment back into the process. The uncoated base paper in the subject mill contains fillers and pigments, accounting for on average 21% in PM6 and 16% in PM7. The filler and pigments are added to the pulp mix also using the broke, which is a mix of uncoated and coated broke from the whole production line. In total, the typical amount of broke originating from between the paper machine and the winders is about 15% of sales production in multicoated fine paper mills, so the broke is an important raw material and source of filler and pigments for base paper.
In order to manage the use of broke, the following factors are normally controlled in multicoated fine paper mills: particle size (e.g. optimising broke pulper conditions and by the defibering and screening process), chemical conditions (the most important is to keep the pH optimal and stable in order to eliminate problems due to calcium carbonate precipitates or dissolution), microbiological activity and interfering substances (e.g. use of fixatives).
Virgin filler is also required to achieve the targets of the ash content of the base paper. Fillers are used in multicoated fine paper because they improve many paper properties such as opacity, smoothness, formation and dimension stability and they are also cheaper
37
than fibres. In the mill studied in this thesis calcium carbonate has been used as virgin filler in the form of chalk, which is from the soft sedimentary rock.
The characteristics of chalk are purity, porosity and fragility. Chalk is composed of the nano-fossils of sea organisms under light pressure and thus the elements of the original organisms are observable. The particle size of unrefined chalk is between 0.5 and 4 micrometers originating from hydrophytes and plankton and 10 to 100 µm of crayfish. The refining of the chalk comprises different kinds of refining, removing impurities such as china clay and calcium phosphate and sometimes bleaching (Krogerus et al. 1992).
Another type of calcium carbonate is also used in the paper industry: both limestone and marble can be refined for use as e.g. coating pigment. Limestone is composed of concrete sedimentary rock, on which the upper part of the bed has been deposited. In that case the nano-fossils have been broken and partly dissolved and re-crystallized, and the rock is therefore harder and porosity has decreased. Marble is metamorphosed limestone, which has re-crystallized and built very dense and hard calcite or dolomite crystals under high pressure and temperature (Krogerus et al. 1992).
The most important properties of the calcium carbonate used are purity, brightness (measured by SCAN-P 43:95 in this study), particle size distribution and abrasiveness. Normally, the CaCO3 content of chalks is 95 to 96% and the CaCO3 content of micro-calcite is 97 to 98% and the MgCO3 content is between 0.5 and 1%. The brightness of filler chalks commonly varies from 80 to 89%, but coating pigments such as micro-calcite, usually have a brightness of over 90%. The particle size distribution of chalk is about 40% of the proportion of the size below 2 micrometers, but for coating pigment purposes the proportion of below 2 micrometers size is typically over 90%. The abrasiveness tendency of calcites is higher than that of chalk: on the Mosh hardness scale calcites have a value of 3 and chalks a value of 1. Abrasiveness is an important factor for evaluating the durability of the plastic wires and dewatering elements of the paper machine. Abrasiveness depends practically on the origin, particle size and shape and impurities e.g. quartz. It is important that the proportion of the particles over 45 µm is low; for pure carbonates it is usually below 0.01% (Krogerus et al. 1992).
3.1.2.2 Quality requirements of recoverable material in different applications
If the recovered material is used for replacing filler in base paper of multicoated fine paper, the following properties are important: - Particle size. The majority, at least over 90% of the recovered material should mainly be below 45 micrometers in particle size. The particle size was measured by the wet sieving method used in the mill of this study (see Appendix 1.). - Ash content. The ash content of the recovered material should mainly be over 80% (measured by SCAN-P 40:40, the exception: burning temperature: 450 °C). - Dry solids. The dry solids content of the recovered material should mainly be over 2% (measured by SCAN-P 39-40).
38
- Microbiological activity should be controlled. - pH should be near 7 or up to it.
If the recovered material is to be used for replacing pigment in pre coating colour of multicoated fine paper, as could be the target in the future, the quality requirements will be much more demanding: - Particle size: The majority, at least over 95% of the recovered material should mainly be below 45 µm and the smaller particle sizes are preferred. - Ash content: The ash content of the recovered material should be over 85%. - Dry solids: The dry solids of the recovered material should be near 50% or over. - Microbiological activity should be controlled. - pH should be mostly above 7.0.
In order to get the recovered material working well in paper production, the mill personnel have to have a positive attitude towards recovery. Everyone must internalise that whatever they emit to the effluent treatment department, will come back to the process. All personnel have to take responsibility for taking care of the content of the wastewater flows of the paper mill. It is no longer allowed to emit any harmful material into the process wastewaters for recovery. On the other hand, people may not let the processes emit material to the effluent treatment department more easily than before, thinking that the recovery process will bring the emitted material back, because of increased energy and raw material requirements for recovery.
3.1.3 Utilisation of combustible rejects in energy production The recovery process separates and fractionates the solid matter from the effluent treatment sludge for utilising as paper filler. The aim is that the solid material residue, which is removed from the recoverable material, could be partly transferred with the thickened effluent treatment sludge of the paper mill by the truckload to the solid fuel boiler in the same mill area for combustion. It is possible to develop the recovery process further to recover the fibres from the residue for them better utilisation in paper production, but this is outside the scope of this study.
The economic efficiency of the combustion process depends on the ash content and dry solid content. The ash of the residue in the mill of this study contains mostly calcium carbonate, which partly replaces the need to use limestone to reduce sulphur emissions caused mostly by the use of peat as the fuel in energy production.
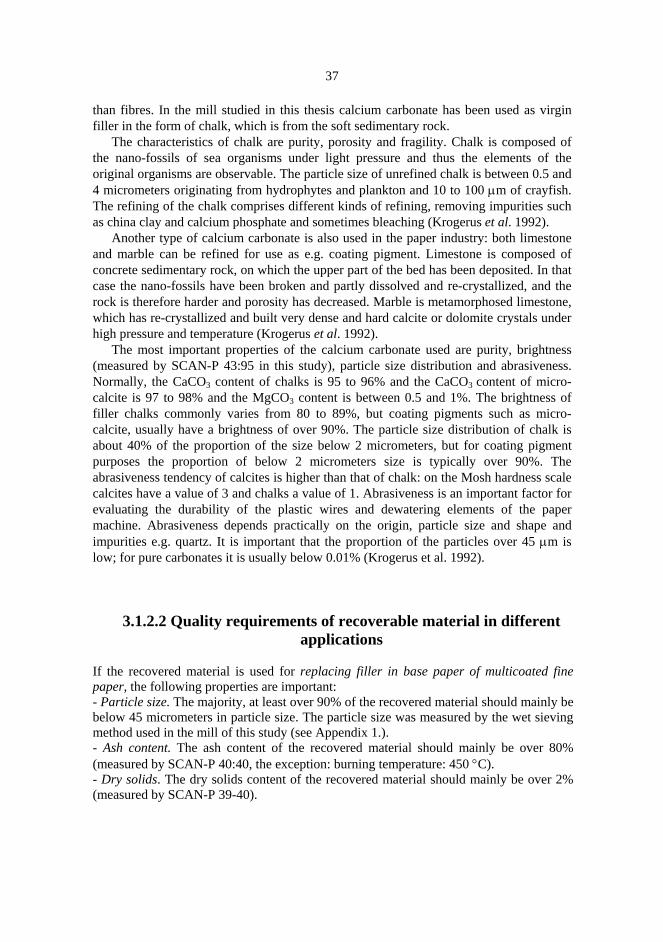
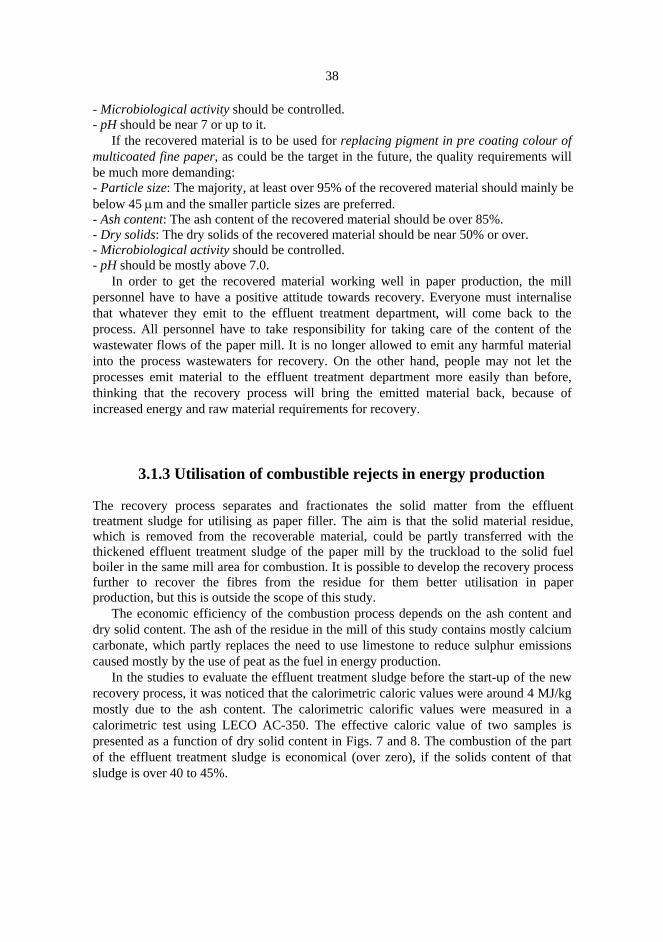
In the studies to evaluate the effluent treatment sludge before the start-up of the new recovery process, it was noticed that the calorimetric caloric values were around 4 MJ/kg mostly due to the ash content. The calorimetric calorific values were measured in a calorimetric test using LECO AC-350. The effective caloric value of two samples is presented as a function of dry solid content in Figs. 7 and 8. The combustion of the part of the effluent treatment sludge is economical (over zero), if the solids content of that sludge is over 40 to 45%.
39
-1
-0.5
0
0.5
1
1.5
2
33 40 45 50 55 60 65
Dry solid content, %
Effe
ctive
cal
oric
val
ue, M
J/kg
Fig. 7. The feed of the belt filter press: the dry solid content 7.5% -> the dry solid content (without polymer dosage) after the belt filter press: 33.0%, calorimetric caloric value: 4.7 MJ/kg, ash content: 75.6%. Sample taken 20 June 2000.
-1
-0.5
0
0.5
1
1.5
2
35 40 45 50 55 60 65
Dry solid content, %
Effe
ctive
cal
oric
val
ue, M
J/kg
Fig. 8. The feed of the belt filter press: dry solid content 17.8% -> the dry solid content (without polymer dosage) after belt filter press 35.0%, calorimetric caloric value: 4.2 MJ/kg, ash content: 77.6 %. Sample taken 22 June 2000.

40
The residue of the new recovery process, which is taken for combustion, will contain more combustible material (fibres) than the feed of the belt filter press before the recovery process. For that reason, the samples were taken without polymer dosage after the belt filter press, so the ash content of the web was as low after start-up of the recovery process as it could be.
3.2 Properties of different effluent flows There are many different effluent sources from the paper mill, which are handled in the effluent treatment department. These effluent flows are presented in Fig. 9. At the start of this study, the different flows were studied to evaluate the amount of solids they contained and to discover which flows are the most important for recovery. All the presented values are calculated as a monthly average for using the amounts directly in dimensioning the recovery process.
Ship unloading
Truck and train Pigment storage unloading area
Slurry pigment area
To river Effluent treatment department
Paper making line 6 Paper making line 7
Stock Stock preparation preparation
PM6 PM7
CM6 CM7
Ultrafiltration
Finishing 6 Finishing 7
Sheeting plant Workshop Clean cooling water
Oil trap well To riverRain water
Fiber containing canal effluents
Coating effluents of pump pit #1
Finishing effluents of pump pit #2
Clear filtrate
Rejects
Effluents of pump pit #4
Effluents of pump pit #5
Coating effluents of pump pit #1
Finishing effluents of pump pit #2
Fiber containing canal effluents
Rejects
Clear filtrate
Effluents of pump pit #3
Fig. 9. The sources of the different effluents to the effluent treatment department.

41
The clear filtrate from the disc filter of PM6 and PM7 is the largest flow in volume to be removed. Its dry solid content is low, but it also contains a considerable amount of soluble and colloidal material. The volume flows and the amount of solids are presented in Figs. 10 and 11.
0
2000
4000
6000
8000
10000
12000
14000
Jan/0
0
Apr/00
Jul/0
0
Oct/00
Jan/0
1
Apr/01
Jul/0
1
Oct/01
Jan/0
2
Apr/02
Jul/0
2
m3 /d
(av.
)
PM7PM6
Fig. 10. The volume flows of the clear filtrate [m3/d; monthly average] between January 2000 and September 2002.
0
0.5
1
1.5
2
2.5
3
Jan/0
0Apr/
00Ju
l/00
Oct/00
Jan/0
1Apr/
01Ju
l/01
Oct/01
Jan/0
2Apr/
02Ju
l/02
t/d (a
v.)
PM7PM6
Fig. 11. The amount of solids [t/d; monthly average] in the clear filtrate between January 2000 and September 2002.
The fibre-containing canal effluents consist of the effluents with the large flow volumes, which are presented in Fig. 12. These effluents originate from the wet end of the paper machine or stock preparation or pump pit #2. This water includes mainly fibres,

42
fillers and pigments and it has a high solid content so its solid waste load is notable. The amount of solids in these waters is from 20 to 120 t/d and the ash content varies between 52 to 78%, which can be seen in Figs. 13 and 14.
0100020003000400050006000700080009000
10000
Jan/00
Apr/00
Jul/00
Oct/00
Jan/01
Apr/01
Jul/01
Oct/01
Jan/02
Ap/02
Jul/02
m3/
d (a
v.)
Fig. 12. The volume flows of the fibre-containing canal effluents [m3/d; monthly average] between January 2000 and September 2002.
0
20
40
60
80
100
120
140
Jan/0
0Apr/
00Ju
l/00
Oct/00
Jan/0
1Apr/
01Ju
l/01
Oct/01
Jan/0
2Apr/
02Ju
l/02
t/d (a
v.)
Fig. 13. The amount of solids [t/d; monthly average] in the fibre-containing canal effluents between January 2000 and September 2002.

43
40
45
50
55
60
65
70
75
80
Jan/0
0Apr/
00Ju
l/00
Oct/00
Jan/0
1Apr/
01Ju
l/01
Oct/01
Jan/0
2Apr/
02Ju
l/02
ash
cont
ent,
%
Fig. 14. The ash content [%; monthly average] of the fibre-containing canal effluents between January 2000 and September 2002.
Coating effluents from pump pit #1 contains all the effluents from coating machines
CM6 and CM7 and it includes all the components used in the coating colour, mainly latexes and pigments. The volume flows are between 1 500 and 3 000 m3/d (monthly average), which is presented in Fig. 15. There is the ultrafiltration for diluted coating effluents in coating kitchen of CM7.
Coating effluent looks white and does not possess good settling properties because of e.g. the dispersion agents used. Coating effluent has a high solid content and the amount of solids in coating effluents from pump pit #1 varies from 10 to 30 t/d (monthly average), which is presented in Fig. 16. The ash content is relatively high, which is shown in Fig. 17.
44
0
500
1000
1500
2000
2500
3000
3500
Jan/0
0
Apr/00
Jul/0
0
Oct/00
Jan/0
1
Apr/01
Jul/0
1
Oct/01
Jan/0
2
Apr/02
Jul/0
2
m3 /d
(av.
)
PM7PM6
Fig. 15. The volume flows of the coating effluents from pump pit #1 [m3/d; monthly average] between January 2000 and September 2002.
0
5
10
15
20
25
30
35
Jan/0
0
Apr/00
Jul/0
0
Oct/00
Jan/0
1
Apr/01
Jul/0
1
Oct/01
Jan/0
2
Apr/02
Jul/0
2
t/d (a
v.)
PM7PM6
Fig. 16. The amount of solids in the coating effluents from pump pit #1 [t/d; monthly average] between January 2000 and September 2002.
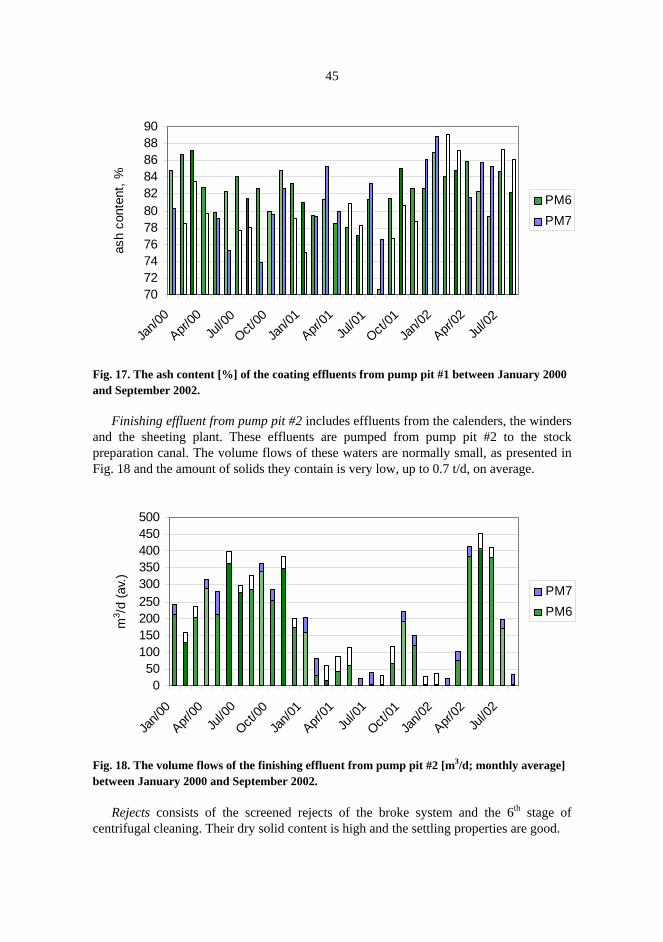
45
7072747678808284868890
Jan/0
0Apr/
00Ju
l/00
Oct/00
Jan/0
1Apr/
01Ju
l/01
Oct/01
Jan/0
2Apr/
02Ju
l/02
ash
cont
ent,
%
PM6PM7
Fig. 17. The ash content [%] of the coating effluents from pump pit #1 between January 2000 and September 2002.
Finishing effluent from pump pit #2 includes effluents from the calenders, the winders and the sheeting plant. These effluents are pumped from pump pit #2 to the stock preparation canal. The volume flows of these waters are normally small, as presented in Fig. 18 and the amount of solids they contain is very low, up to 0.7 t/d, on average.
050
100150200250300350400450500
Jan/0
0
Apr/00
Jul/0
0
Oct/00
Jan/0
1
Apr/01
Jul/0
1
Oct/01
Jan/0
2
Apr/02
Jul/0
2
m3 /d
(av.
)
PM7PM6
Fig. 18. The volume flows of the finishing effluent from pump pit #2 [m3/d; monthly average] between January 2000 and September 2002.
Rejects consists of the screened rejects of the broke system and the 6th stage of
centrifugal cleaning. Their dry solid content is high and the settling properties are good.

46
The volume flows are not very high, as seen in Fig. 19. The amount of solids in the rejects varies between 10 and 40 t/d, so they are significant, see Fig. 20. The ash content can be as high as 85% within the range of 55 to 85%, which is shown in Fig. 21.
0100200300400500600700800900
1000
Jan/0
0
Apr/00
Jul/0
0
Oct/00
Jan/0
1
Apr/01
Jul/0
1
Oct/01
Jan/0
2
Apr/02
Jul/0
2
m3 /d
av. PM7
PM6
Fig. 19. Reject volumes [m3/d; monthly average] between January 2000 and September 2002.
05
101520253035404550
Jan/00
Apr/00
Jul/00
Oct/00
Jan/01
Apr/01
Jul/01
Oct/01
Jan/02
Apr/02
Jul/02
t/d a
v. PM7PM6
Fig. 20. The amount of solids in the rejects [t/d, monthly average] between January 2000 and September 2002.

47
45505560657075808590
Jan/00
Apr/00
Jul/00
Oct/00
Jan/01
Apr/01
Jul/01
Oct/01
Jan/02
Apr/02
Jul/02
ash
cont
ent,
%
PM6PM7
Fig. 21. The ash content in the rejects, [%, monthly average] between January 2000 and September 2002.
The effluents from pump pit #3 contain the effluents of the slurry pigment area. These waters mainly contain pigments and some dispersion agents. The colour is white and their solid content can occasionally be high. The volume flows and the solid amounts of the effluents from pump pit #3 are presented in Figs. 22 and 23.
0
10
20
30
40
50
60
70
80
Jan/0
0
Apr/00
Jul/0
0
Oct/00
Jan/0
1
Apr/01
Jul/0
1
Oct/01
Jan/0
2
Apr/02
Jul/0
2
m3 /d
av.
Fig. 22. The volume flows of the effluents from pump pit #3 [m3/d, monthly average] between January 2000 and September 2002.

48
0
0.5
1
1.5
2
2.5
3
Jan/0
0
Apr/00
Jul/0
0
Oct/00
Jan/0
1
Apr/01
Jul/0
1
Oct/01
Jan/0
2
Apr/02
Jul/0
2
t/d a
v.
Fig. 23. The amount of solids in the effluents from pump pit #3 [t/d, monthly average] between January 2000 and September 2002.
The effluents from pump pit #4 include the effluents from the truck and train unloading points. They also include the rinsing waters of the raw material transport containers, which are unloaded in the mill area. The volume flows of these waters are 60 to 80 m3/d on a monthly average, and the amount of solids to effluent treatment are not monitored daily.
The effluents from pump pit #5 contain the effluents from the pigment storage area, which originate from the washing of the tanks and the overflows. The waters from the unloading of the shipments are also pumped to pump pit#5. The volumes and the amount of solids of these waters are not monitored daily.
Because there are so many significant sources of solid material in the effluents, it was decided at the beginning of this study to collect all these flows in the effluent treatment department as it is at present and to handle the effluent sludge in the new pigment recovery process. This would achieve the biggest benefit from the new solid recovery process.
The total solid amount [t/d av.] going to the effluent treatment department in the studied paper mill is presented in Fig. 24. The calculation is made using the monthly averages of all the other effluents, apart from pump pit #4 and pump pit #5, where the solids are not monitored daily.
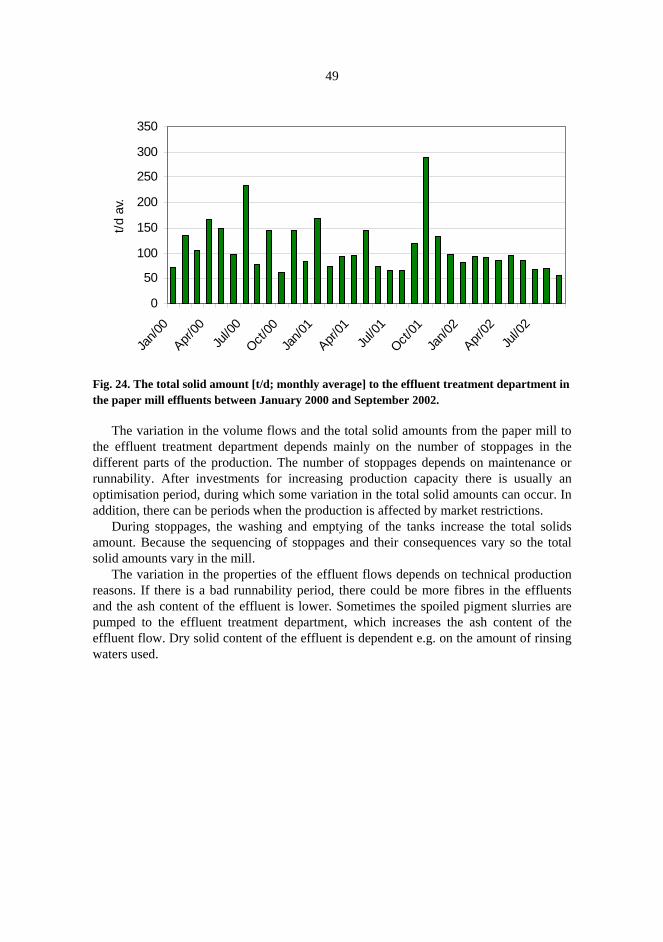
49
0
50
100
150
200
250
300
350Ja
n/00
Apr/00
Jul/0
0Oct/
00Ja
n/01
Apr/01
Jul/0
1Oct/
01Ja
n/02
Apr/02
Jul/0
2
t/d a
v.
Fig. 24. The total solid amount [t/d; monthly average] to the effluent treatment department in the paper mill effluents between January 2000 and September 2002.
The variation in the volume flows and the total solid amounts from the paper mill to the effluent treatment department depends mainly on the number of stoppages in the different parts of the production. The number of stoppages depends on maintenance or runnability. After investments for increasing production capacity there is usually an optimisation period, during which some variation in the total solid amounts can occur. In addition, there can be periods when the production is affected by market restrictions.
During stoppages, the washing and emptying of the tanks increase the total solids amount. Because the sequencing of stoppages and their consequences vary so the total solid amounts vary in the mill.
The variation in the properties of the effluent flows depends on technical production reasons. If there is a bad runnability period, there could be more fibres in the effluents and the ash content of the effluent is lower. Sometimes the spoiled pigment slurries are pumped to the effluent treatment department, which increases the ash content of the effluent flow. Dry solid content of the effluent is dependent e.g. on the amount of rinsing waters used.
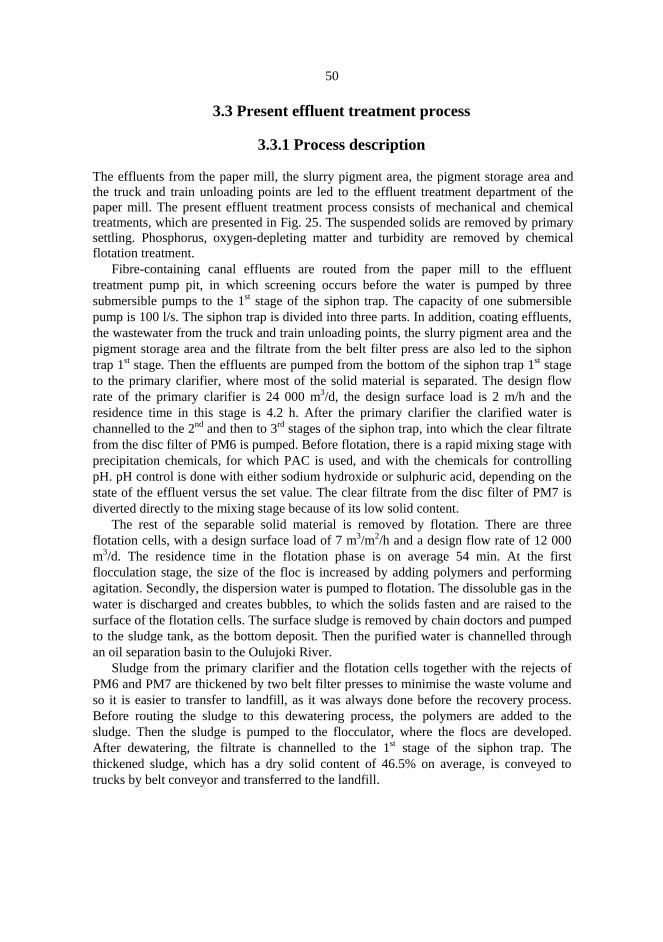
50
3.3 Present effluent treatment process
3.3.1 Process description The effluents from the paper mill, the slurry pigment area, the pigment storage area and the truck and train unloading points are led to the effluent treatment department of the paper mill. The present effluent treatment process consists of mechanical and chemical treatments, which are presented in Fig. 25. The suspended solids are removed by primary settling. Phosphorus, oxygen-depleting matter and turbidity are removed by chemical flotation treatment.
Fibre-containing canal effluents are routed from the paper mill to the effluent treatment pump pit, in which screening occurs before the water is pumped by three submersible pumps to the 1st stage of the siphon trap. The capacity of one submersible pump is 100 l/s. The siphon trap is divided into three parts. In addition, coating effluents, the wastewater from the truck and train unloading points, the slurry pigment area and the pigment storage area and the filtrate from the belt filter press are also led to the siphon trap 1st stage. Then the effluents are pumped from the bottom of the siphon trap 1st stage to the primary clarifier, where most of the solid material is separated. The design flow rate of the primary clarifier is 24 000 m3/d, the design surface load is 2 m/h and the residence time in this stage is 4.2 h. After the primary clarifier the clarified water is channelled to the 2nd and then to 3rd stages of the siphon trap, into which the clear filtrate from the disc filter of PM6 is pumped. Before flotation, there is a rapid mixing stage with precipitation chemicals, for which PAC is used, and with the chemicals for controlling pH. pH control is done with either sodium hydroxide or sulphuric acid, depending on the state of the effluent versus the set value. The clear filtrate from the disc filter of PM7 is diverted directly to the mixing stage because of its low solid content.
The rest of the separable solid material is removed by flotation. There are three flotation cells, with a design surface load of 7 m3/m2/h and a design flow rate of 12 000 m3/d. The residence time in the flotation phase is on average 54 min. At the first flocculation stage, the size of the floc is increased by adding polymers and performing agitation. Secondly, the dispersion water is pumped to flotation. The dissoluble gas in the water is discharged and creates bubbles, to which the solids fasten and are raised to the surface of the flotation cells. The surface sludge is removed by chain doctors and pumped to the sludge tank, as the bottom deposit. Then the purified water is channelled through an oil separation basin to the Oulujoki River.
Sludge from the primary clarifier and the flotation cells together with the rejects of PM6 and PM7 are thickened by two belt filter presses to minimise the waste volume and so it is easier to transfer to landfill, as it was always done before the recovery process. Before routing the sludge to this dewatering process, the polymers are added to the sludge. Then the sludge is pumped to the flocculator, where the flocs are developed. After dewatering, the filtrate is channelled to the 1st stage of the siphon trap. The thickened sludge, which has a dry solid content of 46.5% on average, is conveyed to trucks by belt conveyor and transferred to the landfill.
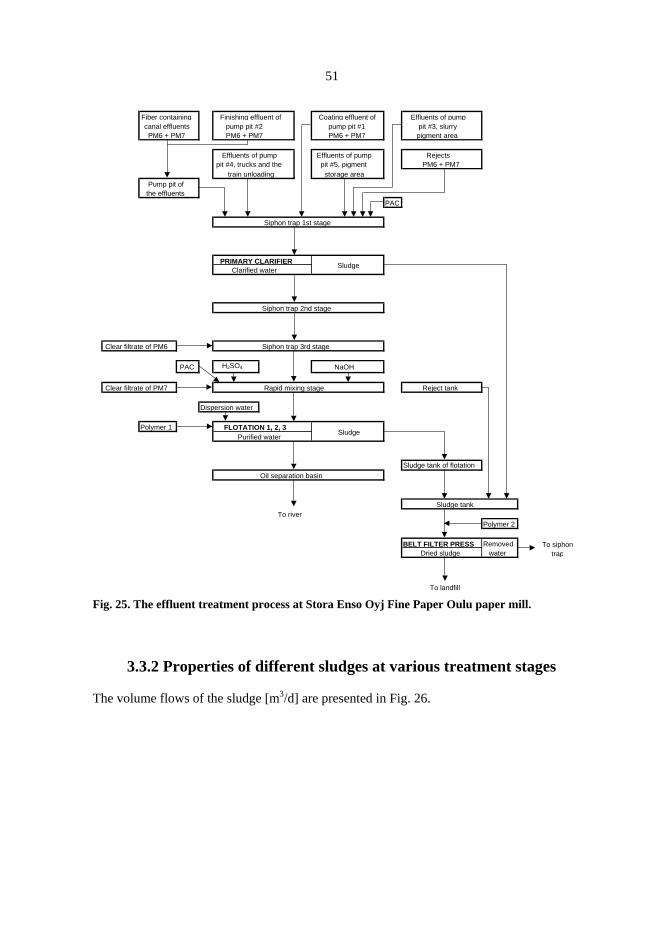
51
Fiber containing Finishing effluent of Coating effluent of Effluents of pump canal effluents pump pit #2 pump pit #1 pit #3, slurry PM6 + PM7 PM6 + PM7 PM6 + PM7 pigment area
Effluents of pump Effluents of pump Rejects pit #4, trucks and the pit #5, pigment PM6 + PM7 train unloading storage area
Pump pit of the effluents
PAC
Siphon trap 1st stage
PRIMARY CLARIFIER Clarified water
Siphon trap 2nd stage
Clear filtrate of PM6 Siphon trap 3rd stage
PAC H2SO4 NaOH
Clear filtrate of PM7 Rapid mixing stage Reject tank
Dispersion water
Polymer 1 FLOTATION 1, 2, 3 Purified water
Sludge tank of flotationOil separation basin
Sludge tank To river
Polymer 2
BELT FILTER PRESS Removed Dried sludge water
To landfill
To siphontrap
Sludge
Sludge
Fig. 25. The effluent treatment process at Stora Enso Oyj Fine Paper Oulu paper mill.
3.3.2 Properties of different sludges at various treatment stages The volume flows of the sludge [m3/d] are presented in Fig. 26.
52
0200400600800
1000120014001600
Nov/00
Jan/0
1Ma/0
1
May/01
Jul/0
1
Sep/01
Nov/01
Jan/0
2Ma/0
2
May/02
Jul/0
2
Sep/02
m3/
d av
.
from primary clarifier from flotation (1 and 2)from flotation (3) from reject collection tank
Fig. 26. The origin of sludge and its volume flows [m3/d, monthly av.].
The study of the particle sizes by wet sieving, dry solid content and ash content of the treatment sludge of the primary clarifier and flotation and the reject of both paper production lines is presented in Table 5. Table 5. Properties of the sludge- samples dated 9 May 2000 (=1) and 17 May 2000 (=2). Sludge from
primary clarifier Sludge from flotation (surface)
Sludge from flotation (bottom)
Rejects from PM6
Rejects from PM7
1. 2. 1. 1. 1. 2. 1. 2. Dry solid content, %
1.6 21.5 1.6 2.1 5.6 7.9 11.3 0.95
Ash content, %
81.1 86.1 58.1 73.0 84 83.7 82.4 55.7
Particle size: Share of solids, %
>500 µm 2.0 7.3 3.0 3.2 1.0 3.9 4.9 14.0 >160 µm 3.2 4.3 4.1 2.9 6.8 11.1 5.4 23.4 >80 µm 2.5 2.8 6.3 4.8 1.4 1.5 17.5 1.1 >45 µm 7.3 7.3 15.4 11.9 9.4 11.8 24.9 3.4 >32 µm 4.9 5.2 13.1 9.3 17.1 12.9 9.9 5.4 <32 µm 80.0 73.1 58.1 67.9 64.3 58.8 37.4 52.7
53
As can be seen in Table 5, the dry solid content of the sludge from the primary clarifier and rejects varied a lot, which was also true for the other sludges. The properties of the sludge depend on the position in paper production and they vary according to these changes. Based on the results of particle sizes, the most valuable sludge for recovery pigments was the sludge from the primary clarifier, because it contained mostly material with a particle size that was small enough and an ash content high enough to replace fillers or pigments in paper production.
3.4 Properties of sludge transferred to landfill and its present applications
Laboratory studies have been done on effluent treatment sludge to establish the possibility of re-using it in different applications.
The study of the effluent treatment sludge sample is presented in Table 6. It can be seen that the material, which is left on a sieve of 500 µm or 250 µm, consists mainly of combustible material. The material, which was left on a sieve of 160 µm or 125 µm, consists of nearly 50% combustible material. On the other hand, the material left on other smaller sieves consists mainly of ash. Table 6. Effluent treatment sludge sample taken on 20 January 2000 and 14 April 2000. The newer sample was studied at the Metso Inkeroinen research centre and the sieve sizes differ from the Oulu sieve series (the sizes of the sieves used are mentioned). 20 January 2000: 14 April 2000: Particle size, µm
Share of the size, %
Ash content, %
Combustible material content, %
Particle size, µm
Share of the size, %
Ash content, %
Combus-tible material content, %
>500 4.4 18.2 81.8 >250 4.9 12.7
87.3
>160 4.0 48.0 52.0 >125 1.2 56.5
43.5
>80 2.3 76.8 23.2 >80 3.0 82.7 17.3 >45 5.8 84.2 15.8 >45 10.1 82.8 17.2 >32 2.5 84.4 15.6 <45 80.8 84.8 15.2 <32 81 84.9 15.1 Σ100 Σ100
The total amount of dewatered sludge was 54 000 wet t in 2000. Since 1998 the effluent treatment sludge from the paper mill at the mill of this study was utilised outside of the mill in groundwork and it is suitable for compacting and surface coating for old landfills. The amounts are presented in Table 3 (see Chapter 3.1.1.).
54
3.5 Results of the evaluation of a concept for recovering material from effluent treatment sludge
The recovery process was named the ECO plant process at the start of 2001. The concept of recovering material from the effluent treatment sludge was evaluated at the beginning of 2001. The evaluation was also made in a workshop (17 participants, three groups). The groups consisted of engineers, technicians and operators from the production department and members of the ECO plant project. The aim of this analysis was to find failures, which would affect primarily the quality of the product and/or because of which the next process stage would be disrupted. Both the causes and the consequences of the failures were evaluated. The information obtained was used in process planning.
In this case four sectors were concerned. There were failures with collecting effluent flows and the process stages prior to that; failures in effluent treatment; failures using the produced ECO pigment in paper production; and finally failures in handling the rejects and their combustion. Below only the major failures that needed resolving or the awareness-raising in each section, are presented.
In collecting the effluents, the failures could be as follows: At first, the collected material could contain unwanted material such as tape, metals, plastic, pieces of felt and wire, which is why separation for these objects would be needed. This unwanted material, if it is not separated effectively, can build up as dirt in the equipment and in the paper and cause runnability and abrasion problems. For to control the function of the separation phases, the particle sizes and ash content will be measured from a daily sample. Secondly, a possible failure could be a microbiological problem, unless this fact is perceived. The effluents include nutrients and favourable conditions for growing bacteria, fungus and moulds. Due to microbe activity, the pH may fall and the runnability and dirt problems may increase in paper production. Sometimes the raw materials, or a mix of them, can be spoiled because of the microbes in the paper mill, and these effluents are channelled to the effluent treatment. The microbe load in this case may be quite high. So effective microbe control is needed for ECO pigment in order to prevent microbe-based problems. The planned process should be flexible to changes in the fibre/pigment ratio of the feed. Changes in the volume flows to effluent treatment could be high, if e.g. the stoppages begin at the same time in both paper production lines. Therefore it is important that the developed ECO plant is separated from the effluent treatment process, and it can be used as required.
The raw material of the ECO plant process is produced in the effluent treatment department. If there are any mechanical failures in effluent treatment, the production of ECO pigment will be stopped. So, it should be possible to use other alternative fillers, if there are situations where ECO pigment cannot be produced. The composition and the dry solid content of the feed varies a lot, so the ECO plant process should be flexible, which should be taken into account when planning the process and selecting the equipment.
The risks in using ECO pigment were seen as a fear of increasing web defects in the base paper. This can be prevented by an effective separation and fractionating process and microbe control in the ECO plant and using an effective fixing system in the paper mill. It was known that when producing low grammages with high broke dosages there is

55
no need for ECO pigment or virgin filler. So some buffer capacity in the form of a storage tank is required.
The most notable failure in handling the rejects and their combustion is too low a dry solid content after the belt filter press, which could be caused by a disruption in polymer dosage or insufficient press load for the composition of the sludge or changes in the dry solid content or amount of feed of the belt filter press. The consequences of too low a sludge dry solid content could be the disruption in dosing it to the solid fuel boiler. So every sludge load should be checked by visual observation before transferring the truckload to the solid fuel boiler. If the thickened sludge looks wet it should be transferred to the landfill.
4 Principles of the ECO plant process and process equipment
The objective of the ECO plant process is to demonstrate an ecological and economic system. The natural resources are better utilised by this recovery process, because the recoverable material is taken from the effluent treatment sludge of the paper mill, which was earlier mainly landfilled after thickening. The product of the ECO plant is a separated and fractionated, mostly pigment containing sludge called ECO pigment, and the residue consists of pigments and mainly organic rejected sludge. Pigment sludge is used as a filler in paper machines for reducing virgin filler consumption.
4.1 Driving forces
The following list includes the driving forces behind this work and reasons for undertaking it:
1. Ecological point of view. There is a compelling reason for coated paper producing mills to decrease the landfill load due to tighter public regulations. Furthermore, Stora Enso Oyj itself is committed to developing its business towards ecological, social and economic sustainability.
The Oulu mill has its own industrial landfill for normal industrial waste in the mill area. Reducing the major discharges, i.e. the effluent treatment sludge from the paper mill, to the landfill, is an effective way to increase the chances of using their own landfill for a longer period before it becomes full.
When the recoverable part of the effluent treatment sludge is separated for re-using, the residual sludge contains a lot of organic, combustible material, which could be combusted to minimise the volume of solid waste.
2. Economic point of view. The amount of filler and pigment in wood-free multicoated fine paper is nearly one half and also the majority of the solids in effluent treatment sludge is pigment and filler material. If this material could be recovered from the effluent treatment sludge and reused as a filler in the multicoated fine paper producing process without any problems in paper quality in the form of web defects, this would mean savings in filler consumption.

57
3. Technological point of view. The most important place to minimise sludge waste is in the process stage where it originates. State-of-art technology such as ultra filtration recovery systems for coating effluents and filler dispersion systems have already been utilised in the mill of this study and the mill has had good experiences with all of these systems. Both of the mentioned recovery processes were invested in at the end of 1990’s, because there was a need for better utilisation of solid waste due to increased production capacity. However, this is not sufficient to get all the re-useable solid material back into the process.
Due to the number of different effluent flows being routed to effluent treatment, a separate recovery process for each of them would have been too complicated and expensive. In this case, it was kept in mind during the planning process and when selecting process equipment that there may not be a need for additional production personnel due to the new process. The targets were to collect all the flows containing solid waste together, as currently in the effluent treatment department, to keep the effluent treatment process as before to minimise risks and to develop and build a separate solid recovery process which could handle the sludge from the effluent treatment process and fibre-containing rejects from paper machines and to recover solids for reuse as a filler in a wood-free multicoated paper production. The reject of the new process will consist of fibres in addition to other debris with larger particle size. Fibres can be chosen to be utilised in the mill’s own paper production or for other purposes (e.g. recycled paper) in the future, which should also be considered, when selecting the separation process for a new pigment recovery process.
4.2 Preliminary assumptions When the research work was started, some assumptions had to be made in this research to keep it in reasonable proportions. The following assumptions and arguments lie behind this research:
1. In spite of treating the whole effluent treatment sludge, which consists of all kinds of solid waste of the paper mill, it is possible to recover material, which could be used as raw material in a multicoated fine paper producing process.
2. The process could be implemented by selecting suitable mechanical separating and fractionating equipment, which is available on the market.
3. It is possible to carry out the process without the necessity of changing the function of the present processes so that they could also work without a new recovery process.
4. The residue of the recovery process containing combustible material could be burnt in the solid fuel boiler in the power plant inside the mill area, in which other solid fuel such as peat and bark waste is used. The residue consists of CaCO3 and it has a similar effect to the use of the limestone in the combustion process, which is commonly used as sulphur binder. The total amount of sludge from the effluent treatment of the paper mill was combusted experimentally in the solid fuel boiler during M.Sc. thesis and the effects of the combustion of sludge containing calcium carbonate as a sulphur binder were observed (Pitkänen 1999).

58
4.3 Hypothesis This research was based on the following main hypotheses:
1. The developed ECO plant process could recover the useful material from the effluent treatment sludge using appropriate separating and fractioning techniques. The product of the ECO plant process consists of over 90% of material, which has a particle size of below 45 µm measured by wet sieving. Its ash content is mainly over 80%, and so the recovery process recovers the filler and pigment from the effluent treatment sludge.
2. The recovered solids can be used as a filler in a wood-free multicoated paper production process. The recovered material must not have any detrimental effects on the quality of the paper in the form of web defects, because the particle size and microbiological statement are controlled.
3. Because of the more effective use of raw material with the ECO plant process, virgin filler consumption is decreased and this increases the ecological significance of the ECO plant.
4. Residual sludge can be combusted in the solid fuel boiler, which uses mainly bark and peat as its fuel.
4.4 Viewpoints for selecting the separation process The first step in the selection of a separation process is to define the problem (Null 1987). The objective of this study is to develop a separation process for utilising pigments from the effluent sludge. The kind of material to be handled in the recovery process was clarified by studies on exploitable sludge and the background of the situation (see Chapter 3). It was clear that the sludge consists both of fibrous material and larger coating particles, separate pigments, and pigment clumps. However, the effluent sludge consists mainly of the pigments used in paper production, which should be separated from other bigger components (e.g. fibres, larger coating particles) and particle size distribution should be low enough that the recovered material can be used in paper production.
The second essential step is to determine which separation methods are capable of accomplishing the separation successfully. In order for two components to be separated, there must be some difference in properties between them. The objective of the design of the separation process is to exploit the property differences in the most economical manner to accomplish the separation (Null 1987).
The following properties are used as the bases in selecting separation processes: state of the handled materials, properties of the separable materials, composition of the feed and its concentrations, purity requirements of the product, the amounts of the handled material, temperature resistance of the materials, corrosion tendency of the materials and pollutant tendency of the materials. If the phases of the separable materials are different, it is often possible to use mechanical separation operations (Hurme 1995).
The scale of operation is often the determining economic factor in the selection between alternative separation processes. Any separation process chosen must be compatible with the scale of the operation of the commercial plant. While it is common to
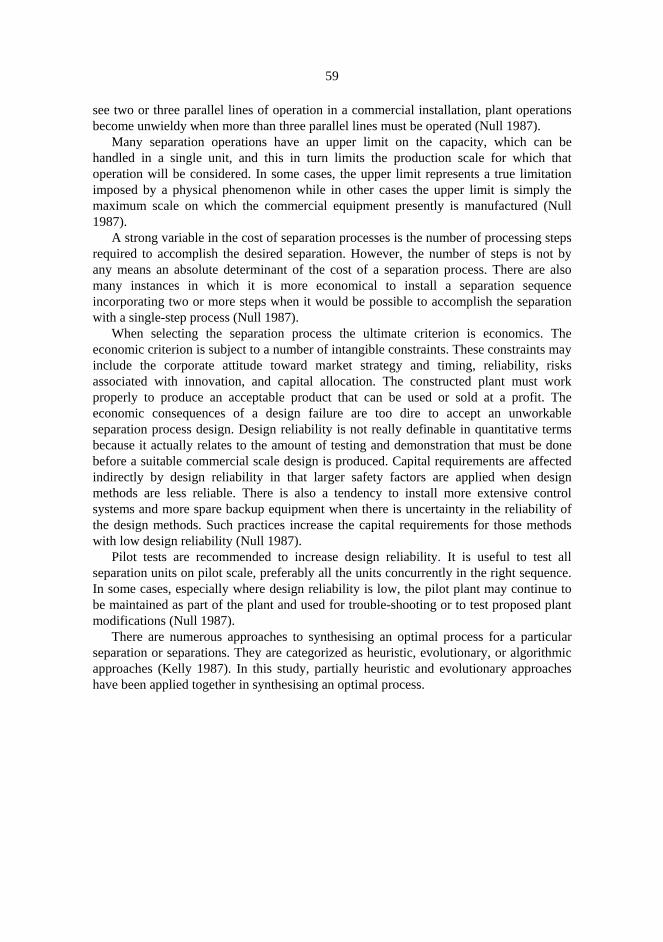
59
see two or three parallel lines of operation in a commercial installation, plant operations become unwieldy when more than three parallel lines must be operated (Null 1987).
Many separation operations have an upper limit on the capacity, which can be handled in a single unit, and this in turn limits the production scale for which that operation will be considered. In some cases, the upper limit represents a true limitation imposed by a physical phenomenon while in other cases the upper limit is simply the maximum scale on which the commercial equipment presently is manufactured (Null 1987).
A strong variable in the cost of separation processes is the number of processing steps required to accomplish the desired separation. However, the number of steps is not by any means an absolute determinant of the cost of a separation process. There are also many instances in which it is more economical to install a separation sequence incorporating two or more steps when it would be possible to accomplish the separation with a single-step process (Null 1987).
When selecting the separation process the ultimate criterion is economics. The economic criterion is subject to a number of intangible constraints. These constraints may include the corporate attitude toward market strategy and timing, reliability, risks associated with innovation, and capital allocation. The constructed plant must work properly to produce an acceptable product that can be used or sold at a profit. The economic consequences of a design failure are too dire to accept an unworkable separation process design. Design reliability is not really definable in quantitative terms because it actually relates to the amount of testing and demonstration that must be done before a suitable commercial scale design is produced. Capital requirements are affected indirectly by design reliability in that larger safety factors are applied when design methods are less reliable. There is also a tendency to install more extensive control systems and more spare backup equipment when there is uncertainty in the reliability of the design methods. Such practices increase the capital requirements for those methods with low design reliability (Null 1987).
Pilot tests are recommended to increase design reliability. It is useful to test all separation units on pilot scale, preferably all the units concurrently in the right sequence. In some cases, especially where design reliability is low, the pilot plant may continue to be maintained as part of the plant and used for trouble-shooting or to test proposed plant modifications (Null 1987).
There are numerous approaches to synthesising an optimal process for a particular separation or separations. They are categorized as heuristic, evolutionary, or algorithmic approaches (Kelly 1987). In this study, partially heuristic and evolutionary approaches have been applied together in synthesising an optimal process.

60
Process synthesis researchers have stated a number of heuristic rules, which can be of considerable aid in guiding the selection of the near optimum or base case and for systematically choosing those alternate sequences to be investigated. Some of the heuristic rules developed will be competing and in some cases even contradictory, but nevertheless they do serve to reduce the enormous amount of work that would be involved in evaluating all possible separation sequences (Null 1987).
Among the more widely accepted heuristics for selection of separation processes (Kelly 2003, Hurme 1995) the following are presented, which were also utilised in selecting the separation process of this study.
1. Always attempt to reduce the separation load. Mixing and dividing the process streams are relatively inexpensive steps as long as no component separation is required. It is usually better to blend two streams consisting of similar material and separate the species of interest than to treat each stream independently. 2. Use separation operations, which are based on the different properties. The separation process is more effective if the successive separation steps are based on the different properties than if the successive separation steps are identical. 3. Choose the separation operation, which utilises the largest difference in the properties between the product and the impurities. The loss is smallest when the product and the impurity differ in properties. 4. Separate the most plentiful components early. Components comprising a large fraction of the feed should be removed first. It is recommended to take 30% off the solid amounts. By reducing this amount of material early in the sequence, processing costs can be cut. 5. Do the most expensive separation operation last. The solid amounts are then as the smallest, and so the separation costs are minimised. 6. It is not sure that a separation process tested in the laboratory will also work on mill scale. On laboratory scale it is possible to use labour-intensive methods. On mill scale, the labour costs are often more considerable than equipment or material costs, because the operations are repeated every day. It is important to pay attention to saving time and efficiencies in process design. The process designer should be open-minded; sometimes laboratory methods can be utilised on mill scale and sometimes the solution is totally different. It is worth checking if the separation equipment can be used e.g. in the production of different products. 7. Keep it simple, stupid. Try to keep the separation processes as simple as possible. The fewer separation steps, the better the yield and the smaller the costs. Also, the risks are minimised. The production is carried out normally in shift work, and so there are chances of error. So in designing the mill-scale process it is more important to make the separation process simple and get it working fluently and minimise solid waste rather than maximise the yield.
The objective of all evolutionary methods for selecting and sequencing separation
processes is a systematic approach to an optimal system. Generation of the initial separation sequence is a critical step in finding an optimal process. Often the best way to generate an initial flowsheet is to examine similar processes that will lead to a feasible

61
initial sequence by using literature, as has been done in this work (Chapter 2). The next identification of evolutionary rules establishes criteria to evaluate possible changes in the initial sequence. Often rules involve picking the separation method, characterizing its effect on the sequence, moving the separator earlier in the process, and finally evaluating alternative separation methods at the point in the sequence. The most important step in evolutionary methods is the determination of the evolutionary strategy. Perhaps the most difficult part of any design process is developing a strategy that directly leads to improvements in existing flowsheets. Many strategies can be characterised as either depth-first or breadth-first strategies. Depth-first strategies are aimed at generating a sequence that appears to be an optimum through the repeated application of one or more evolutionary rules. In this strategy, the optimum will arise through repeated modification of an existing detailed flowsheet. Breadth-first strategies involve the generation of a number of possible sequences that may arise from a single change to an existing flowsheet. The optimum is near when the next generation of flowsheets offer little, if any, improvement over the one from which they were created (Kelly 1987).
The use of algorithmic approaches to process synthesis is, in theory, the only certain way to develop an optimal process. This is true because every possible process sequence can be considered rigorously. Unfortunately, because of the nature of the combinatorial problem that arises, even for relatively simple situations, the use of strictly algorithmic approaches is often unrealistic. However, when they are used in conjunction with heuristic and evolutionary strategies, they represent the best hope for rational process synthesis (Kelly 1987). Rule-based expert systems as well as task-oriented expert systems have proven useful, especially in chemical engineering (Barnicki 1990).
The separation equipments applied in this case, which are based on different particle sizes, are filters and centrifugal cleaners (cyclones). The applicability of different separation equipment based on particle sizes is presented in Fig. 27.
The function of filters is defined as the separation of solids from liquids by passing a suspension through a permeable medium, which retains the particles. In order to obtain fluid flow through the filter medium, a pressure drop has to be applied across the medium. There are four types of driving force used in commercial filters: gravity, vacuum, pressure and centrifugal. Cake washing is used for improving the cake quality in filter applications. The filter cloths can be e.g. plastics and wire cloths (Svarovsky 1990). The target of the filtration is to get a clear filtrate and the solids retained on the medium. In this case filtration was chosen for study as the first separation method, because according to the studies, the feed of the new process consists of enough material, which is larger in particle size than the targeted final product and the method was therefore worth studying for the first separation phase of the new process.
The centrifugal cleaner is a process device, which utilises high centrifugal forces in separation. Centrifugal cleaners have found wide application in various fields of technology e.g. as solids fractioning by particle size (Schweiterer 1979), which is needed after the separation of most of the fibres and larger particles in the studied case. Centrifugal cleaners separate particles of the dispersed phase from the liquid (continuous phase) on the basis of the density difference between the phases, and the separation depends heavily on particle size. Particle size, which separates at 50% efficiency is referred to as the “cut size” and is commonly used to characterise the performance of a centrifugal cleaner. This may be understood to be the aperture size of an ideal screen,
62
which would give similar recovery as the cyclone: a smaller cut size leads to higher recovery. In fractioning applications, however, sharpness of cut is another important factor in assessing the centrifugal cleaner performance as it controls the amount of misplaced material in the two products (Null 1987). The evaluation of the functionality of the separation device in the planned application is done with the suppliers. Also dimensioning and requirements of the devices required are negotiated together with suppliers (Perry 1984).
Fig. 27. Applicability of different separation equipment based on particle sizes (Coulson et al. 1983)
The results of the study and design work for the implemented recovery process are presented in Chapter 4. Various wire and screening methods were examined for removing fibrous material and the bigger coating particles. It was possible to test screening utilising an unused vibration screen from the mill, and the properties of the sludge were evaluated after screening. At first, the chances of doing laboratory tests by wire and screening methods with the original sludge in the universities and research centres of Finland were investigated. The pilot tests were made in order to secure the reliability of the results. The selection of the wire systems was made between a few potential suppliers. One important tool for technical selection criteria of the wire systems was to use the results of the pilot
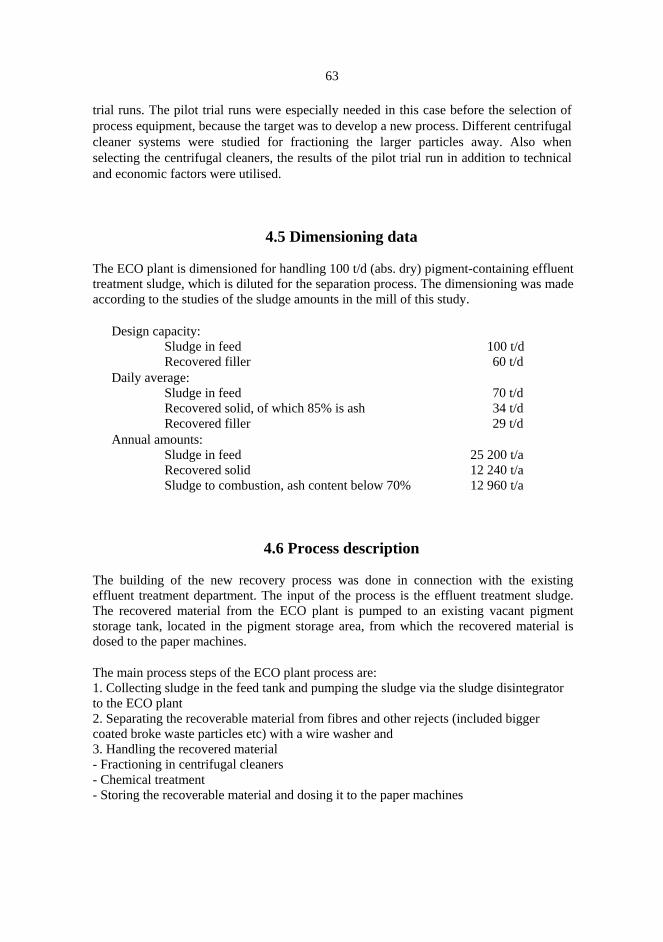
63
trial runs. The pilot trial runs were especially needed in this case before the selection of process equipment, because the target was to develop a new process. Different centrifugal cleaner systems were studied for fractioning the larger particles away. Also when selecting the centrifugal cleaners, the results of the pilot trial run in addition to technical and economic factors were utilised.
4.5 Dimensioning data The ECO plant is dimensioned for handling 100 t/d (abs. dry) pigment-containing effluent treatment sludge, which is diluted for the separation process. The dimensioning was made according to the studies of the sludge amounts in the mill of this study.
Design capacity:
Sludge in feed 100 t/d Recovered filler 60 t/d
Daily average: Sludge in feed 70 t/d Recovered solid, of which 85% is ash 34 t/d Recovered filler 29 t/d
Annual amounts: Sludge in feed 25 200 t/a Recovered solid 12 240 t/a Sludge to combustion, ash content below 70% 12 960 t/a
4.6 Process description The building of the new recovery process was done in connection with the existing effluent treatment department. The input of the process is the effluent treatment sludge. The recovered material from the ECO plant is pumped to an existing vacant pigment storage tank, located in the pigment storage area, from which the recovered material is dosed to the paper machines. The main process steps of the ECO plant process are: 1. Collecting sludge in the feed tank and pumping the sludge via the sludge disintegrator to the ECO plant 2. Separating the recoverable material from fibres and other rejects (included bigger coated broke waste particles etc) with a wire washer and 3. Handling the recovered material - Fractioning in centrifugal cleaners - Chemical treatment - Storing the recoverable material and dosing it to the paper machines
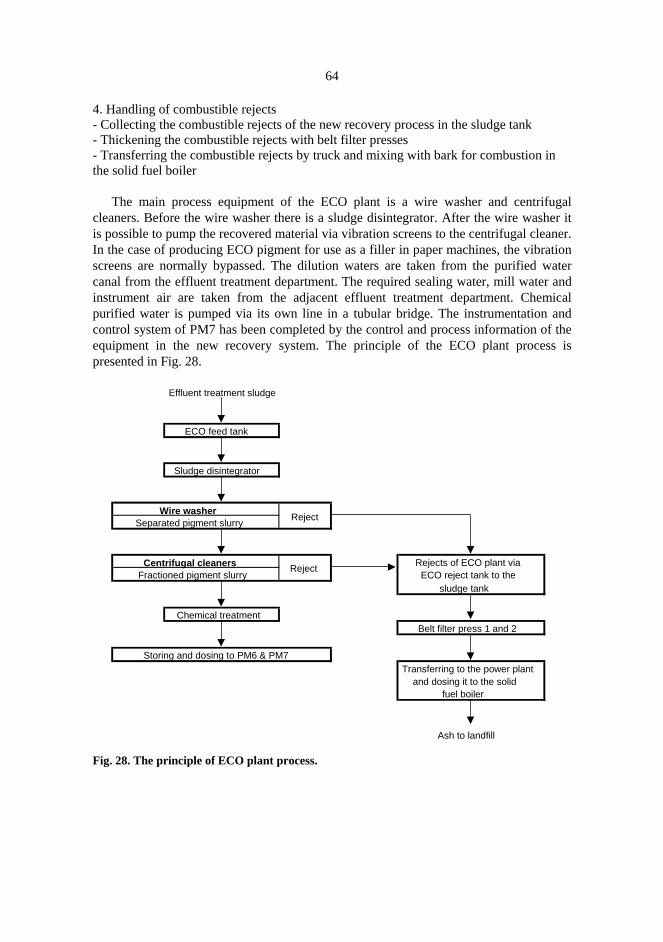
64
4. Handling of combustible rejects - Collecting the combustible rejects of the new recovery process in the sludge tank - Thickening the combustible rejects with belt filter presses - Transferring the combustible rejects by truck and mixing with bark for combustion in the solid fuel boiler
The main process equipment of the ECO plant is a wire washer and centrifugal cleaners. Before the wire washer there is a sludge disintegrator. After the wire washer it is possible to pump the recovered material via vibration screens to the centrifugal cleaner. In the case of producing ECO pigment for use as a filler in paper machines, the vibration screens are normally bypassed. The dilution waters are taken from the purified water canal from the effluent treatment department. The required sealing water, mill water and instrument air are taken from the adjacent effluent treatment department. Chemical purified water is pumped via its own line in a tubular bridge. The instrumentation and control system of PM7 has been completed by the control and process information of the equipment in the new recovery system. The principle of the ECO plant process is presented in Fig. 28.
Effluent treatment sludge
ECO feed tank
Sludge disintegrator
Wire washer Separated pigment slurry
Centrifugal cleaners Rejects of ECO plant via Fractioned pigment slurry ECO reject tank to the
sludge tank
Chemical treatment Belt filter press 1 and 2
Storing and dosing to PM6 & PM7 Transferring to the power plant and dosing it to the solid fuel boiler
Reject
Reject
Ash to landfill
Fig. 28. The principle of ECO plant process.
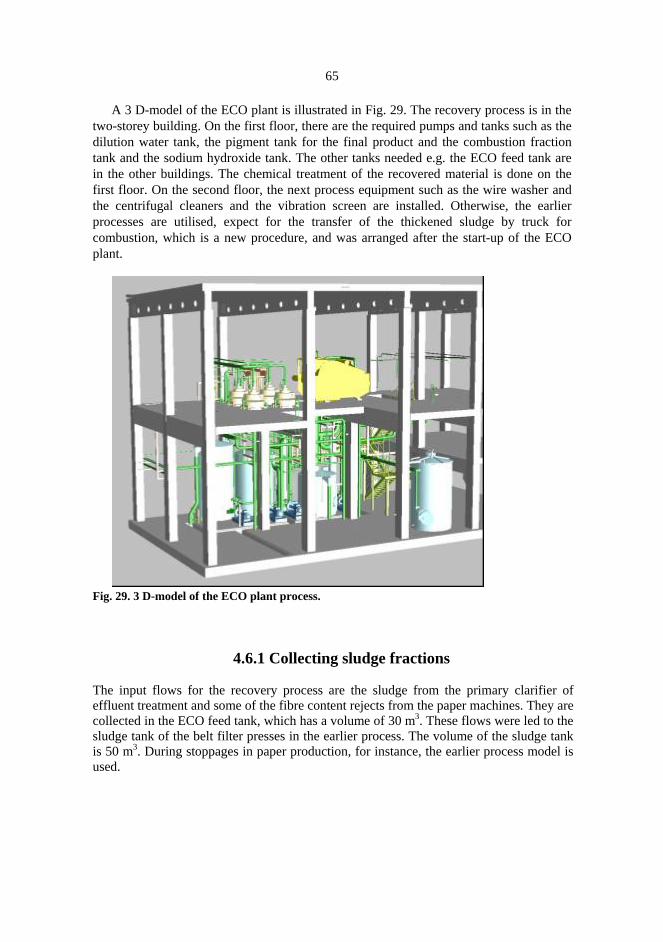
65
A 3 D-model of the ECO plant is illustrated in Fig. 29. The recovery process is in the two-storey building. On the first floor, there are the required pumps and tanks such as the dilution water tank, the pigment tank for the final product and the combustion fraction tank and the sodium hydroxide tank. The other tanks needed e.g. the ECO feed tank are in the other buildings. The chemical treatment of the recovered material is done on the first floor. On the second floor, the next process equipment such as the wire washer and the centrifugal cleaners and the vibration screen are installed. Otherwise, the earlier processes are utilised, expect for the transfer of the thickened sludge by truck for combustion, which is a new procedure, and was arranged after the start-up of the ECO plant.
Fig. 29. 3 D-model of the ECO plant process.
4.6.1 Collecting sludge fractions The input flows for the recovery process are the sludge from the primary clarifier of effluent treatment and some of the fibre content rejects from the paper machines. They are collected in the ECO feed tank, which has a volume of 30 m3. These flows were led to the sludge tank of the belt filter presses in the earlier process. The volume of the sludge tank is 50 m3. During stoppages in paper production, for instance, the earlier process model is used.
66
4.6.2 Separating the recoverable material with a wire washer The feed sludge is diluted in relation to the amount of feed flow with purified water. The purified water is treated in the effluent treatment department. After dilution the diluted sludge is led to the Netzch sludge disintegrator, where the reject cache is emptied by a timed valve. The sludge is normally drawn in continuously through the disintegrator by the downstream self-priming NEMO pump. The material which can be broken down, is carried along by the stream of liquid. This is held by the flow in the somewhat enlarged space in front of the blade mechanism, thrown by the blade rotor against the blade ring and there disintegrated by the blades on the blade wheel. This takes place gradually, since the particles are only pressed against the disintegrating elements by the flow. As a result of this principle, disintegration takes place both thoroughly and uniformly. The material, which has been broken down by the cutting mechanism is carried by the liquid through the relatively narrow slots in the blade wheel and through the gaps between the latter and the blade ring (Nemo®Macerator brochure).
Next, the sludge is pumped to the wire washer. The flow amount is set, and that controls the speed setting of the feed pump. The system calculates the sludge volume flow from the difference between the set flow amount number and the dilution water.
The wire washer is supplied by METSO and is called an OptiThick™ GapWasher (Figs. 30 and 31). The wire washer is a compact twin-wire former, which was developed initially for applications in pulp washing and thickening. The first installation for ash washing was done at Metsä Tissue Mänttä Mill, in which the concentrated and washed web is the accept and the filtrate is the reject. The function of the wire washer was made clear by visiting the Mänttä Mill and seeing it there on mill scale, and by the pilot test in Metso’s Inkeroinen pilot plant with the sludge from the mill of this study. In the case of the pigment recovery concept, this wire washer was used for the first time in the opposite way than before. The recoverable material, which is the accept in this case, goes through the wires and the fibres and other bigger particles form the reject web between the wires.
The main dewatering in the wire washer unit occurs in the dewatering chamber, which is divided into three zones in the flow direction. It creates and maintains a gentle, two-sided dewatering process. The top and bottom wire loops are provided with similar components, which are widely used in paper machine technology and which have been further developed for wire washer operation in order to give good runnability and a long wire lifetime (Jortama et al. 2002).
The recovered material, which has gone through the wire, is routed to the free fall pipe, from where it is conveyed to the fractioning phase. The reject web is released by compressed air from the lower wire into the combustion fraction tank at the end section of the wire washer.

67
Fig. 30. OptiThick™ GapWasher for pigment recovery, published with permission from Metso (Juutinen 2001).
Reject= web Accept = filtrate Fig. 31. Cross-section of GapWasher, published with permission from Metso (Juutinen 2001).
The construction of the OptiThick™ GapWasher is presented in Fig. 32. The main components are: 1 Feed box 7 Stretching roll for upper wire 13 Stretching roll for bottom 2 Breast roll of upper wire 8 Flush shower of upper wire wire 3 Dewatering chamber 9 Turning roll for upper wire 14 Guide roll of bottom wire 4 Guide roll of upper wire 10 Web knock-off shower 15 Feed of sealing water 5 Loading/unloading 11 Turning roll for bottom wire 15 Wire roll doctor equipment for the 12 Oscillator high-pressure 16 Bottom wire breast roll dewatering chamber showers 6 Corner roll
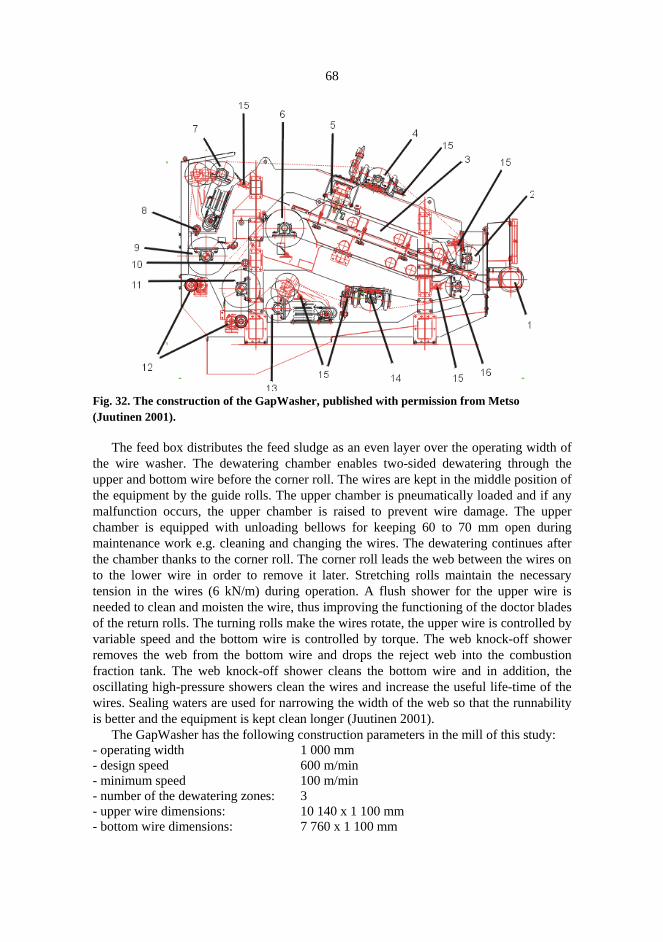
68
Fig. 32. The construction of the GapWasher, published with permission from Metso (Juutinen 2001).
The feed box distributes the feed sludge as an even layer over the operating width of the wire washer. The dewatering chamber enables two-sided dewatering through the upper and bottom wire before the corner roll. The wires are kept in the middle position of the equipment by the guide rolls. The upper chamber is pneumatically loaded and if any malfunction occurs, the upper chamber is raised to prevent wire damage. The upper chamber is equipped with unloading bellows for keeping 60 to 70 mm open during maintenance work e.g. cleaning and changing the wires. The dewatering continues after the chamber thanks to the corner roll. The corner roll leads the web between the wires on to the lower wire in order to remove it later. Stretching rolls maintain the necessary tension in the wires (6 kN/m) during operation. A flush shower for the upper wire is needed to clean and moisten the wire, thus improving the functioning of the doctor blades of the return rolls. The turning rolls make the wires rotate, the upper wire is controlled by variable speed and the bottom wire is controlled by torque. The web knock-off shower removes the web from the bottom wire and drops the reject web into the combustion fraction tank. The web knock-off shower cleans the bottom wire and in addition, the oscillating high-pressure showers clean the wires and increase the useful life-time of the wires. Sealing waters are used for narrowing the width of the web so that the runnability is better and the equipment is kept clean longer (Juutinen 2001).
The GapWasher has the following construction parameters in the mill of this study: - operating width 1 000 mm - design speed 600 m/min - minimum speed 100 m/min - number of the dewatering zones: 3 - upper wire dimensions: 10 140 x 1 100 mm - bottom wire dimensions: 7 760 x 1 100 mm
69
The operation of the wire washer was examined in pilot-scale tests in Metso’s Inkeroinen pilot plant before the start-up of the ECO plant. The results of pilot tests were needed to shorten the optimising period after the start-up of the ECO plant. It was easier to find out the right process parameters for the wire washer, because their effects on the product quality were known due to pilot tests made earlier. Thanks to these pilot tests, the recovery process produced recovered pigment, which was used in paper production very soon after the start-up of the ECO plant.
The wire speed of the wire washer used can vary between 100 and 600 m/min in this application, but usually the speed varies between 200 and 270 m/min. It is advisable to keep the wire speed at a fairly low level, to gain lower power consumption and better yield: a low wire speed ensures minimal turbulence and also gives enough time for dewatering. If the speed of the wire is increased, it means that the yield of the pigment and the solid matter into the filtrate (product) is decreased and its consistency is increased slightly. Correspondingly, increasing the speed of the wire increases the yield of the pigment and the solid matter in the reject web and decreases its consistency. There are no observable effects on the particle size distribution of the filtrate (product) by increasing or decreasing the speed of the wire.
The dry solid content of the feed sludge to the wire washer varies normally between 4.5 and 9.5%. The recommendation based on the tests and the optimisation period at the start was lower: between 3 and 5%, because then the efficiency of the wire washer in removing pigments from the feed to the filtrate was better than at higher dry solid contents. A higher dry solid content in the recovered pigment sludge was targeted later in summer 2002 due to the slight minimising of volumes. This means that increasing the dry solid content of the feed sludge increases the dry solid content and ash content of the filtrate, but increases the dry solid content and ash content of the reject web more: the yield of the pigment decreases a little.
The feed flow to the wire washer varies normally between 7 and 11 l/s. Increasing the feed flow increases the yield of the pigment and the solid matter into the filtrate (product) and also the yield of the pigment and the solid matter in the reject web with higher power consumption. The dry solid content of the reject web increases a little and the ash content of the reject web simultaneously decreases a little, if the feed flow is increased.
The production rate of the wire washer varies from 40 to 90 t/d/m in the mill of this study. The yield (the dry substance removed from the feed to the filtrate) varies from about 65 to 85%; the average yield is over 80% (Jortama et al. 2002).
The temperature of the feed flow was recommended to be over 28 ºC by the equipment supplier and based on the tests. However, there was no need for any temperature control for the feed flow. Because the volumes are high as in the mill of this study, the temperature is kept automatically a little over 30 ºC in nearly all the seasons. Increasing the temperature could increase the yield of the pigment and the solid matter into the filtrate.
The sealing waters are used near the edge of the wire so that the bigger particles do not escape into the filtrate over the edge. In the optimising period, the amount of these sealing waters were optimised at the level where they work, but their effect on decreasing the dry content of the filtrate is at a minimum.
Normally, the wire washer looks very compact and the observation and evaluation of its functional efficiency is difficult to do during production. The easiest and quickest way

70
to evaluate the process state is to open the door near the position where the reject web is dropped down. In the normal state, the reject web looks like “white oatmeal”: if it is too watery or thick, the above-described process variables are then changed to normalise the state of the process. It is of course possible to take laboratory samples of the feed, the accepts (from each chamber) and the reject web of the wire washer, and measure various things such as the dry solid content, ash content and particle size distribution in order to monitor and optimise the process. After the wire washer it is possible to pump the filtrate (product) to the vibration screens e.g. if it is needed to evaluate the composition and the form of the recovered material visually. The unused vibration screens of PM6 surface size are reclaimed in this position. Usually these vibration screens are by-passed when producing ECO pigment for use as a filler.
The fibre-containing reject web is routed to the combustion fraction tank. The web is removed from the wire by blowing compressed air on it.
The purified canal water from the effluent treatment department is used as the shower water of the wire washer at a pressure of 300 kPa. The chemically-purified water is used as the high-pressure shower water at a pressure of 2000 kPa, for which there is a separate high-pressure pump.
The wire washer has been a relatively reliable piece of equipment overall, both in terms of production and maintenance according to the experiences of the first start-up year. Roll covers must be selected by taking account the abrasive nature of the handled sludge. In addition, the wires of the wire washer have been durable in such a hard position: the wires were changed two times during the first year.
4.6.3 Fractioning with centrifugal cleaners After the wire washer the recovered material is pumped to the Andritz centrifugal cleaners, which have two stages. The 1st stage consists of six AhlcleanerTM RB 77 units and the 2nd stage includes two AhlcleanerTM RB 45 units. Only the 2nd stage was bought for the ECO plant, because the 1st stage (bought in 1995) was obtained from the own pulp mill, where it had become unnecessary.
The centrifugal cleaner of the first stage is a small cleaner specially designed to remove difficult small debris such as dirt, resins, ink specks and sand in pulp and stock cleaning applications. It has a specially designed D-shape inlet port, which gives improved flow characteristics through the cleaner. The centrifugal cleaner of the second stage operates by fluidising the inlet stock, allowing debris removal at higher consistencies.
The designed balance sheet is presented in Fig. 33 for a situation in which the feed is 60.5 t/d (abs. dry) and the dry solid content is 4%. The pilot test for making sure of the capability of the centrifugal cleaners and for selecting the type of centrifugal cleaner was done with the pre-screened sludge of the mill of this study in Andritz-Ahlstrom’s pilot plant in Karhula. The following values were used in dimensioning:
-ash content in feed: 70 to 80% -pressure loss: 180 to 220 kPa

71
-maximum feed pressure 250 kPa -back-pressure of accept 50 kPa
Ahlcleaner RB77
Accept: 17.8 l/s, consistency: 3.6
Feed: 17.5 l/s,consistency: 4%
Reject: 3.8 l/s, consistency 5.6%
Reject: 0.9 l/s,consistency 6.7%Dilution water 1.3 l/s,
consistency 0,01%
Ahlcleaner RB45
Combustion fraction tank
Accept: 4,1 l/s, consistency: 3.6
ECO pigment tank
Fig. 33. The design balance sheet of the centrifugal cleaners.
After the first stage, the accept is routed to the ECO pigment tank, which has a volume of 20 m3. The reject is led to the second stage of the centrifugal cleaner through the free fall pipe. After the second stage, the accept can be routed either to the first stage (cascade, normal way in the process) or to the ECO pigment tank. The reject of the second stage is taken to the combustion fraction tank.
4.6.4 Chemical treatment with peracetic acid ECO pigment is treated with peracetic acid before it is pumped to the pigment storage area. Peracetic acid is used before also in the treatment of ultrafiltrate concentrate in the mill. Peracetic acid is used as a preservative and for increasing the brightness of the recovered material.
The peracetic acid used is an equilibrium- type peracetic acid (ePAA). Its active ingredient content is about 15 % (weighted per cent) and it contains 21 to 26% acetic acid and 13 to 16% hydrogen peroxide.
Dosing of peracetic acid is done via the mixing reactor to the ECO pigment tank in order to get effective mixing, which is needed because of the fast reaction rate of peracetic acid. The amount of peracetic acid used has been varied from 3 to 6 kg/t dry solid material 100% peracetic acid in the optimising period of the first year. The strategy was that the ECO pigment should be carefully treated with peracetic acid from the beginning, so that the microbiological problems of the paper mill would not increase because of the use of ECO pigment. At the beginning, 3 to 4 kg of 100% peracetic acid / t dry solid material was used, later in summer 2002 the dosage was increased to 5 to 6 kg/t
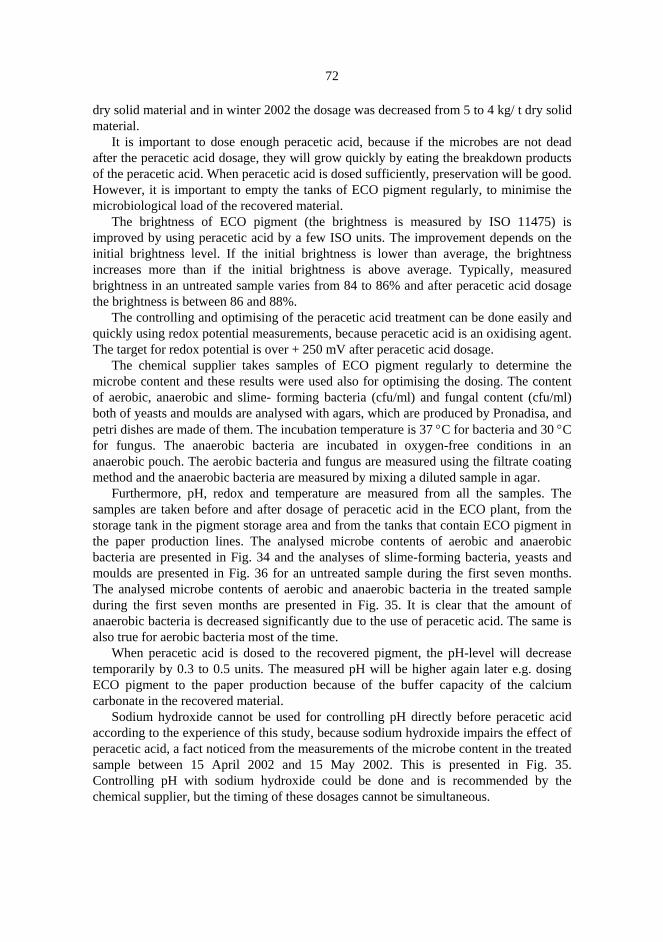
72
dry solid material and in winter 2002 the dosage was decreased from 5 to 4 kg/ t dry solid material.
It is important to dose enough peracetic acid, because if the microbes are not dead after the peracetic acid dosage, they will grow quickly by eating the breakdown products of the peracetic acid. When peracetic acid is dosed sufficiently, preservation will be good. However, it is important to empty the tanks of ECO pigment regularly, to minimise the microbiological load of the recovered material.
The brightness of ECO pigment (the brightness is measured by ISO 11475) is improved by using peracetic acid by a few ISO units. The improvement depends on the initial brightness level. If the initial brightness is lower than average, the brightness increases more than if the initial brightness is above average. Typically, measured brightness in an untreated sample varies from 84 to 86% and after peracetic acid dosage the brightness is between 86 and 88%.
The controlling and optimising of the peracetic acid treatment can be done easily and quickly using redox potential measurements, because peracetic acid is an oxidising agent. The target for redox potential is over + 250 mV after peracetic acid dosage.
The chemical supplier takes samples of ECO pigment regularly to determine the microbe content and these results were used also for optimising the dosing. The content of aerobic, anaerobic and slime- forming bacteria (cfu/ml) and fungal content (cfu/ml) both of yeasts and moulds are analysed with agars, which are produced by Pronadisa, and petri dishes are made of them. The incubation temperature is 37 °C for bacteria and 30 °C for fungus. The anaerobic bacteria are incubated in oxygen-free conditions in an anaerobic pouch. The aerobic bacteria and fungus are measured using the filtrate coating method and the anaerobic bacteria are measured by mixing a diluted sample in agar.
Furthermore, pH, redox and temperature are measured from all the samples. The samples are taken before and after dosage of peracetic acid in the ECO plant, from the storage tank in the pigment storage area and from the tanks that contain ECO pigment in the paper production lines. The analysed microbe contents of aerobic and anaerobic bacteria are presented in Fig. 34 and the analyses of slime-forming bacteria, yeasts and moulds are presented in Fig. 36 for an untreated sample during the first seven months. The analysed microbe contents of aerobic and anaerobic bacteria in the treated sample during the first seven months are presented in Fig. 35. It is clear that the amount of anaerobic bacteria is decreased significantly due to the use of peracetic acid. The same is also true for aerobic bacteria most of the time.
When peracetic acid is dosed to the recovered pigment, the pH-level will decrease temporarily by 0.3 to 0.5 units. The measured pH will be higher again later e.g. dosing ECO pigment to the paper production because of the buffer capacity of the calcium carbonate in the recovered material.
Sodium hydroxide cannot be used for controlling pH directly before peracetic acid according to the experience of this study, because sodium hydroxide impairs the effect of peracetic acid, a fact noticed from the measurements of the microbe content in the treated sample between 15 April 2002 and 15 May 2002. This is presented in Fig. 35. Controlling pH with sodium hydroxide could be done and is recommended by the chemical supplier, but the timing of these dosages cannot be simultaneous.
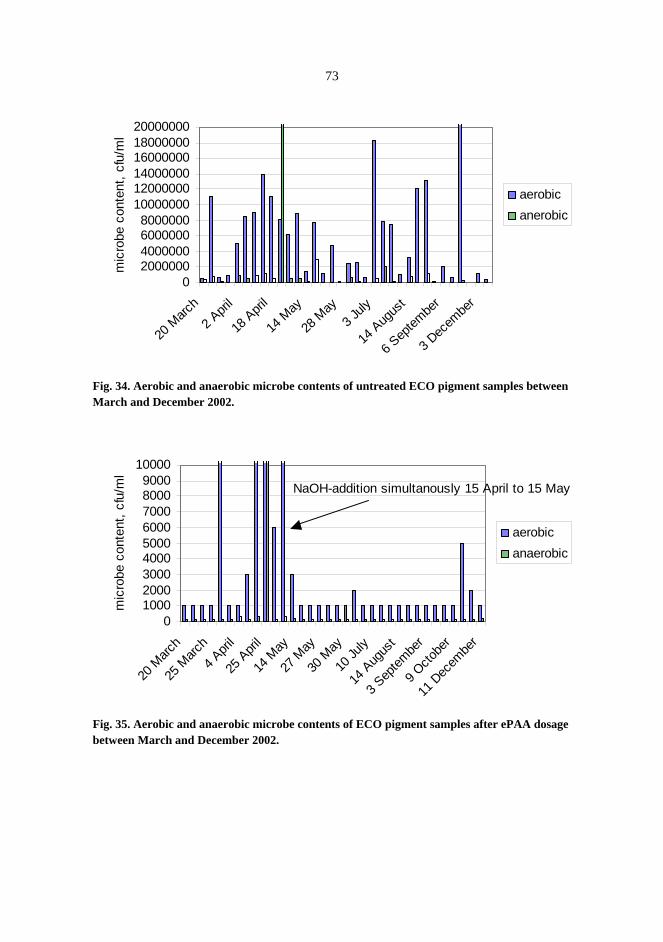
73
02000000400000060000008000000
100000001200000014000000160000001800000020000000
20 M
arch
2 Apri
l
18 A
pril
14 M
ay
28 M
ay3 J
uly
14 A
ugus
t
6 Sep
tembe
r
3 Dec
embe
r
mic
robe
con
tent
, cfu
/ml
aerobicanerobic
Fig. 34. Aerobic and anaerobic microbe contents of untreated ECO pigment samples between March and December 2002.
0100020003000400050006000700080009000
10000
20 M
arch
25 M
arch4 A
pril
25 A
pril
14 M
ay
27 M
ay
30 M
ay
10 Ju
ly
14 A
ugus
t
3 Sep
tembe
r
9 Octo
ber
11 D
ecem
ber
mic
robe
con
tent
, cfu
/ml
aerobic anaerobic
NaOH-addition simultanously 15 April to 15 May
Fig. 35. Aerobic and anaerobic microbe contents of ECO pigment samples after ePAA dosage between March and December 2002.
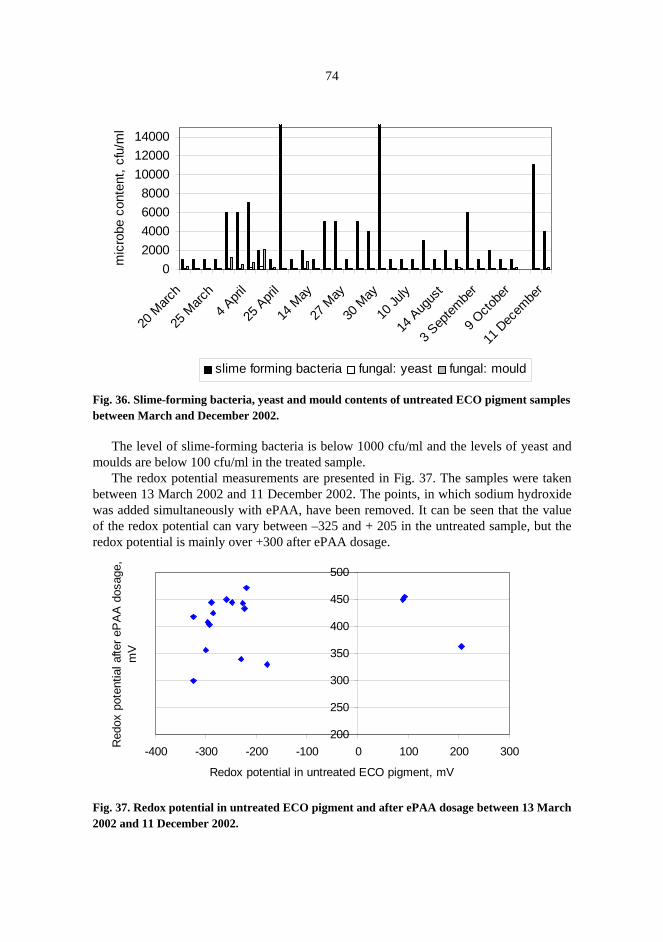
74
02000400060008000
100001200014000
20 M
arch
25 M
arch
4 Apri
l
25 A
pril
14 M
ay
27 M
ay
30 M
ay
10 Ju
ly
14 A
ugus
t
3 Sep
tembe
r
9 Octo
ber
11 D
ecem
ber
mic
robe
con
tent
, cfu
/ml
slime forming bacteria fungal: yeast fungal: mould
Fig. 36. Slime-forming bacteria, yeast and mould contents of untreated ECO pigment samples between March and December 2002.
The level of slime-forming bacteria is below 1000 cfu/ml and the levels of yeast and moulds are below 100 cfu/ml in the treated sample.
The redox potential measurements are presented in Fig. 37. The samples were taken between 13 March 2002 and 11 December 2002. The points, in which sodium hydroxide was added simultaneously with ePAA, have been removed. It can be seen that the value of the redox potential can vary between –325 and + 205 in the untreated sample, but the redox potential is mainly over +300 after ePAA dosage.
200
250
300
350
400
450
500
-400 -300 -200 -100 0 100 200 300
Redox potential in untreated ECO pigment, mV
Red
ox p
oten
tial a
fter e
PA
A d
osag
e,
mV
Fig. 37. Redox potential in untreated ECO pigment and after ePAA dosage between 13 March 2002 and 11 December 2002.

75
The pH decreases directly after ePAA dosage, as shown in Fig. 38.
6.26.46.66.8
77.27.47.67.8
8
6.2 6.7 7.2 7.7
pH in untreated ECO pigment
pH a
fter e
PA
A d
osag
e
Fig. 38. pH level in untreated ECO pigment and directly after ePAA dosage. The samples were measured between 13 March and 11 December 2002. The pH increased a little while it was being transferred to the paper mill, as can be seen in Fig. 39. This is due to the buffering ability of the calcium carbonate in ECO pigment.
6.2
6.4
6.6
6.8
7
7.2
7.4
6.2 6.4 6.6 6.8 7 7.2 7.4
pH direct after ePAA dosage in ECO-plant
pH in
the
EC
O p
igm
ent t
ank
in
pape
r mill
ECO pigment in PM7 ECO pigment in PM6
Fig. 39. pH-level of ECO pigment directly after ePAA dosage and in the ECO pigment tank of the paper mill between 13 March and 11 December 2002.
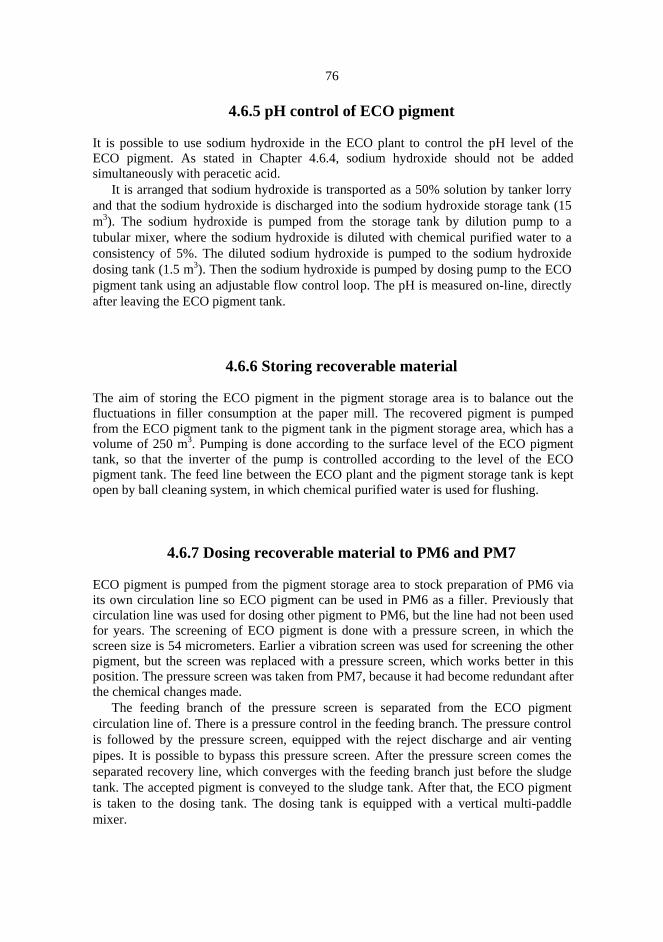
76
4.6.5 pH control of ECO pigment It is possible to use sodium hydroxide in the ECO plant to control the pH level of the ECO pigment. As stated in Chapter 4.6.4, sodium hydroxide should not be added simultaneously with peracetic acid.
It is arranged that sodium hydroxide is transported as a 50% solution by tanker lorry and that the sodium hydroxide is discharged into the sodium hydroxide storage tank (15 m3). The sodium hydroxide is pumped from the storage tank by dilution pump to a tubular mixer, where the sodium hydroxide is diluted with chemical purified water to a consistency of 5%. The diluted sodium hydroxide is pumped to the sodium hydroxide dosing tank (1.5 m3). Then the sodium hydroxide is pumped by dosing pump to the ECO pigment tank using an adjustable flow control loop. The pH is measured on-line, directly after leaving the ECO pigment tank.
4.6.6 Storing recoverable material The aim of storing the ECO pigment in the pigment storage area is to balance out the fluctuations in filler consumption at the paper mill. The recovered pigment is pumped from the ECO pigment tank to the pigment tank in the pigment storage area, which has a volume of 250 m3. Pumping is done according to the surface level of the ECO pigment tank, so that the inverter of the pump is controlled according to the level of the ECO pigment tank. The feed line between the ECO plant and the pigment storage tank is kept open by ball cleaning system, in which chemical purified water is used for flushing.
4.6.7 Dosing recoverable material to PM6 and PM7 ECO pigment is pumped from the pigment storage area to stock preparation of PM6 via its own circulation line so ECO pigment can be used in PM6 as a filler. Previously that circulation line was used for dosing other pigment to PM6, but the line had not been used for years. The screening of ECO pigment is done with a pressure screen, in which the screen size is 54 micrometers. Earlier a vibration screen was used for screening the other pigment, but the screen was replaced with a pressure screen, which works better in this position. The pressure screen was taken from PM7, because it had become redundant after the chemical changes made.
The feeding branch of the pressure screen is separated from the ECO pigment circulation line of. There is a pressure control in the feeding branch. The pressure control is followed by the pressure screen, equipped with the reject discharge and air venting pipes. It is possible to bypass this pressure screen. After the pressure screen comes the separated recovery line, which converges with the feeding branch just before the sludge tank. The accepted pigment is conveyed to the sludge tank. After that, the ECO pigment is taken to the dosing tank. The dosing tank is equipped with a vertical multi-paddle mixer.
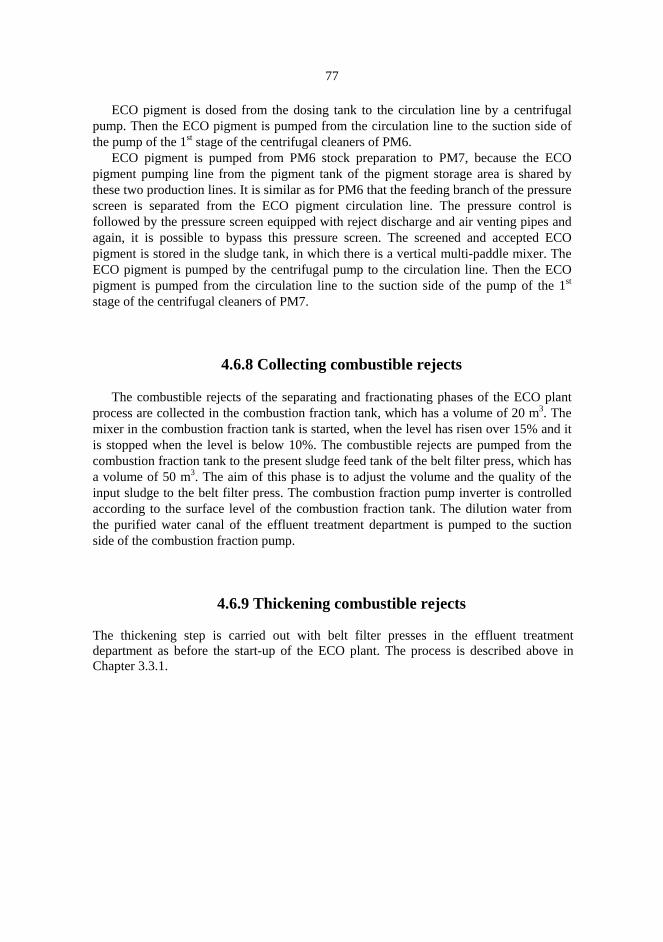
77
ECO pigment is dosed from the dosing tank to the circulation line by a centrifugal pump. Then the ECO pigment is pumped from the circulation line to the suction side of the pump of the 1st stage of the centrifugal cleaners of PM6.
ECO pigment is pumped from PM6 stock preparation to PM7, because the ECO pigment pumping line from the pigment tank of the pigment storage area is shared by these two production lines. It is similar as for PM6 that the feeding branch of the pressure screen is separated from the ECO pigment circulation line. The pressure control is followed by the pressure screen equipped with reject discharge and air venting pipes and again, it is possible to bypass this pressure screen. The screened and accepted ECO pigment is stored in the sludge tank, in which there is a vertical multi-paddle mixer. The ECO pigment is pumped by the centrifugal pump to the circulation line. Then the ECO pigment is pumped from the circulation line to the suction side of the pump of the 1st stage of the centrifugal cleaners of PM7.
4.6.8 Collecting combustible rejects
The combustible rejects of the separating and fractionating phases of the ECO plant process are collected in the combustion fraction tank, which has a volume of 20 m3. The mixer in the combustion fraction tank is started, when the level has risen over 15% and it is stopped when the level is below 10%. The combustible rejects are pumped from the combustion fraction tank to the present sludge feed tank of the belt filter press, which has a volume of 50 m3. The aim of this phase is to adjust the volume and the quality of the input sludge to the belt filter press. The combustion fraction pump inverter is controlled according to the surface level of the combustion fraction tank. The dilution water from the purified water canal of the effluent treatment department is pumped to the suction side of the combustion fraction pump.
4.6.9 Thickening combustible rejects The thickening step is carried out with belt filter presses in the effluent treatment department as before the start-up of the ECO plant. The process is described above in Chapter 3.3.1.
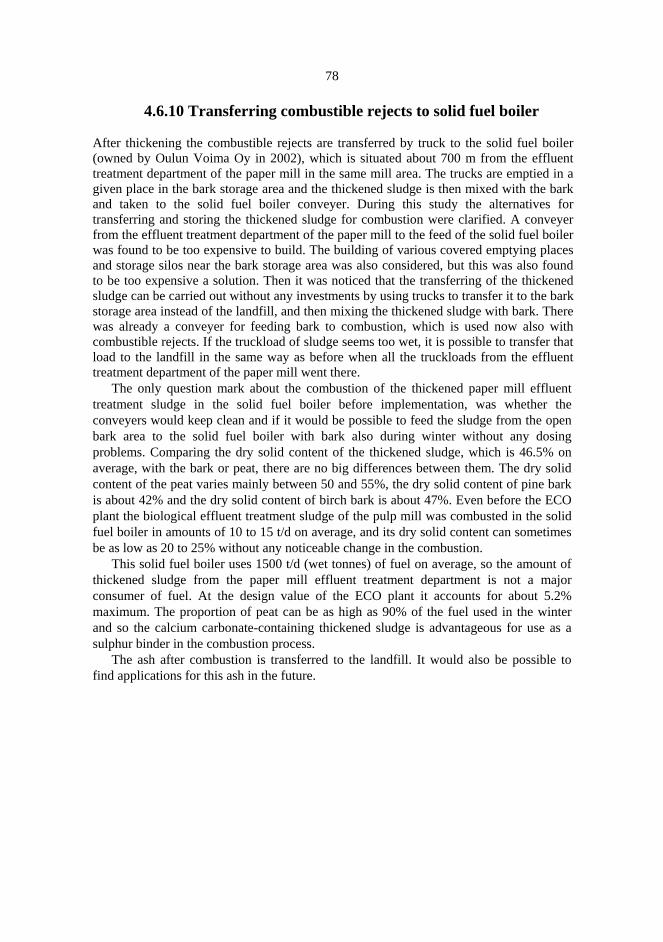
78
4.6.10 Transferring combustible rejects to solid fuel boiler After thickening the combustible rejects are transferred by truck to the solid fuel boiler (owned by Oulun Voima Oy in 2002), which is situated about 700 m from the effluent treatment department of the paper mill in the same mill area. The trucks are emptied in a given place in the bark storage area and the thickened sludge is then mixed with the bark and taken to the solid fuel boiler conveyer. During this study the alternatives for transferring and storing the thickened sludge for combustion were clarified. A conveyer from the effluent treatment department of the paper mill to the feed of the solid fuel boiler was found to be too expensive to build. The building of various covered emptying places and storage silos near the bark storage area was also considered, but this was also found to be too expensive a solution. Then it was noticed that the transferring of the thickened sludge can be carried out without any investments by using trucks to transfer it to the bark storage area instead of the landfill, and then mixing the thickened sludge with bark. There was already a conveyer for feeding bark to combustion, which is used now also with combustible rejects. If the truckload of sludge seems too wet, it is possible to transfer that load to the landfill in the same way as before when all the truckloads from the effluent treatment department of the paper mill went there.
The only question mark about the combustion of the thickened paper mill effluent treatment sludge in the solid fuel boiler before implementation, was whether the conveyers would keep clean and if it would be possible to feed the sludge from the open bark area to the solid fuel boiler with bark also during winter without any dosing problems. Comparing the dry solid content of the thickened sludge, which is 46.5% on average, with the bark or peat, there are no big differences between them. The dry solid content of the peat varies mainly between 50 and 55%, the dry solid content of pine bark is about 42% and the dry solid content of birch bark is about 47%. Even before the ECO plant the biological effluent treatment sludge of the pulp mill was combusted in the solid fuel boiler in amounts of 10 to 15 t/d on average, and its dry solid content can sometimes be as low as 20 to 25% without any noticeable change in the combustion.
This solid fuel boiler uses 1500 t/d (wet tonnes) of fuel on average, so the amount of thickened sludge from the paper mill effluent treatment department is not a major consumer of fuel. At the design value of the ECO plant it accounts for about 5.2% maximum. The proportion of peat can be as high as 90% of the fuel used in the winter and so the calcium carbonate-containing thickened sludge is advantageous for use as a sulphur binder in the combustion process.
The ash after combustion is transferred to the landfill. It would also be possible to find applications for this ash in the future.
79
4.7 Volume flows of ECO plant The volume flows of the feed to the ECO plant and the volume flow of ECO pigment from the ECO plant have been as presented in Figs. 40 and 41. The properties of the ECO pigment produced are presented in Chapter 5.
2
46
8
10
1214
16
13-Ju
l
2-Aug
22-A
ug
11-S
ep
1-Oct
21-O
ct
10-N
ov
30-N
ov
volu
me
flow
, l/s
(hou
rly a
vera
ge)
feed flow dilution water
Fig. 40. The feed volume flow to the ECO plant: the feed to the wire washer and the dilution water used between 10 June 2002 and 10 December 2002.
4.05.06.07.08.09.0
10.011.012.013.0
13-Ju
l
2-Aug
22-A
ug
11-S
ep1-O
ct
21-O
ct
10-N
ov
30-N
ov
volu
me
flow
, l/s
(hou
rly a
vera
ge)
Fig. 41. The volume flow of ECO pigment from the ECO plant between 10 June 2002 and 10 December 2002.

80
In order to handle the volume flows presented above, the speed of the GapWasher has been monitored and the results are presented in Fig. 42.
150
170
190
210
230
250
270
290
310
13-Ju
l2-A
ug
22-A
ug
11-S
ep1-O
ct
21-O
ct
10-N
ov
30-N
ov
spee
d, m
/min
(hou
rly a
vera
ge)
Fig. 42. The operating speed of the wire washer between 10 June 2002 and 10 December 2002.
5 Properties of ECO plant products and efficiencies of separating and fractioning stages
The ECO plant was started in March 2002 to recover material from effluent treatment sludge for use as a filler in paper production. The busiest optimising period was from March to June 2002. Subsequently, laboratory samples were taken only once per weekday from the feed for dry solid and ash content measurements and from the product for dry solid and ash content measurements and wet sieving for evaluation of particle size distribution. The samples were also taken from the sludge tank, from where the sludge is pumped to the belt filter press. The sludge tank contains the combustion fraction and the dry solid and ash content measurements were taken from these samples.
5.1 Wire washer accept The values measured of the wire washer accept were dry solid content, ash content and particle sizes. The measured dry solid content and ash content are presented in Figs. 43 and 44.
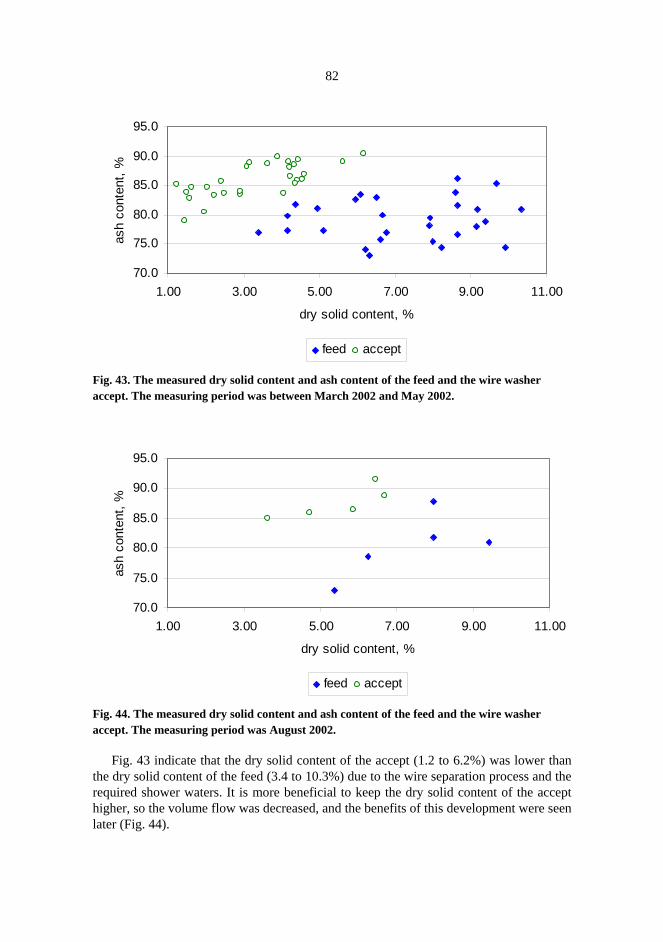
82
70.0
75.0
80.0
85.0
90.0
95.0
1.00 3.00 5.00 7.00 9.00 11.00
dry solid content, %
ash
cont
ent,
%
feed accept
Fig. 43. The measured dry solid content and ash content of the feed and the wire washer accept. The measuring period was between March 2002 and May 2002.
70.0
75.0
80.0
85.0
90.0
95.0
1.00 3.00 5.00 7.00 9.00 11.00
dry solid content, %
ash
cont
ent,
%
feed accept
Fig. 44. The measured dry solid content and ash content of the feed and the wire washer accept. The measuring period was August 2002.
Fig. 43 indicate that the dry solid content of the accept (1.2 to 6.2%) was lower than the dry solid content of the feed (3.4 to 10.3%) due to the wire separation process and the required shower waters. It is more beneficial to keep the dry solid content of the accept higher, so the volume flow was decreased, and the benefits of this development were seen later (Fig. 44).

83
The ash content of the feed varied a lot from 73 to 87% according to Figs. 43 and 44. As seen in Fig. 44, the quality by means of the ash content improved and the ash content of the accept was kept above 85% in this period.
Particle sizes in the feed and accept of the wire washer were studied using wet sieving. The proportion of particles over 500 µm in the feed and accept between March and April 2002 is presented in Fig. 45. It is worth mentioning that although the feed could contain varying amounts, normally 10 to 40%, up to almost 70% of the particles with a size of over 500 micrometers, in the accept that size class was absent; according to measurements this size class accounts for less than 0.06%.
0
0.01
0.02
0.03
0.04
0.05
0.06
0.07
0 20 40 60 80
feed: proportion of particles over 500 micrometer , %
acce
pt: p
ropo
rtion
of p
artic
les
over
50
0 m
icro
met
er, %
Fig. 45. Proportion of particles in the feed and accept of the wire washer, which were over 500 µm in the period between March and April 2002.
A similar development can also be seen in Fig. 46. The wire washer was capable of removing particles of between 160 and 500 µm so that below 0.6 % of the accept consisted of that size. The content in the feed varied usually between 0.4 and 1%.
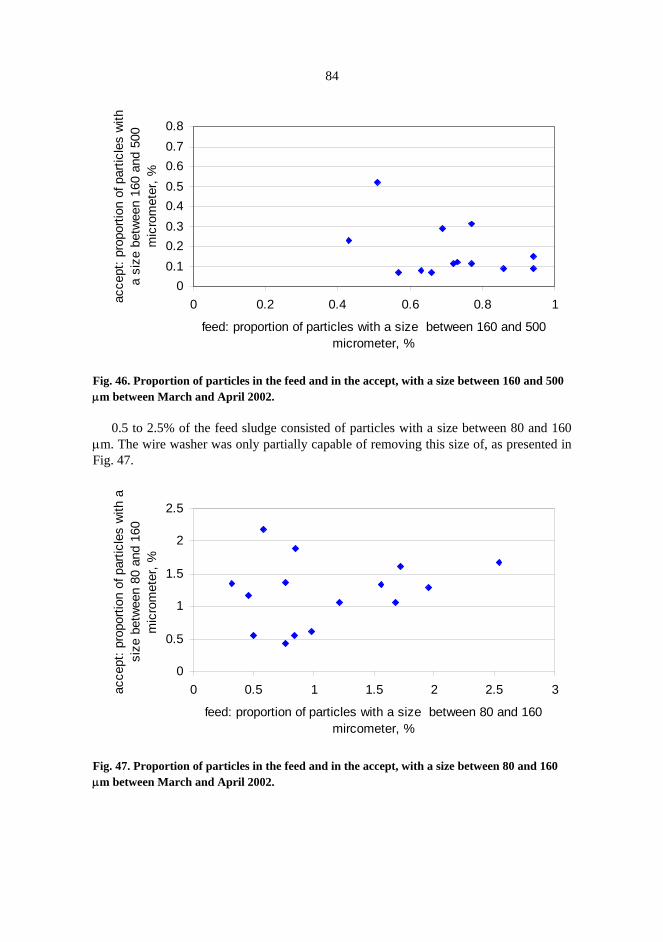
84
00.10.20.30.40.50.60.70.8
0 0.2 0.4 0.6 0.8 1
feed: proportion of particles with a size between 160 and 500 micrometer, %
acce
pt: p
ropo
rtion
of p
artic
les
with
a
size
bet
wee
n 16
0 an
d 50
0 m
icro
met
er, %
Fig. 46. Proportion of particles in the feed and in the accept, with a size between 160 and 500 µm between March and April 2002.
0.5 to 2.5% of the feed sludge consisted of particles with a size between 80 and 160
µm. The wire washer was only partially capable of removing this size of, as presented in Fig. 47.
0
0.5
1
1.5
2
2.5
0 0.5 1 1.5 2 2.5 3
feed: proportion of particles with a size between 80 and 160 mircometer, %
acce
pt: p
ropo
rtion
of p
artic
les
with
a
size
bet
wee
n 80
and
160
m
icro
met
er, %
Fig. 47. Proportion of particles in the feed and in the accept, with a size between 80 and 160 µm between March and April 2002.
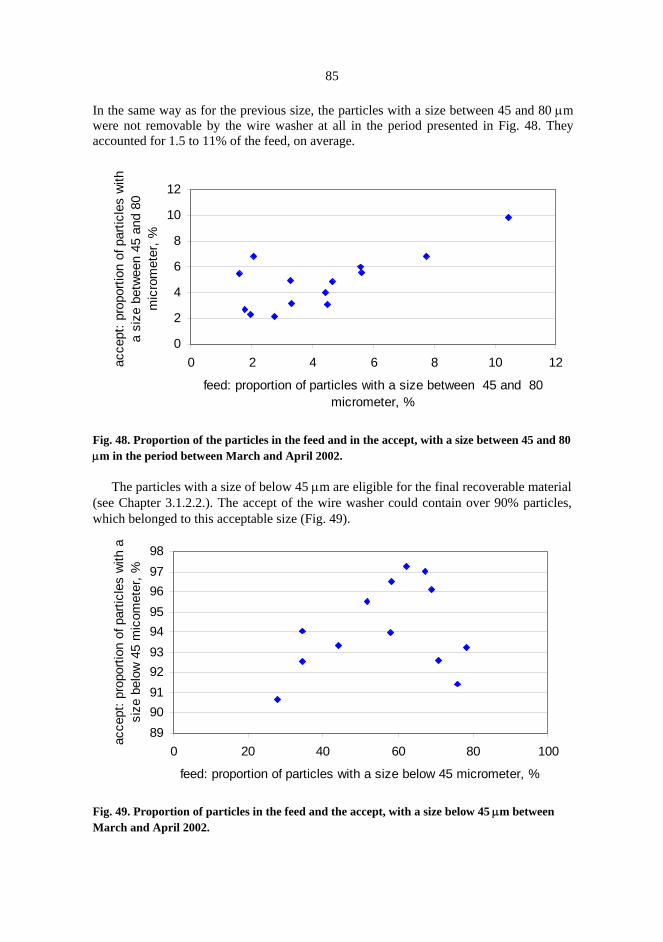
85
In the same way as for the previous size, the particles with a size between 45 and 80 µm were not removable by the wire washer at all in the period presented in Fig. 48. They accounted for 1.5 to 11% of the feed, on average.
0
2
4
6
8
10
12
0 2 4 6 8 10 12
feed: proportion of particles with a size between 45 and 80 micrometer, %
acce
pt: p
ropo
rtion
of p
artic
les
with
a
size
bet
wee
n 45
and
80
mic
rom
eter
, %
Fig. 48. Proportion of the particles in the feed and in the accept, with a size between 45 and 80 µm in the period between March and April 2002.
The particles with a size of below 45 µm are eligible for the final recoverable material (see Chapter 3.1.2.2.). The accept of the wire washer could contain over 90% particles, which belonged to this acceptable size (Fig. 49).
89909192939495969798
0 20 40 60 80 100
feed: proportion of particles with a size below 45 micrometer, %
acce
pt: p
ropo
rtion
of p
artic
les
with
a
size
bel
ow 4
5 m
icom
eter
, %
Fig. 49. Proportion of particles in the feed and the accept, with a size below 45 µm between March and April 2002.

86
5.2 Accept of centrifugal cleaners
5.2.1 Particle size distribution The recovered material is pumped to the centrifugal cleaners after the separating phase of the wire washer. This fractionating stage is essential to remove the great bulk of the remaining particles, which have a size of over 45 µm. The ability of the centrifugal cleaners to remove the particles with a size of between 80 and 160 µm and between 45 to 80 µm is presented in Figs. 50 and 51. 0.02 to 1.19% of the accept sludge consisted of particles with a size between 80 and 160 µm and 0.02 to 3.4% of the accept sludge consisted of particles with a size between 45 and 80 µm.
00.20.40.60.8
11.21.4
0 0.5 1 1.5 2 2.5 3 3.5
feed to centrifugal cleaner (the accept of the wire washer): proportion of particles with a size between 80 and 160
micrometer, %
final
pro
duct
: pr
opor
tion
of
parti
cles
with
a s
ize
wer
e be
twee
n 80
and
160
mic
rom
eter
, %
Fig. 50. Proportion of particles in the feed to the centrifugal cleaner and in the final product, with a size between 80 and 160 µm in the period between March and May 2002.
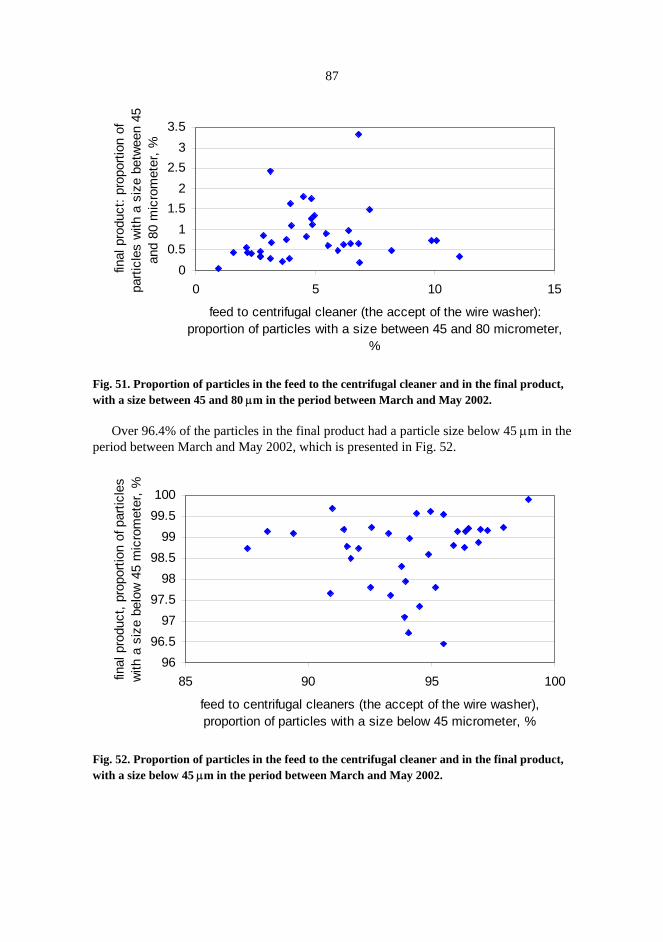
87
00.5
11.5
22.5
33.5
0 5 10 15
feed to centrifugal cleaner (the accept of the wire washer): proportion of particles with a size between 45 and 80 micrometer,
%
fina
l pro
duct
: pro
porti
on o
f pa
rticl
es w
ith a
siz
e be
twee
n 45
an
d 80
mic
rom
eter
, %
Fig. 51. Proportion of particles in the feed to the centrifugal cleaner and in the final product, with a size between 45 and 80 µm in the period between March and May 2002.
Over 96.4% of the particles in the final product had a particle size below 45 µm in the period between March and May 2002, which is presented in Fig. 52.
9696.5
9797.5
9898.5
9999.5100
85 90 95 100
feed to centrifugal cleaners (the accept of the wire washer), proportion of particles with a size below 45 micrometer, %
final
pro
duct
, pro
porti
on o
f par
ticle
s w
ith a
siz
e be
low
45
mic
rom
eter
, %
Fig. 52. Proportion of particles in the feed to the centrifugal cleaner and in the final product, with a size below 45 µm in the period between March and May 2002.
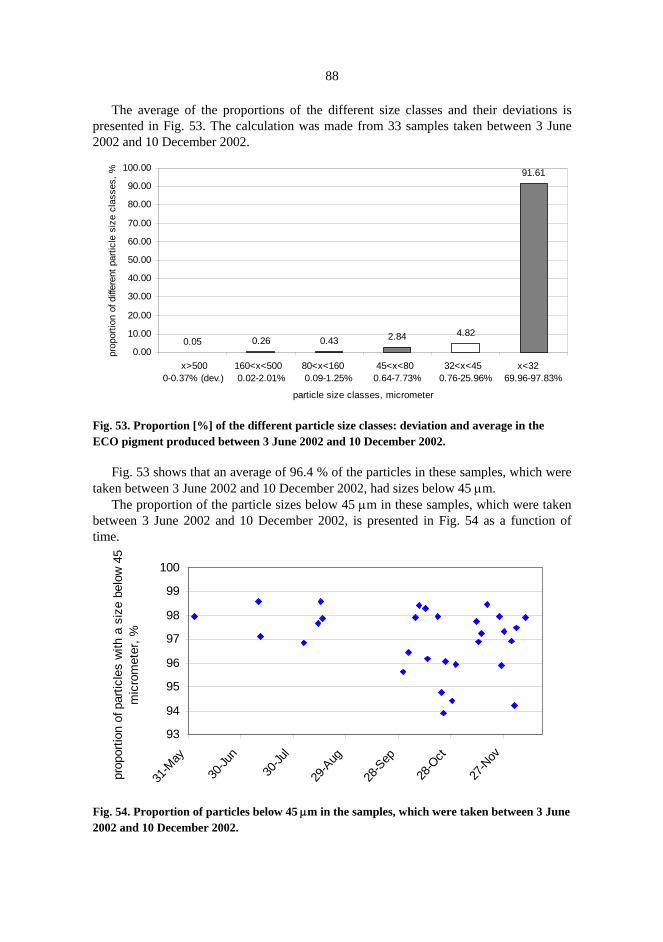
88
The average of the proportions of the different size classes and their deviations is presented in Fig. 53. The calculation was made from 33 samples taken between 3 June 2002 and 10 December 2002.
0.05 0.26 0.43 2.84 4.82
91.61
0.00
10.00
20.00
30.00
40.00
50.00
60.00
70.00
80.00
90.00
100.00
x>500 0-0.37% (dev.)
160<x<500 0.02-2.01%
80<x<160 0.09-1.25%
45<x<80 0.64-7.73%
32<x<45 0.76-25.96%
x<32 69.96-97.83%
particle size classes, micrometer
prop
ortio
n of
diff
eren
t par
ticle
siz
e cl
asse
s, %
Fig. 53. Proportion [%] of the different particle size classes: deviation and average in the ECO pigment produced between 3 June 2002 and 10 December 2002.
Fig. 53 shows that an average of 96.4 % of the particles in these samples, which were taken between 3 June 2002 and 10 December 2002, had sizes below 45 µm.
The proportion of the particle sizes below 45 µm in these samples, which were taken between 3 June 2002 and 10 December 2002, is presented in Fig. 54 as a function of time.
93
94
95
96
97
98
99
100
31-M
ay
30-Ju
n
30-Ju
l
29-A
ug
28-S
ep
28-O
ct
27-N
ov
prop
ortio
n of
par
ticle
s w
ith a
siz
e be
low
45
mic
rom
eter
, %
Fig. 54. Proportion of particles below 45 µm in the samples, which were taken between 3 June 2002 and 10 December 2002.
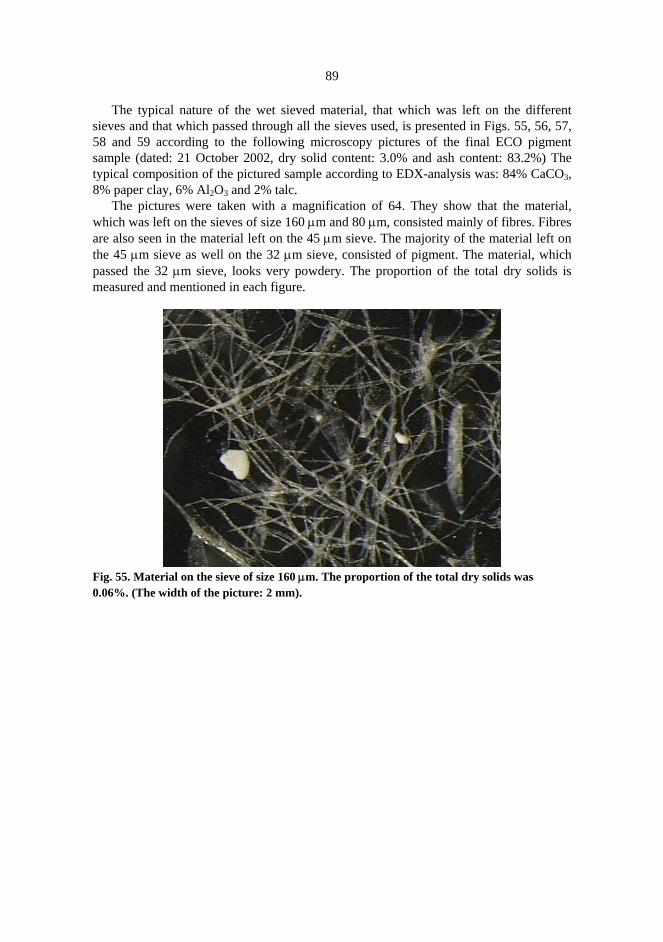
89
The typical nature of the wet sieved material, that which was left on the different sieves and that which passed through all the sieves used, is presented in Figs. 55, 56, 57, 58 and 59 according to the following microscopy pictures of the final ECO pigment sample (dated: 21 October 2002, dry solid content: 3.0% and ash content: 83.2%) The typical composition of the pictured sample according to EDX-analysis was: 84% CaCO3, 8% paper clay, 6% Al2O3 and 2% talc.
The pictures were taken with a magnification of 64. They show that the material, which was left on the sieves of size 160 µm and 80 µm, consisted mainly of fibres. Fibres are also seen in the material left on the 45 µm sieve. The majority of the material left on the 45 µm sieve as well on the 32 µm sieve, consisted of pigment. The material, which passed the 32 µm sieve, looks very powdery. The proportion of the total dry solids is measured and mentioned in each figure.
Fig. 55. Material on the sieve of size 160 µm. The proportion of the total dry solids was 0.06%. (The width of the picture: 2 mm).

90
Fig. 56. Material on the sieve of size 80 µm. The proportion of the total dry solids was 0.33%. (The width of the picture: 2 mm).
Fig. 57. Material on the sieve of size: 45 µm. The proportion of the total dry solids was 1.63%. (The width of the picture: 2 mm).
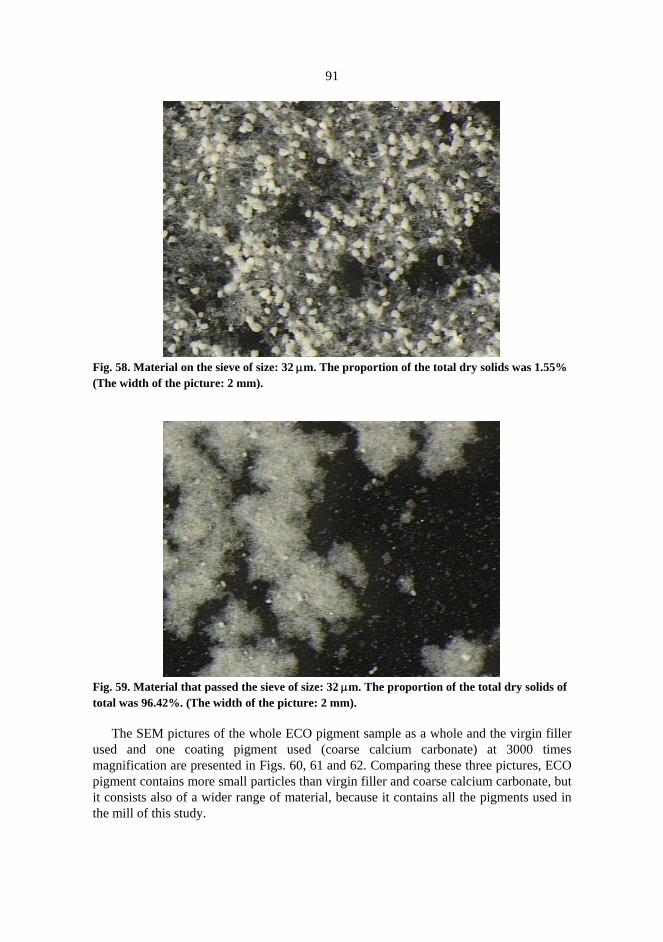
91
Fig. 58. Material on the sieve of size: 32 µm. The proportion of the total dry solids was 1.55% (The width of the picture: 2 mm).
Fig. 59. Material that passed the sieve of size: 32 µm. The proportion of the total dry solids of total was 96.42%. (The width of the picture: 2 mm).
The SEM pictures of the whole ECO pigment sample as a whole and the virgin filler used and one coating pigment used (coarse calcium carbonate) at 3000 times magnification are presented in Figs. 60, 61 and 62. Comparing these three pictures, ECO pigment contains more small particles than virgin filler and coarse calcium carbonate, but it consists also of a wider range of material, because it contains all the pigments used in the mill of this study.

92
Fig. 60. SEM picture of ECO pigment at 3000 times magnification. 21 October 2002.
Fig. 61. SEM picture of virgin filler at 3000 times magnification. 21 October 2002.
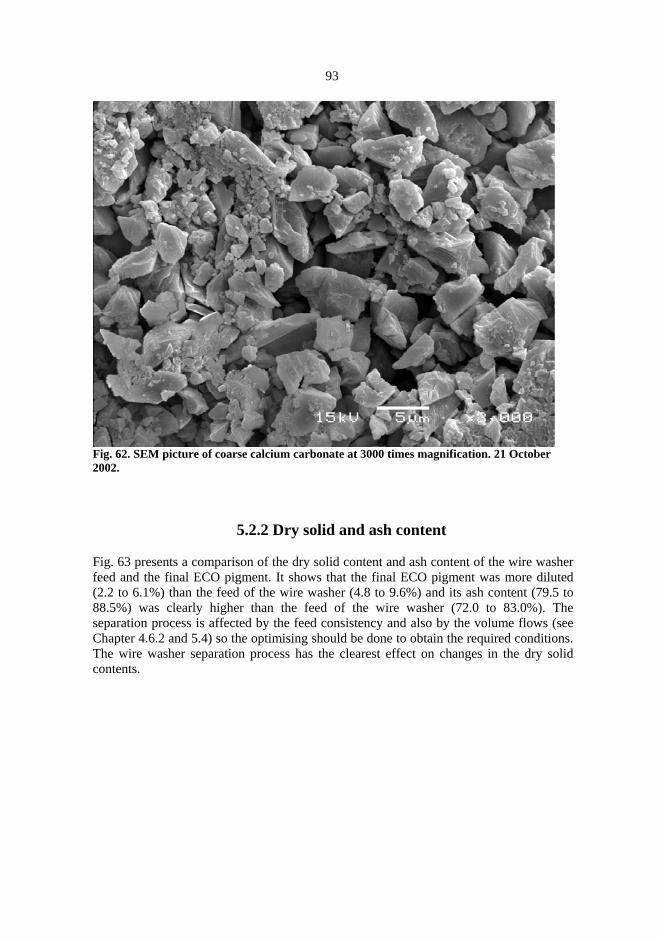
93
Fig. 62. SEM picture of coarse calcium carbonate at 3000 times magnification. 21 October 2002.
5.2.2 Dry solid and ash content Fig. 63 presents a comparison of the dry solid content and ash content of the wire washer feed and the final ECO pigment. It shows that the final ECO pigment was more diluted (2.2 to 6.1%) than the feed of the wire washer (4.8 to 9.6%) and its ash content (79.5 to 88.5%) was clearly higher than the feed of the wire washer (72.0 to 83.0%). The separation process is affected by the feed consistency and also by the volume flows (see Chapter 4.6.2 and 5.4) so the optimising should be done to obtain the required conditions. The wire washer separation process has the clearest effect on changes in the dry solid contents.
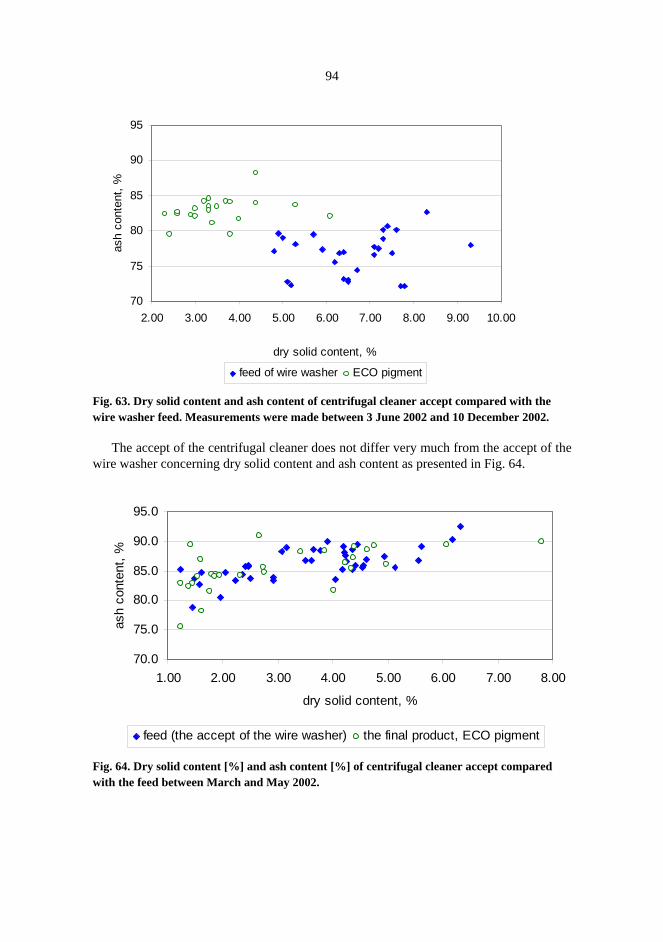
94
70
75
80
85
90
95
2.00 3.00 4.00 5.00 6.00 7.00 8.00 9.00 10.00
dry solid content, %
ash
cont
ent,
%
feed of wire washer ECO pigment
Fig. 63. Dry solid content and ash content of centrifugal cleaner accept compared with the wire washer feed. Measurements were made between 3 June 2002 and 10 December 2002.
The accept of the centrifugal cleaner does not differ very much from the accept of the wire washer concerning dry solid content and ash content as presented in Fig. 64.
70.0
75.0
80.0
85.0
90.0
95.0
1.00 2.00 3.00 4.00 5.00 6.00 7.00 8.00
dry solid content, %
ash
cont
ent,
%
feed (the accept of the wire washer) the final product, ECO pigment
Fig. 64. Dry solid content [%] and ash content [%] of centrifugal cleaner accept compared with the feed between March and May 2002.
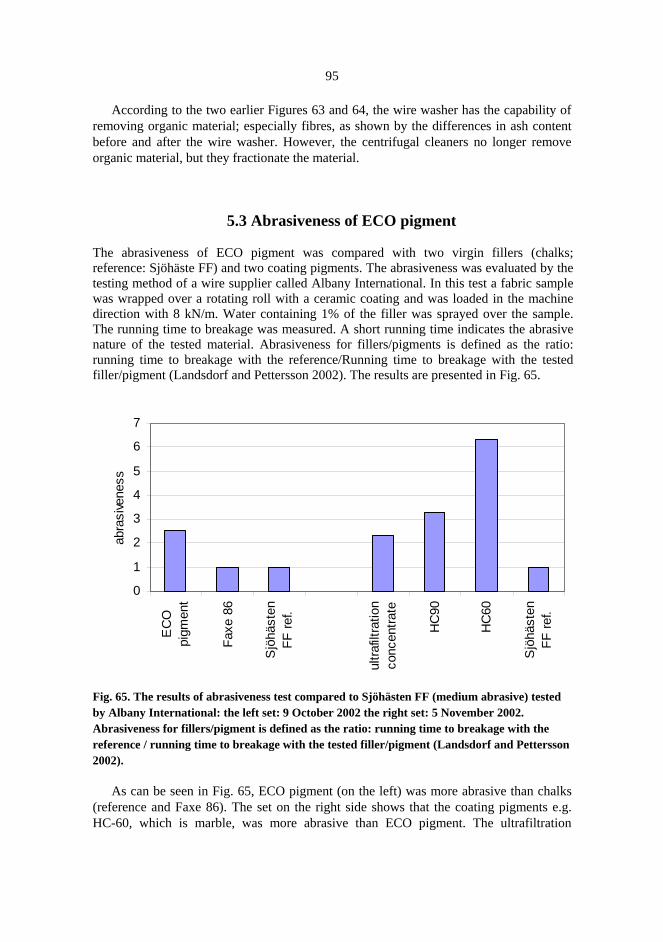
95
According to the two earlier Figures 63 and 64, the wire washer has the capability of removing organic material; especially fibres, as shown by the differences in ash content before and after the wire washer. However, the centrifugal cleaners no longer remove organic material, but they fractionate the material.
5.3 Abrasiveness of ECO pigment The abrasiveness of ECO pigment was compared with two virgin fillers (chalks; reference: Sjöhäste FF) and two coating pigments. The abrasiveness was evaluated by the testing method of a wire supplier called Albany International. In this test a fabric sample was wrapped over a rotating roll with a ceramic coating and was loaded in the machine direction with 8 kN/m. Water containing 1% of the filler was sprayed over the sample. The running time to breakage was measured. A short running time indicates the abrasive nature of the tested material. Abrasiveness for fillers/pigments is defined as the ratio: running time to breakage with the reference/Running time to breakage with the tested filler/pigment (Landsdorf and Pettersson 2002). The results are presented in Fig. 65.
0
1
2
3
4
5
6
7
EC
Opi
gmen
t
Faxe
86
Sjö
häst
enFF
ref.
ultra
filtra
tion
conc
entra
te
HC
90
HC
60
Sjö
häst
enFF
ref.
abra
sive
ness
Fig. 65. The results of abrasiveness test compared to Sjöhästen FF (medium abrasive) tested by Albany International: the left set: 9 October 2002 the right set: 5 November 2002. Abrasiveness for fillers/pigment is defined as the ratio: running time to breakage with the reference / running time to breakage with the tested filler/pigment (Landsdorf and Pettersson 2002).
As can be seen in Fig. 65, ECO pigment (on the left) was more abrasive than chalks (reference and Faxe 86). The set on the right side shows that the coating pigments e.g. HC-60, which is marble, was more abrasive than ECO pigment. The ultrafiltration
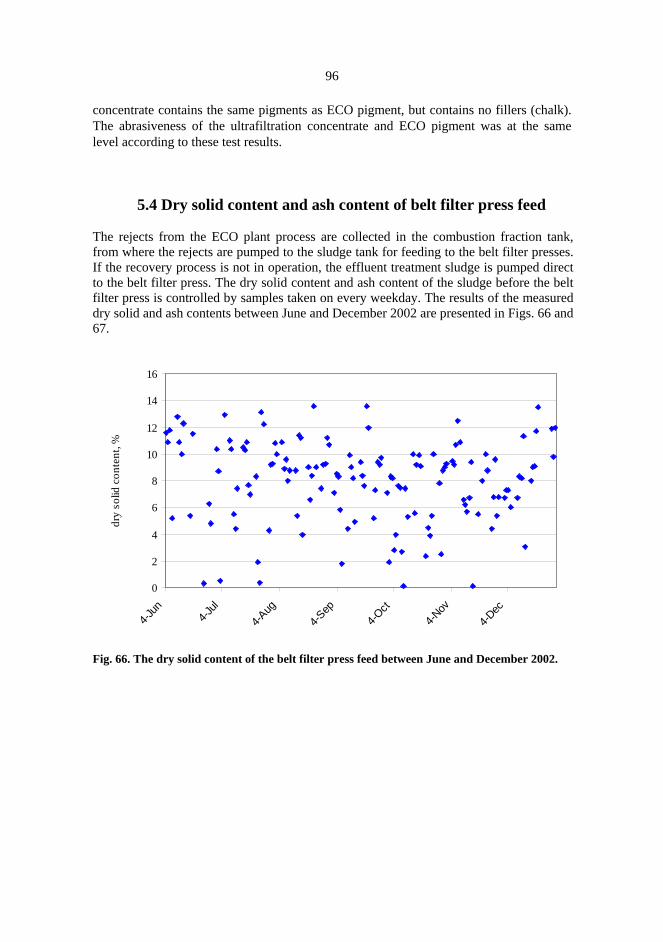
96
concentrate contains the same pigments as ECO pigment, but contains no fillers (chalk). The abrasiveness of the ultrafiltration concentrate and ECO pigment was at the same level according to these test results.
5.4 Dry solid content and ash content of belt filter press feed The rejects from the ECO plant process are collected in the combustion fraction tank, from where the rejects are pumped to the sludge tank for feeding to the belt filter presses. If the recovery process is not in operation, the effluent treatment sludge is pumped direct to the belt filter press. The dry solid content and ash content of the sludge before the belt filter press is controlled by samples taken on every weekday. The results of the measured dry solid and ash contents between June and December 2002 are presented in Figs. 66 and 67.
0
2
4
6
8
10
12
14
16
4-Jun
4-Jul
4-Aug
4-Sep
4-Oct
4-Nov
4-Dec
dry
solid
con
tent
, %
Fig. 66. The dry solid content of the belt filter press feed between June and December 2002.
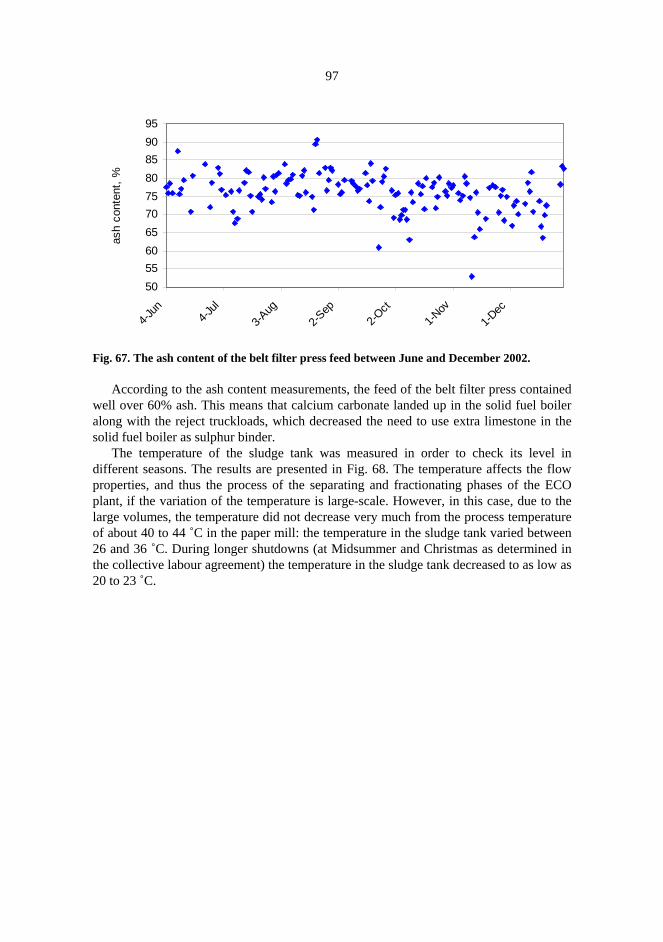
97
50556065707580859095
4-Jun
4-Jul
3-Aug
2-Sep
2-Oct
1-Nov
1-Dec
ash
cont
ent,
%
Fig. 67. The ash content of the belt filter press feed between June and December 2002.
According to the ash content measurements, the feed of the belt filter press contained well over 60% ash. This means that calcium carbonate landed up in the solid fuel boiler along with the reject truckloads, which decreased the need to use extra limestone in the solid fuel boiler as sulphur binder.
The temperature of the sludge tank was measured in order to check its level in different seasons. The results are presented in Fig. 68. The temperature affects the flow properties, and thus the process of the separating and fractionating phases of the ECO plant, if the variation of the temperature is large-scale. However, in this case, due to the large volumes, the temperature did not decrease very much from the process temperature of about 40 to 44 ˚C in the paper mill: the temperature in the sludge tank varied between 26 and 36 ˚C. During longer shutdowns (at Midsummer and Christmas as determined in the collective labour agreement) the temperature in the sludge tank decreased to as low as 20 to 23 ˚C.

98
20
25
30
35
40
4-Jun
4-Jul
3-Aug
2-Sep
2-Oct
1-Nov
1-Dec
tem
pera
ture
, ˚C
Fig. 68. Temperature of the belt filter press feed between June and December 2002.
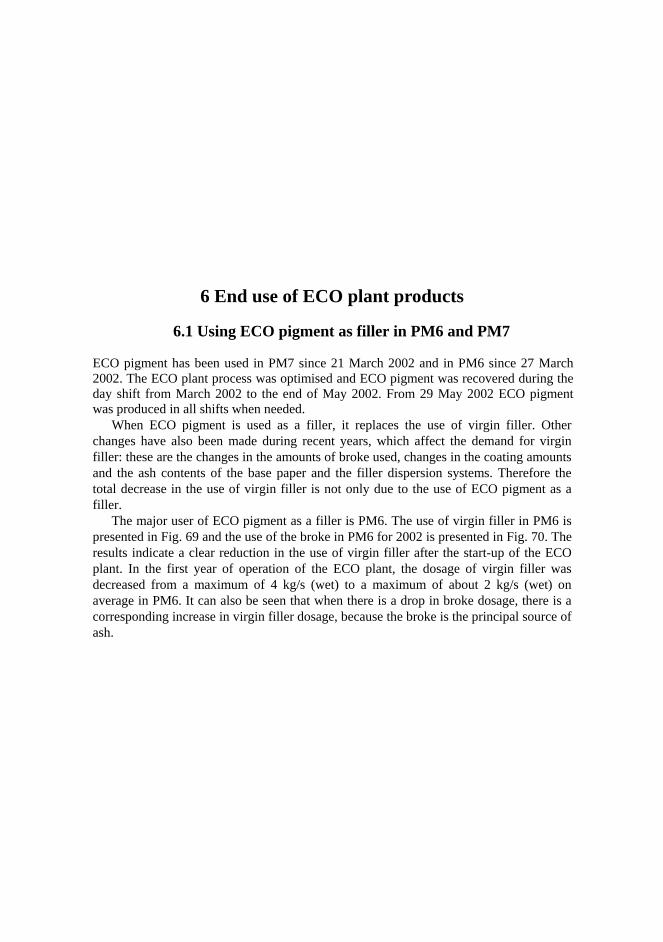
6 End use of ECO plant products
6.1 Using ECO pigment as filler in PM6 and PM7 ECO pigment has been used in PM7 since 21 March 2002 and in PM6 since 27 March 2002. The ECO plant process was optimised and ECO pigment was recovered during the day shift from March 2002 to the end of May 2002. From 29 May 2002 ECO pigment was produced in all shifts when needed.
When ECO pigment is used as a filler, it replaces the use of virgin filler. Other changes have also been made during recent years, which affect the demand for virgin filler: these are the changes in the amounts of broke used, changes in the coating amounts and the ash contents of the base paper and the filler dispersion systems. Therefore the total decrease in the use of virgin filler is not only due to the use of ECO pigment as a filler.
The major user of ECO pigment as a filler is PM6. The use of virgin filler in PM6 is presented in Fig. 69 and the use of the broke in PM6 for 2002 is presented in Fig. 70. The results indicate a clear reduction in the use of virgin filler after the start-up of the ECO plant. In the first year of operation of the ECO plant, the dosage of virgin filler was decreased from a maximum of 4 kg/s (wet) to a maximum of about 2 kg/s (wet) on average in PM6. It can also be seen that when there is a drop in broke dosage, there is a corresponding increase in virgin filler dosage, because the broke is the principal source of ash.

100
0
0.5
1
1.5
2
2.5
3
3.5
4
4.5
1-Jan-02
20-Feb-0
2
11 -Apr-0
2
31 -May-0
2
20-Jul-0
2
8-Sep-02
28-Oct-
0 2
virg
in f
ille
r d
osag
e, k
g/s
Fig. 69. Virgin filler dosage, kg/s in PM6 in 2002; start-up of use of ECO pigment: 27 March 2002.
Fig. 70. Broke dosage, kg/s in PM6 in 2002; start-up of use of ECO pigment: 27 March 2002.
ECO pigment is used also in PM7. The need for virgin filler is not as much as in PM6 due to the lower grammages of PM7, as shown in Fig. 71. The dosage of virgin filler was decreased from the maximum level of about 1 kg/s (wet) before the ECO plant to about 0.2 to 0.7 kg/s (wet). The broke dosage of PM7 is presented in Fig. 72.
2.00
3.00
4.00
5.00
6.00
7.00
8.00
1-Ja
n-02
20 -Feb-0
2
11-Apr
-02
31-May
-02
20-Jul-0
2
8-Sep-0
2
28-Oct-
0 2
brok
e d
osag
e, k
g/s
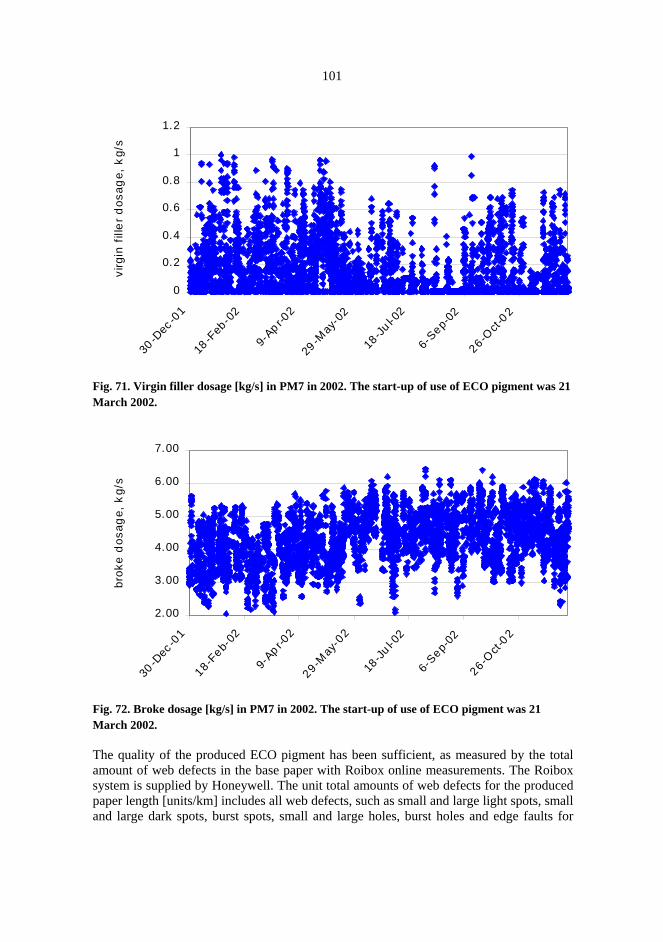
101
Fig. 71. Virgin filler dosage [kg/s] in PM7 in 2002. The start-up of use of ECO pigment was 21 March 2002.
2.00
3.00
4.00
5.00
6.00
7.00
30-D
ec-0
118-F
eb-02
9-Ap r-0
229-M
ay-0
2
18-Ju
l-02
6-Sep-
02
26-Oct-
0 2
brok
e d
osag
e, k
g/s
Fig. 72. Broke dosage [kg/s] in PM7 in 2002. The start-up of use of ECO pigment was 21 March 2002. The quality of the produced ECO pigment has been sufficient, as measured by the total amount of web defects in the base paper with Roibox online measurements. The Roibox system is supplied by Honeywell. The unit total amounts of web defects for the produced paper length [units/km] includes all web defects, such as small and large light spots, small and large dark spots, burst spots, small and large holes, burst holes and edge faults for
0
0.2
0.4
0.6
0.8
1
1.230
-Dec
-01
18-F
eb-0
2
9-Ap r-0
229
-May
-02
18-Ju
l-02
6-Sep-
0226-O
ct-0 2
virg
in f
ille
r d
osag
e, k
g/s
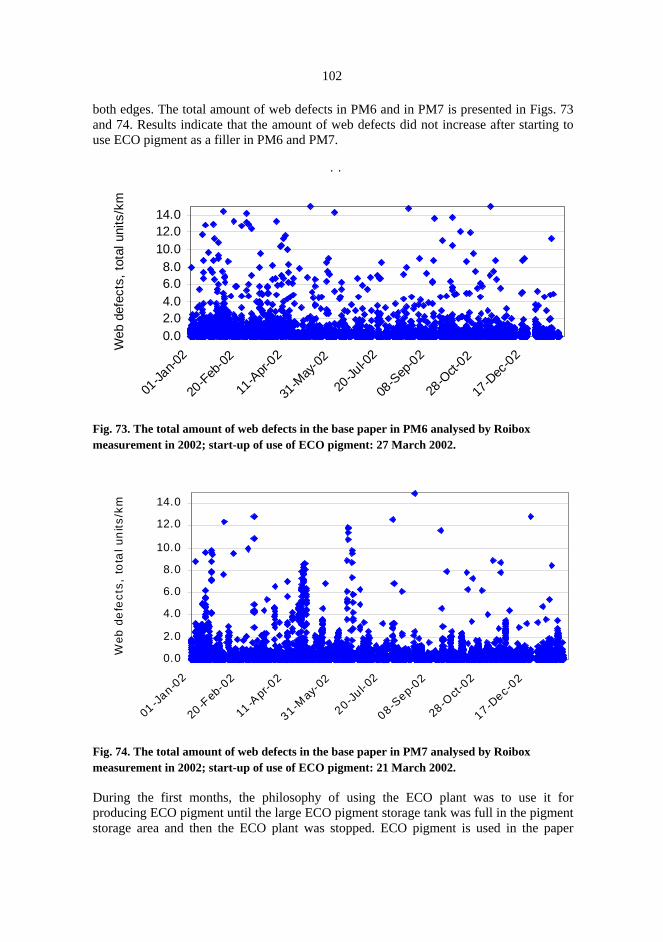
102
both edges. The total amount of web defects in PM6 and in PM7 is presented in Figs. 73 and 74. Results indicate that the amount of web defects did not increase after starting to use ECO pigment as a filler in PM6 and PM7.
. .
0.02.04.06.08.0
10.012.014.0
01-Ja
n-02
20-Feb
-02
11-A
pr-02
31-M
ay-02
20-Ju
l-02
08-S
ep-02
28-O
ct-02
17-D
ec-02
Web
def
ects
, tot
al u
nits
/km
Fig. 73. The total amount of web defects in the base paper in PM6 analysed by Roibox measurement in 2002; start-up of use of ECO pigment: 27 March 2002.
0.0
2.0
4.0
6.0
8.0
10.0
12.0
14.0
01 -Jan-02
20 -Feb-0
2
11 -Apr-0
2
31-May-0
2
20-Jul-0
2
08-Sep-0
2
28-Oct-
02
17-Dec-0
2
Web
de
fect
s, t
ota
l un
its/k
m
Fig. 74. The total amount of web defects in the base paper in PM7 analysed by Roibox measurement in 2002; start-up of use of ECO pigment: 21 March 2002. During the first months, the philosophy of using the ECO plant was to use it for producing ECO pigment until the large ECO pigment storage tank was full in the pigment storage area and then the ECO plant was stopped. ECO pigment is used in the paper
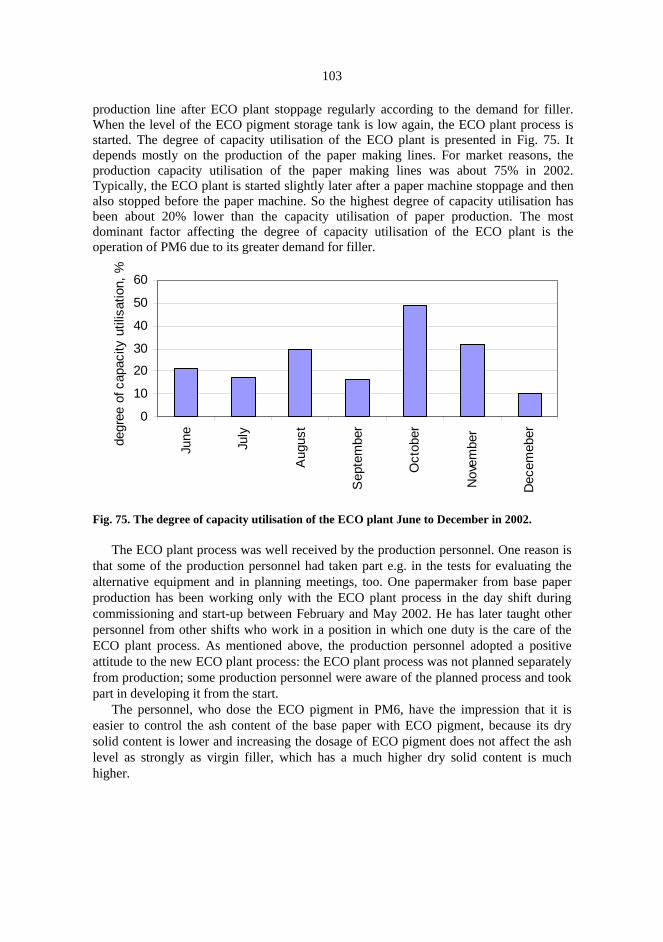
103
production line after ECO plant stoppage regularly according to the demand for filler. When the level of the ECO pigment storage tank is low again, the ECO plant process is started. The degree of capacity utilisation of the ECO plant is presented in Fig. 75. It depends mostly on the production of the paper making lines. For market reasons, the production capacity utilisation of the paper making lines was about 75% in 2002. Typically, the ECO plant is started slightly later after a paper machine stoppage and then also stopped before the paper machine. So the highest degree of capacity utilisation has been about 20% lower than the capacity utilisation of paper production. The most dominant factor affecting the degree of capacity utilisation of the ECO plant is the operation of PM6 due to its greater demand for filler.
0
10
20
30
40
50
60
June
July
Aug
ust
Sep
tem
ber
Oct
ober
Nov
embe
r
Dec
emeb
erdegr
ee o
f cap
acity
util
isat
ion,
%
Fig. 75. The degree of capacity utilisation of the ECO plant June to December in 2002.
The ECO plant process was well received by the production personnel. One reason is that some of the production personnel had taken part e.g. in the tests for evaluating the alternative equipment and in planning meetings, too. One papermaker from base paper production has been working only with the ECO plant process in the day shift during commissioning and start-up between February and May 2002. He has later taught other personnel from other shifts who work in a position in which one duty is the care of the ECO plant process. As mentioned above, the production personnel adopted a positive attitude to the new ECO plant process: the ECO plant process was not planned separately from production; some production personnel were aware of the planned process and took part in developing it from the start.
The personnel, who dose the ECO pigment in PM6, have the impression that it is easier to control the ash content of the base paper with ECO pigment, because its dry solid content is lower and increasing the dosage of ECO pigment does not affect the ash level as strongly as virgin filler, which has a much higher dry solid content is much higher.

104
6.2 Replacing virgin filler ECO pigment replaces part of the virgin filler. Part of the ash of the base paper is from the broke. The consumption of virgin filler, abs. dry t/month is presented in Fig. 76. Results show that after start-up and the optimising period there was a clear reduction in consumption of virgin filler. Later the consumption of virgin filler varied between 600 and 950 t/month (abs. dry) in the mill of this study.
0.00
200.00
400.00
600.00
800.00
1000.00
1200.00
1400.00
1600.00
Jan. Feb. Mar. Apr. May Jun. Jul. Aug. Sep. Oct. Nov. Dec.cons
umpt
ion
of v
irgin
fille
r, ab
s. d
ry t/
mon
th
Fig. 76. The consumption of virgin filler [t/month] (abs. dry) in the mill of this study in 2002. The start-up of use of ECO pigment was in the end of March 2003.
The consumption of virgin filler, abs. dry kg /t produced paper, is presented in Fig. 77. It shows that a clear reduction in consumption is also seen on this scale, after the start-up of the ECO plant. The use of virgin filler has decreased from over 20 kg/t produced paper before the ECO plant to 10 kg/t produced paper at its lowest consumption after start-up of the ECO plant during 2002, calculated from monthly consumption figures for virgin fillers.
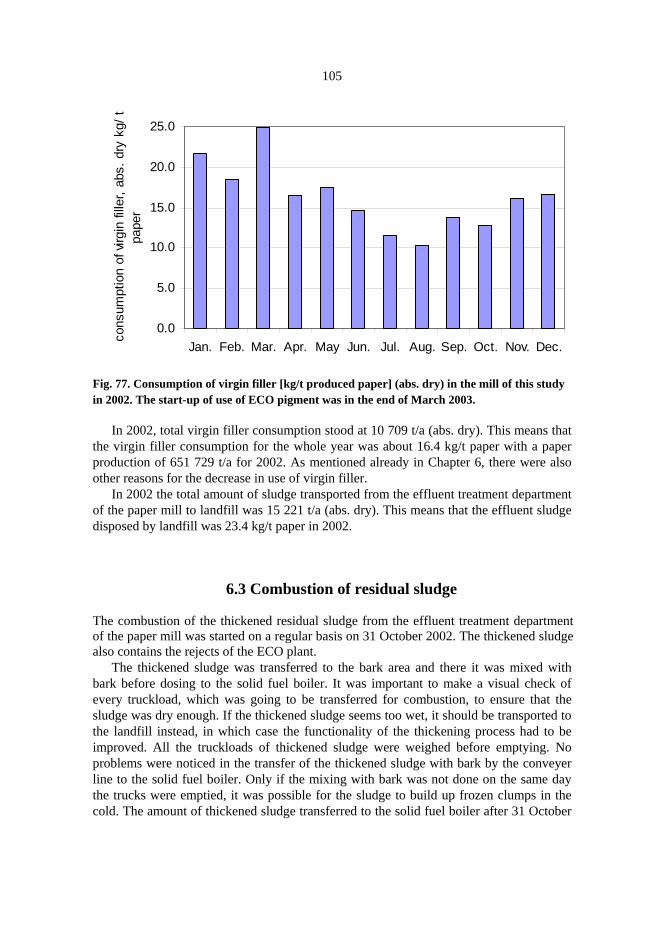
105
0.0
5.0
10.0
15.0
20.0
25.0
Jan. Feb. Mar. Apr. May Jun. Jul. Aug. Sep. Oct. Nov. Dec. con
sum
ptio
n of
virg
in fi
ller,
abs.
dry
kg/
t pa
per
Fig. 77. Consumption of virgin filler [kg/t produced paper] (abs. dry) in the mill of this study in 2002. The start-up of use of ECO pigment was in the end of March 2003.
In 2002, total virgin filler consumption stood at 10 709 t/a (abs. dry). This means that the virgin filler consumption for the whole year was about 16.4 kg/t paper with a paper production of 651 729 t/a for 2002. As mentioned already in Chapter 6, there were also other reasons for the decrease in use of virgin filler.
In 2002 the total amount of sludge transported from the effluent treatment department of the paper mill to landfill was 15 221 t/a (abs. dry). This means that the effluent sludge disposed by landfill was 23.4 kg/t paper in 2002.
6.3 Combustion of residual sludge The combustion of the thickened residual sludge from the effluent treatment department of the paper mill was started on a regular basis on 31 October 2002. The thickened sludge also contains the rejects of the ECO plant.
The thickened sludge was transferred to the bark area and there it was mixed with bark before dosing to the solid fuel boiler. It was important to make a visual check of every truckload, which was going to be transferred for combustion, to ensure that the sludge was dry enough. If the thickened sludge seems too wet, it should be transported to the landfill instead, in which case the functionality of the thickening process had to be improved. All the truckloads of thickened sludge were weighed before emptying. No problems were noticed in the transfer of the thickened sludge with bark by the conveyer line to the solid fuel boiler. Only if the mixing with bark was not done on the same day the trucks were emptied, it was possible for the sludge to build up frozen clumps in the cold. The amount of thickened sludge transferred to the solid fuel boiler after 31 October

106
2002, is presented in Fig. 78. The combustion trials were made with 273 t (abs. dry) of thickened sludge (33 truck loads) earlier in 2002.
0.0
100.0
200.0
300.0
400.0
500.0
600.0
700.0
800.0
900.0
abs.
dry
t/m
onth
abs. dry t/month 16.3 434.8 509.2 825.8 553.4 395.3
October 16.3 t/d
monthly av.
November 14.5 t/d
monthly av.
December 16.4 t/d
monthly av.
January 26.6 t/d
monthly av.
February 19.8 t/d
monthly av.
March 12.8 t/d
monthly av.
Fig. 78. The combustion of thickened effluent treatment sludge. Transfer of thickened sludge to the solid fuel boiler from 31 October 2002 to the end of March 2003.
The amounts of peat and bark used and the SO2 emissions from the solid fuel boiler between October 2002 and March 2003 are presented in Table 7 with results from between October 2001 and March 2002 without the combustion of the thickened effluent treatment sludge as a reference. The use of peat varies, and the need to use peat as a fuel is greater in winter than in summer. It is known that SO2 emissions depend greatly e.g. on the amount of peat used as fuel. When comparing the amounts of peat used and the SO2 emissions of the solid fuel boiler it was seen that it was possible to use more peat as a fuel with same SO2-emissions when enough effluent treatment sludge was used in combustion. The effluent treatment sludge contains calcium carbonate and has a similar effect in the combustion process as limestone, which is commonly used as a sulphur binder.

107
Table 7. The amounts of peat and bark used (wet tons) and SO2 emissions for the solid fuel boiler of Oulun Voima Oy. peat used,
t/month bark used, t/month
total, peat and bark used, t/month
proportion of the sludge of main fuels, %
SO2 emissions, mg/MJ
With effluent treatment sludge:
October 2002 25 249 19 645 44 894 0.08 120 November 2002 37 732 24 091 61 823 1.50 130 December 2002 54 671 20 854 75 525 1.45 165 January 2003 February 2003
53 915 47 955
29 342 19 686
83 257 67 641
2.13 1.76
130 135
March 2003 37 844 22 945 60 789 1.40 107 Without effluent treatment sludge:
October 2001 13 901 22 654 36 555 - 70 November 2001 13 814 20 148 33 962 - 91 December 2001 28 589 21 585 50 174 - 139 January 2002 35 068 20 677 55 745 - 150 February 2002 25 372 22 427 47 799 - 100 March 2002 26 380 23 674 50 054 - 108
In addition to combustion, the thickened sludge was utilised in groundwork, for compacting and as a surface cover for the old landfills in 2002. The total amount of thickened effluent sludge of the paper mill utilised was 19 504 t/a (abs. dry), which was transferred from landfill to applications outside the mill.
7 Further alternatives for using ECO plant products
7.1 Usability of recovered pigment in coating colour Further alternatives were considered for more effective use of ECO pigment in the future. The proportion of coating pigment has been over 90% of all fillers and pigments used during recent years (see Chapter 3.1.1.) in the mill of this study, meaning that ECO pigment consists mainly of pigments used in coating colour. This gives rise naturally to a study of the possibilities of using ECO pigment in coating colour, because enlarging the application of ECO pigment would increase the degree of capacity utilisation for the ECO plant in many situations and would generate both ecological and economic benefits. The mill of this study has experiences of using ultrafiltrate concentrate in a coating application (Kraatari et al. 1999) where the ultrafiltrate concentrate contains the pigments used in the coating colour, recovered from diluted coating effluents.
The most significant difference between the coating pigments or ultrafiltration concentrate and ECO pigment, which is produced at the recovery process being presented, is the final dry solid content. The low dry solid content of the ECO pigment does not restrict its use as a filler, because the dry solid contents in stock preparation overall are near the dry solid content of ECO pigment and in this case the volume flows are large. The dry solid content of coating colours is kept at a high level because of the quality and runnability properties required for multicoated fine paper production.
Because of the lower dry solid content of ECO pigment after thickening compared with virgin pigments and because it is probably of lower quality than the coating pigments normally used, ECO pigment was studied for use as in Sym-coating and in pre-coating like the ultrafiltration concentrate is presently used. The ash content of ECO pigment is lower because it contains more fibres than the ultrafiltrate concentrate, and ECO pigment contains more particles with a larger size than the ultrafiltrate concentrate.

109
7.2 Pilot tests for using ECO pigment in coating colour Two pilot coating tests on using ECO pigment in the coating colour were done in KCL during the end of 2002. ECO pigment was concentrated by letting it settle to a dry solid content of 10.5 % and the amount of use was 5 parts in the coating colour. The target was to evaluate the running properties in the coating machine and the paper quality and printing properties when using ECO pigment in the coating colour.
ECO pigment was used both in the pre-coating with jet application and Sym-coating with film application in these pilot tests, similarly to the way ultrafiltrate concentrate is used nowadays in the mill of this study. Because of the low dry solid content of ECO pigment, the consistencies of the coating colours were about 59%, even though the other pigments in the coating colour were chosen from the pigments used at the mill of this study to achieve the highest dry solid content for the coating colour. The amounts of coating used in pre-coating tests were 13.5 g/m2 for pre-coating and 12 g/m2 for the top coating with 80 g/m2 base paper and in Sym-coating tests 14 g/m2 for Sym-coating and 10 g/m2 for the top coating with 58 g/m2 base paper.
The results obtained indicated that there were no runnability problems such as stripes or any other coating defects in the coated product when using the present ECO pigment. Results from paper quality measurements and printing results also showed that there were no signs of faults or any other failures associated e.g. with the coarser particle size distribution of ECO pigment. The brightness of ECO pigment is lower than the coating pigments normally used, and if needed, this could be compensated by adding optical brightener in relation to the amount of ECO pigment used.
Table 8 shows a summary of the paper quality and printing property changes in relation to the reference according to the pilot coating tests with ECO pigment.
Table 8. A summary of paper quality and printing property changes (+ improvement, - deterioration), in relation to the reference from the pilot coating runs with ECO pigment. Gloss is measured by 75˚TAPPI, PPS is measured by SCAN-P 76:95, opacity is measured by ISO 247.
ECO pigment
in pre-coating ECO pigment in Sym-coating
Gloss, white paper + 4.5% - 1.1% Gloss, printed, 3 colour compact surface + 1.4% - 1.4% PPS, white paper + 9.4% + 1.1% PPS, printed, 3 colour compact surface + 6.5% - 2.9% Opacity, white paper + 1.1% + 0.9%

110
7.3 Possibility of increasing the dry solid content of recovered pigment slurry for the coating application
After studying the various possibilities for increasing the dry solid content of the
recovered pigment sludge to as high a level as 45 to 50%, the decanter centrifuge was found to be a good mechanically-based solution. During this study, two decanter centrifuges from different suppliers were familiarised on mill visits. In both cases, the decanter centrifuge was used for increasing the dry solid content of calcium carbonate- containing slurries.
To evaluate the suitability of the decanter centrifuge for increasing the dry solid content of the recovered pigment slurry in the mill of this study, two different pilot tests were made for possible future actions. Firstly, one test was performed with the coating effluents and the ultrafiltrate concentrate using a rented full-scale decanter centrifuge supplied by Noxon. Secondly, one pilot test was made with the screened effluent treatment sludge, to evaluate ability of the decanter centrifuge to increase the dry solid content of a material fairly similar to ECO pigment. Both pilot tests were made before the start-up of the ECO plant.
Because it is important that the thickened sludge can be pumped, different solutions after thickening were studied both on laboratory and pilot scale.
In the case of ECO pigment, the ECO plant process should be equipped with an extra separation stage of screening if ECO pigment is going to be used in the coating application in the future, because of the stricter requirements for coating pigment than for filler. Even though the coating pilot tests showed that there is no effect on the paper or printing properties of multicoated fine paper associated with the coarseness of pigments, when using 5 parts ECO pigments in Sym or pre-coating, screening is advisable. Nowadays pressure screening is done for ECO pigment used as a filler in the stock preparation department before dosage.
7.3.1 Full-scale test using decanter centrifuge with coating colour effluents and ultrafiltrate concentrate
A full-scale test of Noxon’s DC 20 decanter centrifuge was carried out in January 2002 with coating colour effluents, which had a dry solid content varying from 1.5 to 7% and ultrafiltrate concentrate, which had a dry solid content varying from 22.9 to 30.9% in the CM7 coating kitchen. The test Noxon decanter centrifuge was fitted with a control PC, polymer dosage equipment, feed pump and screw conveyor in a lorry trailer. The volume capacity of the DC 20 was 8 to 25 m3/h and the maximum dry solid amount was 800 kg/hour.
The principle of the Noxon decanter centrifuge is as follows: the central part of the machine is a rotating drum, which contains an independently rotating screw. The sludge is fed in via the inlet pipe to the mixing chamber in the core of the first part of the screw, where polymer is added. Then the sludge passes through ports in the mixing chamber out towards the outer walls of the drum by rotation and dewatering begins. The dewatered
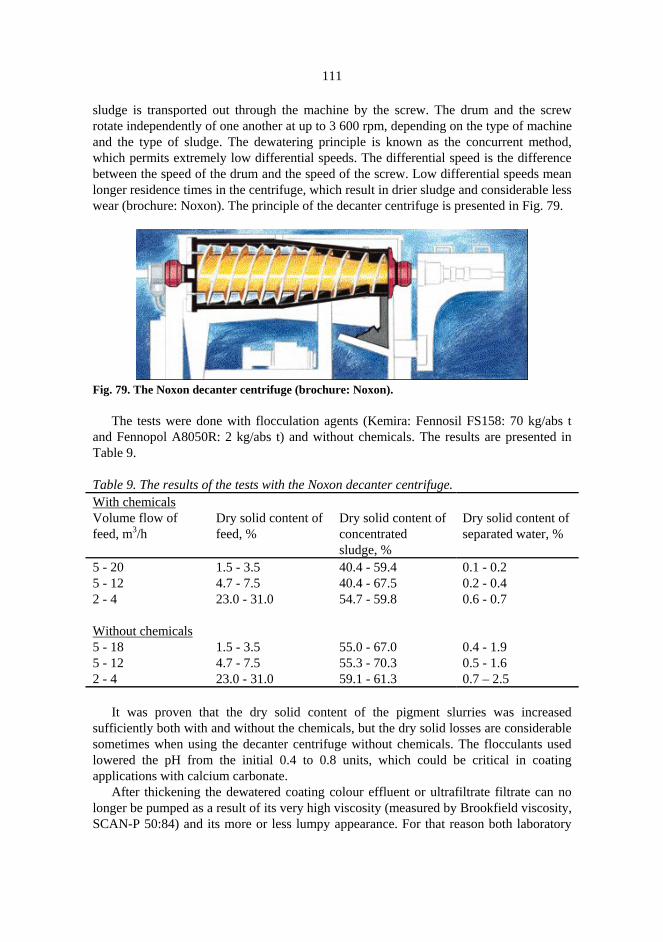
111
sludge is transported out through the machine by the screw. The drum and the screw rotate independently of one another at up to 3 600 rpm, depending on the type of machine and the type of sludge. The dewatering principle is known as the concurrent method, which permits extremely low differential speeds. The differential speed is the difference between the speed of the drum and the speed of the screw. Low differential speeds mean longer residence times in the centrifuge, which result in drier sludge and considerable less wear (brochure: Noxon). The principle of the decanter centrifuge is presented in Fig. 79.
Fig. 79. The Noxon decanter centrifuge (brochure: Noxon).
The tests were done with flocculation agents (Kemira: Fennosil FS158: 70 kg/abs t
and Fennopol A8050R: 2 kg/abs t) and without chemicals. The results are presented in Table 9.
Table 9. The results of the tests with the Noxon decanter centrifuge. With chemicals Volume flow of feed, m3/h
Dry solid content of feed, %
Dry solid content of concentrated sludge, %
Dry solid content of separated water, %
5 - 20 1.5 - 3.5 40.4 - 59.4 0.1 - 0.2 5 - 12 4.7 - 7.5 40.4 - 67.5 0.2 - 0.4 2 - 4 23.0 - 31.0 54.7 - 59.8 0.6 - 0.7 Without chemicals 5 - 18 1.5 - 3.5 55.0 - 67.0 0.4 - 1.9 5 - 12 4.7 - 7.5 55.3 - 70.3 0.5 - 1.6 2 - 4 23.0 - 31.0 59.1 - 61.3 0.7 – 2.5
It was proven that the dry solid content of the pigment slurries was increased
sufficiently both with and without the chemicals, but the dry solid losses are considerable sometimes when using the decanter centrifuge without chemicals. The flocculants used lowered the pH from the initial 0.4 to 0.8 units, which could be critical in coating applications with calcium carbonate.
After thickening the dewatered coating colour effluent or ultrafiltrate filtrate can no longer be pumped as a result of its very high viscosity (measured by Brookfield viscosity, SCAN-P 50:84) and its more or less lumpy appearance. For that reason both laboratory

112
studies and one pilot test were made with an Atrex disperser in Megatrex Oy, Kylmäkoski. The target of these tests was to find a method of making the dewatered sludge pumpable and suitable for dosing in coating applications.
At first, the need for the dispersing agent (tradename: Coatex XLV) was evaluated from samples in which the viscosity was not measurable. The target was to get the viscosity to the same level as that in the coating colours used. The dispersing agent was added to the sample (500 g wet) in the laboratory Diaf blender and the amount of dispersing agent required varied mainly between 0.2 and 1 parts, on average 0.5 parts. The conclusion drawn from these tests was that the dewatered sludge should be made pumpable in addition to other methods with or without any dispersing agent at all because of the considerable need for dispersant.
In the second part of the laboratory studies a viscosity decrease was made by water dosage. The initial dry solid content was 59.9%, and the sludge was diluted to 54.9% until the viscosity could be measured. Then two more diluted samples were made: 50.7% and 45.6%. The viscosity was measured from these three samples after dosage, 24 h after dosage and 48 h after dosage. The results are presented in Table 10. According to the results the viscosity is kept at the targeted level for two days at the point where the sample was diluted to 45.6%.
In the third part of the laboratory studies the viscosity decrease was made using both water and dispersing agent. The initial dry content was the same at 59.9% and after dosage of 0.43 parts dispersing agent the viscosity was measurable. Then two samples were diluted from the sample containing dispersing agent, which had a dry solid content of 55.2% and 50.2%. The results are presented in Table 10. According to the results, the viscosity is kept nearly at the targeted level for two days at the point where the sample was diluted to 50.2%, when both water and dispersing agent are used. Table 10. The results from laboratory studies. A) Without Dispersant: Dry solid content, %
Viscosity directly, cP
Viscosity after 24 hours, cP
Viscosity after 48 hours cP
Observations
54.9 10000 9000 14000 spindel: 7, T =24°C, after 24 and 48 h: T of room
50.7 8400 8400 8700 spindel 6, T =24.5°C, after 24 and 48 h: T of room
45.6 4936 2848 2940 spindel 5, T =22°C, after 24 and 48 h: T of room
B) With Dispersant:
59.7 2116 7780 15100 spindel 5, after 24 h spindle 6, T =25°C, after 24 h: T of room
55.2 832 3020 4920 spindel 5, T =25°C, after 24 h: T of room
50.2 412 904 2100 spindel 5, T =27°C, after 24 h: T of room
113
The pilot test with the Atrex disperser in Megatrex Oy, Kylmäkoski, was carried out with dewatered coating colour effluent, which had an initial dry content of 60%. The Atrex High Intensity Dispersers were developed on the basis of impact mixing technology for continuous slurrying processes for paper pigments.
Because of the state of the dewatered sludge, there were difficulties in feeding the sludge with a hopper equipped with a feed screw. The sludge adhered to the wall of the hopper and the screw clogged. So, it is important to feed the dewatered sludge direct to Atrex at the rate at which it is dried. The amounts of dispersant agent used when dispersant was used were 0.1 to 0.5 parts. Some of the test points were done by diluting with water.
The results obtained indicate that it is possible to get effective mixing with Atrex via dilution of the dry content to 45% and making the dewatered sludge pumpable: the viscosity is about 2476 cP (Brookfelt: operation speed 100 rpm). The viscosity measured after 48 h was at the same level: 2888 cp. It should be noticed that in production the temperature is higher than on laboratory scale and the dry solid content level could be a little higher to get a pumpable product with dilution. By using a relatively large amount of dispersant agent (0.4 to 0.5 parts) the pumpable product has a higher dry content, up to 57%, but it is not as stable as the viscosity in the water-diluted product at the level of 45%.
7.3.2 Pilot tests of decanter centrifuge with pre-screened effluent treatment sludge
The first pilot tests for increasing the dry solid content of ECO pigment were made before the ECO plant start-up in June 2001. The test plant was in Oelde, Germany, where a decanter centrifuge of type CA 225-00-33 made by Gea Westfalia were tested. The tested sludge was the effluent treatment sludge of the mill of this study, which was pre-screened with a sieve of 54 µm to remove large particles that were separated off to simulate ECO pigment. The polymer flocculent used was Fennopol A321.
The results showed that increasing the dry solid content of the tested pigment slurry with a decanter centrifuge was possible. However, high throughput capacities with good particle separation efficiency can only be attained when flocculent is used. Feed volume flows were between 500 and 3000 l/h and dry solid contents in feed were between 2.1% to 9.4%. In that case the dry solid contents of the product varied from a low feed dry solid content of 29% to a high feed dry solid content of 48%. The dry solid content of the removed water was 0.1 to 0.4%, when 15 to 30 l of polymer was used per hour. If the polymer was not used, which was possible at the high feed dry solid content, the dry solid content of the removed water was between 1.2 to 3.2%.
114
7.4 Conclusion The pilot test results obtained indicate that it is possible to use ECO pigment in the coating colours without any paper defects or runnability problems, at least in the proportion of 5 parts. This means that the dry solid content of ECO pigment should be increased up to nearly 50%.
The results of the ultrafiltrate concentrate and the screened effluent treatment sludge show that a maximum increase of up to 70% in dry solid content could be achieved with a decanter centrifuge. The thickened sludge appears not to be pumpaple after the decanter centrifuge, and so the dispersion tests with dispersion chemicals and an Atrex disperser were studied with the addition of the required dilution water. These tests showed that it was possible to make the thickened slurry pumpable, when the dry solid content varied between 45 and 50%.
If it is required to use ECO pigment in the coating colour, some process changes should be made. In addition to thickening ECO pigment up to the level of 45 to 50%, the present ECO plant process should also be equipped with an extra separation stage of screening because of the requirements for coating pigment are more stricter than those for filler.
8 Ecology of ECO plant
8.1 Main results of study The objective of this study was set at the start of the year 2000. The aim was to demonstrate an ecological and economic recovery process by designing a novel pigment recovery process, which recovers the material from the effluent treatment sludge of the paper mill. The recoverable material is utilised as a filler in producing multicoated fine paper used for art printing purposed.
The start-up of the ECO plant process was on 12 March 2002. The recovered material can be used as a filler in both paper machines of the mill of this study, as proven in Chapter 6. There are three sources from which the ash content of the base paper is composed since the start-up of the ECO plant: virgin filler, broke and ECO pigment. Since the start-up of the ECO plant a decrease in the consumption of virgin filler has been seen, especially in PM6. As stated earlier, there have also been other changes such as changes in the amounts of broke, changes in the amount of coating and in the ash targets of the base paper and a filler dispersion system has been adopted in base paper production, which have changed the amounts of virgin filler required during the last few years.
In the first year of operation of the ECO plant, the dosage of virgin filler was decreased from a maximum of 4 kg/s (wet) to a maximum of about 2 kg/s (wet) on average in PM6, and the some decrease has also been observed in the dosage of virgin filler in PM7 from the maximum level of about 1 kg/s (wet) before the ECO plant to about 0.2 to 0.7 kg/s (wet). Results also indicate that use of virgin filler has decreased from over 20 kg/t produced paper before the ECO plant to 10 kg/t produced paper at its lowest consumption after start-up of ECO plant during 2002, calculated from monthly consumption figures for virgin fillers. In total, the need for virgin filler was 16.4 kg/t paper in 2002.
The demand for the production of ECO pigments depends on the utilisation degree of the paper making capacity. The utilisation degree of the capacity of the ECO plant varied between 10 and 50% in 2002.
The developed process is ecological, because it can recover material for reuse from the effluent treatment sludge of the paper mill. Before the start-up of the ECO plant, the
116
sludge in the effluent treatment was always thickened and carried by the truckload to landfill and the amounts utilised were low and always outside the paper mill area.
From the experiences of using ECO pigment as a filler in a paper machine, the developed and implemented ECO plant process with separating and fractioning phases has been found to be workable for producing ECO pigment (see Chapter 5). The use of ECO pigment has not been found to cause more web defect problems in the base paper than before, according to studies of the number of total web defects in both paper machines with the achieved particle size distribution and because the microbe content has been controlled. Most of the particles i.e. 91.61% on average (deviation: 69.96 to 97.87%) were below 32 µm in size, 4.82% (deviation: 0.76 to 25.96%) of the material had a size between 32 and 45 µm, 2.84% (deviation: 0.64 to 7.73%) of the material had a size between 45 and 80 µm, 0.43% (deviation: 0.09-1.25%) of the material had a size between 80 and 160 µm, 0.26% (deviation: 0.02 to 2.01%) of the material had a size between 160 and 500 µm, and 0.05% (deviation: 0 to 0.37%) of the material had a particle size, which is over 500 µm in 2002. The material left on the 32 and 45 µm sieves consists mainly of pigment, but the material left on the bigger sieves consists mainly of fibres.
The ECO plant process is described in detail in Chapter 4. The main process stages in the ECO plant are the collecting of sludge from effluent treatment in the ECO plant feed tank, after the sludge disintegrater the recoverable material is separated from fibres and other rejects with a wire washer. Then the fractionating of the recoverable material is done with centrifugal cleaners, which have two stages. Chemical treatment by peracetic acid is used as a preservative and for slightly increasing the brightness of the ECO pigment. After that the recoverable material is stored in the pigment storage area and dosed to the paper machines for use as a filler. The rejects from the ECO plant are pumped to the present sludge tank and fed to the belt filter press. The combustion of part of the thickened sludge is done in the solid fuel boiler in the mill area by mixing the thickened sludge with bark in the bark storage area. There have been no problems of feeding the thickened sludge with bark to the solid fuel boiler. The mixing of the sludge with the bark should be done on the same day in the cold, when the trucks are emptied, even if no lumps are inhibiting the feed to the solid fuel boiler. Because the solid fuel boiler uses about 1500 t/d (wet tons) peat and bark as fuel, the designed proportion of thickened sludge is 5.2% maximum. No effects on the combustion process were seen with the direct handling of the thickened effluent treatment sludge. The sludge for thickening contains a generous amount of ash at over 60% (see Chapter 5) and the ash contains mainly CaCO3. The proportion of peat can be as high as 90% of the fuel in the winter and so the calcium carbonate-containing thickened sludge is advantageous in acting as a sulphur binder in the combustion process. Limestone is commonly used as a sulphur binder for that function.
The selection of the process equipment has proven worthwhile, because the ECO pigment targets have been attained and the produced ECO pigment has been able to be used principally as a filler in the paper mill. The availability of the ECO plant has not restricted the use of the ECO plant, because the need for maintenance has been low.
It was targeted in the design that the effluent treatment process could be used without the ECO plant and that the use of the ECO plant would not disrupt the function of the
117
effluent treatment process. That target has been met and the benefits of that has been enjoyed in the situations when there have been standstills in the paper mill and it has not been useful to produce ECO pigment, but the function of the effluent treatment is still essential e.g. for process washing.
8.2 Discussion The chosen process alternatives have proven to be good ones, because the targets regarding the properties of ECO pigment have been achieved. The availability of the ECO plant is also good, which means that there have been only a few situations when there have been stoppages in the ECO plant due to maintenance work. Mainly, the availability of the ECO plant has not restricted the use of ECO pigment in paper production. ECO pigment replaces the use of virgin filler. The required ash content of the base paper is achieved by using ECO pigment and virgin filler in addition to the use of broke.
It was proven that material can be recovered from effluent treatment sludge and used as a filler in the production of multicoated fine paper. It was suspected that the use of material from effluent treatment sludge might increase problems in the form of web defects. According to the experiences of this study, the use of ECO pigment has not increased web defects.
It is not possible to use only ECO pigment as a filler at its present dry solid content, because there is not enough storing capacity so that it could suffice to meet the demand for filler of both paper machines in all situations. However, the production of ECO pigment increases the autarchy of the paper mill concerning filler, which is a great benefit for the paper mill. In addition, there should be a way of handling situations, when the ECO plant is not in production. Therefore in the case of filler applications, there will always be a need to use virgin filler.
There could be even more benefits from the ECO plant, if its degree of capacity utilisation could be increased. When the ECO plant was recovering material, which was to be used as a filler, the highest degree of capacity utilisation was seen to be about 20% lower than the degree of capacity utilisation of paper production in 2002. And in this case, PM6 had a more dominant role because it is also the major user of virgin filler. It was proven that the material from the effluent treatment sludge could be utilised as a filler with this ECO plant and by the experience gained during 2002. The present process has also been proven suitable in pilot tests for producing material that suits the pre-coating and Sym-coating recipe with 5 parts. Before using ECO pigment in the coating colour, its dry solid content has to be increased; the target of the dry solid content should be near 50%. The possible methods for increasing the dry solid content were presented and tested on pilot scale in this study.
118
8.3 Conclusions There were both ecological and economic reasons for coated paper- producing mills to decrease their landfill load because of tighter public regulations and because it is reasonable to use bought raw material effectively. The aim was to demonstrate an ecological and economic recovery process by building a pigment recovery process to recover material from the effluent treatment sludge of the paper mill. The recoverable material could be utilised as a filler. The ECO plant process for this task was implemented, and its ability to produce ECO pigment, which can be utilised as a filler in producing multicoated fine paper used for art printing purposes is shown. The part of thickened effluent treatment sludge, which contains the residue of the ECO plant process and non-recovered solid material from the effluent treatment is transferred to the bark storage area and mixed with bark for combustion in the solid fuel boiler, which utilises mainly bark and peat as fuel. This also brings ecological benefits.
In order to get even more benefits, the degree of utilisation capacity of the ECO plant will be increased. Pre-studies were made on using ECO pigment in other applications also, such as using it in the raw material of coating colour. The ECO plant was able to produce ECO pigment that was proven to suit Sym-coating and pre-coating according to the two pilot-scale coating tests, when the amount of ECO pigment used was 5 parts. The necessary process stage before starting to use ECO pigment in the coating colour is the thickening up to a level of 45 to 50%. The possibilities of increasing the dry solid content of the pigment slurries mechanically were tested in the pilot tests.
9 Summary In this study an ecological and economic pigment recovery process was developed and implemented at Stora Enso Oyj Fine Paper Oulu mill during the period 2000 to 2002. The process recovers material called ECO pigment from the effluent treatment sludge and it was proven to be suitable for use as a filler in the making of multicoated fine paper for art printing purposes.
The ecological objective of this recovery process was to decrease the major discharge, i.e. the effluent treatment sludge from the paper mill to the landfill. The economic point of view was recover the material from the effluent treatment sludge and reuse it as filler, which means savings in filler consumption. The new recovery process began to be developed, because although state-of-the-art technology for pigment recovery was being used, it was not sufficient to get all the re-useable solid material back into the process.
In this study, a partially heuristic and partially evolutionary approach has been applied together in synthesising an optimal process. By studying the literature the filters and centrifugal cleaners of mechanical separation methods were found to suit this case due to the results of a pre-study carried out earlier on the sludge and its properties, the volume flows and the present effluent treatment department and the found targets of the recovery material. The main process equipment was selected finally mainly according to the results of pilot tests with the commercially available equipment. Based on the results of the evaluation of the ECO plant concept before it was built, the causes and consequences of potential failures were studied, and the information obtained was used in process planning.
The ECO plant process consists of the following process stages. First, the effluent treatment sludge is collected in the ECO plant feed tank, after which the sludge is routed to a sludge disintegrater. Next, there is a phase to separate the recoverable material from fibres and other rejects. The equipment used for this purpose is the wire washer. Then, the fractionating of the recoverable material is performed with two-stage centrifugal cleaners. Chemical treatment with peracetic acid is used as the preservative and for increasing the brightness of the ECO pigment a little. After that the recoverable material is stored in the pigment storage area and dosed to the paper machines for use as a filler. The rejects of the ECO plant are pumped to the present sludge tank and fed to the belt
120
filter presses. The combustion of the part of the thickened sludge is done in the solid fuel boiler in the mill area by mixing the thickened sludge with bark in the bark storage area.
Most of the particles in ECO pigment were below 45 µm; the proportion of this of the particle size was 96.4% (on average) according to laboratory studies made between June and December 2002.
The use of ECO pigment has not been found to cause more web defect problems on the base paper than before, according to studies on the number of total web defects in both paper machines with the achieved particle size distribution and because the microbe content has been controlled.
There are three sources from which the ash content of the base paper has been composed since the start-up of the ECO plant, which are the broke, the virgin filler and ECO pigment. Since the start-up of the ECO plant a decrease in the consumption of virgin filler has been seen, especially in PM6. There have also been other changes such as changes in the amounts of broke, changes in the amount of coating and the ash targets of the base paper and the filler dispersion system in base paper production, which have changed the required amounts of virgin filler during recent years in the mill of this study. It has been seen that use of virgin filler has decreased from over 20 kg/t produced paper before the ECO plant to 10 kg/t produced paper at its lowest consumption since the start-up of the ECO plant in 2002, as calculated from the consumption of virgin filler for each month.
The combustion of the thickened effluent treatment sludge containing the residue from the ECO plant process takes place in the solid fuel boiler in the mill area by mixing the thickened sludge with bark in the bark storage area. The amounts combusted have been a maximum of about 27 t/d (monthly average) since October 2002. There have been not any problems in feeding the thickened sludge with bark to the solid fuel boiler. The mixing of the sludge with the bark should be done on the same day the trucks are emptied in cold weather, even if there are no lumps inhibiting the feeding to the solid fuel boiler.
The utilisation degree of the capacity of the ECO plant varied between 10 and 50% in 2002. The expanding of the use of ECO pigment in the coating application has been studied for the future. The ECO plant was able to produce ECO pigment that was proven to suit Sym-coating and pre-coating according to the two pilot-scale coating tests, when the amount of ECO pigment used was 5 parts. The necessary process stage before starting to use ECO pigment in the coating colour is the thickening up to a level of 45 to 50%. Pilot tests with a decanter centrifuge were made and the pumpability of ECO pigment after thickening was achieved using dispersion agents with dilution water. The Atrex disperser was tested in that function in pilot-scale tests. In addition to thickening, the present ECO plant process should also be equipped with an extra separation stage of screening because the requirements are more stricter for coating pigment than those for filler.
References Barnicki SD & Fair JR (1990) Separation system synthesis: a knowledge-based approach.
Part 1. Liquid mixture separations, Industrial & Engineering Chemistry Research 29: 421-432.
Caledonian recovers china clay from the effluent stream (1995). Paper Technology 36(3): p 3.
Coulson JM, Richardson JF & Skinnot RK (1983) Chemical Engineering, Vol. 6 Pergamon Press, Oxford, 305-385.
Evans JCW (1983) Innovative changes at Midtec solve problems, yield big savings. Pulp & Paper 57(7): 123-125.
Evans JCW (1985) Midtec’s sludge disposal produces steam, recovers clay, saves money. Pulp & Paper 59(1): 94-95.
Eykamp W & Steen J (1987) Ultrafilration and reverse osmosis. Handbook of Separation Process Technology. John Wiley & Sons, Inc. USA, 826-839.
Frette T (1995) Caledonian Paper recovers china clay for re-use. World Paper (4): p 42. Flynn Jr. BL (1976) Swiss mill is trying wet air oxidation to get rid of sludge and recover
filler. Paper Trade Journal (5): 23-24. Göttsching L, Hennings G & Dalpke H-L (1977) Wiederverwendung der Asche von
Abwasserschlämmen. Wochenblatt für Papierfabrikation 105(23/24): 953-960. Hurme M (1995) Erotusprosessin valinta. Raportti 28 Teknillinen korkeakoulu, Espoo,
17 p. Ichinose L (1984) Midtec Revisited: What a Difference a Year Makes. PIMA (7): 49-52. IPPC Directive 96/61/EC. see htpp://europa.eu.int/comm./environment/ippc/index.htm Jortama P, Luttinen M., Juutinen V & Suhonen V (2002) Ecology and economy through
pigment recovery. New ECO plant at Stora Enso Fine Paper, Oulu, Finland. Fiber&Paper 4(4): 8-9.
Juutinen V (2001) Viirapesurikirja, Stora Enso Oyj/Oulun tehtaat, EKO-laitos, Viirapesuri, GW-1000, unpublished service manual in Stora Enso Oyj, Fine Paper, Oulu mill.
Kay M (2003) What to do with sludge? It’s best to determine local needs before choosing an option. PPI (8): 19-21.

122
Kelly RM (1987) General processing considerations. Handbook of Separation Process Technology. John Wiley & Sons, Inc. USA, 197-225.
Koepinick M (1997) Landfill waste turns into cash savings. Pulp & Paper Europe (6): 12-15.
Kolaczkowski ST, Plucinski P, Beltran FJ, Rivas FJ & Mc Lurgh DB (1999) Wet air oxidation: A rewiew of process technologies and aspects in reactor design, Chem. Eng. J.: 143-160.
Korpivaara M (2002) Pigmentin talteenotto toteutettu Oulussa. Paper and Timber 84(7): 447-449.
Kraatari T & Ryyppö M (1999) Behandlung und Recycling von Streichfarbenhaltigen Wasser im Werk der Finnischen Stora Enso Oyj, Oulu. Wochenblatt für Papierfabrikation (16): 1032-1035.
Krogerus B & Holmberg M (1992) Kalsiumkarbonaattien ominaisuuksia. KCL seloste 2013, p. 29 (unpublished).
Lansdorf A (2002) Abrasion testing of fillers. FA9-02, 5.11.2002, Report for Stora Enso Oyj Fine Paper Oulu mill.
Lilja K et al. (1997) Solid waste minimisation in the pulp and paper industry. Another Environmental Challenge. Jaakko Pöyry Consulting AB, Lidingö, Sweden, 1196 p.
Martin RSE & Cowling RD (1997) The re-use of mineral and fines from paper mill waste streams. Proc. Pira Use of minerals in papermaking 26-27 February 1997, Pira International, Surrey, UK, 227-238.
Mertz HA & Jayne TG (1984) Startup and operating experience with the ZimproR high pressure wet oxidation system for sludge treatment and clay reclamation. Publ. TAPPI 1984 Environmental Conference April 9-11, 1984, Savannah, GS, USA, 75-79.
Mishira VS, Mahajani VV & Joshi JB (1995) Wet air oxidation, Ind. Eng. Chem. Res., (34): 2-48.
Noxon brochure (2001): Decanter Centrifuge. 4 p. Nemo® Macerator brochure (2001), 4 p. Null HR (1987) Selection of a separation process. Handbook of Separation Process
Technology. John Wiley & Sons, Inc. USA 1987, 982-995 Nygård S, Alho J, Hietanen S & Roitto I (1998) Coating chemical regeneration by
ultrafiltration. Proc. TAPPI Coating/Papermakers conference May 4-6, 1998 Sheraton New Orleans New Orleans, LA Book 2, 715-729.
Pat U.S. 5478441 (1995) Recovery and re-use of raw materials from paper mill waste sludge. The Wiggins Teape Group Limited., UK (R. Hamilton). App. 73666, 1993-06-08.Publ. 1995-12-26, 9 p.
Pat. U.S: 5558742 (1996) Recovery of water and solids in a paper mill. ECC International Limited, UK. (I: S: Beakley, H O. E. Toivonen). App1994-13-12. Publ 1996-24-09. 12 p.
Pelikan G, Lammer B & Raith G (1997) Trenntechnologie-ein Verfahren für Rohstoffrecycling in der Papierindustrie. Das Papier. (6A): V189-V195.
Perry RH & Green D (ed.) (1984) Perry’s Chemical Engineers’ Handbook, 6th Edition, McGraw-Hill book Co, New York.
Pettersson C (2002) Abrasion testing of fillers. FA8-02, 9.10.2002. Report for Stora Enso Oyj Fine Paper Oulu mill.
123
Phipps JS, Skuse DR, Payton DC, Purdey JA & Husband J (1998) Material recovery and re-use technologies for the paper industry. 2nd EcoPaperTech Conference, Helsinki, 37-42.
Pitkänen H (1999) Rikinpoisto kerrosleijukattilassa paperitehtaan jätevesilietteen avulla, M.Sc Thesis, University of Oulu, Department of Process Engineering.
Sieppi S & Heino P (2002) Environmental protection in the Finnish Forest industry in 2001. Paper and Timber 86(6): 362-366.
Skuse DR, Husband JC, Phipps JS, Payton DC, Purdey JA, Rundle MT & Toivonen O (1999) Recovery of Pigment and Additives from Waste Paper Coating Formulations. Proc. TAPPI Coating Conference May 2-5, 1999 Toronto, Canada Sheraton Centre, 331-337.
Svarovsky L (ed.) (1990) Solid-Liquid Separation. Third Edition. Butterworth & Co. Ltd., Cambridge, 716 p.
Schweiterer PA (1979) Handbook of Separation Techniques for Chemical Engineers. James Peter Associates inc. New York.
Templer K (1993) Trenntechnik - der neue Weg zur Reststoffverwertung. Deutche Papierwirtschaft. (1): T11-T12.
Tiilikka AM (1997) Pastaveden konsentrointi ja hyötykäyttö päällystyksessä-esiselvitys, KCL-tiedote 84, 15 p.
Toivonen O (1996) A new waste conversion and recycling process. Proc. CPPA 82nd Annual Meeting, January 30-31, 1996. Montréal, Québec, A101-A106.
USFilter/Zimpro (2002) How It All Began. see http://www.zimpro.usfilter.com/wetox/history.htm

Appendix 1: Wet sieving method for studying particle sizes
PRINCIPLE
The target of wet sieving is to determine the particle size distribution of the sample. The sample is sieved by particle size into different size classes by using vibratory sieving apparatus, a sieve series with size of 500, 160, 80, 45 and 32 µm and the water. The material, which is left on each sieve is removed with water from the sieve, dried and weighed. Also the material, which passed through all these sieves, is weighed.
PRELIMINARY PREPARATION -Determine the dry solid content of the sample with a halogen drier (if it has not been determined earlier). -Check the cleanliness of the sieves used. -Put the sieves in order of size in to the vibratory sieving apparatus (the smallest on the bottom)
EXECUTION -Weigh the sample, which is analogous to a sample containing solids 10 g abs. dry =10 g / the dry solid content of the sample ⋅ 100. -Put the vessel (3 litre) under the outlet hose of the sieve series. -Start-up the vibratory sieving apparatus, pour the weighed sample on to the upper sieve and flush the sample bowl with a small amount of water. -Vibrate for 2 min. -Then wash down the sample with 500 ml water, while the vibratory sieving apparatus is in operation. -Vibrate for 3 min more. -Flush each bottom side of the sieve on to the next sieve above. Use as little water as possible, maximum amount 1 litre.
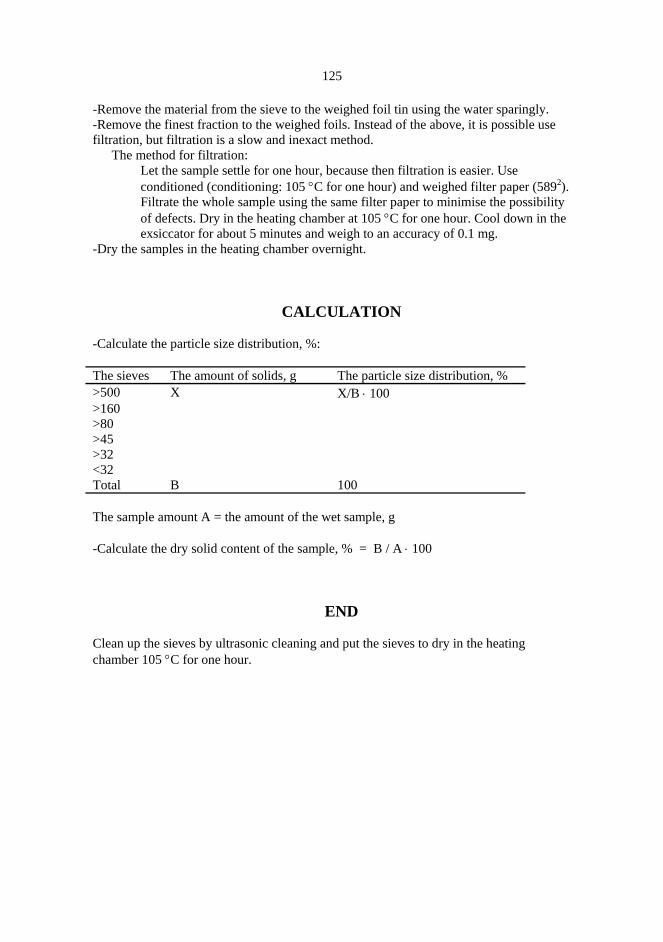
125
-Remove the material from the sieve to the weighed foil tin using the water sparingly. -Remove the finest fraction to the weighed foils. Instead of the above, it is possible use filtration, but filtration is a slow and inexact method. The method for filtration:
Let the sample settle for one hour, because then filtration is easier. Use conditioned (conditioning: 105 °C for one hour) and weighed filter paper (5892). Filtrate the whole sample using the same filter paper to minimise the possibility of defects. Dry in the heating chamber at 105 °C for one hour. Cool down in the exsiccator for about 5 minutes and weigh to an accuracy of 0.1 mg.
-Dry the samples in the heating chamber overnight.
CALCULATION -Calculate the particle size distribution, %: The sieves The amount of solids, g The particle size distribution, % >500 X X/B ⋅ 100 >160 >80 >45 >32 <32 Total B 100 The sample amount A = the amount of the wet sample, g -Calculate the dry solid content of the sample, % = B / A ⋅ 100
END Clean up the sieves by ultrasonic cleaning and put the sieves to dry in the heating chamber 105 °C for one hour.