implementation of a dc microgrid
TRANSCRIPT

Implementation of a DC Microgrid
by
Lee SHAVER
A project report submitted in fulfillment of therequirements for the degree of
Masters of Science(Electrical Engineering)
at the
UNIVERSITY OF WISCONSIN-MADISON
May 2017

This material is based in part upon work supported by the National Science Foundation under GrantNumbers IIP-1542959 and CHE-1230751, the Wisconsin Electric Machines and Power Electronics Consortium(WEMPEC), and the Baldwin Wisconsin Idea Endowment from the University of Wisconsin-Madison. Anyopinions, findings, and conclusions or recommendations expressed in this material are those of the authorand do not necessarily reflect the views of the National Science Foundation.
Copyright © Lee SHAVER 2017All rights reserved

APPROVED BY:
Advisor: Giri VENKATARAMANAN
Advisor Title
Date

“Hofstadter’s Law: It always takes longer than you expect, even when you take into accountHofstadter’s Law.”
Douglas Hofstadter

i
Abstract
The first permanent electric grid powered only the homes and buildings in its immediatevicinity–much like microgrids, which are presently the focus of intense research and de-velopment. An area holding great promise for application of microgrids is electrificationand grid improvement in the developing world. The potential of microgrids in this spaceis examined, and development of a system intended for this context is detailed. TheMicrogrid Energy Manager (MEM) system is proposed as a low-cost, scalable, modularsystem for quickly establishing microgrids with off-the-shelf components. Design of thesystem for interfacing with dc loads and sources is described, and tests of the system’sability to monitor batteries, prioritize loads, and share battery capacity between inter-connected microgrids are conducted. Finally, microgrid work done in partnership withstudents and faculty at the National Institute of Engineering in Mysuru, India is detailed.Goals of this work include establishing a live microgrid testbed on the NIE campus, andpreparation of remote villages for permanent microgrids.

ii
Acknowledgements"I owe it all to my parents." Your love, support, and advice over the years has given meboth the confidence to take risks, and the humility to keep returning to the difficult taskslong after the glamor has worn off.
I thank my advisor, Professor Giri, for his wisdom and guidance–both as an engineerworking to solve difficult problems, and as a human seeking to make the world a morelivable place for all. Your example is an inspiration.
To my fellow grad students, Adria Brooks, David Selhoff, Michael Rios, Zhentao Du,Calvin Cherry; your support (both academic and moral) has been invaluable. To theentire WEMPEC team: faculty, staff, and fellow students: thank you for creating andsustaining a world-class research group.
To Ashray Manur–jack of all trades, and master of a lot of them: your constantdedication to your work is inspiring, and the humility with which you’ve lead the projectteam is indispensable. Thank you for the countless hours helping me debug everythingfrom microcontrollers to Indian social norms.
To Professor Shamsundar Subarroa and Vikram Atreya of CREST: thank you for yourindispensable support during my time in your beautiful city of Mysuru. To the faculty,staff, and students of the National Institute of Engineering, and Principal Dr. G. L. Shekar:thank you for hosting me at your institution, and for all the support you provided. Ihope to visit again soon.
And to Kristy: Through your eyes I have seen that the world is both more beautifuland more fragile than I had recognized. You have inspired me to apply my skills andpassions to making that world a better place, starting with my very next step. . .

iii
Contents
Abstract i
Acknowledgements ii
1 Introduction 11.1 The first electric grid . . . . . . . . . . . . . . . . . . . . . . . . . . . . . . . 11.2 Microgrids enter the scene . . . . . . . . . . . . . . . . . . . . . . . . . . . . 11.3 Evolution of microgrid development . . . . . . . . . . . . . . . . . . . . . . 3
1.3.1 Global status of electrification . . . . . . . . . . . . . . . . . . . . . . 41.3.2 Microgrids for a new context . . . . . . . . . . . . . . . . . . . . . . 4
1.4 Microgrid design considerations for developing world contexts . . . . . . 61.5 Status of microgrids for developing world electrification . . . . . . . . . . 71.6 Conclusion . . . . . . . . . . . . . . . . . . . . . . . . . . . . . . . . . . . . . 9
1.6.1 Document organization . . . . . . . . . . . . . . . . . . . . . . . . . 10
2 Overview of dc microgrids 112.1 Introduction . . . . . . . . . . . . . . . . . . . . . . . . . . . . . . . . . . . . 112.2 Three layers of microgrid control . . . . . . . . . . . . . . . . . . . . . . . . 12
2.2.1 Primary control . . . . . . . . . . . . . . . . . . . . . . . . . . . . . . 122.2.2 Secondary control . . . . . . . . . . . . . . . . . . . . . . . . . . . . 132.2.3 Tertiary control . . . . . . . . . . . . . . . . . . . . . . . . . . . . . . 13
2.3 Status of dc microgrid research and development . . . . . . . . . . . . . . 132.3.1 Standardization in dc microgrids . . . . . . . . . . . . . . . . . . . . 132.3.2 Centralized control systems . . . . . . . . . . . . . . . . . . . . . . . 132.3.3 Decentralized control systems . . . . . . . . . . . . . . . . . . . . . 142.3.4 Hybrid ac and dc microgrids . . . . . . . . . . . . . . . . . . . . . . 152.3.5 Control of interconnected dc microgrids . . . . . . . . . . . . . . . . 16
2.4 Conclusion . . . . . . . . . . . . . . . . . . . . . . . . . . . . . . . . . . . . . 17
3 MEM: Microgrid Energy Manager 183.1 Introduction . . . . . . . . . . . . . . . . . . . . . . . . . . . . . . . . . . . . 18
3.1.1 Previous publications on MEM . . . . . . . . . . . . . . . . . . . . . 193.2 MEMcloud . . . . . . . . . . . . . . . . . . . . . . . . . . . . . . . . . . . . . 20

iv
3.3 HEM . . . . . . . . . . . . . . . . . . . . . . . . . . . . . . . . . . . . . . . . 213.3.1 HEMdc interface . . . . . . . . . . . . . . . . . . . . . . . . . . . . . 21
4 Experimental verification of HEMdc 244.1 Introduction . . . . . . . . . . . . . . . . . . . . . . . . . . . . . . . . . . . . 244.2 Battery management . . . . . . . . . . . . . . . . . . . . . . . . . . . . . . . 24
4.2.1 Individual battery management . . . . . . . . . . . . . . . . . . . . 244.2.2 Collective battery management . . . . . . . . . . . . . . . . . . . . . 254.2.3 Hardware and software for testing . . . . . . . . . . . . . . . . . . . 25
4.3 Use of batteries in dc homegrids . . . . . . . . . . . . . . . . . . . . . . . . 264.3.1 Choice of batteries . . . . . . . . . . . . . . . . . . . . . . . . . . . . 264.3.2 Calculating state-of-charge . . . . . . . . . . . . . . . . . . . . . . . 264.3.3 Charge management algorithm . . . . . . . . . . . . . . . . . . . . . 27
4.4 Individual battery management experiment . . . . . . . . . . . . . . . . . . 284.4.1 Results and discussion . . . . . . . . . . . . . . . . . . . . . . . . . . 294.4.2 Future improvements . . . . . . . . . . . . . . . . . . . . . . . . . . 30
4.5 Collective battery management experiment . . . . . . . . . . . . . . . . . . 304.5.1 Baseline . . . . . . . . . . . . . . . . . . . . . . . . . . . . . . . . . . 314.5.2 Power sharing enabled . . . . . . . . . . . . . . . . . . . . . . . . . . 314.5.3 Results and discussion . . . . . . . . . . . . . . . . . . . . . . . . . . 31
4.6 Conclusions and future work . . . . . . . . . . . . . . . . . . . . . . . . . . 33
5 Microgrid work at NIE-CREST 355.1 Introduction . . . . . . . . . . . . . . . . . . . . . . . . . . . . . . . . . . . . 355.2 Summary of work . . . . . . . . . . . . . . . . . . . . . . . . . . . . . . . . . 36
5.2.1 Phase 1 – December 2015 to January 2016 . . . . . . . . . . . . . . . 365.2.2 Phase 2 – June to August 2016 . . . . . . . . . . . . . . . . . . . . . . 365.2.3 Phase 3 – April 2017 . . . . . . . . . . . . . . . . . . . . . . . . . . . 37
5.3 CREST description and setting . . . . . . . . . . . . . . . . . . . . . . . . . 385.3.1 CREST office wiring and loads . . . . . . . . . . . . . . . . . . . . . 395.3.2 CREST office networking . . . . . . . . . . . . . . . . . . . . . . . . 405.3.3 NIE library solar power system . . . . . . . . . . . . . . . . . . . . . 40
5.4 Systems in place at CREST . . . . . . . . . . . . . . . . . . . . . . . . . . . . 405.4.1 Energy sources . . . . . . . . . . . . . . . . . . . . . . . . . . . . . . 40
5.4.1.1 Solar panels . . . . . . . . . . . . . . . . . . . . . . . . . . . 415.4.1.2 Microhydro . . . . . . . . . . . . . . . . . . . . . . . . . . . 415.4.1.3 Wind turbine . . . . . . . . . . . . . . . . . . . . . . . . . . 425.4.1.4 Diesel generator . . . . . . . . . . . . . . . . . . . . . . . . 43
5.4.2 Power conversion . . . . . . . . . . . . . . . . . . . . . . . . . . . . . 445.4.2.1 MPPT chargers . . . . . . . . . . . . . . . . . . . . . . . . . 44

v
5.4.2.2 Inverters . . . . . . . . . . . . . . . . . . . . . . . . . . . . 455.4.3 Energy storage . . . . . . . . . . . . . . . . . . . . . . . . . . . . . . 45
5.5 Microgrid testbeds . . . . . . . . . . . . . . . . . . . . . . . . . . . . . . . . 455.6 Microgrid candidate site visits . . . . . . . . . . . . . . . . . . . . . . . . . . 47
5.6.1 Tribal hamlets in protected forest areas of Karnataka . . . . . . . . 475.6.2 Semi-rural villages on the outskirts of Bengaluru . . . . . . . . . . . 49
6 Conclusions and future work 516.1 Conclusions . . . . . . . . . . . . . . . . . . . . . . . . . . . . . . . . . . . . 516.2 Future work . . . . . . . . . . . . . . . . . . . . . . . . . . . . . . . . . . . . 52
6.2.1 MEM system development . . . . . . . . . . . . . . . . . . . . . . . 526.2.2 Microgrid at CREST . . . . . . . . . . . . . . . . . . . . . . . . . . . 52
A HEMdc Interface schematics 54
B Code reference for HEMdc experiments 64B.1 Individual battery management . . . . . . . . . . . . . . . . . . . . . . . . . 64B.2 Collective battery management . . . . . . . . . . . . . . . . . . . . . . . . . 65B.3 Python scripting . . . . . . . . . . . . . . . . . . . . . . . . . . . . . . . . . . 66
C CREST office and microgrid testbed wiring 67
Bibliography 72

vi
List of Figures
1.1 Pearl Street Station . . . . . . . . . . . . . . . . . . . . . . . . . . . . . . . . 11.2 Frequency of n-grams . . . . . . . . . . . . . . . . . . . . . . . . . . . . . . . 21.3 Microgrid conceptual schematic . . . . . . . . . . . . . . . . . . . . . . . . . 31.4 Motivations for installing microgrids in different contexts . . . . . . . . . . 61.5 A bidirectional spectrum of electrification . . . . . . . . . . . . . . . . . . . 71.6 Graphic illustrating the components of the MEM/HEM system . . . . . . 9
2.1 Illustration of the three microgrid control layers as implemented inHEM/MEM . . . . . . . . . . . . . . . . . . . . . . . . . . . . . . . . . . . . 12
3.1 Illustration of MEM/HEM hierarchy . . . . . . . . . . . . . . . . . . . . . . 193.2 Block diagram of MEM and HEM components . . . . . . . . . . . . . . . . 203.3 Example of a homegrid . . . . . . . . . . . . . . . . . . . . . . . . . . . . . . 213.4 Block diagram of HEMdc interface . . . . . . . . . . . . . . . . . . . . . . . 22
4.1 Test setup used for HEMdc verification experiments . . . . . . . . . . . . . 254.2 Flowchart describing HEMapp decisions based on battery SOC . . . . . . 284.3 Waveforms of battery voltage, load current, and battery SOC, illustrating
operation of HEM with load switching during different states . . . . . . . 294.4 Waveforms of battery terminal voltage, load current, and battery SOC,
illustrating base case of two homegrids with power sharing disabled . . . 324.5 Waveforms of battery voltage, load current, and battery SOC, illustrating
operation of two homegrids with power sharing enabled . . . . . . . . . . 334.6 Current waveforms for two homegrids with power sharing enabled . . . . 34
5.1 Team photos from phases 1 and 2 . . . . . . . . . . . . . . . . . . . . . . . . 375.2 NIE campus layout . . . . . . . . . . . . . . . . . . . . . . . . . . . . . . . . 385.3 Selected annual weather data for Mysuru . . . . . . . . . . . . . . . . . . . 395.4 Solar and hydro energy sources for CREST microgrid . . . . . . . . . . . . 425.5 Wind and bio-diesel energy sources at CREST . . . . . . . . . . . . . . . . . 425.6 V-I curve for a solar PV panel . . . . . . . . . . . . . . . . . . . . . . . . . . 445.7 Two generations of the dc load monitoring and control hardware for the
microgrid testbeds at CREST . . . . . . . . . . . . . . . . . . . . . . . . . . 46

vii
5.8 A bamboo anganwadi in a tribal hadi near Muthur village . . . . . . . . . 475.9 Typical homes in the tribal hadis . . . . . . . . . . . . . . . . . . . . . . . . 485.10 Map of two tribal hadis being considered for microgrid installation . . . . 495.11 Map of villages visited with Bosch India Foundation . . . . . . . . . . . . . 50
6.1 The famous Palace of Mysuru . . . . . . . . . . . . . . . . . . . . . . . . . . 51
C.1 A simplified one-line diagram of CREST office loads . . . . . . . . . . . . . 67C.2 Electrical layout of CREST . . . . . . . . . . . . . . . . . . . . . . . . . . . . 69C.3 Schematic of "red" microgrid testbed . . . . . . . . . . . . . . . . . . . . . . 70C.4 Schematic of "green" microgrid testbed . . . . . . . . . . . . . . . . . . . . . 70C.5 Schematic of "blue" microgrid testbed . . . . . . . . . . . . . . . . . . . . . 71C.6 Schematic of "yellow" microgrid testbed . . . . . . . . . . . . . . . . . . . . 71

viii
List of Tables
1.1 Grid statistics for selected regions . . . . . . . . . . . . . . . . . . . . . . . . 5
4.1 Selected details of batteries used for HEMdc experiments . . . . . . . . . . 264.2 Threshold definitions and actions for the two homegrids of the power
sharing test . . . . . . . . . . . . . . . . . . . . . . . . . . . . . . . . . . . . . 304.3 Details of homegrid batteries and SOCs for power sharing test . . . . . . . 31
5.1 CREST LAN details . . . . . . . . . . . . . . . . . . . . . . . . . . . . . . . . 405.2 Selected details of solar panels installed at CREST . . . . . . . . . . . . . . 415.3 Selected details of the wind turbine and bio-diesel genset at CREST . . . . 435.4 Selected details of Phocos 100/30 MPPT charger . . . . . . . . . . . . . . . 445.5 Summary details of the four microgrid testbeds at CREST . . . . . . . . . . 46

ix
List of Abbreviations
AGM Absorbant Glass Mata-Si amorphous SiliconCAN Controller Area NetworkCPL Constant Power LoadCREST Centre for Renewable Energy and Sustainable TechnologyDER Distributed Energy ResourceHEM Homegrid Energy ManagerHVDC High Voltage dcLAN Local Area NetworkLi-ion Lithium-ionMEM Microgrid Energy ManagerMDG Millennium Development GoalMPPT Maximum Power Point Trackingmulti-Si multicrystalline SiliconNIE National Institute of EngineeringOECD Organisation for Economic Co-operation and DevelopmentPV PhotovoltaicRE Rural ElectrificationRET Renewable Energy TechnologySE4All Sustainable Energy for AllSHS Solar Home System(s)SOC State-of-chargeUNF United Nations FoundationUPS Uninterruptible Power SupplyVRLA Valve-regulated Lead-acid

x
List of Symbols
IMP current at maximum power AISC short circuit current AP real power WPmax maximum power WQ charge AhS apparent power VAVMP voltage at maximum power VVnom nominal voltage VVOC open circuit voltage V

1
Chapter 1
Introduction
1.1 The first electric grid
FIGURE 1.1: Drawing of the PearlStreet Station in Manhattan [1]
In 1882 Thomas A. Edison’s fledgling electric utility,the Edison Electric Illuminating Co, flipped the switchto on at Pearl Street Station, the world’s first perma-nent power plant [2]. The plant consisted of six 100 kW"jumbo" dynamos, and initially served 85 customers–anumber which jumped to 513 by the end of the year.Each customer, located within one kilometer of theplant, used the electricity exclusively for lighting, us-ing bulbs purchased for $1 each (over $20 USD in 2017dollars) from the Edison Electric Illuminating Co.
The Pearl Street Station and subsequent plants pro-vided power at 110 Vdc [3]. While this system had someadvantages over proposed ac systems, and served cus-tomers well initially, its chief limitation eventually re-sulted in its demise: with no existing technology toeasily step direct current up or down, it could not be
transmitted over distances much longer than a kilometer [4]. As a result, ac generationand transmission (championed by Nikola Tesla and George Westinghouse) eventuallywon out over dc in the famous "war of the currents."
1.2 Microgrids enter the scene
Tremendous advancements occurred over the next century: the development of inductionand synchronous machines, electric meters, high voltage transmission, gas turbines,nuclear reactors, wind turbines, and solar photovoltaics, to name a few [5–7]. All of thesetechnologies were turned to the development, advancement, and expansion of "the grid;"

Chapter 1. Introduction 2
the system of large-scale centralized generation connected to energy users through anetwork of transmission and distribution.
But while a seemingly endless supply of effort and funding was being poured into"the largest machine ever built" [8, 9], in recent years another trend in research started,as some began to explore the advantages to moving in the other direction: distributed,decentralized, local grids: microgrids (see fig. 1.2).
1910 1920 1930 1940 1950 1960 1970 1980 1990 2000 20100
0.5
1
1.5
2
2.5
3
Occ
urre
nces
per
100
,000
Frequency of n-grams "electric grid" and "microgrid"in the English corpus, 1910 - 2008
"electric grid""microgrid"
FIGURE 1.2: A chart showing the frequency of use over time of "electric grid" and"microgrid" [10, 11]
While the idea of a micro (that is, small) grid had been around for some time [12–14],researchers at UW-Madison were among the first to conceive of the microgrid in itsmodern form: a group of energy sources and loads, usually including storage, and anindependent control system allowing for grid-connected or "islanded" operation [15, 16].
In 2012, a formal definition was provided by the U.S. Department of Energy’s Micro-grid Exchange Group [17]:
A microgrid is a group of interconnected loads and distributed energyresources within clearly defined electrical boundaries that acts as a singlecontrollable entity with respect to the grid. A microgrid can connect anddisconnect from the grid to enable it to operate in both grid-connected orisland-mode.
The original motivation for the idea in its early conceptions at UW-Madison was tocreate a framework that would allow distributed energy resources (DERs) to peacefullyco-exist with the grid (see fig. 1.3) [18, 19]. Prior to work on microgrids, many utilitiesrequired customers with DERs to disconnect those resources whenever they detected anissue with the grid voltage or frequency [20, 21]. These requirements, intended to protectutility workers and other customers on the grid, created obstacles for those with suchresources, making integration and control complicated and expensive, and reducing theirdesirability.

Chapter 1. Introduction 3
FIGURE 1.3: A conceptual schematic of a microgrid (copyright Berkeley Lab) [19]
But with a well-planned microgrid, power users would benefit from being able toaggregate a number of sources and loads under one control system, proving benefits suchas back-up power, co-generation, improved power quality, and reduced environmentalimpact (when using renewable resources). From the utility perspective, grouping theseentities under a microgrid means there are less loads and resources to keep track ofand oversee. Later research also found that well-regulated microgrids are capable ofproviding a number of other benefits to the larger grid, including voltage and reactivepower (VAR) regulation. This is an area of ongoing study–in 2009 the Electric PowerResearch Institute (EPRI) began development of a communications protocol for inter-facing microgrids and DERs with utility systems [22], and the Institute of Electrical andElectronics Engineers (IEEE) developed a standard for interconnecting DERs with thegrid [23].
1.3 Evolution of microgrid development
To date, a significant amount of microgrid development and testing has focused onlarge-scale microgrids, operating in spaces such as hospitals, military bases, remotevillages, and government sites [24–26]. Additionally, many labs and college campuseshave functional microgrids operating as part of research efforts [27–29].
In such settings, microgrids are used to accomplish a number of goals: protectionfrom disruptions in supply (such as those due to natural disasters [30]), reducing outage

Chapter 1. Introduction 4
time of critical loads, reducing CO2 emissions, improving grid stability [17], and allowingseamless integration of renewables with the grid [31].
In many ways, each of those objectives can be brought back to financial motiva-tion: added value, reduced losses, and improved returns on renewable energy systems.But even as the business case for microgrids has grown stronger [32], the advances intechnology have opened up paths which are not strictly motivated by profit.
Specifically, microgrids have been envisioned as a solution to the worldwide lack ofaccess to affordable and reliable electricity [33–35].
1.3.1 Global status of electrification
From 1990 to 2012, worldwide access to electricity increased from 75.6% to 84.6%, repre-senting a net electrification of nearly 200 million individuals. South Asia and Sub-SaharanAfrica, the regions with the lowest historical electrification rates, increased by 28% and13%, respectively [36].
These improvements are due in large part to efforts by the the international com-munity. In 2005, the UN commissioned a report investigating the links between lack ofmodern energy services (including both electricity and cooking fuels) and the MillenniumDevelopment Goals (MDGs), originally proposed in 2000, which focus on improvingeight human development indicators such as poverty, gender equality, health, and educa-tion [37]. The report makes the case that without modern energy infrastructure, efforts tofully accomplish any of the goals are hampered. Following this finding, in 2012 the UN,partnering with the World Bank, launched the "Sustainable Energy For All" initiative(abbreviated SE4All, SE4ALL, or SEforALL in the literature) [38]. The goals of this projectare implementing universal electricity access, doubling the share of renewables in theenergy sector, and doubling the rate at which energy efficiency improves annually [39].
Along with these efforts, the World Bank and independent researchers have alsoinvestigated outcomes and best practices for rural electrification (RE). Research indicatesthat improvements in areas such as income inequality, poverty rates, and economicgrowth are not inherently a result of increasing electrification, but that carefully designedprojects can bring about measurable improvements [40–43].
1.3.2 Microgrids for a new context
In addition to the benefits of increasing electrification, another key area of researchseeks to identify the most cost effective means for improving electricity access. Severalstudies have compared outcomes for grid extension vs decentralized generation (using anaverage cost for all feasible sources)[44], grid extension vs solar home systems (SHS) [45],SHS vs solar photovoltaic (PV) microgrids [46], and a three-way comparison betweengrid extension, renewable-based home systems, and renewable-based microgrids [47].

Chapter 1. Introduction 5
Each of these studies analyzes some combination of transmission, distribution, fuel, andcapital costs for the RE options considered.
In general, the results of these studies indicate that while grid extension is typicallythe least-cost option for RE, decentralized options are significantly more cost-effectivein remote and/or sparsely populated areas. In particular, [44] found that in severalSub-Saharan African nations, over 50% of the population could best be served withoff-grid power systems. In addition, the rapid decline of solar PV pricing over the lastfew years indicates that the extent of territory where SHS and PV microgrid systems arethe best option will likely increase instead of decrease.
While these results might seem a somewhat under-whelming endorsement of theprospects for microgrids in developing nations, two additional factors must be considered.First, of 11 million households which were electrified by World Bank projects between2000 and 2014, 8.7 million (roughly 80%) were connected by grid extension, 2 million(roughly 20%) by solar home system, and just over 100,000 (less than 1%) by microgrid(also called minigrid in the literature) [43]. This indicates that despite their promise,microgrids are just beginning to be utilized in RE projects. The focused research anddevelopment efforts underway around the world indicate that the growth of microgridsin this area will be rapid.
RegionElectricoutages
per montha
Typical outageduration(hours)a
Population with electricity accessb
Total (%) Rural (%)
South Asia 25.4 3.1 78.0 69.3Sub-Saharan Africa 9.0 4.2 35.3 15.3OECD countries 0.4 0.4 99.9 99.7
a For commercial users onlyb For residential users only
TABLE 1.1: Grid statistics for selected regions [36, 48]
Secondly, another aspect of electric infrastructure in developing nations indicatesa role for microgrids beyond electrification: the poor quality of electric connections.Table 1.1 shows grid statistics for selected regions of the world: South Asia, Sub-SaharanAfrica, and for comparison, the average for nations in the Organisation for EconomicCo-operation and Development (OECD), a club of rich nations.
These statistics present a dichotomy between the ways in which microgrids have beendeveloped in rich nations, and the ways their strengths can be leveraged to meet needsin the developing world. Figure 1.4 illustrates this dichotomy: whether consideringa microgrid for a hospital in New York City, or for an isolated forest village in India,individuals and organizations have the same goals; reducing costs, improving electricsupply, and utilizing RETs (renewable energy technologies). But the underlying reasonsguiding those choices are fundamentally different.

Chapter 1. Introduction 6
To use renewables:
Out of necessity
Due to mandate
For cost savings from:
Avoided transmission
cost
Reduced fuel use
To improve power supply
by:
Augmenting unreliable or missing grid
Providing backup and
energy security
In developing areas
In developed areas
FIGURE 1.4: Motivations for installing microgrids in different contexts
For example, when building a microgrid in an urban area in the US or Europe,RETs may be more desirable than fossil-fuel burning generators due to restrictions onlocal pollution [49]; whereas in a remote village RETs may be the only feasible solution.Similarly, microgrids with RETs in a location where grid connection is present mayrepresent cost savings largely due to reduced need for purchasing power from the grid,or ability to sell excess power back to the grid; whereas in remote areas, the cost of gridextension may be significantly higher than the cost of establishing a microgrid.
This dichotomy necessarily leads to differences in the design and operation of micro-grids in a developing world context.
1.4 Microgrid design considerations for developing world con-texts
Building on the differences in motivation identified in fig. 1.4, several guiding criteriaare identified for application of microgrids in the developing world:
1. Type, availability, and cost of energy resources
2. Availability of electrical components (chargers, inverters, batteries, etc)
3. Strengths and weaknesses of existing electrical supply (if any)
4. Needs and priorities of users to be served
5. Training and ability of users to operate and maintain the system
6. Ability to adapt to expected changes in grid availability
7. Ability to adapt to changes (generally, growth) in load

Chapter 1. Introduction 7
Another key difference which must be considered for microgrid development is themanner in which the electric grid grows and develops. In the business as usual scenario,the grid, and thus electrification, grows outwards from places with existing reliablegrid connections (such as cities and industrial areas). Communities on the edges ofthe grid would be electrified first, followed by their neighbors, and moving outwards(indeed, this is the paradigm used in several of the the studies cited in section 1.3.2 whencomparing alternate means of electrification). At the same time, reliability and capacityof the grid in those areas already connected would increase (at least in principle).
Reliable connection
Intermittent supply
Grid present but not
connected
Proximity to grid
connection
No electric connection
FIGURE 1.5: A bidirectional spectrum of electrification
But what if development could also flow in the opposite direction? Or better still–inboth directions at the same time, as illustrated in fig. 1.5. From connected areas, the gridcould continue to grow and expand outward, while simultaneously, microgrids couldbe used at the opposite extreme–areas far from the grid–to provide electric connections.These microgrids would introduce not only electric connections for users, but compo-nents that can eventually contribute to grid stability and reliability. Thus, when the twoparadigms "meet in the middle," total power availability and reliability will be higher, ata lower cost, then if only one solution were employed.
1.5 Status of microgrids for developing world electrification
As described in [43], of 11 millions households electrified through World Bank Projectsfrom 2000 to 2014, just over 100,000 were electrified by microgrids. But rather thanrepresenting a poor showing for microgrids, this small share represents the start of a newtrend.
Challenging the assumption that centralized generation is more cost-effective thandecentralized, [45] examines the possibility that developing nations could use decentral-ized electrification paradigms to "leapfrog" the centralized model employed elsewhere.The authors develop a model for comparing costs between centralized and decentralizedelectrification. While they find that off-grid systems are only likely be cost effective inabout 20% of the scenarios examined, their research indicates that attributes of decentral-ized options such as flexibility, scalability, and rapidly falling costs mean that they arelikely to become more competitive in the near future.

Chapter 1. Introduction 8
Further examining factors affecting adoption of microgrids, [35] discusses barriersto private sector investment in decentralized electrification projects. Specific barriersidentified include unpredictable revenue, poor financing, and long-term risks. At theroot of many challenges to private sector investment in microgrids for RE is that themotivation for RE is typically social in nature, making it a better fit for public anddonor institutions. But several factors specific to microgrids make them an increasinglyattractive option for private investment.
First, the modular nature of microgrid design means that once a base microgrid isestablished, adding new connections (that is, paying customers) in adjacent buildings,neighborhoods, or communities is more cost effective than in a system based on stand-alone power systems such as SHS. This, combined with the well-established trend ofusers to steadily increase consumption over time following initial connection, means thatthe prospects for long-term growth in revenue are strong for microgrids.
Second, microgrids are inherently designed to integrate with other microgrids or themain grid. This flexibility stands in contrast to stand-alone technologies, and reducesthe long-term risk of "stranded assets," a situation where power systems installed forRE are rendered obsolete by the introduction of a grid connection. In such a situation,microgrids continue to offer such advantages as back-up power, improved power quality,and possible revenue from selling excess power back to the grid.
A 2014 report by the United Nations Foundation (UNF) provides case studies ofseven microgrid developers operating from the 1990s through the present across India,Malaysia, and Haiti [34]. Together, these developers maintain 787 microgrids with acombined capacity of nearly 15 MW, serving nearly 60,000 customers. The UNF reportcategorizes microgrid business models into for profit, partially subsidized, and fullysubsidized. Within these categories the authors examine seven factors which are criticalto microgrid success: design of tariffs, tariff collection processes, maintenance processes,theft of service risks, growth in demand, technical limits, and local ownership andoperation. Through in-depth case studies of 12 microgrids built and managed by thedevelopers covered in the report, the authors demonstrate that careful attention must bepaid to each of these seven factors to ensure the long-term success of a microgrid project.
While all of these seven factors apply to any RE technology, the technical considera-tions apply differently for microgrids. For instance, microgrids are much more capableof handling growth in demand and stringent technical limits, due to the modular natureof their design. Whereas an electrification project based on SHS would set a hard limiton power usage for each customer, a microgrid consisting of interconnected homes andbusiness would have an aggregate limit for the entire community–meaning that a userwith momentarily high demand could "borrow" capacity from other users with lowerdemand in that moment.
Finally, [50] examines issues related to microgrid deployment in India. Extending the

Chapter 1. Introduction 9
findings from the UNF report in [34], the authors find that microgrids occupy a poorlydefined middle ground between the traditional supply-side model of centralized utilities,and the simplicity of individually owned and operated systems such as solar homesystems. The cooperative nature of microgrids, while resulting in improved technicalperformance compared to both centralized and individual systems, nonetheless bringsa number of requirements (technical, legal, and financial) that are not faced by thosesystems. However, the government of India has recognized the benefits of microgrids,and is engaged with utilities and microgrid installers and operators to address theseconcerns. Two key areas of ongoing research are the development of economicallysustainable ownership models, and tariff structures.
1.6 Conclusion
FIGURE 1.6: Graphic illustrating the components ofthe MEM/HEM system introduced in chapter 3
The development of microgrids hasbrought electric grid technology back toits roots: Microgrids today show signifi-cant promise as a technology for providingelectric connections for communities andneighborhoods which have never beforehad a connection, much like the customersin the vicinity of Thomas Edison’s PearlStreet Station.
While not a panacea, electrification hasthe potential to positively influence devel-opment around the world, and as a resultdonor organizations and governments indeveloping nations have poured significant resources into increasing electrification. De-velopments in microgrid technology have presented a promising new paradigm forincreasing electrification that can bypass many of the obstacles inherent in standardgrid expansion (including both high capital costs and often poor reliability). In the lastseveral decades a number of pilot projects have demonstrated the potential of microgridsnot only to provide electrification in remote areas, but to do so in a way that is moreresilient, cost-effective, and flexible than conventional grid expansion. From a technicalperspective microgrids also mesh well with renewable energy resources, thus increasingtheir appeal as a more healthy and environmentally friendly option.

Chapter 1. Introduction 10
1.6.1 Document organization
The rest of this document is organized as follows: Chapter 2 summarizes recent trends indc microgrid research and development. Chapter 3 gives an overview of the MicrogridEnergy Manager / Homegrid Energy Manager (MEM/HEM) system being developed atUW-Madison. Chapter 4 provides details and results from two experiments conductedusing the HEMdc system. Chapter 5 describes the ongoing work at the National Instituteof Engineering in Mysuru, India to test the MEM system in a real-world situation. Finally,chapter 6 provides conclusions and a discussion of future work related to the effortsdescribed in this report.

11
Chapter 2
Overview of dc microgrids
2.1 Introduction
As discussed in chapter 1, dc power systems have existed since the earliest days ofelectrical systems–but theirapplication to modern microgrids has been a more recentdevelopment. The opportunities for dc microgrids are based on three key advantages[51–54]:
Many renewable energy sources provide dc output. Solar photovoltaics and fuel cellsproduce dc current directly, and many wind power systems can easily produce dccurrent, or are interfaced to the ac grid through a dc link.
Energy storage is typically dc. Batteries and supercapacitors use dc current by their na-ture for charging and discharging. This includes the batteries in electrical vehicles,meaning dc power systems can easily integrate with vehicle-to-grid systems.
Many types of electrical loads use dc power natively. The majority of electronics (suchas computers, servers, and TVs) use dc power. LED lights also use dc powernatively. Many types of motors and drives (especially variable speed drives) usedc power.
In all three cases, these sources, storage systems, and loads require converters when-ever they interface with ac power systems; thus switching to a dc power system eliminatesthe need for such converters, eliminating the losses which are inherent in any type ofpower conversion.
To date, key areas of implementation for dc power systems have included datacenters, spacecraft, airplanes, shipboard power systems, traction power systems (fortrains, trolleys, trams, etc), and telecommunication infrastructure. Developments in theseareas have spurred research on dc microgrids, and in some cases provided test-bedsfor establishing functional dc microgrids (particularly in the case of data centers andtelecoms, where the cost savings potential is significant).
Extending the motivations discussed in chapter 1, dc microgrids are also found tohave widespread application in developing nations [55–58], due to lower electric demand,
Chapter 2. Overview of dc microgrids 12
and the suitability of solar photovoltaics in many areas. Even when higher powerrequirements are present, dc microgrids are still found to be well-suited in applicationswhere a high percentage of renewable energy sources with dc output is present [58, 59].
After a brief overview of microgrid control, this chapter will cover the current statusof dc microgrid research.
2.2 Three layers of microgrid control
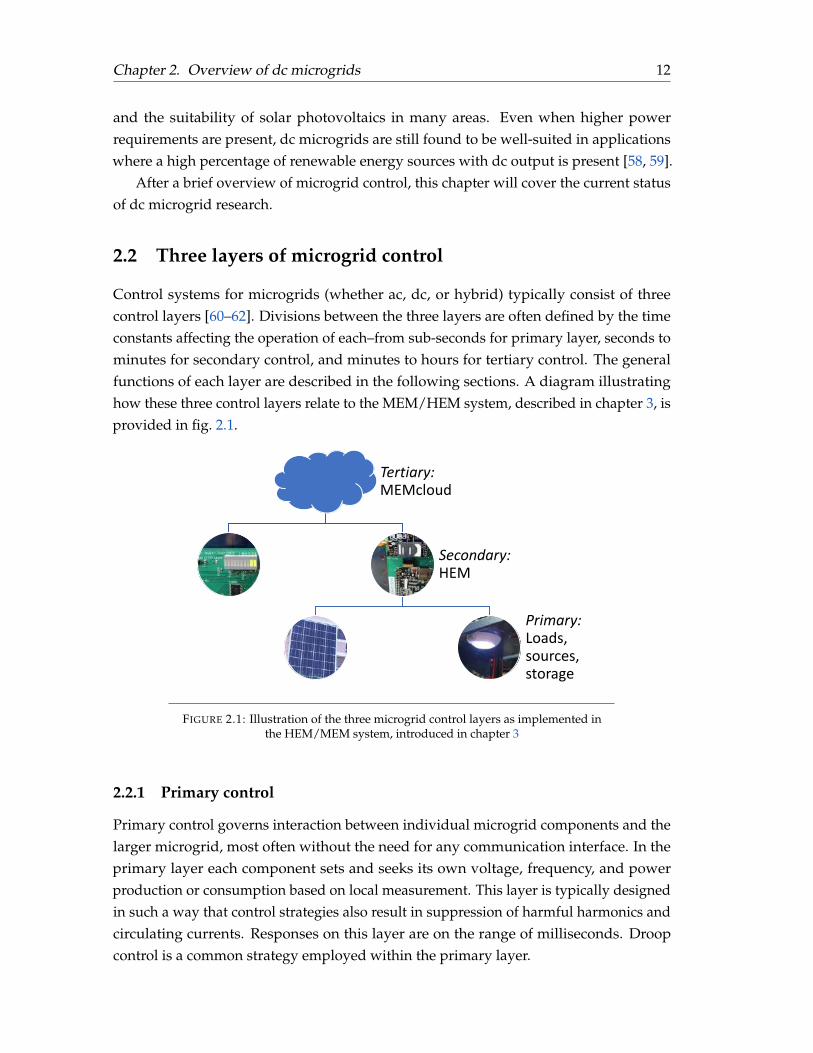
Control systems for microgrids (whether ac, dc, or hybrid) typically consist of threecontrol layers [60–62]. Divisions between the three layers are often defined by the timeconstants affecting the operation of each–from sub-seconds for primary layer, seconds tominutes for secondary control, and minutes to hours for tertiary control. The generalfunctions of each layer are described in the following sections. A diagram illustratinghow these three control layers relate to the MEM/HEM system, described in chapter 3, isprovided in fig. 2.1.
Tertiary: MEMcloud
Secondary: HEM
Primary:Loads, sources, storage
FIGURE 2.1: Illustration of the three microgrid control layers as implemented inthe HEM/MEM system, introduced in chapter 3
2.2.1 Primary control
Primary control governs interaction between individual microgrid components and thelarger microgrid, most often without the need for any communication interface. In theprimary layer each component sets and seeks its own voltage, frequency, and powerproduction or consumption based on local measurement. This layer is typically designedin such a way that control strategies also result in suppression of harmful harmonics andcirculating currents. Responses on this layer are on the range of milliseconds. Droopcontrol is a common strategy employed within the primary layer.

Chapter 2. Overview of dc microgrids 13
2.2.2 Secondary control
Because primary control principally governs the interaction between individual com-ponents and the larger microgrid, a secondary layer is needed to manage interactionsacross the microgrid between these components. The secondary layer manages holisticcontrol within the microgrid, adjusting voltage and frequency set-points which are usedby the primary layer. Secondary control typically employs a communication interface,which by design is low-bandwidth; the slower time constant of secondary control doesnot require high-bandwidth communication. However, several de-centralized means ofemploying secondary control have also been studied with some success.
2.2.3 Tertiary control
Finally, the interaction between the microgrid and the outside world is handled by thetertiary control layer. This includes deciding when to connect and disconnect fromthe grid, economic dispatch of power sources, load balancing and curtailment, anddispatch based on environmental and meteorological factors (particularly important formicrogrids with a high share of wind and solar resources).
2.3 Status of dc microgrid research and development
2.3.1 Standardization in dc microgrids
Emerging standards and best-practices for system protection in dc microgrids are dis-cussed in [51, 54]. The need for standards is described in terms of the key risk associatedwith dc power systems: arcing, fire, electrocution, and damage to loads. Key require-ments for protective systems are identified as reliability, speed, performance, economics,and simplicity. Components for which standards are lacking are identified as fuses, circuitbreakers, no load switches, and solid state switches. In addition to these required compo-nents, several design paradigms requiring standardization are also identified, namely:redundancy, fault isolation, load prioritization, load shedding, transient operation, andcondition-based maintenance.
2.3.2 Centralized control systems
A fuzzy logic-based control system is developed and simulated in [59]. The inputfuzzy variables used in the system are power balance (difference between total powerproduced and load power) and change in battery state-of-charge (SOC). The outputvariable is change in battery charge/discharge current. The system is implementedusing wireless sensors and actuators connected through LabVIEW. Simulation andexperimental evaluation of the system demonstrates its ability to provide stable power to

Chapter 2. Overview of dc microgrids 14
loads with fluctuating input power from a wind and solar source, while simultaneouslymaintaining battery SOC in a desirable range, and supplying excess power back to thegrid.
In [55] a centralized, rules-based system for dc microgrid control is developed andtested through simulation. The back-end of the microgrid is purely dc–all sources, loads,and storage devices are connected through ac-dc or dc-dc converters to a common dc-link at a nominal 300 V. The energy management system handles control of the MPPTinterfaces for the two power sources (wind turbine and solar PV), charging/dischargingof the batteries and supercapacitor used for storage, and load shedding. Data inputsconsist of the dc link voltage and battery SOC. For a one second simulation includingload- and source-stepping events, it is demonstrated that the proposed algorithm is ableto maintain the dc link voltage within 0.04 V of the set-point.
More robust control systems which can adapt to changes in operating modes areproposed and simulated in [58, 63, 64]. Four types of terminals for dc microgridsare defined: dispatchable loads, dispatchable sources, intermittent sources, and a gridinterface. Use of dc voltage measurement is proposed as a proxy for stability, and a tieredstructure is constructed, where defined ranges in voltage are assumed to correspond tostandard variations in operating modes of any system with each type of terminal present.The voltage tiers also correlate to the number of power versus slack buses present atany given time. Different control schemes are used within each voltage range, variouslycomprising droop, proportional control, proportional-integral control, feedback loops,and high- and low-pass filtering.
In [63], while the system performs well in certain aspects of controlled simulation,it is inherently reliant on careful selection of voltage parameters, and assumes uniform,constant voltage drop between any two points in the microgrid. Varying voltage mea-surements are accounted for in the experimental setup tested in [64], but the accuracyand reliability of the voltage measurement system is identified as a critical and costlycomponent of the system, limiting its extensibility.
In [58], the system uses the time constant and frequency of disturbances to determinethe root cause event, and implements a control strategy targeted at responding to specific,predetermined events. In simulation the system is able to distinguish between eventsand implement the proscribed control strategy to restore stability, but further testingwith different events and simultaneous events is required.
2.3.3 Decentralized control systems
Moving in the direction of decentralized control, [65] proposes a control system whereeach node on the dc microgrid handles primary control locally with droop, only requiresa data link to its immediate neighbors (using a graph network) for secondary and tertiarycontrol functions. Each node transmits its own measured per-unit voltage and current,

Chapter 2. Overview of dc microgrids 15
and its estimate of the network voltage. Voltage drop between nodes is accommodatedby setting a communication "weight," or data transfer gain. A voltage observer withnoise filtering combines the local and neighboring voltage measurements to estimate thevoltage across the microgrid, and thus determine the correct local setpoint. To set initialcontrol parameters, prior knowledge of the frequency response must be known, as wellas the microgrid admittance matrix.
In simulation and an experiment using laboratory equipment, the proposed controlsystem outperforms standard droop control in correctly maintaining the voltage setpointand implementing load-sharing. It also demonstrates immunity to noise. Response toload changes, converter failure, and failure of individual data linkages are also testedwith satisfactory results.
A decentralized approach, treating all terminals the same, is proposed and simulatedby [66]. Prior attempts to develop robust secondary control for dc microgrids are foundto assume presence of a single power source, neglect voltage drop between differentpoints on the grid, or artificially insert a small ac signal to attempt "borrowing" of accontrol methods.
To overcome these challenges, a decentralized, droop-based system tuned for lowvoltage regulation is combined with a centralized controller to ensure load sharing. Thecommunication scheme proposed uses digital signals (to reduce the impact of noise),while only requiring transmission of two bytes of data per source–allowing for the use ofrobust yet low-bandwidth, low-speed networks such as CAN (controller area network).In a system with two loads and two sources, simulations and experimental evaluationdemonstrate average voltage regulation less than 3%, and current sharing error below0.5%.
2.3.4 Hybrid ac and dc microgrids
Another important consideration of dc microgrids is interoperability with ac systems[67]. A hybrid system consisting of dc interconnection to share dc sources and storage isconsidered in [57]. This system effectively consists of creating a shared bus for dc loadsand the batteries used for storage: the bulk of the control tasks are still handled by the acsystems.
In contrast, [68] considers "pairs" of ac and dc microgrids which share a single storagesystem and grid-tie connection. In this system, standard primary and secondary controlmethods can be used for the two ac and dc "subgrids," while the tertiary controller servesas a "gatekeeper" to connect the subgrids to each other, storage, or the grid, througha common dc link. With droop control for the two subgrids, an experimental systemwas developed which demonstrated the system’s ability, using only low-bandwidth

Chapter 2. Overview of dc microgrids 16
communication, to effectively manage the two subgrids, focusing on reducing charg-ing/discharging of batteries (increasing their lifespan) and reduced operation time ofpower converters (to minimize losses).
2.3.5 Control of interconnected dc microgrids
A control scheme for clusters of dc microgrids is proposed in [69]. Decentralized controlat the primary level regulates voltage and current sharing using adaptive droop controlbased on battery SOC. At the secondary level, power flow between connected microgridsin the cluster is managed by a centralized controller adjusting voltage set-points basedon the SOC within each microgrid. When a single microgrid is preparing to connectwith the cluster, this secondary controller will match the dc-link voltage to allow forsmooth transition; once connected, the secondary controllers of all connected microgridscooperate to adjust voltage set-points and facilitate power flow between microgridsbased on relative SOC. Similar to [65], a graph network is used to connect the controllerof each microgrid and share measured voltage and SOC.
In simulation, voltage and battery charge/discharge current of individual microgridsis properly controlled, and connection between microgrids is shown to have a smoothtransition. The ability of three interconnected microgrids to share power and movetowards a common value for SOC (microgrids with higher charge sending chargingcurrent to those with less) is also demonstrated.
While not specific to dc microgrids, [70] also considers group control of microgrids,including economic considerations as a control factor. For a group of interconnectedmicrogrids, when any individual microgrid has a power shortage, it can choose betweenconsuming fuel for dispatchable energy sources (such as a generator), purchasing powerfrom the grid, or purchasing from other microgrids. Conversely, a microgrid withexcess capacity can sell this power to the grid, sell it to other microgrids, or store it(within storage limits). Each of these choices have specific economic impacts whichcan change seasonally, daily, or even hourly. While operation of any microgrid haseconomic considerations and constraints, the added option of exchange with neighboringmicrogrids adds an additional degree of freedom to the problem of optimal economicdispatch. This creates a more complex problem, which the authors address by solving theoptimization in a piecewise linear fashion. In simulations based on an actual microgridinstallation in Guangxi Province, China the proposed control method demonstrates thatinterconnected microgrids are able to operate in a more profitable way than an identicalgroup of non-cooperating microgrids.

Chapter 2. Overview of dc microgrids 17
2.4 Conclusion
The nature of renewable energy sources, energy storage systems, and many typical loadsprovides significant potential for dc microgrids. Such microgrids are a natural outgrowthfrom existing development for data centers, traction power systems, and other areaswhere dc power systems have been used for decades. However, there remains a lack ofstandardization for protection and control in dc power systems.
Control in dc microgrids can be broadly separated into centralized and decentralizedapproaches; the former typically being more robust and stable, with the latter beingeasier and more cost-effective to implement. Significant effort has also been put intocontrol systems for hybrid ac-dc microgrids, or interfaces between ac- and dc-microgrids.An additional area of research which has not received significant attention in the past isthe effect of aggregating microgrids, and the benefits and challenges this could bring.

18
Chapter 3
MEM: Microgrid Energy Manager
3.1 Introduction
MEM, the Microgrid Energy Manager, is a platform conceived and developed at theUniversity of Wisconsin-Madison for the purpose of microgrid research and development,in line with the priorities discussed in chapter 1. MEM involves groups of individualhomegrids aggregated together as a microgrid. A homegrid may consist of a home or smallbusiness with its own local energy sources (typically solar PV) and storage (typicallybatteries). Several homegrids grouped together comprise a microgrid, which may alsoinclude shared resources such as larger energy sources (wind turbines, generators, orhydroelectric plants), street lights, and pumped water energy storage. A schematic ofsuch a system is given in fig. 3.1.
MEM consists of two major components, and several sub-components:
MEMcloud: The Microgrid Energy Manager cloud application, which monitors andcontrols individual microgrids and their component homegrids.
HEM: The Homegrid Energy Manager, a hardware and software platform which per-forms local monitoring and control of individual homegrids. Each HEM mayconsists of several components:
HEMcore: The core hardware required for a homegrid, including processors andcommunications interfaces.
HEMapp: The software running on HEMcore which actively monitors and controlsloads, and interfaces with MEMcloud through several possible communica-tions protocols. This includes the firmware and drivers necessary to operatethe hardware peripherals, as well as user code which makes decisions abouthow to operate the hardware.
HEMac: Energy metering and relays used for interfacing with ac loads and sources(110 – 230 Vac, 50 – 60 Hz), interfaced through third-party potential transform-ers, current transformers, and contactors.

Chapter 3. MEM: Microgrid Energy Manager 19
SHARED RESOURCES
MICROGRID AMICROGRID A
HOMEGRID 1HOMEGRID 1
MICROGRID kMICROGRID k
HOMEGRID nHOMEGRID n
ENERGY SOURCES
ENERGYSTORAGEENERGY
STORAGELOADS
...
...
MicrogridEnergy Manager
FIGURE 3.1: Illustration of MEM/HEM hierarchy [71]
HEMdc: Energy metering and relays used for interfacing with dc loads, sources,and batteries (12 – 48 Vdc, up to 10 A per circuit).
The relationship between these components and MEMcloud is illustrated in fig. 3.2.The rest of this chapter will provide additional details on the design and function of theMEM components, going into detail where applicable for this paper.
3.1.1 Previous publications on MEM
The MEM system has been in development since 2013, and has served as the subject ofseveral previous papers.
In [62], a masters thesis, the wireless sensor network for establishing and monitoringMEM microgrids/homegrids is developed. Testing of reliability and network elementsin various topologies and physical environments was performed. Results from this workguided the development of a hardware system which served as the immediate precursorto the MEM/HEM system which is the subject of the present study.
MEM was also the subject of several forthcoming papers presented at a conferencein December 2016 [72]. Aggregation of power and storage requirements for homes isstudied in [73], where a simulation of four average Wisconsin residences finds that loadvariability can be reduced by up to 25%, and battery storage requirements by 10%. In[71], the motivation and need for MEM system is given, highlighting gaps in current

Chapter 3. MEM: Microgrid Energy Manager 20
EVENTLOGGER
HEMDAEMON
SCHEDULER
INTELLIGENCEENGINE
ENERGYMONITOR
COMMANDMANAGER
SECURITY MODULE
COMM.MANAGER
ETHERNET
REAL-TIMECLOCK
GPRS/GSM/3G
WIFI
ENERGYMETERING
SERIAL COMM.
RELAYS
IoTENGINE
PRICEOPERATOR
WEATHER UNIT
SECURITYMODULE
GRIDINTELLIGENCE
FIGURE 3.2: Block diagram of MEM and HEM components [71]
research on the topic of small-scale microgrids. Finally, [74] provides further test andverification of the wireless sensor network system developed in [62].
3.2 MEMcloud
MEMcloud is a cloud application which handles data storage, system management,and remote user interface. Long term, MEMcloud will be responsible for collectingand analyzing all data relevant to the operation of microgrids and homegrids. Thisincludes such data as weather forecasts, solar availability predictions, fuel prices, andgrid electricity costs. MEMcloud is also responsible for monitoring and controlling

Chapter 3. MEM: Microgrid Energy Manager 21
shared community resources which are not associated with a specific homegrid, such aslarge-scale energy sources and storage, as well as public services such as street lightingand water treatment.
3.3 HEM
AV
AV
ENERGY SOURCES
ENERGYSTORAGEENERGY
STORAGE
CONTROLLER & PERIPHERALS
ENERGY METERS RELAYS
FIGURE 3.3: Example of a homegrid [71]
A homegrid is a small autonomous unit within a microgrid–typically a home or smallbusiness, with a small solar array and one or two batteries, as illustrated in fig. 3.3. Largerhomegrids are also possible, but at this stage in development the focus is on systemswith demands in the range of hundreds of watts.
The HEM system consists of the HEMcore hardware, paired with one or both ofHEMac and HEMdc interfaces. The hardware platform is managed by the HEMappsoftware.
HEMapp is responsible for monitoring the battery and loads to keep the systemoperating within limits. HEMapp also handles communication with MEMcloud and thelocal user interface. The basis of HEMapp is a multi-threaded application written in Cwhich interfaces with each of the hardware components. User applications are written inPython, which then interface with HEMapp through an on-board UDP server.
3.3.1 HEMdc interface
HEMdc was developed in early 2017 for the purpose of isolating the communicationsand processing components of the HEM system from the relays and energy meters whichinterface directly with potentially high-power loads and sources (an ac corollary, notcovered in this paper, has also been developed). A block diagram of the hardware isshown in fig. 3.4.
The main features of HEMdc are:

Chapter 3. MEM: Microgrid Energy Manager 22
I2C SCL
5V
GNDI2C
OPTOISOLATION
BUFFER
3.3V
GND
I2C SDA
I2C SCL
I2C SDA
I2C SCLHEM
COR
E IN
TERF
ACE
I2C MUXI2C MUX
3.3V LDO3.3V LDO
GPIO MUXGPIO MUX
I2C SDA I2C BUS
GPIO BUS
++++
++++
METER 1METER 1
METER 2METER 2
......
METER nMETER n
RELAY 1RELAY 1
RELAY 2RELAY 2
......
RELAY nRELAY n ++++
++++
ISO
LATI
ON
---GROUND BUS
SOUR
CES
LOAD
S
HEM DC
3.3V
GND
ISOLATED3.3V LDOISOLATED3.3V LDO
FIGURE 3.4: Block diagram of HEMdc interface
I2C interface with isolation and buffering. HEMdc communicates with HEMcore overan I2C interface. I2C is a serial bus interface consisting of a serial data line and serialclock line pulled-up to 3.3 Vdc [75]. Because I2C is specified for communicationwithin a PCB, buffering and optical isolation is added to extend functionality toprovide a board-to-board interface, improve reliability, and provide protection forthe HEMcore components.
Isolated power supply from HEMcore. The same cable which carries the HEMcore datainterface also supplies 5 Vdc power to operate HEMdc. The 5 Vdc is fed througha 1 W isolated, regulated, dc-dc converter. As with the I2C lines, isolation isimplemented to protect the HEMcore components. Power is brought over fromHEMcore (rather than using a separate supply) so that both components can sharethe same battery back-up system.
Eight 12–48 Vdc, 10 A, input/output interfaces for sources and loads. Screw terminalsare provided allowing for eight pairs of input and output connections (together re-ferred to as a node). Rather than providing channels for specific purposes (sources,loads, or storage) the design decision was made to provide eight generic chan-nels. During the development phase this will enable more flexible configuration ofHEMdc, at the cost of a more complicated external wiring setup. This configurationalso ensures that each channel can accommodate currents up to 10 A.

Chapter 3. MEM: Microgrid Energy Manager 23
Energy metering. Each of the eight nodes has an LTC2946 energy metering IC [76].This IC measures voltage, current, power, energy, and charge. Accuracy for allmeasurements is ±1%. Each IC communicates to HEMcore via the I2C interfacethrough a multiplexer.
Latching relays. Relays are used to connect and disconnect loads and sources at eachof the eight nodes. Relays are driven by a GPIO multiplexer with an I2C interface.Latching relays were chosen so that a loss of power or communication on HEMdcwill not affect operation of user loads and sources. The status of each node isstored by the HEMapp periodically so that in the event of a loss of communica-tion or power, the previous state of all relays can be restored immediately uponreconnection.
Full schematics for HEMdc are provided in appendix A, along with informationabout the Gitlab repository where the PCB design files are available.

24
Chapter 4
Experimental verification of HEMdc
4.1 Introduction
Microgrids are often powered by a high ratio of renewable energy resources, such aswind, water, and solar power. This is done for many reasons, including availability ofsuch resources, cost savings from avoided fuel purchase, and reduced pollution andemissions. However, inherent in this design choice is the unpredictability, intermittency,and limited dispatch ability that comes with such resources. As a result, energy storageis often used in microgrids to supplement renewable energy resources, and ensure poweravailability at times when wind, water, and solar power are not available. Of energystorage resources, batteries are the most ubiquitous, and are desirable as an affordable,mature technology that can be easily scaled up or down [77].
4.2 Battery management
As an integral component of microgrids, accurate monitoring and intelligent controlof the battery is required. While many manufacturers advertise useful battery lives offive years or more, achieving this lifespan requires intelligent operation and dependson number of factors, including rate of charge and discharge, ambient temperature, anddepth of discharge [78, 79].
Two experiments were conducted using HEMdc to verify its ability to effectivelymonitor and manage batteries. The experiments focus on two aspects of battery manage-ment: first as an individual resource managed by an isolated homegrid, and second as ashared resource among the homegrids within a microgrid. Both tests rely on the abilityof HEMapp to properly determine the battery state-of-charge (SOC).
4.2.1 Individual battery management
In the most basic energy storage system, the battery is connected directly to loads andsupplies power until it is depleted, and remains depleted until a charging resource (suchas grid connection or solar PV input) is available. This results in two problems: first, if

Chapter 4. Experimental verification of HEMdc 25
low-priority loads are connected simultaneously with high-priority loads, the former willincrease the rate of battery discharge; low priority loads will be served at the expense ofmore critical loads. Secondly, deep discharge of the battery will occur regularly, reducingits useful life [80].
Thus, a battery management algorithm which can prioritize loads, and prevent deepdischarge of batteries, is desired. Design of such a system is described in section 4.3, andtesting of the system is performed in section 4.4.
4.2.2 Collective battery management
In off-grid power systems utilizing SHS or similar technology, during times with nosolar resource availability, batteries in some homes may be depleted, while those in otherhomes will not be. Using the MEM system, MEMcloud tracks the SOC of the batteriesin each homegrid, and creates connections where appropriate to allow under-utilizedstorage capacity to benefit other users. In practice, such a capacity sharing system wouldlikely be accompanied by a rate structure whereby users with excess capacity would becompensated for sharing this resource with the microgrid.
HOMEGRID 2
HOMEGRID 1
FIGURE 4.1: Test setup used for HEMdcverification experiments
Following the design discussed in sec-tion 4.3, an experiment to demonstrate thefunctionality and benefit of such a system fortwo homegrids is described in section 4.5.
4.2.3 Hardware and software for testing
The testing rig used for all experiments de-scribed in this section is shown in fig. 4.1. Twohomegrids with their own batteries and loadswere connected on one cart, with a wired con-nection for power sharing. Homegrid 1, on theleft, consists of the HEMcore board, interfacedto loads through the HEMdc board. Home-grid 2, on the right, is comprised solely of theHEMcore board, directly interfaced with dcloads. This is a previous version of the HEMhardware built prior to the development of theHEMdc interface. The loads pictured includefans and lights.
Details of the C and Python code used for the experiments is provided in appendix B,along with links to the Gitlab repositories where the code is maintained.

Chapter 4. Experimental verification of HEMdc 26
4.3 Use of batteries in dc homegrids
4.3.1 Choice of batteries
The HEMdc system utilizes valve-regulated lead-acid (VRLA) batteries, also knownas sealed lead-acid (SLA) or simply lead-acid batteries. Specifics of the two models ofbattery used in the experiments described in this chapter are included in table 4.1.
Make Model Type Vnom Capacity (Ah) Vempty Vf ull
Optima Bluetop D34M AGM 12 55 11.2 13.1B.B. Battery BP7-12 Gel 12 7 10.5 12.8
TABLE 4.1: Selected details of batteries used for HEMdc experiments
Lead-acid batteries are the most common type used when a UPS, microgrid, orback-up power system incorporates batteries for energy storage. This popularity isdue to wide availability, low cost, and familiarity [81, 82]. Tubular lead-acid batteriesallow for deep discharge, making them well-suited to microgrids and renewable energytechnology (RET) applications [80]. The well-developed lead-acid recycling industry(able to recycle up to 95% of lead in batteries) is also a tremendous advantage, loweringcost and reducing environmental impact [83]. Development efforts specific to microgridand related applications have focused on increasing specific energy (capacity to weightratio, measured in Wh/kg) and deep-discharge cycle life [80].
Another battery technology, lithium-ion (Li-ion), is beginning to show promise asan energy storage means for microgrids and RETs. Since first being commercialized inthe 1990s, the chief advantage of Li-ion has been its high energy density, making it idealfor mobile devices and electric vehicles, where weight and bulk are important factors[83]. But, its comparative cost has kept it out of the picture for renewables. Recently,the rapid growth in the electric vehicle market has spurred further development ofLi-ion technology [84]. This increases the opportunity for the other advantages of Li-ion,chiefly its higher power rate and cycle life, to develop and outweigh its disadvantagescompared to lead-acid [82]. With growing demand, improvements in materials sourcingand recycling are also likely.
4.3.2 Calculating state-of-charge
The first step in managing batteries is accurately monitoring the level of charge. HEMdcinterfaces with its power source(s) directly through the battery, counting the flow ofcharge from the battery to the loads by direct measurement using an energy monitoringIC at each load–the LTC2946 [76]. The IC measures charge (in coulombs, C) with anaccuracy of ±0.6%. By counting the coulombs flowing to each load, and knowing thetotal capacity of the battery, HEMapp can determine the change in SOC.

Chapter 4. Experimental verification of HEMdc 27
The initial SOC (a value between 0 and 1) is calculated based on the open circuitvoltage Voc(t0) measured each time HEMapp begins running, assuming that the batteryhas been in an open-circuit state for some time [85–87]:
SOC(t0) =Voc(t0)−Vempty
Vf ull −Vempty(4.1)
Values for Vf ull and Vempty are provided by the battery manufacturer, and representthe expected equilibrium open circuit voltages when the battery is fully charged anddepleted, respectively.
The assumption that the battery has been left in an open circuit state for some timeis critical, as several hours may be required for lead-acid batteries to reach equilibriumafter charging or discharging [86].
With the starting value for SOC known, the change can be calculated from subsequentmeasurements in the charge, Q:
∆SOC =Q[k]−Q[k− 1]
Qc × 3600(4.2)
The LTC2946 provides an accumulating register recording coulombs flowing from asource to a load. This value, Q, is updated by the IC every 16 ms (based on an externaloscillator), and read by HEMapp approximately every 5 s (denoted Q[k] to indicate thediscrete nature of the measurement). The factor of 1/3600 is used to convert between Ah(the unit of measure of battery capacity) and C.
Finally, the value of SOC is updated continuously by HEMapp by subtracting ∆SOCeach time it is calculated.
4.3.3 Charge management algorithm
HEMapp uses SOC to make decisions about when to allow power export, request powerimport, and enable or disable loads. Each of these actions enables HEMapp to meet itsfour objectives, in order:
1. Prevent over-discharge of battery
2. Reserve sufficient battery charge to serve high priority loads
3. Provide power to lower priority loads as often as possible
4. Export power to other homegrids to sustain the larger microgrid
Various thresholds are set within the HEMapp to make decisions and accomplishthese goals. The general process is shown in the flowchart of fig. 4.2. For each thresholdthat is set, different actions are defined.

Chapter 4. Experimental verification of HEMdc 28
Start
Estimate initial SOC from terminal
voltage
SOC below threshold?
YES Exporting power?
YESEnd export
NO
Importing power?
Threshold load(s) on?
Turn off threshold load(s)
Update SOC
NO
Request power import
YES
NO
YES
NO
FIGURE 4.2: Flowchart describing HEMapp decisions based on battery SOC
4.4 Individual battery management experiment
To test the basic functionality of SOC calculation and the ability of HEMapp to use thisinformation, the following test was established. A HEMdc system was connected withthree loads of different priority levels:
High priority: 0.5 W LED light; powered when SOC exceeds 25%
Medium priority: 3 W LED light; powered when SOC exceeds 50%
Low priority: 7 W cooling fan; powered when SOC exceeds 75%

Chapter 4. Experimental verification of HEMdc 29
The system was connected to the 7 Ah battery of table 4.1. With a fully chargedbattery, HEMapp was started, and all three loads were powered on. The test was runtwice for 14 hours, with and without the battery management algorithm in place. Asthe battery was depleted past the thresholds at 25%, 50%, and 75%, loads were disabledstarting from the lowest priority.
4.4.1 Results and discussion
0
5
10
15
V
Terminal voltage
0
0.5
1
A
Load current
0 2 4 6 8 10 12 14
Elapsed time (hours)
0
50
100
%
State-of-charge
No charge management With charge management
50%75%
FIGURE 4.3: Waveforms of battery voltage, load current, and battery SOC,illustrating operation of HEM with load switching during different states
Results are shown in fig. 4.3. In the scenario with no battery management (blue line),no loads are being served at all after 12 hours, and in the interval from 9 to 12 hours,current to the loads diminishes rapidly, resulting in the erratic usage shown just beforethe 12th hour. In a real-world scenario such erratic behavior could result in damage tothe loads, battery, management equipment, or all three.
In contrast, with the management algorithm running (red line), the high priority loadis served for the duration of the test, and the medium priority load (powered off when

Chapter 4. Experimental verification of HEMdc 30
SOC reaches 75%) is served for approximately the same duration as it had been in thetest with no battery management. The low priority load (which had the highest usage inthis scenario) is served for just over two hours. At the end of the test the battery retainsnearly 50% charge.
4.4.2 Future improvements
In a real-world scenario, the priority of loads would be determined by the user through asimple ranking mechanism. Setting specific values for the SOC thresholds is an area of on-going research. Current development of the HEM system involves automatic calculationof the thresholds by the HEMapp based on the quantity and size of the loads, and otherfactors such as battery capacity, type, and age. Longer-term work proposes varying thethresholds based on time of day (a predictor for solar energy input), availability of powerexport from neighboring homegrids, and occupancy (whether the homegrid users arepresent or not).
Additionally, factors such as self-discharge and ambient temperature will need to beincluded in the real-time calculation of SOC in order to improve accuracy, especially overthe lifetime of a battery.
4.5 Collective battery management experiment
A second experiment was conducted to test the ability of two homegrids to managebattery capacity collectively. As described in fig. 4.2, as SOC reaches specific thresholds,HEMapp makes decisions about starting or stopping power import or export. Thevarious thresholds programmed for each homegrid for the power sharing tests aredescribed in table 4.2. This table also gives the nominal power rating of the two loads(high priority and low priority) for each homegrid.
Threshold Action
60% Disable power export50% Request power import40% Disable low priority load (4.5 W)10% Disable high priority load (5.5 W)
TABLE 4.2: Threshold definitions and actions for the two homegrids of the powersharing test
To demonstrate the advantage of power sharing, the two homegrids used batteries ofdifferent total capacity of the test. Details of the batteries and their SOCs at the beginningand end of each test (base case and actual) are given in table 4.3.

Chapter 4. Experimental verification of HEMdc 31
Homegrid 1 | 7 Ah battery
Initial SOC Final SOC
Base case 98% 10%Test case 94% 16%
Homegrid 2 | 55 Ah battery
Initial SOC Final SOC
Base case 84% 60%Test case 86% 54%
TABLE 4.3: Details of homegrid batteries and SOCs for power sharing test
4.5.1 Baseline
A baseline was established by charging both batteries and running both homegridswithout the ability to share power. During the 14 hours of the test, no external powersource was used to charge the batteries, and no loads were toggled manually. HEMappexecuted load curtailment as needed based on SOC. Results for this scenario are shownin fig. 4.4.
In this scenario, homegrid 2 maintains sufficient charge to avoid the need for loadcurtailment, while homegrid 1 passes two thresholds, requiring it to curtail all loads afterroughly 9.5 hours.
4.5.2 Power sharing enabled
Next, power sharing was enabled in the HEMapp algorithm. As in the base case, the teststarted with all loads switched on, and batteries fully charged. The power sharing linkwas initially disconnected.
Request for power export is accomplished automatically, with the "importing" home-grid sending an SMS to the "exporting" homegrid. The exporting homegrid initiates theexport as long as its own SOC is above the programmed threshold.
When power export is active, the local battery for the importing homegrid is leftactive–this is to ensure that local loads will continue to be served in the event that theexporting homegrid ceases exporting, or if there is a fault on the power lines linking thetwo homegrids.
4.5.3 Results and discussion
Plots of terminal voltage, current, and SOC are shown in fig. 4.5 for the duration of thetest.
From the plots it can be seen that when the SOC for homegrid 1 reaches 50%, itrequests power export from homegrid 2. Homegrid 2 initiates the export (indicated by

Chapter 4. Experimental verification of HEMdc 32
10
11
12
13
V
Terminal voltage
Homegrid 1Homegrid 2
0
1
2
A
Load current
0 2 4 6 8 10 12 14
Elapsed time (hours)
0
50
100
%
State-of-charge
10%40%
FIGURE 4.4: Waveforms of battery terminal voltage, load current, and batterySOC, illustrating base case of two homegrids with power sharing disabled
the purple shaded region) until its own SOC diminishes below 60%. Shortly after this,homegrid 1 reaches 40% and curtails its low priority load.
After 14 hours the test ends. At this point, homegrid 2 still has both of its loadsenabled (as in the base case), while homegrid 1 still has its high priority load enabled–unlike the base case, where all loads were curtailed after 9.5 hours.
Additional detail for the time period during which power sharing is active is givenin fig. 4.6.
An interesting result can be observed for the first several minutes after power sharingis enabled. The start of power sharing equates to directly connecting the two batteriesof each homegrid. This causes a period of instability in the system, where the voltagesof the two homegrids fluctuate. As a result, the share of power supplied to the loads atthe importing homegrid fluctuates between the remote and local batteries for several

Chapter 4. Experimental verification of HEMdc 33
10
11
12
13
V
Terminal voltage
Homegrid 1Homegrid 2
0
1
2
A
Load current
0 2 4 6 8 10 12 14
Elapsed time (hours)
0
50
100
%
State-of-charge
40%50% 60%
Power sharing
FIGURE 4.5: Waveforms of battery voltage, load current, and battery SOC,illustrating operation of two homegrids with power sharing enabled (see
description of thresholds in table 4.2)
minutes.Just after the seven hour mark, another destabilization event nearly occurs, with the
current drawn from the battery at homegrid 1 beginning to rise sharply. More work isneeded to study and prevent these types of events when power sharing between twohomegrids is enabled.
4.6 Conclusions and future work
The tests performed in this section demonstrate that the HEMapp is able to intelligentlymanage a homegrid’s battery by measuring SOC, and using this data to curtail loads

Chapter 4. Experimental verification of HEMdc 34
0
0.5
1
1.5
2
A
Homegrid 1 currents
Loads Power sharing Battery
0 2 4 6 8 10 12 14
Elapsed time (hours)
0
0.5
1
1.5
2
A
Homegrid 2 currents
40%50% 60%
FIGURE 4.6: Current waveforms for two homegrids with power sharing enabled(to keep plot scales consistent, "Power sharing" is represented as a source in
Homegrid 1, and a load in Homegrid 2)
based on priority. Additionally, when two homegrids are connected, HEMapp is able tomanage sharing of power between them to further prolong battery life.
In a real-world situation, HEMapp would require additional information to properlyprioritize between powering local loads, and sharing power with other homegrids.For instance, there may be scenarios where a local load could be curtailed to continuesupplying power to a remote load. This could represent a situation where the potentialincome from selling excess power is deemed more profitable than some local use ofpower. The opposite scenario could also be true–rather than requesting power import,HEMapp may choose to curtail a local load if such a decision is deemed to be less costly.

35
Chapter 5
Microgrid work at NIE-CREST
5.1 Introduction
From February to May of 2015 Professor Giri Venkataramanan completed a teachingsabbatical at the National Institute of Engineering (NIE) in Mysuru, India [88]. Whileworking with a group of students on construction of a microhydro generator (see sec-tion 5.4.1.2), he forged a relationship with Professor Shamsundar Subbarao, AssociateProfessor of Mechanical Engineering at NIE, and director of CREST, the Centre for Re-newable Energy and Sustainable Technologies. The two proposed a partnership betweentheir two institutions to cooperate on microgrid research, development, and testing.Professor Giri’s research group would provide research expertise and system design,while CREST would provide space for testing, project management for implementation,and expertise on biofuels.
Project collaboration began in December 2015 when Professor Giri and two students(including the author) traveled to Mysuru for three weeks to set up small-scale microgridtest-bench and run a workshop on microgrids with a group of NIE undergraduatestudents from various engineering disciplines.
In May 2016, the two institutions signed a memorandum of understanding, "to pro-mote academic cooperation [. . . ] with a focus on expanding scholarly ties and exploringthe feasibility of establishing a framework for educational and scientific cooperation"[89].
To date, the author has traveled three times to CREST to collaborate on microgridresearch and development. Other members of the microgrid project team from UW-Madison are scheduled to travel to NIE in summer 2017 to continue working on theproject.
In the following sections a brief outline of each visit is given, followed by documen-tation of the work completed, and specifications of the systems currently in place atCREST.

Chapter 5. Microgrid work at NIE-CREST 36
5.2 Summary of work
Dates of the three visits completed to date are given below, followed by a brief descriptionof the goals and outcomes from each visit.
Phase 1 (December 2015 to January 2016): Install and test energy sources (wind, hydro,solar, and biodiesel) and connect to dc microgrid testbeds
Phase 2 (June to August 2016): Upgrade microgrid control hardware, integrate live of-fice loads (interior and street lighting), set up biodiesel generator remote startsystem
Phase 3 (April 2017): Implement prioritization and scheduling of live loads, interfacewith 10kW library solar system, improve control of streetlights
5.2.1 Phase 1 – December 2015 to January 2016
Professor Giri, the author, and fellow graduate student Ashray Manur traveled to NIE forthree weeks in December 2015 and January 2016. During this initial visit, the team workedwith a group of about 20 undergraduate students in various engineering disciplines,including electrical, electronics, and mechanical.
The primary goal of the workshop was the implementation of four isolated microgridtestbeds incorporating various combinations of energy sources, storage, and both ac anddc loads. To this end, work on four separate energy sources was completed: solar arrays,a wind turbine, a microhydro, and a bio-diesel generator.
In addition, two separate systems for microgrid monitoring and control were testedand implemented: one for ac loads which relied on wifi and wireless mesh for commu-nication, and one for dc loads with a GSM modem for communication by text message(SMS). Elements of both systems were later combined into the MEM platform discussedin chapter 3. A number of design and technical issues with the two systems meantthat their functionality was limited, but the work done was important for laying thegroundwork for later progress.
5.2.2 Phase 2 – June to August 2016
Over the summer of 2016 the author traveled to Mysuru alone to work with a group ofapproximately 30 students, including several from the earlier group.
Students were organized into groups of four to six, each working on one aspect ofthe microgrid system. Work done included adding additional solar panels, performinga load study of the CREST office, producing as-built wiring diagrams, and automatingcontrol of the bio-diesel generator.

Chapter 5. Microgrid work at NIE-CREST 37
Phase 1 team at NIE (photo by CREST staff,2015-12-29)
Phase 2 team on a trek to Bettadapura (photo byauthor, 2016-07-07)
FIGURE 5.1: Team photos from phases 1 and 2
During this phase, the control hardware was upgraded to a more powerful dc-onlysystem, which integrated control, communication, and monitoring aspects of both the acand dc hardware used in phase one.
In addition, the students visited two tribal hamlets to determine suitability for futureelectrification projects (see section 5.6).
5.2.3 Phase 3 – April 2017
The purpose of the author’s final visit to Mysuru was supporting four groups of studentscompleting their final year projects, each incorporating some aspect of the microgrid:
Library interconnection. Study of the 10 kW solar power system at the library, andconnection of an ac line from the library to CREST to allow excess power to serveas an alternate source for the CREST microgrid.
Load prioritization algorithm. Development of an algorithm on the existing dc micro-grid hardware to enable or disable loads based on priority and battery chargelevel.
Streetlight automation. Load study and automation of four streetlights outside CRESToffice, including scheduling around dusk and dawn, and increasing brightnesswhen cars and pedestrians approach.
Vertical-axis wind turbine. Testing and characterization of a custom-made vertical-axiswind turbine using an off-the-shelf permanent magnet dc machine.
A site visit to another potential site for microgrid implementation was also conducted.

Chapter 5. Microgrid work at NIE-CREST 38
5.3 CREST description and setting
CREST is located in the city of Mysuru, in the state of Karnataka in southern India.The main campus is at N12°16.8′ E76°38.5′. A satellite image of the main NIE campus,showing the location of the various CREST microgrid elements, is given in fig. 5.2.The map was created in Google My Maps and can be viewed interactively on-line at:https://goo.gl/YG3JKN. Additional images are included in the on-line version, as wellas a scale for estimating distances. Selected annual average weather data for the city ofMysuru is given in fig. 5.3.
FIGURE 5.2: Satellite image of NIE campus indicating location of CRESTmicrogrid elements. View on-line: https://goo.gl/YG3JKN. Map data: Google
Imagery, CNES / Astrium, DigitalGlobe (2017).
CREST is run by a staff of five full-time employees. The office is intended to supporttypical tasks such as hosting meetings, using computers, filing documents, and storingproject materials. For educational purposes, there is a small library and a full-sizeclassroom with projector and sound system. In addition, the office includes a bathroomand small kitchen.
The office occupies roughly 200 m2 on the top floor of a two-story concrete building.The main office space has windows facing north and west; the kitchen and bathroom

Chapter 5. Microgrid work at NIE-CREST 39
02
450
244
W/m
2
Direct solar irradiancea
Month
6 18
Hour
900
8 1210 612
12
3
244
m/s
Wind speeda
Month
6 18
5
Hour
8 1210 612
152
25
244
° C
Ambient temperaturea
Month
6 18
Hour
35
8 1210 612 2 4 6 8 10 12
Month
0
5
10
15
20
cm
Rainfallb
a Hourly solar, wind, and temperature from satellite-derived 10km grid data,averaged over 2002 to 2011 [90]
b Average monthly rain data for Karnataka state, measured by rainguage, aver-aged over 2004 to 2010 [91]. Bounded line shows one standard deviation.
FIGURE 5.3: Selected annual weather data for Mysuru
line the eastward facing wall. The roof above is flat, and accessible only by ladder fromthe outside of the building.
5.3.1 CREST office wiring and loads
Power comes into the office at one location, where it branches in two: one line supplyingsecondary lighting and ceiling fans, and the other diverted through an uninterruptiblepower supply (UPS). From the UPS, one line supplies computers, a projector, and plugloads (mainly fans), while a second line supplies primary lighting. At peak, the UPSsupplies 1000 W for lighting and computers (including 600 W for the projector). Thenon-UPS load is 750 W peak. Loads and other details of the UPS are included in table 5.5along with details on the microgrid testbeds.
Appendix C contains additional details of the office wiring: A simplified one-linediagram is shown in fig. C.1, and the office electrical layout is given in fig. C.2.
Chapter 5. Microgrid work at NIE-CREST 40
5.3.2 CREST office networking
The CREST office has a dedicated Wi-Fi network (independent from the NIE Wi-Finetwork), and a LAN network switch. The general settings to be used for any deviceon the LAN are given in table 5.1. For a specific IP address and network access it isnecessary to communicate with the NIE network administrator.
IP address start 192.168. 19. 2IP address end 192.168. 19.253Gateway 192.168. 19. 1Subnet mask 255.255.255. 0DNS 118.151.209. 5
118.151.209. 6
TABLE 5.1: CREST LAN details
5.3.3 NIE library solar power system
Professor Shamsundar was instrumental in obtaining and installing a solar power systemfor the NIE College library. The system consists of seven strings of the same a-Si panels inuse at CREST (see table 5.2), for a total of 8,600 kW. Energy storage consists of 15 tubularlead-acid batteries with 210 Ah capacity each, for a total capacity of 3,150 Ah. A powerconditioning unit, including MPPT charger and inverter, manages battery charging andsource selection between solar, battery, and mains back-up.
During phase three, as a student project, a wired ac connection was installed betweenthe library and CREST, to allow excess power from the library solar system to be exportedto CREST. Automation of the power export requires accessing the real-time data which isstored on the PCU. The NIE students attempted to access this data using a BeagleboneBlack (BBB) single-board Linux computer (which also serves as the core of the MEMsystem). Unfortunately, it was determined that the serial-to-USB port installed on thePCU is not compatible with BBB. Real-time data export from the PCU was successfullydemonstrated, but could not be maintained consistently. At the time of writing, thestudents were in communication with the PCU vendor to resolve this issue.
5.4 Systems in place at CREST
5.4.1 Energy sources
Four principal energy sources are established at CREST: solar, wind, hydro, and bio-diesel. Specifics of each energy source are given below. The locations described refer tothe layout given in fig. 5.2.

Chapter 5. Microgrid work at NIE-CREST 41
5.4.1.1 Solar panels
Two different solar panel technologies are in use in the microgrid system at CREST:amorphous silicon (a-Si), and multicrystalline silicon (multi-Si, also called polycrystallinesilicon or polysilicon). The types and quantities of each panel in use as of this writing areshown in table 5.2.
Type Quantity Vnom VOC ISC Pmax VMP IMP Make Model
multi-Si 2 12 21.0 2.400 35 16.2 2.200 Ammini ASM-12035Amulti-Si 2 12 21.4 3.150 75 17.7 4.250 Su-Kam POLY 12-075multi-Si 2 24 43.2 4.650 150 34.1 4.400 Su-Kam POLY 24-150
a-Si 28 48 101.0 0.787 43 71.0 0.616 Solarex MST-43MV
TABLE 5.2: Selected details of solar panels at CREST (values for dc) [92, 93]
The multi-Si panels in use were either purchased by or donated new to CREST. Thea-Si panels were obtained free of charge when they were removed from a local installationthat was upgrading to newer, more efficient panels. (The manufacturer of the a-Si panels,Solarex, was acquired by BP Solar in 1999; in 2010 BP Solar shut down the Solarexproduction facilities, and in 2011 BP Solar was dissolved [94, 95].)
This type of panel was once very popular, however two key disadvantages havereduced its popularity over time. First, despite making rapid advances in efficiency inthe early years of development, over the last several years the peak efficiency of a-Sicells has stabilized at 10 to 14%, well below that of crystalline silicon technologies, whichrange from 21.2% to 27.6% [96–98].
Second, degradation rates of a-Si are noticeably higher than those for multi-Si [96]: aliterature review of studies of real-world installations found that post-2000, a-Si systemshad a median degradation rate of 0.87% per year per module, compared to 0.64% formulti-Si [99].
The a-Si panels and two of the multi-Si panels are located on the roof of the buildingadjacent to CREST (see photo, fig. 5.4a), with the balance of the multi-Si panels on theroof of CREST itself.
5.4.1.2 Microhydro
The custom-built microhydro generator which Professor Giri had worked on previouslyis located in the fluid mechanics lab; fig. 5.4b shows it in operation.
The machine used in the microhydro is a standard automotive alternator. To operate,a battery must be connected to excite the alternator; this battery also serves to store theenergy produced once it is running. To export power to the microgrid, a 200 W inverteris connected to the battery to produce 220 Vac power for transmission (by a line run tothe CREST office which also carries power from the genset).

Chapter 5. Microgrid work at NIE-CREST 42
(A) The a-Si solar panels (photo by author,2016-01-01)
(B) The microhydro generator in operation(photo by author, 2015-12-29)
FIGURE 5.4: Solar and hydro energy sources for CREST microgrid
At the time of writing the microhydro was undergoing modifications and improve-ments, including addition of an enclosure to improve water flow.
5.4.1.3 Wind turbine
A 400 W Air X wind turbine from Primus Wind Power was pole-mounted on the roofof the CREST building and wired into the office (selected details in table 5.3a). At thetime of writing the staff at CREST were awaiting a shipment of replacement parts (yawassembly and governor) to repair damage to the turbine caused by improper assemblyduring phase one.
In addition, during phase three a student group built and began testing of a verticalaxis wind turbine (see fig. 5.5a). The turbine uses an off-the-shelf 300 W, 12 Vdc permanentmagnet motor. At the time of writing, the students were testing the turbine at variousspeeds using a large fan to characterize its performance.
(A) Vertical-axis wind turbine (photo by author,2017-04-15)
(B) Bio-diesel generator (photo by author,2016-07-05)
FIGURE 5.5: Wind and bio-diesel energy sources at CREST

Chapter 5. Microgrid work at NIE-CREST 43
5.4.1.4 Diesel generator
A 3 kVA diesel generator, model CC1-3AS [100] was purchased and located in an open-airlab, connected to the CREST office by a 220 Vac line (which also carries power from themicrohydro). The generator is run using a mixture of 80% diesel and 20% bio-diesel, thelatter produced at CREST. Selected details are given in table 5.3b.
(A) Wind turbine
Wind speed details
Startup 3.6 m s−1
Operating range 3.6 – 22 m s−1
Optimum range 11 – 15 m s−1
Rated power output 12.5 m s−1
Maximum 49 m s−1
Electrical characteristics
Machine type Permanent magnetRated power 400 WNominal voltage 12 VdcOutput voltage 14.1 Vdc
Physical characteristics
Swept area 1.07 m2
Rotor diameter 1.17 mWeight 5.9 kg
(B) Genset
Generator
Power at rated speed 3 kVAVoltage 230 VacFrequency 50 HzPower Factor 0.8
Engine
Rated output 3.38 kW / 4.6 hpCylinders 1Displacement 306 cm3
Rated speed 3,000 rpm
Performance at rated power
Alternator efficiency 74%Voltage dip <20%Time to rated output <5 sFuel consumption 1 L h−1
TABLE 5.3: Selected details of (A) the wind turbine [101]; and (B) the bio-dieselgenset [100] at CREST
Remote start of generator. The generator includes an ATS interface with a 5-pin, 240°DIN 45322 connector. The pins are:
• Battery positive
• Battery negative
• Generator contactor relay
• Mains contactor relay
• Auto start switch
By connecting auto start switch to battery negative, the generator can be started.The generator and mains contactor relays are used to control which source is supplyingpower to the load–for the application at CREST, these connections are not needed, asthe generator is only run to supply back-up power when called for by the MEM cloudapplication (see chapter 3 for further details).

Chapter 5. Microgrid work at NIE-CREST 44
Under normal operation, a trickle-charge voltage of 13.8 Vdc should be supplied forbattery maintenance.
During phase 2 of the project, a successful test of a remote generator start system wasconducted. The phase 1 control hardware, no longer in use in the microgrid test-beds,was programmed and wired to start the generator using a relay when a text messagecontaining the words "GENERATOR ON" was received. Sending "GENERATOR OFF"opens the relay, shutting off the generator. The internal controller for the generator delaysstarting and stopping as necessary to ensure proper warm-up and cool-down times.
5.4.2 Power conversion
Two key power conversion systems are in place at CREST: battery chargers, and acinverters.
5.4.2.1 MPPT chargers
202
0.9
0.8
0.7
0.6
0.5
0.4
0.3
0.2
0.1
0
Curr
ent
(A)
Voltage (V)0 20 40 60 80 100 120
MST-43MV I-V Curves
Curve Conditions: Allcurves at cell tempera-ture of 25°C and spectraldistribution of AM 1.5;Upper curves at 1 kW/m2 illumination;lower curves at250 W/m2 illumination.
MST-43LV with Universal framing.
FIGURE 5.6: V-I curve for a solar PV panel [92]
The batteries (section 5.4.3) for each micro-grid testbed are charged from the solar PVpanels using battery chargers with MaximumPower Point Tracking (MPPT). Solar PV cellsexhibit a non-linear V-I curve, varying withambient temperature and solar irradiation–seefig. 5.6 for an example. A given point alongthis curve will be the maximum power point,where the panel will produce the maximumpossible power output for a given temperatureand irradiation level. This point can be deter-mined partly through calculation and partlythrough trial and error (or "perturb and ob-serve"); an MPPT charger uses an algorithmintended to determine and maintain the maxi-mum power point [102, 103].
Details of the MPPT chargers at CREST are given in table 5.4.
PV voltage range 17–95 Vdc Float charge 13.8 VdcMax PV input power 450 W Main charge 14.4 VdcNominal voltage 12 Vdc Boost charge activation 12.3 VdcNominal charge current 30 Adc Equalization activation 12.1 VdcMax battery charge current 33 Adc Equalization charge 14.8 VdcMax efficiency 98% Temperature range -40 to +50 ◦C
TABLE 5.4: Selected details of Phocos 100/30 MPPT charger [104]

Chapter 5. Microgrid work at NIE-CREST 45
5.4.2.2 Inverters
Inverters are used to take power from batteries at 12 Vdc and convert it to 230 V 50 Hz.Two different types of inverters are in use at CREST:
UPS inverters use mains power to charge a battery bank, and supply ac loads withpower from the batteries when mains power is not available. Three 700 VA UPSinverters are in use at CREST.
Solar UPS inverters use solar PV input to charge the batteries and supply loads, whenavailable, and fall back to mains otherwise. One 2400 VA solar UPS inverter is inuse at CREST.
5.4.3 Energy storage
The batteries used for energy storage at CREST are exclusively tubular lead-acid batteries.At this time, Li-ion batteries are not being used as a part of the work on MEM, but anIndian startup based in New Delhi is considering working with NIE to provide Li-ionbatteries for testing, which would be done with the system in the CREST office. Seesection 4.3.1 for a comparison of lead-acid and Li-ion battery chemistries.
At the time of writing, eight different batteries with capacity ranging from 40 to 210Ah are in use at CREST. Total combined capacity of all batteries is 840 Ah.
5.5 Microgrid testbeds
During the course of the three visits to CREST, four microgrid "testbeds" were established.Each consisted of a solar power source and a mix of ac and dc loads, with appropriatechargers and inverters. Selected details of the components used in each testbed aregiven in table 5.5. (The table also includes details for the two main circuits in the CRESToffice–one connected via UPS, and the other on a direct connection to mains power.)
The testbeds were color-coded for differentiation: green, yellow, blue, and red. Thegreen testbed also includes the capability to accept wind and hydro power, though bothsources were undergoing repairs and improvements at the time of writing. Schematicsfor all four testbeds are given in appendix C, in figs. C.3 to C.6.
The inverters for all four testbeds were connected to a single back-up line, whichcould be switched between mains power, and input from the bio-diesel genset. Duringphase 3, work began to interconnect the 10 kW solar power system at the library to theCREST office for the purpose of testing power sharing: the 220 Vac line used for thispurpose will also be connected to the change-over switch for selecting back-up sourcefor the inverters. At a later date, when the HEM ac interface is completed and deployed,selection of back-up source will be automated.

Chapter 5. Microgrid work at NIE-CREST 46
Solar input Batterycapacity
(Ah)
Invertercapacity
(VA)
Loads
Paneltype
Power(W)
Vnom(Vdc) Type Peaka
(W) Voltage
Microgrid testbeds
Greenb a-Si 301 48 100 700 Demo lights 15 12 Vdc
Blue multi-Si 300 48 40 700 Office lights 50 12 VdcOffice lights 100 230 Vac
Yellow a-Si 301 48 40 700 Demo lights 15 12 VdcOffice lights 200 230 Vac
Red multi-Si 220 24 210 1,100 Street lights 150 230 Vac
CREST office
UPS a-Si 602 48 450 2,400Lights,officeequipment
1,000 230 Vac
Mains Lights, fans 750 230 Vac
Totals
1,724 — 840 5,600 80 12 Vdc2,200 230 Vac
a Estimated based on quantity and type of light bulbs, fans, and office equipmentb The "green" testbed is also wired to accept wind and hydro as power sources
TABLE 5.5: Summary details of the four microgrid testbeds at CREST (seeappendix C for schematics)
The existing control hardware for the testbeds at CREST is only capable of monitoringand controlling dc loads. It is furthermore limited to 4.5 A on any one of the four availableload circuits, or a total of 8 A for the entire board. Two versions of the control hardwareare shown in fig. 5.7.
(A) Hardware used during phase 1 (photo byauthor, 2016-01-16)
(B) Hardware used during phases 2 and 3(photo by author, 2016-08-01)
FIGURE 5.7: Two generations of the dc load monitoring and control hardware forthe microgrid testbeds at CREST

Chapter 5. Microgrid work at NIE-CREST 47
5.6 Microgrid candidate site visits
During each phase of the project, the author visited several villages which are beingconsidered as candidates for installation of microgrids for village electrification.
5.6.1 Tribal hamlets in protected forest areas of Karnataka
During the first two visits, the author visited hadis (hamlets) located on protected forestlands, populated by indigenous forest dwellers (or tribal people). While a 1990 bill hadguaranteed forest dwellers the right to their historical homelands, the failure of statesto implement the guidelines, and a Supreme Court decision affecting the definition andjurisdiction of "forests," resulted in large-scale evictions of tribal peoples by the forestdepartments of various states [105–107].
Mass protests followed, putting pressure on government to act. While the federalMinistry of Forests and Environment and the Supreme Court made additional attemptsto rectify the situation, nothing changed significantly until 2006, with the passage byparliament of the "Scheduled Tribes and Other Traditional Forest Dwellers (Recognitionof Forest Rights) Act." The act provides a means to clearly define the boundaries of theforests and protected areas, and sets out the rights of tribal people living in those areas.At the same time, it prohibits them from certain activities, such as hunting and trapping,or large-scale cultivation [108].
An additional provision within the act calls for the government to provide for neces-sities such as schools, hospitals, electricity, roads, and water supply–with the stipulationthat such provision cannot violate previously enacted legislation governing the typesof material and construction allowed within the forests. As a result, state governmentsbegan seeking alternative means to provide necessities to the estimated 84 million forestdwellers [105].
Shamsundar (center) and Balachandran (right)address a group of NIE students
Front view
FIGURE 5.8: A bamboo anganwadi in a tribal hadi near Muthur village (photos byauthor, 2016-07-07)

Chapter 5. Microgrid work at NIE-CREST 48
In the case of Karnataka, Professor Shamsundar of CREST, and his associate andfriend Balachandran Chidambaranatraj, an architect, stepped up to offer a solution [109–111]. One requirement of the act was for the government to provide anganwadis, publicchildcare centers which integrate nutrition, health, and education. Balachandran pro-posed a method for constructing anganwadis using locally sourced materials includingbamboo and mud. Working with Shamsundar, they submitted a proposal to constructsuch structures in 13 tribal hadis. The proposal was accepted, and construction of thefirst bamboo anganwadi begin in 2015. Pictures of the second anganwadi, completed in2016, are shown in fig. 5.8.
In conjunction with construction of anganwadis, Professor Shamsundar also pro-posed construction of a microgrid within one of the 13 hadis where anganwadis willbe constructed. To support the proposal, visits to three of the hadis were conducted todetermine suitability. All three sites are located close to the borders of the protectedareas, and thus are relatively accessible by road. Each hamlet consisted of roughly 20homes with about five members each. None of the households have electric connections,generators, or any other source of electricity. Biomass is the main source of fuel forcooking, and candles or battery operated flashlights are used for lighting.
Based on the site visits, any of the three hadis could serve as a good candidate for amicrogrid. Centralized components of the system could be located at the andganwadis.Due to the nature of home construction, rooftop PV would not likely be feasible: thehomes seen consisted of clay or wattle construction with tile or tarp roofs (see fig. 5.9).As such, a pole- or frame-mounted PV array would be more suitable.
FIGURE 5.9: Typical homes in the tribal hadis (photos by author, 2016-07-07)
Due to the preliminary nature of the visits, additional details about individual homeswere not collected. However, a GPS layout of the second two hadis visited was made(see fig. 5.10). The map was created in Google My Maps, and can be viewed on-line (withadditional photos) at: https://goo.gl/7L5iiI.

Chapter 5. Microgrid work at NIE-CREST 49
FIGURE 5.10: Map of two tribal hadis (outlined in blue) being considered formicrogrid installation. View on-line: https://goo.gl/7L5iiI. Map data: Google
Imagery, CNES / Astrium, CNES / Spot Image, DigitalGlobe (2017).
5.6.2 Semi-rural villages on the outskirts of Bengaluru
During the third trip to Mysuru the author accompanied Professor Shamsundar on a visitto two semi-rural villages just east of Bengaluru (the capital of the state of Karnataka).The two villages were Banandur (N12°46.5′ E77°23.9′) and Chowkahalli (N12°44.25′
E77°24.75′).The visits were arranged through a mutual contact with the Bosch India Foundation,
a branch of Bosch India which focuses on corporate social responsibility work in villagessurrounding Bosch locations [112]. Banandur and Chowkahalli are both located nearBosch’s Bidadi plant in the Bidadi Industrial area (see fig. 5.11).
While both villages, being located near the industrial park, have relatively reliableelectric connections, there may be some opportunity for microgrid systems. In particular,both villages have very active dairy cooperatives, producing around 2,000 L of milkdaily. Currently both cooperatives have diesel generators to provide back-up power forthe dairy chillers. Installation of a microgrid in these areas could thus provide moresustainable back-up power during outages, while also reducing fuel costs. Both dairycooperatives are located near other businesses and organizations (such as temples, stores,community centers, and a water purification facility) which could also benefit from amicrogrid.

Chapter 5. Microgrid work at NIE-CREST 50
FIGURE 5.11: Map of villages visited with Bosch India Foundation. Map data:Google (2017).
At this time Professor Shamsundar is proposing to work with Bosch India Founda-tion and the villages to implement rainwater harvesting facilities. Other sustainabletechnologies, including microgrids, would be considered at a later date.
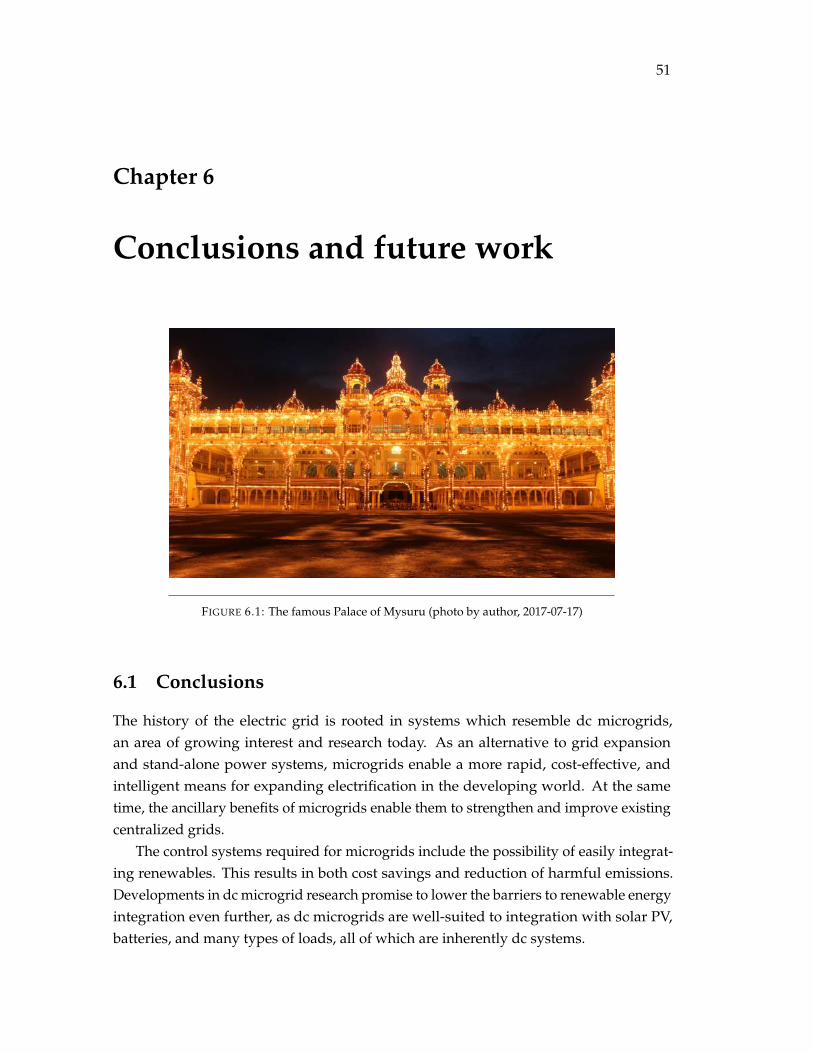
51
Chapter 6
Conclusions and future work
FIGURE 6.1: The famous Palace of Mysuru (photo by author, 2017-07-17)
6.1 Conclusions
The history of the electric grid is rooted in systems which resemble dc microgrids,an area of growing interest and research today. As an alternative to grid expansionand stand-alone power systems, microgrids enable a more rapid, cost-effective, andintelligent means for expanding electrification in the developing world. At the sametime, the ancillary benefits of microgrids enable them to strengthen and improve existingcentralized grids.
The control systems required for microgrids include the possibility of easily integrat-ing renewables. This results in both cost savings and reduction of harmful emissions.Developments in dc microgrid research promise to lower the barriers to renewable energyintegration even further, as dc microgrids are well-suited to integration with solar PV,batteries, and many types of loads, all of which are inherently dc systems.

Chapter 6. Conclusions and future work 52
To this end, the present study has contributed to development of a simple hardwareinterface for monitoring and controlling small dc "homegrids," called MEM–MicrogridEnergy Manager. The ability of this system to monitor battery charge was tested. One ofthe core benefits of microgrids–the ability to intelligently share power–was also tested.Results indicate that MEM can preserve battery charge to make sure priority loads arepowered, and that a pair of homegrids can effectively consolidate their local storageresources for mutual benefit.
Over three visits to the National Institute of Engineering in Mysuru, India, workwas completed to develop a microgrid testbed for MEM. Energy sources includingsolar, wind, water, and bio-diesel were established for the Centre for Renewable Energyand Sustainable Technologies. Four small microgrid testbeds were established, andgroundwork was done for eventually powering the entire office on the microgrid withrenewable sources. Several site visits to find candidate locations for future microgridprojects were also conducted.
6.2 Future work
6.2.1 MEM system development
Work continues to improve and expand upon the MEM system. At the time of writing, anac interface, corollary to HEMdc, had been developed and was being tested. Additionalwork is being done to allow one HEM system to monitor and control a mix of ac and dcloads and sources.
Work to make MEM ready for use outside of the laboratory is also being conducted.This includes development of a local user interface and a battery back-up module to runthe hardware independent of the storage system for the loads HEM operates.
Extensive work on MEMcloud is also being conducted. Currently the softwarecapabilities of MEMcloud do not reach the potential of the hardware, but developmentwork underway is quickly rectifying this situation.
Finally, to allow MEM to reach a wider audience, the core team at UW-Madisonis working to partition the software running on HEMapp–core software for operatingthe hardware peripherals and communicating with MEMcloud will be separated fromsoftware handling the decision-making and operations of the system. In this way,MEM system development and research on microgrid control can proceed on separatepathways.
6.2.2 Microgrid at CREST
Next steps at CREST will require completion of HEMac. Once this system is ready, theentirety of the loads at CREST can be moved on to the microgrid, giving the office the

Chapter 6. Conclusions and future work 53
benefit of using reliable and renewable energy, and providing the research groups atUW-Madison and NIE with a real-world test bed for studying microgrids in general, andthe MEM system specifically.
Integration of additional energy sources also needs to be completed. This includesinterfacing with the 10 kW solar system at the NIE library to allow for power sharingwith the CREST microgrid, and installing a change-over switch in CREST to allow forremotely operated selection of back-up sources between grid power and the bio-dieselgenerator.
Additional work developing remote sites is also needed. The challenges of buildinga power system in remote, tribal villages will need to be considered, and a long-termmaintenance plan will be necessary.
To effectively plan and manage these projects, a core group of NIE students withdedicated electrical engineering faculty supervision will likely be required.

54
Appendix A
HEMdc Interface schematics
The HEMdc schematics and PCB layout were prepared in Altium Designer version17.0.11 (Build 656). The source files are available on Gitlab at: https://gitlab.com/microgridenergymanager/HEM_DC_Interface. The repository includes the necessaryfiles to build and populate the board, as well as instructions for constructing the cablerequired to interface with HEMcore.
Full schematics begin on the following page.

1
1
2
2
3
3
4
4
D D
C C
B B
A A
Title
Number RevisionSize
A
Date: 5/15/17 Sheet ofFile: C:\Users\..\HEM_DC_Interface.SchDoc Drawn By:
Main
Lee Shaver1 9
I2C_SCL_IN
I2C_SDA_IN
GND_IN
5V_IN
Core_headercore_header.SchDoc
R_OFF[8..1]
R_ON[8..1]
MUX_SCL
MUX_SDA
GPIO_muxGPIO_mux.SchDoc
I2C_SCL_REMOTE
I2C_SDA_REMOTE
I2C_SCL_LOCAL
I2C_SDA_LOCAL
3.3V_IN
GND_IN
I2C_bufferI2C_buffer.SchDoc
MUX_SDA
MUX_SCL
SDA_METER[8..1]
SCL_METER[8..1]
I2C_muxI2C_mux.SchDoc
V_SRC[8..1]
V_LOAD[8..1]
main_IOmain_IO.SchDoc
REPEAT(V_IN)
REPEAT(METER_SDA)
REPEAT(METER_SCL)
REPEAT(VOUT)
REPEAT(MT,1,8)meter.SchDoc
REPEAT(REL_OFF)
REPEAT(REL_ON) REPEAT(VOUT)
REPEAT(VIN)
REPEAT(RL,1,8)relay.SchDoc
SCL_M_BUS[8..1]
SDA_M_BUS[8..1]
R_OFF_BUS[8..1]
R_ON_BUS[8..1]
SCL_M_BUS
SDA_M_BUS
R_OFF_BUS
R_ON_BUS
V_SRC_BUS
V_INT_BUS
V_INT_BUS
V_LOAD_BUS
V_IN
T_BU
S[8..1]
V_LOAD_BUS[8..1]
V_SRC_BUS[8..1]
5V_IN
GND_IN
3.3V_I2C
Power_supplypower_supply.SchDoc
NLR0OFF0BUS080010 NLR0OFF0BUS NLR0OFF0BUS080010 NLR0OFF0BUS NLR0OFF0BUS080010 NLR0OFF0BUS NLR0OFF0BUS080010 NLR0OFF0BUS NLR0OFF0BUS080010 NLR0OFF0BUS NLR0OFF0BUS080010 NLR0OFF0BUS NLR0OFF0BUS080010 NLR0OFF0BUS NLR0OFF0BUS080010 NLR0OFF0BUS
NLR0ON0BUS080010 NLR0ON0BUS NLR0ON0BUS080010 NLR0ON0BUS NLR0ON0BUS080010 NLR0ON0BUS NLR0ON0BUS080010 NLR0ON0BUS NLR0ON0BUS080010 NLR0ON0BUS NLR0ON0BUS080010 NLR0ON0BUS NLR0ON0BUS080010 NLR0ON0BUS NLR0ON0BUS080010 NLR0ON0BUS
NLSCL0M0BUS080010 NLSCL0M0BUS NLSCL0M0BUS080010 NLSCL0M0BUS NLSCL0M0BUS080010 NLSCL0M0BUS NLSCL0M0BUS080010 NLSCL0M0BUS NLSCL0M0BUS080010 NLSCL0M0BUS NLSCL0M0BUS080010 NLSCL0M0BUS NLSCL0M0BUS080010 NLSCL0M0BUS NLSCL0M0BUS080010 NLSCL0M0BUS
NLSDA0M0BUS080010 NLSDA0M0BUS NLSDA0M0BUS080010 NLSDA0M0BUS NLSDA0M0BUS080010 NLSDA0M0BUS NLSDA0M0BUS080010 NLSDA0M0BUS NLSDA0M0BUS080010 NLSDA0M0BUS NLSDA0M0BUS080010 NLSDA0M0BUS NLSDA0M0BUS080010 NLSDA0M0BUS NLSDA0M0BUS080010 NLSDA0M0BUS
NLV0INT0BUS080010 NLV0INT0BUS
NLV0INT0BUS080010 NLV0INT0BUS
NLV0INT0BUS080010 NLV0INT0BUS
NLV0INT0BUS080010 NLV0INT0BUS
NLV0INT0BUS080010 NLV0INT0BUS
NLV0INT0BUS080010 NLV0INT0BUS
NLV0INT0BUS080010 NLV0INT0BUS
NLV0INT0BUS080010 NLV0INT0BUS
NLV0LOAD0BUS080010 NLV0LOAD0BUS NLV0LOAD0BUS080010 NLV0LOAD0BUS NLV0LOAD0BUS080010 NLV0LOAD0BUS NLV0LOAD0BUS080010 NLV0LOAD0BUS NLV0LOAD0BUS080010 NLV0LOAD0BUS NLV0LOAD0BUS080010 NLV0LOAD0BUS NLV0LOAD0BUS080010 NLV0LOAD0BUS NLV0LOAD0BUS080010 NLV0LOAD0BUS
NLV0SRC0BUS080010 NLV0SRC0BUS NLV0SRC0BUS080010 NLV0SRC0BUS NLV0SRC0BUS080010 NLV0SRC0BUS NLV0SRC0BUS080010 NLV0SRC0BUS NLV0SRC0BUS080010 NLV0SRC0BUS NLV0SRC0BUS080010 NLV0SRC0BUS NLV0SRC0BUS080010 NLV0SRC0BUS NLV0SRC0BUS080010 NLV0SRC0BUS

1
1
2
2
3
3
4
4
D D
C C
B B
A A
Title
Number RevisionSize
A
Date: 5/15/17 Sheet ofFile: C:\Users\..\main_IO.SchDoc Drawn By:
A98492-ND
1
2
3
4
5
6
7
8
9
10
11
12
13
14
15
16
J2
Header 16A98492-ND
1
2
3
4
5
6
7
8
9
10
11
12
13
14
15
16
J1
Header 16
V_SRC[8..1]
V_LOAD[8..1]
Power, load, and communication interfaces
Lee Shaver2 9
V_LOAD[8..1]
V_SRC[8..1]
1 2
F1
Fuse holder
1 2
F2
Fuse holder
1 2
F3
Fuse holder
1 2
F4
Fuse holder
1 2
F8
Fuse holder
1 2
F7
Fuse holder
1 2
F6
Fuse holder
1 2
F5
Fuse holder
GND GND
V_SRC1
V_SRC2
V_SRC3
V_SRC4
V_SRC8
V_SRC7
V_SRC6
V_SRC5
V_LOAD1
V_LOAD2
V_LOAD3
V_LOAD4
V_LOAD8
V_LOAD7
V_LOAD6
V_LOAD5
i10A
i10A
i10A
i10A
i10A
i10A
i10A
i10A
PIF101 PIF102
COF1
PIF201 PIF202
COF2
PIF301 PIF302
COF3
PIF401 PIF402
COF4
PIF501 PIF502
COF5
PIF601 PIF602
COF6
PIF701 PIF702
COF7
PIF801 PIF802
COF8
PIJ101
PIJ102
PIJ103
PIJ104
PIJ105
PIJ106
PIJ107
PIJ108
PIJ109
PIJ1010
PIJ1011
PIJ1012
PIJ1013
PIJ1014
PIJ1015
PIJ1016
COJ1
PIJ201
PIJ202
PIJ203
PIJ204
PIJ205
PIJ206
PIJ207
PIJ208
PIJ209
PIJ2010
PIJ2011
PIJ2012
PIJ2013
PIJ2014
PIJ2015
PIJ2016
COJ2
PIJ102
PIJ104
PIJ106
PIJ108
PIJ1010
PIJ1012
PIJ1014
PIJ1016 PIJ201
PIJ203
PIJ205
PIJ207
PIJ209
PIJ2011
PIJ2013
PIJ2015
PIF101 PIJ103
PIF201 PIJ107
PIF301 PIJ1011
PIF401 PIJ1015 PIF502 PIJ202
PIF602 PIJ206
PIF702 PIJ2010
PIF802 PIJ2014 PIF102
NLV0LOAD080010
NLV0LOAD1
POV0LOAD080010
PIF202
NLV0LOAD080010
NLV0LOAD2
POV0LOAD080010
PIF302
NLV0LOAD080010
NLV0LOAD3
POV0LOAD080010
PIF402
NLV0LOAD080010
NLV0LOAD4
POV0LOAD080010
PIF501
NLV0LOAD080010
NLV0LOAD5
POV0LOAD080010
PIF601
NLV0LOAD080010
NLV0LOAD6
POV0LOAD080010
PIF701
NLV0LOAD080010
NLV0LOAD7
POV0LOAD080010
PIF801
NLV0LOAD080010
NLV0LOAD8
POV0LOAD080010
PIJ101
NLV0SRC080010
NLV0SRC1
POV0SRC080010
PIJ105
NLV0SRC080010
NLV0SRC2
POV0SRC080010
PIJ109
NLV0SRC080010
NLV0SRC3
POV0SRC080010
PIJ1013
NLV0SRC080010
NLV0SRC4
POV0SRC080010
PIJ204
NLV0SRC080010
NLV0SRC5
POV0SRC080010
PIJ208
NLV0SRC080010
NLV0SRC6
POV0SRC080010
PIJ2012
NLV0SRC080010
NLV0SRC7
POV0SRC080010
PIJ2016
NLV0SRC080010
NLV0SRC8
POV0SRC080010
POV0LOAD1 POV0LOAD2 POV0LOAD3 POV0LOAD4 POV0LOAD5 POV0LOAD6 POV0LOAD7 POV0LOAD8 POV0LOAD080010
POV0SRC1 POV0SRC2 POV0SRC3 POV0SRC4 POV0SRC5 POV0SRC6 POV0SRC7 POV0SRC8 POV0SRC080010

1
1
2
2
3
3
4
4
D D
C C
B B
A A
Title
Number RevisionSize
A
Date: 5/15/17 Sheet ofFile: C:\Users\..\core_header.SchDoc Drawn By:
12345678
J400
Header 8
I2C_SCL_IN
I2C_SDA_IN
GND_IN
5V_IN
HEM Core interface header
Lee Shaver3 9
CORE_SCL
CORE_SDA
CORE_GND
CORE_5V
PIJ40001
PIJ40002
PIJ40003
PIJ40004
PIJ40005
PIJ40006
PIJ40007
PIJ40008
COJ400
PIJ40006
PIJ40008 NLCORE05V PO5V0IN
PIJ40001
PIJ40003
PIJ40005
PIJ40007
NLCORE0GND POGND0IN
PIJ40004 NLCORE0SCL
POI2C0SCL0IN
PIJ40002 NLCORE0SDA POI2C0SDA0IN
PO5V0IN
POGND0IN
POI2C0SCL0IN
POI2C0SDA0IN

1
1
2
2
3
3
4
4
D D
C C
B B
A A
Title
Number RevisionSize
A
Date: 5/15/17 Sheet ofFile: C:\Users\..\power_supply.SchDoc Drawn By:
Polarity Protection
MEF1S0503SPC
+Vin1
-Vin2
+Vout 6
-Vout 4
U602
DC/DC CONVERTER 3.3V 1W
5V_IN
GND_IN
3.3V_I2C
C6010.1µF
C60210µF
Q601
IRLML6402PBF
C6030.47µF
VOUT 3
GN
D2
VIN1U601LM3940_3.3V_1A_LDO
C6050.1µF
VCC
GND
1 2
J601
12
P601
1 2
J602
1 2
J603
12
P602
RED (631nm)
12
D601
R601330
DC Power Supply
Lee Shaver4 9
C60433µF
GND_IN
5V_1 3.3V_I2C_1 3.3V_I2C
VCC_1
5V_2 5V_3
C6060.1µF
5V power input Regulated, un-isolated output
Regulated, isolated output
PIC60101
PIC60102 COC601
PIC60201
PIC60202 COC602
PIC60301
PIC60302 COC603
PIC60401
PIC60402 COC604
PIC60501
PIC60502 COC605
PIC60601
PIC60602 COC606
PID60101
PID60102 COD601
PIJ60101 PIJ60102
COJ601
PIJ60201 PIJ60202
COJ602
PIJ60301 PIJ60302
COJ603
PIP60101 PIP60102
COP601
PIP60201 PIP60202
COP602
PIQ60101
PIQ60102
PIQ60103 COQ601
PIR60101
PIR60102
COR601
PIU60101
PIU60102
PIU60103
COU601
PIU60201
PIU60202 PIU60204
PIU60206
COU602
PIJ60202 NL303V0I2C PO303V0I2C PIC60401 PIC60501 PIJ60201
PIU60103 NL303V0I2C01 PIJ60101 NL5V01 PO5V0IN PIC60101 PIC60201
PID60102
PIJ60102 PIQ60101
PIU60201
NL5V02
PIC60301 PIQ60103 PIU60101
NL5V03
PIC60602
PIP60201 PIP60202
PIU60204
PIC60102 PIC60202 PIC60302 PIC60402 PIC60502
PIP60101 PIP60102
PIQ60102
PIR60102
PIU60102
PIU60202
NLGND0IN POGND0IN
PID60101 PIR60101
PIJ60302 PIC60601
PIJ60301 PIU60206
NLVCC01
PO303V0I2C PO5V0IN
POGND0IN

1
1
2
2
3
3
4
4
D D
C C
B B
A A
Title
Number RevisionSize
A
Date: 5/15/17 Sheet ofFile: C:\Users\..\I2C_buffer.SchDoc Drawn By:
C102
0.1µF
C101
0.1µF
I2C
_SC
L_R
EMO
TE
I2C
_SD
A_R
EMO
TE
I2C
_SC
L_LO
CA
L
I2C
_SD
A_L
OC
AL
I2C booster and isolation
Lee Shaver5 9
R103180
R104180
A/I 2
NC 1
Y/O4
GND
3
VCC
5D101
74LVC1G07
A/I 2
NC 1
Y/O4
GND
3
VCC
5D102
74LVC1G07
VCC
8
Sy7 Ry 6
Ty 5
Sx1
Rx 2
Tx 3
GND
4
U100
P82B96D
HCPL-060L-000E
NC1
AN2
CA3
NC4
VCC 8
VE 7
V0 6
GND 5
U101 Optoisolator
NC 1
AN 2
CA 3
NC 4
VCC8
VE7
V06
GND5U102
Optoisolator
NC1
AN2
CA3
NC4
VCC 8
VE 7
V0 6
GND 5
U103
Optoisolator
3.3V_IN
3.3V_IN
NC 1
AN 2
CA 3
NC 4
VCC8
VE7
V06
GND5U104
Optoisolator
3.3V_IN
VCC
VCC
GND
GND
GND
GND
VCC
VCC
3.3V_IN
GND_IN GND_IN
GND_IN
GND_IN
12
P102
Header 2
R109390
R110390
R101180
R102180
R1074.7k
R1084.7k
R1064.7k
R1054.7k
12
P101Header 2
See references for P82B96D - "Optoisolation" - Fig. 6
I2C
_SC
L_LO
CA
L
I2C
_SD
A_L
OC
AL
I2C
_SD
A_R
EMO
TE
I2C
_SC
L_R
EMO
TE
PIC10101
PIC10102 COC101
PIC10201
PIC10202 COC102
PID10101
PID10102
PID10103
PID10104
PID10105 COD101
PID10201
PID10202
PID10203
PID10204
PID10205 COD102
PIP10101 PIP10102
COP101
PIP10201
PIP10202
COP102
PIR10101
PIR10102
COR101 PIR10201
PIR10202
COR102 PIR10301
PIR10302
COR103 PIR10401
PIR10402
COR104 PIR10501
PIR10502
COR105 PIR10601
PIR10602
COR106
PIR10701
PIR10702
COR107 PIR10801
PIR10802
COR108 PIR10901
PIR10902
COR109 PIR11001
PIR11002
COR110
PIU10001
PIU10002
PIU10003
PIU10004 PIU10005
PIU10006 PIU10007
PIU10008 COU100
PIU10101
PIU10102
PIU10103
PIU10104 PIU10105
PIU10106
PIU10107
PIU10108
COU101
PIU10201
PIU10202
PIU10203
PIU10204 PIU10205
PIU10206
PIU10207
PIU10208
COU102
PIU10301
PIU10302
PIU10303
PIU10304 PIU10305
PIU10306
PIU10307
PIU10308
COU103
PIU10401
PIU10402
PIU10403
PIU10404 PIU10405
PIU10406
PIU10407
PIU10408
COU104
PIC10202
PIR10101 PIR10201
PIR10701 PIR10801 PIR10901 PIR11001
PIU10008 PIU10207
PIU10208
PIU10407
PIU10408 NL303V0IN
PO303V0IN
PIC10101
PID10103
PID10203
PIU10105
PIU10305
PIC10201
PIU10004
PIU10205
PIU10405 NLGND0IN
POGND0IN
PID10202
PIP10202
PIR10502
PIU10306
NLI2C0SCL0LOCAL
POI2C0SCL0LOCAL
PIP10101
PIR10702
PIU10007
NLI2C0SCL0REMOTE POI2C0SCL0REMOTE
PID10102
PIP10201
PIR10602
PIU10106
NLI2C0SDA0LOCAL
POI2C0SDA0LOCAL
PIP10102
PIR10802
PIU10001
NLI2C0SDA0REMOTE POI2C0SDA0REMOTE
PID10101
PID10104 PIU10203
PID10201
PID10204 PIU10403
PIR10102 PIU10102
PIR10202
PIU10302
PIR10302
PIU10202
PIR10402
PIU10402
PIR10902 PIU10002
PIU10206
PIR11002
PIU10006
PIU10406
PIU10003
PIU10103
PIU10005
PIU10303
PIU10101
PIU10104
PIU10201
PIU10204
PIU10301
PIU10304
PIU10401
PIU10404
PIC10102
PID10105
PID10205
PIR10301 PIR10401 PIR10501 PIR10601
PIU10107
PIU10108
PIU10307
PIU10308 NLVCC
PO303V0IN
POGND0IN
POI2C0SCL0LOCAL
POI2C0SCL0REMOTE
POI2C0SDA0LOCAL
POI2C0SDA0REMOTE

1
1
2
2
3
3
4
4
D D
C C
B B
A A
Title
Number RevisionSize
A
Date: 5/15/17 Sheet ofFile: C:\Users\..\I2C_mux.SchDoc Drawn By:
C201
0.1µF
R202
1k
R20110k
GND
MBT2222Q201
RESET_I2C
I2C MUX
I2C MUX Reset
R20310k
GND
I2C multiplexer
Lee Shaver6 9
PCA9548ADWR
VCC 24
SDA 23
SCL 22
A221
SC7 20SD719
SC6 18SD617
SC5 16SD515
SC4 14SD413
GND 12
SC3 11SD310
SC2 9SD28
SC1 7SD16
SC0 5SD04
RESET3
A12
A01
U200
I2C MUX
MUX_SDA
MUX_SCL
VCC
GND
SDA_M1
SDA_M2
SDA_M3
SDA_M4
SDA_M5
SDA_M6
SDA_M7
SDA_M8
SCL_M1
SCL_M2
SCL_M3
SCL_M4
SCL_M5
SCL_M6
SCL_M7
SCL_M8
SDA_METER[8..1]
SCL_METER[8..1]
SDA_M[8..1]
RESET_CTRL
VCC
SCL_M[8..1]
R201
10k
VCC
1234
A202
Header 2X2
1234
A200
Header 2X2
1234
A201
Header 2X2
GNDVCC
GNDVCC
GNDVCC
PIA20001 PIA20002
PIA20003 PIA20004
COA200
PIA20101 PIA20102
PIA20103 PIA20104
COA201
PIA20201 PIA20202
PIA20203 PIA20204
COA202
PIC20101 PIC20102
COC201
PIR20101 PIR20102
COR201
PIU20001
PIU20002
PIU20003
PIU20004 PIU20005
PIU20006 PIU20007
PIU20008 PIU20009
PIU200010 PIU200011
PIU200012
PIU200013 PIU200014
PIU200015 PIU200016
PIU200017 PIU200018
PIU200019 PIU200020
PIU200021
PIU200022
PIU200023
PIU200024
COU200
PIA20004
PIA20104
PIA20204 PIC20102
PIU200012
PIA20001
PIA20003
PIU20001
PIA20101
PIA20103
PIU20002
PIA20201
PIA20203
PIU200021
PIR20101 PIU20003 PIU200022 POMUX0SCL
PIU200023 POMUX0SDA
PIA20002
PIA20102
PIA20202
PIC20101
PIR20102
PIU200024
PIU20005
NLSCL0M080010
NLSCL0M1
POSCL0METER080010
PIU20007
NLSCL0M080010
NLSCL0M2
POSCL0METER080010
PIU20009
NLSCL0M080010
NLSCL0M3
POSCL0METER080010
PIU200011
NLSCL0M080010
NLSCL0M4
POSCL0METER080010
PIU200014
NLSCL0M080010
NLSCL0M5
POSCL0METER080010
PIU200016
NLSCL0M080010
NLSCL0M6
POSCL0METER080010
PIU200018
NLSCL0M080010
NLSCL0M7
POSCL0METER080010
PIU200020
NLSCL0M080010
NLSCL0M8
POSCL0METER080010
PIU20004
NLSDA0M080010
NLSDA0M1
POSDA0METER080010
PIU20006
NLSDA0M080010
NLSDA0M2
POSDA0METER080010
PIU20008
NLSDA0M080010
NLSDA0M3
POSDA0METER080010
PIU200010
NLSDA0M080010
NLSDA0M4
POSDA0METER080010
PIU200013
NLSDA0M080010
NLSDA0M5
POSDA0METER080010
PIU200015
NLSDA0M080010
NLSDA0M6
POSDA0METER080010
PIU200017
NLSDA0M080010
NLSDA0M7
POSDA0METER080010
PIU200019
NLSDA0M080010
NLSDA0M8
POSDA0METER080010
POMUX0SCL
POMUX0SDA
POSCL0METER1 POSCL0METER2 POSCL0METER3 POSCL0METER4 POSCL0METER5 POSCL0METER6 POSCL0METER7 POSCL0METER8 POSCL0METER080010
POSDA0METER1 POSDA0METER2 POSDA0METER3 POSDA0METER4 POSDA0METER5 POSDA0METER6 POSDA0METER7 POSDA0METER8 POSDA0METER080010

1
1
2
2
3
3
4
4
D D
C C
B B
A A
Title
Number RevisionSize
A
Date: 5/15/17 Sheet ofFile: C:\Users\..\GPIO_mux.SchDoc Drawn By:
GND1 23 4
A302
Header 2X2
1 23 4
A300
Header 2X2
1 23 4
A301
Header 2X2
C3010.1µF
R302
1k
R30110k
GND
RESET_GPIO
MBT2222Q301
GPIO Expander Relays
GPIO Expander Relays Reset
R30310k
GND
R_OFF[8..1]
R_ON[8..1]
R_ON8
R_ON7
R_ON6
R_ON5
R_ON4
R_ON3
R_ON2
R_ON1
R_OFF8
R_OFF7
R_OFF6
R_OFF5
R_OFF4
R_OFF3
R_OFF2
RESET_CTRL
MUX_SCL
MUX_SDA
R_OFF1
MCP23017T-E/SO
GPBO 1GPB12
GPB2 3GPB34
GPB4 5GPB56
GPB6 7GPB78
VDD9
VSS10
NC11
SCL12
SDA13
NC14 A0 15
A1 16
A2 17
RESET 18
INTB 19
INTA 20
GPA0 21GPA122
GPA2 23GPA324
GPA4 25GPA526
GPA6 27GPA728
U300
IC I/O Exapnder I2C
VCC
VCC
GPIO multiplexer
Lee Shaver7 9
R_OFF[8..1]
R_ON[8..1]
GNDVCC
GNDVCC
GNDVCCR301
10k
VCC
PIA30001 PIA30002
PIA30003 PIA30004
COA300
PIA30101 PIA30102
PIA30103 PIA30104
COA301
PIA30201 PIA30202
PIA30203 PIA30204
COA302
PIC30101
PIC30102 COC301
PIR30101 PIR30102
COR301
PIU30001 PIU30002
PIU30003 PIU30004
PIU30005 PIU30006
PIU30007 PIU30008
PIU30009
PIU300010
PIU300011
PIU300012
PIU300013
PIU300014 PIU300015
PIU300016
PIU300017
PIU300018
PIU300019
PIU300020
PIU300021 PIU300022
PIU300023 PIU300024
PIU300025 PIU300026
PIU300027 PIU300028
COU300
PIA30004
PIA30104
PIA30204 PIC30101
PIU300010
PIA30001
PIA30003
PIU300015
PIA30101
PIA30103
PIU300016
PIA30201
PIA30203
PIU300017
PIR30101 PIU300018 PIU300011
PIU300012 POMUX0SCL
PIU300013 POMUX0SDA
PIU300014
PIU300019
PIU300020
PIA30002
PIA30102
PIA30202
PIC30102
PIR30102
PIU30009
PIU300022
NLR0OFF080010
NLR0OFF1
POR0OFF080010
PIU300024
NLR0OFF080010
NLR0OFF2
POR0OFF080010
PIU300026
NLR0OFF080010
NLR0OFF3
POR0OFF080010
PIU300028
NLR0OFF080010
NLR0OFF4
POR0OFF080010
PIU30002
NLR0OFF080010
NLR0OFF5
POR0OFF080010
PIU30004
NLR0OFF080010
NLR0OFF6
POR0OFF080010
PIU30006
NLR0OFF080010
NLR0OFF7
POR0OFF080010
PIU30008
NLR0OFF080010
NLR0OFF8
POR0OFF080010
PIU300021
NLR0ON080010
NLR0ON1
POR0ON080010
PIU300023
NLR0ON080010
NLR0ON2
POR0ON080010
PIU300025
NLR0ON080010
NLR0ON3
POR0ON080010
PIU300027
NLR0ON080010
NLR0ON4
POR0ON080010
PIU30001
NLR0ON080010
NLR0ON5
POR0ON080010
PIU30003
NLR0ON080010
NLR0ON6
POR0ON080010
PIU30005
NLR0ON080010
NLR0ON7
POR0ON080010
PIU30007
NLR0ON080010
NLR0ON8
POR0ON080010
POMUX0SCL
POMUX0SDA
POR0OFF1 POR0OFF2 POR0OFF3 POR0OFF4 POR0OFF5 POR0OFF6 POR0OFF7 POR0OFF8 POR0OFF080010
POR0ON1 POR0ON2 POR0ON3 POR0ON4 POR0ON5 POR0ON6 POR0ON7 POR0ON8 POR0ON080010

1
1
2
2
3
3
4
4
D D
C C
B B
A A
Title
Number RevisionSize
A
Date: 5/15/17 Sheet ofFile: C:\Users\..\meter.SchDoc Drawn By:
DC meter
Lee Shaver8 9
C2 0.1µF
R7
0.0
R2
1k
1 23 45 6
A0
Header 3X2
1 23 45 6
A1
Header 3X2GND GND
GND
LTC2946IMS#PBF
SENSE+ 16
SENSE- 15
ADR1 14
ADIN 13
ADR0 12
GND 11
CLKOUT 10
CLKIN 9SCL8 SDAI7 SDAO6 GPIO35 GPIO24 GPIO13 INTVCC2 VDD1U1
DC ENERGY METER
ABLS-4.000MHZ-B2-T
1 2X1
Crystal C336pF
C436pF
INTVCC INTVCC
C1
0.1µF
GND
GNDGND
GND
R54.7k
R64.7k
RED (631nm)
12
D1
V_IN
METER_SDA
METER_SCL
VCC
R4
100k
R3
3.3k
VCC
GNDGND
VOUT
INTVCC
1 2R1
Current Sense 0.02
V_IN VOUT
PIA001 PIA002
PIA003 PIA004
PIA005 PIA006
COA0 PIA101 PIA102
PIA103 PIA104
PIA105 PIA106
COA1
PIC101 PIC102
COC1
PIC201
PIC202
COC2
PIC301
PIC302 COC3
PIC401
PIC402 COC4
PID101 PID102
COD1
PIR101 PIR102
COR1
PIR201 PIR202
COR2
PIR301 PIR302
COR3
PIR401 PIR402
COR4
PIR501
PIR502
COR5 PIR601
PIR602
COR6
PIR701 PIR702
COR7
PIU101
PIU102
PIU103
PIU104
PIU105
PIU106
PIU107
PIU108 PIU109
PIU1010
PIU1011
PIU1012
PIU1013
PIU1014
PIU1015
PIU1016
COU1
PIX101 PIX102
COX1
PIA006 PIA106
PIC102
PIC202
PIC302 PIC402
PIU104
PIU105
PIU1011
PIU1013
PIA002 PIA102
PIC101
PIU102
NLINTVCC PIA001
PIA003
PIA005
PIU1012
PIA004
PIA101
PIA103
PIA105
PIU1014
PIA104
PIC201
PIR202
PIU101
PIC301
PIU109
PIX101
PIC401
PIU1010
PIX102
PID101
PIR402
PIU103 PID102 PIR302
PIR502
PIU108
POMETER0SCL
PIR602 PIR701
PIU106
POMETER0SDA PIR702
PIU107
PIR101
PIR201
PIU1016
NLV0IN POV0IN
PIR301
PIR401
PIR501 PIR601
PIR102
PIU1015
NLVOUT POVOUT
POMETER0SCL
POMETER0SDA
POV0IN POVOUT

1
1
2
2
3
3
4
4
D D
C C
B B
A A
Title
Number RevisionSize
A
Date: 5/15/17 Sheet ofFile: C:\Users\..\relay.SchDoc Drawn By:
DK1A-L2-3V-F
NEG 1
VS 3
VOUT 4
SET6
RST5
REL
D3
1N4148
D2
1N4148
R10 0.0
R12 0.0BSS138BKS,115
D1 6G25 S24
S11
G12 D2 3
Q1
R9 100
R11 100R13100k R14
100k
GND GND
GND
C5
1µF
C60.1µF
GND
REL_OFF
REL_ON
VOUTVOUT
VCC
VIN
Relay
Lee Shaver9 9
VIN
PIC501 PIC502
COC5
PIC601
PIC602
COC6
PID20A PID20K
COD2
PID30A PID30K
COD3
PIQ101 PIQ102 PIQ103
PIQ104 PIQ105 PIQ106
COQ1
PIR901 PIR902
COR9
PIR1001 PIR1002
COR10
PIR1101 PIR1102
COR11
PIR1201 PIR1202
COR12
PIR1301
PIR1302 COR13
PIR1401
PIR1402 COR14
PIREL01
PIREL03
PIREL04
PIREL05
PIREL06
COREL
PIC501
PIC602
PIQ101 PIQ104
PIR1302 PIR1402
PID20A
PIR1202 PIREL05
PID30A
PIR1002 PIREL06
PIQ102 PIR1102 PIQ103 PIR1201
PIQ105 PIR902 PIQ106 PIR1001 PIR901
PIR1301 POREL0ON
PIR1101
PIR1401 POREL0OFF
PIC502
PID20K
PID30K
PIREL01
PIREL03 NLVIN
POVIN
PIC601 PIREL04
NLVOUT POVOUT
POREL0OFF
POREL0ON
POVIN
POVOUT

64
Appendix B
Code reference for HEMdcexperiments
This appendix provides a reference for the code used to run the experiments in chapter 4.The most recent version of HEMapp includes the function dcGetStateofCharge()
for monitoring battery SOC. The code is maintained in the HEMapp repository, avail-able at https://gitlab.com/microgridenergymanager/hemapp (permission to accessthe project should be requested from the current master developer). This repository isactively maintained and updated as new features and bugfixes are implemented.
B.1 Individual battery management
The batteryMonitor() thread of the main.c file of HEMapp was used to implement theindividual battery management experiment as described in this report. Shortly after theexperiment was concluded, the functionality was moved from the HEMapp C code intoa Python script, which was also used for the collective battery management experiments.Python scripting is discussed in appendix B.3.
For reference, a snippet of the C code is provided below, showing a simple methodfor implementing load prioritization:
if( presentSOC <= 75 )
{
if( presentSOC <= 50 )
{
if( getNodeRelayStatus (0) == 1 )
{
relayActuate(RELAY0_OFF))
setNodeRelayStatus (0,0);
}
}
else if( presentSOC <= 25 )
{
if( getNodeRelayStatus (2) == 1 )

Appendix B. Code reference for HEMdc experiments 65
{
relayActuate(RELAY2_OFF))
setNodeRelayStatus (2,0);
}
}
else if ( getNodeRelayStatus (1) == 1 )
{
relayActuate(RELAY1_OFF))
setNodeRelayStatus (1,0);
}
}
In this example, the priority of the three nodes (0, 1, and 2) is known ahead of time, aswell as the priority thresholds. Improvements to the code would generalize these valuesso that users and/or MEMcloud could change the values on-the-fly.
B.2 Collective battery management
The collective battery management experiment was implemented using Python scripting.As of this writing, the most current version of HEMapp includes the necessary functionsto run and communicate with a running Python script, as described in appendix B.3.
The Python script used for the experiment is available at https://gitlab.com/
lshaver/thesis/blob/export_test/scripts/export.py. A snippet of the code is pro-vided below to illustrate the functionality:
def prioritize():
while True:
if ( SOC <= 10 ):
# Turn off the high priority load
toggleRelay( relayHigh, 'off' )
elif ( SOC <= 40 ):
# Turn off the medium priority load
toggleRelay( relayMed, 'off' )
elif ( SOC <= 50 ):
if importing is False:
# Request power import
sendToServer(exportCommand)
importing = True
# Turn on the relay which will allow input power
toggleRelay( relayLink, 'on' )
elif ( SOC <= 60 ):

Appendix B. Code reference for HEMdc experiments 66
if exporting is True:
# Turn off the relay which would allow output power
toggleRelay( relayLink, 'off' )
exporting = False
elif ( SOC <= 70 ):
# Turn off the low piority load
toggleRelay( relayLow, 'off' )
time.sleep(5)
In this example, thresholds are known ahead of time, while load priorities (relayHigh,for example) are set by a simple header file. Future improvements will allow users and/orMEMcloud to set these values on-the-fly.
B.3 Python scripting
On any HEMcore or HEMdc system running up-to-date HEMapp code, a Python scriptcan easily be implemented; only a few lines of code are necessary to create the linksbetween HEMapp and the Python script:
import socket
SERVER_ADDRESS = 8888
sock = socket.socket(socket.AF_INET, socket.SOCK_DGRAM)
server_address = ('localhost', SERVER_ADDRESS)
Then, the following lines can be used to send or receive some data from HEMapp:
# Sending
sent = sock.sendto(data, server_address)
# Receiving
data, server = sock.recvfrom(4096)
As this functionality is developed further, additional examples will be made availablein the main HEMapp repository on Gitlab.

67
Appendix C
CREST office and microgrid testbedwiring
Figure C.1 provides a simplified one-line diagram of the CREST office, showing the typeand rating of loads used.
220 Vac
UPSUPS
4x45 W
7x80 W
4x100 W
1x600 W
2x45 W
4x80 W
6x9 W
6x23 W
FIGURE C.1: A simplified one-line diagram of CREST office loads
Figure C.2 gives the CREST floor-plan and a basic electrical layout. Different colorsare used to indicate the different circuits in the office:
Red: Lights and fans, connected to mains power only.
Yellow: Main UPS circuit, which feeds the projector, two sub-circuits (green and blue),and outlets on the north wall.

Appendix C. CREST office and microgrid testbed wiring 68
Green: UPS sub-circuit powering lights along the west wall.
Blue: UPS sub-circuit supplying lights and outlets along the east wall.
Purple: DC lighting circuit. The lights are fixed in the ceiling along the north wall. Inputpower from this circuit comes from the microgrid testbeds.
Switch and outlet banks refer to grouped switches and/or outlets permanentlyinstalled in the walls. Some of these also serve as junction boxes for other circuits:notably the easternmost outlet on the north wall, where the main UPS circuit (yellow)branches into the green and blue sub-circuits. Depending on requirements for rewiringthe office, these junction boxes could be used to additionally sub-divide circuits.
The remaining figures in this chapter (figs. C.3 to C.6) as-built schematics of the fourmicrogrid testbeds at CREST.

Appendix C. CREST office and microgrid testbed wiring 69
Switch bank
Outlet/switch bank
Outlet bank
Light
Ceiling fan
Projector
UPS inverter
Mains input
DC light
TESTBEDS
MICROGRID ENERGY SOURCES (SOLAR, WIND, HYDRO, BIO-DIESEL) ENTER HERE
NETWORKINTERFACE
NORTH
SOUTH
EAST
WES
T
FIGURE C.2: Electrical layout of CREST

Appendix C. CREST office and microgrid testbed wiring 70
SOLAR PV2×35 + 2×75 W
BATTERY210 Ah
BATTERY210 Ah
INVERTER1100 VA
STREET LIGHTS150 W
AC BACKUPGENSET or MAINS 12 VDC line
230 VAC line
12 VDC line
230 VAC line
FIGURE C.3: Schematic of "red" microgrid testbed
SOLAR PV7×43 W
BATTERY100 Ah
BATTERY100 Ah
HEM
WIND TURBINE400 W
WIND TURBINE400 W
HYDROHYDRO
RECTIFIER
INVERTER200 VA
MPPT CHARGER80V to 12V
CHARGER
DEMO LIGHTS15 W
INVERTER700 VA
AC BACKUPGENSET or MAINS
12 VDC line
230 VAC line
12 VDC line
230 VAC line
FIGURE C.4: Schematic of "green" microgrid testbed

Appendix C. CREST office and microgrid testbed wiring 71
SOLAR PV2×150 W
HEM
MPPT CHARGER80V to 12V
INVERTER700 VA
OFFICE LIGHTS50 W
OFFICE LIGHTS100 W
AC BACKUPGENSET or MAINS
BATTERY40 Ah
BATTERY40 Ah
12 VDC line
230 VAC line
12 VDC line
230 VAC line
FIGURE C.5: Schematic of "blue" microgrid testbed
SOLAR PV7×43 W
BATTERY40 Ah
MPPT CHARGER80V to 12V
HEM
INVERTER700 VA
DEMO LIGHTS15 W
OFFICE LIGHTS200 W
AC BACKUPGENSET or MAINS
12 VDC line
230 VAC line
12 VDC line
230 VAC line
FIGURE C.6: Schematic of "yellow" microgrid testbed

72
Bibliography
[1] Earl Morter. Pearl Street Station. In: Wikipedia. 1890. URL: https://en.wikipedia.org/wiki/File:PearlStreetStation.jpg#filelinks.
[2] Ania Monaco. “Edison’s Pearl Street Station Recognized With Milestone”. In: TheInstitute (July 27, 2011). URL: http://theinstitute.ieee.org/tech-history/technology- history/edisons- pearl- street- station- recognized- with-
milestone810.
[3] Richard F. Hirsh. Emergence of Electrical Utilities in America. Sept. 2002. URL: http://americanhistory.si.edu/powering/.
[4] R. W. Lobenstein and C. Sulzberger. “Eyewitness to Dc History”. In: IEEE Powerand Energy Magazine 6.3 (May 2008), pp. 84–90. ISSN: 1540-7977. DOI: 10.1109/MPE.2008.920421.
[5] Institute for Energy Research. History of Electricity. Aug. 29, 2014. URL: http://instituteforenergyresearch.org/history-electricity/.
[6] Union of Concerned Scientists. How the Electricity Grid Works. Feb. 18, 2015. URL:http://www.ucsusa.org/clean-energy/how-electricity-grid-works.
[7] Martin Doppelbauer. A Short History of Electric Motors. Sept. 25, 2014. URL: https://www.eti.kit.edu/english/1376.php.
[8] Stephanie Joyce. When The Largest Machine In The World Fails. May 16, 2015. URL:http://insideenergy.org/2015/05/16/when-the-largest-machine-in-the-
world-fails/.
[9] Sonia Aggarwal. Greasing the Electric Grid, the World’s Largest Machine (Op-Ed). Nov. 24, 2014. URL: http://www.livescience.com/48893- improving-efficiency-on-the-electric-grid.html.
[10] Jean-Baptiste Michel et al. “Quantitative Analysis of Culture Using Millions ofDigitized Books”. In: Science 331.6014 (Jan. 14, 2011), pp. 176–182. ISSN: 0036-8075. DOI: 10.1126/science.1199644. URL: http://science.sciencemag.org.ezproxy.library.wisc.edu/content/331/6014/176.
[11] The Google Books Team. Google Books Ngram Viewer. 2013. URL: https://books.google.com/ngrams.

BIBLIOGRAPHY 73
[12] Energy and Environmental Research Center. Demonstration of Technologies forRemote Power Generation in Alaska. Semi-Annual Report Task 3.14. Energy andEnvironmental Research Center, Aug. 11, 1997. URL: https://www.osti.gov/scitech/servlets/purl/650240.
[13] Chris Marnay, F. Javier Rubio, and Afzal S. Siddiqui. “Shape of the Microgrid”. In:Lawrence Berkeley National Laboratory (Nov. 1, 2000). URL: http://escholarship.org/uc/item/9fw029wb.
[14] D. Herman. “Investigation of the Technical and Economic Feasibility of Micro-Grid-Based Power Systems”. In: Electric Power Research Institute, Palo Alto,CA 2 (2001), pp. 1–1. URL: http : / / assets . fiercemarkets . net / public /smartgridnews/EPRI_Technical_Report_Micro-Grid.pdf.
[15] R. H. Lasseter. “MicroGrids”. In: 2002 IEEE Power Engineering Society WinterMeeting. Conference Proceedings (Cat. No.02CH37309). 2002 IEEE Power EngineeringSociety Winter Meeting. Conference Proceedings (Cat. No.02CH37309). Vol. 1.2002, 305–308 vol.1. DOI: 10.1109/PESW.2002.985003.
[16] R. H. Lasseter and P. Paigi. “Microgrid: A Conceptual Solution”. In: 2004 IEEE 35thAnnual Power Electronics Specialists Conference (IEEE Cat. No.04CH37551). 2004 IEEE35th Annual Power Electronics Specialists Conference (IEEE Cat. No.04CH37551).Vol. 6. June 2004, 4285–4290 Vol.6. DOI: 10.1109/PESC.2004.1354758.
[17] Dan T. Ton and Merrill A. Smith. “The US Department of Energy’s MicrogridInitiative”. In: The Electricity Journal 25.8 (2012), pp. 84–94. URL: http://www.sciencedirect.com/science/article/pii/S1040619012002254.
[18] Krista Eastman. From Micro to Macro, UW–Madison’s Expansion of the Microgrid Idea.Mar. 3, 2017. URL: https://energy.wisc.edu/news/micro-macro-uw-madisons-expansion-microgrid-idea.
[19] Microgrids at Berkeley Lab. About Microgrids. 2017. URL: https://building-microgrid.lbl.gov/about-microgrids.
[20] R. C. Dugan and S. K. Price. “Issues for Distributed Generation in the US”. In:2002 IEEE Power Engineering Society Winter Meeting. Conference Proceedings (Cat.No.02CH37309). 2002 IEEE Power Engineering Society Winter Meeting. Confer-ence Proceedings (Cat. No.02CH37309). Vol. 1. 2002, 121–126 vol.1. DOI: 10.1109/PESW.2002.984969.
[21] R. Brent Alderfer et al. Making Connections: Case Studies of Interconnection Barriersand Their Impact on Distributed Power Projects. Case Study NREL/SR-200-28053.Golden, CO (US): National Renewable Energy Laboratory, July 2000. URL: http://www.osti.gov/scitech/biblio/753767.

BIBLIOGRAPHY 74
[22] EPRI. Development of a Standard Language for Photovoltaic and Storage Integration.Technical Brief 1020435. Palo Alto, CA: Electric Power Research Institute, Dec.2009. URL: http://www.epri.com/abstracts/Pages/ProductAbstract.aspx?ProductId=000000000001020435.
[23] IEEE Standards Board. IEEE Standard for Interconnecting Distributed Resources withElectric Power Systems: 1547-2003. New York: Institute of Electrical and ElectronicsEngineers, 2003. ISBN: 978-0-7381-3720-9.
[24] Berkeley Lab. Examples of Microgrids. 2017. URL: https://building-microgrid.lbl.gov/examples-microgrids.
[25] S. Morozumi. “Micro-Grid Demonstration Projects in Japan”. In: 2007 PowerConversion Conference - Nagoya. 2007 Power Conversion Conference - Nagoya. Apr.2007, pp. 635–642. DOI: 10.1109/PCCON.2007.373032.
[26] N. W. A. Lidula and A. D. Rajapakse. “Microgrids Research: A Review of Ex-perimental Microgrids and Test Systems”. In: Renewable and Sustainable EnergyReviews 15.1 (Jan. 2011), pp. 186–202. ISSN: 1364-0321. DOI: 10.1016/j.rser.2010.09.041. URL: http://www.sciencedirect.com/science/article/pii/S136403211000328X.
[27] Mohammad Shahidehpour and Joseph F. Clair. “A Functional Microgrid forEnhancing Reliability, Sustainability, and Energy Efficiency”. In: The Electric-ity Journal 25.8 (Oct. 2012), pp. 21–28. ISSN: 1040-6190. DOI: 10.1016/j.tej.2012.09.015. URL: http://www.sciencedirect.com/science/article/pii/S1040619012002278.
[28] B. Washom et al. “Ivory Tower of Power: Microgrid Implementation at the Uni-versity of California, San Diego”. In: IEEE Power and Energy Magazine 11.4 (July2013), pp. 28–32. ISSN: 1540-7977. DOI: 10.1109/MPE.2013.2258278.
[29] Kevin B. Jones et al. “The Urban Microgrid: Smart Legal and Regulatory Policiesto Support Electric Grid Resiliency and Climate Mitigation”. In: Fordham Urb. LJ41 (2013), p. 1695. URL: http://heinonline.org/hol-cgi-bin/get_pdf.cgi?handle=hein.journals/frdurb41§ion=49.
[30] Julia Pyper. “Are Microgrids the Answer to City-Disrupting Disasters?” In: Sci-entific American (Sept. 11, 2013). URL: https://www.scientificamerican.com/article/are-microgrids-the-answer-to-city-disrupting-disasters/.
[31] Taha Selim Ustun, Cagil Ozansoy, and Aladin Zayegh. “Recent Developmentsin Microgrids and Example Cases around the World—A Review”. In: Renewableand Sustainable Energy Reviews 15.8 (Oct. 2011), pp. 4030–4041. ISSN: 13640321.DOI: 10.1016/j.rser.2011.07.033. URL: http://linkinghub.elsevier.com/retrieve/pii/S1364032111002735.

BIBLIOGRAPHY 75
[32] Robert Liam Dohn. “The Business Case for Microgrids”. In: White Paper Siemens(2011). URL: http://w3.usa.siemens.com/smartgrid/us/en/microgrid/Documents/The%20business%20case%20for%20microgrids_Siemens%20white%
20paper.pdf.
[33] Giri Venkataramanan and Chris Marnay. “A Larger Role for Microgrids”. In:IEEE Power and Energy Magazine 6.3 (May 2008), pp. 78–82. ISSN: 1540-7977. DOI:10.1109/MPE.2008.918720. URL: http://ieeexplore.ieee.org/lpdocs/epic03/wrapper.htm?arnumber=4505829.
[34] Daniel Schnitzer et al. Microgrids for Rural Electrification: A Critical Review of BestPractices Based on Seven Case Studies. Case Study. United Nations Foundation,Jan. 2014. URL: https://rael.berkeley.edu/wp-content/uploads/2015/04/MicrogridsReportEDS.pdf.
[35] Nathaniel J. Williams et al. “Enabling Private Sector Investment in Microgrid-Based Rural Electrification in Developing Countries: A Review”. In: Renewableand Sustainable Energy Reviews 52 (Dec. 2015), pp. 1268–1281. ISSN: 1364-0321. DOI:10.1016/j.rser.2015.07.153. URL: http://www.sciencedirect.com/science/article/pii/S136403211500800X.
[36] The World Bank. Access to Electricity (% of Population). 2016. URL: http://data.worldbank.org/indicator/EG.ELC.ACCS.ZS.
[37] Vijay Modi et al. Energy Services for the Millenium Development Goals. Study. UNMillenium Project, World Bank, 2005. URL: http://www.unmillenniumproject.org/documents/MP_Energy_Low_Res.pdf.
[38] Sustainable Energy For All. About Us | Sustainable Energy for All (SEforALL). 2016.URL: http://www.se4all.org/about-us.
[39] Sudeshna Ghosh Banerjee et al. Global Tracking Framework 2013. Progress Report.Washington, DC, USA: The World Bank, 2013. URL: http://trackingenergy4all.worldbank.org/~/media/GIAWB/GTF/Documents/GTF-2013-Full-Report.pdf.
[40] F. Fluitman. Socio-Economic Impact of Rural Electrification in Developing Coun-tries: A Review of Evidence. ILO Working Paper 992274003402676. InternationalLabour Organization, 1983. URL: https://ideas.repec.org/p/ilo/ilowps/992274003402676.html.
[41] Energy Sector Management Assistance Program. Rural Electrification and Devel-opment in the Philippines: Measuring the Social and Economic Benefits. Collabora-tive Study 255/03. Washington, DC, USA: World Bank, 2003. URL: http : / /siteresources.worldbank.org/INTPSIA/Resources/490023-1120845825946/
philippines_rural_electrification.pdf.

BIBLIOGRAPHY 76
[42] Independent Evaluation Group. The Welfare Impact of Rural Electrification: A Re-assessment of the Costs and Benefits. Washington, DC, USA: The World Bank, 2008.ISBN: 978-0-8213-7367-5. URL: http://elibrary.worldbank.org/doi/book/10.1596/978-0-8213-7367-5.
[43] Independent Evaluation Group. World Bank Group Support to Electricity Access,FY2000-2014. Evaluation. IEG, 2015. URL: https://ieg.worldbankgroup.org/Data/reports/chapters/Electricity_Access_1.pdf.
[44] Todd Levin and Valerie M. Thomas. “Least-Cost Network Evaluation of Cen-tralized and Decentralized Contributions to Global Electrification”. In: EnergyPolicy. Modeling Transport (Energy) Demand and Policies 41 (Feb. 2012), pp. 286–302. ISSN: 0301-4215. DOI: 10.1016/j.enpol.2011.10.048. URL: http://www.sciencedirect.com/science/article/pii/S0301421511008639.
[45] Todd Levin and Valerie M. Thomas. “Can Developing Countries Leapfrog theCentralized Electrification Paradigm?” In: Energy for Sustainable Development 31(Apr. 2016), pp. 97–107. ISSN: 0973-0826. DOI: 10.1016/j.esd.2015.12.005. URL:http://www.sciencedirect.com/science/article/pii/S0973082615301599.
[46] A. Chaurey and T. C. Kandpal. “A Techno-Economic Comparison of Rural Elec-trification Based on Solar Home Systems and PV Microgrids”. In: Energy Pol-icy. The Role of Trust in Managing Uncertainties in the Transition to a Sustain-able Energy Economy, Special Section with Regular Papers 38.6 (June 2010),pp. 3118–3129. ISSN: 0301-4215. DOI: 10.1016/j.enpol.2010.01.052. URL:http://www.sciencedirect.com/science/article/pii/S0301421510000807.
[47] Uwe Deichmann et al. “The Economics of Renewable Energy Expansion in RuralSub-Saharan Africa”. In: Energy Policy 39.1 (Jan. 2011), pp. 215–227. ISSN: 0301-4215. DOI: 10.1016/j.enpol.2010.09.034. URL: http://www.sciencedirect.com/science/article/pii/S0301421510007202.
[48] Enterprise Surveys and The World Bank. Data on Infrastructure - World BankEnterprise Survey of Business Managers. Survey. The World Bank Group, 2016. URL:http://www.enterprisesurveys.org.
[49] Pierluigi Mancarella and Gianfranco Chicco. “Global and Local Emission ImpactAssessment of Distributed Cogeneration Systems with Partial-Load Models”. In:Applied Energy 86.10 (Oct. 2009), pp. 2096–2106. ISSN: 03062619. DOI: 10.1016/j.apenergy.2008.12.026. URL: http://linkinghub.elsevier.com/retrieve/pii/S0306261908003516.
[50] V. S. K. Murthy Balijepalli, S. A. Khaparde, and C. V. Dobariya. “Deployment ofMicroGrids in India”. In: IEEE PES General Meeting. IEEE PES General Meeting.July 2010, pp. 1–7. DOI: 10.1109/PES.2010.5589956.

BIBLIOGRAPHY 77
[51] Robert M. Cuzner and Giri Venkataramanan. “The Status of DC Micro-GridProtection”. In: Industry Applications Society Annual Meeting, 2008. IAS’08. IEEE.IEEE, 2008, pp. 1–8. URL: http://ieeexplore.ieee.org/xpls/abs_all.jsp?arnumber=4659170.
[52] Brian Fortenbery, Ecos Consulting EPRI, and William Tschudi. “DC Power forImproved Data Center Efficiency”. In: Lawrence Berkeley National Laboratory, Uni-versity of California, California (2008). URL: https://pdfs.semanticscholar.org/5268/2f8c38e24390fb9b392e61b7d3686ee4c196.pdf.
[53] D. J. Becker and B. J. Sonnenberg. “DC Microgrids in Buildings and Data Centers”.In: 2011 IEEE 33rd International Telecommunications Energy Conference. 2011 IEEE33rd International Telecommunications Energy Conference. Oct. 2011, pp. 1–7.DOI: 10.1109/INTLEC.2011.6099725.
[54] Ahmed T. Elsayed, Ahmed A. Mohamed, and Osama A. Mohammed. “DC Mi-crogrids and Distribution Systems: An Overview”. In: Electric Power SystemsResearch 119 (Feb. 2015), pp. 407–417. ISSN: 0378-7796. DOI: 10.1016/j.epsr.2014.10.017. URL: http://www.sciencedirect.com/science/article/pii/S0378779614003885.
[55] Ishwari Tank and Shrikant Mali. “Renewable Based DC Microgrid with EnergyManagement System”. In: Signal Processing, Informatics, Communication and EnergySystems (SPICES), 2015 IEEE International Conference On. IEEE, 2015, pp. 1–5. URL:http://ieeexplore.ieee.org/xpls/abs_all.jsp?arnumber=7091542.
[56] Md Junayed Sarker et al. “DC Micro-Grid with Distributed Generation for RuralElectrification”. In: 2012 47th International Universities Power Engineering Conference(UPEC). IEEE, 2012, pp. 1–6. URL: http://ieeexplore.ieee.org/xpls/abs_all.jsp?arnumber=6398580.
[57] B. Alipuria et al. “Application of DC Micro-Grids for Integration of Solar HomeSystems in Smart Grids”. In: Intelec 2013; 35th International TelecommunicationsEnergy Conference, SMART POWER AND EFFICIENCY. Intelec 2013; 35th Inter-national Telecommunications Energy Conference, SMART POWER AND EFFI-CIENCY. Oct. 2013, pp. 1–6.
[58] Yang Han et al. “Energy Management Method for Photovoltaic DC Micro-GridSystem Based on Power Tracking Control”. In: IECON 2016 - 42nd Annual Con-ference of the IEEE Industrial Electronics Society. IECON 2016 - 42nd Annual Con-ference of the IEEE Industrial Electronics Society. Oct. 2016, pp. 3058–3063. DOI:10.1109/IECON.2016.7793868.

BIBLIOGRAPHY 78
[59] Y. K. Chen et al. “Design and Implementation of Energy Management SystemWith Fuzzy Control for DC Microgrid Systems”. In: IEEE Transactions on PowerElectronics 28.4 (Apr. 2013), pp. 1563–1570. ISSN: 0885-8993. DOI: 10.1109/TPEL.2012.2210446.
[60] Ali Bidram and Ali Davoudi. “Hierarchical Structure of Microgrids Control Sys-tem”. In: IEEE Transactions on Smart Grid 3.4 (Dec. 2012), pp. 1963–1976. ISSN:1949-3053. DOI: 10.1109/TSG.2012.2197425. URL: http://ieeexplore.ieee.org/document/6202752/.
[61] T. L. Vandoorn et al. “Microgrids: Hierarchical Control and an Overview ofthe Control and Reserve Management Strategies”. In: IEEE Industrial ElectronicsMagazine 7.4 (Dec. 2013), pp. 42–55. ISSN: 1932-4529. DOI: 10.1109/MIE.2013.2279306.
[62] Ashray Manur. “Microgrid Energy Management System”. Masters Thesis. Univer-sity of Wisconsin-Madison, 2015. URL: https://minds.wisconsin.edu/handle/1793/73976.
[63] Dong Chen, Lie Xu, and Liangzhong Yao. “DC Voltage Variation Based Au-tonomous Control of DC Microgrids”. In: IEEE Transactions on Power Delivery 28.2(Apr. 2013), pp. 637–648. ISSN: 0885-8977. DOI: 10.1109/TPWRD.2013.2241083.URL: http://ieeexplore.ieee.org/lpdocs/epic03/wrapper.htm?arnumber=6449332.
[64] Chi Jin et al. “Implementation of Hierarchical Control in DC Microgrids”. In: IEEETransactions on Industrial Electronics 61.8 (Aug. 2014), pp. 4032–4042. ISSN: 0278-0046, 1557-9948. DOI: 10.1109/TIE.2013.2286563. URL: http://ieeexplore.ieee.org/lpdocs/epic03/wrapper.htm?arnumber=6642055.
[65] Vahidreza Nasirian et al. “Distributed Cooperative Control of DC Microgrids”.In: IEEE Transactions on Power Electronics 30.4 (Apr. 2015), pp. 2288–2303. ISSN:0885-8993. DOI: 10.1109/TPEL.2014.2324579. URL: http://ieeexplore.ieee.org/lpdocs/epic03/wrapper.htm?arnumber=6816073.
[66] Sandeep Anand, Baylon G. Fernandes, and Josep Guerrero. “Distributed Controlto Ensure Proportional Load Sharing and Improve Voltage Regulation in Low-Voltage DC Microgrids”. In: IEEE Transactions on Power Electronics 28.4 (Apr. 2013),pp. 1900–1913. ISSN: 0885-8993. DOI: 10.1109/TPEL.2012.2215055. URL: http://ieeexplore.ieee.org/lpdocs/epic03/wrapper.htm?arnumber=6287047.
[67] P. J. Hart, R. H. Lasseter, and T. M. Jahns. “Symmetric Droop Control for ImprovedHybrid AC/DC Microgrid Transient Performance”. In: 2016 IEEE Energy Conver-sion Congress and Exposition (ECCE). 2016 IEEE Energy Conversion Congress andExposition (ECCE). Sept. 2016, pp. 1–8. DOI: 10.1109/ECCE.2016.7855486.

BIBLIOGRAPHY 79
[68] Poh Chiang Loh et al. “Hybrid AC & DC Microgrids With Energy Storages andProgressive Energy Flow Tuning”. In: IEEE Transactions on Power Electronics 28.4(Apr. 2013), pp. 1533–1543. ISSN: 0885-8993. DOI: 10.1109/TPEL.2012.2210445.URL: http://ieeexplore.ieee.org/lpdocs/epic03/wrapper.htm?arnumber=6249790.
[69] Q. Shafiee et al. “Hierarchical Control for Multiple DC-Microgrids Clusters”.In: IEEE Transactions on Energy Conversion 29.4 (Dec. 2014), pp. 922–933. ISSN:0885-8969. DOI: 10.1109/TEC.2014.2362191.
[70] P. Tian et al. “A Hierarchical Energy Management System Based on Hierar-chical Optimization for Microgrid Community Economic Operation”. In: IEEETransactions on Smart Grid 7.5 (Sept. 2016), pp. 2230–2241. ISSN: 1949-3053. DOI:10.1109/TSG.2015.2470551.
[71] Ashray Manur et al. “MEM: Energy Management System for Low Voltage DCMicrogrids”. In: Sustainable Green Buildings and Communities. Sustainable GreenBuildings and Communities. Chennai, India, 2016 (forthcoming).
[72] SGBC. First International Conference on Sustainable Green Buildings & CommunitiesConference. 2016. URL: http://www.sgbcconf.org/.
[73] Adria E. Brooks, Ashray Manur, and Giri Venkataramanan. “Energy Modeling ofAggregated Community Scale Residential Microgrids”. In: Sustainable Green Build-ings and Communities. Sustainable Green Buildings and Communities. Chennai,India, 2016 (forthcoming).
[74] Ashray Manur and Giri Venkataramanan. “Wireless Sensor Network for DC/ACHomegrids”. In: Sustainable Green Buildings and Communities. Sustainable GreenBuildings and Communities. Chennai, India, 2016 (forthcoming).
[75] NXP Semiconductors. I2C-Bus Specification and User Manual. Apr. 4, 2014. URL:http://www.nxp.com/documents/user_manual/UM10204.pdf.
[76] Linear Technology. LTC2946 Wide Range I2C Power, Charge and Energy Monitor.2014. URL: http://www.linear.com/LTC2946.
[77] K.C. Divya and Jacob Østergaard. “Battery Energy Storage Technology for PowerSystems—An Overview”. In: Electric Power Systems Research 79.4 (Apr. 2009),pp. 511–520. ISSN: 03787796. DOI: 10.1016/j.epsr.2008.09.017. URL: http://linkinghub.elsevier.com/retrieve/pii/S0378779608002642.
[78] Rodolfo Dufo-López, Juan M. Lujano-Rojas, and José L. Bernal-Agustín. “Com-parison of Different Lead–acid Battery Lifetime Prediction Models for Use inSimulation of Stand-Alone Photovoltaic Systems”. In: Applied Energy 115 (Feb. 15,2014), pp. 242–253. ISSN: 0306-2619. DOI: 10.1016/j.apenergy.2013.11.021. URL:http://www.sciencedirect.com/science/article/pii/S0306261913009148.

BIBLIOGRAPHY 80
[79] B. Zhao et al. “Operation Optimization of Standalone Microgrids ConsideringLifetime Characteristics of Battery Energy Storage System”. In: IEEE Transactionson Sustainable Energy 4.4 (Oct. 2013), pp. 934–943. ISSN: 1949-3029. DOI: 10.1109/TSTE.2013.2248400.
[80] Kathryn R. Bullock. “Lead/Acid Batteries”. In: Journal of power sources 51 (1-21994), pp. 1–17. URL: http://www.sciencedirect.com/science/article/pii/0378775394019525.
[81] Nirmal-Kumar C. Nair and Niraj Garimella. “Battery Energy Storage Systems:Assessment for Small-Scale Renewable Energy Integration”. In: Energy and Build-ings 42.11 (Nov. 2010), pp. 2124–2130. ISSN: 0378-7788. DOI: 10.1016/j.enbuild.2010.07.002. URL: http://www.sciencedirect.com/science/article/pii/S0378778810002185.
[82] Elena M. Krieger, John Cannarella, and Craig B. Arnold. “A Comparison ofLead-Acid and Lithium-Based Battery Behavior and Capacity Fade in off-GridRenewable Charging Applications”. In: Energy 60 (Oct. 1, 2013), pp. 492–500.ISSN: 0360-5442. DOI: 10.1016/j.energy.2013.08.029. URL: http://www.sciencedirect.com/science/article/pii/S0360544213007044.
[83] M. Armand and J.-M. Tarascon. “Building Better Batteries”. In: Nature 451.7179(Feb. 7, 2008), pp. 652–657. ISSN: 0028-0836. DOI: 10.1038/451652a. URL: http://www.nature.com.ezproxy.library.wisc.edu/nature/journal/v451/n7179/
full/451652a.html.
[84] Boucar Diouf and Ramchandra Pode. “Potential of Lithium-Ion Batteries in Re-newable Energy”. In: Renewable Energy 76 (Apr. 2015), pp. 375–380. ISSN: 0960-1481.DOI: 10.1016/j.renene.2014.11.058. URL: http://www.sciencedirect.com/science/article/pii/S0960148114007885.
[85] Shuo Pang et al. “Battery State-of-Charge Estimation”. In: American Control Confer-ence, 2001. Proceedings of the 2001. American Control Conference, 2001. Proceedingsof the 2001. Vol. 2. 2001, 1644–1649 vol.2. DOI: 10.1109/ACC.2001.945964.
[86] Sabine Piller, Marion Perrin, and Andreas Jossen. “Methods for State-of-ChargeDetermination and Their Applications”. In: Journal of Power Sources. Proceedingsof the 22nd International Power Sources Symposium 96.1 (June 1, 2001), pp. 113–120. ISSN: 0378-7753. DOI: 10.1016/S0378-7753(01)00560-2. URL: http://www.sciencedirect.com/science/article/pii/S0378775301005602.
[87] M. Coleman et al. “State-of-Charge Determination From EMF Voltage Estimation:Using Impedance, Terminal Voltage, and Current for Lead-Acid and Lithium-IonBatteries”. In: IEEE Transactions on Industrial Electronics 54.5 (Oct. 2007), pp. 2550–2557. ISSN: 0278-0046. DOI: 10.1109/TIE.2007.899926.

BIBLIOGRAPHY 81
[88] G L Shekar. Farewell to Dr. Venkata Giri Venkataramanan. May 13, 2015. URL: http://www.nie.ac.in/wp-content/uploads/2015/11/circular_0012.pdf.
[89] Editor. NIE Signs MoU with University of Wisconsin-Madison. June 3, 2016. URL:http://citytoday.news/nie-signs-mou-with-university-of-wisconsin-
madison/.
[90] NREL. PVWatts Calculator Version 5.3.8 (India). Oct. 2016. URL: http://pvwatts.nrel.gov/India/index.php.
[91] India Meteorological Department. District-Wise Monthly Rainfall Data, List of Rain-gauge Stations. Sept. 1, 2012. URL: http://www.indiawaterportal.org/articles/district-wise-monthly-rainfall-data-list-raingauge-stations-india-
meteorological-department.
[92] Solarex. Millenia Photovoltaic Modules. 1999.
[93] Andreas Wagner. Photovoltaik Engineering: Handbuch für Planung, Entwicklung undAnwendung. Springer-Verlag, Nov. 27, 2015. 476 pp. ISBN: 978-3-662-48640-5.
[94] Bruce Mulliken. “Solarex Fades Away”. In: Green Energy News (Mar. 27, 2010).URL: http://www.green-energy-news.com/arch/nrgs2010/20100020.html.
[95] Kevin Bullis. “Why BP Solar Failed”. In: MIT Technology Review (Dec. 21, 2011).URL: https://www.technologyreview.com/s/426461/why-bp-solar-failed/.
[96] Bhubaneswari Parida, S. Iniyan, and Ranko Goic. “A Review of Solar Photo-voltaic Technologies”. In: Renewable and Sustainable Energy Reviews 15.3 (Apr.2011), pp. 1625–1636. ISSN: 1364-0321. DOI: 10.1016/j.rser.2010.11.032. URL:http://www.sciencedirect.com/science/article/pii/S1364032110004016.
[97] NREL. Cell Efficiency Explanatory Notes. Explanatory Notes. Golden, CO (US):National Renewable Energy Laboratory, 2016. URL: https://www.nrel.gov/pv/.
[98] Martin A. Green et al. “Solar Cell Efficiency Tables (Version 49)”. In: Progress inPhotovoltaics: Research and Applications 25.1 (Jan. 2017), pp. 3–13. ISSN: 10627995.DOI: 10.1002/pip.2855. URL: http://doi.wiley.com/10.1002/pip.2855.
[99] D. C. Jordan and S. R. Kurtz. “Photovoltaic Degradation Rates—an AnalyticalReview”. In: Progress in Photovoltaics: Research and Applications 21.1 (Jan. 1, 2013),pp. 12–29. ISSN: 1099-159X. DOI: 10.1002/pip.1182. URL: http://onlinelibrary.wiley.com.ezproxy.library.wisc.edu/doi/10.1002/pip.1182/abstract.
[100] Kirloskar Oil Engines Limited. Kirloskar Chhota Chilli. 2017. URL: http://www.koelgreen.com/3-kva-5-kva.
[101] Primus Wind Power. Air X Turbine. 2013. URL: http://www.primuswindpower.com/wind-power-products/air-30-turbine-2/.

BIBLIOGRAPHY 82
[102] Roberto Faranda and Sonia Leva. “Energy Comparison of MPPT Techniques forPV Systems”. In: WSEAS transactions on power systems 3.6 (2008), pp. 446–455. URL:http://www.wseas.us/e-library/transactions/power/2008/27-545.pdf.
[103] M. A. G. de Brito et al. “Evaluation of the Main MPPT Techniques for Photo-voltaic Applications”. In: IEEE Transactions on Industrial Electronics 60.3 (Mar.2013), pp. 1156–1167. ISSN: 0278-0046. DOI: 10.1109/TIE.2012.2198036.
[104] Phocos. MPPT 100/30 Datasheet. Oct. 17, 2013. URL: http://www.phocos.co.in/products/mppt-100-30a.
[105] Kaushiki Sanyal. The Scheduled Tribes (Recognition of Forest Rights) Bill, 2005. Leg-islative Brief. New Delhi, India: Parliamentary Research Service, Apr. 6, 2006. URL:http://www.prsindia.org/uploads/media/1167469383/legis1167477829_
legislative_brief_scheduled_tribes_bill.pdf.
[106] Sharachchandra Lélé. “A ’Defining’ Moment for Forests?” In: Economic and PoliticalWeekly 42.25 (2007), pp. 2379–2383. ISSN: 0012-9976. URL: http://www.jstor.org.ezproxy.library.wisc.edu/stable/4419725.
[107] Nayantara Narayanan. A Short History of India’s Two-Decade Struggle to Define Whata Forest Actually Is. May 12, 2015. URL: https://scroll.in/article/726461/a-short - history - of - indias - two - decade - struggle - to - define - what - a -
forest-actually-is.
[108] K. N. Chaturvedi. The Scheduled Tribes and Other Traditional Forest Dwellers (Recog-niction of Forest Rights) Act. Dec. 29, 2006. URL: http://extwprlegs1.fao.org/docs/pdf/ind77867.pdf.
[109] Balachandran Chidambaranatraj. Construction of Environment & Child Friendly(E&CF) Anganawadi Centres with GBC (Green Building Concept) Approach - in theMidst of Mysore Range Forest Tribal Area. Project Report. Mysuru, India: CREST,Mar. 27, 2016.
[110] THE BAMBOO SCHOOL: A Documentary on Eco Sensitive Anganwadi Kendra.Aug. 20, 2016. URL: https://vimeo.com/179607063.
[111] H.N. Narasimha Kumar. “An All-Bamboo Anganwadi in the Forest”. In: The Hindu(Mar. 27, 2016). URL: http://www.thehindu.com/news/national/karnataka/an-allbamboo-anganwadi-in-the-forest/article8400831.ece.
[112] Bosch Limited. Bosch India Foundation. 2017. URL: http://www.boschindia.com/en/in/sustainability_innovation_5/bosch_india_csr_bif.html.