impax fourth quarter 2016 earnings call presentation
TRANSCRIPT

1
Fourth Quarter and Full Year 2016 Results March 1, 2017

2
Impax Cautionary Statement Regarding Forward Looking Statements "Safe Harbor" statement under the Private Securities Litigation Reform Act of 1995: To the extent any statements made in this presentation contain information that is not historical; these statements are forward-looking in nature and express the beliefs and expectations of management. Such statements are based on current expectations and involve a number of known and unknown risks and uncertainties that could cause the Company’s future results, performance, or achievements to differ significantly from the results, performance, or achievements expressed or implied by such forward-looking statements. Such risks and uncertainties include, but are not limited to, fluctuations in the Company’s operating results and financial condition, the volatility of the market price of the Company’s common stock, the Company’s ability to successfully develop and commercialize pharmaceutical products in a timely manner, the impact of competition, the effect of any manufacturing or quality control problems, the Company’s ability to manage its growth, risks related to acquisitions of or investments in technologies, products or businesses, risks relating to goodwill and intangibles, the reduction or loss of business with any significant customer, the substantial portion of the Company’s total revenues derived from sales of a limited number of products, the impact of consolidation of the Company’s customer base, the Company’s ability to sustain profitability and positive cash flows, the impact of any valuation allowance on the Company’s deferred tax assets, the restrictions imposed by the Company’s credit facility and indenture, the Company’s level of indebtedness and liabilities and the potential impact on cash flow available for operations, the availability of additional funds in the future, any delays or unanticipated expenses in connection with the operation of the Company’s manufacturing facilities, the effect of foreign economic, political, legal and other risks on the Company’s operations abroad, the uncertainty of patent litigation and other legal proceedings, the increased government scrutiny on the Company’s agreements to settle patent litigations, product development risks and the difficulty of predicting FDA filings and approvals, consumer acceptance and demand for new pharmaceutical products, the impact of market perceptions of the Company and the safety and quality of the Company’s products, the Company’s determinations to discontinue the manufacture and distribution of certain products, the Company’s ability to achieve returns on its investments in research and development activities, changes to FDA approval requirements, the Company’s ability to successfully conduct clinical trials, the Company’s reliance on third parties to conduct clinical trials and testing, the Company’s lack of a license partner for commercialization of Numient® (IPX066) outside of the United States, impact of illegal distribution and sale by third parties of counterfeits or stolen products, the availability of raw materials and impact of interruptions in the Company’s supply chain, the Company’s policies regarding returns, rebates, allowances and chargebacks, the use of controlled substances in the Company’s products, the effect of current economic conditions on the Company’s industry, business, results of operations and financial condition, disruptions or failures in the Company’s information technology systems and network infrastructure caused by third party breaches or other events, the Company’s reliance on alliance and collaboration agreements, the Company’s reliance on licenses to proprietary technologies, the Company’s dependence on certain employees, the Company’s ability to comply with legal and regulatory requirements governing the healthcare industry, the regulatory environment, the effect of certain provisions in the Company’s government contracts, the Company’s ability to protect its intellectual property, exposure to product liability claims, changes in tax regulations, uncertainties involved in the preparation of the Company’s financial statements, the Company’s ability to maintain an effective system of internal control over financial reporting, the effect of terrorist attacks on the Company’s business, the location of the Company’s manufacturing and research and development facilities near earthquake fault lines, expansion of social media platforms and other risks described in the Company’s periodic reports filed with the Securities and Exchange Commission. Forward-looking statements speak only as to the date on which they are made, and the Company undertakes no obligation to update publicly or revise any forward-looking statement, regardless of whether new information becomes available, future developments occur or otherwise. Trademarks referenced herein are the property of their respective owners. ©2017 Impax Laboratories, Inc. All Rights Reserved.

3
Agenda
Business Update
Kevin Buchi – Interim President & Chief Executive Officer
Financial Review
Bryan Reasons – Senior Vice President, Chief Financial Officer
Additional Participants for Q&A Session
Doug Boothe – President Impax Generics Michael Nestor – President Impax Specialty Pharma

4 4
Business Update Kevin Buchi
Interim President & Chief Executive Officer

5
Increased rate of ANDA approvals by FDA Consolidation of payers and customers Aggressive competition and pricing activities; impacted our 2016 results
Generic division pricing declined ~22% Excluding diclofenac sodium gel and metaxalone; pricing declined ~12%
Generic Industry Challenges…
Summary of 2016
$0
$50
$100
$150
$200
$250
1Q 2Q 3Q 4Q
2016 Quarterly Revenue
Generic Specialty Pharma
…Resulted in Significant Sales Volatility
$226
$173
$228 $198
$711 $606
$150 $218
$0
$200
$400
$600
$800
$1,000
2015 2016
Annual Revenue
Generic Specialty Pharma
$861 $824
($ millions)
Note: The sum of the individual amounts may not equal due to rounding.
6
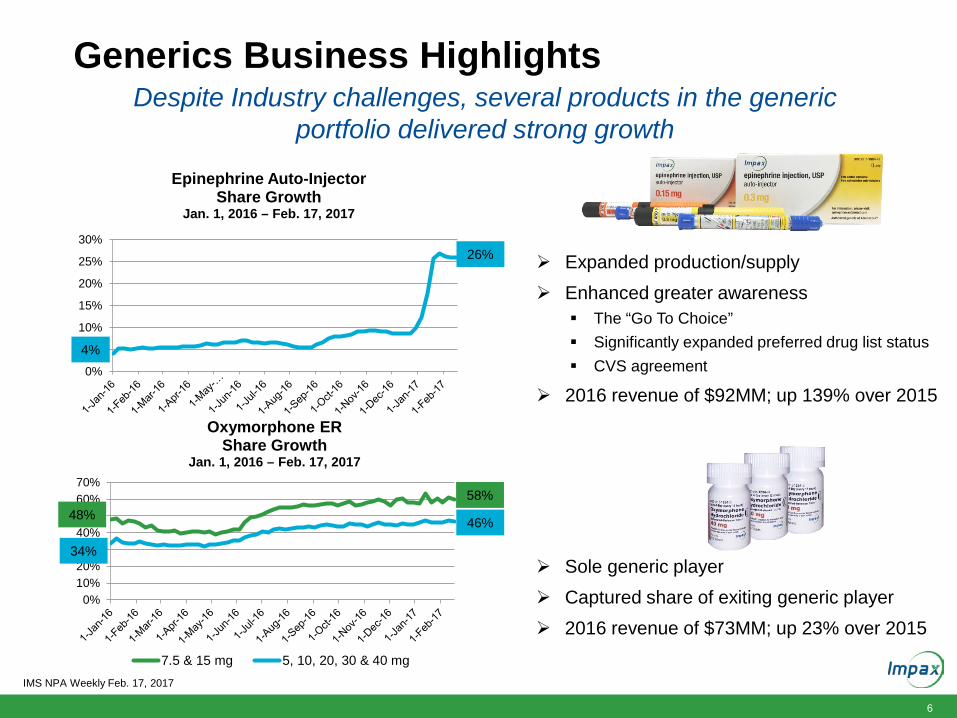
Expanded production/supply Enhanced greater awareness
The “Go To Choice” Significantly expanded preferred drug list status CVS agreement
2016 revenue of $92MM; up 139% over 2015
Generics Business Highlights
IMS NPA Weekly Feb. 17, 2017
0%
5%
10%
15%
20%
25%
30%
Epinephrine Auto-Injector Share Growth
Jan. 1, 2016 – Feb. 17, 2017
4%
26%
0%10%20%30%40%50%60%70%
Oxymorphone ER Share Growth
Jan. 1, 2016 – Feb. 17, 2017
7.5 & 15 mg 5, 10, 20, 30 & 40 mg
34%
46%
Sole generic player Captured share of exiting generic player 2016 revenue of $73MM; up 23% over 2015
48% 58%
Despite Industry challenges, several products in the generic portfolio delivered strong growth

7
Redefined clinical messaging related to formulation Simplified dose conversion guidance for general neurologists Launched myRytary Patient Support Program www.myrytary.com 74% revenue growth and 114% script growth in 2016 (a)
Delivering Solid Growth Across Specialty Portfolio
Emphasis on second position promotion Increased non-personal promotion Solid growth from general neurologists, headache
specialists and pediatricians 9% revenue growth and 8% script growth in 2016
0%
1%
2%
3%
02,0004,0006,0008,000
10,00012,00014,000
Jan-16 Feb-16 Mar-16 Apr-16 May-16 Jun-16 Jul-16 Aug-16 Sep-16 Oct-16 Nov-16 Dec-16 Jan-17
CD
LD S
hare
TRx
Monthly TRx and Share of National CD-LD TRx
Rytary TRx CD-LD Share
(a) Rytary was launched in Feb. 2015. (b) Acquired in the Tower Holdings Acquisition in March 2015. Source: IMS NPA Monthly Jan. 2017
Emverm launched late 1Q 2016 Focusing on Albenza to Emverm conversion Increased non-personal promotion of Emverm Albenza: 43% revenue growth in 2016 (b)

8
Investing to Expand Pipeline Opportunities
Source of sales data: IMS NSP Dec 2016; *U.S. Brand/Generic market sales; Pipeline data as of Feb 24, 2017
Generic R&D
16 14
7 6
Pending at FDA$14B
Under Development$10B
Solid Oral Dose Alternative Dose
23 20
# of Potential Products
FTF or FTM 8 17
Specialty Pharma R&D
Portfolio of 43 Products Current U.S. Brand/Generic Market of $24B
IPX-203 Carbidopa-Levodopa
Ongoing Phase 2b study Multiple dose study in patients with
advanced Parkinson’s disease
Interim results by end of first half 2017 Held meeting with FDA in Feb. 2017 to
discuss Phase 3 development plan
Pipeline provides solid platform for growth
9
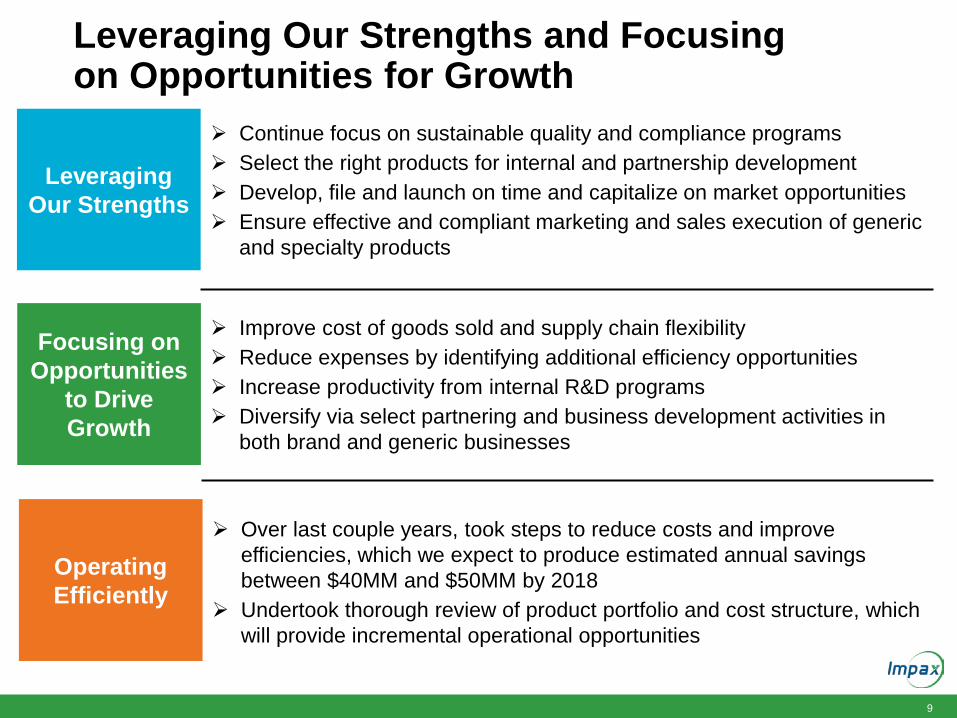
Leveraging Our Strengths and Focusing on Opportunities for Growth
Continue focus on sustainable quality and compliance programs Select the right products for internal and partnership development Develop, file and launch on time and capitalize on market opportunities Ensure effective and compliant marketing and sales execution of generic
and specialty products
Leveraging Our Strengths
Improve cost of goods sold and supply chain flexibility Reduce expenses by identifying additional efficiency opportunities Increase productivity from internal R&D programs Diversify via select partnering and business development activities in
both brand and generic businesses
Focusing on Opportunities
to Drive Growth
Over last couple years, took steps to reduce costs and improve efficiencies, which we expect to produce estimated annual savings between $40MM and $50MM by 2018
Undertook thorough review of product portfolio and cost structure, which will provide incremental operational opportunities
Operating Efficiently

10 10
Financial Review Bryan Reasons
Senior Vice President, Chief Financial Officer

11
Consolidated 4Q & FY 2016 Results
Refer to the GAAP to non-GAAP reconciliation tables in the appendix for a reconciliation of non-GAAP results
($ millions, expect per share data) 4Q 2016 4Q 2015 FY 2016 FY 2015
Revenues $198 $282 $824 $860 Gross (Loss) Profit $(161) $115 $(151) $352
Gross Margin (81%) 41% (18%) 41% Adjusted Gross Profit $93 $138 $413 $424
Gross Margin 47% 49% 50% 49% (Loss) Income from Operations $(264) $31 $(494) $70 Adjusted Income from Operations $22 $65 $141 $170 Net (loss) income $(280) $11 $(472) $39 Adjusted Net Income $12 $45 $84 $105 Diluted (loss) Income Per Share $(3.91) $0.16 $(6.63) $0.54 Adjusted Income Per Share $0.16 $0.62 $1.16 $1.45
4Q and full year 2016 reported results primarily impacted by non-cash intangible asset impairment charges

12
$ millions 4Q 2016 FY 2016
Tower Holdings Acquisition
Currently marketed portfolio $175 $177
In-process R&D $20 $46
Other --- $8
Teva Transaction
Currently marketed portfolio $54 $302
In-process R&D $4 $7
Other
Currently marketed portfolio $1 $1
Total non-cash impairment $254 $542
Note: The sum of the individual amounts may not equal due to rounding.
Non-Cash Intangible Asset Impairment Charges

13
Generic Division 4Q & FY 2016 Results ($ millions) 4Q 2016 4Q 2015 FY 2016 FY 2015
Revenues $139 $227 $606 $711 Gross (Loss) Profit $(176) $76 $(275) $261
Gross Margin (127%) 34% (45%) 37% Adjusted Gross Profit $46 $92 $238 $303
Gross Margin 33% 41% 39% 43% (Loss) Income from Operations $(212) $42 $(386) $169 Adjusted Income from Operations $22 $58 $157 $211
Refer to the GAAP to non-GAAP reconciliation tables in the appendix for a reconciliation of non-GAAP results
4Q and full year 2016 reported results primarily impacted by non-cash intangible asset impairment charges

14
Specialty Pharma Division 4Q & FY 2016 Results ($ millions) 4Q 2016 4Q 2015 FY 2016 FY 2015
Revenues $59 $55 $218 $150 Gross Profit $15 $38 $124 $92
Gross Margin 26% 70% 57% 61% Adjusted Gross Profit $47 $46 $174 $121
Gross Margin 79% 84% 80% 81% (Loss) Income from Operations $(17) $19 $12 $19 Adjusted Income from Operations $26 $27 $87 $49
Refer to the GAAP to non-GAAP reconciliation tables in the appendix for a reconciliation of non-GAAP results
4Q and full year 2016 reported results primarily impacted by non-cash intangible asset impairment charges

15
Capitalization as of December 31, 2016
Capitalization ($ millions) 4Q 2016
Cash and Cash Equivalents $180
2022 Convertible Senior Notes $600
Term Loan $395
Total Debt $995
Net Debt $815
Net Debt to Adjusted EBITDA 4.1X
Excess Free Cash Flow Primarily Targeted for Debt Reduction
Feb. 28, 2017 – made a voluntary prepayment of $50 million towards term loan facility.

16 16
The Company’s full year 2017 estimates are based on management’s current expectations, including with respect to prescription trends, pricing levels, inventory levels, and the anticipated timing of future product launches and events. The following statements are forward-looking, and
actual results could differ materially depending on market conditions and the factors set forth above under our “Safe Harbor” statement.
2017 Outlook

17
2017 Assumptions
Generic Division Aggressive competition and pricing activities expected to continue
Pricing erosion in the high single to low double digit range
Minimal contribution from approved/tentatively approved products expected to launch throughout 2017
Generic Vytorin® (tentatively approved), patent expires late April
Not expecting approval of generics Renvela® and/or Welchol® until late 2017 – at the earliest May be delayed until 2018
Total revenues, excluding products not yet approved, expected to decline year over year
Specialty Pharma Division Continued Rytary® and Zomig® nasal spray growth
Possible generic competition on Albenza®
Partially offset by launch of our own authorized generic
Focusing on Albenza® to Emverm® conversion
The Company’s full year 2017 estimates are based on management’s current expectations, including with respect to prescription trends, pricing levels, inventory levels, and the anticipated timing of future product launches and events. These statements are forward-looking, and actual results could differ materially depending on market conditions and the factors set forth under our “Safe Harbor” statement above.

18
2017 Financial Guidance Summary
Guidance
Adjusted Gross Margin as a % of Revenues ≈ 47% to 49%
R&D & Patent Litigation Expense ≈ $90MM to $95MM
Selling, General & Administrative Expense ≈ $190MM to $195MM
Adjusted Interest Expense ≈ $30MM
Tax Rate ≈ 34% to 35%
Capital Expenditures ≈ $25MM to $30MM
The Company’s full year 2017 estimates are based on management’s current expectations, including with respect to prescription trends, pricing levels, inventory levels, and the anticipated timing of future product launches and events. These statements are forward-looking, and actual results could differ materially depending on market conditions and the factors set forth under our “Safe Harbor” statement above.
Aggressively pursuing additional efficiency opportunities to free up resources to invest in growth initiatives and reduce
long-term debt

19 19
Q&A

20
ANDA Pipeline Includes Several Potential High-Value First-to-Market Opportunities
Source of sales data: IMS NPS Dec 2016; Pipeline data as of Feb 24, 2016; TA = tentative approval 1 Launched authorized generic in April 2016 2 Assuming final FDA approval, earliest potential launch date/timing based on settlement or patent expiration date
Disclosed Pending ANDAs and Tentative Approval Products
Greneric Product Name Brand IMS Sales
Potential Launch Timing
FTM Opportunity
Oxycodone ER tablet (new formulation) 1 OxyContin® $2.3B Settled, not disclosed
Sevelamer Carbonate IR tablet Renvela® $1.9B Approval √ Methylphenidate HCI ER tablet Concerta® $1.8B Approval
Teriflunomide IR tablet Aubagio® $1.1B Pending litigation √ Ezetimibe/Simvastatin IR tablet – TA 2 Vytorin® $690M April 2017 √ Colesevelam IR tablet Welchol® $635M Approval √ Oxymorphone ER tablet (new formulation) Opana ER® $305M Pending litigation
Fentanyl Buccal IR tablet Fentora® $143M Settled, not disclosed √ Dutasteride/Tamsulosin IR capsule Jalyn® $46M Approval
Risedronate Sodium DR tablet Atelvia® $31M Approval

21
GAAP to Adjusted Results Reconciliation The following table reconciles total Company reported cost of revenues and (Loss) income from operations to adjusted cost of revenues, adjusted gross profit, adjusted gross margin and adjusted income from operations. (Unaudited, amounts in thousands)
Refer to the Fourth Quarter 2016 Earnings Release for an explanation of adjusted items. The sum of the individual amounts may not equal due to rounding. (a) Adjusted gross profit is calculated as total revenues less adjusted cost of revenues. Adjusted gross margin is calculated as adjusted gross profit divided by total revenues.
Three months ended Year Ended December 31, December 31,
2016 2015 2016 2015 Cost of revenues $ 129,047 $ 160,019 $ 486,899 $ 500,762 Cost of revenues impairment charges 230,625 7,303 488,632 7,303 Adjusted to deduct: Amortization 16,886 12,970 56,490 40,186 Intangible asset impairment charges 230,625 7,303 488,632 7,303 Restructuring and severance charges 6,414 1,136 18,708 6,387 Lease termination for office consolidation - - 53 - Hayward facility remediation costs - 1,973 - 11,364 Fair value of inventory step-up - (9) - 6,458
Adjusted cost of revenues $ 105,747 $ 143,949 $ 411,648 $ 436,367
Adjusted gross profit (a) $ 92,675 $ 138,143 $ 412,781 $ 424,102 Adjusted gross margin (a) 46.7% 49.0% 50.1% 49.3%
GAAP (loss) income from operations $ (263,906) $ 30,804 $ (494,182) $ 69,568 Adjusted to deduct: Amortization 16,886 12,970 56,490 40,186 Intangible asset impairment charges 230,625 7,303 488,632 7,303 Restructuring and severance charges 11,705 2,946 24,071 10,768 In-process research and development impairment charges 23,248 6,360 52,965 6,360 Business development expenses 251 2,363 4,540 17,334 Turing legal expenses 2,111 - 7,554 - Lease termination for office consolidation - - 144 - Hayward facility remediation costs - 1,973 - 11,364 Fair value of inventory step-up - (9) - 6,458 Other 600 - 1,522 750
Adjusted income from operations $ 21,520 $ 64,710 $ 141,736 $ 170,091

22
GAAP to Adjusted Net Income Reconciliation The following table reconciles reported net (loss) income to adjusted net income. (Unaudited, amounts in thousands, except per share and per share data)
Refer to the Fourth Quarter 2016 Earnings Release for an explanation of adjusted items. The sum of the individual amounts may not equal due to rounding.
Three months ended Year Ended December 31, December 31,
2016 2015 2016 2015 Net (loss) income $(279,585) $ 11,427 $(472,031) $ 38,997
Adjusted to add (deduct): Amortization 16,886 12,970 56,490 40,186 Non-cash interest expense 6,241 5,204 22,846 11,230 Business development expenses 251 2,363 4,540 17,334 Intangible asset impairment charges 253,873 13,664 541,597 13,664 Reserve for Turing receivable (7,731) - 40,312 - Turing legal expenses 2,111 - 7,554 - Restructuring and severance charges 11,705 2,947 23,896 10,768 Fixed asset impairment charges 1,644 - 1,644 - Lease termination for office consolidation - - 144 - Gain on sale of asset - - - (45,574) Loss on extinguishment of debt - - - 16,903 Net change in fair value of derivatives - 9,000 - 13,000 Hayward facility remediation costs - 1,973 - 11,364 Fair value of inventory step-up - (9) - 6,458 Ticking Fees - - - 2,317 Other 1,118 520 2,040 1,270 Income tax effect 5,136 (15,540) (145,368) (33,399)
Adjusted net income $ 11,649 $ 44,519 $ 83,664 $ 104,518
Adjusted net income per diluted share $ 0.16 $ 0.62 $ 1.16 $ 1.45 Net (loss) income per diluted share $ (3.91) $ 0.16 $ (6.63) $ 0.54
23
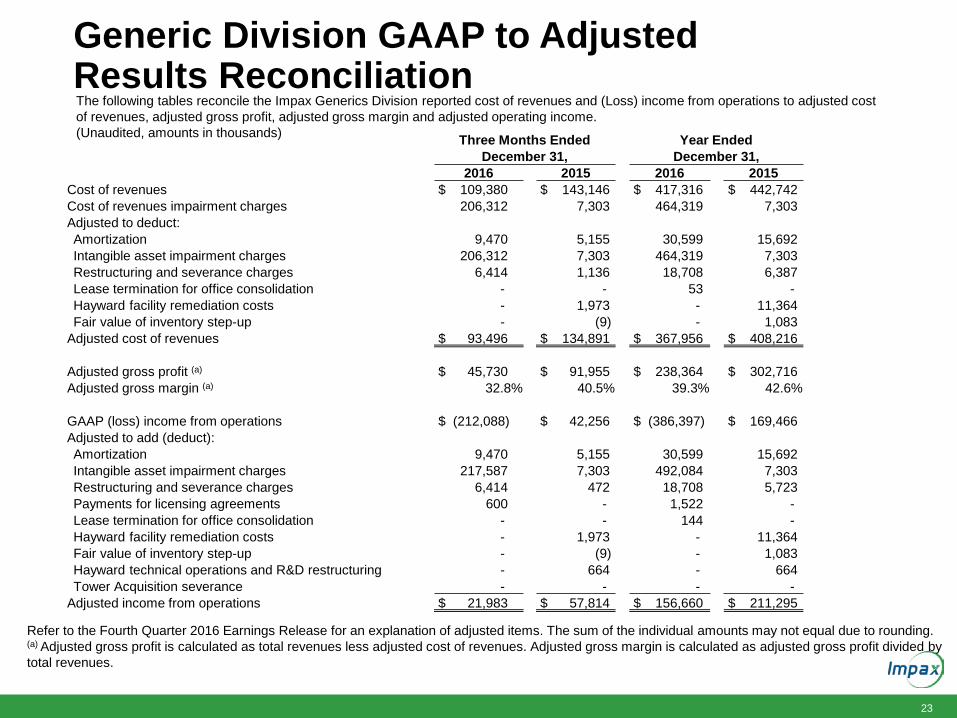
Generic Division GAAP to Adjusted Results Reconciliation The following tables reconcile the Impax Generics Division reported cost of revenues and (Loss) income from operations to adjusted cost of revenues, adjusted gross profit, adjusted gross margin and adjusted operating income. (Unaudited, amounts in thousands)
Refer to the Fourth Quarter 2016 Earnings Release for an explanation of adjusted items. The sum of the individual amounts may not equal due to rounding. (a) Adjusted gross profit is calculated as total revenues less adjusted cost of revenues. Adjusted gross margin is calculated as adjusted gross profit divided by total revenues.
Three Months Ended Year Ended December 31, December 31,
2016 2015 2016 2015 Cost of revenues $ 109,380 $ 143,146 $ 417,316 $ 442,742 Cost of revenues impairment charges 206,312 7,303 464,319 7,303 Adjusted to deduct: Amortization 9,470 5,155 30,599 15,692 Intangible asset impairment charges 206,312 7,303 464,319 7,303 Restructuring and severance charges 6,414 1,136 18,708 6,387 Lease termination for office consolidation - - 53 - Hayward facility remediation costs - 1,973 - 11,364 Fair value of inventory step-up - (9) - 1,083
Adjusted cost of revenues $ 93,496 $ 134,891 $ 367,956 $ 408,216
Adjusted gross profit (a) $ 45,730 $ 91,955 $ 238,364 $ 302,716 Adjusted gross margin (a) 32.8% 40.5% 39.3% 42.6%
GAAP (loss) income from operations $ (212,088) $ 42,256 $ (386,397) $ 169,466 Adjusted to add (deduct): Amortization 9,470 5,155 30,599 15,692 Intangible asset impairment charges 217,587 7,303 492,084 7,303 Restructuring and severance charges 6,414 472 18,708 5,723 Payments for licensing agreements 600 - 1,522 - Lease termination for office consolidation - - 144 - Hayward facility remediation costs - 1,973 - 11,364 Fair value of inventory step-up - (9) - 1,083 Hayward technical operations and R&D restructuring - 664 - 664 Tower Acquisition severance - - - -
Adjusted income from operations $ 21,983 $ 57,814 $ 156,660 $ 211,295

24
Specialty Pharma Division GAAP to Adjusted Results Reconciliation The following tables reconcile the Impax Specialty Pharma Division reported cost of revenues and (Loss) income from operations to adjusted cost of revenues, adjusted gross profit, adjusted gross margin and adjusted income from operations. (Unaudited, amounts in thousands)
Refer to the Fourth Quarter 2016 Earnings Release for an explanation of adjusted items. The sum of the individual amounts may not equal due to rounding. (a) Adjusted gross profit is calculated as total revenues less adjusted cost of revenues. Adjusted gross margin is calculated as adjusted gross profit divided by total revenues.
Three months ended Year Ended December 31, December 31,
2016 2015 2016 2015 Cost of revenues $ 19,667 $ 16,873 $ 69,583 $ 58,020
Cost of revenues impairment charges 24,313 - 24,313 - Adjusted to deduct:
Amortization 7,416 7,815 25,891 24,494
Intangible asset impairment charges 24,313 - 24,313 -
Fair value of inventory step-up - - - 5,375
Adjusted cost of revenues $ 12,251 $ 9,058 $ 43,692 $ 28,151
Adjusted gross profit (a) $ 46,945 $ 46,188 $ 174,417 $ 121,386 Adjusted gross margin (a) 79.3% 83.6% 80.0% 81.2%
GAAP (loss) income from operations $ (17,437) $ 18,850 $ 12,089 $ 19,321 Adjusted to add:
Amortization 7,416 7,816 25,891 24,494
Intangible asset impairment charges 36,286 - 49,513 -
Fair value of inventory step-up - - - 5,375 Tower Acquisition severance - - - -
Adjusted income from operations $ 26,265 $ 26,666 $ 87,493 $ 49,190