impacts of soil nox emission on o air quality in rural
TRANSCRIPT
Impacts of soil NOx emission on O3air quality in rural California
Jessie Zhang2 , Tong Sha1,2, Xiaoyan Ma1, Jun Wang2, Nate Janechek2, Yanyu Wang3, Yi Wang2, Lorena Castro2, Darrel Jenerette4
1 Collaborative Innovation Center on Forecast and Evaluation of Meteorological Disasters (CIC-FEMD)/Key Laboratory for Aerosol-Cloud-Precipitation of China Meteorological Administration,
Nanjing University of Information Science & Technology, Nanjing 210044, China2 Department of Chemical and Biochemical Engineering/
Center for Global and Regional Environmental Research, The University of Iowa, Iowa City, IA, USA3 Department of Environmental Science and Engineering, Institute of Atmospheric Sciences, Fudan
University, Shanghai 200438, China4 Department of Botany and Plant Sciences, University of California, Riverside, California 92521, USA
1TEMPO Science Team Meeting, June 2-3, 2021
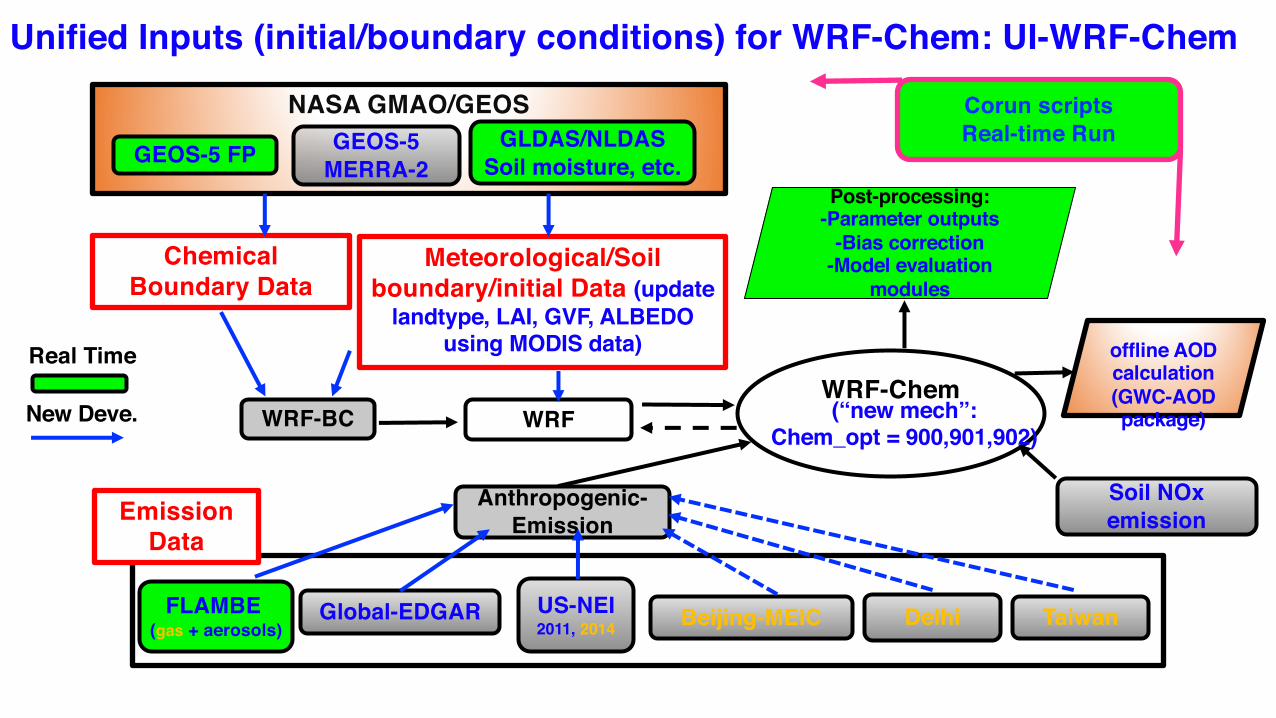
NASA GMAO/GEOS
Unified Inputs (initial/boundary conditions) for WRF-Chem: UI-WRF-Chem
Anthropogenic-Emission
US-NEI 2011, 2014
WRF WRF-BC
Real Time
Meteorological/Soil boundary/initial Data (update
landtype, LAI, GVF, ALBEDO using MODIS data)
Chemical Boundary Data
Emission Data
Post-processing:-Parameter outputs
-Bias correction-Model evaluation
modules
WRF-Chem
FLAMBE (gas + aerosols)
GEOS-5 FP GEOS-5 MERRA-2
GLDAS/NLDASSoil moisture, etc.
Global-EDGAR Beijing-MEIC Taiwan
(“new mech”: Chem_opt = 900,901,902)
New Deve.
Corun scriptsReal-time Run
Delhi
Soil NOx emission
offline AOD calculation (GWC-AODpackage)
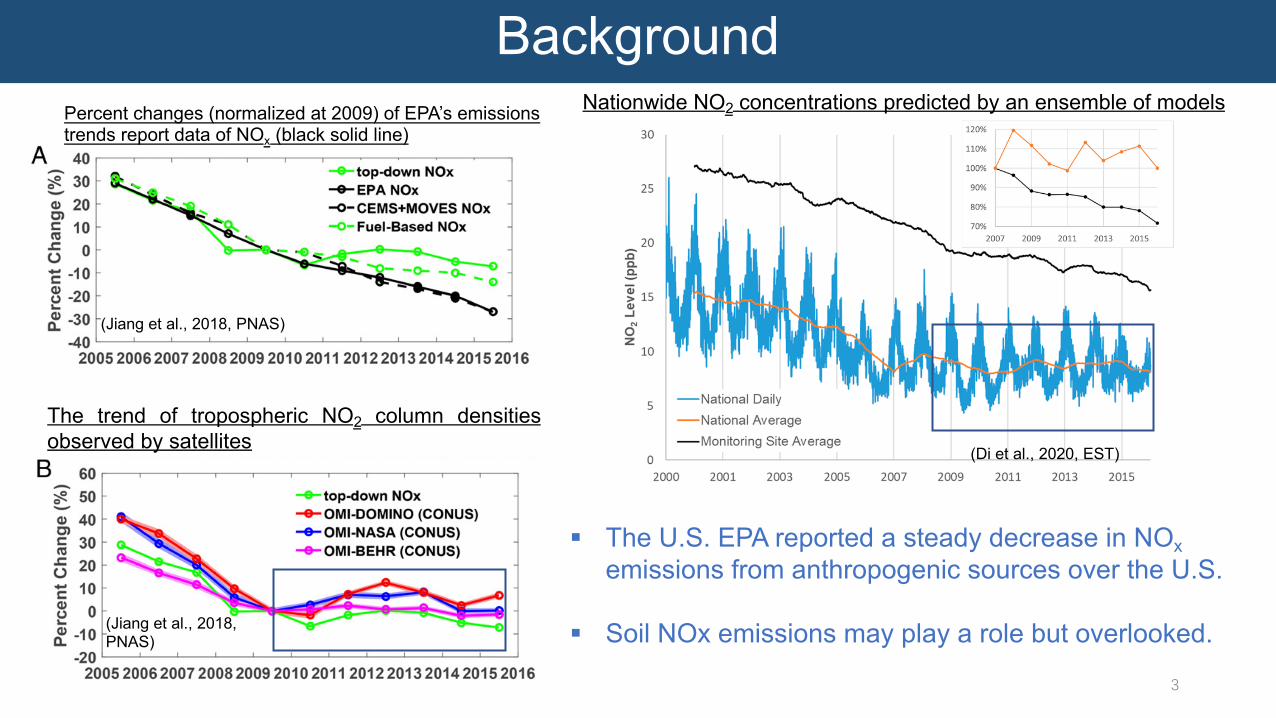
Percent changes (normalized at 2009) of EPA’s emissions trends report data of NOx (black solid line)
(Jiang et al., 2018, PNAS)
Background
§ The U.S. EPA reported a steady decrease in NOxemissions from anthropogenic sources over the U.S.
§ Soil NOx emissions may play a role but overlooked.
The trend of tropospheric NO2 column densitiesobserved by satellites
(Jiang et al., 2018, PNAS)
Nationwide NO2 concentrations predicted by an ensemble of models
(Di et al., 2020, EST)
3
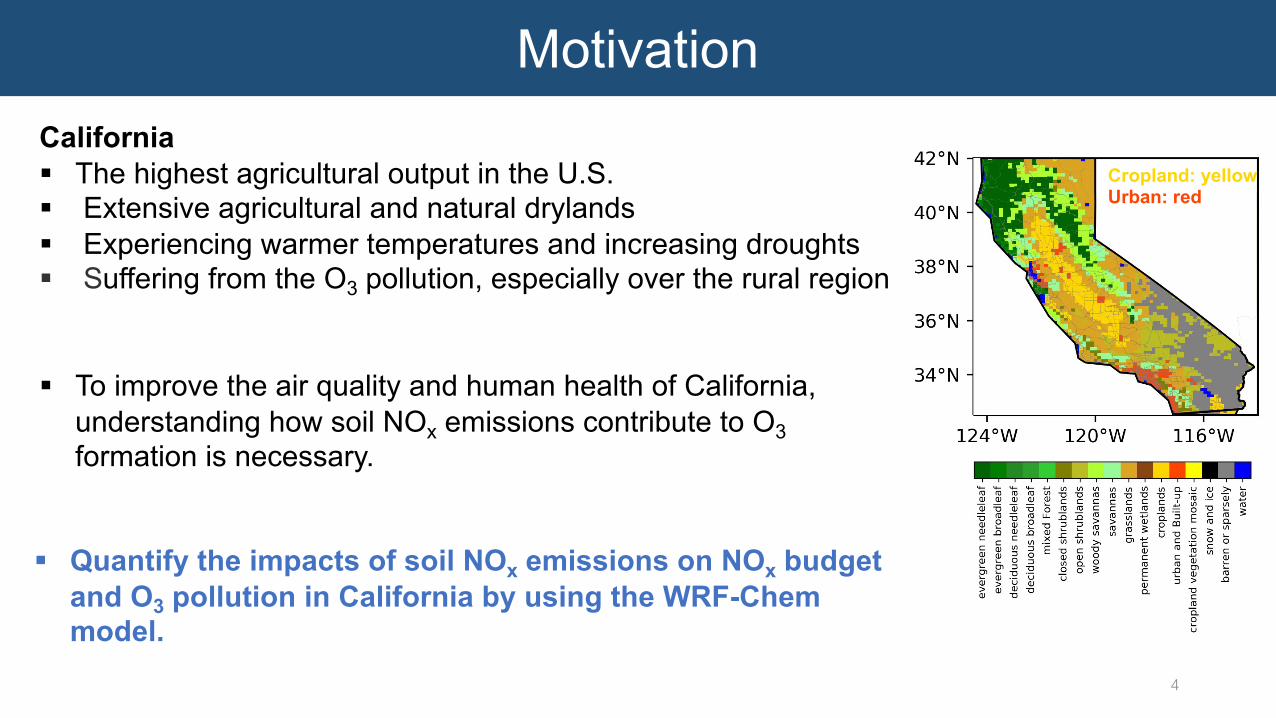
MotivationCalifornia§ The highest agricultural output in the U.S.§ Extensive agricultural and natural drylands§ Experiencing warmer temperatures and increasing droughts§ Suffering from the O3 pollution, especially over the rural region
Cropland: yellowUrban: red
§ To improve the air quality and human health of California, understanding how soil NOx emissions contribute to O3formation is necessary.
§ Quantify the impacts of soil NOx emissions on NOx budget and O3 pollution in California by using the WRF-Chem model.
4

Default soil NOx emission scheme in the WRF-Chem
MEGAN MEGAN biogenic emissions calculate online based on the weather, land use data.
𝑠𝑜𝑖𝑙 𝑁𝑂𝑥 𝑓𝑙𝑢𝑥 = 𝐴!"#"$×𝑓(𝑇)§ Aveget is a emission factor based on vegetation type (only four types: Broad leaf, Needle leaf,
Shrubs, Herbaceous biota)§ f(T) is a temperature response factor
5
Imperial Valley
§ Model underestimates soil NOx emissions (Oikawa et al., 2015, Nature Communications)

Implementation of the BDSNP (Hudman et al., 2012) with modifications:Berkley Dalhousie Iowa Soil NO Parameterization (BDISNP)
§ Land cover types: Updating the land cover types in WRF model by using the MODIS Land Cover Type (MCD12Q1) v6 in 2018 to reflect more diverse land covers
§ Surface temperature representation: Using the GLDAS data to predict the initial and boundary condition of soil moisture and temperature, and directly adopting soil temperature at the top layer to simulate soil NOx emissions
§ Climate zones distribution: Using the modelled green vegetation fraction (VGF) to determine the arid and non-arid region (due to the response of soil moisture factor depending on climate zones)
Updated soil NOx emission scheme in the WRF-Chem
6
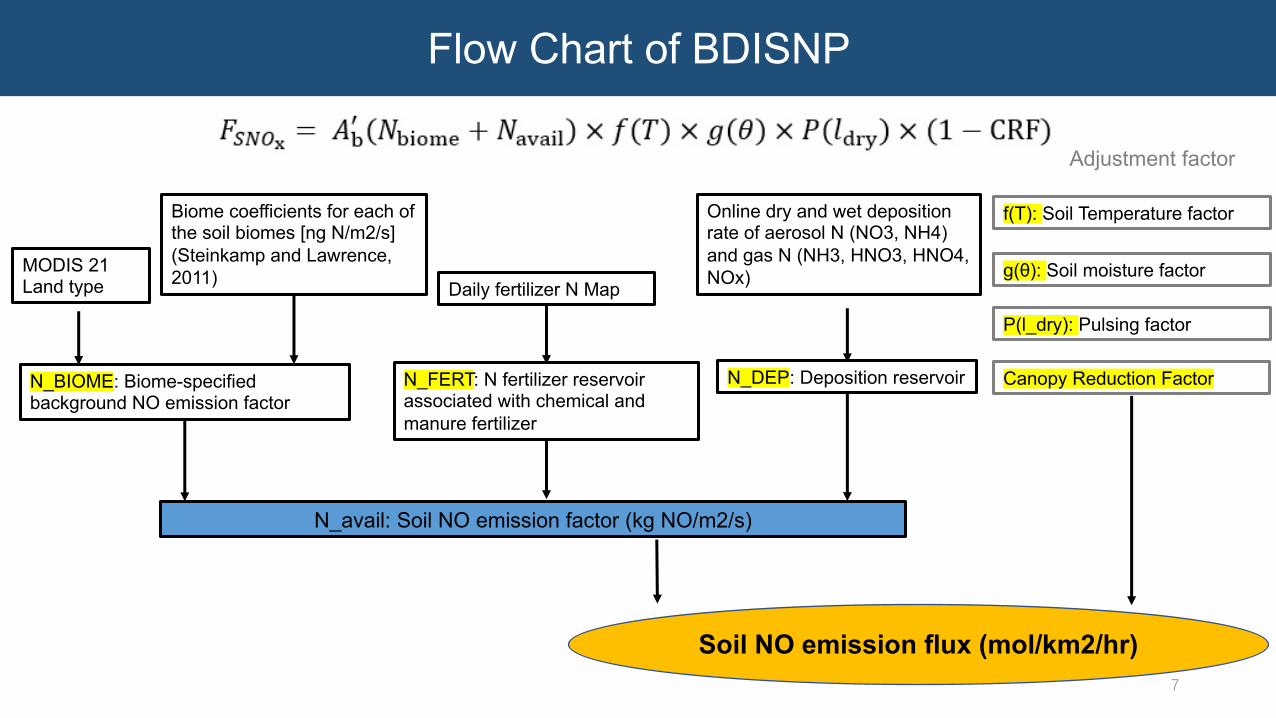
Flow Chart of BDISNP
N_BIOME: Biome-specified background NO emission factor
MODIS 21 Land type
Biome coefficients for each of the soil biomes [ng N/m2/s] (Steinkamp and Lawrence, 2011)
N_FERT: N fertilizer reservoir associated with chemical and manure fertilizer
Daily fertilizer N Map
Online dry and wet deposition rate of aerosol N (NO3, NH4) and gas N (NH3, HNO3, HNO4, NOx)
N_DEP: Deposition reservoir
N_avail: Soil NO emission factor (kg NO/m2/s)
f(T): Soil Temperature factor
g(θ): Soil moisture factor
P(l_dry): Pulsing factor
Canopy Reduction Factor
Soil NO emission flux (mol/km2/hr)
Adjustment factor
7
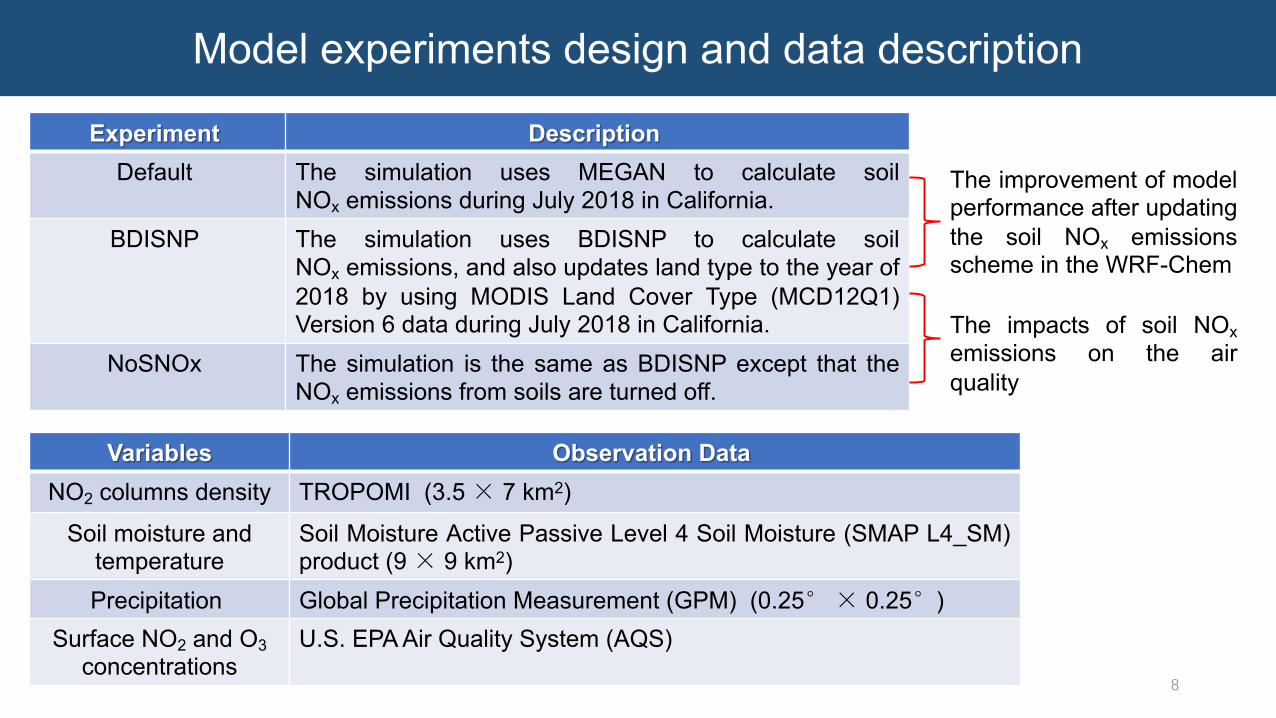
Model experiments design and data description
Experiment DescriptionDefault The simulation uses MEGAN to calculate soil
NOx emissions during July 2018 in California.BDISNP The simulation uses BDISNP to calculate soil
NOx emissions, and also updates land type to the year of2018 by using MODIS Land Cover Type (MCD12Q1)Version 6 data during July 2018 in California.
NoSNOx The simulation is the same as BDISNP except that theNOx emissions from soils are turned off.
The improvement of modelperformance after updatingthe soil NOx emissionsscheme in the WRF-Chem
The impacts of soil NOxemissions on the airquality
Variables Observation DataNO2 columns density TROPOMI (3.5× 7 km2)
Soil moisture and temperature
Soil Moisture Active Passive Level 4 Soil Moisture (SMAP L4_SM)product (9× 9 km2)
Precipitation Global Precipitation Measurement (GPM) (0.25°× 0.25°)Surface NO2 and O3
concentrationsU.S. EPA Air Quality System (AQS)
8
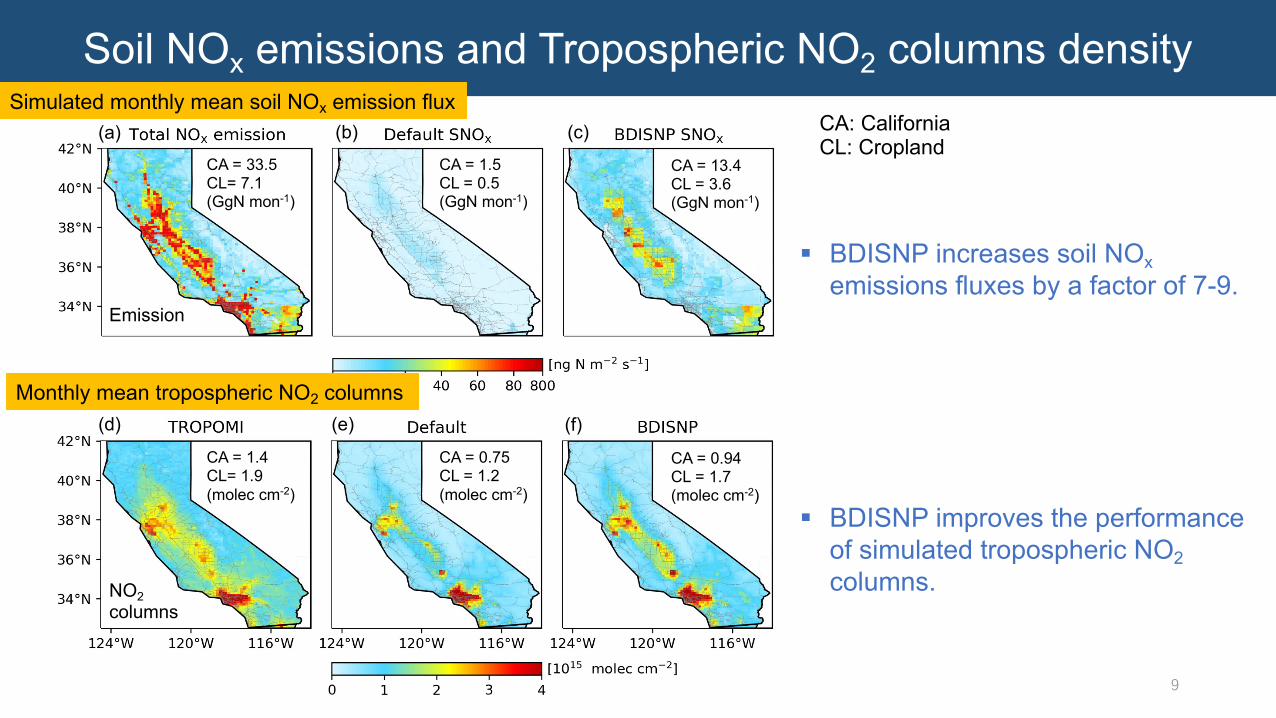
Soil NOx emissions and Tropospheric NO2 columns density
9
CA: CaliforniaCL: Cropland
(a) (c)(b)
(d)
Emission
NO2columns
(e) (f)
CA = 1.5CL = 0.5(GgN mon-1)
CA = 13.4CL = 3.6(GgN mon-1)
CA = 33.5CL= 7.1 (GgN mon-1)
CA = 0.75CL = 1.2(molec cm-2)
CA = 0.94CL = 1.7(molec cm-2)
CA = 1.4CL= 1.9(molec cm-2)
Simulated monthly mean soil NOx emission flux
Monthly mean tropospheric NO2 columns
§ BDISNP improves the performance of simulated tropospheric NO2columns.
§ BDISNP increases soil NOxemissions fluxes by a factor of 7-9.
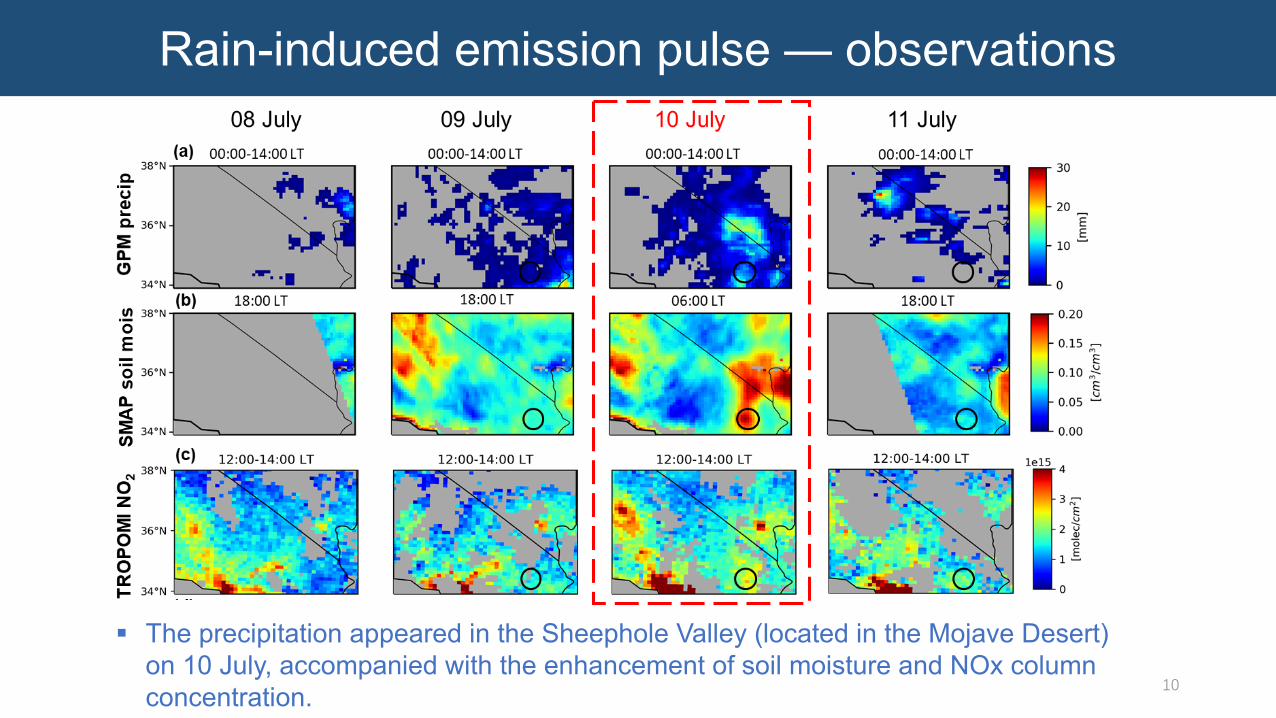
Rain-induced emission pulse — observations
§ The precipitation appeared in the Sheephole Valley (located in the Mojave Desert) on 10 July, accompanied with the enhancement of soil moisture and NOx column concentration. 10
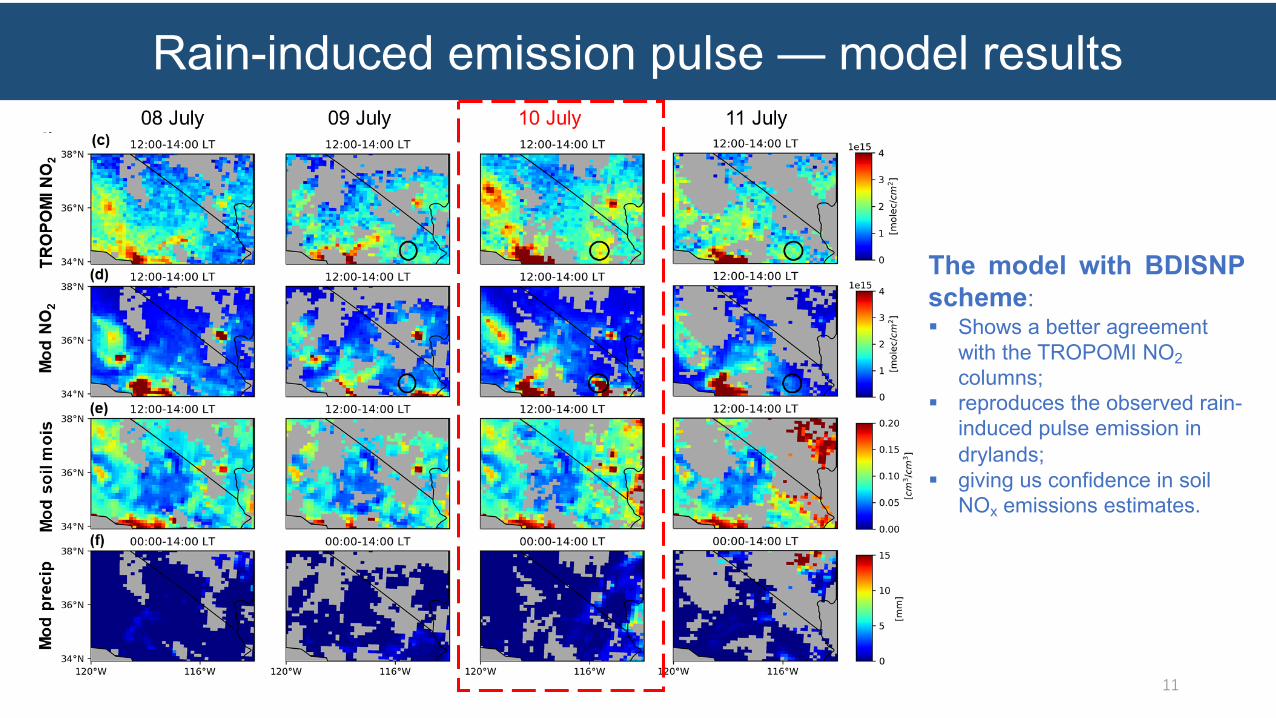
Rain-induced emission pulse — model results
11
The model with BDISNPscheme:§ Shows a better agreement
with the TROPOMI NO2columns;
§ reproduces the observed rain-induced pulse emission in drylands;
§ giving us confidence in soil NOx emissions estimates.

Impact of soil NOx emissions on air qualityDiurnal variation of simulated and observed surface NO2 and O3 concentrations in the rural area downwind from LA, California during July 2018
EPA NO2 (Green triangles) andO3 (purple dots ) measurement sites
§ BDISNP show a better agreement with the observed diurnal variation of NO2 and O3
12

Impact of soil NOx emissions on air qualityContribution of soil NOx to surface NO2 and O3
§ This rural region is NOx-limited and the air quality is sensitive to soil NOx emissions § Therefore, the intensive agriculture and dry desert soils associated with high SNOx in rural California could
lead to poor air quality13
Summary§ The model with BDISNP shows a better agreement with TROPOMI NO2 columns and can
reproduce the observed rain-induced pulse event of SNOx, giving us confidence in SNOxestimates.
§ 40.1% of the state’s total NOx emissions are from soils in July 2018, and SNOx could exceedanthropogenic sources over croplands, accounting for 50.7% of NOx emissions.
§ Such considerable SNOx enhance the monthly mean NO2 columns by 34.7% (53.3%) andsurface NO2 concentrations by 176.5% (114.0%), leading to an additional 23.0% (23.2%) ofsurface O3 concentration in California (cropland).
§ SNOx serves as an important source of atmospheric NOx in California, particularly in ruralregions with high fertilizer application but also in minimally managed native drylands, andshould be included in regulations to reduce adverse effects to air quality and humanhealth.
§ Acknowledgement: We thank National Science Foundation and the Department of Agriculture inthe U.S. for funding support.
14Sha, T.*, X. Ma, H. Zhang*, N. Janechek*, Y. Wang*, Y. Wang*, L. Castro*, G. Jenerette, J. Wang, Impacts of soil NOx emission on O3 air quality in rural California, Environmental Science & Technology, 55, 7113−7122, DOI: https://doi.org/10.1021/acs.est.0c06834, 2021.