impacts of regional trade agreements on international trade · impacts of regional trade agreements...
TRANSCRIPT

.
Impacts of regional trade agreements on international tradepatterns revisitedI
NGUYEN Duc Bao∗
GREThA - UMR CNRS 5113, Université de Bordeaux, Av Léon Duguit,
33608 Pessac Cedex, France
Abstract
This paper assesses the ex-post effects of seventeen regional trade agreements (RTAs) all overthe world based on a gravity model with solid theoretical foundations that involve the Andersonand van Wincoop’s multilateral resistance terms. The study covers 160 countries over the periodof 1960 through 2014. Over a long time span of 55 years, this period covers nearly all waves ofregionalism taking place on earth in the wake of the Second World War. We aim to explorewhether regional trading blocs around the world have stimulated trade among members as wellas trade with non-members or they have increased members’ trade to the detriment ofnon-members. The gravity model is estimated by a Poisson pseudo maximum likelihood(PPML) estimator with fixed effects to handle problems of zero trade flows and control forheteroskedasticity. The inclusion of various dummy variables for RTAs in the gravity modelallows us to correctly determine Vinerian trade creation and trade diversion effects in the wakeof the establishment of trading blocs. Our study is among the first efforts in the literature onRTAs effects that have used the PPML estimation technique to deal with the zero trade flowsand has taken into account the Anderson and van Wincoop’s multilateral resistance terms at onetime. The analysis finds that most RTAs lead to significant trade creation between members,along with trade diversion effects in terms of bloc exports and imports in many cases. RTAslocated in America and Europe appear to have more significant effects on intra-bloc trade aswell as on extra-bloc trade than Asian and African RTAs.
JEL classification: F10, F13, F15.
Keywords: gravity model, regional trade agreements, regional integration, trade creation, tradediversion.
IThis is only a preliminary version.∗Tel.: +33-678-55-07-05.Email address: [email protected] (NGUYEN Duc Bao)

1. Introduction
Regional trade agreements (RTAs) have rapidly proliferated around the world in recent years.As of July 2016, there are 267 RTAs had been notified to the World Trade Organization (WTO)and are currently in force. This type of trade agreement has become a key component oftrade policy for many countries around the globe. Balassa (1961) determined various formsof integration for RTAs, such as free trade areas, customs unions, common markets, economicunions and total economic integration. These forms of RTAs are based on different degreesof suppression of discrimination resulting from trade barriers and national economic programsamong member countries.
RTAs have always accompanied by the multilateral trading system. However, we havewitnessed since the early 1990s a development in the debate on the relationship betweenregionalism and multilateralism. When the Uruguay Round overcame many challenges in itsnegotiations before being finally signed in 1994, the number of RTAs entering into force hadsteadily increased since 1995 following the establishment of the WTO1. Several studiesconsider the proliferation of RTAs as a major challenge to the multilateral trade process.Bhagwati (1991) underlined that regionalism embodied a discriminatory characteristic andcould induce perverse effects. A steady increase in RTAs could also be detrimental tonon-members or the rest of the world (Baldwin, 1993). According to Bhagwati (1995),countries have a greater power will gain from the trade liberalisation while the smaller ones arelosing from it within regional groups, and the regionalism could also increase the risk ofconflicts between regional trading blocs.
Conversely, the regional trading system is perceived by others as a step towards thebreakthrough of multilateral trade liberalisation under the umbrella of the WTO. Summers(1991) argued that regional trade liberalisation generates an advance on multilateralism and itleads to more trade creation than trade diversion. Thus, the inclination of regional tradeintegration did not hinder the achievement of the Uruguay Round negotiations because thecountries that drove the multilateral trade system after the Second World War are the same onesthat promoted the regional trade liberalisation (Baldwin, 2004). Moreover, RTAs can alsoencourage foreign direct investment (Lawrence, 1996; Kimura and Ando, 2005; Freund andOrnelas, 2010), and economic growth in member countries through technological transfer.
The upsurge in RTAs throughout the world over the past two decades has resulted in theemergence of a dense, complex network of RTAs in which there are several overlappingagreements among the same trading partners. In the context of the multilateral trading system,RTAs are operated under the rules introduced by the WTO. It may seem that RTAs violate theMost-Favoured-Nation (MFN) principle, one of the most important pillars of the WTO, whichprohibits countries from discriminating between their trading partners2. However, RTAs areconsidered as an exception to the MFN obligation. In fact, the WTO rules lay down a legalframework for RTAs covering trade in goods: Article XXIV (GATT 1994) and paragraph 2(c)of the Enabling Clause (GATT 1979) . In this study, we will focus on the term "regional tradeagreements" used under the GATT/WTO rules, which takes into account agreements covering
1Acharya (2016) found that about three RTAs on average were notified per year during the General Agreement onTariffs and Trade (GATT) period (from 1948 to 1994) compared with the WTO period (since 1995) when on averagetwenty-five RTAs have been notified per year.
2The MFN requires that any trade advantages one country grants to another member must also be offered to all otherWTO members.
2
liberalisation of trade in goods: free trade areas and customs unions3.In the context of the growing trend towards regionalism, owing to the steady increase in the
number of RTAs established all over the world since the early 1990s, this paper will revisit theex-post effects of RTAs on the multilateral trading system over a long time span from 1960 until2014. This period covers nearly all waves of regionalism taking place on earth in the wake ofthe Second World War. We aim to study the impacts of several RTAs on their intra-bloc tradeand the tendency of member countries to trade with the rest of the world in the wake of theirformation. We thus explore whether regional trading blocs around the world have stimulatedtrade among members as well as trade with non-members or they have increased members’ tradeto the detriment of non-members.
The motivation for our study comes firstly from the renewed interest in the application ofgravity model to analyse bilateral trade flows, especially after the emergence of its more solidtheoretical foundation in the early 2000s. Over the past fifty years, the gravity equation hasbecome the most fruitful and dominant empirical framework for analysing international trade.The basic gravity model introduced by Tinbergen (1962) found that bilateral trade flowsbetween two trading partners depended on their countries’ incomes positively and bilateraldistance negatively. However, this model, which is inspired by Newton’s law of gravity, did nothave solid underpinnings in economic theory. Several authors have attempted to develop strongtheoretical foundations for the gravity model since the late 1970s4. Much improvement hasbeen achieved; more recently and more notably, Anderson and van Wincoop (2003) laid out andpopularised the solid theoretical framework of the gravity equation that takes into accountmultilateral resistance terms, as also introduced by the two authors.
On the other hand, questions have also been asked in the empirical literature about theappropriate formulation of variables in the gravity equation, mostly the dummy variables thatcan assess impacts of RTAs. There has been a revolution in the choice of dummy variables fora better examination of trade effects associated with RTAs regarding trade creation and tradediversion introduced by Viner (1950). Based on a static and partial equilibrium framework,Viner (1950) argued that an RTA did not necessarily enhance member countries’ welfare. Theauthor has taught us that RTAs, under the form of free trade areas or customs unions, are likely toproduce trade creation if member countries import more from efficient producers located in othermembers at the expense of less efficient producers in the domestic market. Accordingly, RTAsenhance efficiency from both sides regarding production and consumption and increase welfarefor member countries. By contrast, RTAs may lead to trade diversion as well, when memberstake the imports away from the most efficient suppliers (low-cost producers) in the rest of theworld and give them to inefficient suppliers (higher-cost producers) in other member countries.This situation leads to an inefficiency in global production, which is detrimental to the outsidersof RTAs. It can also be harmful to member countries when the consumer surplus is impossibleto outweigh the cost of the inefficiency in production.
The net effect of trade liberalisation following the formation of RTAs is ambiguous anddepends on whether the trade creation effect or the trade diversion effect is dominant5. Although
3These two terms are adopted in Article XXIV (GATT 1994).4see Anderson (1979); Helpman and Krugman (1985); Bergstrand (1989); Deardorff (1998); Baier and Bergstrand
(2001).5Viner (1950, p.44) states that: "Where the trade-creating force is predominant, one of the members at least must
benefit, both may benefit, two combined must have a net benefit, and the world at large benefits; but the outside worldloses, in the short-run at least.... Where the trade-diverting effect is predominant, one at least of the member countries is
3

Viner’s findings only focus on static impacts of RTAs and do not clearly address their netwelfare effects, his two principal concepts of trade creation and trade diversion havesignificantly inspired later theoretical and empirical studies on RTAs effects6. Since then, resultsfrom the empirical literature still have been quite mixed. In this paper, we will adopt the methodincluding three dummy variables for each RTA to adequately capture Vinerian trade effects.These dummy variables will explain the impacts of each RTA on intra-bloc trade, members’imports and members’ exports to the rest of the world.
Our motivation also comes from the question about the proper estimation techniques that canhandle the presence of zero trade, which arises prominently in trade data. The gravity model hasbeen widely estimated using cross-sectional approach or panel data approach. The latter methodemerged in the early 2000s and had been favoured by many researchers because it can alleviatethe problem of heterogeneity among the countries for which cross-sectional method is unable tocontrol. Most of the studies using cross-sectional data or panel data to assess the gravity modelfirst have to transform the model to log-linear form by taking logarithms and then estimate thelog-linear specification of the gravity model. However, this method is questionable since the log-linear model cannot determine observations concerning zero trade in bilateral trade flows. Byexcluding the meaningful insight about pairs of countries that do not trade with each other, thesestudies could generate biased results (Helpman et al., 2008). Particularly in the case of our study,when the proportion of zero trade reaches about 50% of total potential observations, the choiceof a proper estimation technique that can deal with the problem of zero trade is quite important.
As a result, what is the proper measure to which we can resort to assess the zero trade flows?In this paper, to overcome the zero trade problem, we will estimate the gravity equation byapplying the Poisson pseudo maximum likelihood (PPML) estimator proposed by Santos Silvaand Tenreyro (2006). Moreover, these authors also find that this approach is consistent in thepresence of heteroskedasticity in trade data. In this paper, we will show that PPML estimator withtime-varying country fixed effects can provide convincing results of RTAs effects on internationaltrade.
This study will contribute to the literature on the ex-post effects of RTAs concerning tradecreation and trade diversion using a larger sample of countries and RTAs, and a longer time spanthan most other empirical studies on this question. Our study is among the first efforts in theliterature on RTAs effects that use the PPML estimation technique to deal with the zero tradeflows and take into account the Anderson and van Wincoop’s multilateral resistance terms at onetime. Within the scope of our study, we cover most of the plurilateral RTAs in force in the worldand being notified to the WTO with a total of seventeen RTAs. We are able to capture the impactsof RTAs around the world and to observe the distinct trade patterns of RTAs located in differentgeographic regions on earth and formed by countries with various levels of development. Resultsfrom the PPML estimator suggest that in the wake of their entry into force, many RTAs havegenerated a significant increase in trade flows between member countries, yet many cases, withdetriment to the rest of the world. Moreover, RTAs located in America and Europe seem to havemore significant impacts on intra-bloc trade and extra-bloc trade than Asian and African RTAs.
bound to be injured, both may be injured, the two combined will suffer a net injury, and there will be injury to the outsideworld and to the world at large".
6Many authors have attempted to enhance the Vinerian theory and found that parts of Viner’s analysis were notcomplete and acute by introducing the elasticities of demand, the dynamic effects into the model or by taking intoaccount the enlargement of trading bloc over time, based on a partial equilibrium (Johnson, 1960) or a general equilibriumframework (Meade, 1955; Lipsey, 1970; Kemp and Wan, 1976).
4

The remainder of the paper is organised as follows. Section 2 summarises the empiricalliterature on RTAs effects. Section 3 briefly specifies our econometric approach, the gravitymodel and describes the data set. Section 4 presents our main empirical results involving theaverage effects of seventeen RTAs over the period of 1960-2014. Some robustness analysis isprovided in Section 5. Section 6 concludes and indicates some caveats in our paper.
2. Empirical literature reviews
Began with only one dummy variable to capture RTAs effects on intra-bloc trade, the workson RTAs impacts had been extended with the addition of a second and third dummy variables tomeasure RTAs effects on the trade of member countries with non-members. This improvementchanges the way researchers interpret the empirical results as they could assess more carefullythe trade creation and trade diversion effects following the creation of RTAs, as introduced byViner (1950). Effects on trade flows between regional blocs and the rest of the world resultingfrom the formation of RTAs are more clarified with the support of different regional dummyvariables. We demonstrate in this section the path of development in RTAs empirical analysisbased on the improvement in the set of regional dummy variables.
In the interest of evaluating the effects of an RTA on trade flows, many studies first enhancedthe basic gravity model by including a regional dummy variable to measure its effects on tradeflows between member countries. This dummy represents the sum of trade creation and tradediversion effects generated by the RTA. The results obtained in various studies including just oneregional dummy variable have been conflicting. Based on the cross-section gravity model, Aitken(1973), Brada and Méndez (1985) showed that the European Economic Community (EEC) hadsignificantly positive effects on trade flows between participating countries, while the works ofBergstrand (1985), Frankel et al. (1995) found insignificant effects in the same RTA. Meanwhile,Bayoumi and Eichengreen (1997) found significant effects regarding the enlargements of theEEC in the years of 1972, 1981 and 1986.
In the case of trading blocs in America, Frankel (1997) found that the North American FreeTrade Agreement (NAFTA) and the Southern Common Market (MERCOSUR) have positiveand significant impact on their intra-bloc trade by means of pooled estimation over the period of1970 through 1992, while the bloc effect of the ANDEAN Community is insignificant. Chengand Wall (2005) and Bussière et al. (2005) found that these RTAs all create a positive impact onintra-bloc trade based on panel data method. As regards the European Free Trade Association(EFTA), Frankel et al. (1995) showed that the coefficients for the bloc effect of the EFTA werenever significant during studying period, whereas Aitken (1973) found strong evidence that theintra-bloc trade between the EFTA members is above the expected levels predicted from thegravity model following the formation of the bloc, although both studies applied cross-sectionaldata.
Since the studies including only a single regional dummy variable were not capable ofcapturing the effect of an RTA on trade flows between bloc members and non-members, manyempirical studies, in the late 1990s, have added a second regional dummy variable to measure it.This dummy is a binary variable assuming the value of 1 if one of the two countries in a bilateralcountry-pair participates in a given RTA and the other does not, and 0 otherwise. Frankel (1997)indicates that this variable accounts for the level of openness of RTAs. Studies can identify thetrade creation and trade diversion effects separately of an RTA, thanks to the combination ofthe former regional dummy variable and the second one. In the case when the formation of anRTA leads to an increase in intra-bloc trade and also promotes extra-bloc trade or keeps the latter
5

unchanged, this RTA is likely to have trade creation effect. On the other hand, if an RTA increasestrade flows between member countries to the detriment of their trade flows with the outsiders, itseems to induce trade diversion effect since the intra-bloc trade can substitute for the trade flowscoming from non-members.
When the openness term of RTAs is taken into account, Frankel (1997) found significantnegative coefficient estimates for trade between members and non-members in the cases of theEFTA and the NAFTA, along with significant and positive coefficient estimates for intra-bloctrade. The author also found that the MERCOSUR and the free trade area by the Association ofSouth East Asian Nations (ASEAN) have an increase in propensity to trade with non-membersbecause the estimated coefficients of both regional dummy variables are positive. For the EEC,Frankel (1997) showed that in 1980 and 1985, the EEC members are more open to trade with therest of the world than one would predict from the standard gravity variables through the opennesscoefficient highly significant and positive. By contrast, Bayoumi and Eichengreen (1997) foundevidence of negative effects on extra-bloc trade following the formation of the EEC in the 1960s.Lee and Park (2005) showed that the European Union (EU), the NAFTA, the MERCOSUR leadto an increase in extra-bloc trade and greater progress in trade between member countries usingpanel data, whereas the Central American Common Market (CACM) and the Common Marketfor Eastern and Southern Africa (COMESA) contribute to a significant decrease in extra-bloctrade.
Nonetheless, studies including these two dummy variables seldom precisely identify the tradecreation and trade diversion effects for RTAs. Since the dummy variable for the level of openness(extra-bloc trade) covers both of members’ total exports and imports of goods, it is not capable ofseparating the impact of the trading bloc on the extra-bloc trade regarding exports from the oneregarding imports. As Soloaga and Winters (2001) noted, the import and export flows of membercountries may come after different paths. When an RTA improves their trade with non-membercountries, the gravity model with two regional dummy variables cannot identify whether thiseffect comes from the exports towards the rest of the world or the imports from non-members.Similarly, this problem also arises when an RTA has negative effects on extra-bloc trade.
The most recent studies since the 2000s have once again extended the model by including athird regional dummy variable to create a set of three dummy variables individualised for eachRTA. Among these three variables, one will measure the intra-bloc trade between participatingcountries, the second one will try to explain the export flows of member countries towards non-members, and the third one will capture the import flows from the rest of the world reachingmember countries. The last two dummies seek to indicate the level of overall openness for thetrading bloc in terms of export and import flows.
For the purpose of interpreting the effects of a given RTA, these studies need to compare thevalue of coefficient estimate for intra-bloc trade and the ones for the extra-bloc trade regardingexports and imports. As a result, when an RTA induces an increase in intra-bloc trade (a positivecoefficient) combining with an increase in extra-bloc trade in terms of exports or imports withnon-members (a positive coefficient for extra-bloc exports or imports), it can be identified astrade creation regarding export flows or import flows, respectively. By contrast, if an increasein intra-bloc trade combines with a decline in extra-bloc trade regarding exports or imports (anegative coefficient for extra-bloc exports or imports), this situation will be determined by exportdiversion effect or import diversion effect, respectively. Moreover, as regards the effects of RTAson welfare, one can identify an RTA as being harmful to non-members when the coefficientfor the extra-bloc trade regarding exports to non-members is negative, which leads to a fallinginclination of member countries to ship their goods to the rest of the world. As a result, it
6

results in welfare losses for the outsiders. On the other hand, supposing the producers withinan RTA cost more to produce goods than those in the rest of the world, it means an inefficiencyin the allocation of resources in the world, which is also detrimental to the outsiders of RTAs(Trotignon, 2010).
Results from the empirical literature involving RTAs impacts on extra-bloc trade in termsof bloc exports and imports have also been mixed. Soloaga and Winters (2001), in a cross-section study, found the presence of export diversion effect in the cases of the EU and the EFTA,whereas Carrère (2006) and Trotignon (2010) found an increase in the propensity of the EU toexport to the rest of the world employing the panel data approach. Meanwhile, Endoh (1999)pointed to trade creation effect in the EEC over the period 1960-1994 through all three channels:intra-bloc trade, extra-bloc trade in terms of exports and imports as well. For the ANDEANCommunity, the MERCOSUR, the NAFTA and the ASEAN, Carrère (2006) showed a fallingpropensity to import from the rest of the world in the wake of the formation of these RTAs, whileTrotignon (2010) found opposite effects as the author demonstrated an increase in extra-bloctrade regarding imports coming from non-members. Although the two authors both use panelgravity model, their studies can lead to very conflicting results due to the discrepancy of specificeffects included in their panel gravity model.
In sum, many studies have distinctly contributed to the evolution in the empirical analysis ofRTAs effects on international trade through the development of the set of regional dummyvariables: from single dummy to three dummies. According to our objective, this paper isreasonably in line with those studies including the set of three regional dummy variablesindividualised for each RTA, which is the most recent development in the set of RTAs dummyvariables. As regards the empirical studies that include three regional dummy variables, most ofthem agree on trade creation effects regarding the intra-bloc trade following the creation ofRTAs. Nonetheless, they split over the RTAs impacts on extra-bloc trade. Soloaga and Winters(2001) and Carrère (2006) show trade diversion effects in terms of bloc exports and imports formost RTAs, whereas Trotignon (2010) finds trade creation effects regarding the extra-bloc tradefor a majority of RTAs. These mixed results stem mostly from differences between these studiesregarding the studying period, the sample of countries as well as the choice of explanatoryvariables and estimation techniques.
3. Methodology and data
Pursuing a study including the set of three RTA dummy variables, we will evaluate theimpacts of seventeen RTAs in all over the world on intra-bloc trade and members’ trade withthe rest of the world. Having created a data set involving 160 potential trading partners from1960-2014, we want to estimate these RTAs effects by applying the PPML estimator both inthe traditional gravity equation and in a gravity equation that takes into account the Andersonand van Wincoop’s multilateral resistance terms. In Section 3.1, we present our econometrictechniques and the fundamental problems in the gravity model. In Section 3.2, we introduce thegravity model. In Section 3.3, we describe our data set.
3.1. Econometric approach
Studies on RTAs ex-post effects have lately encountered two main problems in the gravitymodel. The first one concerns zero trade flows between country pairs. On the one hand, some ofthe zero trade flows reflect a random rounding error or random missing data. They may also come
7

from the systematic rounding of very low reported values of bilateral trade. On the other hand,zero trade flows remaining in the database may naturally originate from the fact that bilateraltrade does not exist over a period due to the remoteness of those countries, to the prohibitivetransport costs or the small size of the economies, as argued by Frankel (1997), Santos Silva andTenreyro (2006), and Helpman et al. (2008). Martin and Pham (2015) also found that most ofthe bilateral trade flows in aggregate trade data display a real absence of trade. The problem ofzero trade flows is quite serious since almost 50% of the total observations on bilateral trade arezero in the data set used by Santos Silva and Tenreyro (2006), Helpman et al. (2008), and Burgeret al. (2009). As a result, one need to take the problem of zero trade flows more seriously byusing proper econometric techniques.
The conventional method for estimating gravity model is to keep the model in log-linearform. However, this approach is inappropriate as the log-linearised model is infeasible in thecase of observations involving zero trade flow because the natural logarithm of zero is undefined.Hence, several ways have been proposed in the empirical literature to handle the zero trade flowsproblem. One of the most prevalent ways is simply excluding zero trade from the data set andthen estimating the gravity model on a truncated database of country pairs that consists of onlypositive bilateral trade flows. By omitting observations with zero trade, this method overlooksinteresting and useful insight into the real nature of zero trade between countries and inducesserious problems and biased results, since these zero trade flows are generally not randomlydetermined, as shown by Burger et al. (2009) and Martin and Pham (2015).
Other studies choose to do not exclude zero trade flows, but use some transformationinvolving the dependent variable, for instance, adding a small number to the zero tradeobservation (value of 1 in most cases) before taking logarithms. Another method uses a tobitmodel and keeps the observations involving zero trade. Santos Silva and Tenreyro (2006)argued that these methods will induce inconsistent estimates in the case when theconstant-elasticity model is used. They also pointed out that the standard methods used toestimate gravity models can lead to misleading estimated coefficients in the presence ofheteroskedasticity, which appears inherently in trade data. If the problem of heteroskedasticityrises in the multiplicative model, its transformation into log-linear form can lead to a moresevere bias in the estimated elasticities. Hence, they do not recommend to estimate the gravitymodel based on a log-linearised version.
According to Santos Silva and Tenreyro (2006), the PPML estimator is a natural methodto solve the problem of zero trade flows. Especially, they found that the performance of thePPML estimator is not affected when the proportion of the dependent variable with zero trade issubstantial. Since the gravity model is directly estimated from its multiplicative form, where thedependent variable is measured in levels, instead of linearising the model by using logarithms,the zero trade problem is well handled. Moreover, they found that the PPML method seems toyield more robust and consistent results than the other econometric techniques in the presenceof heteroskedasticity. Several recent empirical analyses on gravity model have included PPMLmethod and praised the estimator as one of the new workhorses to assess international trade, suchas Westerlund and Wilhelmsson (2011), Anderson and Yotov (2012), Martin and Pham (2015).
The second problem that many analyses on trade policies have encountered in the gravitymodel involves the issue of potential endogeneity of RTAs when there is potential reversecausality between RTAs and a higher level of bilateral trade between country pairs. Accordingto the hypothesis of "natural trading partners" or "natural trading blocs" introduced by Krugman(1991), countries show a propensity to form RTAs with other partner countries where there arepotentially higher trade volumes between them. Furthermore, there still are many unobserved
8

factors between country pairs that may increase bilateral trade and promote the establishment ofan RTA concurrently. As a result, the estimated coefficients are likely biased since the RTAdummy variables featuring the existence of the trade agreement are potentially correlated withthe error term in the gravity equation.
A majority of empirical studies using cross-sectional data and including dummy variablesfor trade agreements do not take account of the issue of RTA endogeneity. In the past literature,Trefler (1993) and Lee and Swagel (1997) are the first works that attempt to adjust for theendogeneity of trade policies on a cross-section framework by using instrumental variables7.By contrast, Magee (2003) recently finds that instrumental-variables approach does not appearefficient at adjusting the issue of endogeneity bias of the RTA dummy variable that has binaryform, and it is hard to find instruments that are not likely correlated with the error term of thegravity equation.
An alternative method of handling the potential endogeneity issue with RTAs is to estimatethe gravity model including both bilateral fixed effects for country pairs and time-varying fixedeffects for exporter and importer countries8. According to Baier and Bergstrand (2007), this fixedeffects specification can deal with the issue of RTA endogeneity bias because it is able to betterdeal with the unobserved heterogeneity among pairs of countries, which are one of the mostimportant sources of the endogeneity problem related to RTAs. In addition, Head and Mayer(2013) found that due to lacking adequate instrumental variables, panel data method includingcountry-pair fixed effects can control for part of potential RTA endogeneity bias. Filippini andMolini (2003) likewise used country-pairs fixed effects model and found that long-term data donot have endogeneity problem and produces unbiased results.
With the help of the PPML estimator suggested by Santos Silva and Tenreyro (2006), ourstudy will try to tackle these two significant problems in the gravity model.
3.2. Gravity methodologyTo estimate the effects of RTAs, we use the basic gravity equation that has usually been used
in international trade analysis and then, we augment the model with our dummy variables forseventeen RTAs. Our gravity model determines the trade flow between an exporter country andan importer country on a bilateral basis by the following equation:
Xi jt =βO(GDPit)β1 (GDP jt)β2 (DIS Ti j)β3 eβ4(LANGi j)eβ5(CONT IGi j)
× eαintra(RT A_intrai jt)eαX (RT A_Xi jt)eαM (RT A_Mi jt)ψi jt(1)
where the variables are defined as:
• Xi jt is the value of trade flow in terms of goods in current dollar values from exportercountry i to importer country j at time t.
• GDPit and GDP jt are the current dollar value of the gross domestic product (GDP) incountry i and country j, respectively at time t. The impact of these two variables onbilateral trade flows is expected to be positive.
7Trefler (1993) and Lee and Swagel (1997) concluded that the impacts of trade liberalisation policies tend to beunderestimated without considering instrumental variables.
8Baier and Bergstrand (2007) includes bilateral fixed effects to control for the unobserved time-invariant variablesamong country pairs and time-varying fixed effects for both exporter and importer countries to control for the Andersonand van Wincoop’s multilateral resistance terms.
9

• DIS Ti j is the distance measured in kilometres between country i and trading partner j.The impact of this variable on trade flows is expected to be negative.
• LANGi j is a binary variable which takes the value of 1 if i and j share a common language,and 0 otherwise. The effect of this dummy variable is expected to be positive, given thata common language between two trading partners could facilitate trade deals and thus,reduce trade costs.
• CONT IGi j is a binary variable which takes the value of 1 if i and j have a commonland border, and 0 otherwise. The effect of sharing a common land border between twocountries is likely to be positive on bilateral trade flows.
• RT A_intrai jt assumes the value of 1 if both trading partners i and j have joined the sameRTA at time t, and 0 otherwise. This dummy variable tests intra-bloc trade.
• RT A_Xi jt assumes the value of 1 if exporter country i belongs to an RTA in which importercountry j do not participate at time t, and 0 otherwise. This dummy variable captures theimpact of the bloc exports to the rest of the world.
• RT A_Mi jt assumes the value of 1 if importer country j belongs to an RTA in which exportercountry i do not participate at time t, and 0 otherwise. This dummy variable tests the impactof the bloc imports coming from the rest of the world.
• e is the natural logarithm base, and ψi jt denotes error term.
The traditional approach to estimating equation (1) in the literature is to transform it to linearmodel by taking logarithms, leading to the following equation:
ln Xi jt =βO + β1 ln (GDPit) + β2 ln (GDP jt) + β3 ln (DIS Ti j) + β4(LANGi j)+ β5(CONT IGi j) + αintra(RT A_intrai jt) + αX(RT A_Xi jt)+ αM(RT A_Mi jt) + εi jt
(2)
where εi jt (= lnψi jt) is the error term of equation (1). The log-linearised model is only feasiblewhenever Xi jt > 0. Thus, the log transformation struggles with observations involving Xi jt = 0because the natural logarithm of zero cannot be determined.
As explained in the previous section, our study applies the PPML estimator to deal withthe challenges which the log-linear gravity equation has failed to overcome. Thus, the PPMLtechnique is used to estimate the following gravity model:
Xi jt = exp(βO + β1 ln (GDPit) + β2 ln (GDP jt) + β3 ln (DIS Ti j) + β4(LANGi j)
+ β5(CONT IGi j) + αintra(RT A_intrai jt) + αX(RT A_Xi jt)
+ αM(RT A_Mi jt) + εi jt
) (3)
The equation (1) is only an augmented version of the traditional gravity model introducedby Tinbergen (1962) that lacks solid theoretical foundation. In the early 2000s, Anderson andvan Wincoop (2003) concluded their remarkable work by introducing the multilateral resistanceterms. According to the two authors, the three trade resistance factors in international trade are,therefore, the bilateral trade barriers, the exporter country’s trade resistance towards all otherdestinations as well as the importer country’s trade resistance towards all other trading partners.
10

To carry out an easier computational method for taking into account these multilateralresistance terms variables, Anderson and van Wincoop (2003) and Feenstra (2004) suggest theestimation of equation (1) by using time-variant fixed effects for both exporter and importercountries. This type of fixed effects can produce unbiased results concerning coefficientsestimates of β0, β3, β4, β5, αintra, αX and αM
9.To specify the theoretically-motivated gravity equation including the Anderson and van
Wincoop’s multilateral resistance terms and adapting to the PPML estimator, equation (3) maybe written as follows:
Xi jt = exp(βO + β1 ln (GDPit) + β2 ln (GDP jt) + β3 ln (DIS Ti j) + β4(LANGi j)
+ β5(CONT IGi j) + αintra(RT A_intrai jt) + αX(RT A_Xi jt)
+ αM(RT A_Mi jt) + λit + λ jt + εi jt
) (4)
where λit and λ jt are time-varying exporter and importer fixed effects, respectively. Note thatequation (4) may be augmented with bilateral fixed effects λi j to control for the unobservedfactors within country pairs and to overcome the problem of potential endogeneity of RTAs.
We now return to our prime variables of interest: the set of three RTA dummy variables.It allows us to assess a precise identification of RTAs trade effects introduced by Viner (1950)on their member countries and multilateral trading system. To capture the trade creation andtrade diversion effects of a specific RTA, we need to examine the signs of the coefficients ofthese RTA variables, which are αintra, αX and αM , respectively. Consider that αintra > 0, whichmeans that the formation of an RTA stimulates intra-bloc trade creation effects between membercountries. In this case, there is additional trade induced by both member countries joining in theRTA. Precisely, the domestic production of member countries or the bloc imports coming fromthe rest of the world can be substituted with the increase in intra-bloc trade resulting from theformation of the RTA. Thus, the coefficients αX and αM will determine the trade creation andtrade diversion effects for a specific RTA. We demonstrate our method of analysing the signs ofRTA coefficients, inspired by Soloaga and Winters (2001), Carrère (2006) and Trotignon (2010),in Table 1 as follows.
Table 1: Trade creation and Trade diversion effects based on sign of RTA coefficientsSign of RTA coefficients Trade creation and trade diversion effectsαintra αX αM
>0 >0 >0 Intra-bloc trade creation / Export creation / Import creation
>0 >0 <0 Intra-bloc trade creation / Export creation / Import diversion (when αintra > |αM |)Export creation / Import diversion (when αintra < |αM |)
>0 <0 >0 Intra-bloc trade creation / Export diversion / Import creation (when αintra > |αX |)Export diversion / Import creation (when αintra < |αX |)
>0 <0 <0 Intra-bloc trade creation / Export diversion / Import diversion (when αintra > |αX + αM |)Export diversion / Import diversion (when αintra < |αX + αM |)
Source: Trotignon (2010).
In sum, when αintra > 0 combines with αX > 0 (αM > 0), it indicates trade creation in termsof bloc exports to the rest of the world and bloc imports from the rest of the world. αintra >0, coupled with αX < 0 or αM < 0, displays trade diversion regarding bloc exports or bloc
9β1 and β2 are no longer determined because exporter and importer fixed effects are time varying.
11

imports. The term "export creation/diversion" is used for illustrating higher/lower trade whenthe exporter country is a member of the RTA and the importer country is not, whereas "importcreation/diversion" is used for increased/reduced trade when the importer country belongs tothe RTA in which the exporter country do not participate. If αX and αM are both negative, weneed to compare the value of αintra with the absolute value of the sum of αX and αM to examinewhether the trade diversion regarding bloc exports and bloc imports can completely outweighthe intra-bloc trade creation (in the case when αintra < |αX + αM |). Besides, studying the signs ofRTA coefficients also helps us to assess welfare for non-members. For instance, when αintra > 0combines with αX < 0, we could figure out a decrease in welfare for non-members throughexport diversion effect.
3.3. Data
The model is estimated based on a data set including 160 countries over the period of 1960through 2014. Appendix A enumerates the countries used in our study. These countries, onaverage, accounted for over 95% of total trade in the world over the period of 55 years.Nominal bilateral trade data are collected from the International Monetary Fund’s (IMF)Direction of Trade Statistics. Nominal GDPs are from Head et al. (2010) and the World Bank’sWorld Development Indicators. The set of control variables involving geographical and culturalcharacteristics, such as bilateral distance, contiguity, common language, are sourced from theCEPII gravity database. Dummy variables for RTAs are created from the WTO Regional TradeAgreements Information System (RTA-IS)10 complemented with the database of Head et al.(2010), and Baier and Bergstrand (2007). In our paper, we include only full (no partial) RTAscovering liberalisation of trade in goods that are notified to the GATT/WTO under GATTArticle XXIV or the Enabling Clause for developing countries, which are free trade agreementsand customs unions. The date when a given RTA enters into force is used to define whether thedummies for this RTA will take the value of 1 or 0.
To capture impacts of the wave of regionalism on the multilateral trading system around theworld, we consider seventeen RTAs that exist in different regions. Many of them were eithercreated or revamped during the late 1980 and early 1990s, such as the ASEAN Free TradeAgreement, the NAFTA, the MERCOSUR, the ANDEAN Community, the Central AmericanCommon Market (CACM). During the 1990s and 2000s, we also witnessed the great extensionof the EU along with the reduction in membership of the EFTA, and the establishment of otherRTAs located mainly in Africa, Asia and Central Africa. The lists of all RTAs and countriesincluded in our study are provided in Appendix B.
Since this paper takes into account uni-directional trade flows as suggested by Baldwin andTaglioni (2006) rather than the average of the two-way exports, our data set presents a panelstructure consisting of a total of 1,399,200 ((160 x 159) x 55) potential annual observationsfor 25,440 pairs of countries. Once the missing values are taken out, our sample covers thus1,136,548 observations.
Comparing to other empirical studies involving the assessment of RTAs effects oninternational trade, our work has a fairly large sample. Also based on the IMF’s Direction ofTrade Statistics, Frankel (1997) pooled data from 1970 through 1992 with five-year intervalsand examined a total of 6,102 observations; Baier and Bergstrand (2007) has a sample of 47,081observations covering 96 countries from 1960 to 2000 at five-year intervals. Carrère (2006)
10rtais.wto.org/UI/PublicMaintainRTAHome.aspx12

assesses RTAs impacts with a sample comprising 240,691 observations over the period1962-1996 and trade data sourced from UN COMTRADE. We describe the descriptive statisticsof variables in Table 2 as below.
Table 2: Summary statistics
Variables N Mean Standard Deviation Min MaxXi jt 1,377,473 1.950×10⁸ 2.939×10⁹ 0 4.668×10¹¹
GDPit 1,262,937 1.667×10¹¹ 8.225×10¹¹ 1.159×10⁷ 1.742×10¹³
GDP jt 1,262,937 1.667×10¹¹ 8.225×10¹¹ 1.159×10⁷ 1.742×10¹³
lnGDPit 1,262,937 22.930 2.497 16.267 30.489lnGDP jt 1,262,937 22.930 2.497 16.267 30.489DISTi j 1,399,200 7,789 4,446 60.77 19,650lnDISTi j 1,399,200 8.736 0.766 4.107 9.886CONTIGi j 1,399,200 0.018 0.132 0 1LANGi j 1,399,200 0.152 0.359 0 1RTA_intrai jt
* 1,399,200 0.023 0.149 0 1RTA_Xi jt
* 1,399,200 0.355 0.479 0 1RTA_Mi jt
* 1,399,200 0.355 0.479 0 1* RTA_intrai jt , RTA_Xi jt and RTA_Mi jt represent the total observations involving seventeen selected RTAs
for intra-bloc trade flows, bloc exports and bloc imports related to the rest of the world.
Table 2 suggests that an exporter country trades with an importer country an average ofapproximately 195.2 million in current US dollars over 55 years from 1960 to 2014. The highestvalue of export flows in the database corresponds to the exports from China to the United Statesin 2014 (466.8 billion in current US dollars). As regards the value of exporter and importerGDPs, over 100,000 observations have missing values due to either unreported GDP of somesmall countries in a period of time or obviously unrecorded GDP of countries prior to theirindependence. The average distance between pairs of countries is about 7,700 kilometres. Thedata set also shows that 15.2% country pairs share a common language and only 1.8% countrypairs have a common land border. Of all the observations, 31,644 observations (about 2.3%)belong to an RTA included in our sample of seventeen RTAs, that corresponds to 1,640 countrypairs (about 6.5%) on the country-pairs level. Among these seventeen RTAs, the EU involvesthe most member countries with 27 countries included and covers 11,910 observations over atime span of 55 years, whereas the Australia-New Zealand Closer Economic Relations TradeAgreement (ANZCERTA) involves only two country pairs in terms of uni-directional trade flowsand covers the least observations (64 observations).
As regards the issue of zero trade flows in our data set, approximately 50.5% of theobservations are zero (Xi jt = 0)11. This proportion of zero trade is similar to other empiricalstudies. For instance, 47.6% of the observations in Santos Silva and Tenreyro (2006), and abouthalf of the observations in Helpman et al. (2008) and Burger et al. (2009) involve zero tradeflows. Table 3 features the patterns of zero trade flows in the data set based on a set of bilateraldistance and sets of exporter and importer GDPs. We find that smaller countries tend to exportto a much smaller number of partner countries than others since the percentage of zero tradeflows are higher in the set of the 1st to the 33th percentile of exporter GDP and importer GDP
11Note that in the case of missing values in trade flows between exporter and importer countries for over ten consecutiveyears, we consider them as zero trade flows.
13

(72.79% and 66.98%, respectively) than one in the set of the 66th to the 99th percentile whichcorresponds to countries having greater GDP. In addition, countries are more likely to export topartner countries located not far away because the percentage of zero trade flows increases withbilateral distance. The findings from our data set are in line with the literature as bilateral tradeis likely absent among small and remote countries due to prohibitive trade costs.
Table 3: Percentage of zero trade flows in the total number of possibleexport flows
Distance Exporter GDP Importer GDP1st to 33th percentile 43.04% 72.79% 66.98%
34th to 66th percentile 51.28% 47.33% 49.06%67th to 99th percentile 57.32% 36.69% 39.70%
Source: Author’s calculation.
Figure 1a as follows shows a histogram and a kernel density plot for the proportion of zeroin the exports of 160 countries included in our study. Among them, 18 countries have total zerotrade flows under 15% of their potential export flows with trading partners from 1960 through2014. All of these countries are developed countries. Nonetheless, the majority of countries havezero trade flows in terms of exports with around 40% to 70% of their potential partner countries.
05
1015
20N
umbe
r of
cou
ntrie
s
0 10 20 30 40 50 60 70 80 90Percentage of zero trade flows
Note: The kernel density estimate is plotted using the Epanechnikov kernel with bandwidth 7.4326
(a) On country-level export
010
0020
0030
0040
0050
00N
umbe
r of
cou
ntry
-pai
rs
0 20 40 60 80 100Percentage of zero trade flows
Note: The kernel density estimate is plotted using the Epanechnikov kernel with bandwidth 4.1232
(b) On country-pairs-level export
Figure 1: Proportion of zero trade over the period 1960-2014
On the country-pairs level, Figure 1b presents a histogram and a kernel density plot forthe proportion of zero exports involving 25,400 country pairs. There are 3,975 country pairscompletely having no zero trade flows over 55 years, and about 49% of the total country pairshave zero trade flows between 60% to 100%. In particular, we find that 2,399 country pairs, mostof which involve small countries and remote from each other, have zero trade entirely duringthe studying period. Also, Figure 1b shows that zero trade flows are nonrandomly distributed,as expected from trade theory. In sum, the data set used in this paper suggests again that theissue of zero trade flows is quite crucial with 50.5% of the observations having zero trade flows.Thus, it justifies the need to handle the zero trade problem in order to gather valuable information
14

contained in zero trade data.
4. Empirical results
We present the average impacts of each RTA over the period of 1960 through 2014 based onboth the traditional gravity model and the gravity model including strong theoretical foundations,which controls for the multilateral resistance terms. We first carry out some preliminary tests tocheck for the presence of specific effects and heteroskedasticity in the gravity model. Breuschand Pagan Lagrangian multiplier test rejects the null hypothesis of the absence of specific effectsin the log-linearised gravity equation (equation (2)) estimated by Ordinary Least Squares (OLS).Thus, specific effects exist in our gravity model and need to be controlled for. We look forthe heteroskedasticity in our data set by using White test. The null hypothesis of the presenceof homoskedasticity is rejected. As a result, the problem of heteroskedasticity also should becontrolled for in the estimation.
As mentioned earlier in Section 3.2, the λit and λ jt denoting country-year dummies forexporter and importer countries in equation (4) are capable of properly accounting for thepossible bias introduced by the potential omission of the multilateral resistance terms forexporter and importer countries. Since the total trade resistance captured by the unobservedexporter and importer resistance terms has a diverging and evolving nature, the inclusion oftime-varying country dummies is believed to successfully control for it, especially in our paperwhen the time span is indeed quite long.
However, since our data set includes 160 countries and 55 years, we would require theinclusion of 17,600 dummies in the regressions concerning time-varying dummies for bothexporter and importer countries. Hence, this issue makes the estimation computationallyunfeasible for econometric software. It cannot deal with this large number of dummies neededfor time-varying country fixed effects. To handle the multilateral resistance terms in our study,we consider an alternative specification suggested by Ruiz and Vilarrubia (2007) that includestime-varying country dummies defined as country-three-year period dummies orcountry-five-year period dummies for exporter and importer countries.
These specifications help to reduce the number of dummy variables to less than one-third(with country-three-year period dummies) or one-fifth (with country-five-year period dummies)of that used in the original time-varying country fixed effects. These dummies will remainfixed in three-year or five-year intervals. As a result, instead of including time-varying countrydummies for 55 consecutive years, we are taking into account only 18 periods of three yearseach (except the last one that captures four years from 2010 to 2014) or 11 periods of five yearseach. Although time-varying country dummies defined as country-three-year period dummies orcountry-five-year period dummies do not precisely capture the effects of exporter and importertime-varying resistance terms, we believe that the bias yielded from estimations accountingfor these dummies will probably be smaller than that in estimations excluding the issue of themultilateral resistance terms.
Table 4 provides the empirical findings resulting from both of the estimation of equation (3)that features the traditional gravity model and the estimation of equation (4) that includes themultilateral resistance terms by using the PPML technique. Column (1) lists the estimatedcoefficients for the traditional gravity equation without any fixed effects. Column (2) and (3)provide coefficient estimates resulting from the PPML method for the Anderson and vanWincoop gravity equation with country-five-year period and country-three-year period fixed
15

effects, respectively. Column (4) presents the estimation outcomes resulting from panel datamethod, which we will discuss later in the next section.
Table 4: Average effects of RTAs on international trade in terms of trade creation and tradediversion over the period of 1960-2014
Variables
The traditional gravityequation by
The Anderson and van Wincoop gravity equation
(1) PPML withoutfixed effects
(2) PPML withcountry-five-year
period fixed effects
(3) PPML withcountry-three-yearperiod fixed effects
(4) Panel data withcountry-three-yearperiod and bilateral
fixed effects
lnGDPit 0.813** (0.0145) 0.435** (0.023) 0.496** (0.019) 0.384** (0.0155)lnGDP jt 0.763** (0.0123) 0.521** (0.038) 0.520** (0.028) 0.552** (0.0150)lnDISTi j -0.710** (0.0325) -0.756** (0.0321) -0.756** (0.0321)CONTIGi j 0.500** (0.0826) 0.371** (0.0640) 0.370** (0.0641)LANGi j 0.459** (0.0720) 0.276** (0.0547) 0.276** (0.0547)ANDEAN_intrai jt 0.404 (0.256) 0.593** (0.213) 0.591** (0.213) 1.435** (0.211)ANDEAN_Xi jt -0.510** (0.186) -0.0544 (0.0525) 0.0463 (0.0318) -0.0138 (0.0797)ANDEAN_Mi jt -0.601** (0.0970) 0.0122 (0.0429) -0.0916* (0.0459) -0.192* (0.0757)ANZCERTA_intrai jt 0.901** (0.252) 1.097** (0.179) 1.097** (0.179) 0.384** (0.110)ANZCERTA_Xi jt -0.177 (0.237) -0.125** (0.0412) -0.138** (0.0433) -0.168* (0.0721)ANZCERTA_Mi jt 0.000191 (0.103) -0.106* (0.0523) -0.164* (0.0680) -0.0692 (0.0964)ASEAN_intrai jt 0.157 (0.174) 0.0102 (0.135) 0.0115 (0.135) -0.484** (0.143)ASEAN_Xi jt 0.472** (0.0886) 0.0901* (0.0389) 0.0201 (0.0321) 0.263** (0.0456)ASEAN_Mi jt 0.367** (0.0978) 0.0359 (0.0337) -0.0199 (0.0293) 0.0480 (0.0608)CACM_intrai jt 1.071** (0.248) 1.369** (0.173) 1.370** (0.172) 0.182 (0.131)CACM_Xi jt -0.393* (0.160) 0.0170 (0.0541) -0.0461 (0.0440) -0.00540 (0.0759)CACM_Mi jt -0.360* (0.141) 0.0426 (0.0466) -0.106* (0.0448) -0.0460 (0.0686)CAFTA-DR_intrai jt 0.644** (0.198) 0.815** (0.127) 0.824** (0.126) 0.599** (0.134)CAFTA-DR_Xi jt -0.395** (0.0889) -0.0582 (0.0321) -0.0290 (0.0217) -0.0302 (0.0528)CAFTA-DR_Mi jt -0.141 (0.116) -0.142** (0.0320) -0.0674** (0.0253) -0.132* (0.0566)CARICOM_intrai jt 2.429** (0.345) 2.522** (0.258) 2.523** (0.257) 1.119** (0.204)CARICOM_Xi jt -0.659** (0.240) -0.348* (0.144) -0.302* (0.123) 0.0677 (0.0859)CARICOM_Mi jt -0.302** (0.116) 0.277 (0.142) 0.102 (0.160) -0.109 (0.0635)CIS_intrai jt 1.722** (0.247) 2.035** (0.177) 2.035** (0.177) -1.068** (0.162)CIS_Xi jt -0.365** (0.118) -0.173 (0.172) 0.228** (0.0562) 0.297** (0.0692)CIS_Mi jt -0.793** (0.106) -0.259 (0.170) 0.170** (0.0624) 0.298** (0.0674)COMESA_intrai jt 1.144** (0.197) 1.187** (0.219) 1.187** (0.220) 0.902** (0.118)COMESA_Xi jt -1.264** (0.144) -0.116 (0.0881) 0.0467 (0.0309) 0.00665 (0.0591)COMESA_Mi jt -0.552** (0.0909) -0.0581 (0.0528) 0.0573 (0.0360) 0.110* (0.0525)EAC_intrai jt 1.728** (0.383) 1.874** (0.386) 1.872** (0.387) 0.881** (0.262)EAC_Xi jt -0.736** (0.184) -0.371* (0.189) -0.0472 (0.0791) 0.0801 (0.0847)EAC_Mi jt -0.365* (0.146) 0.0519 (0.119) 0.0541 (0.0690) 0.206** (0.0797)EFTA_intrai jt 0.718** (0.213) 0.336* (0.143) 0.337* (0.144) 0.0112 (0.0886)EFTA_Xi jt -0.452** (0.122) -0.0923** (0.0250) -0.156** (0.0282) -0.133** (0.0457)EFTA_Mi jt -0.531** (0.105) -0.176** (0.0269) -0.269** (0.0393) -0.300** (0.0554)EU_intrai jt 0.501** (0.0915) 0.329** (0.0768) 0.329** (0.0768) 0.908** (0.0392)EU_Xi jt -0.635** (0.0862) -0.0987* (0.0467) -0.104* (0.0447) -0.0815** (0.0236)EU_Mi jt -0.455** (0.0701) -0.122** (0.0460) -0.150** (0.0451) -0.231** (0.0294)MERCOSUR_intrai jt 0.973** (0.189) 1.209** (0.152) 1.212** (0.152) 0.503** (0.178)MERCOSUR_Xi jt -0.609** (0.124) -0.0578 (0.0453) -0.0259 (0.0544) 0.0309 (0.0669)MERCOSUR_Mi jt -0.569** (0.105) 0.206** (0.0541) 0.0266 (0.0625) 0.142 (0.0824)NAFTA_intrai jt 0.311 (0.184) 0.740** (0.106) 0.744** (0.107) 0.0563 (0.123)NAFTA_Xi jt -0.389** (0.0981) -0.143 (0.116) -0.121 (0.102) 0.0413 (0.0457)NAFTA_Mi jt 0.177 (0.111) -0.189* (0.0860) -0.187* (0.0793) -0.0409 (0.0546)PAFTA_intrai jt -0.748** (0.209) -0.792** (0.226) -0.796** (0.226) 0.741** (0.107)PAFTA_Xi jt 0.0403 (0.121) -0.101** (0.0361) -0.168** (0.0335) -0.00222 (0.0466)PAFTA_Mi jt -0.269** (0.0865) 0.0982** (0.0313) 0.157** (0.0321) -0.0221 (0.0396)SADC_intrai jt 1.545** (0.263) 1.755** (0.236) 1.749** (0.237) 0.788** (0.209)SADC_Xi jt -0.0914 (0.192) -0.0132 (0.0437) -0.00815 (0.0630) -0.0310 (0.0577)SADC_Mi jt -0.0565 (0.125) -0.0176 (0.0518) -0.0763 (0.0513) -0.141* (0.0565)SAFTA_intrai jt -0.182 (0.468) 0.165 (0.420) 0.169 (0.421) -0.516** (0.172)SAFTA_Xi jt -0.903** (0.148) 0.0744 (0.0460) 0.0118 (0.0318) 0.0184 (0.0322)SAFTA_Mi jt -0.439** (0.123) 0.210** (0.0726) 0.130* (0.0607) -0.0735 (0.0490)WAEMU_intrai jt 2.484** (0.315) 2.695** (0.280) 2.692** (0.280) 0.682** (0.200)WAEMU_Xi jt -1.169** (0.154) 2.997** (0.781) -0.164* (0.0664) -0.0987 (0.0731)
Continued on next page
16

Table 4 – Continued from previous page
Variables
The traditional gravityequation by
The Anderson and van Wincoop gravity equation
(1) PPML withoutfixed effects
(2) PPML withcountry-five-year
period fixed effects
(3) PPML withcountry-three-yearperiod fixed effects
(4) Panel data withcountry-three-yearperiod and bilateral
fixed effects
WAEMU_Mi jt -0.796** (0.137) -3.330** (0.418) 0.00214 (0.0699) 0.0692 (0.0652)Constant -14.79** (0.506) -19.40** (0.823) -17.94** (1.525) -7.366** (0.376)Observations 1,136,548 1,104,295 1,096,603 652,924Country-pairs 25,400 25,400 25,400 22,847R2? 0.775 0.893 0.895Within R2 0.451Exporter-Time effects No Yes Yes YesImporter-Time effects No Yes Yes YesCountry-pair effects No No No Yes
** and * denote statistical significance at the 1% and 5% levels, respectively. Robust standard errors are in parentheses. The dependentvariable in PPML regressions with specifications (1), (2) and (3) is the export flows in level; the dependent variable in panel dataregression (4) is the natural log of the export flows. R2? from PPML regressions is defined as the squared of the correlation betweenthe observed and fitted values of the dependent variable. Coefficient estimates for time-varying exporter and importer fixed effects,and bilateral fixed effects are not reported for reasons of brevity.
At first glance, the PPML estimates with different kinds of specification in Column (1), (2)and (3) all reveal that the level of GDP of exporter and importer countries are highly statisticallysignificant at 1% and have the expected positive sign as bilateral trade flows increase with the sizeof exporter and importer countries’ GDP. The coefficient for distance is negative and statisticallysignificant at 1%; the estimated coefficients for contiguity and common language are also positiveand highly significant in all PPML estimates as expected.
Our primary interest in this study is to assess the impact of various RTAs on members’trade. Thus, we mainly focus on dummy variables for RTAs. We interpret the results basedon the framework featured in Table 1. The traditional gravity model without time and countryfixed effects estimated by the PPML technique (Column 1) shows significant intra-bloc tradecreation along with export diversion and import diversion for most of the RTAs, such as theEU, the EFTA, the MERCOSUR, the CACM, the Caribbean Community and Common Market(CARICOM), the Commonwealth of Independent States (CIS), the COMESA, the East AfricanCommunity (EAC) and the West African Economic and Monetary Union (WAEMU). There isonly the ASEAN that witnesses export creation and import creation. However, the estimatedcoefficient for the ASEAN intra-bloc trade is insignificantly positive. Meanwhile, only the Pan-Arab Free Trade Area (PAFTA) has a significantly negative coefficient for intra-bloc trade effects.
Since this specification of gravity model without fixed effects ignores the recentdevelopments in theoretical foundations of gravity model that involve the multilateral resistanceterms, the results in Column (1) may suffer bias. Hence, they are presented for comparisonpurposes and a connection to past empirical literature only. Column (3) shows coefficientoutcomes resulting from our preferred specification with country-three-year period fixed effectsbecause it allows for more time-varying country dummies (18 periods) that could capture theevolution of the multilateral resistance terms over time more precisely than one with five-yearintervals (11 periods).
The results provided by the PPML methods in Column (2) and (3) present consistent impactof many trading blocs on their intra-bloc trade that is an increase in trade between membercountries following the formation of RTAs. The intra-bloc trade of several RTAs is significantlygreater above the expected levels that one would predict from the gravity model, with theexception of the ASEAN, the South Asian Free Trade Agreement (SAFTA) and the PAFTA.They are insignificantly positive effects for the ASEAN and the SAFTA intra-bloc trade and
17

counter-intuitive significantly negative effects for the PAFTA intra-bloc trade. It may seemsurprising that the coefficient for the intra-bloc trade is negative for the PAFTA since theintra-bloc trade tends to increase more than predicted by the gravity model following theformation of an RTA.
Soloaga and Winters (2001), Carrère (2006) and Tumbarello (2007) also find a negative signin the coefficient for intra-bloc trade of some RTAs. In our case, the negative coefficient forthe PAFTA intra-bloc trade could be explained by the weak transportation networks betweenmember countries that hinder the effort to promote the intra-bloc trade. In addition, severalcountries participating in the PAFTA are member countries of the Organisation of the PetroleumExporting Countries (OPEC) like Saudi Arabia, Kuwait, Qatar and the United Arab Emirates.Consequently, these countries are likely to induce complex impacts on trade patterns of thePAFTA in general through their petroleum export policies over the years. Especially, there aretwo oil shocks in 1973 and 1979, which hit global economy hard, involve some PAFTA members(OPEC nations). Parra Robles et al. (2012) found an negligible impact of the PAFTA on intra-bloc trade based on panel data method.
On the other hand, Frankel (1997) indicates that the intra-bloc trade coefficient tends tobecome smaller when RTA openness variable is added to the model. In our study, we add twoextra dummies for bloc exports and imports; consequently, we believe that the inclusion of thosedummies could reduce the absolute value of the effects of a particular RTA on its intra-bloc tradelike in the case of the PAFTA.
Turn to the assessment of trade creation and trade diversion effects of RTAs in terms of thetrading bloc exports and imports, the coefficient estimates for extra-bloc trade are quite sensitiveto the specification of fixed effects. A useful approach to analysing the coefficients outcomesis to group the RTAs based on whether they are located in same continents, sub-regions or theyhave same levels of development.
As regards the RTAs established by developed countries, both the PPML estimators withcountry-three-year period fixed effects and with country-five-year period fixed effects produceplausible common patterns of extra-bloc trade for the EU, the NAFTA, the EFTA and theANZCERTA. All of these trading blocs witness export diversion and import diversion by meansof significantly negative coefficients of bloc exports and imports. For instance, as indicated inColumn (3), the intra-EU trade is 38.96% (= 100*(e0.329 −1)) above expected levels predictedby the gravity variables along with a propensity to export to non-members and to import fromnon-members lower by 9.87% and 13.93%, respectively.
Our findings are in line with results from Soloaga and Winters (2001), Frankel (1997) andSapir (1998) as the regional integration process within the EU members impacted negativelyboth on EU imports from European non-members and the rest of the world in general as well ason EU exports to the outsiders. We conclude that the EU shows trade diversion effects in termsof exports and imports. Accordingly, the regional integration of EU members imposed costs onthe outsiders. Especially, our findings cover all enlargement processes of the EU from EU-9countries to EU-27 countries. Nonetheless, our results of the effects on EU extra-bloc trade isquite different with the findings from Carrère (2006) and Trotignon (2010) that provide exportcreation and import creation for the EU.
In the case of the EFTA, we reach the same conclusion with Soloaga and Winters (2001)concerning export and import diversions for the trading bloc. In addition, the negative propensityto import from the rest of the world of the NAFTA is in line with Carrère (2006) but contradictorywith Trotignon (2010). By contrast, we found export and import creation effects for the CIS inthe Eastern Europe. In the wake of the dissolution of the Soviet Union in the early 1990s, these
18

trade patterns reflect the openness of the CIS members with their neighbours (outsiders of theCIS) that have stimulated strong trade liberalisation in terms of goods since the late 1990s, suchas Turkey, members of the EU in the Western Europe, and China, Pakistan, India in South Asia.
Turn to the RTAs formed by developing countries in Central and Latin America, theANDEAN and the CACM witness average import diversion which is significant at the 5% level.Precisely, the ANDEAN and the CACM present a tendency to import from the rest of the worldslightly decreasing by 8.75% and 10%, respectively. Carrère (2006) also found import diversionfor the ANDEAN. By contrast, the MERCOSUR witnesses, on average, a propensity to importfrom the rest of the world insignificant in PPML estimate with country-three-year period fixedeffects, but superior by 22.87% and highly significant at the 1% level in PPML estimate withcountry-five-year period fixed effects. The import creation for the MERCOSUR is also foundby Soloaga and Winters (2001) and Trotignon (2010) but in contrast with Carrère (2006).Column (2) shows the CARICOM has the same trade patterns with the MERCOSUR in termsof import creation effects, whereas Column (3) confirms only significant export diversion effectsat the 5% level.
For the Dominican Republic-Central America-United States Free Trade Agreement (CAFTA-DR) that formed by a North partner (the United States) and South partners (smaller developingeconomies in Central American), there are significant average import diversion effects in asimilar way to the impacts of the CACM on extra-bloc trade. We find strong trade ties betweencountries joining in this RTA-the first free trade agreement between the United States with agroup of developing countries, although it entered into force not long ago (in 2006).
Turn to the RTAs in Asia, as mentioned above, both of the ASEAN and the SAFTA haveinsignificantly positive coefficient estimates for intra-bloc trade. It reflects a long implementationperiod concerning trade liberalisation schedules for the two Asian RTAs12. The ASEAN has theimplementation of tariff concessions over 26 years (from 1992 to 2018), while the SAFTA hasimplementation period over ten years (from 2006 to 2016). It means that members of these twoRTAs have gradually lowered their trade barriers regarding both tariff and non-tariff barriers forgoods coming from other members. However, the slow decrease in trade barriers within theASEAN and the SAFTA does not generate substantial impacts on their intra-bloc trade. Hence,the average effects of the ASEAN and the SAFTA over the period 1960-2014 on intra-bloc tradeare not significantly different from the expected levels predicted from the gravity model.
In addition, the insignificant average effects of the ASEAN and the SAFTA on intra-bloc tradecould be explained by the fact that trade patterns of their member countries are actively orientedtowards trade with the rest of the world. They have large global markets for their potential exportsfrom different sectors, such as agriculture, textiles and apparel industry, electronics industry,etc. As a result, member countries of the ASEAN and the SAFTA do not show a higher intra-bloc trade propensity yet. The PPML estimate with country-three-year period fixed effects shownegligible export creation for these two Asian RTAs, and significant import creation for theSAFTA. The PPML estimate with country-five-year period fixed effects presents a propensity toexport to non-members increasing by 9.43% in the case of the ASEAN.
For the RTAs in Africa, we study the effects of four African RTAs that represent the pillarsof the African Economic Community (AEC): the COMESA, the Southern African Development
12Each RTA is subject to different liberalisation procedure and schedules. In some RTAs, the liberalisation of intra-bloc trade takes place upon the date of entry into force of member countries. In our study, this date is used to definewhether the dummies for RTAs take the value of 1 or 0. More common for RTAs is a phased implementation of tariffconcessions over a period. The WTO’s data on RTAs determines the implementation period for a given RTA is the dateof final implementation of tariff eliminations undertaken by the slowest liberalising member.
19

Community (SADC), the EAC in South East Africa, and the WAEMU in West Africa. Note thatthere is a complex network of RTAs in Africa with several overlapping trading blocs establishedby same trading partners, for instance, Tanzania has joined in all of the three RTAs in South EastAfrica (the COMESA, the SADC and the EAC), Madagascar has participated in the COMESAand the SADC.
When bloc impacts of these RTAs are tested at the same time, we do not find any extra-bloc trade effects being significantly different from zero in their cases because the outsiders of agiven RTA probably participate in another RTA along with member countries of the former RTA.Thus, there are unclear average impacts of RTAs in South East Africa on their trade (exportsand imports) with non-members over the period of 1960 through 2014. It is recommended thatone does not test the effects of RTAs in East and Southern Africa simultaneously. In the case ofthe WAEMU, significant export diversion effects reflect strong trade ties between former Frenchcolonies in West Africa through a tendency to export to member countries, which is detrimentalto non-members.
In short, three main findings emerge from our study. First, intra-bloc trade creation effectsare found for most RTAs. There are increases in trade between member countries in the wakeof the establishment of several RTAs. Second, export and import diversion effects are significantin many RTAs, regardless of whether they are formed by developed countries or developingcountries. However, there are more export and import creations resulted from the formation ofRTAs between developing countries. Finally, RTAs located in America and Europe appear tohave more significant effects on intra-bloc trade as well as on extra-bloc trade than Asian andAfrican RTAs. The EFTA is the only RTA witnessing that the increase in intra-bloc trade isentirely offset by a lower propensity to export and import. Besides, magnitudes of coefficientestimates for RTAs dummies variables in our study are smaller than ones found in previousstudies on RTAs. The estimated impacts of RTAs on international trade are likely to be differentwhen zero trade flows are taken into account by using the PPML estimator.
We also observe that the coefficient estimates for extra-bloc trade effects for the ANDEAN,the CACM, the COMESA vary between different kinds of fixed effects specification (betweenresults in Column (2) and Column (3)), from insignificantly positive coefficients to insignificantlynegative ones. It means that these extra-bloc effects are very sensitive to the inclusion of the time-varying country fixed effects with three-year intervals or five-year intervals. There are probablystrong evidence of other unobserved factors (e.g., regional and political instability) that cannotbe totally controlled for by the time-varying country fixed effects and have impacts on these fixedeffects otherwise.
5. Robustness check
In Section 5.1, we test the robustness of RTA dummies coefficient estimates resulting fromthe PPML estimator by comparing with ones from panel data technique with fixed effects. InSection 5.2, we try to assess the effects of RTAs based on the level of economic development ofmember countries (North or South countries).
5.1. Test for the robustness of RTAs effects resulting from the PPML estimator
In a panel context, the gravity model is usually transformed to log-linear form as expressed inequation 2. As suggested by Baier and Bergstrand (2007), bilateral fixed effects along with time-varying fixed effects for exporter and importer are included in the model to overcome the RTAs
20

endogeneity bias and to take account of the Anderson and van Wincoop’s multilateral resistanceterms at the same time.
Since our data set consists of 160 countries, it is unfeasible to include 25,440 bilateraldummies in the estimations with PPML technique. Unfortunately, we cannot add bilateral fixedeffects to control for unobserved country-pairs factors and time-varying country fixed effectssimultaneously in the model estimated by PPML technique.
Column (4) in Table 4 provides the estimation outcomes resulting from panel data methodwith country-three-year period and bilateral fixed effects. One important drawback of country-pairs fixed-effects approach is that we cannot obtain the coefficient estimates for time-invariantbilateral factors such as distance, common language and contiguity. Moreover, as regards thetotal number of observations, since log-linear model estimated by panel data method excludeszero trade flows observations, it can only deal with 652,924 positive and nonzero dependentvariables, whereas the PPML estimator with country-three-year period fixed effects is capable ofhandling a total of 1,096,603 observations. Thus, panel data method is likely to give up usefulinsight about zero trade flows between country pairs that could influence the RTAs impacts onbloc trade and international trade.
We focus now on the comparison between the estimated coefficients of RTAs effects resultingfrom the PPML estimator and those resulting from panel data method. Regarding the RTAseffects on trade between member countries, we found that intra-bloc trade creation effects for tenRTAs (e.g., the ANDEAN, the ANZCERTA, the CAFTA-DR, the CARICOM, the COMESA,the EAC, the EU, the MERCOSUR, the SADC, the WAEMU) discovered by using the PPMLestimator are consistent with results from panel data method. The magnitudes of the intra-bloctrade coefficients from the PPML estimate for most of these RTAs are greater than those frompanel data method, except for the ANDEAN and the EU. The coefficient for the intra-bloc tradecreation changes from significant in PPML technique to insignificant in panel data estimate forthe EFTA, the NAFTA, the CACM. Likewise, the coefficient for the effects on intra-bloc tradefor the PAFTA varies from negative in PPML estimate to positive in panel data estimate, whilethe ones for the ASEAN, the CIS, the SAFTA suddenly vary from positive to negative. Thus,these RTAs seem to be sensitive to the difference between PPML and panel data techniques.
Regarding the extra-bloc trade effects of RTAs, significant import diversion effects for theANDEAN, the CAFTA-DR, the EFTA, the EU found in panel data estimate are consistent withthe PPML estimate. The panel data technique found the same import diversion effects for theANZCERTA, the CACM and the NAFTA that are in line with the PPML estimate, but negligible.In addition, both methods find significant export diversion effects for the EFTA and the EU. TheCIS witnesses export and import creation effects from both estimator. However, effects on extra-bloc trade for several RTAs are likely to be very sensitive to the treatment of zero trade with thePPML estimator and the inclusion of bilateral fixed effects in panel data technique. We find thatthe ASEAN members have a significant level of openness concerning trade with non-membersin panel data estimate through the increase in their propensity to export to the rest of the world,while these effects are insignificant from PPML estimate. There are negligible export creationeffects for the CARICOM, negligible import diversion effects for the PAFTA and the SAFTAfrom panel data estimate that contrast with our previous findings by using the PPML estimator.Coefficients for extra-bloc trade of some RTAs also have opposite sign from PPML and paneldata estimates, but they are negligible in panel data method.
Some RTAs like the ANZCERTA, the CACM, the NAFTA, the PAFTA and the WAEMU losetheir significant impacts on extra-bloc trade when the model is estimated by panel data method.Column (4) shows that the EU is the only case that has consistent effects on both extra-bloc trade
21

and intra-bloc trade with the PPML estimator. Moreover, we cannot clearly observe the tradepatterns of RTAs based on levels of economic development of member countries or their locationin Column (4), which is different from the findings of the PPML estimator.
In sum, several RTAs keep a consistency in the effects on intra-bloc trade and extra-bloc tradein both the PPML estimation and the panel data estimation. Nonetheless, some RTAs are quitesensitive to the treatment of zero trade with the PPML estimator as they have different effectson extra-bloc trade than those resulting from the panel data method. The findings from thePPML estimator with country-three-year period fixed effects are still quite robust because theyreasonably show similar trade patterns for groups of RTAs that are located on same continents orhave same levels of economic development 13.
5.2. RTAs effects depending on the level of development of member countries
In this section, we try to assess RTAs effects based on member countries characteristics. Dothe level of economic development affect the impacts of RTAs on members’ trade? Since theestablishment of the WTO in 1995, more developing countries (South partners) have involved inthe formation of RTAs. Since then, more North-South RTAs and South-South RTAs are createdall over the world by means of a dynamic participation of developing countries in Asia, SouthAmerica and Africa.
Immediate implementation
Under or equal to 5 years
6 to 10 years
11 to 15 years
16 to 20 years
over 20 years
2%
13.9%
25.7%
23.3%
19.2%
15.9%
Figure 2: Duration of the implementation period of RTAs included in the study
On the other hand, as we mentioned in previous sections, different RTAs are subject todifferent strategy for trade and tariff liberalisation. In some RTAs, member countries choose tradeand tariff liberalisation beginning at the entry into force of RTAs. In others, partner countrieschoose this schedule taking place by the end of the implementation of RTAs, which means
13We also perform the PPML estimator with country-two-year period fixed effects. The findings from this specificationare consistent with those from the PPML estimator with country-three-year period fixed effects. For the sake of brevity,we omit to present these results here.
22

the final implementation of tariff eliminations undertaken by the slowest liberalising member(Acharya, 2016). Phase-in period for trade and tariff liberalisation are prominently applied inmany RTAs.
For this analysis, we expand our RTAs sample up to 245 RTAs all over the world until 2015.Figure 2 shows the breakdown of RTAs based on the length of their implementation period. Ofthose 245 RTAs included in this study, 15.9% RTAs have the implementation periods takingplace immediately at their entry into force, while implementation periods up to five years occurin 19.2% and 23,3% had implementation periods varying from six to ten years. Of the RTAsstudied, 41.6% RTAs have the transition period of trade and tariff liberalisation exceeding tenyears.
Figure 3 provides detailed insights of implementation periods of the RTAs studied based ontypes of RTAs. RTAs established between partners with similar characteristics on developmentlevel seem to undertake shorter implementation period for trade and tariff liberalisation. Of theRTAs studied, 65.8% North-North RTAs and 69.5% South-South RTAs have their transitionperiod up to 10 years. By contrast, RTAs witnessing an asymmetry of economic developmentcharacteristics between members like North-South RTAs tend to undertake longerimplementation period. This period that exceeds ten years happened in 57.3% North-SouthRTAs.
North-North RTAs North-South RTAs South-South RTAs
Immediate implementation
Under or equal to 5 years
6 to 10 years
11 to 15 years
16 to 20 years
over 20 years
17.1%
17.1%
19.5%
39%
7.3%
3.1%
17.7%
36.5%24%
11.5%
7.3%
1.9%
9.3%
19.4%
24.1%18.5%
26.9%
Figure 3: Breakdown of RTAs implementation periods based on RTAs types
In order to test the impacts of RTAs on trade during their implementation periods, we takeinto account one lagged level (five years after the date of entry in force of RTAs) and two laggedlevel (ten years after the date of entry in force of RTAs). We modify our gravity model in section3.2 to include only RTAs dummies for intra-bloc trade and introduce new dummies to distinguishRTAs based on different levels of development of member countries. Consequently, the gravity
23

model employed in this analysis is described as follows:
Xi jt =βO(GDPit)β1 (GDP jt)β2 (DIS Ti j)β3 eβ4(LANGi j)eβ5(CONT IGi j)eβ6(COMCOLi j)eβ7(COLONYi j)
× eα1(North−NorthRT Ai jt)eα2(North−NorthRT Ai j,t−k)eδ1(North−S outhRT Ai jt)eδ2(North−S outhRT Ai j,t−k)
× eθ1(S outh−S outhRT Ai jt)eθ2(S outh−S outhRT Ai j,t−k)ψi jt
(5)
where RTAs dummies are defined as:
• North − NorthRT Ai jt = 1 if both trading partners are developed countries and have joinedthe same RTA at time t, and 0 otherwise.
• North− S outhRT Ai jt = 1 if i and j join the same RTA at time t and i is developing countryand j is developed country or vice versa, and 0 otherwise.
• S outh−S outhRT Ai jt = 1 if both trading partners are developing countries and have joinedthe same RTA at time t, and 0 otherwise.
• k = 1 if one lagged level is included or k = 2 if two lagged levels are included.
The modification of our gravity model leads to the following theoretically-motivated gravityequation estimated by PPML estimator:
Xi jt = exp(βO + β1 ln (GDPit) + β2 ln (GDP jt) + β3 ln (DIS Ti j) + β4(LANGi j) + β5(CONT IGi j)
+ β6(COMCOLi j) + β7(COLONYi j) + α1(North − NorthRT Ai jt) + α2(North − NorthRT Ai j,t−k)
+ δ1(North − S outhRT Ai jt) + δ2(North − S outhRT Ai j,t−k) + θ1(S outh − S outhRT Ai jt)
+ θ2(S outh − S outhRT Ai j,t−k) + λit + λ jt + λi j + εi jt
)(6)
where λit and λ jt are time-varying exporter and importer fixed effects, λi j is country-pair fixedeffects.
Table 5 provides the empirical results concerning the effects of RTAs on member countries’trade during the implementation period. Types of RTAs are based on the difference betweenmembers in the level of development. Our analysis also covers 160 countries spanning from1960 through 2015 with five-year intervals. Column (1), (2) and (3) present the gravity estimatesfrom equation 6 and based on the criteria of IMF for categorising North countries and Southcountries14, while Column (4), (5) and (6) present the outcomes based on the criteria of WorldBank for classifying developed and developing countries15, for comparison purposes. For thisanalysis, we take account of three econometric techniques: Column (1) and (4) provide resultsfrom PPML estimator with country-year and bilateral fixed effects; Column (2) and (5) presentresults from panel data method with country-year and bilateral fixed effects; Column (3) and (6)report results from first difference technique with country-year fixed effects.
14According to the IMF World Economic Outlook, developed countries included in this study are: Belgium, Germany,Italy, United Kingdom, Austria, France, Netherlands, Luxembourg, Denmark, Ireland, Finland, Sweden, Spain, Greece,Portugal, Canada, Japan, Norway, Switzerland, Iceland, United States, Australia, New Zealand, Israel (1996-), HongKong (1996-), Republic of Korea (1996-), Singapore (1996-), Cyprus (2000), Slovenia (2006-), Malta (2007-), SlovakRepublic (2008-), Czech Republic (2008-), Estonia (2010-), Latvia (2013-), Lithuania (2014-), Macao (2015)
15According to World Bank World Economic Situation and Prospects, developed countries included in this study are:EEu-27, Iceland, Norway, Switzerland, Australia, Canada, Japan, New Zealand, United States
24

Table 5: Gravity estimates with two lagged levels of the RTA dummies over the period of 1960-2015
Variables (1) (2) (3) (4) (5) (6)
NorthNorthRTAi jt 0.0242 0.0926** 0.223*** 0.133*** 0.327*** 0.440***(0.0952) (0.0463) (0.0514) (0.0475) (0.0519) (0.0555)
NorthNorthRTAi jt−1 0.0843 0.125*** 0.125*** 0.105*** 0.228*** 0.215***(0.0614) (0.0413) (0.0364) (0.0337) (0.0472) (0.0461)
NorthNorthRTAi jt−2 0.0711 0.374*** 0.114** 0.0888* 0.254*** 0.0927(0.0561) (0.0461) (0.0485) (0.0466) (0.0511) (0.0620)
NorthSouthRTAi jt -0.0192 -0.0151 0.0443 0.00492 -0.0425 0.0489(0.0592) (0.0370) (0.0410) (0.0626) (0.0357) (0.0406)
NorthSouthRTAi jt−1 -0.0848 0.0751 0.0891* 0.0476 0.0554 0.0799(0.0583) (0.0505) (0.0504) (0.0519) (0.0499) (0.0504)
NorthSouthRTAi jt−2 -0.00590 0.574*** 0.125*** 0.0298 0.586*** 0.169***(0.0548) (0.0519) (0.0456) (0.0555) (0.0514) (0.0463)
SouthSouthRTAi jt 0.171*** 0.278*** 0.138*** -0.0618 0.354*** 0.0803(0.0549) (0.0475) (0.0516) (0.0854) (0.0542) (0.0542)
SouthSouthRTAi jt−1 0.0179 0.193*** 0.119** -0.145** 0.143** 0.101*(0.0482) (0.0526) (0.0516) (0.0691) (0.0564) (0.0546)
SouthSouthRTAi jt−2 -0.0722 0.336*** 0.0580 -0.0925 0.277*** 0.0148(0.0737) (0.0547) (0.0519) (0.0764) (0.0574) (0.0548)
Constant 15.96*** 15.97***(0.0159) (0.0160)
Observations 226,932 148,714 117,770 226,932 148,714 117,770Total NorthNorth RTAseffects
0.592 0.462 0.327 0.809 0.655
Total NorthSouth RTAseffects
0.574 0.214 0.586 0.169
Total SouthSouth RTAseffects
0.171 0.807 0.257 -0.145 0.774 0.101
R2 0.970 0.240 0.970 0.240Within R2 0.491 0.492Exporter-Yeareffects
Yes Yes Yes Yes Yes Yes
Importer-Yeareffects
Yes Yes Yes Yes Yes Yes
Country-paireffects
Yes Yes No Yes Yes No
First difference No No Yes No No Yes
***, ** and * denote statistical significance at the 1%, 5% and 10% levels, respectively. Robust standard errors are in parentheses.The dependent variable in PPML regression (1) and (4) are the export flows in level; the dependent variable in panel data regression(2) and (5), and first difference regressiong (3) and (6) are the natural log of the export flows. Coefficient estimates for country-yearfixed effects are not reported for reasons of brevity.
We include in this estimation two lagged levels (five years and ten years lagged). At firstglance, based on the IMF’s criteria concerning North and South partners, panel data (Column(2)) and first difference method (Column (3)) provide many significant RTAs impacts, while thePPML estimator (Column (1)) shows only significantly positive effects for South-South RTAsintra-bloc trade at time t. It may seem that RTAs impacts on members’ trade are very sensitive tothe treatment of zero trade with the PPML estimator. Column (2) and Column (3) both agree onsignificant and positive impacts of RTAs between North partners on intra-bloc trade at their entryinto force and during their implementation period of trade and tariff liberalisation over five or tenyears. These outcomes confirm that North-North RTAs have shorter transition periods since thelevel of economic development of their members is more symmetrical than other types of RTAs.
As regards North-South RTAs, panel data method found negligible coefficients for RTAs atthe entry into force of RTAs and after five years, but significantly positive impacts of these RTAsafter ten years. First difference method, however, found significantly positive impacts of theseRTAs after five and ten years. These results show that North-South RTAs tend to increase trade
25
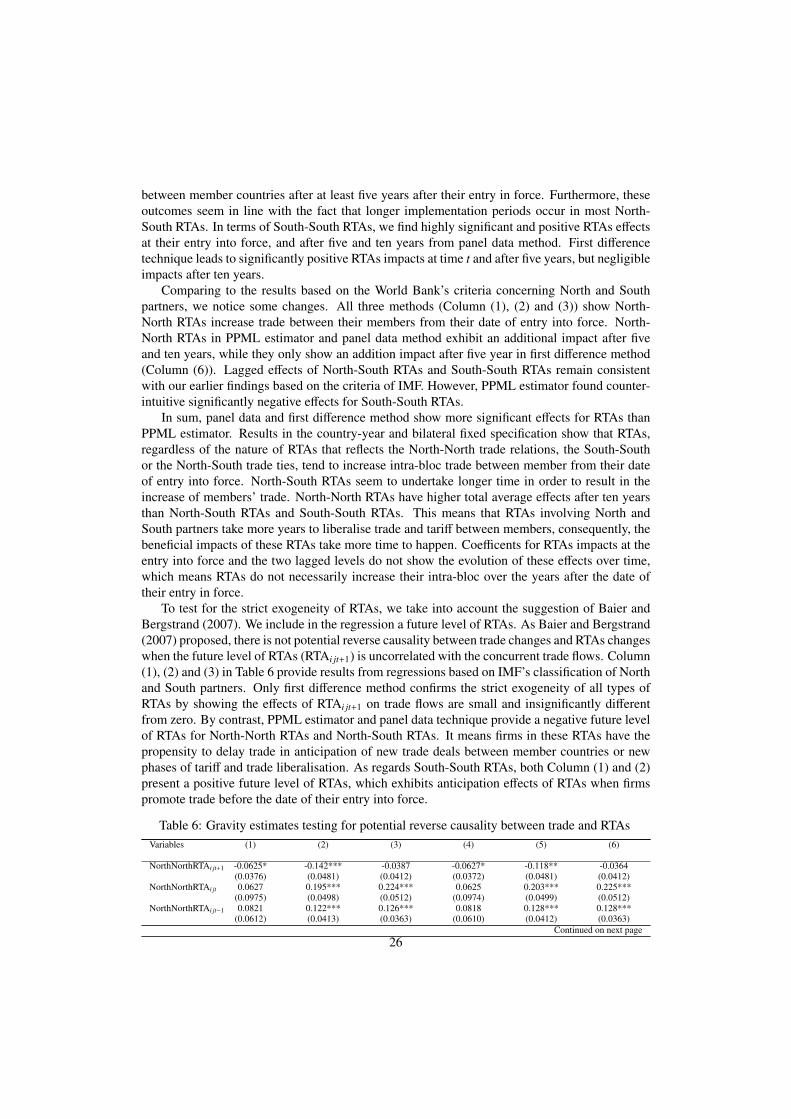
between member countries after at least five years after their entry in force. Furthermore, theseoutcomes seem in line with the fact that longer implementation periods occur in most North-South RTAs. In terms of South-South RTAs, we find highly significant and positive RTAs effectsat their entry into force, and after five and ten years from panel data method. First differencetechnique leads to significantly positive RTAs impacts at time t and after five years, but negligibleimpacts after ten years.
Comparing to the results based on the World Bank’s criteria concerning North and Southpartners, we notice some changes. All three methods (Column (1), (2) and (3)) show North-North RTAs increase trade between their members from their date of entry into force. North-North RTAs in PPML estimator and panel data method exhibit an additional impact after fiveand ten years, while they only show an addition impact after five year in first difference method(Column (6)). Lagged effects of North-South RTAs and South-South RTAs remain consistentwith our earlier findings based on the criteria of IMF. However, PPML estimator found counter-intuitive significantly negative effects for South-South RTAs.
In sum, panel data and first difference method show more significant effects for RTAs thanPPML estimator. Results in the country-year and bilateral fixed specification show that RTAs,regardless of the nature of RTAs that reflects the North-North trade relations, the South-Southor the North-South trade ties, tend to increase intra-bloc trade between member from their dateof entry into force. North-South RTAs seem to undertake longer time in order to result in theincrease of members’ trade. North-North RTAs have higher total average effects after ten yearsthan North-South RTAs and South-South RTAs. This means that RTAs involving North andSouth partners take more years to liberalise trade and tariff between members, consequently, thebeneficial impacts of these RTAs take more time to happen. Coefficents for RTAs impacts at theentry into force and the two lagged levels do not show the evolution of these effects over time,which means RTAs do not necessarily increase their intra-bloc over the years after the date oftheir entry in force.
To test for the strict exogeneity of RTAs, we take into account the suggestion of Baier andBergstrand (2007). We include in the regression a future level of RTAs. As Baier and Bergstrand(2007) proposed, there is not potential reverse causality between trade changes and RTAs changeswhen the future level of RTAs (RTAi jt+1) is uncorrelated with the concurrent trade flows. Column(1), (2) and (3) in Table 6 provide results from regressions based on IMF’s classification of Northand South partners. Only first difference method confirms the strict exogeneity of all types ofRTAs by showing the effects of RTAi jt+1 on trade flows are small and insignificantly differentfrom zero. By contrast, PPML estimator and panel data technique provide a negative future levelof RTAs for North-North RTAs and North-South RTAs. It means firms in these RTAs have thepropensity to delay trade in anticipation of new trade deals between member countries or newphases of tariff and trade liberalisation. As regards South-South RTAs, both Column (1) and (2)present a positive future level of RTAs, which exhibits anticipation effects of RTAs when firmspromote trade before the date of their entry into force.
Table 6: Gravity estimates testing for potential reverse causality between trade and RTAsVariables (1) (2) (3) (4) (5) (6)
NorthNorthRTAi jt+1 -0.0625* -0.142*** -0.0387 -0.0627* -0.118** -0.0364(0.0376) (0.0481) (0.0412) (0.0372) (0.0481) (0.0412)
NorthNorthRTAi jt 0.0627 0.195*** 0.224*** 0.0625 0.203*** 0.225***(0.0975) (0.0498) (0.0512) (0.0974) (0.0499) (0.0512)
NorthNorthRTAi jt−1 0.0821 0.122*** 0.126*** 0.0818 0.128*** 0.128***(0.0612) (0.0413) (0.0363) (0.0610) (0.0412) (0.0363)
Continued on next page26

Table 6 – Continued from previous pageVariables (1) (2) (3) (4) (5) (6)NorthNorthRTAi jt−2 0.0695 0.358*** 0.112** 0.0723 0.392*** 0.115**
(0.0560) (0.0463) (0.0487) (0.0560) (0.0464) (0.0487)NorthSouthRTAi jt+1 -0.0629* -0.0639* 0.00968 -0.0742** -0.0732** 0.00177
(0.0337) (0.0341) (0.0370) (0.0333) (0.0342) (0.0370)NorthSouthRTAi jt 0.0188 0.0338 0.0437 0.0153 0.0322 0.0419
(0.0482) (0.0401) (0.0405) (0.0478) (0.0401) (0.0405)NorthSouthRTAi jt−1 -0.0853 0.0740 0.0886* -0.0888 0.0752 0.0870*
(0.0583) (0.0505) (0.0504) (0.0580) (0.0505) (0.0504)NorthSouthRTAi jt−2 -0.00593 0.574*** 0.124*** -0.0101 0.561*** 0.118***
(0.0548) (0.0521) (0.0457) (0.0544) (0.0522) (0.0459)SouthSouthRTAi jt+1 0.113** 0.139*** -0.0463 0.00889 -0.117* -0.186***
(0.0476) (0.0540) (0.0560) (0.0491) (0.0606) (0.0622)SouthSouthRTAi jt 0.105** 0.179*** 0.136*** 0.0990* 0.203*** 0.162***
(0.0527) (0.0514) (0.0509) (0.0557) (0.0582) (0.0574)SouthSouthRTAi jt−1 0.0179 0.193*** 0.117** 0.00169 0.196*** 0.117**
(0.0480) (0.0526) (0.0515) (0.0503) (0.0604) (0.0593)SouthSouthRTAi jt−2 -0.0784 0.335*** 0.0576 -0.0971 0.254*** -0.00999
(0.0746) (0.0547) (0.0518) (0.0787) (0.0633) (0.0566)Constant 15.96*** 16.00***
(0.0164) (0.0161)
Observations 226,932 148,714 117,770 226,932 148,714 117,770Total NorthNorth RTAseffects
-0.0625 0.533 0.462 -0.0627 0.605 0.468
Total NorthSouth RTAseffects
-0.0629 0.510 0.213 -0.0742 0.488 0.205
Total SouthSouth RTAseffects
0.218 0.846 0.253 0.0990 0.536 0.093
R2 0.970 0.240 0.970 0.240Within R2 0.491 0.490Exporter-Yeareffects
Yes Yes Yes Yes Yes Yes
Importer-Yeareffects
Yes Yes Yes Yes Yes Yes
Country-paireffects
Yes Yes No Yes Yes No
First difference No No Yes No No Yes
***, ** and * denote statistical significance at the 1%, 5% and 10% levels, respectively. Robust standard errors are in parentheses.The dependent variable in PPML regression (1) and (4) are the export flows in level; the dependent variable in panel data regression(2) and (5), and first difference regressiong (3) and (6) are the natural log of the export flows. Coefficient estimates for country-yearfixed effects are not reported for reasons of brevity.
In terms of RTAs lagged levels impacts, the results including the future level of RTAs areconsistent with previous regressions (Table 5). These effects are significantly positive in paneldata and first difference methods. However, the total average effects of South-South RTAs aregreater than ones of North-North RTAs since the coefficient of future level of South-South RTAsis positive, whereas the one of North-North RTAs is negative.
In Column (4), (5) and (6) of Table 6, we try to block the effects of RTAs that involve Africancountries (African South-South RTAs). As stated in Section 4, African RTAs have overlappingmembers and do not result in much effects on members’ trade. Therefore, we exclude theseRTAs from regressions. First difference method finds strict exogeneity of North-North RTAs andNorth-South RTAs, but a significant tendency of firms in South-South RTAs to delay trade inanticipation of new trade deals. PPML estimator found only strict exogeneity of South-SouthRTAs, whereas panel data technique found a significantly negative coefficient for the future levelof RTAs in all three types of RTAs. As regards lagged levels impacts of RTAs, most coefficientsfor RTAs are consistent with previous findings. Both panel data and first difference methodsconfirm that total average effects of North-North RTAs are greater than ones of other types ofRTAs. In short, the causality between trade changes and RTAs changes is also sensitive to the
27

choice of econometric technique. Panel data and first difference seem to have consistent resultswith each other.
6. Conclusions
This paper revisits the ex-post effects of RTAs on member countries’ trade by using thePPML estimator and including the Anderson and van Wincoop’s multilateral resistance terms.The results concerning the average effects of RTAs over the period of 1960-2014 are quitesensitive to the specification for fixed effects of the PPML estimator. Overall, the PPMLestimate with country-three-year period fixed effects reveals significant intra-bloc trade creationfor most of the RTAs. The Asian RTAs like the ASEAN and the SAFTA seem to do not lead tosignificant impacts on their intra-bloc trade between members because these RTAs have a longimplementation period concerning trade liberalisation procedures. We also found that theoverlapping RTAs in East and Southern Africa do not result in significant effects on members’trade when they are tested at the same time.
There are compatible extra-bloc trade patterns for groups of RTAs based on their levels ofeconomic development or their location. Export diversion and import diversion effects are foundfor RTAs formed by developed countries (the EU, the NAFTA, the EFTA), import diversioneffects are observed for RTAs established by developing countries in America (the CACM, theANDEAN). A majority of RTAs showed evidence of trade diversion effects in terms of blocexports and imports, regardless of the nature of RTAs that reflects the North-North trade relations,the South-South or the North-South trade ties.
Our results featuring the increase in intra-bloc trade and trade diversion effects in terms ofextra-bloc trade for most of the RTAs seem to be in line with previous studies like Soloaga andWinters (2001) and Carrère (2006). It appears that the propensity of regional integration aroundthe world has improved the performance of intra-bloc trade for many RTAs, nonetheless, it isdetrimental to the rest of the world. Our findings appear plausible in the light of the upsurgein RTAs around the world over the past two decades and the failure of the Doha Round of theWTO which aims to a better multilateral trading system. Our robust analysis also finds thediscrepancy in impacts on members’ trade between RTAs based on the level of development oftheir member countries and the length of their implementation periods. It suggests that RTAsformed by developed countries and by countries that have symmetry of economic developmentcharacteristics result in greater increase in trade between members during shorter transitionperiods of trade and tariff liberalisation.
Some caveats are necessarily considered in our future research. This paper cannot assess theRTAs effects of seventeen RTAs with the PPML estimator based on gravity model including bothtime-varying country fixed effects and bilateral fixed effects. These specifications of fixed effectsmay allow us to not only take account of the multilateral resistance terms but also to overcomethe RTAs endogeneity bias generated by unobserved time-invariant factors among country pairs.Our further studies on this question should focus more on the dynamic effects of RTAs that canvary over time and on the drivers of successful RTAs according to both member countries’ andRTAs’ characteristics.
28

Appendix A. List of the 160 countries in the sample
Figure A.1: World map indicating selected countries
Table A.1: List of the 160 selected countriesAlbania Dominica Lao Sao Tome and PrincipeAlgeria Dominican Republic Latvia Saudi ArabiaAngola Ecuador Lebanon SenegalArgentina Egypt Lithuania SeychellesArmenia, Republic of El Salvador Luxembourg Sierra LeoneAustralia Equatorial Guinea Macao SingaporeAustria Estonia Macedonia Slovak RepublicAzerbaijan, Republicof
Ethiopia Madagascar Slovenia
Bahamas, The Fiji Malawi SomaliaBahrain, Kingdom of Finland Malaysia South AfricaBangladesh France Mali SpainBarbados Gabon Malta Sri LankaBelarus Gambia Mauritania St.Kitts and NevisBelgium Georgia Mauritius St.LuciaBelize Germany Mexico St.Vincent and the
GrenadinesBenin Ghana Mongolia SudanBolivia Greece Morocco SurinameBosnia andHerzegovina
Grenada Mozambique Sweden
Brazil Guatemala Myanmar SwitzerlandBrunei Darussalam Guinea Nepal TajikistanBulgaria Guinea-Bissau Netherlands TanzaniaBurkina Faso Guyana New Zealand ThailandBurundi Haiti Nicaragua Togo
Continued on next page
29

Table A.1: List of the 160 selected countriesCambodia Honduras Niger TongaCameroon Hong Kong Nigeria Trinidad and TobagoCanada Hungary Norway TunisiaCape Verde Iceland Oman TurkeyCentral AfricanRepublic
India Pakistan Turkmenistan
Chad Indonesia Panama UgandaChile Iran Papua New Guinea UkraineChina Ireland Paraguay United Arab EmiratesColombia Israel Peru United KingdomComoros Italy Philippines United StatesCongo, Republic of Jamaica Poland UruguayCosta Rica Japan Portugal UzbekistanCote d’Ivoire Jordan Qatar VanuatuCyprus Kazakhstan Romania VenezuelaCzech Republic Kenya Russian Federation VietnamDenmark Korea, Republic of Rwanda ZambiaDjibouti Kuwait Samoa Zimbabwe
Appendix B. List of 17 RTAs and member countries included in the estimates
Names of the RTA Type of agreement Member countriesAndean Community(ANDEAN)
Customs union Bolivia (1988); Colombia (1988); Ecuador(1988); Peru (1988); Venezuela (1988)
Australia – New Zealand(ANZCERTA)
Free trade agreement Australia (1983); New Zealand (1983)
Association of SoutheastAsian Nations Free TradeArea (ASEAN)
Free trade agreement Brunei Darussalam (1992); Cambodia (1999);Indonesia (1992); Lao (1997); Malaysia (1992);Myanmar (1997); Philippines (1992); Singapore(1992); Thailand (1992); Vietnam (1995)
Central AmericanCommon Market(CACM)
Customs union Costa Rica (1964-1974/1993); El Salvador(1961-1974/1993); Guatemala (1961-1974/1993);Honduras (1962-1974/1993); Nicaragua(1961-1974/1993)
Dominican Republic –Central America –United States Free TradeAgreement (CAFTA-DR)
Free trade agreement Costa Rica (2009); Dominican Republic (2007);El Salvador (2006); Guatemala (2006); Honduras(2006); Nicaragua (2006); United States ofAmerica (2006)
Caribbean Communityand Common Market(CARICOM)
Customs union Bahamas (1983) ; Barbados (1973); Belize(1974); Dominica (1974) ; Grenada (1974);Guyana (1973); Jamaica (1973); Haiti(2003/2006-); Saint Kitts and Nevis (1974); SaintLucia (1974); Saint Vincent and the Grenadines(1974); Suriname (1995); Trinidad and Tobago(1973)
Continued on next page
30

Table A.2 – continued from previous pageNames of the RTA Type of agreement Member countriesCommonwealth ofIndependent States (CIS)
Free trade agreement Armenia (1995); Azerbaijan (1997); Belarus(1995); Georgia (1995); Kazakhstan (1995);Russian Federation (1995); Tajikistan (1997);Ukraine (1995); Uzbekistan (1995)
Common Market forEastern and SouthernAfrica (COMESA)
Customs union Burundi (1995); Comoros (1995); Djibouti(1995); Egypt (1999); Ethiopia (1995); Kenya(1995); Madagascar (1995); Malawi (1995);Mauritius (1995); Rwanda (1995); Seychelles(2009); Sudan (1995); Tanzania (1995); Uganda(1995); Zambia (1995); Zimbabwe (1995)
East African Community(EAC)
Customs union Burundi (2007); Kenya (2000); Rwanda (2007);Tanzania (2000); Uganda (2000)
European Free TradeAssociation (EFTA)
Free trade agreement Iceland (1970); Norway (1960); Switzerland(1960); United Kingdom (1960-1973); Danemark(1960-1973); Portugal (1986); Sweden (1995);Austria (1960-1995); Finland (1986-1995)
European Union (EU) Customs union Austria (1995); Belgium-Luxembourg (1958);Bulgaria (2007); Cyprus (2004); Czech Republic(2004); Denmark (1973); Estonia (2004); Finland(1995); France (1957); Germany (1957); Greece(1981); Hungary (2004); Ireland (1973); Italy(1957); Latvia (2004); Lithuania (2004); Malta(2004); Netherlands (1957); Poland (2004);Portugal (1986); Romania (2007); SlovakRepublic (2004); Slovenia (2004); Spain (1986);Sweden (1995); United Kingdom (1973)
Southern CommonMarket (MERCOSUR)
Customs union Argentina; Brazil; Paraguay; Uruguay
North American FreeTrade Agreement(NAFTA)
Free trade agreement Canada (1988); Mexico (1994); United States ofAmerica (1988)
Pan-Arab Free TradeArea (PAFTA)
Free trade agreement Bahrain (1998); Egypt (1998); Jordan (1998);Kuwait (1998); Lebanon (1998); Morocco(1998); Oman (1998); Qatar (1998); SaudiArabia (1998); Sudan (1998); Tunisia (1998);United Arab Emirates (1998)
Southern AfricanDevelopmentCommunity (SADC)
Free trade agreement Madagascar (2001); Malawi (2001); Mauritius(2001); Mozambique (2001); South Africa(2001); Tanzania (2001); Zambia (2001);Zimbabwe (2001)
South Asian Free TradeAgreement (SAFTA)
Free trade agreement Bangladesh (2006); India (2006); Nepal (2006);Pakistan (2006); Sri Lanka (2006)
West African Economicand Monetary Union(WAEMU)
Customs union Benin (2000); Burkina Faso (2000); Cote d’Ivoire(2000); Guinea-Bissau (2000); Mali (2000);Niger (2000); Senegal (2000); Togo (2000)
Years in parentheses indicate the date of entry into force of RTAs or the date when new membercountries join in RTAs.
31

References
Acharya, R., 2016. Regional trade agreements and the multilateral trading system. Cambridge University Press,Cambridge.
Aitken, N. D., 1973. The effect of the EEC and EFTA on european trade: A temporal cross-section analysis. TheAmerican Economic Review 63 (5), 881–892.
Anderson, J., Yotov, Y., 2012. Gold standard gravity. NBER Working Papers 17835, National Bureau of EconomicResearch, Inc.
Anderson, J. E., 1979. A theoretical foundation for the gravity equation. The American Economic Review 69 (1), 106–116.
Anderson, J. E., van Wincoop, E., 2003. Gravity with gravitas: A solution to the border puzzle. The American EconomicReview 93 (1), 170–192.
Baier, S. L., Bergstrand, J. H., 2001. The growth of world trade: tariffs, transport costs, and income similarity. Journal ofInternational Economics 53 (1), 1–27.
Baier, S. L., Bergstrand, J. H., 2007. Do free trade agreements actually increase members’ international trade? Journalof International Economics 71 (1), 72 – 95.
Balassa, B., 1961. Towards a theory of economic integrational. Kyklos 14 (1), 1–17.Baldwin, R., 1993. A domino theory of regionalism. Working Paper 4465, National Bureau of Economic Research.Baldwin, R., 2004. Stepping stones or building blocs? Regional and multilateral integration. Unpublished manuscript,
Graduate Institute of International Studies, Geneva.Baldwin, R., Taglioni, D., September 2006. Gravity for dummies and dummies for gravity equations. Working Paper
12516, National Bureau of Economic Research.Bayoumi, T., Eichengreen, B., 1997. Is regionalism simply a diversion? Evidence from the evolution of the EC and
EFTA. In: Ito, T., Krueger, A. O. (Eds.), Regionalism vs. Multilateral Arrangements. The University of ChicagoPress, Chicago.
Bergstrand, J. H., 1985. The gravity equation in international trade: Some microeconomic foundations and empiricalevidence. The Review of Economics and Statistics 67 (3), 474–481.
Bergstrand, J. H., 1989. The generalized gravity equation, monopolistic competition, and the factor-proportions theoryin international trade. The Review of Economics and Statistics 71 (1), 143–153.
Bhagwati, J., 1991. The world trading system at risk. Princeton University Press, Princeton, NJ.Bhagwati, J., 1995. U.S. Trade Policy: The Infatuation with Free Trade Areas. In: Bhagwati, J., Krueger, A. (Eds.),
The Dangerous Drift to Preferential Trade Agreements. American Enterprise Institute for Public Policy Research,Washington, D.C.
Brada, J. C., Méndez, J. A., 1985. Economic integration among developed, developing and centrally planned economies:A comparative analysis. The Review of Economics and Statistics 67 (4), 549–556.
Burger, M., van Oort, F., Linders, G.-J., 2009. On the specification of the gravity model of trade: Zeros, excess zeros andzero-inflated estimation. Spatial Economic Analysis 4 (2), 167–190.
Bussière, M., Fidrmuc, J., Schnatz, B., 2005. Trade integration of central and eastern european countries: Lessons froma gravity model. Working papers, Oesterreichische Nationalbank (Austrian Central Bank).
Carrère, C., 2006. Revisiting the effects of regional trade agreements on trade flows with proper specification of thegravity model. European Economic Review 50 (2), 223 – 247.
Cheng, I. H., Wall, H. J., 2005. Controlling for heterogeneity in gravity models of trade and integration. Federal ReserveBank of St. Louis Review 87 (1), 49–63.
Deardorff, A., 1998. Does gravity work in a neoclassical world? In: Frankel, J. A. (Ed.), The Regionalization of theWorld Economy. The University of Chicago Press, Chicago.
Endoh, M., 1999. Trade creation and trade diversion in the EEC, the LAFTA and the CMEA: 1960-1994. AppliedEconomics 31 (2), 207–216.
Feenstra, R., 2004. Advanced International Trade : Theory and Evidence. Princeton University Press, Princeton, N.J.Filippini, C., Molini, V., 2003. The determinants of East Asian trade flows: a gravity equation approach. Journal of Asian
Economics 14 (5), 695 – 711.Frankel, J., Stein, E., Wei, S.-J., 1995. Trading blocs and the americas: The natural, the unnatural, and the super-natural.
Journal of Development Economics 47 (1), 61 – 95.Frankel, J. A., 1997. Regional Trading Blocs. Institute for International Economics, Washington, DC.Freund, C., Ornelas, E., 2010. Regional Trade Agreements. The World Bank.Head, K., Mayer, T., 2013. Gravity equations: Workhorse, toolkit, and cookbook. Working papers, CEPII research center.Head, K., Mayer, T., Ries, J., 2010. The erosion of colonial trade linkages after independence. Journal of International
Economics 81 (1), 1 – 14.Helpman, E., Krugman, P., 1985. Market Structure and Foreign Trade. MIT Press, Cambridge, MA.
32

Helpman, E., Melitz, M., Rubinstein, Y., 2008. Estimating trade flows: Trading partners and trading volumes. TheQuarterly Journal of Economics 123 (2), 441.
Johnson, H. G., 1960. The economic theory of customs unions. Pakistan Economic Review 10, 14–30.Kemp, M. C., Wan, H. Y., 1976. An elementary proposition concerning the formation of customs unions. Journal of
International Economics 6 (1), 95 – 97.Kimura, F., Ando, M., 2005. Two-dimensional fragmentation in East Asia: Conceptual framework and empirics.
International Review of Economics & Finance 14 (3), 317–348.Krugman, P., 1991. The move toward free trade zones. In: Policy Implications of Trade and Currency Zones. Proceedings
of symposium sponsored by the Federal Reserve Bank of Kansas City, Jackson Hole, Wyoming.Lawrence, R., 1996. Regionalism, Multilateralism, and Deeper Integration. Brookings Institution, Washington, D.C.Lee, J.-W., Park, I., 2005. Free trade areas in East Asia: Discriminatory or non-discriminatory? The World Economy
28 (1), 21–48.Lee, J.-W., Swagel, P., 1997. Trade barriers and trade flows across countries and industries. Review of Economics and
Statistics 79 (3), 372–382.Lipsey, R., 1970. The Theory of Customs Unions: A General Equilibrium Analysis. L.S.E. research monographs.
Weidenfeld & Nicolson.Magee, C., 2003. Endogenous preferential trade agreements: An empirical analysis. The B.E. Journal of Economic
Analysis & Policy 2 (1), 1–19.Martin, W., Pham, C., 2015. Estimating the gravity model when zero trade flows are frequent and economically
determined. Policy Research Working Paper Series 7308, The World Bank.Meade, J., 1955. The theory of customs unions. North-Holland, Amsterdam.Parra Robles, M. D., Martinez-Zarzoso, I., Burguet, C. S., 2012. The impact of FTAs on MENA trade. Discussion paper
217, Ibero America Institute for Economic Research.Ruiz, J. M., Vilarrubia, J. M., 2007. the wise use of dummies in gravity models: Export potentials in the euromed region.
Working Paper 0720, Banco De España.Santos Silva, J. M., Tenreyro, S., 2006. The log of gravity. The Review of Economics and Statistics 88 (4), 641–658.Sapir, A., 1998. The political economy of EC regionalism. European Economic Review 42 (3–5), 717 – 732.Soloaga, I., Winters, L. A., 2001. Regionalism in the nineties: what effect on trade? The North American Journal of
Economics and Finance 12 (1), 1–29.Summers, L., 1991. Regionalism and the world trading system. In: Policy Implications of Trade and Currency Zones.
Proceedings of symposium sponsored by the Federal Reserve Bank of Kansas City, Jackson Hole, Wyoming.Tinbergen, J., 1962. Shaping the World Economy. The Twentieth Century Fund, New York.Trefler, D., 1993. Trade liberalization and the theory of endogenous protection: An econometric study of U.S. import
policy. Journal of Political Economy 101 (1), 138–60.Trotignon, J., 2010. Does regional integration promote the multilateralization of trade flows?: A gravity model using
panel data. Journal of Economic Integration 25, 223–251.Tumbarello, P., 2007. Are Regional Trade Agreements in Asia Stumbling or Building Blocks? Implications for the
Mekong-3 Countries. IMF Working Paper - Asia and Pacific Department 07 (53).Viner, J., 1950. The customs union issue. Studies in the administration of international law and organization. Carnegie
Endowment for International Peace, New York.Westerlund, J., Wilhelmsson, F., 2011. Estimating the gravity model without gravity using panel data. Applied Economics
43 (6), 641–649.World Trade Organization, 1995. Analytical index: Guide to GATT law and practice, Volume 2. World Trade
Organization, Geneva.
33