impacts of kaizen management on workers: evidence from the
TRANSCRIPT

1
Impacts of Kaizen management on workers: Evidence from the Central America and Caribbean Region.
Go Shimada1 and Tetsushi Sonobe2
Abstract. – There has been renewed interest in productivity movement, especially the
diffusion of Kaizen management, as an approach to industrial development in
developing countries in recent years. While some previous studies evaluate the impact
of the introduction of Kaizen on management practices and business performance, few
studies have been conducted to assess its impacts on working conditions, wages, and
employment, especially in the long-term. We collected firm-level data in eight countries
in Central America to conduct a retrospective study of the impacts of the Kaizen project
implemented in eight countries in the Central America and Caribbean Region by the
Japan International Cooperation Agency. The project selected 94 firms to treat based on
willingness to adopt Kaizen management. Using the same criteria, we selected 182
comparable firms in the same industries in the same countries as those treatment group
firms. Employing propensity score matching methods, this study finds that the
introduction of Kaizen improved working conditions and strengthened the social capital
of workers in those firms. Managers’ willingness to pay for the Kaizen training became
higher after the training, suggesting positive effects for the firms’ performances. We
also find that managers and workers perceive the usefulness of Kaizen differently,
which offers suggestions for how to improve the design of future training programs.
Keywords: Management training, Impact evaluation, Propensity Score Matching,
Willingness to pay, Small and medium enterprises, Central America and Caribbean
Region.
JEL Classification: L2, M1, O1
1 University of Shizuoka, Japan. Email: [email protected], [email protected] 2 National Graduate Institute for Policy Studies (GRIPS), Japan. Email: [email protected]
Preliminary Draft

2
1 Introduction
There has been increasing interest among development economists in managerial capital
as “a key missing form of capital in developing countries” (Bruhn, Karlan and Schoar,
2010, p. 629). A number of randomized controlled trials of management training have
been conducted in recent years. Most of them find that even a short-term program of
basic business training or coaching can improve management practices significantly
(e.g., Karlan and Valdivia, 2011; Field et al. 2010; Berge et al., 2012; Mano et al.,
2011; Drexler et al., 2014; Berge, et al., 2014; Bruhn and Zia, 2013; De Mel et al.,
2014;). Moreover, Bloom et al. (2013) find that management training improves the
performance of the firms as well as management practices.
These studies concentrate attention on the impacts of management training and
coaching on management practices and business performance. Although they do not pay
much attention to other impacts, it seems natural to ask whether management training
improves working conditions, whether it increases employment and wages, and whether
it improves workers’ attitudes toward work and toward the acquisition of advanced
skills.
This paper attempts to assess the impacts of management training on workers by
using survey data collected from firms in eight countries in the Central America and
Caribbean, where Japan International Cooperation Agency (JICA) implemented a
technological cooperation project in 2009 to early 2012. The main purpose of this
project was to train a number of business development service providers so that they
would become able to teach Kaizen, a Japanese approach to production management
and quality control, to firms in their own countries. As an integral part of the training,

3
each of these would-be trainers introduced Kaizen management to a few firms in his or
her charge under the guidance of Japanese experts. These firms were not randomly
selected but on the condition that they showed strong interest in learning and adopting
Kaizen management. These firms constitute a treatment group in the present study.
Two and a half years later, the same division of JICA together with the same
government bodies planned to implement another Kaizen training program for small
and medium firms in the same countries in the same format and used the same criteria
to select firms to be participants in the training program. These newly selected firms are
comparable to the firms in the original program because they were selected by the same
criteria. In late 2014 to early 2015, we conducted a survey of those firms that
participated in the original program as a treatment group and those firms participating in
the new program as a comparison group. Thus, the treatment group and comparison
groups in this study are considerably comparable. Moreover this study applies
propensity score matching methods that impose the condition of common support.
These empirical strategies allow reasonably good impact evaluation.
Our survey questionnaire was designed to elicit information from both managers
and workers about workers’ working conditions, firms’ management practices and
business performance, the relationship between managers and workers, that among
workers, and workers’ attitude toward work, in order to assess the impacts of Kaizen on
these variables. Unfortunately, many sample firms were so reluctant to disclose actual
figures on their business performance that we could obtain only the percentage
increases relative to� the base year value. Thus, our attention was mostly placed on the
impacts of the introduction of Kaizen on the improvements in management practices,
working conditions, and social capital within firms.

4
We obtained the following major findings. Firstly, the introduction of Kaizen
improved both management practices and working conditions significantly. Moreover,
It also significantly strengthened social capital within firms, especially the relationships
among workers in the treatment group firms. Interestingly, both managers and workers
find that workers’ attitudes towards work became better after the introduction of Kaizen.
Among the treatment group firms, employee’s wage growth was closely correlated with
improvements in their attitudes toward work.
Secondly, at the time of recession, the treatment group firms did not lower their
wages as much as the comparison group firms. These results allow at least a few
interpretations, as we will discuss in detail below. Thirdly, managers and workers
perceive the usefulness of Kaizen differently. It takes managers some time to embrace
the Kaizen management practices. Interestingly, however, it takes workers more time to
accept the practices even in those cases in which the introduction of Kaizen is followed
by better working conditions. These findings have some implications for improving the
design of future training programs, which we will work out toward the end of this
paper.
The rest of the paper is organized as follows. The next section describes the design
of this study, followed by the descriptive analysis of the survey data. Sections 3 and 4
present estimation methods and the estimation results, respectively. Section 5 concludes
the paper with implications for policy and future research.
2 Empirical Setting and Data
2.1 Time line
A JICA sponsored project titled “Project for Capacity Building of Facilitators on

5
Improving Productivity and Quality for Small and Medium Enterprise in the Central
America and Caribbean Region” was implemented from July 2009 to March 2012 by
JICA and UTN-CECAPRO (Productivity and Quality Center of the National Technical
University) of Costa Rica.3 This project was a South-South cooperation project among
eight countries in the region: Belize, Costa Rica, Dominican Republic, El Salvador,
Guatemala, Honduras, Nicaragua, and Panama. Prior to this project, CECAPRO sent its
consultants to Japan to receive intensive training from the Japan Productivity Center in
how to teach Kaizen to private firms. During this project, the CECAPRO consultants
visited these eight countries to train the staff members of the SME support agency and
private consultants of each country.4 These would-be trainers were called facilitators in
this project and will be called so hereafter in this paper as well.
The SME support agency of each country and JICA selected 135 target firms in
total in the eight countries from among a number of firms that had applied for training
participation. The selection was not random but based on the following conditions: (1)
the firm was eager to adopt the Kaizen practices; (2) it was a small- or medium-sized
enterprise with 10 to 100 persons engaged including family members; (3) it had been in
operation for more than three years since establishment; (4) it had official corporate
status; and (5) it had not yet adopted Kaizen.
In 2015, JICA and the governments of the eight countries basically agreed to
implement a new round of Kaizen management training for SMEs. A large number of
SMEs applied for training participation in each country. In total, 182 target firms were 3 In Spanish, the center is called El Centro de Calidad y Productividad. The center was called CEFOF (Centro de Formación de Formadores y de Personal Técnico para el Desarrollo industrial de Centro América, Universidad Técnica Nacional) during the project period. The center was renamed CECAPRO recently. 4 They are called “facilitators” in this project. The data was collected by enumerators of each country under the supervision of Ms. Satomi Wakamatsu and Ms. Tamayo Ito.

6
selected from among them by SME support agencies and JICA by using the same
criteria as in the previous round of training. From all organizations concerned, we
obtained approval for an impact evaluation of the SME training part of the facilitator
capacity building project and especially for conducting a survey of the target firms of
both first and second rounds of the training program. Our intention was to use the 135
target firms in the first round implementation of the training program as the treatment
group and the 182 possible target firms in the second round implementation as the
comparison group. Thus, we started the survey started when the new round of the
training program were being prepared and finished when the training just began. Two
questionnaires were used: one for general managers and the other for employees. The
description of the basic statistics and the features of the collected data will be presented
toward the end of this section.
2.2 The training content
The most important part of the training program for the facilitators was to introduce
Kaizen to target firms in their own countries under the guidance of the CECAPRO
consultants. The cycle of the following project activities were carried out twice during
the project.
Phase 1: Training in CEPAPRO (40 hours)
Phase 2: Seminar in each country (2 days)
Phase 3: OJT training (introduce Kaizen to target firms in their own countries under
the guidance of the CECAPRO consultants) (24 weeks)
Phase 4: Training in CEPAPRO (40 hours)
Phase 5: OJT training (introduce Kaizen to target firms in their own countries under

7
the guidance of the CECAPRO consultants) (24 weeks)
Phase 6: Final examination in CECAPRO (1 day)
Phase 7: Final seminar in each country (1 day)
Phase 8: Evaluation and systematization of the activity
In each country, the CECAPRO consultant in charge of the country provided
classroom training sessions for the owners and managers of the target group firms and
sent the facilitators to the firms to benchmark the facilities, practices, and workers’ and
managers’ attitudes and provide on-site coaching services. A facilitator was in charge of
several firms and visited the firm. A CECAPRO consultant visited each of the firms that
were charged with by the facilitators under his or her supervision to give advice to the
facilitators and the firms.
2.3 Data
We collected data on sales revenue, working conditions, and employment, among
others. During our survey preparation, we found that some firms are quite open to
sharing business data, but some are not.� Therefore, instead of actual figures for those
variables, we asked for the rate of change compared with the previous year. In this way,
it is easier for firms to share that information, and it is easier for us to compare among
firms.5
Other than these business performance data, to dig into the mechanism of the
Kaizen impact, we also collected data on detailed business practices on the factory floor.
This is because Kaizen has social impacts, encouraging several changes involving
5 We chose sales revenue rather than profit rate because in many cases it takes time for some firms to calculate these figures. Since most managers are quite busy, our interviews usually lasted less than one hour.

8
employees: (1) participation; (2) visualization and (3) improving working practices
(logistics). Participation includes strengthening social capital among staff members. In
business administration, this is very well known as “QC (Quality Control) circle.”
These three factors are the drivers of Kaizen’s results.
There are three reasons for selecting these aspects. First, participation is the most
important element of all for Kaizen. Kaizen takes a bottom-up approach to operating the
firms, forming a committee or a group of workers, which is often called a Kaizen
committee (or QC circle). The Kaizen committee is a forum to promote suggestions for
improvement from workers based on their own knowledge on the ground. In this way,
workers are expected to become active participants in the firms’ operations rather than
passively waiting. Therefore, after the training, it was expected that workers’ attitudes
toward work would become more proactive. To promote worker participation, firms
work to prevent hazards in the work place. The objective is not only to make workers
participate in improving the condition of the workplace, but also to improve their
service to the customers.6
Second, “visualization” aims to identify problems in the firm, and share them
among staff members to solve them together. This is the essential foundation to promote
the participation of workers. Third, the “improvement of logistical working practices”
and the social capital in the firm build up to make big changes in the firms’
performance. These are the drivers of Kaizen.
The impacts on business performance do not come directly from these three. As
shown in Figure 1, there is an impact ladder to reach business performance. After the
6 For instance, in health sector, Kaizen is introduced not only to prevent nurses from possible infection to diseases, but also to improve nurse’s services to patients with improved working condition.

9
Kaizen training, the behavior of managers is expected to change. They are the leaders of
Kaizen to promote participation, visualization and improving working practices. Social
capital is strengthened, through active participation with other employees. Then, in the
next stage, it will lead to a behavior change in employees. If this happens, finally, the
full impact of Kaizen can emerge. When analyzing the impact of Kaizen, it is necessary
to keep this ladder in mind.
Table 1 shows the sample sizes of the treatment and comparison groups and
descriptive statistics. For the treatment group, initially 135 firms participated in the
Kaizen project. Among them, eight firms only participated an initial meeting. These
eight firms are not included in the treatment group since they did not take any training
other than the meeting. Then, from the remaining 127 firms, 94 managers accepted our
survey. As the interview takes two hours (one hour for manager and one hour for
employees), we could not get consent from 34 firms to be interviewed. From the
comparison group, 182 firms accepted our survey.
From general managers, we collected data on their educational and occupational
backgrounds, the brief history of their businesses, growth in sales revenue, employment,
marketing activities, transactions with financial institutions, public relations,
communication with workers, workers’ attitudes as well as their perception about
Kaizen and efforts to adopt Kaizen practices among other things. From employees, we
elicited information on their attitudes toward work, relationship with colleagues,
relationship and communication with the management of their firms as well as their
perception about Kaizen and efforts to adopt Kaizen practices among other things. Since
not a few general managers were reluctant or even refused outright to share business
data, we could not obtain sales revenue data but merely the annual growth rate of sales
10
revenue.
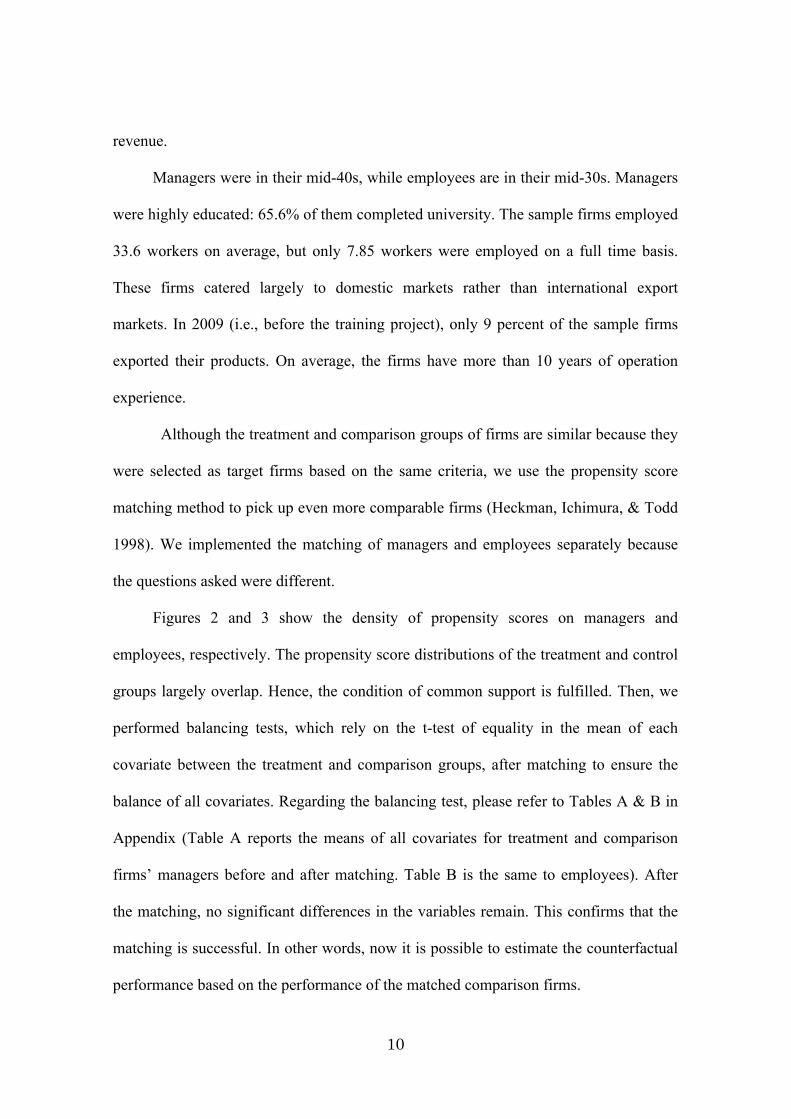
Managers were in their mid-40s, while employees are in their mid-30s. Managers
were highly educated: 65.6% of them completed university. The sample firms employed
33.6 workers on average, but only 7.85 workers were employed on a full time basis.
These firms catered largely to domestic markets rather than international export
markets. In 2009 (i.e., before the training project), only 9 percent of the sample firms
exported their products. On average, the firms have more than 10 years of operation
experience.
Although the treatment and comparison groups of firms are similar because they
were selected as target firms based on the same criteria, we use the propensity score
matching method to pick up even more comparable firms (Heckman, Ichimura, & Todd
1998). We implemented the matching of managers and employees separately because
the questions asked were different.
Figures 2 and 3 show the density of propensity scores on managers and
employees, respectively. The propensity score distributions of the treatment and control
groups largely overlap. Hence, the condition of common support is fulfilled. Then, we
performed balancing tests, which rely on the t-test of equality in the mean of each
covariate between the treatment and comparison groups, after matching to ensure the
balance of all covariates. Regarding the balancing test, please refer to Tables A & B in
Appendix (Table A reports the means of all covariates for treatment and comparison
firms’ managers before and after matching. Table B is the same to employees). After
the matching, no significant differences in the variables remain. This confirms that the
matching is successful. In other words, now it is possible to estimate the counterfactual
performance based on the performance of the matched comparison firms.

11
3 Empirical Results
Based on the matching, we calculated the ATT (average treatment-on-the-treated). As
our prime concern is the impacts of management training on workers, first, we will
analyze the social impacts especially on the working conditions of employees. We will
also analyze how Kaizen promoted participation by the workers. This is because, as
discussed, participation is the most important among the three drivers of Kaizen. Then,
we will also check the firms’ performance and willingness to pay (hereafter WTP);
Third, we will analyze the remaining two drivers of Kaizen which are visualizations and
daily working practice, meaning not only logistics, but also social capital and networks.
(1) Social Impacts
This section mainly focuses on the social impacts on employees’ participation in firms’
operations and firms’ measures to prevent accidents. Table 2 shows the PSM estimation
of the Kaizen impacts on these aspects. To estimate, we used Kernel matching and
Nearest-neighbor bias corrected estimators. Kernel matching is a nonparametric
matching estimator, and uses the weighted averages of all comparison group firms to
construct the counterfactual match for each firm (Heckman, Ichimura and Todd 1988).7
To check the robustness of the results, we employed nearest neighbor matching as well
and what was the conclusion of comparing the results of using two matching methods.
This estimator matched each treatment firm to the comparison firm with the closest
propensity score. We used the STATA command nnmatch, which corrected the bias of
7 For Kernel matching, we used bootstrap.� By bootstrap, repeated samples are drawn from the original sample, and then we can estimate standard errors and other (Khandker et al. 2010). We used a bandwidth of 0.06.

12
the treatment effect and estimated either the sample or population variance, with or
without assuming a constant treatment effect (homoskedasticity).
Columns (1) to (4) present the results� from the manager data and columns (5) to
(8) the results from the employee data. Columns (3), (4), (7) and (8) show the mean
values of what? for the treatment and comparison groups. Columns (1) and (5) adopts
Kernel matching results, and columns (2) and (6) use the nearest matching.
As columns (1) and (2) show, managers in the treatment group firms rated the
impacts of Kaizen positively on three items out of four. Those three items are:
employees’ attitude toward work, suggestions from employees, and more measures to
prevent accidents. On each item, questions were asked to both managers and employees
on their subject assessment of them. Scale of rating differs depending on the nature of
the question. For instance, regarding the attitude question, it is five-point scale (5. Very
good, 4. Good, 3. Moderate, 2. Bad, 1. Very Bad). On the other hand, the question on
accident prevention measure is three-point scale (3. Yes, perfectly. 2. Yes, moderately,
3. No).
These estimates are significant at the 1% level in both cases of using Kernel
matching and the nearest-neighbor matching. The suggestion’s contribution to profits
becomes positive at the 5% level of significance for Kernel matching, but not
significant even at the 10 percent level for nearest-neighbor matching. These differences
are evident just looking at the mean value (columns (3) and (4)). The mean values of the
treatment group firms are higher than of the control group firms. Therefore, managers
recognized the influence of Kaizen to initiate workers’ participation in the business.
As columns (5) and (6) indicate, employees found their attitude toward work
more positive after the introduction of Kaizen to their firms than before. They, however,

13
did not find themselves more willing to suggest improvements to their managers or their
firms more appropriately taking accident preventive measures after the introduction of
Kaizen than before. Thus, the managers and employees perceive the effects of the
introduction of Kaizen differently.
Judging from these results, the impact has not fully emerged yet. Kaizen has
already changed workers’ attitude. Managers and workers both recognized the change.
However, the impacts are still only halfway developed, as above results show. Our
study was conducted soon after the project, and as time goes by, the benefits are
expected to show themselves.
(2) Impacts on firms’ performance and WTP
The results of matching regarding the training effects on growth in sales revenue, wages
and employment are shown in Table 3. The numbers in columns (1) and (2) are
revenue indexes with 100 representing the level of annual sales revenue in 2009, and
similarly those in columns (3) and (4) are wage indexes. Although the existing
literature does not analyze the training impacts on wages, we pay attention to wage
because sharing increased profits due to increased efficiency between the firm and
employees is considered to encourage employees to press forward to the application of
Kaizen.8 Table 3 shows the mean of these indexes in each year from 2010 to 2013 and
the t-values for the nearest neighbors matched DID between the treatment and
comparison groups and between each of these years and the base year 2009.
8 The three guiding principles were announced in 1955 by whom?. Those were: expansion of employment, cooperation between labor and management, and fair distribution of the fruit of productivity. The principles were announced after a long negotiation between management and labor. The labor union was quite against the introduction of Kaizen as they regarded it as a tool to intensify labor. After this announcement, the labor union agreed to participate in Kaizen (Shimada 2016).

14
Columns (1) to (3) indicate that the treatment group did not increase (or decrease)
sales revenue significantly relative to the comparison group during the period under
study. This result does not give any clue about whether the treatment group would
grow in sales revenue faster than the comparison group in future. It may well be that
the treatment group focused on the assimilation of the Kaizen practices for increase
productivity, safety, and comfort in workplace. In columns (4) to (6), we do not find
evidence that the treatment group firms shared profit with their employees. The DID
for the wage index indicates that while the wage increased in the treatment group
significantly more than in the comparison group between 2009 and 2012, the
comparison group raised wages substantially in the next year to catch up with the
treatment group. Columns (7) to (9) present the data on the number of employees
during the period under study and the matched DIDs. Here again we do not find
evidence that the treatment group increased (or decreased) employment faster than the
comparison group.
Then, we analyzed the factors correlating with the wage growth. Table 4 shows
the regression results of the treatment group firms and comparison group firms
respectively. The difference is that in the comparison group firms the sales revenue
growth is significantly correlated with the wage growth, whereas in the treatment group
the improvement of work attitude is significantly correlated with the wage growth.
These results reaffirm that the managers in Kaizen firms started to evaluate workers
differently. As we have seen that Kaizen has a positive effect on workers’ attitude
toward work, it is confirmed that for managers this change is really important.
Table 5 examines whether the Kaizen training raised the WTP for the treatment
group firms. Columns 1 and 2 show the results of Kernel matching and nearest-neighbor

15
matching, respectively. The upper row shows the WTP; the lower row shows the WTP
with definitely sure. As the table shows, the WTP did not become significant. This is a
puzzling result. So, following the lead of Blumenshein et al. (2008), we take their
certainty approach and asked: “How sure are you about the answer? Are you definitely
sure or probably sure?” They find that this approach reduces the bias to a negligible
magnitude.9 The lower row is the results based on this approach. Now, the WTP has
become statistically significant. Therefore, it would be safe to say that the Kaizen
training certainly raises the WTP of managers, suggesting the positive effects of Kaizen
on firms’ performance. Furthermore, the different results between the upper and lower
rows suggest that managers tend to answer questions, by anticipating the intention of
the interviewer and trying to satisfy their interviewer with the “correct answer.”
Therefore, although this is a simple method, the certainty approach reduces the bias and
is useful to collect better data.
(3) The adoption of Kaizen practices and social capital impacts
The last aspect to study is daily working practices �not only logistics (business
practices on the factory floor), but also social capital and networks. These are the
remaining two drivers of Kaizen we discussed earlier: “visualization” and “working
practice.”
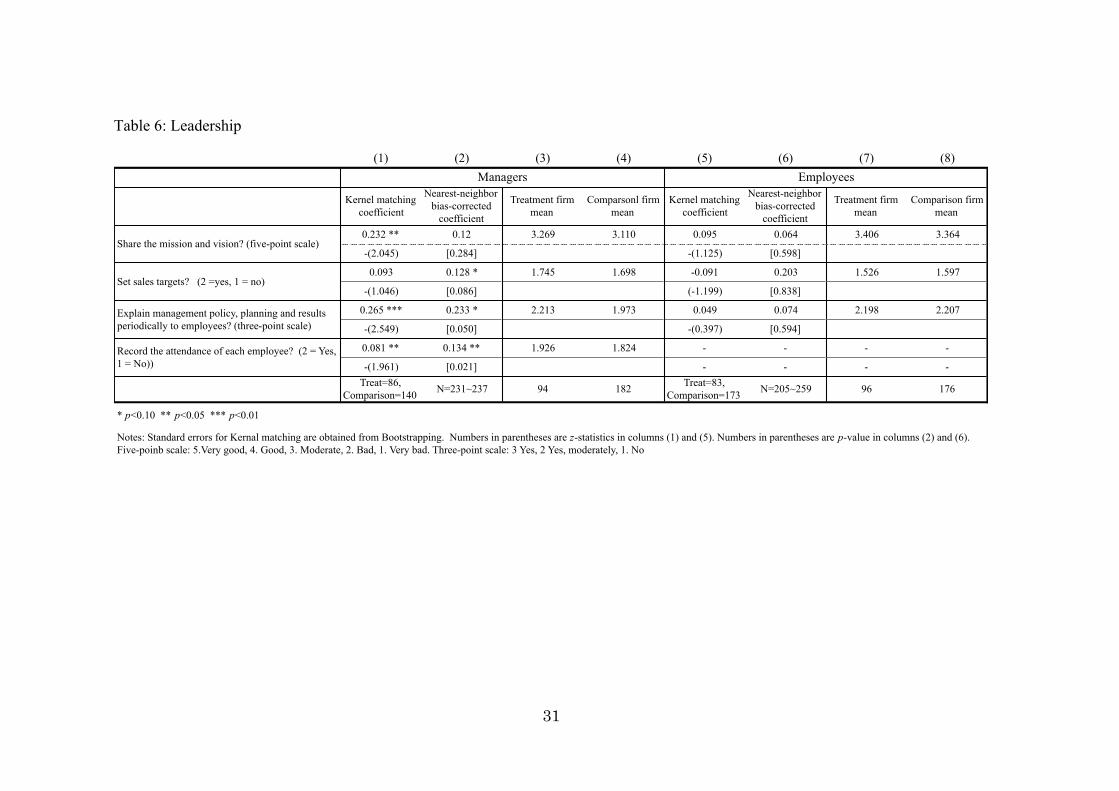
First, we analyzed how Kaizen has been actually implemented on the factory floor
to “visualize” (Table 6). As we discussed earlier, one of the essential parts of the Kaizen
activities is “visualization.” This is not just to see the situation of the firm. Rather, it is
to identify the problems of the firm and share them among employees to solve them 9 Suzuki et al. (2014) and Higuchi et al. (2015) also employed this approach.

16
together. The first step is to share basic thinking of the management of the firm: (a)
sharing the mission of the firm essential for participation. Then, the second step and
steps followed are: (b) set the sales target and share it with workers; and (c) explain
management policy, planning, and results periodically to employees. So, we analyzed
the impact of these.
On each item, questions were asked to both managers and employees on their
subject assessment of them. Scale of rating differs depending on the nature of the
question. Three-point scale (3. Yes, perfectly. 2. Yes, moderately, 3. No) were used on
“the sharing mission,” and “accident prevention” questions. The management policy
question also the same rating scale, but different catchword: (3. Yes, 2 Yes, but not
periodically, 1: No).
Table 6 shows that there is stark a difference in viewpoint between managers and
employees. It is observed that the managers in treated group firms understood the
importance of sharing this basic information with workers. It was a robust result for
“periodical explanation to workers” (at the 1% significance level for Kernel matching),
and “record of attendance of workers” at the 5% significance level. The results were
mixed for “share the mission and vision” and “set the sales targets.”
The employees of the treatment and comparison group firms differ in none of
these variables after matching, as shown in columns (5) and (6). That is to say, from
the employees’ perspective, contrary to the managers, Kaizen introduction did not make
noticeable changes so far to these aspects. Managers perceived themselves as doing
what they learned is important to do after Kaizen training, but the perception from
employees was a little bit different. These results indicate that there is room for
improvement for the future.� This also implies that it takes time for Kaizen to have an

17
effect on the ground. In any organization, changes will occur after the leader of the
organization realizes what they need to do. This institutional change does not happen
easily; it would take time.
Second, we checked more in detail whether Kaizen promoted visualization and
participation of the workers on the ground (Table 7). Questions on Kaizen practices
listed in Table 7 were asked by tree-point scale (3. Yes, 2. Yes, moderately, 1. No).
The results were mixed. For some aspects, both managers and employees
recognized the impacts, but for others the perception differed between managers and
employees. Managers recognized the positive influence in all variables (existence of the
Kaizen committee, floor plan, put tools in the designated place, clean the work space;
maintenance, sense of participation), except the last one (keep the material record every
day), although for some variables estimation results were mixed.
Employees perceived things slightly differently. For instance, labor recognized
the existence of the committee at the 1% significance level for Kernel matching.
Managers also recognized it, but the coefficient is small, and the result is not robust
(only Kernel matching became significant at the 10% level). This means the actual
operation is ahead of managers’ perception. The workers do these tasks by themselves.�
This is what Kaizen calls “participation in the operation” without being instructed to do
so. Therefore, in the treatment group firms’ workers are considered to have become
active players rather than passive labor.
The recognition of floor plan and maintenance between managers and employees
completely differs. Managers had intended to display the floor plan to give workers a
clear idea of the factory floor to initiate gradual changes, but employees did not
recognize it, so there is room for improvement in the future.� It seems both managers
18
and employees share the sense of participation.
As we have seen so far, employees’ attitudes to work have changed after the
introduction of Kaizen. Even if managers tried to lead changes in many parts of the
operation, we found that the workers could not recognize the changes on the factory
floor. This is puzzling� a result. If nothing happened on the factory floor, what is the
factor or incentive to change the workers’ attitudes toward work?
The factor could be their relations to people in the firm. So, next, we analyzed the
social capital in the firm. So far, our study found that employees do not recognize the
changes as much as managers do. In spite of that, we found their attitude has changed.
One possible reason was that Kaizen promoted social capital, one way to promote
workers’ participation in the firms’ operation, and that affects the employees’ attitudes
toward work.
Table 8 shows the results. Again, there is a stark difference between managers
and employees. There does not appear to be any positive change on managers’ social
capital this time. The first variable questions their trust toward the general public.10 The
second question asked specifically about social capital, their trust toward employees
(question to managers) or colleagues (question to employees). In both variables, the
results did not become statistically significant for mangers, but did for employees at the
5% significance level. The results are robust as confirmed by both estimators. This
indicates that Kaizen strengthens the social capital of employees. There has been a
difference between the actual operation on the ground and the impact perceived by
managers.
10 The question were asked the way the World Values Survey does their survey as follows: “Generally speaking, would you say that ? 1. Most people can be trusted, 2. You need to be careful dealing with people.”

19
Then, we checked other aspects of social capital, asking whether “crime, theft and
disorder” is an obstacle to their operation. “Crime, theft and disorder” is usually
negative relationship with outsiders. This relationship, however, is also internal in the
case of Central America and the Caribbean islands. The crime rate in this region is very
high, as the World Bank (2011) reported. During our interviews with several firms,
some managers privately revealed that they have faced extortion from their own staff
members who are connected to “maras.” The maras are a form of gang in the Central
America and Caribbean Region. As the table shows, the coefficients are negative and
significant at the 5% level. This means that after Kaizen those issues became less
problematic. It is known that high social capital is often associated with a low crime rate
(Putnam 2001).
Even if the direction of causality is not known, these results imply that after the
Kaizen the social capital inside the Kaizen firms improved. Even if the trust from
managers to employees does not improve, they generally recognize that the attitude of
employees changed. This positive change probably improved the work place
atmosphere and the relationship between managers and employees.
(4) How difficult is it for managers and workers to adopt Kaizen?
As we have seen, there are different perceptions on the progress of Kaizen. So, we
studied whether it takes time for managers and workers to adopt Kaizen (Table 9). The
table shows that all managers in the treatment group appreciate Kaizen as a management
tool. However, before the project the same managers thought of Kaizen differently. The
majority of managers did not know if Kaizen was useful for their firms. We need to
recall that they were selected as treatment group firms based on their eagerness to learn

20
Kaizen, but still they were not one hundred percent sure about the usefulness of the
method.
That is why as the table shows, at the time of introducing Kaizen, they faced
difficulty convincing their colleagues and employees to adopt this new tool. Employees
are more skeptical about introducing Kaizen than management-level staff members.
They might fear that because the new management method aims to improve
“efficiency,” they would end up losing their jobs. We also need to remember that new
management methods in many cases nowadays involve BPR (Business Practice
Re-engineering). These methods try to reduce costs, including staff costs, and end up
reducing the number of jobs for workers and/or decreasing wages. So, when managers
start to introduce new management methods, there is good reason for workers to fear
that they will lose their jobs or get lower wages. With this anxiety, workers
understandably become skeptical of a new management method when managers try to
introduce them.
This trend can be seen even in the answers to the following questions. We asked
both managers and employees when they realized the usefulness of Kaizen (Figure 4).
The majority of managers (80%) found Kaizen useful within three months, but 20%
managers took longer months. A greater portion of employees (34.94%) took more
time, even if Kaizen eventually benefitted their working conditions (including wages).
Therefore, it would be safe to say that it takes time to reap the benefits of Kaizen.
Kaizen itself is a gradual approach rather than a rapid approach since its foundation sits
on the cooperative relationship (or trust) between managers and workers (vertical) and
among workers (horizontal), which takes time to strengthen.

21
4 Conclusions
Our study found that Kaizen improved employees’ participation in the operation
of firms; strengthened social capital inside the firms, especially the relationship among
workers in the treatment group. The managers’ willingness to pay became positive after
the introduction of Kaizen, suggesting managers now realized its usefulness for their
firms’ performance.
However, this paper also found that the impacts had still not yet fully emerged.
This is because Kaizen is a gradual and bottom-up approach to improvement involving
working together among staff members. Even if this study could not confirm the
impacts on sales revenue and the number of employee, there were three encouraging
signs. First, managers now realized what they need to do. They also perceived positive
changes on their factory floors after the project. Second, even if workers do not fully
recognize all the changes that managers intend to introduce to their factories, our study
found that their level of participation and social capital in the firm strengthened. Third,
managers now appreciate workers’ participation, and value it highly, as the wages of
workers suggests.
Even if there are positive signs for the Kaizen approach, there seems to be room
for improvement, especially with the perception difference between managers and
employees. As discussed, institutionalization of Kaizen takes time. The managers now
understand the concept of Kaizen, so the next step is to institutionalize it. As a
bottom-up approach is the core of Kaizen, strengthening institutionalization is the way
to improve the efficiency of Kaizen.
This is also a classic case of asymmetry of information. Our findings suggest that
it took time for private firms to understand the usefulness. In this situation, the

22
investment becomes less than the Pareto optimal level. Therefore, support from the
government and international donors is essential to encourage firms’ to introduce
Kaizen.
Finally, this paper has a limitation. As mentioned, this paper mainly used
subjective data, rather than objective data. It was difficult to collect objective data from
private firms. The sample firms we collected data from are all SMEs. Since they are
very busy, we could not get consent from them to take more time to collect objective
data. One challenge for the future is to collect more objective data.
Acknowledgements
We would like to thank Tatsufumi Yamagata, Naohiro Kitano, Yoshinobu Ikura,
Hiromichi Murakami, Susumu Katsumata, Akihisa Tanaka, Atsuki Sakamoto, Momoko
Suzuki, Ippei Tsuruga, Masumi Okamoto, Yuka Kitamatsu, Koichi Toya, Satomi
Wakamatsu, Tamayo Ito, Takayuki Watanabe for their helpful comments and
arrangement to conduct this study. We are grateful to Satomi Wakamatsu and Tamayo
Ito for all their work data collection in the eight countries and assistance in preparing
questionnaires. This paper draws on research projects conducted at JICA Research
Institute.

23
References
Berge, L.I.O., K. Bjorvatn, K.S. Juniwaty, and B.Tungodden. 2012. Business training in Tanzania: from research-driven experiment to local implementation. Journal of African Economies, 21(5), 808-827.
Berge, L.I.O., K. Bjorvatn, B. Tungodden. 2014. Human and financial capital for microenterprise development: evidence from a field and lab experiment. Management Science 61, 707-722.
Bruhn, M. and B. Zia. 2013. Stimulating managerial capital in emerging markets: the impact of business training for young entrepreneurs. Journal of Development Effectiveness 5(2), 232-266.
Bruhn, M., D. Karlan, and A. Schoar. 2010. “What capital is missing in developing countries?” American Economic Review 100 (2), 629-633.
Blumenschein, K., G. C. Blomquist, M. Johannesson, N. Horn and P. Freeman. 2008. Eliciting willingness to pay without bias: evidence from a field experiment. Economic Journal 118, 114–137.
Drexler, A., G. Fischer and A. Schoar. 2014. Keeping it simple: financial literacy and rules of thumb. American Economic Journal: Applied Economics 6(2), 1-31.
Field, E., S. Jayachandran, and R. Pande. 2010. Do traditional institutions constrain female entrepreneurship?: a field experiment on business training in India. IFMR Working Paper Series No. 36, January. Chennai: Institute for Financial Management and Research.
Heckman, J., H. Ichimura and P. Todd. 1997. “Matching as an econometric evaluation estimator: evidence from evaluating a job training programme,” Review of Economic Studies 64, 605-654.
Heckman, J., H. Ichimura and P. Todd. 1998. Matching as an econometric evaluation estimator. Review of Economic Studies, 65(2), 261–294.
Higuchi, Y., E. P. Mhede and T. Sonobe. forthcoming. Short- and longer-run impacts of Kaizen management training: an experiment in Tanzania.
Higuchi, Y., V.H. Nam and T. Sonobe. 2015. Sustained impacts of Kaizen training. Journal of Economic Behavior and Organization 120, 189-206.
Jaumotte, F. and C. O. Buitron. 2015. Inequality and Labor Market Institutions. IMF Staff Discussion Note (July 2015). Washington D.C.: IMF.
Karlan, D., and M. Valdivia. 2011. “Teaching entrepreneurship: impact of business training on microfinance clients and institutions.” Review of Economics and Statistics 93(2): 510-527.

24
Khandker, S.R., G.B. Koolwal and H.A. Samad. 2010. Handbook on impact evaluation: quantitative methods and practices. Washington D.C.: World Bank,
Mano, Y., I. Alhassan, Y. Yoshino and T. Sonobe. 2012. “How can micro and small enterprises in Sub-Saharan Africa become more productive? The impacts of experimental basic managerial training.” World Development 40 (3), 458–468.
Putnam, R. 2001. Social capital: measurement and consequences. Isuma: Canadian Journal of Policy Research. 2 (Spring 2001): 41–51.
Rodrik, D. 1999. Democracies pay higher wages. The Quarterly Journal of Economies. Vol. 114. No.3: 707-738.
Rosenbaum, P. R. and D. B. Rubin. 1983. “The Central Role of the Propensity Score in Observational Studies for Causal Effects,” Biometrika. 70 (1). 41-55.
Smith, J.A. and P. E. Todd. 2005. “Does matching overcome LaLonde’s critique of nonexperimental estimators?” Journal of Econometrics 125 (1-2), 305-353.
Shimada, G. 2016. “Inside the black box of Japan�s institution for industrial policy � an institutional analysis of development bank, private sector and labour.” In Akbar Noman and Joseph Stiglitz, eds. Efficiency, finance and varieties of industrial policy. New York: Columbia University Press.
Solow, R. M. 1956. “A Contribution to the Theory of Economic Growth.” Quarterly Journal of Economics. 70(1): 65-94.
Sonobe, T. and K. Otsuka. 2014. Cluster-based industrial development: Kaizen management for MSE growth in developing countries. New York: Palgrave Macmillan.
Suzuki, A., H. N. Vu, and T. Sonobe. 2014. “Willingness to pay for managerial training: A case from the knitwear industry in Northern Vietnam.”�Journal of Comparative Economics. 42 (2014): 693–707
Syverson, C. 2011. “What determines productivity?” Journal of Economic Literature 49: 326–365.
World Bank. 2011. Crime and violence in Central America: a development challenge. Washington D.C.: World Bank.

25

26
Table 1: Descriptive Statistics and Sample Size
TreatmentManagers
ComparisonMangers
TreatmentEmployees
ComparisonEmployees Total
Mean(SD)
Mean(SD)
Mean(SD)
Mean(SD)
Mean(SD)
47.138 45.289 35.156 35.108 40.544(12.539) (10.927) (9.955) (10.236) (12.106)16.734 12.110 8.688 6.795 10.597
(10.358) (9.768) (6.480) (6.537) (9.127)6.543 8.528 . . 7.847
(9.184) (10.774) . . (10.283)21.920 32.619 . . 33.593
(21.098) (41.532) . . (83.231)5.730 10.490 . . 8.965
(18.057) (25.597) . . (23.513)
94 182 96 176 548
Number of full-time employees
Number of persons engaged including familymembers and excluding temporary workers
Percentage of export amount in 2009
No. of observation
Variable
Age
Years in the company

27
Table 2: Employee’s working conditions
(1) (2) (3) (4) (5) (6) (7) (8)
Kernel matchingcoefficient
Nearest-neighborbias-corrected
coefficient
Treatment firmmean
Comparison firmmean
Kernel matchingcoefficient
Nearest-neighborbias-corrected
coefficient
Treatment firmmean
Comparison firmmean
0.306 *** 0.388 ** 3.301 3.121 0.294 *** 0.215 ** 3.200 3.017
(3.078) [0.002] (3.062) [0.071]
0.233 *** 0.169 ** 2.404 2.253 0.125 0.301 2.458 2.347
(2.960) [0.075] (1.635) [0.781]
0.274 *** 0.233 *** 1.660 1.396 0.163 0.122 1.600 1.500
(3.803) [0.041] (1.200) [1.39]
0.122 ** 0.105 1.819 1.747 - - - -
(2.023) [0.163] - - - -Treat=86,
Comparisonl=140
N=231~237 94 182 Treat=83,Comparison=173 N=205~259 96 176
* p<0.10 ** p<0.05 *** p<0.01
Notes: Standard errors of Kernal matchig are obtained from Bootstrapping. Numbers in parentheses are z-statistics in columns (1) and (5). Numbers in brackets are p-value in columns (2) and (6).Five-point scale: 5.Very good, 4. Good, 3. Moderate, 2. Bad, 1. Very bad. Three-point scale: 3 Yes, 2 Yes, moderately, 1. No
Managers Employees
Employees' attitudes towards work (Five-point scale)
Employees suggest improvements (Three-point scale)
Firms take measures to prevent accidents?(Three-point scale)
Suggestions contribute to increased profit.(2 =yes, 1 = no)

28
Table 3: Sales Revenue, Wages, and Employment
(1) (2) (3) (4) (5) (6) (7) (8) (9)
Treatmentcompanies
Comparisoncompanies
Nearest-NeighborMatching
Treatmentcompanies
Comparisoncompanies
Nearest-NeighborMatching
Treatmentcompanies
Comparisoncompanies
Nearest-NeighborMatching
mean mean t-value mean mean t-value mean mean t-value
111.0 111.6 104.4 107.4 21.9 32.6[24.3] [22.2] [6.6] [13.2] [21.1] [41.5]
115.0 114.5 107.0 105.6 26.0 34.9[29.5] [24.2] [6.8] [4.7] [24.9] [45.7]
111.8 116.5 106.1 104.9 27.3 36.9[27.7] [37.4] [5.9] [6.9] [24.8] [49.8]
116.3 122.4 107.0 107.7 29.4 36.6
[31.7] [44.3] [6.1] [14.4] [28.4] [49.2]
Notes: Numbers in brackets are the standard diviation.
0.196
Sales Revenue Wages Employment
in 2010 -0.892 in 2010 -0.877 in 2010 0.185
in 2011 -0.615 in 2011 1.189 in 2011
0.083
in 2012 -1.267 in 2012 2.487 *** in 2012 0.044
in 2013 1.332 in 2013 0.533 in 2013

29
Table 4: Factors correlating with wage growth
(1) (2)
Dependent variableTreatment
firmsWage growth
Comparisonfirms
Wage growthcoefficient coefficient
0.314 0.07 ***(1.30) (5.20)
1.922 * 0.530
(1.73) (0.79)2.308 * 2.141 **(1.69) (1.92)-1.950 0.631
(-0.50) (0.27)
N 75 163R-squared 0.085 0.168
Numbers in parentheses are t-statistics.
Cons
Sales revenue growth
Work attitude of employees improved
University degree

30
Table 5: Willingness to Pay for Kaizen Training
(1) (2) (3) (4)
Kernel matchingcoefficient
Nearest-neighborbias-corrected
coefficient
Treatment firmmean
Comparison firmmean
0.031 0.041 0.819 0.813
(0.530) (0.520) (0.387) (0.391)
0.203 *** 0.180 ** 0.521 0.373
(3.122) (0.039) (0.502) (0.485)Treat=86,
Comparison=140 N=231~237
WTP
WTP +Definitely sure
* p<0.10 ** p<0.05 *** p<0.01Notes: Standard errors for Kernal matching are obtained from Bootstrapping. Numbers inparentheses are t-statistics in column (1). Numbers in parentheses are p-value in column (2).Numbers in parentheses in columns (3) and (4) are medians.
31
Table 6: Leadership
(1) (2) (3) (4) (5) (6) (7) (8)
Kernel matchingcoefficient
Nearest-neighborbias-corrected
coefficient
Treatment firmmean
Comparsonl firmmean
Kernel matchingcoefficient
Nearest-neighborbias-corrected
coefficient
Treatment firmmean
Comparison firmmean
0.232 ** 0.12 3.269 3.110 0.095 0.064 3.406 3.364
-(2.045) [0.284] -(1.125) [0.598]
0.093 0.128 * 1.745 1.698 -0.091 0.203 1.526 1.597
-(1.046) [0.086] (-1.199) [0.838]
0.265 *** 0.233 * 2.213 1.973 0.049 0.074 2.198 2.207
-(2.549) [0.050] -(0.397) [0.594]
0.081 ** 0.134 ** 1.926 1.824 - - - -
-(1.961) [0.021] - - - -Treat=86,
Comparison=140 N=231~237 94 182 Treat=83,Comparison=173 N=205~259 96 176
Managers Employees
Notes: Standard errors for Kernal matching are obtained from Bootstrapping. Numbers in parentheses are z-statistics in columns (1) and (5). Numbers in parentheses are p-value in columns (2) and (6).Five-poinb scale: 5.Very good, 4. Good, 3. Moderate, 2. Bad, 1. Very bad. Three-point scale: 3 Yes, 2 Yes, moderately, 1. No
Share the mission and vision? (five-point scale)
Set sales targets? (2 =yes, 1 = no)
Explain management policy, planning and resultsperiodically to employees? (three-point scale)
Record the attendance of each employee? (2 = Yes,1 = No))
* p<0.10 ** p<0.05 *** p<0.01

32
Table 7: Kaizen practices
(1) (2) (3) (4) (5) (6) (7) (8)
Kernel matchingcoefficient
Nearest-neighborbias-corrected
coefficient
Treatment firmmean
Comparison firmmean
Kernel matchingcoefficient
Nearest-neighborbias-corrected
coefficient
Treatment firmmean
Comparison firmmean
0.228 * 0.192 1.851 1.637 0.470 *** 0.500 ** 2.073 1.697
(1.852) (0.193) [0.892] [0.821] (4.271) (0.002) [0.874] [0.806]
0.268 *** 0.203 1.511 1.287 0.088 0.072 2.292 2.176
(2.579) (0.141) [0.839] [0.654] (1.334) (0.367) [0.457] [0.425]
0.511 *** 0.435 *** 2.109 1.768 - - - -
(5.832) (0.001) [0.791] [0.739] - - - -
0.509 *** 0.547 *** 2.606 2.155 0.262 *** 0.189 * 2.583 2.420
(5.008) (0.000) [0.609] [0.759] (3.414) (0.089) [0.574] [0.713]
0.265 *** 0.233 *** 2.176 1.955 -0.124 -0.025 2.021 2.119
(2.549) (0.050) [0.760] [0.810] (-1.041) (0.127) [0.763] [0.723]
0.283 *** 0.151 2.543 2.368 0.135 * 0.662 2.542 2.494
(2.710) (0.171) [0.667] [0.674] (1.706) (0.555) [0.648] [0.668]
0.005 0.233 2.787 2.797 - - - -
(0.091) (0.764) [0.411] [0.404] - - - -Treat=86,
Comparison=140 N=231~237 Treat=83,comparison=173 N=205~259
Employees clean their workspace at the end of everyworkday? (three-point scale)
Managers Employees
Is there a committee or group organized by theemployees in search of solutions to the problems ofthe workplace? (three-point scale)
Have a floor plan displayed on the wall of theworkplace? (three-point scale)
Employees put tools and equipment in the designatedplace? (three-point scale)
Employees clean and do maintenance using themanual? (three-point scale)
All managers and employees share the sense ofparticipation in reducing defect rate or number ofcustomer complaints? (three-point scale)Keep the material record every day (or at everytransaction) with dates, material name, amount usedand amount purchased? (three-point scale)
* p<0.10 ** p<0.05 *** p<0.01
Notes: Standard errors for Kernal matching are obtained from Bootstrapping. Numbers in parentheses are t-statistics in columns (1) and (5). Numbers in parentheses are p-values in columns (2) and (6).Three-point scale: 3 Yes, 2 Yes, moderately, 1. No

33
Table 8: Social capital and network
(1) (2) (3) (4) (5) (6) (7) (8)
Kernel matchingcoefficient
Nearest-neighborbias-corrected
coefficient
Treatment firmmean
Comparison firmmean
Kernel matchingcoefficient
Nearest-neighborbias-corrected
coefficient
Treatment firmmean
Comparison firmmean
-0.061 -0.105 1.355 1.456 0.103 ** 0.178 ** 1.375 1.318
(-0.849) (0.203) [0.481] [0.499] (1.805) (0.036) [0.487] [0.467]
0.074 -0.012 3.624 3.632 0.226 ** 0.331 ** 3.698 3.585
(0.594) (0.937) [0.806] [0.905] (1.915) (0.052) [0.964] [1.010]
(-0.477 ** (-0.517 ** 1.903 2.104 - - - -
(-2.214) (0.380) [1.554] [1.503] - - - -Treat=86,
Comparison=40 N=231~237 Treat=83,Comparison=173 N=205~259
Notes: Standard errors of Kernal matching are obtained from Bootstrapping. Numbers in parentheses are t-statistics in columns (1) and (5). Numbers in parentheses are p-values in columns (2) and (6).Numbers in brackets in columns 3, 4, 7 and 8 are medians. Five-point scale rating: 5.Very good, 4. Good, 3. Moderate, 2. Bad, 1. Very bad. Three-point scale: 3 Yes, 2 Yes, moderately, 1. No
Managers Employees
Most people can be trusted? (2 = Yes, 1 = No)
Trust employees (Manager)? or Trust Colleagues(Employee) ? (Five-point scale)
Is crime, theft and disorder an obstacle? (5: Veryserious - 1: No)
* p<0.10 ** p<0.05 *** p<0.01

34
Table 9: Managers’ Perception of Kaizen
Is 5S/Kaizen useful?
� Before After
Very useful 27 (35.0%) 77 (100%)
Useful 16 (20.8%) 0
Useful but others are
more useful 2 (2.6%) 0
Not useful 1 (1.3%) 0
Don't know 31 (40.3%) 0
Did you have any difficulty
convincing you
management-level colleague
or employees to introduce
5S/Kaizen
� To colleagues To employees
It was difficult 18 (19.4%) 43 (46.2%)
No difficulty 75 (80.6%) 50 (53.8%)

35
Figure 1: Impact ladder
Kaizen�• Visualization�• Participation�• Improving working
practice�
Behavior changes of managers • Social Capital
strengthened
Behavior changes of employees
Business Performance�

36
Figure 2. Propensity score distribution (Managers) Figure 3. Propensity score distribution (Employees)
01
23
4D
ensi
ty
0 .2 .4 .6 .8Propensity score
Comparison firms Treatment firms
01
23
4D
ensi
ty
0 .2 .4 .6 .8Propensity score
Comparison firms Treatment firms

37
Figure 4 Timing of Realizing Usefulness (Managers and Employees)
48.05%
31.17%
18.18%
1.299%1.299%
At the time of orientation In the beginningAfter three months After six monthsAfter the project
When did you realize usefulness? (Managers)
20%�
32.53%
32.53%
21.69%
2.41%10.84%
At the time of orientation In the beginning of the projectAfter three months After six monthsAfter the project
When did you realize usefulness (employees)?
34.94%�

38
Table A: Balancing test results (Managers)

39
Table B: Balancing test results (Employees)