impacts of international wheat improvement research 1994...
TRANSCRIPT
Impacts of International Wheat Improvement Research1994-2014
Maximina A. Lantican | Hans-Joachim BraunThomas S. Payne | Ravi Singh | Kai SonderMichael Baum | Maarten van Ginkel | Olaf Erenstein


Impacts of International Wheat Improvement Research1994-2014
Maximina A. Lantican1 | Hans-Joachim Braun1
Thomas S. Payne1 | Ravi Singh1 | Kai Sonder1
Michael Baum2 | Maarten van Ginkel2 | Olaf Erenstein1
1 International Maize and Wheat Improvement Center (CIMMYT)
2 International Center for Agricultural Research in the Dry Areas (ICARDA)

CIMMYT – the International Maize and Wheat Improvement Center (www.cimmyt.org) – is the global leader on publicly-funded maize and wheat research and related farming systems. Headquartered near Mexico City, CIMMYT works with hundreds of partners throughout the developing world to sustainably increase the productivity of maize and wheat cropping systems, thus improving global food security and reducing poverty. CIMMYT is a member of the CGIAR Consortium and leads the CGIAR Research Programs on MAIZE and WHEAT. The Center receives support from national governments, foundations, development banks and other public and private agencies.
International Maize and Wheat Improvement Center (CIMMYT) 2016. All rights reserved. The designations employed in the presentation of materials in this publication do not imply the expression of any opinion whatsoever on the part of CIMMYT or its contributory organizations concerning the legal status of any country, territory, city, or area, or of its authorities, or concerning the delimitation of its frontiers or boundaries. The opinions expressed are those of the author(s), and are not necessarily those of CIMMYT or our partners. CIMMYT encourages fair use of this material. Proper citation is requested.
Correct citation: Lantican, M.A., H.J. Braun, T.S. Payne, R.P. Singh, K. Sonder, M. Baum, M. van Ginkel, and O. Erenstein. 2016. Impacts of International Wheat Improvement Research, 1994-2014. Mexico, D.F.: CIMMYT.
ISBN: 978-607-8263-55-4
AGROVOC descriptors: Wheats; Varieties; Plant breeding; Seed production; Production economics;
Impact assessment; Yields; International cooperation; Regional development.
AGRIS category codes: A50 Agricultural Research
F30 Plant Genetics and Breeding
E16 Production Economics
Additional Keywords: CIMMYT
Dewey Decimal Classification: 633.11 LAN
Printed in Mexico.

iiiImpacts of International Wheat Improvement Research 1994- 2014
Tables
Figures
Acronyms
Acknowledgements
Executive summary
CHAPTER 1. INTRODUCTION
CHAPTER 2. DATA SOURCES AND METHODS
Sources and types of data
Analytical methods
CHAPTER 3. EVOLUTION IN BREAD WHEAT IMPROVEMENT AND INVESTMENTS IN WHEAT IMPROVEMENT RESEARCH
Evolution in bread wheat improvement
Investments in wheat improvement research
CHAPTER 4. GLOBAL WHEAT VARIETAL RELEASES, 1994-2014
Rates of varietal releases
Wheat growth habit and production environments of varietal releases
CGIAR contribution to wheat varietal releases
Private and public sector roles in varietal releases
Breeding objectives and attributes of wheat varietal releases
CHAPTER 5. GLOBAL WHEAT VARIETAL ADOPTION
Wheat varietal adoption
CGIAR contribution to the adoption of modern varieties
Alternative measures of CGIAR contribution to wheat varieties grown
Characteristics of wheat varietal adoption
CHAPTER 6. BENEFITS OF WHEAT IMPROVEMENT RESEARCH
Wheat yields
Benefits of wheat improvement research
Discussion
CONCLUSIONS
APPENDICES
REFERENCES AND RECOMMENDED READING
iv
v
vi
vii
viii
1
2
3
5
8
9
17
18
19
20
22
24
27
28
29
30
33
34
38
39
40
42
44
48
54
CONTENTS

iv
TABL
ES2.1 Countries that participated in CIMMYT/CGIAR global wheat impacts studies. 4
3.1 Priority traits in breeding spring bread wheat germplasm at CIMMYT. 11
3.2 Spring bread wheat international yield trials and screening nurseries distributed yearly by CIMMYT. 16
3.3 Estimated research intensity by region, area, production, and value of wheat production, 2014. 17
4.1 Average and cumulative number of wheat varieties released by region and period, 1994-2014. 19
4.2 Wheat varietal releases by moisture regime, region, and wheat type, 1994-2014. 21
4.3 Distribution of wheat area by mega-environment, 2014, with percentage comparisons to values from studies conducted in 1997 and 1990. 22
4.4 Wheat varietal releases by mega-environment and region, 1994-2014. 23
4.5 CGIAR contribution to wheat varieties released worldwide, 1994-2014. 23
4.6 Wheat varietal releases by sector and region, 1994-2014. 25
4.7 Percentage of wheat varietal releases by target trait and region, 1994-2014. 26
4.8 Reported breeding objectives by rank of importance. 27
5.1 Adoption of improved, modern varieties in 2002 and 2014 in a subset of countries covered in both surveys. 29
5.2 Area sown to different wheat types and variety classes in survey countries, 2014. 30
5.3 CGIAR contribution to modern wheat varieties adopted worldwide, 2014. 30
5.4 Area sown to different wheat types, classified by origin of germplasm, 2014. 32
5.5 Weighted average age of varieties grown by farmers, 1997 and 2014. 35
5.6 Attributes of 499 wheat varieties by region, 2014. 37
6.1 Global wheat yields and underlying growth rates. 39
6.2 Additional annual wheat production due to wheat improvement research based on two attribution scenarios, 2014. 41
6.3 Benefits from global wheat improvement research (high- and low-end estimates in parentheses). 41
6.4 Counterfactual scenarios: a world without CGIAR wheat improvement research. 43
A.1 Rates of genetic gain in bread wheat yield, developing countries. 48
A.2 Rates of genetic gain in wheat yield, developed countries. 49
A.3 ICARDA’s yearly spring bread wheat international nurseries and yield trials. 49
A.4 ICARDA’s yearly durum wheat international nurseries. 50

vImpacts of International Wheat Improvement Research 1994- 2014
2.1 Distribution of global wheat production. 3
3.1 CGIAR wheat research expenditures, 2002-14. 16
3.2 Number of CGIAR wheat improvement researchers, 2002-14. 16
4.1 Rates of release of wheat varieties, normalized by wheat area, 1994-2014. 20
4.2 Key wheat production sites in the study countries. 21
4.3 Spring bread wheat releases by region and origin, 1994-2014. 23
4.4 Spring durum wheat releases by region and origin, 1994-2014. 24
4.5 Winter/facultative bread wheat releases by region and origin, 1994-2014. 24
4.6 Spring bread wheat releases by region and breeding program, 1994-2014. 25
4.7 Spring durum wheat releases by region and breeding program, 1994-2014. 26
4.8 Winter/facultative bread wheat releases by region and breeding program, 1994-2014. 26
5.1 Spring bread wheat area shares by origin of germplasm and region, 2014. 31
5.2 Spring durum wheat area shares by origin of germplasm and region, 2014. 31
5.3 Winter/facultative bread wheat area shares by origin of germplasm and region, 2014. 32
5.4 CGIAR contribution to spring bread wheat varieties grown worldwide, 2014. 33
5.5 CGIAR contribution to spring durum wheat grown worldwide, 2014. 33
5.6 CGIAR contribution to winter/facultative bread wheat varieties grown worldwide, 2014. 34
5.7 Genetic diversity in the Elite Spring Wheat Yield Trial (ESWYT), with genetic distance measured as average Rogers distances. 37
A.1 Global wheat sites with stem rust as a production constraint. 50
A.2 Global wheat sites with leaf rust as a production constraint. 51
A.3 Global wheat sites with yellow rust as a production constraint. 51
A.4 Global wheat sites with powdery mildew as a production constraint. 52
A.5 Global wheat sites with drought and heat stresses as production constraints. 52
A.6 Global wheat sites with drought stress as a production constraint. 53
A.7 Global wheat sites with heat stress as a production constraint. 53
FIGUR
ES

vi
Benefit-cost ratio
Borlaug Global Rust Initiative
Consultative Group on International Agricultural Research
International Maize and Wheat Improvement Center
Coefficient of parentage
CGIAR Project on Diffusion and Impacts of Improved Crop Varieties in Sub-Saharan Africa
deoxynivalenol
Durable Rust Resistance in Wheat Project
End-point royalty
CIMMYT Elite Spring Wheat Yield Trial
Food and Agriculture Organization of the United Nations
Fusarium head blight
Full-time equivalent
Genealogy management system
Global Trade Analysis Project Agro-Ecological Zone
Hectare
International Center for Agricultural Research in the Dry Areas
International Crop Information System
International Model for Policy Analysis of Agricultural Commodities and Trade
Turkey-CIMMYT-ICARDA International Winter Wheat Improvement Program
Kenyan Agriculture and Livestock Research Organization
Meters above sea level
Mega-environment
Improved, modern variety
Plant breeders’ rights
Sub-Saharan Africa
Triennium ending
International Union for the Protection of Plants
U.S. Department of Agriculture–National Agricultural Statistics Service
Weighted average age
West Asia and North Africa
CGIAR Research Program on Wheat
BCR
BGRI
CGIAR
CIMMYT
COP
DIIVA
DON
DRRW
EPR
ESWYT
FAO
FHB
FTE
GMS
GTAP-AEZ
ha
ICARDA
ICIS
IMPACT
IWWIP
KALRO
masl
ME
MV
PBR
SSA
TE
UPOV
USDA-NASS
WA
WANA
WHEAT
ACRO
NYMS

viiImpacts of International Wheat Improvement Research 1994- 2014
We owe a tremendous debt of gratitude to the many people who have contributed to this report. Wheat researchers from around the world provided the basic data for this study. We are grateful for their time and effort to provide the best information available, especially Negusse Abraha, Suresh Acharya, Adnan Adary, Michel Afram, Khoshgeldi Danatarovich Agakishiev, Husnu Aktas, Ana Sofia Almeida, Azzildeen M. Al-Shamma, Fanny Alvaro, Hussien Al-zubi,Bakit Alpysbaevna Aynebekova, Mathewos Ashamo, Moustafa Azab, Carlos Tomás Bainotti, Naresh Chandra Deb Barma, Savas Belen, Roi Ben-David, Sahar Bennani, Cresencio Calle Cruz, Miguel Alfonso Camacho Casas, Ravish Chatrath, Fran Clarke, M. Nazim Dincer, Chen Dongsheng, Jose Coutinho, Fran Clark, Francisco de Assis Franco, Srbislav Dencic, Pasquale de Vita, Mahmud Duwayri, Mira Dzhunusova, Rola El Amil, Fetah Elezi, Dario Fossati, Dnyandeo Gadekar, Nihorimbere Gaspard, Nutan Raj Gautam, Seyed Mahmoud Tabib Ghaffary, Tanja Gerjets, Lisardo Jorge González, Bob Graybosch, Ana Gulbani, Edgar Guzmán Arnéz, Innocent Habarurema, Sherif Thabet Issa Hafez, Victor Manuel Hernández Muela, Julio Huerta-Espino, Bahromiddin Husenov, Makhdoom Hussain, Abdelraheem H.A. Hussein, Muhammad Ibrahim, Talai Javanshir, Saffour Kaddour, Ishwar K. Kalappanavar, Roland Kazarian, Arthur Klatt, Man Mohan Kohli, Umran Kucukozdemir, Uri Kushnir, Liu Jianjun, Sergey Nikolaevich Kulinkovich, Masatomo Kurushima, László Láng, Benvindo Macas, Nestor Machado, Peter Mavindidze, Ibrahim Mamuya, Herbert Masole, Andrea Massi, Vladimir Meglic, Ruben Miranda, Rose Mongi, Carlos Monar Benavides, Moussa Mosaad, Goodarz Najafian, Nsarellah Nasserlehaq, Zdenek Nesvadba, Peter Njau, Oluwasina Gbenga Olabanji, Izzet Ozseven, Irfan Ozturk, S. Venkata Sai Prasad, Pu Zongjun, Martin Quincke, Mahbubjon Rahmatov, Teshome Regassa, Salah Rezgui, Carlos Roberto Riede, Mozaffar Roostaei, Victor Kuzmich Ryabchun, Sami Sabry, Gharbi Mohamed Salah, Keremli Saparmuradov, Nicolae Saulescu, Ruzanna Sayodan, Ursula Schafer, Cemal Sermet, Yahya Shakhatreh, Vladimir Petrovich Shamanin, Ali Chafiq Shehadeh, Shi Xiaowei, Mahboob Ali Sial, Hoshiyar Singh, N.B. Singh, Julius Siwale, Virinder Singh Sohu, Ignacio Solis Martel, Ernesto Solís Moya, Valentina Spanic, Vija Strazdina, Sun Daojie, Muluken Bayable Tadege, Seyfi Taner, Mekuria Temtme, Dhruba Bahadur Thapa, Primoz Titan, Vicki Tolmay, Richard Trethowan, Sangay Tshewang, Riza Unsal, Patrizia Vaccino, Ondrej Veskrna, Merja Vetelainen, Eben Von Well, Wagoire William Wamala, Wu Xiaohua, Xiang Cheng, Yang Fangping, Yang Jinhua, Yang Wuyun, Yao Jinbao, Selami Yazar, Omar Zeghouane, Zhang Pingzhi, Zhang Yelun, Zhang Yueqiang, Zhao Hong, Zhu Zhanwang, and Zafar Ziyaev.
We are also grateful to those who forwarded the query/questionnaires to their colleagues/other wheat experts, particularly Carl Bulich, Hadi Bux, Luigi Cattivelli, L. Cseuz, Ephrame Havazvidi, Marja Jalli, Francois Koekemoer, Bona Lajos, Zacharia Malley, Hafiz Muminjanov, Frank Ordon, Ivan Rwomushana,
and Roberto Tuberosa. Thanks also to Eric Huttner for the useful reference material he gave for this report.
Many CIMMYT colleagues also afforded support for this report, especially in following up on the return of questionnaires, data collection, and data validation. We thank Bekele Abeyo, Beyhan Akin, Akhter Ali, Karim Ammar, Jorge Enrique Autrique Ruiz, Sridhar Bhavani, He Zhonghu, Muhammad Imtiaz, Arun Kumar Joshi, M.R. Jalal-Kamali, Muratbek Karabayev, Li Simin, Alexei Morgounov, Rajiv Kumar Sharma, Wang Xin, Amor Yahyaoui, and Yuriy Zelenskiy. Other CIMMYT colleagues have provided additional wheat-related information: we are grateful to Irene Christiansen, Cesar Mariano Cossani Rial, Maria Laura Donnet, Susanne Dreisigacker, Maria Luz George, Moti Jaleta, Dil Rahut, Matthew Reynolds, Darell Sison, Graham Sim, Chloé Konig Kleinsmidt, Petr Kosina, Jennifer Marie Nelson, Maria Emilia Arredondo Fernandez Cano, Newman Edmundo Montes Samayoa, Martin Rodríguez Velasquez, Maria Teresa Rodríguez, and Ariel Saffer. We also thank María Concepción Castro Aragón for the Spanish translation of the questionnaire for Latin America and Karlygash Dyussembayeva for the translation of questionnaires from English to Russian for former Soviet Union countries, as well as for translating responses from Russian to English.
Likewise, other former CIMMYT colleagues have provided help during the initial stage of this study, in particular, Federico Carrión, Morten Lillemo and Reynaldo Villareal.
Colleagues from ICARDA provided wheat-related information and helped validate data; for this we thank Ahmed Amri, Filippo Bassi, Zewdie Bishaw, Salah Chouki, Mohamad El Mourid, Mesut Keser, Erwin Lopez, Hassan Machlab, Ahmed Mazid, Ram Chandra Sharma, Abdul Rahman Manan, and Tadesse Wuletaw.
We are deeply grateful to Jesper Norgaard for his tireless curation of wheat variety pedigrees, providing an additional parser, and the BROWSE application. Similarly, we thank Arlett Portugal and Graham McLaren for their help in the initial phase of the pedigree analysis, and Erico Panergalin for his excellent assistance in data processing/graphics.
We are extremely grateful to Victor Kommerell and the WHEAT CRP for funding and supporting this study.
Finally, we greatly thank CIMMYT science writer Mike Listman for editing this report and Bosen Zhou and Eliot Sánchez Pineda for its design, overall production, and printing.
– Mina LanticanACKN
OWLE
DGEM
ENTS

viii
This study documents for 1994-2014 the global use of improved wheat germplasm and the economic benefits from international collaboration in wheat improvement research funded by CGIAR and involving national agricultural research systems,1 CGIAR organizations, and advanced research institutes. Conducted by the CGIAR Research Program on Wheat (WHEAT), this is the fourth in a series of global wheat impact assessments (Byerlee and Moya 1993; Heisey et al. 2002; Lantican et al. 2005) initiated by the International Maize and Wheat Improvement Center (CIMMYT). It updates data and earlier analyses from the most recent, previous study, covering 1988-2002 (Lantican et al. 2005).
Data were collected through questionnaires sent to public and private wheat breeding programs in 94 countries that produce at least 5,000 tons of wheat per year. Responses were received from 66 countries (a response rate of 70%) representing about 80% of world wheat production and from 44 developing countries that account for 99% of the wheat grown in the developing world. Survey data were complemented with
information from other sources, including inter alia online resources, published varietal guides, figures on wheat varietal area insured or grown, scientific journals, technical bulletins, the US Department of Agriculture National Agricultural Statistics Service (USDA-NASS), Annual Wheat Newsletter, and wheat area, production and yield statistics from the Food and Agriculture Organization of the United Nations (FAO). Pedigree analysis using the BROWSE2 application served to determine the CGIAR contribution to wheat improvement research. A simple economic surplus model was used to estimate the benefits attributable to international wheat improvement research.
Adoption of high-yielding improved varieties of wheat had increased since the previous study. A paired comparison of 32 countries revealed an increase in adoption from 93% in 2002 to 97% in 2014.
Globally, CGIAR-related varieties covered about 106 million (64%) of the study countries’ 165.7 million hectares sown in 2014. This study's area coverage
represented three-quarters of the world’s wheat area (222 million hectares3) in 2014. The rest of the area not covered is mainly in developed countries such as France, the United Kingdom, other EU-28 member countries, other areas of the Russian Federation (represented in this study by the Omsk region only) and Australia’s wheat areas aside from Western Australia (covered in this study).
Output, as measured by the rate of releases of improved wheat varieties, has been particularly high in recent years: 2010-14 accounted for nearly a quarter of the 4,604 improved varieties released by public national research organizations and private seed companies since 1994, which may be due to the introduction of rust-resistant varieties in recent years. Public breeding programs were the main source of varietal releases (63%), followed by the private-sector (37%). In Latin America, especially Argentina and Brazil, private companies had a greater role, accounting for 53% of wheat varietal releases.
CGIAR-related varieties accounted for 63% of all releases. In South Asia – home to more than 300 million undernourished people and whose inhabitants consume
EXECUTIVE SUMMARYImpacts of International Wheat Improvement Research, 1994-2014
DATA AND METHODSRESULTS
1 This includes publicly-funded breeding and extension programs, private companies, universities in developing countries, and non-governmental and community-based organizations.
2 BROWSE is a part of the International Crop Information System (ICIS) program that extracts the required pedigree information, counting selfing generations and identifying common ancestors of sister lines (McLaren et al. 2007).
3 Derived from FAOSTAT January 2016.

ixImpacts of International Wheat Improvement Research 1994- 2014
over 100 million tons of wheat each year– 92% of the varieties released contained CGIAR breeding contributions and half of the spring bread wheat varieties were direct releases of CGIAR breeding lines. In Latin America, 70% of the spring durum (pasta wheat) varietal releases were CGIAR breeding lines used directly. In Sub-Saharan Africa, direct releases of CGIAR lines comprised 63% of the spring durum wheat varieties and in West Asia and North Africa, 52%. CGIAR breeding contributions were present in 71% of released winter/facultative bread wheat in West Asia and North Africa.
The CGIAR share of improved wheat area in 2014 was highest in the main target regions of the developing world (South Asia and Africa). The share with contributions from CGIAR centers was quite large in high-income countries. In China, 28% of all wheat area was sown to CGIAR-related germplasm in 2014.
The study confirmed that international wheat improvement research continued to generate very high returns. Annually some US $30 million [2010] was being invested by the CGIAR in international wheat improvement research. In recent years funding had come primarily through bilaterally-funded research conducted with partners worldwide by CIMMYT and the International Center for Agricultural Research in the Dry Areas (ICARDA) and including since 2012 approximately US $6 million per year for WHEAT. CGIAR organizations develop and freely share global public goods and depend on national partnerships to achieve meaningful farm-level impacts, but national co-investments are not estimated here.
The yield gain attributable to wheat improvement research is the main factor
in the estimation of annual benefits, and includes both the growth in yield potential and the averted yield decline due to yield maintenance. Two attribution scenarios were used: (1) historic average increase over base yield (observed average yield increase over the base yield for the reference period), and (2) marginal yield increase by longevity (observed annual marginal yield increase at the end of the reference period multiplied by a “persistence” factor representing an expert estimate of the longevity of the marginal yield gain). Annual benefits4 generated from global wheat improvement efforts ranged from US $6.7 billion to $9.4 billion [2010]. These benefits are attributable to global wheat research that includes the contributions of CGIAR, national agricultural research systems, and advanced research partners.
Based on the BROWSE-generated CGIAR contribution (0.33), the benefits attributable specifically to wheat improvement research by CGIAR organizations ranged from US $2.2 billion to $3.1 billion [2010] per year – levels that confirm and exceed estimates from earlier studies and largely reflect expanded area under improved varieties and a higher reference price for wheat.
The benefit-cost ratio for CGIAR wheat improvement efforts ranged from 73:1 to 103:1 and appears dramatically to justify the investments made. Note that these estimates do not encompass benefits from non-yield traits such as improved grain quality or fodder quality, straw strength, or shortened growth cycles, all of which would further boost the returns.
Consistent and sustainable future funding is critical to maintain an efficient and effective global wheat germplasm improvement pipeline, able to respond to emerging threats and opportunities and allowing farmers to satisfy the demand for wheat for the 9 billion-plus world population expected by 2050.
THE RETURNS ON INVESTMENTS IN INTERNATIONAL
AGRICULTURAL RESEARCH FOR DEVELOPMENT FOR WHEAT
4 Annual benefits were estimated by applying a simple economic surplus model, crediting wheat improvement research with the value of the additional grain production. The physical quantities of the additional grain production were translated into value terms by multiplying them with a reference price of wheat. The benefits were expressed in real terms (2010 US $) to remove inflation effects.

01INTRODUCTION

1Impacts of International Wheat Improvement Research 1994- 2014
Wheat is a major source of calories and protein for consumers in developing countries. The “Green Revolution” improved the national food security and welfare of the poor in developing countries in the second half of the 20th century. However, investments in crop breeding research have slowed down subsequently, putting pressure on both national and international wheat improvement programs, and wheat productivity increases now lag behind population growth. Continued investments in agricultural innovation and productivity growth are as essential today as in the early years of the Green Revolution (Pingali 2012), particularly as global cereal production must increase by an estimated 56% between 1997 and 2050, with developing countries accounting for 93% of cereal demand growth by 2050 (Rosegrant and Cline 2003).
Since 1990, CIMMYT – the principal center for wheat research of the Consultative Group for International Agricultural Research (CGIAR) – has led three global studies (Byerlee and Moya 1993; Heisey et al. 2002; Lantican et al. 2005) on the impacts of international wheat breeding research in the developing world. These studies showed that:
• The adoption and diffusion of modern wheat varieties continued in the post-Green Revolution era.
• Improved wheat germplasm developed by CIMMYT’s wheat breeding program continued to be used widely by breeding programs in developing countries.
• Public investment in international wheat breeding research continued to produce high rates of return.
The present study on the global impacts of improved wheat germplasm updates and expands the data and analyses of the 2002 study and was commissioned and funded by the CIMMYT-led CGIAR Research Program on Wheat (WHEAT; http://wheat.org).
In line with the previous efforts, this study:
• Examined the use of improved wheat germplasm in the world.
• Documented the contribution of national agricultural research systems, the private sector, and the CGIAR to international wheat improvement research.
• Estimated the benefits generated by international wheat improvement research and CGIAR investments.
• Was designed to increase awareness about the value of international wheat improvement research.
Following this introduction, Chapter 2 describes analytical methods and the sources and types of data used. Chapter 3 discusses the evolution in bread wheat improvement and investments in wheat improvement research. Chapter 4 analyzes wheat varietal releases in the world from 1994 to 2014 by origin, wheat type, growing environment, and region. Chapter 5 examines the use of improved wheat germplasm in the world using similar categories, as well as selected adoption characteristics such as varietal turnover and attributes of adopted varieties. Chapter 6 presents and discusses the estimated research benefits that can be attributed to international wheat improvement efforts and specifically, to CGIAR wheat improvement research. Chapter 7 presents concluding thoughts and discussion.

2
02DATA AND METHODS

3Impacts of International Wheat Improvement Research 1994- 2014
From some countries where respondents provided information on varietal releases but no data on varietal use, we used the following sources:
• CANADA. As a proxy for area sown to specific varieties, we used online data for area insured.
• USA. We used lists of varieties and corresponding area coverage from wheat surveys and the United States Department of Agriculture National Agricultural Statistics Service (USDA-NASS) listing of 2014 wheat varieties grown in major wheat-producing states (Colorado, Kansas, Montana, North Dakota, Oklahoma, South Dakota, Texas, and Washington), as well as the following state surveys: “Idaho Wheat Commission’s 2013 Wheat Variety Survey” and the “Wheat Commission’s 2014 California Wheat Variety Survey.”
• AUSTRALIA. We included data only from Western Australia, derived from the “2014 Wheat Variety Guide for Western Australia,” which lists varieties and percentage of area sown for each.
Information on pedigree, year of release for several previously unknown varieties, and attributes (in some cases) were obtained from the Journal of Plant Registrations, Crop Science, Technical Bulletin, Annual Wheat Newsletter, and other scientific papers.
Information captured through the survey was complemented with data and information provided by or compiled from these sources:
• Public agricultural research programs, including ministries of agriculture, research and extension institutes, and universities.
• CIMMYT and ICARDA offices worldwide.
• Private sector scientists and managers.
• Diverse sources of information about wheat varieties, including online lists, published variety guides, and lists of wheat varietal areas insured or grown.
• Scientific papers in journals.
• The World Wheat Book (Bonjean and Angus 2000; Bonjean et al. 2011).
SOURCES AND TYPES OF DATA
We conducted a global survey of wheat experts, primarily in public wheat breeding programs, sending questionnaires to the 94 countries that produce at least 5,000 tons of wheat each year (Figure 2.1). Sixty-six countries that together produce about 80% of the world’s wheat responded. This is a 70% response rate and represents a greater number of wheat-growing countries than those covered in previous such studies (Table 2.1). Of the countries from which responses came, 44 are developing countries that collectively account for 99% of developing world wheat production, 11 belong to the EU-28, and the remaining 11 are other industrialized countries. The study covers wheat sown on about 166 million hectares, which represent three-quarters of the world’s wheat area (about 222 million hectares5 in 2014).6 Production constraints cited in survey responses for key wheat-growing locations are shown in Figures A.1–A.7.
Figure 2.1. Distribution of global wheat production.Data (2005) and aggregation based on You et al. 2014.
5 Derived from FAOSTAT, January 2016.
6 The remaining wheat areas not covered in the study were from countries such as France, United Kingdom, Germany (only list of released varieties received, no adoption data), remaining wheat areas of the Russian Federation (represented in the study by the Omsk region), Australia’s other wheat areas (represented in the study by Western Australia), Spain’s remaining areas (only Andalusia covered), and other relatively small wheat-producing countries wherein we did not receive data nor have online data available.

4
a The year is the year of the survey; the figures in brackets are the total number of study countries.
b Only Western Australia’s wheat area is covered in this study.
c Only Omsk region’s wheat area is covered in this study.
d Only Andalusia’s wheat area is covered in this study.
AlgeriaArgentinaBangladeshBoliviaBrazilBurundiChileSouth ChinaColombiaEcuadorEgyptEthiopiaGuatemalaIndiaIranJordanKenyaLebanonLibyaMexicoMoroccoMyanmarNepalNigeriaPakistanParaguayPeruSaudi ArabiaSudanSyriaTanzaniaTunisiaTurkeyUruguayYemenZambiaZimbabwe
AfghanistanAlgeriaArgentinaBangladeshBoliviaBrazilChileChinaColombiaEcuadorEgyptEthiopiaGuatemalaIndiaIranJordanKenyaLebanonMexicoMoroccoNepalNigeriaPakistanParaguayPeruSouth AfricaSudanSyriaTanzaniaTunisiaTurkeyUruguayYemenZambiaZimbabwe
AfghanistanArgentinaArmeniaAzerbaijanBangladeshBoliviaBrazilChileChinaColombiaCzech RepublicEcuadorEgyptEstoniaEthiopiaGeorgiaHungaryIndiaIranKazakhstanKenyaKorea DPRKyrgyzstanLatviaLithuaniaMacedoniaMexicoMoroccoNepalPakistanParaguayPeruPolandRomaniaRussiaSlovakiaSouth AfricaTajikistanTurkeyUkraineZambiaZimbabwe
AfghanistanAlbaniaAlgeriaArgentinaArmeniaAustraliab
AzerbaijanBangladeshBelarusBhutanBoliviaBrazilBurundiCanadaChinaCroatiaCzech RepublicEcuadorEgyptEritreaEthiopiaFinlandGeorgiaGermanyHungaryIndiaIranIraqIsraelItalyJapanJordanKazakhstanKenyaKyrgyzstan
LatviaLebanonMexicoMoroccoNepalNigeriaPakistanParaguayPortugalRomaniaRussian Federationc
RwandaSerbiaSloveniaSouth AfricaSpaind
SudanSwitzerlandSyrian RepublicTajikistanTanzaniaTunisiaTurkeyTurkmenistanUgandaUkraineUnited StatesUruguayUzbekistanZambiaZimbabwe
Table 2.1. Countries that participated in CIMMYT/CGIAR global wheat impacts studies (the number of countries appears in brackets).a
1990 <37> 1997 <35> 2002 <42> 2014 <66>Byerlee and Moya 1993 Heisey et al. 2002 Lantican et al. 2005 Lantican et al. 2016

5Impacts of International Wheat Improvement Research 1994- 2014
We examined pedigree information for wheat varieties released since 1994 and for cultivars grown during 2013-14 to determine CGIAR contributions, if any. We also performed pedigree analysis using BROWSE, an application of the International Crop Information System (ICIS; McLaren et al. 2005) that extracts the required pedigree information, counting selfing generations and detecting common ancestors of sister lines (McLaren et al. 2007). BROWSE can easily analyze the pedigrees of more than a thousand varieties for 12 generations or more. The database used includes ICIS GMS v. 5.5.013 (central database) and a local genealogy management system (GMS) that incorporates the varieties analyzed.
All pedigrees were curated to ensure accuracy and correct syntax before applying BROWSE and, where the output was not in line with prior knowledge of genetic contributions, we rechecked and corrected the pedigree and re-applied BROWSE. The output for each variety comes in the form of a Mendelgram showing a table of progenitors with their type, contribution, count, and origin. This essentially represents the coefficient of parentage (COP) between a line and an ancestor; that is, the probability that a randomly chosen, unselected allele in the target genotype comes from the progenitor.
ANALYTICAL METHODS
PEDIGREE ANALYSIS
VARIETAL ORIGIN CATEGORIES
VARIETAL CONTRIBUTION
Wheat varietal releases and adoption were categorized into five sub-sets based on the pedigree analysis:
Category 1: CIMMYT/ICARDA (CGIAR) line. This means that the cross and selection were made by CIMMYT or ICARDA or involved a direct cross from CGIAR collaboration.7 Lines in this category may have been re-selected by a national breeding program. In most cases, these varieties were selected from international yield trials and observation nurseries distributed annually by both centers to the global wheat breeding community.
Category 2: CIMMYT/ICARDA (CGIAR) parent. A national program or private sector cross using one or more CGIAR parents, these are usually selected from international yield trials or observation nurseries or received directly from CIMMYT or ICARDA on special request.
Category 3: CIMMYT/ICARDA (CGIAR) ancestry. A national program or private sector cross that has CGIAR germplasm as a grandparent or more distant ancestor, regardless of how far back in the pedigree tree the center germplasm has been used.
Category 4: Non-CGIAR variety. A variety whose pedigree contains no known contribution from CGIAR germplasm.
Category 5: Unknown variety. A variety for which we had no pedigree information or whose origin was not known.
Categories 2 and 3 include crosses made by national programs or companies in their home country and released there, or varieties introduced and released in a country other than where the original cross was made.
Based on the preceding categories, we applied a set of measures (rules) to assign credit for varietal contributions from specific improvement programs or crosses. The present study applied three of the same attribution measures as two previous global wheat impact studies (Heisey et al. 2002; Lantican et al. 2005). The measures are listed here in decreasing order of restrictiveness and indicating to which varietal origin category the rule relates:
• The “CGIAR cross” rule is the most restrictive; it assigns credit only to Category 1 varieties.
• The “CGIAR cross plus parent” rule assigns credit to both Category 1 and Category 2 varieties.
• The “any CGIAR ancestor” rule gives full credit to varieties belonging to any of Categories 1-3. In the present study, we applied this rule only to provide a point of comparison with the rules above and to pick up the extent of varieties that contain any degree of CGIAR contribution, without weighting the contribution.
In all cases, BROWSE was used to assess the extent of the contribution of germplasm from CIMMYT or ICARDA.
7 Includes varieties developed through Turkey-CIMMYT-ICARDA (TCI) collaboration.

6
The number of continuous years that a given variety has been sown is a good gauge of the rate at which varieties are being replaced. In the “weighted average age” approach (WA; Brennan and Byerlee 1991), the “age” of a variety since its release is weighted by the area sown to it. For a given year, t, the measure would be computed as follows:
WA = Σ (pit Nit)
Where pit is the proportion of the area sown to variety i in year t; Nit is the number of years (at time t) since release of variety i.
VARIETAL REPLACEMENT
We estimated the yield growth rate using FAO farm-level wheat yield data for the 44 developing (study) countries for 1994-2013 (2013 being the most recent year for which yield data were available) and then for all wheat-producing countries in the world for the same period, in both cases applying a log-linear trend regression:
ln(Y) = α + βX
where α is constant; ln(Y) the natural logarithm of yield Y; β is the growth rate of Y; X the time (years). This is a semi-logarithmic regression where gains are expressed as the average percentage change per year.
YIELD GROWTH
Crop breeding is a continuous process wherein costs are incurred and benefits obtained over time. Benefits in any given year are accrued returns to investments made over an extended period, just as investments in any given year produce benefits over an extended period.
Returns to investment are hence ideally estimated in terms of dynamic flows;
SURPLUS MODEL
There are three major problems in estimating benefits of crop breeding programs (Morris and Heisey 2003):
1. Measuring adoption of improved modern varieties (MVs). It is difficult to get accurate data on area planted to MVs. Interpretation of what constitutes an MV can also be problematic. Here we refer to an MV as an improved wheat variety resulting from global wheat improvement research (CGIAR, national program, private sector) released since 1994.
2. Estimating the benefits from modern varietal use. Main difficulties include: (a) estimating farm-yield gains; (b) identifying yield gains attributable to MV adoption versus those from improved crop management; and (c) drawing counterfactual scenarios; that is, what would have happened in the absence of the evaluated wheat improvement research? Other difficulties, such as accounting for non-yield benefits, modeling aggregate price effects, or accounting for policy distortions, are not covered in this study.
3. Attribution. Attributing credit to the many wheat improvement programs that contribute to developing an MV presents challenges. These include dealing with spillovers between different research programs and disentangling complementarities between the performance of the research system and that of supporting institutions and structures; for example, the seed supply system, the extension service, the marketing system, and transportation and communications infrastructure. This is an important issue which could be pursued in the future.
BENEFIT STREAM
that is, investments in period A lead with a lag to benefits in period B and need to be discounted (Byerlee and Moya 1993). Crop improvement however is a continuous activity that requires annually recurring investments to maintain an associated benefit stream. A simplification used in this study compares annual recurring investment to annual incremental benefits.

7Impacts of International Wheat Improvement Research 1994- 2014
The CGIAR investment in wheat improvement research goes primarily to CIMMYT and ICARDA, the two international centers leading CGIAR wheat improvement research. Both centers engage not only in plant breeding but also in research-for-development activities around wheat agri-food systems, including crop and resource management research, social science research, training and capacity building, networking, and knowledge management. Congruent with Heisey et al. (2002) and Lantican et al. (2005), to single out the portion of the centers’ overall budget that is spent on wheat improvement research, we used two measures:
• Expenditures 1 is based on the assumption that all wheat research staff– both breeders and other scientists– contribute to wheat improvement research. The CGIAR investment in wheat improvement research is thus estimated by multiplying the pooled center budgets by the ratio of wheat senior staff to the total number of senior staff in the centers.
• In Expenditures 2, we assume that 65% of the centers’ wheat research budgets is committed to wheat improvement, plus a 26% associated overhead. The current levels of CGIAR and center investments in wheat improvement research are discussed in the next chapter.
The gross annual benefits generated by international wheat improvement research were estimated using a simple economic surplus model, crediting wheat improvement research with the value of the additional grain production. The physical quantities of additional grain were translated into value terms by multiplying them with a reference price of wheat:
Bt = At yt Pt
where B = value of additional production attributable to wheat improvement research; A = area sown to improved wheat varieties; y = yield gain attributable to wheat improvement research; P = the price of wheat grain.8
The area sown to modern wheat varieties was estimated using data from the 2014 global wheat survey and totaled 149.1 million hectares.
The yield gain attributable to wheat improvement research is the main factor in the annual benefits reported, and includes both the growth in yield potential and the averted yield decline due to yield maintenance. We used two attribution scenarios:
• Historic average yield increase over a base yield. We credited wheat improvement research with the observed average yield increase over the base yield for the reference period.
• Marginal yield increase by longevity. We credited wheat improvement research with the observed annual marginal yield increase at the end of the reference period multiplied by a “persistence” factor representing an expert estimate of the longevity of the marginal yield gain. We estimate the yield gain benefits (including both the growth in yield potential and the
COST STREAM
“maintenance” of yield against factors such as evolving crop disease strains) to last fully for only 3 years, and then to decline linearly to 0 over the subsequent 8 years. After discounting the future yield gains at 5%9 p.a., the persistence factor amounts to 5.6 for a 10-year longevity scenario.10
9 Discount or interest rate used in determining the present value of future gains.
10 The persistence factor for a 10-year longevity scenario and a high-end annual increment of 0.0464 t/ha (1.46% p.a.) would yield a cumulative incremental production of 0.260 t/ha – approximating the actually observed average yield increase of 0.292 t/ha from TE1993 to TE2013 over the TE1993 baseline yield (derived from FAOSTAT).
8 The additional wheat is valued using the international price of wheat, based on the export price of the North American hard red winter wheat (U.S. Gulf ports). In 2014, the average price was equivalent to US $267/t in 2010 US $. However, instead of this, the average real prices of wheat for the study period (1994-2014) US$ 215/t (2010 $) was used to have a more conservative estimate of annual benefits.

8
03EVOLUTION IN BREAD WHEAT IMPROVEMENT AND INVESTMENTS IN WHEAT IMPROVEMENT RESEARCH

9Impacts of International Wheat Improvement Research 1994- 2014
The structure of the international wheat breeding system was outlined by Heisey et al. (2002). Likewise, Lantican et al. (2005) described the evolution of the CIMMYT wheat breeding program, drawing heavily on information in global wheat impacts studies. This chapter summarizes the evolution in bread wheat improvement to enhance genetic gains for grain yield, disease resistance, abiotic stress tolerance, and end-use and nutritional quality, as well discussing current CGIAR investments and research intensity in wheat improvement.
EVOLUTION IN BREAD WHEAT IMPROVEMENTThe improved bread and durum wheat germplasm developed at CIMMYT and ICARDA targets most wheat-production environments in the developing world. The CIMMYT spring bread wheat breeding program, initiated in Mexico in 1944 by Nobel Peace laureate Dr. Norman E. Borlaug and continuing today, achieves two generations of selection each year by shuttling segregating populations and advanced breeding lines between two contrasting field environments in Mexico (Braun et al. 1996). Shuttle breeding was expanded in 2008 to include the research station at Njoro, Kenya. Operated by the Kenyan Agriculture and Livestock Research Organization (KALRO) and located in an area that experiences frequent and intense natural infections of wheat stem rust caused by the Ug99 race group of Puccinia graminis, the facility is used to screen thousands of wheat lines each year from breeding programs worldwide for resistance to that pathogen.
In the last decade phenotyping in CIMMYT’s global wheat program has expanded significantly to address the performance of wheat breeding lines under heat and drought, resistance to a range of diseases, end-use processing traits, and nutritional quality. The lines developed through this accelerated breeding and testing process are
distributed and tested worldwide in yield trials and screening nurseries, and the fraction of materials thus selected are used to make new crosses.
The concept of wheat mega-environments (MEs; Rajaram et al. 1994) was introduced to better target the crossing program in Mexico and the deployment of appropriate germplasm to diverse production environments worldwide. Mega-environments are geographical areas, though not necessarily contiguous, where wheat adaptation can be expected to be similar, due either to similar climatic, disease or crop-management constraints. In recent years there appears to be more frequent overlap between mega-environments that were previously clearly delineated, a phenomenon possibly due to climate change effects and expected to become more pronounced. As one result, new wheat varieties will need to feature not only superior yield potential but also increased tolerance to drought and heat stress, better disease and pest resistance, more stable processing traits, and better nutritional qualities. The CIMMYT wheat breeding program is evolving continuously to develop superior and diverse improved germplasm that can continue enhancing productivity and nutrition in target areas of adaptation.

10
Increasing grain yield, yield stability, resistance/tolerance to biotic and abiotic stresses, end-use and nutritional quality characteristics are among the most important breeding objectives at present and will remain so in the future, considering that most of the wheat in developing countries will be consumed by humans. In developing countries, where population pressure continues to increase while land and water resources decline due to urbanization and unsustainable use, the options to raise productivity are genetic enhancement or improved crop-management.
Led by CIMMYT under WHEAT and in collaboration with other international centers and numerous national and advanced research institutions, the International Wheat Improvement Network (IWIN) continuously adjusts breeding objectives and schemes for effectiveness and efficiency and to tailor required germplasm products. In one example, as water resources decline farmers will need new wheat varieties that are both high-yielding and that use water more efficiently for irrigated areas, or that feature improved drought tolerance for rain-fed growing conditions. Improved varieties that tolerate heat stress are required for all MEs. Improved germplasm distributed through international trials and nurseries must feature a range of maturity types, as part of adaptation in diverse environments.11 Finally, new varieties also need desirable end-use and nutritional qualities for local and global markets.
Researchers are thus attempting to breed new varieties that combine core traits listed in Table 3.1 and to add resistance to diseases and pests.
BREEDING OBJECTIVES
BREEDING FOR GENETIC YIELD GAINS
Various studies have shown that increases in wheat yield potential are associated mainly with increased biomass, kernel number, kernel weight, and harvest index. Recent CIMMYT studies show that yield potential continues to increase and that large kernel size, an important trait in local markets of various developing countries, could be contributing (Lopes et al. 2012, Sharma et al. 2012). Wheat germplasm recently developed at CIMMYT has shown both increased yield potential and a kernel weight of over 50 milligrams (mg) in northwestern Mexico, compared with about 40 mg for most wheat germplasm developed during the 1980s-90s. New high-yielding varieties also tend to be more tolerant to heat and drought stress (Mondal et al. 2015).
Early gains in the yield potential of semi-dwarf wheat varieties came through the incorporation of dwarfing genes; subsequent progress can be attributed to quantitatively-inherited additive genes. Intense breeding efforts over the last four decades have already selected additive genes that have greatly contributed to enhanced yield potential. Further progress is expected from selecting genes that have much smaller effects, thus making it necessary to modify traditional breeding schemes. Alternatively, introgression of new genetic diversity from unrelated wheat germplasm, including wide hybridization, can bring in genes not present in commonly used wheat germplasm. At the same time, it has become crucial to increase the number of advanced lines in yield trials, to find new lines with superior yield potential.
11 The very significant impact of IWIN is based on co-operation between national program and CGIAR wheat partners and in particular on the principle of free germplasm exchange. Current efforts to increase annual genetic gains in farmers’ fields would be very difficult to realize if the free exchange of wheat germplasm among IWIN partners were restricted.

11Impacts of International Wheat Improvement Research 1994- 2014
Table 3.1. Priority traits in breeding spring bread wheat germplasm at CIMMYT.
Wheat improvement often utilizes simple crosses, three-way (top) crosses, four-way (double) crosses, or repeated backcrossing approaches. Various wheat breeders also practice pedigree or bulk methods of selection. In the 1960s-70s, CIMMYT relied on simple, top, and double crosses, followed by pedigree selection. During the early 1980s, CIMMYT breeders applied simple and three-way crosses and occasionally single backcrosses, followed by modified bulk selection where individual plants were harvested in the F2 generation to grow the F3 generation, with bulk selection in the F3-F5 generations. Individual plants or spikes were once again harvested in the F5 or F6 generation.
Singh et al. (1998) showed that the choice of parents, rather than the selection scheme, determined the performance of progeny lines. Following that study, as of the mid-1990s a selected bulk-breeding scheme was introduced for bread wheat improvement. Under this approach, one spike from each of the selected plants is harvested as bulk and a sample of seed is used in growing the next generation, in all segregating generations until F4 or F5. Individual plants or spikes are harvested in the F4 to F6 generations as needed. This scheme allows breeders to retain a larger sample of selected plants at the same cost and is operationally efficient. Moreover, retaining a large sample of plants in segregating populations increases the probability of identifying rare progenies that carry most desired genes.
Initially to incorporate multiple, additive minor genes for resistance to wheat rust, CIMMYT breeders instituted single-backcross crossing (Singh and Huerta-Espino 2004). It soon became apparent that this also favored selection of genotypes with higher yield potential.
CIMMYT breeders normally make about 2,000 targeted, simple crosses each year. Some 700 F1 progeny are then used to make top (three-way) crosses and another 700 to make single backcrosses with the higher-yielding parents. About 400 hybrid seeds are produced per top and backcross. About 2,000 F2 populations are then grown from F1-simple, F1-top, and BC1 crosses. These crosses are meant to combine multiple traits from different parents and to increase the probability of finding superior progenies at the end of the selection cycle.
In collaboration with Kansas State and Cornell universities, the CIMMYT spring bread wheat breeding program is attempting to accelerate genetic gains for yield by developing and testing genomic prediction models and high-throughput phenotyping.
Durable resistance to key diseases/pests for specific mega-environments
• High and stable yield potential • Septoria leaf blight (ME2)• Durable resistance to all three rust diseases • Spot blotch (ME5)• Water use-efficiency / drought tolerance • Tan spot (ME4)• Heat tolerance • Fusarium head blight and mycotoxins (ME2, 4, 5)• End-use quality • Karnal bunt (ME1)• Enhanced Zn and Fe content for nutrition • Root rots and nematodes (ME4)
Core traits

12
Support from various projects over the last decade has allowed CIMMYT to expand yield testing significantly and under diverse environments. As indicated above, about 9,000 new advanced lines are now yield tested during the first year in trials with two replicates under optimally irrigated conditions in Ciudad Obregón. In the 1980s only about 1,000 new lines were tested in replicated yield trials and a decade back this number had increased to about 4,000 and then dropped again to about 2,500 entries for a few years, due to significant reductions in funding.
About 1,500 lines are retained from first-year yield trials using phenotypic data for grain yield, heading, maturity, height and resistance to rusts, including Ug99. These lines undergo rigorous phenotyping for end-use quality at El Batán; for yellow rust and septoria tritici blight at Toluca; for leaf rust, fusarium head blight, and tan spot
EXPANDED PHENOTYPING FOR GRAIN YIELD AND OTHER TRAITS UNDER DIVERSE ENVIRONMENTS
SELECTION FOR DROUGHT TOLERANCE IN SEGREGATING GENERATIONS
Selection for drought tolerance is begun by growing the same set of F3 and F4 populations as unreplicated yield trial plots, together with checks, under artificially managed drought stress in Ciudad Obregón, a desert location that receives little rainfall during the crop season. The field plots are screened visually and for canopy temperature depression and normalized difference vegetative index; finally, grain yield is determined. The 40% of the populations that score highest for those measures are grown as space-sown F4 and F5 in Toluca. Selection is carried out and spikes are individually harvested, grain selection conducted, and about 30,000 retained for sowing as small plots in Ciudad Obregón. About 3,000 advanced lines are finally retained after selecting them at Ciudad Obregón, Toluca, and El Batán for agronomic and grain characteristics and disease resistance. These lines are then included in first-year replicated yield trials alongside sister lines from Mexico-Kenya shuttle breeding.
MEXICO–KENYA SHUTTLE BREEDING FOR UG99 RESISTANCE
Following the launch of Borlaug Global Rust Initiative (BGRI) in 2005, breeding for resistance to the Ug99 stem rust race group began in 2006. The F3 and F4 populations derived from the first set of targeted crosses were first grown for selection at the Njoro, Kenya (latitude -0.341368, longitude 35.947650, 2,165 masl), research station of the Kenya Agriculture & Livestock Research Organization (KALRO) in 2008. In addition to allowing researchers to screen wheat lines for stem rust resistance under Njoro’s intense infections of the Ug99 race, the location provides another selection environment with respect to day-length and temperatures, broadening the adaptation of CIMMYT wheat germplasm. The Durable Rust Resistance in Wheat (DRRW) Project funded construction of an irrigation system at Njoro to facilitate growing and selecting wheat for two generations per year. Since 2008 CIMMYT has moved F3 and F4 generation populations from its research station at Toluca, Mexico (latitude 19.25, longitude -99.58, 2,607 masl) to Njoro, selecting them for two consecutive generations under high stem rust pressures, and then bringing back the F5 and F6 populations to Ciudad Obregón, Mexico (latitude 27.33, longitude -109.93, 32 masl). A selected-bulk selection scheme, as described earlier, is being used. Individual plants are then selected and harvested in the F5 and F6 populations that are grown at Ciudad Obregón, where selection is conducted for plants with large, plump grains. At present researchers retain over 40,000 plants after grain selection to grow them in small plots and select for agronomic traits and disease resistance in the F6 and F7 generations in Mexico. About 6,000 advanced lines are finally retained after selection at Ciudad Obregón, Toluca, and El Batán (latitude 19.53, longitude -98.844481, 2,250 masl) as well as for grain characteristics to conduct first-year replicated yield trials at Ciudad Obregón and to phenotype for stem and yellow rust at Njoro.

13Impacts of International Wheat Improvement Research 1994- 2014
at El Batán; and for stem rust and yellow rust at Njoro. Simultaneous, initial seed multiplication takes place at El Batán. All data are used to retain about 1,200 lines for further yield testing in trials with three replicates under six environments12 at Ciudad Obregón. These lines are phenotyped for leaf rust and Karnal bunt at Ciudad Obregón, spot blotch at Agua Fría, Mexico (latitude 20.455, longitude -97.64111, 109 masl), and stem rust and yellow rust at Njoro. DNA is extracted for genotyping with genotyping-by-sequencing markers at Kansas State University to develop genomic prediction models, supplemented with high-throughput aerial phenotyping of all trials. Seed multiplication for international distribution is done at Mexicali, Mexico (latitude 32.29, longitude -115.25, 8 masl), under quarantine conditions.
All data are utilized to select the 500-600 best lines for distribution through international screening nurseries; phenotyping of the lines continues for disease resistance (to leaf rust, yellow rust, stem rust, tan spot, and septoria nodorum blotch in the greenhouse) and end-use quality. Molecular markers for genes of interest are also applied. Resulting data are used to select some 280 white grained lines for another year of yield testing at Ciudad Obregón under optimum irrigation, severe drought stress, and late-sown heat stress, as well as for large-scale seed multiplication at Mexicali to supply three international yield trials of white grained entries. The 135 entries selected for these international trials have thus undergone rigorous testing for grain yield and other traits.
ENHANCING THE FREQUENCY OF LINES WITH DURABLE RESISTANCE TO WHEAT RUSTS
The three rusts – stem (or black), leaf (or brown), and stripe (or yellow), caused respectively by Puccinia graminis f. sp. tritici, P. triticina, and P. striiformis f. sp. tritici – continue to reduce wheat harvests worldwide and constitute a key focus and constantly “moving target” for wheat breeding. This is because rust fungi are highly-specialized pathogens and display significant variation for avirulence/virulence to specific resistance genes. They also evolve quickly through migration, mutation, and recombination, followed by selection, whereby evolved strains able to overcome resistance genes rapidly dominate pathogen populations. To reduce/curtail this evolution of virulence, breeding programs now seek to identify and use combinations of plant resistance genes that individually have small-to-intermediate effects – for example, merely slowing rather than fully blocking rust development – but which together produce additive effects that confer resistance levels approaching immunity. The combined effects compare in disease-stopping value to that of a single, major, race-specific resistance gene but, given their genetic complexity, are more difficult for the pathogen to overcome than a single gene and are therefore more durable. Three recent review papers (Rosewarne et al. 2013; Li et al. 2014; Yu et al. 2014) summarize current knowledge on genes and genetic diversity for slow rusting, “adult plant” resistance (that is, expressed at advanced plant development, rather than in the seedling stage).
Slow rusting resistance genes now form the backbone of leaf rust resistance breeding for CIMMYT, as over 60% of wheat lines distributed by the Center possess near-immune resistance and the importance of leaf rust has gone down in areas where varieties derived from the lines are grown. The proportion of wheat lines with complex, adult plant resistance to stem rust has also increased since 2012, with Mexico-Kenya shuttle breeding. Nonetheless, another four-to-five years are needed to attain a high frequency of wheat lines that combine the highest yield potential with near-immunity to stem rust, as required for the eastern African highlands where wheat is grown year round and stem rust is prevalent and virulent. Diverse sources of race-specific resistance genes have also been incorporated and distributed in high-yielding backgrounds through CIMMYT international nurseries and trials.
12 (1) Flat-sown with optimum irrigation; (2) sown on raised beds with optimum irrigation; (3) sown one month earlier on raised beds for heat stress at juvenile growth stages; (4) sown on raised beds with moderate drought stress; (5) flat sown with severe drought stress; and (6) sown three months late for continuous heat stress.

14
IMPROVING RESISTANCE TO DISEASES OTHER THAN RUSTS
Table 3.1 lists the foliar diseases of importance in targeted MEs. CIMMYT began breeding for resistance to septoria tritici blotch, caused by Mycosphaerella graminicola (anamorph Septoria tritici), in semi-dwarf wheat in early 1970, with steady progress and the development of several high-yielding, semi-dwarf wheats with good resistance. Resistance is derived from diverse sources, including synthetic wheats. The high-rainfall site of Toluca, Mexico, is used for selection. Inter-crossing parents with different resistance sources has produced lines with high levels of resistance based on genes with additive effects, where disease development is restricted to the lowest two or three leaves and with low severity. Lines that show good resistance in Toluca maintain their resistance levels in target areas such as the eastern African highlands. Some lines derived from synthetics also show excellent resistance that appears to be leading towards immunity to the disease, and offer new genetic diversity of resistance originating from durum wheat and Triticum tauschii.
First crosses to incorporate spot blotch (caused by Bipolaris sorokiniana) resistance into CIMMYT wheats were made about 25 years ago. Testing for resistance is currently conducted at Agua Fría, a hot-spot for the disease. Use of diverse sources of mostly intermediate levels of resistance has enabled the development of early-maturing lines targeted for the Eastern Gangetic Plains of South Asia and which feature high-to-adequate resistance levels. Sb1, the first designated gene for resistance, turns out to be the pleiotropic, multi-pathogen, partial rust and mildew resistance gene Lr34/Yr18/Sr57/Pm38 (Lillemo et al. 2013). The gene confers moderate resistance that is sufficient to prevent losses in areas where disease pressure is normally not high.
Tan spot (caused by Drechslera tritici-repentis) is on the increase in areas where wheat stubble is retained through successive crop cycles, as part of conservation agriculture practices common in rainfed areas of South America and Central Asia, and where rotation options are limited and a single crop is grown each year. Tan spot phenotyping routinely takes place in the greenhouse and field at El Batán. Good-to-moderate resistance is common in newer wheats.
Wheat lines are also screened for septoria nodorum blotch (caused by Parastagonospora nodorum, previously Phaeosphaeria nodorum, synonyms Stagonospora nodorum; Septoria nodorum) in seedlings in the greenhouse.
Several species of Fusarium cause fusarium head blight (FHB) or scab, a chief production constraint where humid and semi-humid conditions coincide with wheat flowering, such as in the Yangtze River basin of China. Disease outbreaks leading to epidemics are now more frequent in countries where residues are kept on the soil for
First detected in Mexico in 2002, a new, aggressive, and heat-tolerant yellow rust race group has been causing serious problems and become the predominant race in various countries (Ali et al. 2014). As in other countries, in Mexico also the original race has evolved several times and overcome resistance conferred by at least four race-specific resistance genes. In some cooler areas where wheat remains longer in its vegetative phase, this race group is able to establish early, multiply sufficiently, and damage the foliage before the stem elongates and when the slow rusting, minor-gene-based adult plant resistance becomes functional. Despite the challenges to breeding that this presents, the pathogen’s presence in Mexico has facilitated selection for resistance and its phenotyping at other selected field sites, such as Ludhiana, India, and Njoro, Kenya. The genetic basis of resistance in germplasm with high levels of resistance at all sites is complex. Mapping studies so far indicate that it often involves combinations of slow rusting minor genes with moderately effective, race-specific genes that are often difficult to phenotype in seedlings in the greenhouse (Basnet et al. 2014; Lan et al. 2014), but field selection has been effective in building such resistance gene combinations, which are likely to be a better solution than using only large-effect, race-specific resistance genes. CIMMYT breeders are using field response and seedling reaction data, combined with molecular markers where available, to select resistant lines for international distribution.

15Impacts of International Wheat Improvement Research 1994- 2014
conservation agriculture (Argentina, Brazil, and Uruguay, for example), and in areas where maize, which FHB also infects, is on the rise in cropping systems (China and the eastern African highlands). The fungus not only cuts crop productivity but also produces mycotoxins, such as deoxynivalenol (DON), that accumulate in the grain and render it unsafe for humans or livestock to eat.
Resistance to FHB is under quantitative genetic control but a moderate-effect gene from the Chinese cultivar ‘Sumai 3’ on the short arm of chromosome 3B, known as Fhb1, has shown the largest and most consistent effects in reducing disease severity and mycotoxin accumulation (Anderson et al. 2001). The Chinese varieties and their derivatives remain the best resistance sources available and are being combined with others. Progress in FHB resistance breeding at CIMMYT has been hindered by the widespread use of the stem rust resistance gene Sr2, also located on the short arm of 3B but in repulsion to Fhb1. However, new Sr2 + Fhb1 recombinants obtained from CSIRO, Australia, are being incorporated in high-yielding wheat lines already possessing moderate FHB resistance.
BREEDING FOR INDUSTRIAL AND NUTRITIONAL QUALITY IN HIGH-YIELDING WHEAT
Wheat figures in a broad range of foods and provides essential nutrients. Bread wheat is generally milled into flour (both refined and whole meal) and made into leavened breads, flat breads, biscuits, and noodles. Industrial millers require wheat grain of very specific characteristics. The genetics of wheat industrial quality is well understood and our understanding continually increases as more alleles and their effects are discovered. Some attributes, such as protein content and alpha-amylase activity, are influenced by environmental factors. Protein content tends to be higher when the plant is under stress and lower under well-watered or N-limiting conditions. Protein content also affects other aspects of quality, such as dough strength, dough mixing time, and loaf volume. The largest fraction of total protein is gluten, made up, in turn, of glutenins and gliadins. Gluten influences the viscoelastic properties of wheat flour and largely determines how a particular variety is used. While a relatively small portion of total variation in protein content across years and locations is genetic, the quality of protein is controlled by known high and low molecular weight glutenins and gliadins. Genome loci that control both high and low molecular weight glutenins can be determined using ID SDS-PAGE and the information used to breed higher-quality cultivars. The CIMMYT wheat quality lab applies both modern and traditional methods to determine end-use quality in wheat lines. The frequency of lines with poor quality un-extensible gluten has been reduced to below 20% in international trials and nurseries – a very significant change from a decade back.
Given wheat’s widespread use as food by low-income consumers, since around 2005 breeders have been working to biofortify the crop, identifying and selecting for higher grain concentrations of key micronutrients, particularly iron (Fe) and zinc (Zn). There is significant variation for those traits in certain un-adapted landraces and wheat relatives, such as spelt wheat, diploid Aegilops tauschii, and some wild tetraploids (Monasterio and Graham 2000; Cakmak et al. 2002). The work has moved forward under the CGIAR program HarvestPlus. New rapid, cost-effective, non-destructive methods to determine Zn and Fe grain levels, such as the XRF machine, allow phenotyping of large numbers of lines. To facilitate selection for grain Zn, ZnSO4 was applied to research plots to reduce soil variation for this element. As a result of targeted crossing, maintaining large population sizes, and phenotyping advanced lines, breeders have been able to develop and share high-yielding lines with significantly enhanced grain levels of Zn and Fe. The target region for this work is South Asia, where partners have being growing the HarvestPlus Yield Trial and HarvestPlus Screening Nursery for five years. Several high-Zn and -Fe lines identified in Mexico produced grain with good concentrations of these elements at multiple sites in India and Pakistan, indicating high heritability for the trait (Velu and Singh 2012) and increased grain Zn correlates with increased Fe. A high-Zn line from this work has been released as the variety ‘Zinc Shakti’ in India and ‘Zincol 2015’ in Pakistan; both feature about 40% higher grain Zn than other commercial varieties while providing comparable yields.

16
SPRING BREAD WHEAT INTERNATIONAL YIELD TRIALS
AND NURSERIES UNDER ANNUAL DISTRIBUTION
Table 3.2 lists the spring bread wheat international yield trials and screening nurseries distributed by CIMMYT each year at no cost to those who request them. They can be used by national partners as a source of direct releases or for crossing programs. The targeted yield trials are designed for partners rapidly to identify new, high-yielding lines for promotion to variety registration trials. About 150 sets of international yield trials and screening nurseries are being distributed each year, an increase of 40 to 50% during the last decade. Partners are asked to return data on yield, agronomic performance, and disease resistance; the response rate for this is about 60%. The data are collated and made publically available by CIMMYT via its web page; they also help CIMMYT scientists to identify the best-adapted parents for crossing programs.
Costs incurred in the aforementioned wheat improvement research activities (that is, breeding for genetic yield gains, selection for drought tolerance in segregating generations, etc.) are included in the investments discussed in the following section.
0
10
20
30
40
Expe
nditu
re (2
010
US$
mill
ions
)
2002
2004
2006
2008
2010
2012
2014
Expenditure 1Expenditure 2
Figure 3.1. CGIAR wheat research expenditures, 2002-14.
Figure 3.2. Number of CGIAR wheat improvement researchers, 2002-14.
Num
ber o
f res
each
ers
2002
2004
2006
2008
2010
2012
2014
Total staffSenior staffPost-doctoral staff
0
10
20
30
40
50
60
70
Trial/nursery Abbreviation Number of entries Target environment Grain color
Yield trials (replicated) Elite Spring Wheat Yield Trial ESWYT 50 ME1, ME2, ME5 WhiteSemi-Arid Wheat Yield Trial SAWYT 50 ME4 WhiteHigh Rainfall Wheat Yield Trial HRWYT 50 ME2, ME4 RedHeat Tolerance Wheat Yield Trial HTWYT 50 ME1, ME4, ME5 WhiteHarvestPlus Yield Trial HPYT 50 ME1, ME5 White
Screening nurseries International Bread Wheat Screening Nursery IBWSN 250-300 ME1, ME2, ME5 WhiteSemi-Arid Wheat Screening Nursery SAWSN 200-250 ME4 WhiteHigh Rainfall Wheat Screening Nursery HRWSN 100-150 ME2, ME4 RedHarvestPlus Advanced Nursery HPAN 100 ME1, ME5 White
Disease-based nurseries Stem Rust Resistance Screening Nursery SRRSN 100-150 All MEs White/RedInternational Septoria Observation Nursery ISEPTON 100-150 ME2, ME4 White/RedLeaf Blight Resistance Screening Nursery LBRSN 100-150 ME4, ME5 White/RedFusarium Head Blight Screening Nursery FHBSN 50-100 ME2, ME4 White/RedKarnal Bunt Resistance Screening Nursery KBRSN 50-100 ME1 White/Red
Table 3.2. Spring bread wheat international yield trials and screening nurseries distributed yearly by CIMMYT (see Appendix Tables A3-4, for a listing of ICARDA bread and durum wheat nurseries).

17Impacts of International Wheat Improvement Research 1994- 2014
Area Production Value of production FTE scientists per FTE scientists per FTE scientists per US $100Country/region million hectares million tons of wheat million of wheat
China 33.0 7.0 2.5 South Asia1 40.5 15.6 5.8 Sub-Saharan Africa2 134.0 52.9 19.8West Asia and North Africa 99.0 56.3 21.0Latin America 29.2 13.8 5.2Former Soviet Union countries 55.9 23.8 8.9EU and other high-income countries6 84.2 25.5 10.0
INVESTMENTS IN WHEAT
IMPROVEMENT RESEARCH
CGIAR wheat research investments (Figure 3.1) are considered for the period 2002-14, rather than the entire study period (1994-2014), given that the last CIMMYT global wheat impacts study (reported in Lantican et al. 2005) was conducted in 2002 and covered the earlier years of CIMMYT investments in wheat genetic improvement. ICARDA’s wheat program was launched in 2004; it is assumed that, prior to 2004, ICARDA incurred about US $1.2 million [2010] in operational costs for wheat research collaborations with CIMMYT in West Asia and North Africa (WANA).
Expenditures 1 was computed based on the number of the CGIAR wheat program staff relative to total staff, so any change in CGIAR staff numbers will raise or lower Expenditures 1. Given that Expenditures 2 is based on the assumed percentage of the centers’ budgets allocated to wheat improvement (see “Analytical Methods” section, Chapter 2), it is considered a more accurate measure of CGIAR investments in wheat improvement research. CGIAR invests an average of about US $30 million [2010] per year in wheat improvement research – a small portion of the total investment in international wheat improvement research.13 Included in the CGIAR investment are about US $6 million [2010] annually for WHEAT during 2012-14. In spite of these added funds, by 2014 the total CGIAR investment on wheat improvement had slightly declined for both measures.
Scientific staff account for a major share of CGIAR investments during 2002-14. Total staff includes senior staff and post-doctoral fellows (Figure 3.2). The number of CGIAR scientists involved in wheat improvement research has fluctuated between 35 and 65 p.a., with a low in 2007.
National investments in wheat improvement research are ideally estimated by examining research expenditure data, but complete and accurate data of this type are not available. The number of full-time equivalent (FTE) scientists provides a proxy, but can result in over- or underestimations of research investments, given the difficulties of adequately accounting for all personnel involved in wheat improvement research or their activities. To facilitate comparisons across countries and regions, we present the “research intensity” of wheat improvement research in terms of the ratios of FTE scientists to wheat area, production, and value of production (Table 3.3). As expected, regions or countries characterized by smaller wheat areas and values of production have higher estimated research intensities than those with larger areas, production, and values of production. Some small wheat-producing countries were excluded from the estimation to avoid inflating the averages. For Sub-Saharan Africa, we excluded Eritrea, Burundi, Uganda, and Zimbabwe; for Latin America, Ecuador; for West Asia/North Africa, Jordan; for South Asia, Bhutan; and for EU and other high-income countries, Slovenia.
Table 3.3. Estimated research intensity by region, area, production, and value of wheat production, 2014.
13 Heisey (2002) estimated that in the 1990s wheat breeding research expenditures across developing countries ranged from US $110 to US $170 million (1996 US $) per year.
1 Includes Bangladesh, India, Nepal and Pakistan.2 Includes Ethiopia, Kenya, Rwanda, South Africa, Sudan, and Zambia.6 Includes Albania, Croatia, Czech Republic, Hungary, Japan, Italy, Latvia, Portugal, Romania, Serbia, Spain (Andalusia), and Switzerland.

18
04GLOBAL WHEAT VARIETAL RELEASES, 1994-2014

19Impacts of International Wheat Improvement Research 1994- 2014
This chapter describes global wheat varietal releases for 1994-2014 and presents several related indicators: rates of varietal releases, associated wheat growth habits and production environments, the CGIAR contribution, public and private sectors’ roles, and varietal attributes.
RATES OF WHEAT VARIETAL RELEASESA total of 4,604 improved wheat varieties were released by public national research organizations and private seed companies between 1994 and 2014. The number of releases per year averaged 219, ranging from 208 (1994-99) to 231 (2005-09) (Table 4.1) and with high-income countries accounting for nearly half, likely reflecting a greater resource allocation to wheat genetic research and the increased participation of the private sector.14
Because wheat area varies greatly by country and region, varietal releases per million hectares of wheat serves as a useful indicator for comparison.
More varieties per unit area of wheat were released in Latin America and Sub-Saharan Africa than in the rest of the developing world (Figure 4.1) and there was higher variability in the rates of release for these two regions, possibly associated with their smaller wheat areas, greater diversity in mega-environments (MEs), faster evolution in wheat disease complexes, and greater involvement of the private sector15 in wheat improvement (Heisey et al. 2002; Lantican et al. 2005). In contrast, varietal release rates for large wheat producers like China and India are lower, reflecting their larger wheat areas and the economies of scale at relatively modest national investment levels.
Annual average Cumulative 1994-99 2000-04 2005-09 2010-14 1994-2014 1994-2014
China 13 14 10 6 11 226EU and high-income countries 96 105 118 102 105 2,205 Australia 4 10 10 5 7 152 Germany 12 15 12 12 13 269 Canada 8 8 9 15 10 207 United States of America 19 19 31 17 21 447Former Soviet Union countries 11 17 17 17 15 318Latin America 25 27 32 36 30 630South Asia 16 12 14 19 15 320Sub-Saharan Africa 13 15 17 10 14 291West Asia and North Africa 34 28 22 32 29 614World 208 218 231 222 219 4,604
Source: 2014 survey.
14 Private-sector varieties dominate Australia and Germany, while for Canada and the USA, varieties released are largely from the public-sector.
15 In South Africa and Zimbabwe for Sub-Saharan Africa.
Table 4.1. Average and cumulative number of wheat varieties released by region and period, 1994-2014.

20
WHEAT GROWTH HABIT AND PRODUCTION ENVIRONMENTS OF VARIETAL RELEASESFigure 4.2 shows key wheat production sites listed by respondents to the global wheat survey. Wheat releases (Table 4.1) are normally targeted to specific moisture regimes (Table 4.2) and MEs (Tables 4.3-4.4) defined by type of wheat, biotic and abiotic stresses, predominant cropping systems, and consumer preferences.16 Some varieties are recommended for more than one moisture regime, with 56% of global releases being suitable for irrigated cropping, 48% for high-rainfall settings, and 44% for dry rain-fed areas. The most commonly targeted water regimes included dry rain-fed (33%), a combination of irrigated and high-rainfall (31%), and irrigated (16%), with significant regional variations. Fifty-five percent of varietal releases in South Asia are recommended only for irrigated areas, 19% specifically for dry rain-fed areas and 11% for both these two moisture regimes. Sixty percent of varietal releases in former Soviet Union countries
are recommended only for dry rain-fed zones of high-latitude areas. Similarly, 30% of varietal releases in the EU and high-income countries target dry, rain-fed, high-latitude areas, whereas 51% are recommended for both irrigated and high-rainfall areas.
Wheat releases include both bread and durum and their spring and winter/facultative variants, with variations by moisture regime (Table 4.2). Nearly half of spring wheat releases (both bread and durum) are for use in dry rain-fed cropping zones, with the rest targeted for irrigated and high-rainfall production; 25% of spring bread wheat releases and 19% of spring durum wheat releases are recommended for irrigated areas alone. In contrast, nearly two-thirds (64%) of winter/facultative bread wheat releases are meant for use in either irrigated or high-rainfall areas.
Figure 4.1. Rates of release of wheat varieties, normalized by wheat area, 1994-2014.
ChinaEU and other high income countriesFormer Soviet Union countriesLatin AmericaSouth AsiaSub-Saharan AfricaWest Asia and North AfricaWorld
0
10
20
30
40
50
60
Num
ber o
f var
ietie
s pe
r mill
ion
hect
ares
per
yea
r,�v
e-ye
ar m
ovin
g av
erag
e
2002
2004
2006
2008
2010
2012
2000
1998
1996
16 Rajaram et al. 1994; Braun et al. 1996; Lantican et al. 2005.

21Impacts of International Wheat Improvement Research 1994- 2014
Figure 4.2. Key wheat production sites in the study countries.
Table 4.3 shows the distribution of wheat area by ME in 2014, with percentage comparisons to 1997 and 1990. Irrigated spring bread wheat (ME1) has dominated world wheat area in all periods, whereas winter, facultative, and high-latitude spring wheat areas pertain mostly to the EU and high-income countries and former Soviet Union nations. Durum wheat cropping in residual moisture drylands (ME4C) has significantly declined, while irrigated spring durum wheat area has increased four-fold, possibly driven by the higher world price for this wheat type.
The greatest number of varietal releases was targeted to ME11 (30%), followed by ME4 (18%) and ME1 (15%), with less than 10% of releases for any of the other MEs and significant regional
variation. Two-thirds of South Asia’s varietal releases and nearly a third of Sub-Saharan Africa’s releases were targeted to irrigated ME1 (Table 4.4). Latin America’s varietal releases were suited primarily for the low rainfall ME4 (41%), as were more than a quarter of varietal releases in both South Asia (28%) and West Asia and North Africa (WANA) (26%). Eighteen percent of WANA’s varietal releases were also meant for dry winter areas (ME12). More than half (58%) of varietal releases in the EU and high-income countries targeted ME11, followed by the dry, high latitude areas (ME6, 14%) and ME4 (11%). Nearly a quarter (24%) of varietal releases in former Soviet Union countries targeted dry winter areas (ME12), while 21% were suited for high-latitude ME6 areas.
Table 4.2. Wheat varietal releases (%) by moisture regime, region, and wheat type, 1994-2014.
High- Irrigated Irrigated High-rainfall All threeRegion/ rainfall (well- Dry and high- and dry and dry moisturewheat type Irrigated watered) rain-fed rainfall rain-fed rain-fed regimes
China 36 16 13 30 3 2 0EU and high-income countries 3 4 30 51 1 0 10Former Soviet Union countries 24 1 60 7 9 0 0Latin America 13 25 37 15 2 7 1South Asia 55 0 19 8 11 0 7Sub-Saharan Africa 35 32 27 0 1 4 0West Asia and North Africa 24 11 45 7 9 4 0World 16 9 33 31 3 2 6
Spring bread wheat 25 16 47 3 4 3 1Spring durum wheat 19 22 48 1 3 6 1Winter/facultative bread wheat 7 0 16 64 2 0 11Winter/facultative durum wheat 18 0 56 11 4 0 12All wheat 16 9 33 31 3 2 6
Source: 2014 survey.

22
CGIAR CONTRIBUTION TO WHEAT VARIETAL RELEASESTable 4.5 summarizes CGIAR contributions to global varietal releases.17 Overall, 63% were CGIAR-related, with the highest contribution in South Asia (92%). Sub-Saharan Africa ranked second (73%) and Latin America (72%) third. In China, half of the varieties released were CGIAR-related, as was the case in the EU and high-income countries whereas, in the former Soviet Union, CGIAR contributions figured in nearly half (48%). Wheat research by CGIAR targets the developing world, but significant spill-overs from the work benefit wheat farmers and consumers elsewhere.
CGIAR contribution by wheat type. Direct releases of CGIAR lines dominated the spring bread wheat varietal releases in South Asia (50%), Sub-Saharan Africa (54%), and WANA (47%) (Figure 4.3). In Latin America more than 70% of wheat varietal releases were CGIAR-related, although the direct use of CGIAR lines as spring bread wheat releases had declined from levels documented in previous impact studies, particularly in Argentina and Brazil, due to the increasing participation of private companies in wheat seed markets and the presence of strong national research programs that incorporate CGIAR germplasm in varietal development research.
Table 4.3. Distribution of wheat area by mega-environment (ME), 2014, with percentage comparisons to values from studies conducted in 1997 and 1990.
ME Bread Durum Bread Durum Bread Durum Bread DurumSpring1 47.2 3.9 29.6 2.5 36.3 0.6 32.3 0.42 5.9 1.4 3.7 0.9 6.7 2.0 7.6 2.43 1.3 0.0 0.8 0.0 1.4 0.0 1.7 0.04A 9.0 4.7 5.6 2.9 5.6 3.8 5.5 4.84B 1.6 0.1 1.0 0.1 3.0 0.1 3.2 0.04C 2.9 0.0 1.8 0.0 6.4 9.1 4.4 1.55 2.1 0.1 1.3 0.0 3.6 0.0 7.1 0.06 21.0 2.1 13.1 1.3 4.6 0.0 4.9 0.0Subtotalsb 90.8 12.3 56.9 7.7 67.7 6.5 66.8 9.1
Facultative7 17.6 0.0 11.0 0.0 9.4 0.0 5.6 0.08 4.1 0.0 2.6 0.0 0.2 0.09 2.2 0.2 1.4 0.1 3.2 0.0 4.5 1.2Subtotals 23.9 0.2 15.0 0.1 12.8 0.0 10.1 1.4
Winter10 4.4 0.0 2.8 0.0 2.9 0.0 6.6 0.211 19.2 0.0 12.0 0.0 3.4 0.112 8.0 0.9 5.0 0.6 5.4 1.0 6.0 1.2Subtotals 31.6 0.9 19.8 0.6 11.7 1.1 12.6 1.4
Totals 146.2 13.4 91.6 8.4 92.3 7.7 89.5 10.5
Area, 2014a Percentage, 2014 Percentage, 1997 Percentage, 1990 (million ha) (Heisey et al.2002) (Byerlee and Moya 1993)
17 Following the CGIAR’s Project on Diffusion and Impacts of Improved Crop Varieties in Sub-Saharan Africa (DIIVA) which assessed the contributions of CGIAR centers to varieties of various crops in Sub-Saharan Africa (see Walker et al. 2014)
a Excludes area grown to wheat varieties with unknown wheat type and ME.b Figures may not add up exactly to subtotal and total amounts shown, due to rounding.Source: 2014 survey.
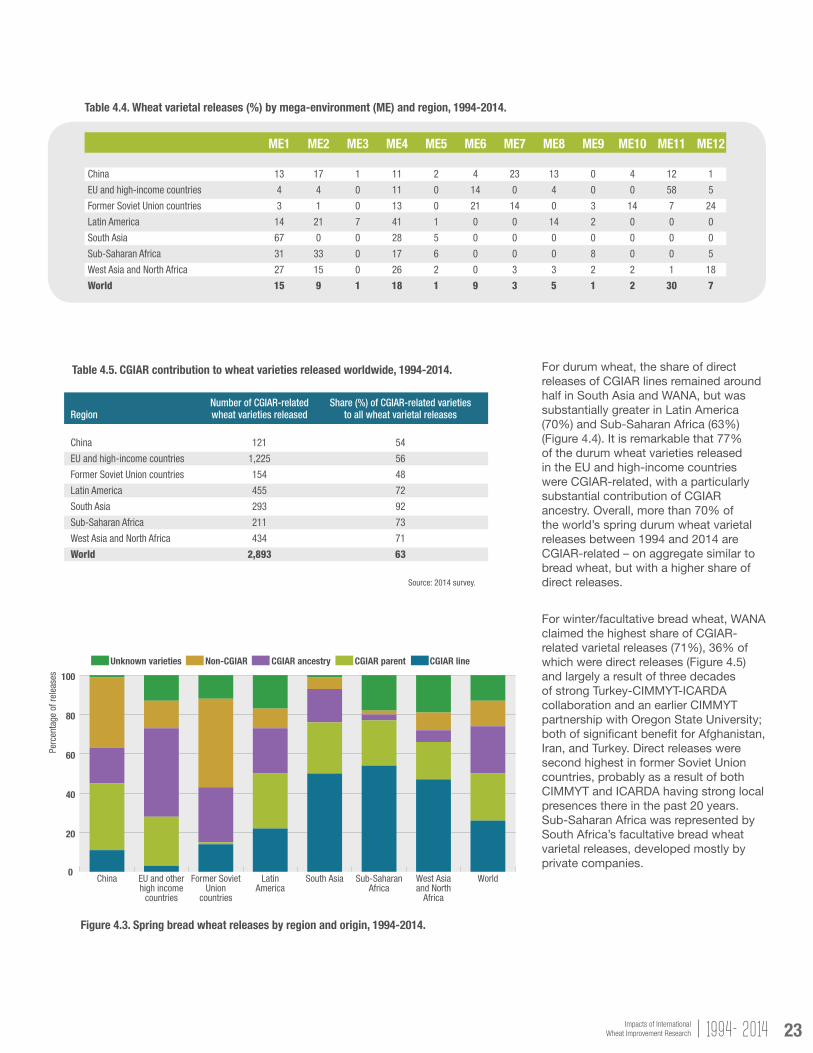
23Impacts of International Wheat Improvement Research 1994- 2014
Number of CGIAR-related Share (%) of CGIAR-related varietiesRegion wheat varieties released to all wheat varietal releases
China 121 54
EU and high-income countries 1,225 56
Former Soviet Union countries 154 48
Latin America 455 72
South Asia 293 92
Sub-Saharan Africa 211 73
West Asia and North Africa 434 71
World 2,893 63
Source: 2014 survey.
Figure 4.3. Spring bread wheat releases by region and origin, 1994-2014.
ME1 ME2 ME3 ME4 ME5 ME6 ME7 ME8 ME9 ME10 ME11 ME12
China 13 17 1 11 2 4 23 13 0 4 12 1
EU and high-income countries 4 4 0 11 0 14 0 4 0 0 58 5
Former Soviet Union countries 3 1 0 13 0 21 14 0 3 14 7 24
Latin America 14 21 7 41 1 0 0 14 2 0 0 0
South Asia 67 0 0 28 5 0 0 0 0 0 0 0
Sub-Saharan Africa 31 33 0 17 6 0 0 0 8 0 0 5
West Asia and North Africa 27 15 0 26 2 0 3 3 2 2 1 18
World 15 9 1 18 1 9 3 5 1 2 30 7
Table 4.4. Wheat varietal releases (%) by mega-environment (ME) and region, 1994-2014.
Table 4.5. CGIAR contribution to wheat varieties released worldwide, 1994-2014. For durum wheat, the share of direct releases of CGIAR lines remained around half in South Asia and WANA, but was substantially greater in Latin America (70%) and Sub-Saharan Africa (63%) (Figure 4.4). It is remarkable that 77% of the durum wheat varieties released in the EU and high-income countries were CGIAR-related, with a particularly substantial contribution of CGIAR ancestry. Overall, more than 70% of the world’s spring durum wheat varietal releases between 1994 and 2014 are CGIAR-related – on aggregate similar to bread wheat, but with a higher share of direct releases.
For winter/facultative bread wheat, WANA claimed the highest share of CGIAR-related varietal releases (71%), 36% of which were direct releases (Figure 4.5) and largely a result of three decades of strong Turkey-CIMMYT-ICARDA collaboration and an earlier CIMMYT partnership with Oregon State University; both of significant benefit for Afghanistan, Iran, and Turkey. Direct releases were second highest in former Soviet Union countries, probably as a result of both CIMMYT and ICARDA having strong local presences there in the past 20 years. Sub-Saharan Africa was represented by South Africa’s facultative bread wheat varietal releases, developed mostly by private companies.
South AsiaEU and otherhigh income
countries
Former SovietUnion
countries
LatinAmerica
Sub-SaharanAfrica
West Asiaand North
Africa
World0
20
40
60
80
100
Perc
enta
ge o
f rel
ease
s
Unknown varieties Non-CGIAR CGIAR ancestry CGIAR parent CGIAR line
China

24
Figure 4.5. Winter/facultative bread wheat releases by region and origin, 1994-2014.
China EU and otherhigh income
countries
Former SovietUnion
countries
LatinAmerica
Sub-SaharanAfrica
West Asiaand North
Africa
World0
20
40
60
80
100
Perc
enta
ge o
f rel
ease
s
Unknown varieties Non-CGIAR CGIAR ancestry CGIAR parent CGIAR+TCI line
Figure 4.4. Spring durum wheat releases by region and origin, 1994-2014.
South AsiaEU and otherhigh income
countries
Former SovietUnion
countries
LatinAmerica
Sub-SaharanAfrica
West Asiaand North
Africa
World0
20
40
60
80
100
Perc
enta
ge o
f rel
ease
s
Unknown varieties Non-CGIAR CGIAR ancestry CGIAR parent CGIAR line
PRIVATE AND PUBLIC SECTOR ROLES IN WHEAT VARIETAL RELEASESThe role of private companies in wheat varietal development and seed marketing has grown in many developed countries in recent decades, partly as a result of reduced public investment in agricultural research and of a more attractive climate for investment in the private sector. There is a similar trend in emerging economies, with South Africa leading and greater participation in Argentina and Brazil.
In aggregate over 1994-2004, the public sector still dominated the world’s varietal releases (63%), with the private-sector accounting for 37% of the releases in high-income countries and half of those in Latin America (Table 4.6). Argentina was among

25Impacts of International Wheat Improvement Research 1994- 2014
Public- Private-Region sector sector
China 92 8EU and high-income countries 50 50Former Soviet Union countries 97 3Latin America 47 53South Asia 99 1Sub-Saharan Africa 68 32West Asia and North Africa 77 23
World 63 37
Source: 2014 Global Wheat Impacts survey.
Figure 4.6. Spring bread wheat releases by region and breeding program, 1994-2014.
Private-public sector roles by wheat type. Both for bread and durum wheat, the public sector provided the bulk of the spring wheat varietal releases globally and by region (Figures 4.6 and 4.7). Among developing country regions, Latin America was the exception for spring bread wheat, in that the public and private sectors accounted for equal shares of varietal releases (Figure 4.6). In high-income countries, 60% of spring durum wheat releases came from the private sector (Figure 4.7). For winter/facultative bread wheat, varietal releases worldwide came in nearly equal portions from public and private sources, but the aggregate figure masks substantial regional differences, with the private sector dominating winter/facultative bread wheat releases in Latin America, Sub-Saharan Africa (represented by South Africa) and high-income countries, whereas public sources provided most releases elsewhere (Figure 4.8).
Table 4.6. Wheat varietal releases (%) by region and breeding program, 1994-2014.
Private Sector Public Sector
China EU and otherhigh income
countries
Former SovietUnion
countries
LatinAmerica
South Asia Sub-SaharanAfrica
West Asiaand North
Africa
World0
20
40
60
80
100
Perc
enta
ge o
f rel
ease
s
the first countries in the world to establish some form of Plant Breeders’ Rights (PBR) (Pray 1992). As discussed in Heisey et al. (2002), Argentina was also among the first of the developing countries to become a member of the International Union for the Protection of Plants (UPOV) and varieties developed by the private sector in this country are also grown in Brazil and Uruguay. Likewise, some Brazilian varieties are sown in Argentina. Sub-Saharan Africa has the third-largest private sector share in wheat varietal releases (32%), primarily the products of private seed companies based in South Africa and Zimbabwe.
The public sector accounted for most wheat varietal releases across developing country regions (Table 4.6). The high figure for the share (97%) of public varietal releases in former Soviet Union countries must be interpreted with caution because, for the Russian Federation, we received data only from the Omsk region.
Public- and private-sector roles were split for high-income countries (Table 4.6). Australia applies the End Point Royalty (EPR),18 a value capture system used by plant breeding companies to generate returns on their investment.
18 This is a risk-sharing mechanism, wherein a crop grower pays a royalty based on production instead of a set fee for a particular variety (http://varietycentral.com.au/end-point-royalties).

26
Figure 4.8. Winter/facultative bread wheat releases by region and breeding program, 1994-2014.
Private sector Public sector
China EU and otherhigh income
countries
Former SovietUnion
countries
LatinAmerica
Sub-SaharanAfrica
West Asiaand North
Africa
World0
20
40
60
80
100
Perc
enta
ge o
f rel
ease
s
Table 4.7. Percentage of wheat varietal releases by target trait and region, 1994-2014.
Figure 4.7. Spring durum wheat releases by region and breeding program, 1994-2014.
Private sector Public sector
EU and otherhigh income
countries
Former SovietUnion
countries
LatinAmerica
South Asia Sub-SaharanAfrica
West Asiaand North
Africa
World0
20
40
60
80
100
Perc
enta
ge o
f rel
ease
s
Resistance to Tolerance to Other: Early orRegion High yield Better quality biotic stresses abiotic stresses late maturity
China 89 5 7 10 0EU and high-income countries 38 60 57 56 1Former Soviet Union countries 77 9 85 92 1Latin America 27 25 62 25 6South Asia 32 21 60 77 0Sub-Saharan Africa 51 34 47 37 1West Asia and North Africa 51 23 63 61 0World 49 36 58 56 1
Source: 2014 survey.Rows do not add up to 100, as there were combined responses.

27Impacts of International Wheat Improvement Research 1994- 2014
Table 4.8. Reported breeding objectives by rank of importance (%).
Breeding objectives 1st 2nd 3rd Overall
High yield 71 9 8 30Biotic stress resistance 9 54 27 29Abiotic stress tolerance 17 12 43 24Better quality 7 23 29 19Wide adaptation 1 5 1 2Early maturing varieties 1 1 3 2Yield stability 0 1 1 1Short plant stature 0 1 0 0
Source: 2014 survey.1 Columns do not add up to 100 as there were some combined responses.
Rank of importance1
BREEDING OBJECTIVES AND ATTRIBUTES OF WHEAT VARIETAL RELEASES
Survey responses provided information on varietal attributes for about a third of the wheat releases reported. The attributes most often targeted included resistance to biotic stresses (58%), tolerance to abiotic stresses (56%), high yield (49%), and better quality (36%) (Table 4.7), with substantial variation among regions. High yield (89%) was the predominant attribute for wheat in China, whereas in former Soviet Union countries yield was second to biotic and abiotic stress tolerance. Attributes reported for wheat releases in high-income countries included better quality and biotic and
abiotic stress tolerance in equal measure. In Latin America, biotic stress resistance was most often targeted, whereas in South Asia abiotic stress tolerance ranked somewhat higher than biotic stresses. Some breeders/respondents did not prioritize yield as the most important attribute because it is considered obvious. In general however, yield is still the overarching driver in all countries where varieties are tested in registration trials. For instance, in the EU, no variety will be released that is not competitive for yield.
Evidently, yield was still important but other traits were considered of equal or greater importance during the 15 years leading up to the current study, due to factors such as the increasing ability of disease organisms to evolve and overcome resistance and the rising emphasis on end-use quality.
Respondents were also asked to name the three most important breeding objectives for the next five years. High yield was ranked first, followed by biotic stress resistance, abiotic stress tolerance, and quality, in priority ranking and overall unweighted average (Table 4.8). These findings align with the attributes reported for varietal releases over the last two decades and also the important breeding objectives mentioned in Chapter 3.

28
05GLOBAL WHEAT VARIETAL ADOPTION

29Impacts of International Wheat Improvement Research 1994- 2014
This chapter looks into global wheat varietal adoption and particularly the CGIAR’s contribution. We also review some of the characteristics of wheat varietal adoption – including the lags in adoption/varietal replacement, wheat varietal attributes, and the effects of adoption on genetic diversity.
WHEAT VARIETAL ADOPTIONUse of improved varieties – also known as modern varieties (MVs) – in wheat production has long been widespread, with universal use in the developed economies. Still, based on the results of the current and previous global impacts survey, adoption of MVs increased from 93% in 2002 to 97% in 2014 (Table 5.1 – covering only the 32 countries included in both surveys). The most notable increases were observed in West Asia and North Africa (WANA) and particularly Sub-Saharan Africa (SSA). Aggregate area sown to improved varieties across the 32 countries had expanded by 4.6 million hectares in 2014, a phenomenon seen in the EU and high-income countries, former Soviet Union countries, South Asia, Sub-Saharan Africa, and WANA.
Table 5.1. Adoption of improved, modern varieties (MVs) in 2002 and 2014, in a subset of countries covered in both surveys.
Number of Improved varieties, 2002 Improved varieties, 2014 Region paired countries Area (000 ha) Adoption (%) Area (000 ha) Adoption (%)
China 1 26,033 100 24,213 100EU and high income countries 4 4,140 100 4,237 100Former Soviet Union countries1 7 5,650 100 7,808 100Latin America 7 9,051 99 7,594 100South Asia 4 36,324 100 39,337 100Sub-Saharan Africa 4 1,019 76 1,753 98West Asia and North Africa 5 16,644 80 18,537 86Total/weighted average 32 98,861 93 103,479 97
In contrast, the area sown to improved wheat varieties contracted in China and Latin America over the same period. Spring wheat in China was largely replaced by maize, a crop in high demand as a source of feed grain.
Across all 2014 study countries, global wheat area amounted to 165.7 million hectares, comprising 149.1 million hectares (90%) of improved varieties, 3.1 million hectares (2%) of landraces, and 13.4 million hectares (8%) of unidentified or unknown varieties, some of which may be improved (Table 5.2). Spring bread wheat comprised more than half (58%) of the global wheat area, followed by winter/facultative bread wheat (34%), spring durum (8%), and winter/facultative durum (about 1% - Table 5.2).
1 The excess area coverage (13.6 million hectares) in 2014 for some countries in this group was excluded in the analysis to avoid bias in the actual MV area expansion.
Source: 2002 and 2014 global wheat impacts database.

30
Table 5.2. Area (million ha) sown to different wheat types and variety classes in survey countries, 2014.
CGIAR CONTRIBUTION TO MODERN VARIETIES ADOPTEDGlobally, the area sown to CGIAR-related wheat varieties in 2014 was nearly 106 million hectares – 71% of the area sown to modern, improved varieties. Area under non-CGIAR wheat varieties developed by public programs in 2014 was 39.5 million hectares (26.5%), while 3.8 million hectares (2.5%) of the area was sown to non-CGIAR wheat varieties from private companies.
Use of CGIAR-related MVs varied significantly among regions (Table 5.3). As expected, the CGIAR share was highest (>90%) in the main target regions of the developing world (South Asia and Sub-Saharan Africa) and lower in Latin America (Table 5.3). Contributions from CGIAR centers figured significantly in high-income countries, whereas the shares for China and the former Soviet Union were below average, with the area grown to unknown varieties excluded from the calculation. For comparison we included the CGIAR share of varietal releases and, overall, the CGIAR contributed slightly more to adoption (71%) than to varietal releases (63%). In Sub-Saharan Africa and WANA, the CGIAR share in the use of improved varieties was substantially larger
Table 5.3. CGIAR contribution to modern wheat (MV) varieties adopted worldwide, 2014.
Adoption Release Difference Estimated between CGIAR adoptionCountry / region adoption (%) CGIAR share (%) CGIAR share (%) and release shares (%)
China 100 28 54 (26) EU and high-income countries 80 82 56 26 Former Soviet Union countries 90 25 49 (24) Latin America 84 78 73 5 South Asia 99 98 92 6 Sub-Saharan Africa a 97 97 72 25 West Asia and North Africa 84 98 71 27 Weighted average b 90 71 63 8
a Excluding South Africa due to unavailability of adoption data.b Weighted by total area, except the share in adoption estimates that are weighted by total adopted area in each region.Source: 2014 global wheat impacts survey.
than the share in varietal releases, but in China and the Former Soviet Union19 it was considerably lower than the other regions. Our estimate of the CGIAR share in improved wheat adoption in China (28%) corroborates the findings of Huang et al. (2015), whose study reported that more than 26% of major wheat varieties in the country since 2000 contained contributions from CIMMYT breeding and that these had enhanced the performance of China’s wheats for traits such as yield potential, grain processing quality, disease resistance, and early maturity.
19 Use of CGIAR germplasm however had increased in Central Asia in the last decade.
Wheat type Improved, modern varieties (MV) Landraces Unknown varietiesa All
Spring bread wheat 89.8 1.0 5.1 95.9Spring durum wheat 10.7 0.1 1.9 12.6Winter/facultative bread wheat 47.8 2.0 6.3 56.1Winter/facultative durum wheat 0.9 0 0.2 1.1All wheat types 149.1 3.1 13.4 165.7
Source: 2014 Global wheat impacts survey;a Some may be modern or improved varieties.

31Impacts of International Wheat Improvement Research 1994- 2014
Figure 5.1. Spring bread wheat area shares (%) by origin of germplasm and region, 2014.
Figure 5.2. Spring durum wheat area shares (%) by origin of germplasm and region, 2014.
Unknown varieties Landraces Non-CGIAR CGIAR ancestry CGIAR parent CGIAR line
China EU and otherhigh income
countries
Former SovietUnion
countries
LatinAmerica
South Asia Sub-SaharanAfrica
West Asiaand North
Africa
World0
20
40
60
80
100
Perc
enta
ge o
f are
a so
wn
Unknown varieties Landraces Non-CGIAR CGIAR ancestry CGIAR parent CGIAR line
EU and otherhigh income
countries
Former SovietUnion
countries
LatinAmerica
South Asia Sub-SaharanAfrica
West Asiaand North
Africa
World0
20
40
60
80
100
Perc
enta
ge o
f are
a so
wn
The aggregate CGIAR contribution can be grouped into varietal origin categories based on pedigree analysis and by wheat type: spring bread wheat (Figure 5.1), spring durum (Figure 5.2), and winter/facultative bread wheat (Figure 5.3).
Of all wheat types, spring bread wheat accounted for the largest area share sown to CGIAR-related varieties (more than 70%; Figure 5.1). Sub-Saharan Africa stood out with a near universal use of CGIAR-related varieties20 and a heavy
reliance on CGIAR-lines. This is followed by South Asia, with more than 90% of the area sown to CGIAR-related cultivars. Likewise, more than 85% of wheat area in WANA is sown to CGIAR-related germplasm. In China, CGIAR-related varieties occupy nearly half the area sown to spring bread wheat.
A somewhat smaller area of spring durum wheat was sown to CGIAR-related varieties (approaching 70%; Figure 5.2). In SSA use of CGIAR-related varieties
was very high, with particularly heavy reliance on CGIAR ancestry. In WANA, more than 90% of the wheat area was sown to CGIAR-related varieties, a result of long collaboration between national programs and CIMMYT and ICARDA. There was significant use of CGIAR durum lines in WANA and Latin America. CGIAR-related cultivars were grown on about 70% of the durum wheat area in the EU and high-income countries, with a major presence in Italy and Spain.
20 South Africa is not included due to the unavailability of adoption data.

32
The share of CGIAR-related varieties sown in winter/facultative bread wheat areas was slightly more than 40% (Figure 5.3). Still, those varieties accounted for nearly 70% of the winter/facultative area in WANA, including Afghanistan, Iran, Turkey, and other countries – an outcome in part of nearly three decades of Turkey-CIMMYT-ICARDA collaboration, as well as of an earlier joint program of CIMMYT with Oregon State University. An impact assessment by Jilani et al. (2013) showed that CGIAR-related varieties performed well in Afghanistan, particularly in irrigated areas. Similarly, a quarter of China’s winter/facultative bread wheat area was sown to CGIAR- related varieties.
In Table 5.4 we further disaggregate the origin of improved wheat varieties by source of cross and CGIAR contribution. Across all wheat types, 35.7 million ha (22%) were sown to CGIAR crosses, 99.5 million ha (60%) to public national program crosses, 13.9 million ha (8%) to private sector crosses, 3.1 million ha (2%) to landraces, and 13.4 million ha (8%) to unidentified varieties. Both the national program and private sector crosses showed a heavy reliance on CGIAR-related breeding material. As expected, CGIAR germplasm was particularly dominant in spring bread and durum wheats. Nearly 27 million hectares of spring bread wheat area was sown to direct releases of CGIAR lines. CGIAR germplasm has figured as parents in another 26.6 million ha of spring bread wheat varieties released by publicly-funded national programs. An additional 12.9 million ha was sown to varieties whose pedigrees featured CGIAR lines as grandparents or earlier ancestors utilized by national programs. CGIAR-related germplasm was in the parentage or earlier ancestry of private, spring bread wheat releases grown on nearly 7.0 million hectares.
More than one-third (37%, or 4.6 million ha) of spring durum area is sown to CGIAR lines, with an additional 3.9 million ha (31%) of CGIAR-related public and private-sector crosses.
Figure 5.3. Winter/facultative bread wheat area shares (%) by origin of germplasm and region, 2014.
Unknown varieties Landraces Non-CGIAR CGIAR ancestry CGIAR parent CGIAR + TCI line
EU and otherhigh income
countries
Former SovietUnion
countries
LatinAmerica
China West Asiaand North
Africa
World0
20
40
60
80
100
Perc
enta
ge o
f are
a so
wn
Table 5.4. Area (million ha) sown to different wheat types, classified by origin of germplasm, 2014.
Public national Private sector program crosses releases
CGIAR CGIAR CGIAR Non- CGIAR- Non- Land UnknownType line parent ancestry CGIAR related CGIAR races varieties All
Spring bread wheat 26.9 26.6 12.9 14.5 6.9 2.0 1.0 5.1 95.9Spring durum wheat 4.6 1.3 1.5 1.8 1.1 0.3 0.1 1.9 12.6Winter/facultative bread wheat 4.3 4.2 13.0 22.8 2.0 1.5 2.0 6.3 56.1Winter/facultativedurum wheat - - 0.5 0.3 0.1 - - 0.2 1.1All wheat types 35.7 32.1 27.9 39.5 10.1 3.8 3.1 13.4 165.7
Source: 2014 global wheat impacts survey.

33Impacts of International Wheat Improvement Research 1994- 2014
Figure 5.4. CGIAR contribution to spring bread wheat varieties grown worldwide, 2014.
Figure 5.5. CGIAR contribution to spring durum wheat grown worldwide, 2014.
ALTERNATIVE MEASURES OF CGIAR CONTRIBUTION TO
WHEAT VARIETIES GROWNAs discussed in Chapter 2, the rules for crediting CGIAR contributions can be used to generate aggregate indicator estimates of the CGIAR contribution to the varieties grown. The “CGIAR cross” rule underestimates the CGIAR contribution, since it restricts it to include only CGIAR crosses or lines. In contrast, the “any CGIAR ancestor” rule overestimates the CGIAR contribution, because it attributes all varieties with a CGIAR relation to the CGIAR, regardless of how far back in the pedigree tree the CGIAR germplasm was used. The most accurate estimate is provided by BROWSE, which accounts for the CGIAR contribution at different stages of varietal development and gives more credit for the most recent cross. The “CGIAR cross” (0.28) and “CGIAR cross plus parent” (0.35) rules approximate the BROWSE estimate (0.33).
The CGIAR contribution to wheat varieties grown can be disaggregated by wheat type: spring bread wheat (Figure 5.4), spring durum (Figure 5.5) and winter/facultative bread wheat (Figure 5.6). It is interesting to contrast the CGIAR contribution across all study countries and solely in developing countries: as would be expected and regardless of the attribution measure used, developing countries have benefited more from CGIAR contributions to spring bread and spring durum wheat (Figures 5.4 and 5.5), but spillovers in other countries have also been significant.
40
Perc
enta
ge
Study countriesDeveloping countries
0
15
30
45
60
75
90
CGIAR cross rule CGIAR cross plusparent rule
Any ancestor rule BROWSE
Study countriesDeveloping countries
CGIAR cross rule CGIAR cross plusparent rule
Any ancestor rule BROWSE0
20
40
60
80
100
Perc
enta
ge

34
It is remarkable that for winter/facultative bread wheat, the “any ancestor” rule generates a higher CGIAR contribution for all study countries than for developing countries alone (Figure 5.6). This implies that CGIAR lines are being used by several developed countries during early stages of varietal development.
Overall, the findings highlight the widespread use of CGIAR wheat improvement outputs in the developing world, as well as significant spillovers in more developed economies. The continued use of improved wheat germplasm is expected to have benefited smallholder farmers in the developing world and to have enhanced the availability of food to poor consumers. Both conclusions are beyond the scope of this study but are supported by studies like Shiferaw et al. (2014), which documented the enhanced availability and affordability of food to poor consumers in Ethiopia from the adoption and use of improved wheat varieties in that country.
CHARACTERISTICS OF WHEAT VARIETAL ADOPTION
Figure 5.6. CGIAR contribution to winter/facultative bread wheat varieties grown worldwide, 2014.
Study countriesDeveloping countries
CGIAR cross rule CGIAR cross plusparent rule
Any ancestor rule BROWSE0
10
20
30
40
50
60
70
Perc
enta
ge
Our study showed that most farmers in developing countries had adopted improved wheat varieties, but that a large share of these were older improved varieties and that the replacement of old varieties was slow. Slow uptake of new improved varieties delays and reduces the potential benefits from wheat improvement research, as farmers who grow old varieties forego gains from the improved yield potential and better disease resistance of the newer varieties. A recent stochastic frontier analysis by Battese et al. (2014), for example, substantiates the decreased technical efficiency of wheat production in Punjab, Pakistan, from slow varietal replacement.
One major driver of varietal turnover has been the emergence of new, highly-virulent strains of fungal pathogens – particularly those associated with the rusts – that are able to overcome the genetic resistance protecting older improved varieties. Khan (1987) estimated that it takes five to six years for leaf rust resistance to break down in wheat in northern Pakistan, while Byerlee and Heisey (1990) revealed an average longevity of three to five years for rust resistance in northern Mexico. The longevity of rust resistance based on a single race-specific rust resistance gene approaches six years (Kilpatrick 1975).
LAGS IN ADOPTION/VARIETAL REPLACEMENT

35Impacts of International Wheat Improvement Research 1994- 2014
Age (years) 1997a 2014b
<6 Zimbabwe , Afghanistan Argentina, Burundi, Czech Republic, Eritrea, Georgia, Hungary, Kenya, Lebanon, Spain, Ukraine6-8 Argentina, Brazil, Chile, China, Guatemala, Brazil, Paraguay, Rwanda, Tajikistan, Uruguay, Zimbabwe Pakistan8-10 Bolivia, Colombia, Iran, Nigeria, Afghanistan, W. Australia, Azerbaijan, Bangladesh, Canada, Uruguay, Zambia China, Ethiopia, Iran, Italy, Japan, Latvia, Mexico, Nepal, Pakistan, Romania, Tanzania, USA, Uzbekistan, Zambia10-12 Ecuador, Morocco, Paraguay,South Africa, Armenia, Bolivia, Egypt, Kazakhstan, Nigeria, Turkmenistan, Tanzania Uganda, Switzerland 12-14 India, Kenya, Lebanon, Mexico, Albania, Belarus, India, Israel, Portugal, Turkey, Serbia, Syria, Yemen Slovenia, Russian Federation (Omsk Region)>14 Algeria, Bangladesh, Egypt, Ethiopia Algeria, Bhutan, Ecuador, Jordan, Kyrgyzstan, Morocco, Jordan, Nepal, Peru, Sudan, Tunisia, Turkey Sudan, Syriac, Tunisia
Source: a Heisey et al. (2002);b 2014 Global Wheat Impacts survey.c For Syria, adoption data before the country’s troubling situation were used in the analysis.
The breakdown of rust resistance is followed by rust epidemics and, eventually, replacement of susceptible varieties, a phenomenon known as the “boom-and-bust” cycle. The lag in the development and release of new resistant varieties seriously harms the food security and livelihoods of smallholder farm families. To achieve more durable resistance to rust pathogens, since the mid-1970s CIMMYT has pursued a breeding strategy that involves endowing varieties with four-to-five partial resistance genes (also known as “slow rusting” or adult-plant-resistance genes, because they usually become effective in post-seedling growth stages) that individually have small-to-intermediate effects but in combination often provide levels of resistance that are comparable to immunity. This approach is described in greater detail in Chapter 3, in the section “Enhancing the frequency of lines with durable resistance to wheat rusts.”
Table 5.5 compares the weighted average age (WA) of improved wheat varieties grown in 1997 and 2014 (though earlier for Syria), with WA divided into 6 categories: less than 6 years, 6-8 years, 8-10 years, 10-12 years, 12-14 years, and more than 14 years. Consistent with past studies (Byerlee and Moya 1993; Heisey et al. 2002; Lantican et al. 2005; Dixon et al. 2006; Krishna et al. 2015), a significant proportion of the current wheat area is sown to older improved wheat varieties.
The WA had improved in some countries over the two periods, but in others there were long or lengthening time lags for varietal turnover (Table 5.5). Varietal replacement in Argentina in 2014 had improved to less than 6 years from the 6-8 year WA for 1997, possibly due to greater involvement of the private sector. WA in Kenya had improved tremendously, from 12-14 in 1997 to less than 6 years in 2014, a consequence of the need to provide farmers with new varieties able to resist the stem rust race Ug99. In contrast, varietal replacement in Afghanistan and Zimbabwe was occurring in less than 6 years in 1997 but had slowed to 8-10 and 6-8 years, respectively, in 2014, likely due to farmer preferences for the attributes of certain older improved varieties.
Table 5.5. Weighted average age of varieties grown by farmers, 1997 and 2014.

36
Particular varietal attributes can lead to strong farmer preferences for specific cultivars. Good examples are CIMMYT’s Attila22 line, released as PBW 343 in India in 1995, and LOK-1, which has two CIMMYT parents and was released in India in 1981. These two older improved varieties are now susceptible to stem rust race Ug99 and also yellow rust in the case of PBW343, but farmers still prefer them over other varieties, due to their productivity and other traits. In addition to high yields, PBW 343 has yield stability – that is, it is dependable under varying conditions – and it has good heat tolerance, a quality of great value in India, where pre-monsoon temperatures regularly exceed 40o C. In 2014, this variety was sown on more than 2 million hectares in India alone. Likewise, LOK-1, which was grown on about 1 million hectares in India in 2014, is broadly adapted and very good for making chapattis.
Table 5.6 presents the foremost reported attributes of 499 wheat varieties grown in 2014, covering resistance to biotic stresses, tolerance to abiotic stresses, high yield, and superior quality. Some respondents listed several attributes for a particular variety. High yield was the most important attribute for farmers in China, whereas in Latin America better quality, high yield, and resistance to biotic stresses were favored equally.
In 1997, wheat varietal replacement in Pakistan was in the 6-8 years category but slowed to 8-10 years in 2014 (Table 5.5). This seems to differ from results of a recent study using duration analysis and showing that irrigated areas of Punjab, Pakistan, have an average varietal turnover rate of four years (Nazli and Smale 2016). The authors however observed that their results would likely have been different, had they estimated varietal replacement in rain-fed wheat areas, implying that environment can be a key factor in varietal turnover. Lantican et al. (2003), on average, also found that varietal replacement occurred three years sooner in favorable wheat-growing environments than in marginal ones.
Bangladesh, Ethiopia, and Nepal had markedly improved WAs in 2014, down to 8-10 years from more than 14 years in 1997, while in Mexico WA improved from 12-14 years to 8-10 years (Table 5.5). Farmers in India were changing varieties in 2014 WA a year earlier than in 1997 but still remaining in the WA category of 12-14 years; due again to farmer-preferred attributes in older varieties. Among West Asian countries, only the WA of Turkey had improved, from more than 14 years in 1997 to 12-14 in 2014. Mazid et al. (2014) link low adoption of newer improved varieties in Turkey to farmers’ knowledge and perception of certain varietal attributes, together with the unavailability of adequate or timely seed.21 Other WANA countries have remained in the slowest WA category. The same case applies for Sudan.
China’s varietal replacement has slowed slightly as WA increased from category 6-8 years in 1997 to 8-10 years in 2014. This appears to contradict Huang et al. (2015), who claimed that farmers in China replaced their wheat varieties in less than four years, but this may simply be a result of the method used to estimate varietal turnover. They conducted a farm survey in 2011 wherein farmers were asked to indicate how often they changed varieties, from among options of 0 to 9 years. The results do not indicate that all farmers replaced their older varieties with new, improved ones. Indeed, from our survey results, some varieties grown in China in 2014 included those released in the late 1990s and even a few released in the 1980s, likely due (again) to their possessing attributes valued by farmers.
21 The latter has changed in recent years since Turkey has introduced a system that encourages farmers to buy new seed. (Ministry of Food, Agriculture, and Livestock 2013)
22 Attila’s pedigree is ND/VG9144//KAL/BB/3/YACO/4/VEE#5 and has been released in several countries.
WHEAT VARIETAL ATTRIBUTES

37Impacts of International Wheat Improvement Research 1994- 2014
Figure 5.7. Genetic diversity in the Elite Spring Wheat Yield Trial (ESWYT), with genetic distance measured as average Rogers distances.
Table 5.6. Attributes (%) of 499 wheat varieties by region, 2014.
y = -0.001x + 0.3376R2 = 0.2405, p = 0.013
0.40
0.35
0.30
0.25
0.20
Aver
age
gene
tic d
ista
nce
50 10 15ESWYT
20 25
Several studies (Smale et al. 2001; Dreisigacker et al. 2004; Zhang et al. 2005; Reif et al. 2005; Warburton et al. 2006) have examined the effects of the widespread use of CGIAR wheat germplasm on the global genetic diversity of bread wheat. Molecular marker analysis on the use of synthetic hexaploid wheat has shown that synthetic backcross-derived lines are ideal for increasing diversity (Dreisigacker et al. 2008), as they provide a combination of precise elements to incorporate new genes for increased yield, abiotic stress tolerance, and biotic stress resistance (Trethowan and Mujeeb-Kazi 2008; Zhu et al. 2014). Furthermore, based on genetic distance, Dreisigacker et al. 2012 concluded that a constant level of genetic diversity has been maintained over the years in CIMMYT’s Elite Spring Wheat Yield Trial (ESWYT) (Figure 5.7).
Genetic distance between individual ESWYT lines significantly increased when lines were grouped according to differences in years of ESWYT dissemination, suggesting a systematic change in allele frequencies over time, most likely due to breeding and directional selection (Dreisigacker et al. 2012). These studies highlight that there is no loss of genetic diversity among CIMMYT/CGIAR-bred bread wheat materials.
Source: Dreisigacker et al. 2012.
Source: 2014 global wheat impacts survey. * As part of the survey, participants were asked to list the attributes or traits that they considered valuable in particular adopted varieties. The open-ended responses were grouped into the five trait categories listed here, and a percentage given based on the number of times a specific trait was mentioned, compared to the total number of responses received. Sums across rows exceed 100 because many respondents mentioned multiple varietal attributes.
High Better Resistance to Tolerance to OtherRegion (n) yield quality biotic stresses abiotic stresses (growth cycle)
China (23) 78 17 4 13 0EU and high income countries (205) 49 46 63 65 0Former Soviet Union Countries (44) 45 20 61 79 2Latin America (20) 50 50 50 35 0South Asia (44) 30 21 73 69 0Sub-Saharan Africa (36) 47 15 62 34 6West Asia and North Africa (127) 47 36 71 61 2World (499) 48 35 63 60 1
GENETIC DIVERSITY IN THE CGIAR-BREAD WHEAT PIPELINE

38
06BENEFITS OF WHEAT IMPROVEMENT RESEARCH

39Impacts of International Wheat Improvement Research 1994- 2014
TE1993 TE2003 TE2013
Wheat yield (t/ha) 2.507 2.711 3.176Yield growth rate (% pa) < 1.14% >< 1.46% > < 1.18% >Average increase in yield over base yield TE1993 (t/ha/yr) < 0.132 >< 0.452 > < 0.292 >
Source: Derived from FAOSTAT. TE = triennium ending.
Table 6.1. Global wheat yields and underlying growth rates.
Previous global wheat impact studies have reported large benefits from international wheat improvement efforts. This chapter discusses whether this positive trend continues. It reviews wheat yields and estimates and discusses the benefits from wheat improvement research.
WHEAT YIELDSGlobal wheat yields averaged 3.2 tons per hectare (t/ha) for the triennium ending 2013 (TE2013), up from 2.5 t/ha two decades earlier and with an underlying growth rate of 1.2% p.a. Taking the 2.5 t/ha from TE1993 as the base yield, the cumulative additional production over the base amounts to 5.84 tons by TE2013, or an annual average of 0.292 t/ha (Table 6.1). The observed yield growth is understood as the net result of three factors:
• Growth in genetic yield potential.
• Yield maintenance (for example, breeding for disease resistance) to avert yield declines.
• Use by farmers of yield-enhancing crop management practices.
Yield growth was relatively slow in the first decade and accelerated during the second, probably as a result of replacing rust-susceptible varieties with new, resistant ones and wheat growers’ response to improved prices after 2008.
The growth in yield potential is the most easily measured gain from wheat improvement research. An assessment of genetic progress for yield using results from CIMMYT’s Semi-Arid Wheat Yield Trial23 over a 17 year-period showed
a gain of 1% per year and concluded that there had been consistent genetic progress (Manes et al. 2012). In a related study by Sharma et al. (2012), genetic yield gains in CIMMYT spring bread wheat, based on data from the Elite Spring Wheat Yield Trial (ESWYT) during 1995-2009, ranged from 0.5% to 1.13% per year. Analysis of yield data from Kansas (USA) test performance farms during 1977-2006 showed that 79% of the yield increases can be credited to genetic improvements from public and private wheat breeding (Nalley et al. 2008). Results of another study conducted by Kansas State University showed that during 1985-2011 wheat breeding programs had improved average yields by a cumulative 0.917 t/ha or a cumulative 27% of the base yield (Barkley et al. 2014).
Notwithstanding, the environment directly influences the expression of many genes, so it is not always easy to disentangle the purely genetic component of yield from environmental effects. Moreover, unfavorable environments furnish a lower baseline for yield gain studies. For example, in ESWYT data for 1979-99, wheat yields in dry and hot environments showed higher annual growth rates (3.5% and 2.1% respectively) than those from favorable environments (0.8-1.1%).24
24 This is due partly to an increased focus on selection for heat and drought tolerance (Lantican et al. 2003).
23 This replicated yield trial contains spring bread wheat germplasm adapted to low rainfall, drought-prone environments typically receiving less than 500 millimeters of water during the cropping cycle.

40
Appendix Tables A.1 and A.2 present updated summaries of rates of yield gains in various locations and environments in developing and developed countries.
Maintaining disease resistance in the face of evolving pathogen biotypes has been a major thrust in wheat improvement research and particularly in international wheat breeding, given resource-poor farmers’ lack of disease control measures (Reynolds and Borlaug 2006), but the yield losses averted through breeding for disease resistance are hard to quantify. Singh and Rajaram (2002) claimed that wheat yield gains are contingent upon maintaining genetic disease resistance for the rusts, Septoria diseases, leaf blight, blotch, and tan spot. Marasas et
al. (2004) estimated a net present value of US $5.4 billion [1990] from leaf rust resistance research during 1973-2007. Likewise, a 2009 study that quantified the benefits from CGIAR research on yield stability estimated the annual global value of genetic resistance to various diseases at about US $2 billion (CGIAR 2011). Sayre et al. (1998) showed the maintenance effect to be substantially larger than the yield potential effect, under experimental conditions with increased disease pressure. Byerlee and Traxler (1995) assumed that, under farmers’ conditions, the maintenance effect would equal yield potential gains in irrigated and high-rainfall areas, and be somewhat lower in less favorable areas, due to lower disease pressure.
BENEFITS FROM WHEAT IMPROVEMENT RESEARCHThe net yield gain attributable to wheat improvement research is the main component for calculating the annual benefits the research brings. Due to the difficulty of attributing yield gains in farmers’ fields to the multiple causes involved, we assumed that three principal underlying factors – yield potential, yield maintenance, and crop management – contribute equally. For this study, the aggregate effect of crop improvement was assumed to consist of yield potential + yield maintenance.
We used two attribution scenarios for the annual benefits of wheat improvement research: (1) historic average increase over the base yield and (2) marginal yield increase from longevity. For each of the preceding scenarios, we included a base situation wherein the observed wheat yield gains for 1993-2013 reflected the aggregate effect of crop improvement (0.292 t/ha/yr for Scenario 1 and 1.18% p.a. for Scenario 2). We complemented each base scenario with a range estimate. The “low-end” or more conservative estimate was calculated as half of the observed gains. An alternative proxy interpretation for this lower rate would be that it reflects yield potential alone, in the absence of maintenance breeding. The “high-end” or more liberal estimate is based on the yield gains during the second decade, 2004-13. Such a higher rate could reflect a structural upward shift in yield gains associated with crop improvement.
The CGIAR contribution rules were used to estimate the CGIAR share of the gross benefits of global wheat improvement. The most realistic indicator of the CGIAR contribution is generated by applying the ICIS program BROWSE – which estimates the CGIAR share in global wheat germplasm at 33%.
The estimated additional annual wheat production due to international wheat improvement research, based on the first attribution measure used (historic average yield increase from base yield) ranged from 21.7 to 67.4 million tons (Table 6.2). Using the BROWSE-generated CGIAR contribution (0.33), the additional wheat production attributable to the CGIAR ranged from 7.2 to 22.2 million tons of wheat per year. The remaining two-thirds of additional annual wheat production are due to wheat improvement efforts of non-CGIAR partners.

41Impacts of International Wheat Improvement Research 1994- 2014
Scenario Historic average increase Marginal yield increase over base yield by longevityYield increase 0.292 t/ha 1.18% (0.146-0.452) (0.6-1.46%)Annual benefits (billion 2010 US$) attributed to: Global wheat improvement research 9.4 6.7 (4.7-14.5) (3.4-8.4)CGIAR wheat improvement research 3.1 2.2(based on BROWSE) (1.5-4.8) (1.1-2.8)
Table 6.3. Benefits from global wheat improvement research (high- and low-end estimates in parentheses).
In the second scenario (marginal yield increase by longevity), the additional annual wheat production due to international wheat improvement research ranged from 15.7 to 38.8 million tons (Table 6.2). The additional wheat production attributable to CGIAR wheat improvement research ranged from 5.2 to 12.8 million tons per year.
From the above computed additional annual wheat production and using the average World Bank’s real price25 of wheat for the study period (1994-2014) – US$ 215 [2010] per ton – global wheat improvement research generated an annual benefit of US $9.4 ($4.7-$14.5) billion [2010] under the first scenario (historic average yield increase over the base yield) (Table 6.3). Annual benefits are somewhat lower but still substantial under the second scenario (marginal yield increase by longevity): US $6.7 ($3.4-$8.4) billion [2010].
Of this, the annual benefits attributable to CGIAR wheat improvement research were US $3.1 ($1.5-$4.8) billion [2010] for the first scenario and US $2.2 ($1.1-$2.8) billion [2010] for the second (Table 6.3).
25 Based on price data from Global Economic Monitor (GEM) Commodities (http://databank.worldbank.org/data/reports.aspx?source=global-economic-monitor-%28gem%29-commodities&savedlg=1&l=en# . )
*Calculated from Table 6.2 using a reference price. For a more conservative estimate of annual benefits due to wheat improvement research, the 1994-2014 average real price (US $215/t) was used instead of the higher 2014 wheat price equivalent to US $267/t [2010].
Table 6.2 Additional annual wheat production due to wheat improvement research based on two attribution scenarios, 2014 (for each scenario, low-, mid-range, and high-end estimates are given).*
1.Historic average increase over base yield 0.146 21.7 7.2
0.292 43.5 14.4
0.452 67.4 22.2
2. Marginal yield increase by longevity 0.105 15.7 5.2
0.210 31.4 10.4
0.260 38.8 12.8
Attribution scenario Assumed yield gain (t/ha)
Additional annual wheat production due to international wheat
improvement research (million tons)
Additional annual wheat production attributable to CGIAR wheat
improvement research (million tons)
*Total area grown to improved wheat varieties = 149.1 million hectares (see Table 5.2); the CGIAR contribution generated through BROWSE = 0.33.

42
The CGIAR invests an average of about US $30 million [2010] per year in wheat improvement research of late; up from only US $10-15 million in the early 2000s, prior to the 2008 world food price crisis. Thus, regardless of the scenario or contribution rule used, annual returns to CGIAR investments in wheat improvement have been substantial.
The “historic average yield increase” scenario is very sensitive to the assumed base yield – TE1993 – and the effect of this sensitivity increases over time, being more pronounced in the second decade of the study period. The “marginal yield increase by longevity” scenario is more robust and can be used for marginal forward-looking analysis; that is, to forecast expected returns from an additional year of investment in wheat improvement research. It takes prior investments as sunk costs – which clearly lay the foundation for future benefits – and gives cumulative expected benefits from each year’s investment.
Both scenarios could be variously strengthened by more robust measurements underlying the various assumptions. The BROWSE application provided a particularly robust way of estimating the CGIAR contribution to the germplasm, but 8% of the varieties remained unidentified. Most likely these were improved varieties but with unknown ancestry, including undisclosed origins. More reliable estimates on the extent of varietal use across the globe are still much needed; the current study relied heavily on expert estimates compiled during the survey. New developments such as DNA fingerprinting offer new prospects to better identify ancestries and the extent of their use. Stronger attribution of yield gains would be another area that merits improvement. Aside from these various improvements, it will be advisable to continually monitor progress and impacts, and possibly take stock and document impacts every five years. Finally, several aspects – including price and distributional and non-yield effects – were not accounted for in our study. We discuss them in the next section.
DISCUSSION
Benefits of international wheat improvement research can be estimated in various ways. Our study followed a simple economic surplus approach, as did two previous global wheat impact studies (Heisey et al. 2002 and Lantican et al. 2005). Those studies focused on developing countries and the latter study valued the benefits attributable to global wheat improvement efforts during 1988-2002 at US $2.0-6.1 billion [2002] per year. Although the studies apply similar underlying models, their results are not directly comparable, given the expanded target areas and wheat areas, certain of the underlying assumptions, and differences in the international reference prices of wheat used for each study. Still, the outcomes of both reiterate the continuous and substantial returns to investments in international wheat
improvement research, even now that adoption of modern varieties is becoming near universal and farmers upgrade to newer and better modern varieties.
Byerlee and Traxler (1996) likewise used the economic surplus approach to estimate the impact of the joint CIMMYT/national wheat genetic improvement efforts, focusing on spring bread wheat and looking at an investment stream and the associated benefit stream over time. Their calculations arrived at global benefits of US $2.5 billion per year due to wheat breeding research, of which about US $1.5 billion per year could be attributed to the CIMMYT/national wheat program network and varieties of CIMMYT origin.

43Impacts of International Wheat Improvement Research 1994- 2014
Counterfactual scenario
Study Model Wheat output Wheat price
Evenson and Rosegrant (2003) IMPACT -5-6% +19-22%Stevenson et al. (2013) GTAP-AEZ -43-60% +29-59%
Using the International Model for Policy Analysis of Agricultural Commodities and Trade (IMPACT), which is a partial equilibrium model for the agricultural sector, and data from 1965-2000, Evenson and Rosegrant (2003) found that, in the absence of CGIAR genetic improvement in wheat, there would have been a 5-6% decrease in wheat output and a 19-22% increase in wheat prices (Table 6.4), with adverse effects on poverty and nutrition.
Supporting and providing another perspective on those findings, Stevenson et al. (2013) used the Global Trade Analysis Project Agro-Ecological Zone (GTAP-AEZ) Model, which includes land rent effects and impacts on land-use through factor markets, to show that, without the contributions of CGIAR crop genetic improvement in the developing world, wheat production in 2004 would have been 43-60% lower than observed output (Table 6.4). This lack would have been partially offset by increased wheat imports in developing countries, which in turn would have driven up the global weighted average price of wheat by 29-59% (Stevenson et al. 2013).
Table 6.4. Counterfactual scenarios: a world without CGIAR wheat improvement research.
Irrespective of the model used, all studies attribute substantial benefits to CGIAR wheat improvement research. Still, the simple economic surplus model used in the current study provides a rather narrow measure of benefits. Future impact studies should consider assessing the benefits of spill-overs, price-effects, and non-yield benefits such as improved grain quality, improved fodder and straw quality, and short growth cycles. In a recent review of the impacts of CGIAR research, Renkow and Byerlee (2010) concluded that direct productivity impacts and indirect (wage and price) impacts of modern varieties developed by international centers and partners continue to provide huge benefits for the poor within and outside the agricultural sector.
Taken with the global importance of wheat as a food crop and the expected growth in demand for wheat to 2050, the current and past impact studies make a strong case for continued or increased system-wide investment in genetic improvement research on wheat. For CGIAR to continue to generate enormous benefits from wheat improvement research, consistent and secure financial support is crucial.
This message has resonated in studies that focus on potential wheat production losses from evolving and virulent crop pathogens. Byerlee and Dubin (2010) concluded that sustainable funding was vital to the success of international wheat improvement efforts, especially with the re-emergence of stem rust as a threat to wheat production and food security in the developing world. More recently, Beddow et al. (2015) found that yearly global grain production lost to wheat stripe rust alone, estimated at $979 million, warranted a sustained annual research investment of at least $32 million.

44
07CONCLUSIONS

45Impacts of International Wheat Improvement Research 1994- 2014
Past global wheat impact studies have illustrated the significant contribution of CGIAR-related germplasm to international wheat improvement efforts. This study reiterates these findings and provides further support. It also strongly confirms the conclusions reached by the earlier studies: (1) the adoption and spread of modern wheat varieties has been sustained in the post-Green Revolution period, (2) CGIAR germplasm has continued to be widely used by breeding programs in the developing countries, and (3) investment in wheat improvement research continues to generate higher returns.
There has been no slowdown in the rates of release of improved varieties. Between 1994 and 2014, public and private-sector breeding programs released 4,604 wheat varieties in the world. Sixty-three percent of varietal releases were from public-sector breeding programs, while the private-sector had accounted for 37% of wheat varietal releases. Latin America is the region with the highest percentage of private-sector releases (53%). EU and high–income countries had equal shares (50%) of public and private-sector releases. In other regions, most wheat varietal releases came from the public sector.
More than 60% of wheat varietal releases since 1994 were CGIAR-related. Direct use of CGIAR lines was prevalent in South Asia (50%). In Latin America, the use of direct CGIAR lines decreased relative to past impacts studies, particularly in Argentina and Brazil. There is an active private seed sector in the
region and, though the pedigrees of several varietal releases were unknown, wheat scientists had used CGIAR germplasm extensively as parents or grandparents in breeding programs, so that more than 70% of varietal releases contained CGIAR contributions.
With the Green Revolution many decades behind, the use of improved wheat varieties was widespread but had continued to expand. A comparison of 32 paired countries showed that the area under improved varieties had expanded by 4.6 million hectares during 2002-2014 and adoption had increased from 93% to 97% in some regions, including high-income countries, former Soviet Union countries, South Asia, Sub-Saharan Africa, and WANA.
In contrast to suggestions that yields of modern varieties are more variable than those of farmers’ traditional varieties, Gollin (2006) showed that the relative variability in wheat grain yields had actually fallen over 40 years, due to use of improved varieties. Furthermore, as discussed earlier, several studies provide evidence that there has been no loss of genetic diversity in CIMMYT/CGIAR- bred varieties.
The significance of CGIAR-related varieties is evident in farmers’ fields. The total area sown to CGIAR-related germplasm in the world is estimated at about 106 million hectares. Spring bread wheat occupied more than half (58%) of the global wheat area in 2014, with winter/facultative bread wheat coming second at 34%.

46
As expected, CGIAR made significant contributions to spring bread wheat; 27 million hectares (28%) were sown to spring bread wheat varieties that constituted direct releases of CGIAR lines. CGIAR germplasm had contributed indirectly (as parents) in public national program spring bread wheat releases grown on another 26.6 million hectares (28% of spring bread wheat area). An additional 12.9 million hectares (14%) were sown to varieties with CGIAR lines as grandparents or utilized by public national programs as ancestors in the early development of varieties. Likewise, CGIAR-related germplasm was grown on nearly 7.0 million hectares of private-sector spring bread wheat.
By region, use of CGIAR-related spring bread wheat varieties was nearly universal in South Asia and Sub-Saharan Africa, with the latter region relying heavily on direct releases of CGIAR lines.
SPRING BREAD WHEAT
Nearly all spring durum wheat grown in Africa had CGIAR ancestry and – likely as a result of long collaboration between ICARDA and CIMMYT – nearly 80% of the durum wheat area in WANA was sown to direct releases of CGIAR lines. Similarly, nearly 70% of the area in
WANA was under CGIAR-related winter/facultative bread cultivars that can be credited to almost three decades of Turkey-CIMMYT-ICARDA collaboration and an earlier partnership of CIMMYT with Oregon State University.
DURUM AND WINTER/FACULTATIVE WHEAT
Developing countries received the greatest benefit from CGIAR contributions, particularly in spring bread and spring durum wheat areas, an outcome that aligns with CGIAR’s mandate to help resource-poor farmers and alleviate poverty and malnutrition. Still, adoption of CGIAR-related cultivars was not limited to developing countries and our study highlights significant spill-overs.
• In Canada, three-quarters of the wheat area was sown to CGIAR-related cultivars.
• In the USA, nearly 60% of the wheat area was sown to CGIAR-related varieties.
• In Western Australia, CGIAR-related varieties were used on more than 90% of the wheat area, confirming the findings of Brennan and Quade (2004), who reported high spillover benefits to Australia from CIMMYT/CGIAR wheat improvement research, as well as related averted welfare losses.
CHIEF BENEFICIARIES AND SPILLOVERS

47Impacts of International Wheat Improvement Research 1994- 2014
REPLACING OLD VARIETIESMost farmers in developing countries have adopted modern wheat varieties, but a large portion of total wheat area in 2014 was still sown to older improved varieties and few countries (Argentina, Hungary, Kenya, Lebanon, and Czech Republic) had improved their varietal replacement rates. Farmers who grow older improved varieties lose out significantly on gains from improved yield potential or better disease resistance in the newer varieties, not to mention running the risk of devastating grain losses from disease outbreaks. A better understanding of the attributes of new varieties, coupled with strong public and private sector support, are needed to promote adoption of newer improved wheat varieties.
On average, CGIAR was investing about US $30 million per year [2010] in wheat improvement research at the time of the study, but according to our estimates, CGIAR wheat improvement efforts accounted for US $2.2-3.1 billion [2010] in economic benefits per year, attributable to increased grain production. The associated benefit-cost ratio for CGIAR wheat improvement research ranged from 73:1 to 103:1. So, while it accounted for a relatively small portion of the global investment in wheat improvement research, CGIAR generated a large share of the total benefits, had substantial impact, and continued to serve as a leader and a catalyst in the global wheat improvement system.
Our analyses could be strengthened through use of more robust measurements, but our study provides valuable information on the trends of varietal releases, varietal attributes,
adoption of improved varieties, and the continued importance of CGIAR wheat improvement research efforts – a relevance confirmed by published counterfactual scenarios. Climate change and evolving disease spectra call for continued investments in wheat improvement. Food security concerns and the limited availability of favorable agricultural lands also call for revisiting the potential contribution of less favorable lands to increase production while avoiding encroachment into forests.
In general, the CGIAR continues to generate very high returns from its relatively modest investment in wheat improvement research.
Consistent and secure financial support for international wheat improvement research is crucial to continue to generate these benefits, respond to emerging threats and opportunities, and avoid recurrences of global food crises.
ECONOMIC BENEFITS AND RETURNS ON INVESTMENT

48
Genetic gains in yield resulting from the release of new wheat varieties over time.
APPE
NDIC
ESTable A.1. Evidence on rates of genetic gain in bread wheat yield, developing countries.
Environment/location Period Rate of gain (%/yr) Data source
Spring habit wheat, irrigated
Sonora, Mexico 1962-83 a 1.1 Waddington et al. (1986) 1962-85 a 0.6 Ortiz-Monasterio et al. (1990) 1962-88 a 0.8 Sayre, Rajaram and Fischer (1997) 1988-96 a 0.8 H.J. Dubin, CIMMYT b ,c
Nepal 1978-88 a 0.8 Morris, Dubin and Pokhrel (1992)India 1967-79 1.2 Kulshrestha and Jain (1982)India 1989-99 1.9 Nagarajan (2002)Northwest India 1985-95a 0.9 H.J. Dubin, CIMMYT b ,c
Pakistan 1965-82a 0.8 Byerlee (1993)Zimbabwe 1967-85 1.0 Mashiringwani (1987)Semi-arid wheat, CIMMYT 1994-2010 1.0 Manes et al. (2012)CIMMYT spring bread 1977-2008 0.7 Lopes et al. (2012)
Hot, irrigated
Sudan 1967-87 0.9 Byerlee and Moya (1993)
Rainfed
Ethiopia 1967-94 1.2-1.7 Amsal et al (1996)Uruguay 1966-95a 1.4 Mohan Kohli, CIMMYT b
high fertility 1966-95b 0.9 Mohan Kohli, CIMMYT b
low fertilityParana, Brazil (non-acid) 1978-94 0.9 Mohan Kohli, CIMMYT b
Paraguay 1972-90 1.3 Mohan Kohli, CIMMYT b
1979-92a 1.6 Mohan Kohli, CIMMYT b
Argentina 1966-89 1.9 Byerlee and Moya (1993) 1971-89 3.6 Mohan Kohli, CIMMYT b
unprotected 1971-89a 2.1 Mohan Kohli, CIMMYT b
protected 1988-97a 3.7 Mohan Kohli, CIMMYT b
Bolivia 1986-96a 1.0 Mohan Kohli, CIMMYT b
Central India 1966-91 0.27 Jain and Byerlee (1999)
Acid soils, rainfed
Rio Grande do Sul 1976-89 3.2 Byerlee and Moya (1993)Rio Grande do Sul, Brazil 1970-90 3.6 Tomasini (2002)Parana, Brazil 1969-89 2.2 Byerlee and Moya (1993) 1970-96a 0.2(ns) Mohan Kohli, CIMMYT b
Facultative/winter habit wheat
South Africa 1930-90 1.4 Van Lill and Purchase (1995) Northern China 1960-2000 0.48-1.23 Zhou et al. (2007)Southern China 1949-2000 0.31-0.74 Zhou et al. (2007)Henan, China 1981-2008 0.6 Zheng et al. (2011)
a Semi-dwarfs only. b Unpublished data. c Two-variety comparison only.Note: This table is an update of Lantican, Dubin and Morris (2005); Heisey, Lantican and Dubin (2002); Rejesus, Smale and Heisey (1999); and Byerlee and Moya (1993).

49Impacts of International Wheat Improvement Research 1994- 2014
Table A.2. Evidence on rates of genetic gain in wheat yield, developed countries.
Environment/location Period Rate of gain (%/yr) Data source
Spring habit wheat, rainfed
Victoria, Australia 1850-1940 0.3 O’Brien (1982) 1940-81 0.8New South Wales, Australia 1956-84 0.9 Anthony and Brennan (1987)Western Australia 1884-1982 0.4 Perry and D’Antuono (1989)(low rainfall)Siberia, Russia 1900-2000 0.7 Morgounov et al. (2010)Hard red spring wheat (CWRS)Western Canada prior to 1990 0.35 Thomas and Graf (2014) early 1990s-2013 0.67
Facultative/winter habit wheat, rainfed
Kansas (hard red winter) 1932-69 0.6 Feyerherm and Paulsen (1981) 1971-77 0.8 Feyerherm, Paulsen & Sebaugh (1984) 1874-1970 0.4 Cox et al. (1988) 1976-87 1.2Oklahoma/Texas (hard red winter) 1932-74 0.8 Feyerherm and Paulsen (1981)Oklahoma, USA 1919-1997 1.3 Khalil et al. (2002)U.S. corn belt winter (soft/hard) 1968-76 1.7 Feyerherm,Paulsen and Sebaugh (1984)U.S. winter 1958-78 0.7-1.4 Schmidt (1984)(various regional performance nurseries)U.S. Great Plains 1996-97 and 1998-99 Older genotypes 0.16 Donmez et al. (2001) New genotypes 0.63U.S. Great Plainssemidwarf winter wheat 1971-2008 0.4 Battenfield et al. (2013)US Southern region (SRPN) 1959-2008 All entries 1.1 Graybosch and Peterson (2010) Only most productive entry 1.3US Northern region (NRPN) 1959-2008 All entries 0.79 Graybosch and Peterson (2010) Most productive entry 0.79U.K. 1947-77 1.5 Silvey (1978)Sweden 1900-1976 0.2 Ledent and Stoy (1988)Spain (contrasting environments) 1930-2000 0.88 Sanchez-Garcia et al. (2013)
Note: This table is an update of Lantican, Dubin and Morris (2005); Heisey, Lantican and Dubin (2002); Rejesus, Smale and Heisey (1999); and Byerlee and Moya (1993).
Table A3. ICARDA’s yearly spring bread wheat international nurseries and yield trials.
Nurseries/yield trials Abbreviations Number of entries Target environments Seed color
Spring bread wheat observation nursery for CWANA SBWON 130-160 CWANA-rainfed and irrigated White/AmberSpring bread wheat observation nursery for heat tolerance SBWON-HT 160 CWANA-irrigated White/AmberSpring bread wheat yield trial for irrigated environments ISBWYT 24 CWANA-irrigated White/AmberSpring bread wheat yield trial for dry-land environments DSBWYT 24 CWANA-rainfed White/AmberElite spring bread wheat yield trial ESBWYT 24 CWANA-rainfed and irrigated White/Amber

50
Figure A.1. Global wheat sites with stem rust as a production constraint.
Production constraints per key wheat site as viewed by respondents are summarized, mapped and presented in Figures A.1 to A.7. Note that no responses on constraints were received from Australia, Canada and the USA.
Table A4. ICARDA’s yearly durum wheat international nurseries.
Nurseries/yield trials Abbreviations Number of entries Target environments Seed color
International Durum Wheat Observation Nursery IDON 96 ME1, ME2B, ME4, ME5, ME6 Amber/Red/BrownInternational Durum Wheat Yield Trials IDYT 24 ME1, ME2B, ME4, ME5, ME6 AmberInternational Facultative Winter IFWDON 48 ME7, ME8, ME9, occasionally ME12 Amber/Red Durum Wheat Observation Nursery

51Impacts of International Wheat Improvement Research 1994- 2014
Figure A.2. Global wheat sites with leaf rust as a production constraint.
Figure A.3. Global wheat sites with yellow rust as a production constraint.

52
Figure A.5. Global wheat sites with drought and heat stresses as production constraints.
Figure A.4. Global wheat sites with powdery mildew as a production constraint.

53Impacts of International Wheat Improvement Research 1994- 2014
Figure A.6. Global wheat sites with drought stress as a production constraint.
Figure A.7. Global wheat sites with heat stress as a production constraint.

54
Abdalla, O.S., J. Crossa, E. Autrique, and I.H. de Lacy. 1996. Relationships among international testing sites of spring durum. Crop Sci. 36(1): 33-40.
Ali S., P. Gladieux, M. Leconte, A. Gautier, A.F. Justesen, M.S. Hovmøller, J. Enjalbert, C. de Vallavieille Pope. 2014. Origin, migration routes and worldwide population genetic structure of the wheat yellow rust pathogen Puccinia striiformis f. sp. tritici. PLoS Pathog 10(1): e1003903. doi:10.1371/journal.ppat.1003903.
Ali, M., and D. Byerlee. 1991. Economic efficiency of small farmers in a changing world: A survey of recent evidence. Journal of International Development 3(1): 1-27.
Alston, J.M. 1991. Research benefits in a multimarket setting: A review. Review of Marketing and Agricultural Economics 59 (1): 32-52.
Alston, J.M., and P.G. Pardey. 2001. Attribution and other problems in assessing the returns to agricultural R&D. Agricultural Economics 25(2-3): 141-152.
Amsal, T., G. Getinet, T. Tesfaye, and D.G. Tanner. 1996. Effects of genetic improvement on morpho-physiological characters related to grain yield of bread wheat in Ethiopia. In Woldeyesus Sinebo, Zerihun tadele, and Nigussie Alemayehu (eds.), Proceedings of the Annual Agronomy and Crop Physiology Society of Ethiopia. Addis Ababa, Ethiopia: ACPSE.
Anderson J.A., R.W. Stack, S. Liu, B.L. Waldron, A.D. Fjeld, C. Coyne, B. Moreno-Sevilla, F.J. Mitchell, Q.J. Song, P.B. Cregan, and R.C. Frohberg. 2001. DNA markers for Fusarium head blight resistance QTLs in two wheat populations. Theor Appl Genet 102:1164-1168.
Anthony, G., and J.P. Brennan. 1987. Progress in yield potential and bread-making characteristics in wheat in New South Wales, 1925-26 to 1984-85. Agricultural Economics Bulletin, Division of Marketing and Economic Services, New South Wales, Australia: Department of Agriculture.
Austin, R.B., J. Bingham, R.D. Blackwell, L.T. Evans, M.A. Ford, C.L. Morgan, and M. Taylor. 1980. Genetic improvements in winter wheat yields since 1900 and associated physiological changes. Journal of Agricultural Science, Cambridge 94:675-689.
Barkley, A., J. Tack, L.L. Nalley, J. Bergtold, R. Bowden, and A. Fritz. 2014. Weather, disease and wheat breeding effects on Kansas wheat varietal yields, 1985-2011. Agronomy Journal 106(1): 227-235.
Basnet B.R., R.P. Singh, A.M.H. Ibrahim, S.A. Herrera-Foessel, J. Huerta-Espino, C. Lan, and J.C. Rudd. 2014. Characterization of Yr54 and other genes associated with adult plant resistance to yellow rust and leaf rust in common wheat Quaiu 3. Mol Breeding 33:385-399.
Battenfield, S.D., A.R. Klatt, and W.R. Raun. 2013. Genetic yield potential improvement of semidwarf winter wheat in the Great Plains. Crop Sci. 53:946-955.
Beddow, J.M., P.G. Pardey, Y. Chai, T.M. Hurley, D.J. Kriticos, H.J. Braun, R.F. Park, W.S. Cuddy, and T. Yonow. 2015. Research investment implications of shifts in the global geography of wheat stripe rust. Nature Plants DOI: 10.1038/nplants.2015.132.
Bonjean, A.P., and W.J. Angus (eds.). 2000. The World Wheat Book. A History of Wheat Breeding. Paris: Lavoisier Publishing Inc.
REFERENCES AND RECOMMENDED READING

55Impacts of International Wheat Improvement Research 1994- 2014
Bonjean, A.P., W.J. Angus, M. van Ginkel (eds.). 2011. The World Wheat Book 2. A History of Wheat Breeding. Paris: Lavoisier Publishing.
Braun H.J., S. Rajaram, and M. Van Ginkel. 1996. CIMMYT’s approach to breeding for wide adaptation. Euphytica 92:175-183.
Brennan, J.P., and D. Byerlee. 1991. The rate of crop varietal replacement on farms: measures and empirical results for wheat. Plant Varieties and Seeds (4): 99-106.
Brennan, J.P., and K.J. Quade. 2004. Analysis of the Impact of CIMMYT Research on the Australian Wheat Industry. Economic Research Report No. 25. NSW Department of Primary Industries, Wagga Wagga.
Byerlee, D. 1992. Technical change, productivity, and sustainability in irrigated cropping systems of South Asia: Emerging issues in the post-Green Revolution era. Journal of International Development 4(5): 477-496.
Byerlee, D. 1993. Technical change and returns to wheat breeding research in Pakistan’s Punjab in the post-Green Revolution period. The Pakistan Development Review 32(1): 69-86.
Byerlee, D. and P.W. Heisey. 1990. Wheat varietal diversification over time and space as factors in yield gains and rust resistance in the Punjab. 1990. In P.W. Heisey (ed.) Accelerating the Transfer of Wheat Breeding Gains to Farmers: A Strategy of the Dynamics of Varietal Replacement in Pakistan. CIMMYT Research Report No. 1 Mexico, D.F.: CIMMYT.
Byerlee, D., and G. Traxler. 1995. National and international wheat improvement research in the post Green Revolution period: Evolution and impacts. American Journal of Agricultural Economics 77: 268-278.
Byerlee, D. and P. Moya. 1993. Impacts of International Wheat Breeding Research in the Developing World, 1966-90. Mexico, D.F.: CIMMYT.
Byerlee, D., and H.J. Dubin. 2010. Crop improvement in the CGIAR as a global success story of open access and international collaboration. International Journal of Commons Vol 4, No 1. DOI: http://doi.org/10.18352/ijc.147.
Cakmak I., R.D. Graham, and R.M. Welch. 2002. Agricultural and molecular genetic approaches to improving nutrition and preventing micronutrient malnutrition globally. In Encyclopedia of Life Support Systems, Vol. 2, 1075-1099. UNESCO publishing.
CGIAR. 2011. Forty Findings on the Impacts of CGIAR Research 1971-2011. World Bank, Washington, D.C.: CGIAR Fund Office.
Cox, T.S., J.P. Shroyer, B.-H. Liu, R.G. Sears, and T.J. Martin. 1988. Genetic improvement in agronomic traits of hard red winter wheat cultivars from 1919 to 1987. Crop Science 28:756-760.
Dixon, J., L. Nalley, P. Kosina, R. La Rovere, J. Hellin, and P. Aquino. 2006. Adoption and economic impact of improved wheat varieties in the developing world. J Agr Sci [Centenary Review] 144:489-502.
Donmez, E., R.G. Sears, J.P. Shroyer, and G.M. Paulsen. 2001. Genetic gain in yield attributes of winter wheat in the Great Plains. Crop Science 41:1412-1419.
Dreisigacker, S., P. Zhang, M. Warburton, M. Van Ginkel, M. Bohn, and A.E. Melchinger. 2004. SSR and pedigree analyses of genetic diversity among CIMMYT wheat lines targeted to different mega-environments. Crop Science 44:381-388.
Dreisigacker, S., M. Kishii, J. Lage, and M. Warburton. 2008. Use of synthetic hexaploid wheat to increase diversity for CIMMYT bread wheat improvement. Australian Journal of Agricultural Research 59:413-420.
Dreisigacker, S., H. Shewayrga, J. Crossa, V.N. Arief, I.H. DeLacy, R.P. Singh, M.J. Dieters and H.J. Braun. 2012. Genetic structures of the CIMMYT international yield trial targeted to irrigated environments. Molecular Breeding 29(2): 529-541.
Evenson, R.E. 2000. Crop germplasm improvement: A general perspective. Paper presented at the annual meeting of the American Association of the Advancement of Science. Washington, D.C. 21 February 2000.
Evenson, R.E., and D. Gollin. 2003. Assessing the impact of Green Revolution 1960-2000. Science 300:750-762.

56
Evenson, R.E., and M. Rosegrant. 2003. The economic consequences of crop genetic improvement programmes. In R.E. Evenson and D. Gollin (eds.), Crop Variety Improvement and its Effect on Productivity: The Impact of International Agricultural Research. Food and Agriculture Organization. Wallingford, U.K.: CABI Publishing.
Feyerherm, A.M., and G.M. Paulsen. 1981. An analysis of temporal and regional variation in wheat yields. Agronomy Journal 73:863-867.
Feyerherm, A.M., G.M. Paulsen, and J.L. Sebaugh. 1984. Contribution of genetic improvement to recent wheat yield increases in the USA. Agronomy Journal 76:985-990.
Fischer, R.A., and P.C. Wall. 1976. Wheat breeding in Mexico and yield increases. Journal of the Australian Institute of Agricultural Science 42:138-148.
Fischer, R.A. and G. O. Edmeades. 2010. Breeding and cereal yield progress. Crop Sci. 50:S-85 – S-98.
Fischer, R.A., D. Byerlee, and G. Edmeades. 2014. Crop yields and global food security: will yield increase continue to feed the world? Canberra: Australian Centre for International Agricultural Research. Retrieved from http://aciar.gov.au/publication/mn158.
Galushko, V., and R. Gray. 2014. Twenty-five years of private wheat breeding in the UK: lessons for other countries. Science and Public Policy:1-15.
Gollin, D. 2006. Impacts of International Research on Intertemporal Yield Stability in Wheat and Maize: An Economic Assessment. Mexico, D.F.: CIMMYT
Graybosch, R.A., and C.J. Peterson. 2010. Genetic Improvement in Winter Wheat Yields in the Great Plains of North America, 1959-2008. USDA-Agricultural Research Service/ University of Nebraska-Lincoln Faculty Paper 915.
Heisey, P.W. 1990 (ed.). 1990. Accelerating the Transfer of Wheat Breeding Gains to Farmers: A Study of the Dynamics of Varietal Replacement in Pakistan. CIMMYT Research Report No. 1. Mexico, D.F.: CIMMYT.
Heisey, P.W., and M.A. Lantican. 1999. International wheat breeding research in Eastern and Southern Africa. In Tenth Regional Wheat Workshop for Eastern, Central, and Southern Africa. Addis Ababa, Ethiopia: CIMMYT.
Heisey, P.W., C.S. Srinivasan, and C. Thirtle. 2001. Public Sector Plant Breeding in a Privatizing World. Agriculture Information Bulletin No. 772. U.S. Department of Agriculture.
Heisey, P.W. 2002. International Breeding and Future Productivity in Developing Countries. Wheat Yearbook/WHS-2002. United States Department of Agriculture – Economic Research Service (USDA-ERS).
Heisey, P.W., M.A. Lantican, and H.J. Dubin. 2002. Impacts of International Wheat Breeding Research in the Developing World, 1966-97. Mexico, D.F.: CIMMYT.
Huang, J., C. Xiang, and Y. Wang. 2015. The Impact of CIMMYT Wheat Germplasm on Wheat Productivity in China. Mexico, D.F.: CGIAR Research Program on Wheat.
Jain, K.B.L., and D. Byerlee. 1999. Investment efficiency at the national level: Wheat improvement research in India. In M.K. Maredia and D. Byerlee (eds.), The Global Wheat Improvement System: Prospects for Enhancing Efficiency in the Presence of Spillovers. CIMMYT Research Report No.5. Mexico, D.F.: CIMMYT.
Jilani, A., D. Pearce, and F. Bailo. 2013. ACIAR wheat and maize projects in Afghanistan. ACIAR Impact Assessment Series Report No. 85. Canberra: Australian Centre for International Agricultural Research.
Khalil, I.H., B.F. Carver, E.G. Krenzer, C.T. MacKown, and G.W. Horn. 2002. Genetic trends in winter wheat yield and test weight under dual-purpose and grain only management systems. Crop Sci. 42:710-715.
Khan, M.A. 1987. Wheat Variety Development and Longevity of Rust Resistance. Lahore, Pakistan: Department of Agriculture, Government of the Punjab.
Krishna, V.V., D.J. Spielman, and P.C. Veettil. 2015. Exploring the supply and demand factors of varietal turnover in Indian wheat. Journal of Agricultural Science. DOI:10.1017/S0021859615000155.
Kulshrestha, V.P., and H.K. Jain. 1982. Eighty years of wheat breeding in India: Past selection pressures and future prospects. Zeitschrift Pflanzenzuchtung 89:19-30.
Lan, C., G.M. Rosewarne, R.P. Singh, S.A. Herrera-Foessel, J.Huerta-Espino, B.R. Basnet, Y. Zhang, and E. Yang. 2014. QTL characterization of resistance to leaf rust and stripe rust in the spring wheat line Francolin#1. Mol. Breeding 34:789-803.
Lantican, M.A., H.J. Dubin, and M.L. Morris. 2005. Impacts of International Wheat Breeding Research in the Developing World, 1988-2002. Mexico, D.F.: CIMMYT.
Lantican, M.A., P. L. Pingali, and S. Rajaram. 2003. Is research on marginal lands catching up? The case of unfavourable wheat growing environments. Agricultural Economics 29:353-361.
Ledent, J.F., and V. Stoy. 1988. Yield of winter wheat, a comparison of genotypes from 1910 to 1976. Cereal Research Communications 16: 151-156.
Li, Z., C. Lan, Z. He, R.P. Singh, G.M. Rosewarne, X. Chen, and X. Xia. 2014. Overview and application of QTL for adult plant resistance to leaf rust and powdery mildew in wheat. Crop Science 54:1907–1925.
Lillemo M., A.K. Joshi, R. Prasad, R. Chand, and R.P. Singh. 2013. QTL for spot blotch resistance in bread wheat line Saar co-locate to the biotrophic disease resistance loci Lr34 and Lr46. Theor Appl Genet 126:711-719.
Lopes, M.S., M.P. Reynolds, Y. Manes, R.P. Singh, J.Crossa, and H.J. Braun. 2012. Genetic yield gains and changes in associated traits of CIMMYT spring bread wheat in a “historic” set representing 30 years of breeding. Crop Science 52:1123-1131.
Manes, Y., H.F. Gomez, L. Puhl, M. Reynolds, H.J. Braun, and R. Trethowan. 2012. Genetic gains of the CIMMYT International Semi-arid Wheat Yield Trials from 1994 to 2010. Crop Science 52: 1543-1552.
Marasas, C.N., M. Smale, and R.P. Singh. 2004. The Economic Impact in Developing Countries of Leaf Rust Resistance Breeding in CIMMYT-Related Spring Bread Wheat. CIMMYT Economics Program Paper 04-01. Mexico, D.F.: CIMMYT.
Maredia, M.K., and D. Byerlee (eds.). 1999. The Global Wheat Improvement System: prospects for Enhancing Efficiency in the Presence of Spillovers. CIMMYT Research Report No. 5. Mexico, D.F.: CIMMYT.
Marshall, G.R., and J.P. Brennan. 2001. Issues in benefit-cost analysis of agricultural research projects. The Australian Journal of Agricultural and Resource Economics 45(2): 195-213.

57Impacts of International Wheat Improvement Research 1994- 2014
Mashiringwani, N.A. 1987. Trends in Production and Consumption of Wheat and the Role of Variety Improvement in Zimbabwe. Department of Research and Specialist Services.
Mazid, A., M. Keser, K.N. Amegbeto, A. Morgounov, A. Bagci, K. Peker, M. Akin, M. Kucukcongar, M. Kan, A. Semerci, S. Karabak, A. Altikat, and S. Yaktubay. 2014. Measuring the impact of agricultural research: The case of new wheat varieties in Turkey. Experimental Agriculture 51(02): 161-178.
McLaren, C.G., R. Bruskiewich, A.M. Portugal, and A.B. Cosico. 2005. The International Rice Information System. A Platform for Meta-Analysis of Rice Crop Data. Plant Physiology 139:637-642.
McLaren, C.G., I. DeLacy and J. Crossa, 2007. Routine Computation and Visualization of Coefficients of Parentage Using the International Crop Information System. Technical Report.
Monasterio I. and R.D. Graham. 2000. Breeding for trace minerals in wheat. Food and Nutrition Bulletin 21:393-396.
Mondal S., R.P. Singh, J. Huerta-Espino, Z. Kehel, and E. Autrique. 2015. Characterization of heat and drought stress tolerance in high-yielding spring wheat. Crop Science 55:1–11.
Morgounov, A., V. Zykin, I. Belan, L. Roseeva, Y. Zelenskiy, H.F. Gomez-Becerra, H. Budak, and F. Bekes. 2010. Genetic gains for grain yield in high latitude spring wheat grown in Western Siberia in 1900-2008. Field Crops Res. 117:101-112.
Morris, M.L. and P.W. Heisey. 2003. Evaluating the benefits of plant breeding research. Methodological issues and practical challenges. Agricultural Economics 29:241-252.
Morris, M.L., H.J. Dubin, and T. Pokhrel. 1992. Returns to wheat research in Nepal. CIMMYT Economics Working Paper 92-04. Mexico, D.F.: CIMMYT.
Nagarajan, S. 2002. The significance of wheat production for India, in particular under limited moisture conditions. http://www.biotech.biol.ethz.ch/India/forms/Nagarajan.pdf.
Nalley, L.L., A. Barkley, and F. Chumley. 2008. The impact of Kansas wheat breeding program on wheat yields, 1911-2006. Journal of Agricultural and Applied Economics 40(3):913-925.
Nelson, G.C., M.W. Rosegrant, J. Koo, R.D. Robertson, T. Sulser, T. Zhu, C. Ringler, S. Msangi, A. Palazzo, M. Batka, M. Magalhaes, R. Valmonte-Santos, M. Ewing, D.R. Lee. 2009. Climate Change: Impact on Agriculture and Costs of Adaptation. Food Policy Report. Washington, D.C.: IFPRI.
O’Brien, L. 1982. Victorian wheat yield trends 1898-1977. Journal of the Australian Institute of Agricultural Science 48:163-68.
Ortiz-Monasterio, J.I., K. Sayre, S. Rajaram, and M. McMahon. 1990. Genetic progress of CIMMYT germplasm under different levels of nitrogen. Agronomy Abstracts 156-60.
Ortiz-Monasterio, J.I., K. Sayre, S. Rajaram, and M. McMahon. 1997. Genetic progress in wheat yield and nitrogen use efficiency under four nitrogen rates. Crop Science 37:898-904.
Pardey, P.G., J.M. Alston, J.E. Christian, and S. Fan. 1996. Hidden Harvest: U.S. Benefits from International Research Aid. Food Policy Report. Washington, D.C.: International Food Policy Research Institute (IFPRI).
Pardey, P.G., J.M. Beddow, D.J. Kriticos, T.M. Hurley, R.F. Park, E. Duveiller, R.W. Sutherst, J.J. Burdon, and D. Hodson. 2013. Right-sizing stem-rust research. Science 340:147-148.
Perry, M., and M. D’Antuono. 1989. Yield improvement and associated characteristics of some Australian spring wheat cultivars introduced between 1860 and 1982. Australian Journal of Agricultural Research 40:457-472.
Pingali, P.L. 2012. Green Revolution: Impacts, limits, and the path ahead. Proceedings of the National Academy of Sciences of the United States of America (PNAS) 109(31): 12302–12308.
Pray, C.E. 1992. Plant Breeders’ Rights Legislation, Enforcement and R&D: Lessons for Developing Countries. In G.H. Peters, B.F. Stanton, and G.J. Tyler (eds.), Sustainable Agricultural Development: The Role of international Cooperation, Proceedings of the Twenty-first International Conference of Agricultural Economists, Tokyo, Japan, 22-29 August 1991,330-342. Brookfield, Vermont: Dartmouth.

58
Qin, X., F. Zhang, C. Liu, H. Yu, B. Cao, S. Tian, Y. Liao, and K.H.M. Siddique. 2015. Wheat yield environments in China: Past trends and future directions. Field Crops Research 177:117-124.
Rajaram, R., M. van Ginkel, and R.A. Fischer. 1994. CIMMYT’s wheat breeding mega-environments (ME). In Proceedings of the 8th International Wheat Genetics Symposium, July 19-24, Beijing, China. 1101-1106.
Reif, J.C., P. Zhang, S. Dreisigacker, M.L. Warburton, M. van Ginkel, D. Hoisington, M. Bohn, and A.E. Melchinger. 2005. Wheat genetic diversity trends during domestication and breeding. Theoretical and Applied Genetics 110:859–864.
Rejesus, R.M., P.W. Heisey and M.Smale. 1999. Sources of Productivity Growth in Wheat: A Review of Recent Performance and Medium to Long-term Prospects. CIMMYT Economics Working Paper 99-05. Mexico, D.F.: CIMMYT.
Renkow, M., and D. Byerlee. 2010. The impacts of CGIAR research: A review of recent evidence. Food Policy35(5): 391-402.
Reynolds, M.P. and N.E. Borlaug. 2006. Impacts of breeding on international collaborative wheat improvement. Journal of Agricultural Science 144:3-13.
Rosegrant, M.W., and S.A. Cline. 2003. Global food security: challenges and policies. Science 302:1917-1919.
Rosegrant, M.W., S. Tokgoz, and P. Bhandary. 2012. The new normal? A tighter global agricultural supply and demand relation and its implications for food security. Amer J Agr Econ 95(2): 303-309.
Rosewarne G.M, S.A. Herrera-Foessel, R.P. Singh, J. HuertaEspino, X.C. Lan, and Z.H. He. 2013. Quantitative trait loci of stripe rust resistance in wheat. Theoretical and Applied Genetics 126:2427–2449.
Rubenstein, K.D., P. Heisey, R. Shoemaker, J. Sullivan, and G. Frisvold. 2005. Crop Genetic Resources: An Economic Appraisal. Economic Information Bulletin No. 2: USDA.
Sanchez-Garcia, M., C. Royo, N. Aparicio, J.A. Martin-Sanchez, F. Alvaro. 2013. Genetic improvement of bread wheat and associated traits in Spain during the 20th century. J Agric Sci 151(1): 105-118.
Sayre, K.D., S. Rajaram, and R.A. Fischer. 1997. Yield potential progress in short bread wheats in northwest Mexico. Crop Science 37(1): 36-42.
Sayre, K.D., R.P. Singh, J. Huerta-Espino, and S. Rajaram. 1998. Genetic progress in reducing losses to leaf rust in CIMMYT-derived Mexican spring wheat cultivars. Crop Science 38:654-659.
Schmidt, J.W. 1984. Genetic contributions to yield gains in wheat. In W.R. Fehr (ed.), Proceedings of a Symposium on Genetic Contributions to Yield Gains of Five Major Crop Plants. Sponsored by C-1, Crop Science Society of America, Atlanta, Georgia, 2 December 1981. Madison, Wisconsin: Crop Science Society of America and American Society of Agronomy.
Sharma, R.C., J. Crossa, G. Velu, J. Huerta-Espino, M. Vargas, T.S. Payne, and R.P. Singh. 2012. Genetic gains for grain yield in CIMMYT spring bread wheat across international environments. Crop Science 52: 1522-1533.
Shiferaw, B., M. Kassie, M. Jaleta and C. Yirga. 2014. Adoption of improved wheat varieties and impacts on household food security in Ethiopia. Food Policy 44:272-284.
Silvey, V. 1978. The contribution of new varieties to increasing cereal (wheat and barley) yields in England and Wales. Journal of National Institute of Agricultural Botany 14(3): 367-384.
Singh R.P., and J. Huerta-Espino. 2004. The use of ‘single-backcross, selected-bulk’ breeding approach for transferring minor genes based rust resistance into adapted cultivars. In C.K. Black, J.F. Panozzo and G.J. Rebetzke (eds.), Proc. of 54th Australian Cereal Chemistry Conference and 11th Wheat Breeders Assembly, 21-24 September 2004, Canberra, Australia, 48-51. Melbourne: Cereal Chemistry Division, Royal Australian Chemical Institute.
Singh R.P., S. Rajaram, A. Miranda, J. Huerta-Espino and E. Autrique. 1998. Comparison of two crossing and four selection schemes for yield, yield traits, and slow rusting resistance to leaf rust in wheat. Euphytica 100:35-43.
Singh, R.P., and S. Rajaram. 2002. Breeding for disease resistance in wheat. In B.C. Curtis, S. Rajaram, and H. Gomez Macpherson (eds.), Bread Wheat Improvement and Production, FAO Plant Production and Protection Series No. 30, 141-156. Rome: FAO.
Slafer, G.A., and F.H. Andrade. 1989. Genetic improvement in bread wheat (Triticum aestivum) yields in Argentina. Field Crops Research 21:289-296.

59Impacts of International Wheat Improvement Research 1994- 2014
Smale, M., M.P. Reynolds, M.L. Warburton, R. Trethowan, R.P. Singh, I. Ortiz-Monasterio, J.Crossa, M. Khairallah, and M.I. Almanza-Pinzon. 2001. Dimensions of Diversity in CIMMYT Bread Wheat from 1965 to 2000 Mexico, D.F.: CIMMYT.
Smit, H.A., V.L. Tolmay, A. Barnard, J.P. Jordaan, F.P. Koekemoer, W.M. Otto, Z.A. Pretorius, J.L. Purchase, and J.P.C. Tolmay. 2008. An overview of the context and scope of wheat (Triticum aestivum) research in South Africa from 1983 to 2008. S Afr J Plant & Soil 27(1): 1983-2008.
Stevenson, J.R., N. Villoria, D. Byerlee, T. Kelley, and M. Maredia. 2013. Green Revolution research saved an estimated 18 to 27 million hectares from being brought into agricultural production. Proceedings of the National Academy of Sciences of the United States of America (PNAS). Vol. 110 No. 21.
Thomas, J.B. and R.J. Graf. 2014. Rates of yield gain of hard red spring wheat in western Canada. Can J Plant Sci 94:1-13.
Tomasini, R.G.A. 2002. Impact of Mexican Germplasm on Brazilian Wheat Cropping: An Ex-Post Economic Analysis. CIMMYT Economics Working Paper No. 02-01. Mexico, D.F.: CIMMYT.
Trethowan, R.M., and A. Mujeeb-Kazi..
2008. Novel germplasm resources for improving environmental stress tolerance of hexaploid wheat. Crop Science 48(4): 1255-1265.
Trethowan, R.M., M. van Ginkel, and S. Rajaram. 2002. Progress in breeding for yield and adaptation to global drought affected environments. Crop Science 42(5): 1441-1446.
Van Lill, D., and J.L. Purchase. 1995. Directions in breeding for winter wheat yield and quality in South Africa from 1930 to 1990. Euphytica 82: 79-87.
Velu, G., and R.P. Singh. 2012. Biofortified wheat to alleviate micronutrient malnutrition globally. In A.I Betancourt and H.F. Gaitan (eds.), Micronutrients: Sources, Properties and Health Effects, 117-135. New York: Nova Science Publishers.
Waddington, S.R., J.K. Ransom, M. Osmanzai, and D.A. Saunders. 1986. Improvement in the yield potential of bread wheat adapted to Northwest Mexico. Crop Science 26:698-703.
Walker, T., A. Alene, J. Ndjeunga, R. Labarta, Y. Yigezu, A. Diagne, R. Andrade, R. Muthoni Andriatsitohaina, H. De Groote, K. Mausch, C. Yirga, F. Simtowe, E. Katungi, W. Jogo, M. Jaleta, and S. Pandey. 2014. Measuring the effectiveness of crop improvement research in Sub-Saharan Africa from the perspectives of varietal output, adoption, and change: 20 crops, 30 countries, and 1,150 cultivars in farmers’ fields. Report of the Standing Panel on Impact Assessment (SPIA), CGIAR Independent Science and Partnership Council (ISPC) Secretariat: Rome, Italy.
Warburton, M.L., J. Crossa, J. Franco, M. Kazi, R.M. Trethowan, S. Rajaram, W.H. Pfeiffer, P. Zhang, S. Dreisigacker, and M. van Ginkel. 2006. Bringing wild relatives back into the family: Recovering genetic diversity CIMMYT improved wheat germplasm. Euphytica 149(3): 289-301.
You, L., U. Wood-Sichra, S. Fritz, Z. Guo, L. See, and J. Koo. 2014. Spatial Production Allocation Model (SPAM) 2005 v2.0. June 9, 2015. Available from http://mapspam.info.
Yu L-X., H. Barbier, M.N. Rouse, S. Singh, R.P. Singh, S. Bhavani, J. HuertaEspino, and M.E. Sorrells. 2014. A consensus map for Ug99 stem rust resistance loci in wheat. Theoretical and Applied Genetics 127:1561-1581.
Yu, S.R., Z.S. Wu, and Z.P. Yang. 1988. Genetic improvement in yield and its associated traits of wheat cultivars in northern Jiangsu province since 1970. Sci Agric Sin 21:15-21.
Zhang, P., S. Dreisigacker, A.E. Melchinger, M. van Ginkel, D. Hoisington, and M.L. Warburton. 2005. Quantifying novel sequence variation in synthetic hexaploid wheats and their backcross-derived lines using SSR markers. Molecular Breeding 15:1-10.
Zhang, Y., S. Li, Z. Wu, W. Yang, Y. Yu, X. Xia, and Z. He. 2011. Contribution of CIMMYT germplasm to genetic improvement of grain yield in spring wheat of Sichuan, Yunnan, Gansu, Xinjiang Provinces. Acta Agron Sin 37(10): 1752-1762.
Zheng, T., X. Zhang, G. Yin, L. Wang, Y. Han, L. Chen, and F. Huang. 2011. Genetic gains in grain yield, net photosynthesis and stomatal conductance achieved in Henan province of China between 1981 and 2008. Field Crops Research 122:225-233.
Zhou, Y., H. Zhu, S. Cai, Z. He, X. Zhang, X. Xia, and G. Zhang. 2007. Genetic improvement of grain yield and associated traits in the southern China winter wheat region from 1949 to 2000. Euphytica 157:455-473.
Zhou, Y., Z. He, X. Sui, X. Xia, G. Zhang. 2007. Genetic improvement of grain yield and associated traits in the northern China winter wheat region from 1960 to 2000. Crop Science 47:245-253.
Zhu, Z., D. Bonnett, M. Ellis, P. Singh, N. Heslot, S. Dreisigacker, C. Gao, and A. Mujeeb-Kazi. 2014. Mapping resistance to spot blotch in a CIMMYT synthetic-derived bread wheat. Molecular Breeding 34(3): 1215-1228.


Apdo. Postal 6-641 CDMX, México 06600Email: [email protected]
Impacts of International Wheat Improvement Research
1994-2014M
.A. Lantican | H.J. Braun | T.S. Payne | R.P. Singh | K. Sonder | M. Baum
| M. van Ginkel | O. Erenstein