impacts of genetically engineered crops on pesticide use in the
TRANSCRIPT

Impacts of Genetically Engineered Crops on Pesticide Use in the United States: The First Thirteen Years
November 2009
by Charles Benbrook
The Organic Center www.organic-center.org
Critical Issue Report: Th e First Th irteen Years

PREFACE
Th is report explores the impact of the adoption of genetically engineered (GE) corn, soybean, and cotton on pesticide use in the United States, drawing principally on data from the United States Department of Agriculture. Th e most striking fi nding is that GE crops have been responsible for an increase of 383 million pounds of herbicide use in the U.S. over the fi rst 13 years of commercial use of GE crops (1996-2008).
Th is dramatic increase in the volume of herbicides applied swamps the decrease in insecticide use attributable to GE corn and cotton, making the overall chemical footprint of today’s GE crops decidedly negative. Th e report identifi es, and discusses in detail, the primary cause of the increase -- the emergence of herbicide-resistant weeds.
Th e steep rise in the pounds of herbicides applied with respect to most GE crop acres is not news to farmers. Weed control is now widely acknowledged as a serious management problem within GE cropping systems. Farmers and weed scientists across the heartland and cotton belt are now struggling to devise aff ordable and eff ective strategies to deal with the resistant weeds emerging in the wake of herbicide-tolerant crops.
But skyrocketing herbicide use is news to the public at large, which still harbors the illusion, fed by misleading industry claims and advertising, that biotechnology crops are reducing pesticide use. Such a claim was valid for the fi rst few years of commercial use of GE corn, soybeans, and cotton. But, as this report shows, it is no longer.
An accurate assessment of the performance of GE crops on pesticide use is important for reasons other than correcting the excesses of industry advertising. It is also about the future direction of agriculture, research, and regulatory policy.
Herbicides and insecticides are potent environmental toxins. Where GE crops cannot deliver meaningful reductions in reliance on pesticides, policy makers need to look elsewhere. In addition to toxic pollution, agriculture faces the twin challenges of climate change and burgeoning world populations. Th e biotechnology industry’s current advertising campaigns promise to solve those problems, just as the industry once promised to reduce the chemical footprint of agriculture. Before we embrace GE crops as solution to these new challenges, we need a sober, data-driven appraisal of its track record on earlier pledges.
Th e government has the capability, and we would argue a responsibility, to conduct periodic surveys of suffi cient depth to track and accurately quantify the impacts of GE crops on major performance parameters, including pesticide use. While the USDA continued to collect farm-level data on pesticide applications during most of the 13 years covered in this report, the Department has been essentially silent on the impacts of GE crops on pesticide use for almost a decade. Th is is why the groups listed in the Acknowledgements commissioned this study by Dr. Benbrook, the third he has done on this topic since 2002.
We hope that this report will help trigger new government and academic assessments of the performance, costs, and risks associated with today’s GE crops. Without such assessments, American agriculture is likely to continue down the road preferred by the biotechnology industry, a path that promises to maximize their profi ts by capturing a larger share of farm income, and limit the ability of plant breeders and other agricultural scientists to address other pressing goals of wider importance to society as a whole.
Dr. Margaret Mellon Director, Food and Environment Program Union of Concerned Scientists
Mr. Mark Retzloff Board Chair, Th e Organic Center President, Aurora Organic Dairy
The Organic Center Critical Issue Report Page November 2009 The First Thirteen Years i

The Organic Center Critical Issue Report Page November 2009 The First Thirteen Years ii
ACKNOWLEDGMENTS
Th is is the third report we have done on the impact of genetically engineered (GE) crops on overall pesticide use in the United States. Th e fi rst was released as Ag BioTech InfoNet Technical Paper Number 6 in 2003 and covered the fi rst eight years of commercial use of GE seeds. Th e second report was completed in October, 2004 and analyzed the fi rst nine years of commercial use.1
Several people have contributed to this report, as well as to the development and refi nement of the model used in all three reports. Th anks to all of them for sharing their expertise and knowledge.
Karen Benbrook compiled and manages the Access database encompassing USDA pesticide use data going back to 1964. Th is valuable research tool makes it possible to carry out analytical projects drawing on annual USDA pesticide use surveys. Karen also developed the graphics and desk-top published the report.
Karie Knoke, K-Comp Solutions, has contributed to the development and refi nement of the Microsoft Excel-based analytical model.
Over the years Dr. Michael Hansen of the Consumers Union, and Dr. Robert Kremer, with the Agricultural Research Service in Columbia, Missouri have provided key information for developing and applying the projection model. Also, thanks to William Freese, Center for Food Safety, for assistance in compiling information on resistant weeds, emerging GE crops, and current developments in the biotechnology industry and regulatory agencies. Bill’s attention to detail and depth of knowledge were invaluable as the project unfolded.
Th e analytical work required to complete this report was funded by a coalition of non-governmental organizations including the Union of Concerned Scientists, the Center for Food Safety, the Cornerstone Campaign, GE Policy Project, Greenpeace, and Rural Advancement Foundation International - USA. Th e Organic Center supported the writing and publication of the report.
I am grateful for the encouragement, counsel, and technical support of Dr. Margaret (Mardi) Mellon and Dr. Jane Rissler of the Union of Concerned Scientists for my work over the last decade on the impact of GE crops on pesticide use.
I am solely responsible for the analytical approach and model, decisions required to deal with data gaps, the interpretation and communication of fi ndings, and any errors or lapses in judgment.
Charles Benbrook, Ph.D. Chief Scientist Th e Organic Center
1 Access the October, 2004 report, Ag BioTech InfoNet Technical Paper Number 7, at http://www.organic-center.org/science.latest.php?action=view&report_id=158

The Organic Center Critical Issue Report Page November 2009 The First Thirteen Years iii
TABLE OF CONTENTS
Preface ..................................................................................................................................................... i
Acknowledgements .................................................................................................................................ii
1. Executive Summary .............................................................................................................................1 A. Focus of Th is Report ................................................................................................................................................2 B. Key Findings ...............................................................................................................................................................2 Impacts on Pesticide Use Resistant Weeds Lower Dose Herbicides Used with Conventional Crops C. Th e Road Ahead for GE Corn, Soybeans and Cotton ..........................................................................................5 Tipping Point for RR Crops Resistance Management Still Key in Sustaining Bt Crop Effi cacy Future Trends
2. Introduction, Data Sources and Methodology ......................................................................................9 A. Tracking Pesticide Use and Risk .............................................................................................................................9 B. Milestones and Major Impacts of GE Crops ..............................................................................................................11 Herbicide Tolerance Insect Resistance C. Data Sources and Complications ..........................................................................................................................15 Impacts of USDA Decision to Stop Collecting Pesticide Use Data D. Methodology .................................................................................................................................................................................18 Estimating Herbicide Application Rates on Conventional and HT Soybeans, Corn, and Cotton Insecticide Application Rates on Conventional and Bt Corn and Cotton Acres E. Assumptions and Caveats ............................................................................................................................................................20
3. Acreage Planted to GE Crop Varieties: 1996 - 2008 .............................................................................................24 A. Acres Planted ...............................................................................................................................................................................24 New Challenges in Tracking GE Traits and Acres 4. Impacts of Herbicide-Tolerant Crops on Herbicide Use ......................................................................................28 A. Herbicide-Tolerant Soybeans .....................................................................................................................................................30 Special ERS Tabulation in 1998 B. Herbicide-Tolerant Corn .............................................................................................................................................................32 C. Herbicide-Tolerant Cotton .........................................................................................................................................................34 D. Impacts of Resistant Weeds on Herbicide Use and Risks ......................................................................................................34 Dramatic Increases Reported in Glyphosate Resistance Th e “Perfect Weed” Glyphosate-Resistant Horseweed Glyphosate-Resistant Giant Ragweed HT Crops Accelerate the Pesticide Treadmill

The Organic Center Critical Issue Report Page November 2009 The First Thirteen Years iv
TABLE OF CONTENTS cont.
5. Impacts of Bt Crops on Insecticide Use ..........................................................................................................41 A. Stacked Traits and Multiple Insecticide Formulations Muddy the Water ...........................................................................42 B. Insecticide Use Displaced by Two Types of Bt Corn ................................................................................................................43 Bt Corn for ECB Control Bt Corn for CRW Control C. Bt Cotton Continues to Perform Well .......................................................................................................................................44
6. Aggregate Impacts of GE Crops on Pesticide Use: Th e First Th irteen Years ........................................................46 A. Major Findings and Conclusions ................................................................................................................................................46 Key Conclusions B. Estimates in Other Studies ..........................................................................................................................................................47 U.S. Department of Agriculture National Center for Food and Agriculture (NCFAP) Policy Studies Herbicide-Tolerant Corn Herbicide-Tolerant Soybeans PG Economics Ltd 7. Th e Road Ahead for Today’s GE Crops ..............................................................................................................53 A. Th e Tipping Point for RR Crops ................................................................................................................................................53 B. Industry’s Response to Resistant Weeds ...................................................................................................................................55 Subsidies for Use of Non-glyphosate Herbicides Enhanced Glyphosate Resistance Crops Resistant to Multiple Herbicides C. Resistance Management Still Key in Sustaining Bt Crop Effi cacy ........................................................................................60 D. Why the Dramatic Increase in the Number of Toxins Needed to Grow Corn? ...................................................................61 E. Stacking Traits Poses New and Poorly Understood Risks ....................................................................................................61
List of Tables ...........................................................................................................................................iii
List of Figures .........................................................................................................................................iv
Abbreviations ..........................................................................................................................................iv

LIST OF TABLES
Table 2.1. Corn, Soybean, and Cotton Acreage Planted, Average Pesticide Use per Acre, and Total Pounds Applied: 1996–2008 ..............11Table 2.2. Percent of National Acres Planted to Herbicide-Tolerant (HT) and Bt Crop Varieties (Combines acres planted to single and multiple-trait varieties) ........................................................................................................................................................................................12Table 3.1. Acreage Planted to Herbicide-Tolerant (HT) and Bt Varieties of Corn, Soybean, and Cotton ......................................................25 Table 4.1. Changes in the Pounds of Glyphosate Applied per Acre per Crop Year on Corn, Cotton and Soybeans: 1996 – 2007 .................29Table 4.2. Diff erence in Herbicide Application Rates per Acre on Herbicide-Tolerant (HT) versus Conventional Soybeans in 1998, based on a Special Tabulations of ARMS Data, Carried out by the ERS ...................................................................................................................32 Table 4.3. Estimates of Acres Infested with Glyphosate Resistant Weeds in 2008, by Type of Weed ............................................................35 Table 6.1. Impacts of HT Soybeans on Herbicide Use as Projected by Kynetec Data and Th is Analysis Based on NASS Data ................51
SUPPLEMENTAL TABLES Access the Supplemental Tables on Th e Organic Center’s website at: http://www.organic-center.org/reportfi les/ Supplmental%20Tables.pdf
Supplemental Table 1. Percent of National Acres Planted to All Herbicide-Tolerant (HT) and Bt Crop Varieties , 1996 - 2008 [Combines percent acres planted to single and multiple trait varieties] Supplemental Table 2. Genetically Engineered (GE) Corn Varieties by State and United States, 2000-2009 Supplemental Table 3. Genetically Engineered (GE) Soybean Varieties by State and United States, 2000-2009 Supplemental Table 4. National Upland Cotton Acres Planted to Genetically Engineered (GE) Varieties Based on Data Provided by the Agricultural Marketing Service Supplemental Table 5. Herbicide-Tolerant (HT) Varieties of Corn, Soybean, and Cotton: Acres Planted, 1996 - 2008 Supplemental Table 6. Bt Transgenic Varieties of Corn and Cotton: Acres Planted, 1996 - 2008 .Supplemental Table 7. Average Pesticide Pounds Applied per Acre of Conventional, Herbicide-Tolerant (HT), and Bt Varieties and Estimated Diff erences in Pesticides Applied per Acre, 1996 - 2008 Supplemental Table 8. Diff erences in the Pounds of Pesticides Applied as a Result of GE Corn, Soybean and Cotton Acres Planted, 1996 - 2008 Supplemental Table 9. Insecticide Use to Control the European Corn Borer (ECB) and Southwestern Corn Borer (SWCB) on Conventional Varieties of Corn, 1996 - 2008 Supplemental Table 10. Insecticide Use to Control Rootworm (CRW) on Conventional Corn Varieties, 1996- 2008 Supplemental Table 11. Insecticides Used to Control the European Corn Borer (ECB), Southwestern Corn Borer (SWCB), and Corn Rootworm (CRW) on Conventional and Bt Varieties of Corn, 1996 - 2008 .Supplemental Table 12. Insecticides Applied to Control the Budworm/Bollworm Complex of Insects on Conventional Varieties of Cotton, 1996 - 2008 Supplemental Table 13. Herbicide Pounds Applied per Acre to Conventional and Herbicide-Tolerant (HT) Corn, 1996 - 2008 Supplemental Table 14. Herbicide Use in Conventional and Roundup Ready (RR) Herbicide-Tolerant (HT) Upland Cotton Varieties, 1996 - 2008 Supplemental Table 15. Herbicide Use on Conventional and Herbicide-Tolerant (HT) Soybeans, 1996 - 2008 Supplemental Table 16. Changes in the Application of Glyphosate on Corn, Cotton, and Soybeans: 1996-2007 Supplemental Table 17. Corn, Soybean, and Cotton Acreage Planted, Average Pesticide Use per Acre, and Total Pounds Applied, 1996 - 2008 Supplemental Table 18. Number of Pesticide and Pest Control Chemicals or Toxins Used to Manage Pests: 1971 through 2010 Supplemental Table 19. Number of States with Newly Reported, Documented Cases of Glyphosate Resistant Weeds, 1996 - 2008
The Organic Center Critical Issue Report Page November 2009 The First Thirteen Years v

LIST OF FIGURES Figure 1.1. Average Glyphosate Rate per Crop Year on Corn, Soybeans, and Cotton ........................................................................................5Figure 2.1. Corn, Soybean, and Upland Cotton: Number of Herbicides Used to Manage Weeds, 1971 – 2008 .........................................10Figure 2.2. Corn and Upland Cotton: Number of Insecticides Used to Manage Pests, 1971 – 2008 ............................................................10Figure 2.3. Shares of Herbicides and Insecticides Applied on Corn, Soybean, and Cotton: 1996 - 2008 .......................................................11Figure 2.4. U.S. Crop Acreage Infested With Herbicide-Resistant Weeds by Class of Herbicide and Year Reported, 1970 - 2008 .............13Figure 2.5. Percent of National Acres Planted to Herbicide-Tolerant (HT) Crop Varieties, 1996 – 2008 ....................................................13Figure 2.6. Percent of National Acres Planted to Bt Corn and Cotton Varieties, 1996 – 2008 .....................................................................14Figure 2.7. Insecticide Use Rates to Control ECB and CRW, 1996 – 2008 ....................................................................................................20Figure 3.1. Trends in the Percentage of National Crop Acreage Planted to Herbicide-Tolerant (HT) and Bt Crops, 1996 – 2008 ..............24Figure 3.2. Total Acreage Planted to GE Crop Varieties, 1996 – 2008 ...........................................................................................................26Figure 4.1. Herbicide Use Rates on All RR and Conventional Soybean Acres, 1996 – 2008 .........................................................................30Figure 4.2. Trends in Herbicide Pounds Applied per Acre to Conventional and HT Corn, 2005 – 2008 .....................................................33Figure 4.3. Trends in Herbicide Pounds Applied per Acre to Conventional and HT Cotton, 1996 – 2008 .................................................34 Figure 5.1. Pounds of Insecticides Displaced by an Acre of Bt Corn for ECB/SWCB Control ......................................................................43 Figure 6.1. Acres Planted to Genetically Engineered Corn and Upland Cotton ..............................................................................................46Figure 6.2. Acres Planted to Genetically Engineered Soybeans ........................................................................................................................46Figure 6.3. Diff erences in the Pounds of Herbicide Applied to GE Crop Acres, Compared to Conventional Acres .......................................47Figure 6.4. Diff erences in the Total Pounds of Herbicide and Insecticide Applied to GE Crop Acres Over the First Th irteen Years of Use ................47
ABBREVIATIONSAI – Active Ingredient ALS – Acetolactate synthase, a major herbicide family of chemistryARMS - Agricultural Resources Management SurveyAMS - Agricultural Marketing ServiceBXN - Bromoxynil TolerantBt – Bacillus Th uriengensis CWR – Corn RootwormECB – European Corn BorerEPA - Environmental Protection AgencyERS – Economic Research ServiceGE – Genetically EngineeredGM - Genetically Modifi edGR – Glyphosate-ResistantHT – Herbicide-TolerantIPM - Integrated Pest ManagementLL – Liberty LinkNAS - National Academy of SciencesNASS - National Agricultural Statistics ServiceNCFAP - National Center for Food and Agriculture PolicyNOP - National Organic ProgramPPO - Protoporphyrinogen Oxidase, an enzymeRR – Roundup ReadySWCB – Southwestern Corn BorerUSDA – United States Department of AgricultureWCB – Western Corn Borer
The Organic Center Critical Issue Report Page November 2009 The First Thirteen Years vi

The Organic Center Critical Issue Report Page November 2009 The First Thirteen Years 1
1. Executive Summary
In a recent story tracking the emergence of weeds resistant to glyphosate (Roundup) herbicides, a North Carolina farmer said that “Roundup is the greatest thing in agriculture in my lifetime.”
A retired weed scientist admits in the same story “In hindsight, we screwed up. We can’t rely on the same thing over and over.”
But farmers did, turning glyphosate herbicide and genetically engineered (GE) corn, soybeans, and cotton into the most stunning and profi table market success story in the history of the pesticide and seed industry.
Th is report documents some of the key impacts of GE crops on their way to market dominance and explains why the total pounds of herbicides applied on GE crops has spiked so sharply in recent years, with more increases to come.
But fi rst, some key terms are defi ned.
A “pesticide” is a chemical that controls pests. Th e term encompasses herbicides applied to control weeds, insecticides used to manage insects, and fungicides sprayed to manage plant diseases.
A pesticide “active ingredient” (AI) is the chemical (or chemicals) in a pesticide that is responsible for killing or otherwise controlling target pests.
“Pesticide use” is usually measured as pounds of pesticide “active ingredient” applied per acre, or on a given crop over some period of time.
A “trait” in a genetically engineered crop is the unique characteristic or attribute added to the genetic makeup of the crop using recombinant DNA (gene-splicing) technology. Th e capacity of a plant to withstand applications of a particular herbicide is an example of a GE crop trait.
“Stacked” GE seeds are those expressing two or more distinct traits.
“Trait acres” are the number of GE crop acres that contain a particular trait. One acre planted to a single-trait GE crop represents one trait acre, an acre planted to a “stacked” crop with two traits is equivalent to two trait acres, and so on. (Th is is why GE “trait acres” planted exceeds total GE crop acres planted).
GE seeds were introduced commercially in 1996 and now dominate the production of corn, soybeans, and cotton in the United States. GE crops contain one or both of two major categories of traits:
• Herbicide-tolerant (HT) crops are genetically engineered to survive direct application of one or more herbicides during the growing season, chemicals that would otherwise kill or severely stunt the crop. Th e major HT crops are soybeans, corn, and cotton. Nearly all HT trait acres are planted to “Roundup Ready” (RR) seeds that tolerate applications of Monsanto’s glyphosate (Roundup) herbicide, the active ingredient in Roundup herbicide.• Bt crops are engineered to produce toxins derived from the natural bacterium Bacillus thuringiensis (Bt) in plant cells. Th ese toxins are lethal to certain agricultural insect pests.

A. Th is Report
Th is report focuses on the impacts of GE crops on pesticide use, as measured by the total pounds applied on HT and Bt corn in contrast to conventional corn, HT soybeans in contrast to conventional soybeans, and HT and Bt cotton compared to conventional cotton.
Offi cial U. S. Department of Agriculture (USDA) surveys are the source of most of the data used in this report on the acres planted to each GE trait in corn, soybeans, and cotton. Annual “trait acreage” reports from Monsanto provide more nuanced data on the acres planted to crops with specifi c traits and trait combinations.
Th e data in this report on the acres planted to crops with each major GE trait are of high quality and are not controversial.
Pesticide use data come from annual surveys done by the USDA’s National Agricultural Statistics Service (NASS). Th ese surveys encompass the percentage of crop acres treated with each pesticide active ingredient, average rates of application, the number of applications, and pounds of active ingredient applied.
NASS pesticide use data are also of high quality and have stood the test of time, but NASS surveys do not report
pesticide use separately on crop acres planted to GE seeds, in contrast to acres planted to conventional seeds. Hence, a method was developed for each GE crop and trait to estimate from NASS data how much more or less pesticide was used on a GE acre versus an acre planted with conventional seeds (for more methodological details, see Chapters 2, 4, and 5). Th ese diff erences in pesticide use per acre are calculated by crop, trait, and year. Th e result is then multiplied by the acres planted to each GE crop trait in a given year. Last, the model adds together the diff erences in the total pounds of pesticides applied across all crops, traits and years, producing this report’s bottom line. It’s a big number -- an additional 318 million pounds of pesticides were applied due to the planting of GE crops from 1996 through crop year 2008.
B. Key Findings
Farmers planted 941 million acres of GE HT corn, soybeans, and cotton from 1996 through 2008. HT soybeans accounted for two-thirds of these acres.
Bt corn and cotton were grown on 357 million acres, with corn accounting for 79% of these acres.
Th us, about 1.3 billion trait acres of HT and Bt crops have been grown between 1996 and 2008. HT crops account for 72% of total GE crop trait acreage. Th e actual number
The Organic Center Critical Issue Report Page November 2009 The First Thirteen Years 2
Corn and soybean strip-cropping systems reduce weed and insect pressure and lessen reliance on pesticides and GE crops

of acres planted to GE soybeans, corn, and cotton over this period is considerably less than 1.3 billion due to the prevalence of “stacked” versions of GE corn and cotton.
Impacts on Pesticide Use
GE crops have increased overall pesticide use by 318.4 million pounds over the fi rst 13 years of commercial use, compared to the amount of pesticide likely to have been applied in the absence of HT and Bt seeds.
Th e 318.4 million pound increase represents, on average, an additional 0.25 pound of pesticide active ingredient for every GE trait acre planted over the fi rst 13 years of commercial use.
Bt corn and cotton have delivered consistent reductions in insecticide use totaling 64.2 million pounds over the 13 years. Bt corn reduced insecticide use by 32.6 million pounds, or by about 0.1 pound per acre. Bt cotton reduced insecticide use by 31.6 million pounds, or about 0.4 pounds per acre planted.
HT crops have increased herbicide use by a total of 382.6 million pounds over 13 years. HT soybeans increased herbicide use by 351 pounds (about 0.55 pound per acre), accounting for 92% of the total increase in herbicide use across the three HT crops.
Recently herbicide use on GE acres has veered sharply upward. Crop years 2007 and 2008 accounted for 46% of the increase in herbicide use over 13 years across the three HT crops. Herbicide use on HT crops rose a remarkable 31.4% from 2007 to 2008.
GE crops reduced overall pesticide use in the fi rst three years of commercial introduction (1996-1998) by 1.2%, 2.3%, and 2.3% per year, but increased pesticide use by 20% in 2007 and by 27% in 2008.
Two major factors are driving the trend toward larger margins of diff erence in the pounds of herbicides used to control weeds on an acre planted to HT seeds, in comparison to conventional seeds:
• Th e emergence and rapid spread of weeds resistant to glyphosate, and
• Incremental reductions in the average application rate of herbicides applied on non-GE crop acres.
Resistant Weeds
Th e widespread adoption of glyphosate-resistant (GR), RR soybeans, corn, and cotton has vastly increased the use of glyphosate herbicide. Excessive reliance on glyphosate has spawned a growing epidemic of glyphosate- resistant weeds, just as overuse of antibiotics can trigger the proliferation of antibiotic-resistant bacteria.
The Organic Center Critical Issue Report Page November 2009 The First Thirteen Years 3
Th e stalk of a mature Palmer amaranth weed can reach six inches in diameter, and can damage mechanical cotton pickers.
GR weeds were practically unknown before the introduction of RR crops in 1996. Today, nine or more GR weeds collectively infest millions of acres of U.S. cropland. Th ousands of fi elds harbor two or more resistant weeds. Th e South is most heavily impacted, though resistant weeds are rapidly emerging in the Midwest, and as far north as Minnesota, Wisconsin, and Michigan. In general, farmers can respond to resistant weeds on acres planted to HT crops in fi ve ways:
• Applying additional herbicide active ingredients, • Increasing herbicide application rates, • Making multiple applications of herbicides previously sprayed only once, • Th rough greater reliance on tillage for weed control, and • By manual weeding.
In the period covered by this report, the fi rst three of the above fi ve responses have been by far the most common, and each increases the pounds of herbicides applied on HT crop acres.
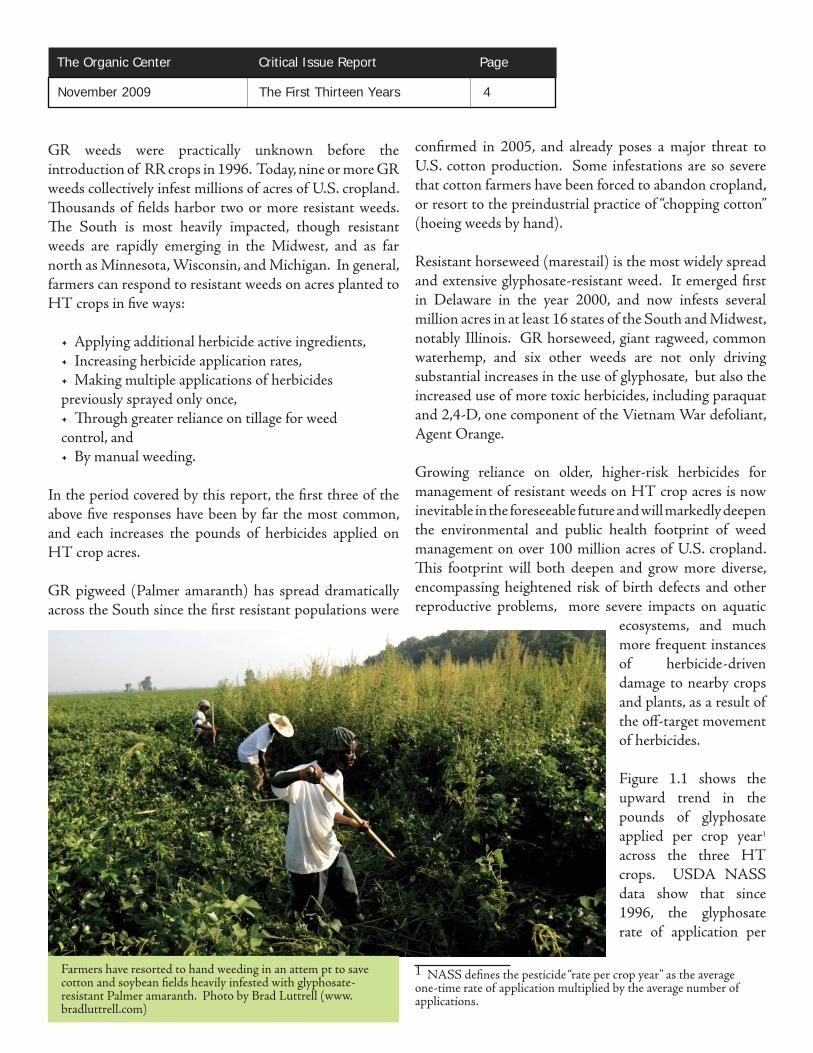
GR pigweed (Palmer amaranth) has spread dramatically across the South since the fi rst resistant populations were
confi rmed in 2005, and already poses a major threat to U.S. cotton production. Some infestations are so severe that cotton farmers have been forced to abandon cropland, or resort to the preindustrial practice of “chopping cotton” (hoeing weeds by hand).
Resistant horseweed (marestail) is the most widely spread and extensive glyphosate-resistant weed. It emerged fi rst in Delaware in the year 2000, and now infests several million acres in at least 16 states of the South and Midwest, notably Illinois. GR horseweed, giant ragweed, common waterhemp, and six other weeds are not only driving substantial increases in the use of glyphosate, but also the increased use of more toxic herbicides, including paraquat and 2,4-D, one component of the Vietnam War defoliant, Agent Orange.
Growing reliance on older, higher-risk herbicides for management of resistant weeds on HT crop acres is now inevitable in the foreseeable future and will markedly deepen the environmental and public health footprint of weed management on over 100 million acres of U.S. cropland. Th is footprint will both deepen and grow more diverse, encompassing heightened risk of birth defects and other reproductive problems, more severe impacts on aquatic
ecosystems, and much more frequent instances of herbicide-driven damage to nearby crops and plants, as a result of the off -target movement of herbicides.
Figure 1.1 shows the upward trend in the pounds of glyphosate applied per crop year1 across the three HT crops. USDA NASS data show that since 1996, the glyphosate rate of application per
1 NASS defi nes the pesticide “rate per crop year” as the average one-time rate of application multiplied by the average number of applications.
The Organic Center Critical Issue Report Page November 2009 The First Thirteen Years 4
Farmers have resorted to hand weeding in an attem pt to save cotton and soybean fi elds heavily infested with glyphosate-resistant Palmer amaranth. Photo by Brad Luttrell (www.bradluttrell.com)

crop year has tripled on cotton farms, doubled in the case of soybeans, and risen 39% on corn. Th e average annual increase in the pounds of glyphosate applied to cotton, soybeans, and corn has been 18.2%, 9.8%, and 4.3%, respectively, since HT crops were introduced.
Lower-Dose Herbicides Used with Conventional Crops
Th e second key factor responsible for the increasing margin of diff erence in herbicide use on HT versus conventional crops is progress made by the pesticide industry in discovering more potent active ingredients that are eff ective at progressively lower average rates of application. As a result of these discoveries, the average per acre amount of herbicides applied to conventional crops has steadily fallen since 1996. In contrast, glyphosate/Roundup is a relatively high-dose herbicide and glyphosate use rates have been rising rapidly on HT crop acres, as clearly evident in the NASS data presented above.
Th e average rate of herbicides applied to conventional soybean acres dropped from 1.19 pounds of active ingredient per acre in 1996 to 0.49 pounds in 2008. Th e steady reduction in the rate of application of conventional soybean herbicides accounts for roughly one-half of the diff erence in herbicide use on GE versus conventional soybean acres. Th e increase in the total pounds of herbicides applied to HT soybean acres, from 0.89 pounds in 1996 to 1.65 pounds in 2008, accounts for the other one-half of the diff erence.
A similar trend is evident with insecticides. Corn insecticides targeting the corn rootworm (CRW) were
applied at around 0.7 pound per acre in the mid-1990s and about 0.2 pound a decade later. Th e exception to this rule of dramatically falling pesticide use rates has been cotton insecticides targeting the budworm/bollworm complex. Th e rate of these products has fallen marginally from 0.56 to 0.47 pounds per acre. C. Th e Road Ahead for GE Corn, Soybeans, and Cotton
Th e vast majority of corn, soybean, and cotton fi elds in the U.S. in 2010 will be sown with GE seeds. Th is is not a bold prediction because the non-GE seed supply is so thin now that most farmers will be purchasing GE seeds for the next several years, whether they want to or not.
Th e GE corn, soybean, and cotton seeds planted over the next fi ve to 10 years will, if current trends hold, contain increasing numbers of stacked traits (usually three or more), cost considerably more per acre, and pose unique resistance management, crop health, food safety, and environmental risks. HT crops will continue to drive herbicide use up sharply, and those increases in the years ahead will continue to dwarf the reductions in insecticide use on Bt crop acres.
Tipping Point for RR Crops
Crop year 2009 will probably mark several tipping points for RR crops. Th e acres planted to HT soybeans fell 1% from the year before, and will likely fall by a few additional percentage points in 2010. Farmer demand for conventional soybeans is outstripping supply in several states, and universities and regional seed companies are working together to close the gap.
Reasons given by farmers for turning away from the RR system include the cost and challenges inherent in dealing with GR weeds, the sharply increasing price of RR seeds, premium prices off ered for non-GE soybeans, the poorer than expected and promised yield performance of RR 2 soybeans in 2009, and the ability of farmers to save and replant conventional seeds (a traditional practice made illegal with the purchase of HT/RR seeds).
In regions where farmers are combating resistant weeds, especially Palmer amaranth and horseweed in the South,
The Organic Center Critical Issue Report Page November 2009 The First Thirteen Years 5

university experts are projecting increases of up to $80 per acre in costs associated with HT crops in 2010. Th is increase represents a remarkable 28% of soybean income per acre over operating costs, based on USDA’s bullish forecast for 2010 soybean income (average yield 42 bushels; average price, about $9.90).
Th e economic picture dramatically darkens for farmers combating resistant weeds under average soybean yields (36 bushels) and market prices ($6.50 per bushel). Such average conditions would generate about $234 in gross income per acre. Th e estimated $80 increase in 2010 costs per acre of HT soybeans would then account for one-third of gross income per acre, and total cash operating costs would exceed $200 per acre, leaving just $34 to cover land, labor, management, debt, and all other fi xed costs. Such a scenario leaves little or no room for profi t at the farm level.
Resistance Management Still Key in Sustaining Bt Crop Effi cacy
Th e future of Bt transgenic crops is brighter, but if and only if resistance is prevented. Th e seed industry, the
Environmental Protection Agency (EPA), and university scientists have collaborated eff ectively in the last 13 years in an eff ort to closely monitor and prevent resistance to Bt crops.
But now, some experts argue that the emphasis on resistance management in Bt crops can be relaxed. Th ey point out that the trend in the seed industry toward stacking multiple Bt toxins in corn and cotton varieties should reduce the risk of resistance. Th e EPA has apparently been persuaded by this argument, since it has approved several recent Bt crops with substantially relaxed resistance management provisions.
History suggests that lessened diligence in preventing Bt resistance is premature. It took 10-15 years for corn and cotton insects to develop resistance to each new type of insecticide applied to control them since the 1950s.
Bt cotton has now been grown for 14 years, but the acreage planted to it did not reach one-third of national cotton acres until 2000. Plus, the fi rst populations of Bt resistant bollworms were discovered in Mississippi and Arkansas
The Organic Center Critical Issue Report Page November 2009 The First Thirteen Years 6
Heavy infestations of resistant weeds in cotton fi elds reduce crop yields and increase costs of production. Resistant populations of weeds can grow as tall, or taller than a hoe handle and produce several hundred thousand seeds per plant.

The Organic Center Critical Issue Report Page November 2009 The First Thirteen Years 7
cotton fi elds in 2003, about when experts predicted fi eld resistance would emerge.
Bt corn for CRW control has been planted on signifi cant acreage for only three years (2007-2009). Bt corn hybrids for Eastern corn borer (ECB) control are still planted on just a little over one-half national corn acres. For both types of Bt corn, and especially in the case of Bt corn for CRW control, it is far too early to declare with confi dence that resistance is no longer a signifi cant threat.
Future Trends
Agricultural biotechnology fi rms have thus far devoted the lion’s share of their R&D resources to the development of only two biotech traits: herbicide tolerance and insect resistance. Pest control systems largely based on these traits are in jeopardy, biologically and economically, for the simple reason that they foster near-exclusive reliance on single pest control agents – season-long, year after year, and over vast areas of cropland. Th ese are “perfect storm” conditions for the evolution and spread of resistance.
Th ere is no serious dispute that RR crops have been popular, for the most part eff ective, and about budget-neutral for farmers. But they have fostered unprecedented reliance on glyphosate for weed control, and overreliance has spawned a growing epidemic of glyphosate-tolerant and resistant weeds.
Two major players in the industry – Monsanto and Syngenta – are now off ering to pay farmers rebates on the order of $12 per acre to spray herbicides that work through a mode of action diff erent from glyphosate. Monsanto’s program will
even pay farmers to purchase herbicides sold by competitors, a sign of how seriously Monsanto now views the threat posed by resistance to its bread and butter product lines.
While corn, soybean, and cotton farmers view the spread of resistant weeds as a slow moving train wreck eroding their bottom line, the seed and pesticide industry sees new market opportunities and profi t potential arising in the wake of resistant weeds. A large portion of industry R&D investments are going into the development of crops that will either withstand higher rates of glyphosate applications, or tolerate applications of additional herbicides, or both. In short, the industry’s response is more of the same.
One major biotech company has applied for and received a patent covering HT crops that can be directly sprayed with herbicide products falling within seven or more diff erent herbicide families of chemistry.2 Th ese next-generation HT crops will likely be sprayed with two or three times the number of herbicides typically applied today on fi elds planted with HT seeds, and the total pounds of herbicides applied on HT crops, and the cost of herbicides, will keep rising as a result.
Addressing the rapidly emerging problem of resistant weeds in this way makes as much sense as pouring gasoline on a fi re in the hope of snuffi ng out the fl ames. Despite these ill-conceived eff orts, unmanageable weeds with their roots in the Southeast will almost certainly continue to spread north and west, fi rst into the fringes but eventually throughout the Corn belt.
2 Herbicides within a “family of chemistry” work through the same mode of action.
Farmers will have to diversify weed management tactics and systems to deal with HR weeds. Deep tillage (left photo) buries weed seeds; cover crops (center) can repress weed germination and growth; and mechanized cultivation between plant rows (right) is a proven alternative to herbicides.
The Organic Center Critical Issue Report Page November 2009 The First Thirteen Years 8
Major weed management problems in the cotton industry in the Southeastern U.S. will not have a dramatic impact on U.S. agriculture or national well being, but what if the same fate lies ahead for corn and soybean producers? It well might in the absence of major changes in weed management systems and regulatory policies.
Instead of just spraying more, farmers must diversify the tactics embedded in their weed management systems, alter crop rotations, scrupulously follow recommended herbicide resistance management plans, and utilize tillage more aggressively to bury herbicide-tolerant weed seeds deep enough to keep them from germinating.
Sustaining the effi cacy of Bt crops is both important and possible. Th e emergence in 2003 of the fi rst, isolated fi eld populations of a major cotton insect resistant to Bt is troubling, but also reinforces the importance of today’s resistance management plans, which have kept the resistant populations found in Mississippi and Arkansas from spreading. Th e industry has recently proposed, and EPA
has approved, backing away from Bt resistance management practices, steps that recklessly place the future effi cacy of Bt crops and Bt insecticide sprays at risk.
Overall pesticide use is bound to continue rising on GE corn, soybeans, and cotton. Even if the new, multiple-toxin versions of Bt corn and cotton prove more eff ective in reducing insect pressure and feeding damage, the reduction in pounds of insecticides achieved as a result will be dwarfed by the continuing surge in herbicide use on HT crops.
Th e immediate and pressing goals for farmers, scientists and the seed industry include developing weed management systems capable of getting ahead of resistant weeds, assuring no lapse in the commitment to preserving the effi cacy of Bt toxins, and expanding the supply and quality of conventional corn, soybean, and cotton seeds. Th e last goal will likely emerge as the most vital, since the productivity of our agricultural system and the quality of much of our food supply begins with and depends on seeds.
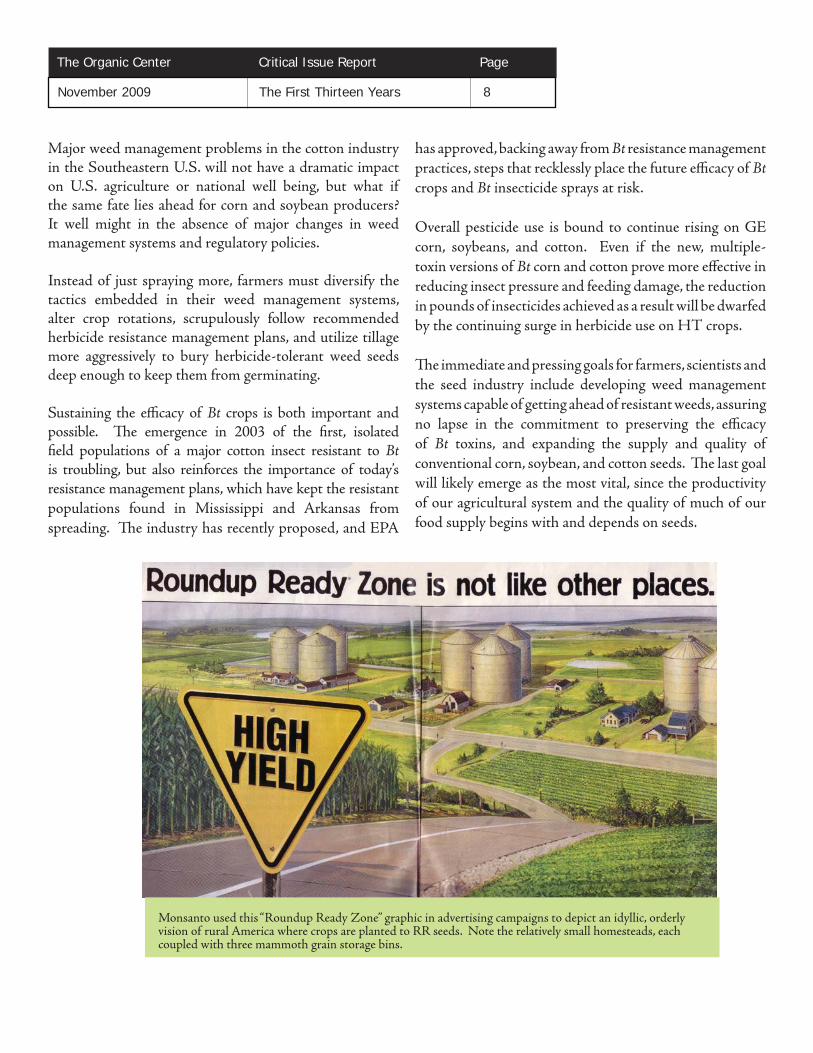
Monsanto used this “Roundup Ready Zone” graphic in advertising campaigns to depict an idyllic, orderly vision of rural America where crops are planted to RR seeds. Note the relatively small homesteads, each coupled with three mammoth grain storage bins.