impacts of entry by counterfeiters · 2017-10-02 · impacts of entry by counterfeiters∗ yi qian...
TRANSCRIPT

IMPACTS OF ENTRY BY COUNTERFEITERS∗
YI QIAN
This paper uses a natural experiment to test the impact of counterfeitingunder weak intellectual property rights. I collect new panel data from Chineseshoe companies from 1993–2004. By exploiting the discontinuity of governmentenforcement efforts for the footwear sector in 1995 and the differences in authenticcompanies’ relationships with the government, I identify and measure the effectsof counterfeit entry on authentic prices, qualities, and other market outcomes.The results show that brands with less government protection differentiate theirproducts through innovation, self-enforcement, vertical integration of downstreamretailers, and subtle high-price signals. These strategies push up authentic pricesand are effective in reducing counterfeit sales.
I. INTRODUCTION
Since the early 1990s, protection of intellectual propertyrights (IPR) has been at the top of the international trade agenda,resulting in a set of globally harmonized IPR specified in theWorld Trade Organization Agreement on Trade-Related Aspectsof Intellectual Property Rights (TRIPS). IPR advocates believein the stimulating effects IPR have on innovation, which fuelsfaster economic growth. Scholars have shown such stimulatingeffects to be very limited in practice, however, with inconclusiveresults from country case studies (Scherer and Weisburst 1995;Kortum and Lerner 1998; Sakakibara and Branstetter 1999) andcross-country panel results that establish stimulating effects onlyin countries with higher development and education levels (Qian2007, 2008). Other related research discusses the effects of IPRimplementations on the direction of innovative activity (Moser
∗I am grateful to my advisers Josh Lerner, Philippe Aghion, RichardCaves, and Richard Cooper for their constant advice and encouragement; toEric Anderson, Gary Chamberlain, Tat Chan, Pradeep Chintagunta, DavinChor, Mercedes Delgado-Garcia, J.P. Dube, Sarah Ellison, Ray Fisman, RichardFreeman, Shane Greenstein, Karsten Hansen, Caroline Hoxby, Yasheng Huang,William Kerr, Michael Kremer, Don Lessard, Ben Olken, Ariel Pakes, Peter Rossi,Kathryn Spier, Scott Stern, Jim Stock, Joel Waldfogel, Lucy White, Hui Xie, andPai-Ling Yin, and to participants of the seminars at Harvard, MIT Sloan, Kellogg,Brown, RAND, SUNY, Georgia Tech, Chicago GSB, NBER Productivity, IPR, andChina Conferences for helpful feedback; to Lawrence Katz (the editor) and fouranonymous referees for invaluable comments; to Ting Zhu, Mingxing Liu, andQi Zhang for providing data; to Vincent Chen for helpful discussions in the earlystages of the project; and to my beloved parents for their encouragement. Financialsupport from the Harvard CID Grants and IO Research Grants and cooperationfrom the Chinese Quality and Technology Supervision Bureau (QTSB) and thecompanies interviewed and surveyed are gratefully acknowledged. The results inthis paper do not necessarily represent the views of QTSB.
C© 2008 by the President and Fellows of Harvard College and the Massachusetts Institute ofTechnology.The Quarterly Journal of Economics, November 2008
1577

1578 QUARTERLY JOURNAL OF ECONOMICS
2003) and foreign direct investments (Branstetter, Fisman, andFoley 2006) and pinpoints the shortcomings of current patentsystems (Gans, Hsu, and Stern 2003; Jaffe and Lerner 2004).Although the shift in policy focus from lowering trade barriersto an international rule of law for IPR is highly controversial(Lanjouw and Cockburn 2001; McCalman 2001), curbing coun-terfeiting through tightening IPR protection has been a commonpractice worldwide to foster brand values. Despite this practicebeing so common, little research attention has been paid to theflip side of IPR, that is, determining the economic principlesunderlying counterfeit infringements and the way in which IPRowners sustain themselves in the absence of governmental IPRmonitoring.
In this paper, I identify a natural experiment that allows meto investigate how markets function with less government IPRenforcement. This natural experiment was created by the Chinesegovernment’s emergent reallocation of IPR enforcement resourcesaway from monitoring footwear and fashion products to the othersectors in response to several food-poisoning and gas-explosionaccidents in the early 1990s. Counterfeiters massively enteredthe Chinese footwear industry in the mid-1990s after the policyshift, infringing on brands of both multinational corporations andChinese enterprises. Within the footwear industry, the Chineseleather- and sports-shoe sectors include most of the companiesthat have their own brands and account for approximately US$6billion in annual sales. Some Chinese brands, such as Antaand Li-ning, occupy a Chinese-market share close to Nike’s.My data set includes both domestic brands and multinationalbrands operating in China and is supplemented by the ChineseIndustrial Census database, an eBay-in-China data set, productcatalog information, and interviews. The natural experimentand the unique panel data set facilitate a systematic analysis ofa wide range of economic issues pertaining to counterfeiting. Iprobe into the origins and impacts of counterfeits, which claimbrand names that they do not own, and I propose potentialremedies.
Many insights emerge from this study. Brands with lessgovernment protection seek to differentiate their products andself-enforce their IPR through several strategic moves: investingin product attributes that are difficult to imitate, such as shoe-surface materials, technology, and elegant appearance; investingin nonprice signals including but not limited to licensed outlets

IMPACTS OF ENTRY BY COUNTERFEITERS 1579
(vertical integration); establishing brand-protection offices tomonitor the market and to assist the government with en-forcement; and even employing subtle price signals.1 All thesestrategies lead to higher authentic prices. I find that the pricesset by the authentic manufacturers that were infringed uponrose by 45%, on average, two years after their counterfeitersentered the market. The prices of the generic brands withoutcounterfeits followed a smooth and slightly upward time trend,while the counterfeit prices remained level. I additionally showthat investing in enforcement activities and switching fromwholesale to largely retail distribution are effective in deterringcounterfeit entry or at least in reducing counterfeit sales.
Although no accurate financial value of global counterfeit-ing is available, estimates exist to reflect its massive nature. TheWorld Customs Organization (WCO) estimates that over 500 bil-lion euros of traded world merchandise in 2004 may have beencounterfeit (WCO 2004). Therefore, the effects of counterfeits onmarket prices and authentic-producer marketing strategies arepertinent issues to address. However, prior literature on coun-terfeits is scarce. Darby and Karni (1973) theorize the reasonsfor and determinants of using fraud information as a means ofattracting customers. They suggest utilizing branding and clientrelationships as tools for monitoring quality but do not discusswhat happens when brands are counterfeited. For example, coun-terfeiters’ attempts to infringe upon brands may generate asym-metric information complexities. Previous literature on pricingunder asymmetric information on entrants’ quality are confinedto analysis with exogenous quality levels (Nelson 1974; Milgromand Roberts 1986; Metrick and Zeckhauser 1999). Additionally,there is a dearth of empirical studies on counterfeits or under-ground economics in general. The illicit nature of counterfeitingimplies under-the-table activity and difficult-to-measure effects,and past economic studies on illegal behavior have mainly reliedon self-reported data (for example, Levitt and Venkatesh [2000]on a drug-selling gang).
This study provides a framework to synthesize various theo-ries on quality uncertainties and endogenous sunk costs (ESC),
1. Companies’ self-enforcement is prevalent even in advanced and highlyinstitutionalized contexts. For instance, the luxury house LVMH assigned ap-proximately 60 full-time employees and spent more than US$16 million on inves-tigations and legal fees in 2004 alone. Many brands (e.g., Fendi and Abbott) useholograms to distinguish their products from forgeries.

1580 QUARTERLY JOURNAL OF ECONOMICS
a term coined by Sutton (1991),2 and serves as a fairly cleanempirical test of the theory. I collect detailed annual financialinformation from 31 domestic and multinational shoe companiesof different sizes and brands in China to analyze the impactsof counterfeits over a recent twelve-year period.3 In addition, Igather external data to verify self-reported data and to augmentanalysis drawn from the Chinese Industrial Census database, aneBay-in-China data set, and product catalog information. I thenprovide suitable instruments for various levels of counterfeit en-try and sales. The panel structure of my data enables me to bettercorrect potential omitted-variable bias and helps to improve theprecision of the entry-effect estimator. The study of multiple com-panies of different sizes and brands further makes the results gen-eralizable. My findings that authentic companies strive to upgradequality, invest in self-enforcement, and build company stores af-ter counterfeiters enter demonstrates the value of disentanglingquality uncertainties. These strategies can also broadly be con-sidered as ESC. Using a stylized vertical differentiation modelwith asymmetric information, I thus demonstrate that the find-ings are consistent with theory predictions and have generalizableimplications.
The rest of the paper is organized as follows. Section II de-scribes the empirical research design and identification strategies.Section III introduces data, followed by empirical results in Sec-tion IV. Section V provides theoretical foundations for the findings,and Section VI concludes and discusses policy implications. Theremaining details are available in Qian (2006) and in the QJEonline supplementary materials for this article.
II. STUDY DESIGN
In testing the impacts of entries by counterfeiters, the idealexperiment would randomly assign counterfeit entry for a setof brands in a large pool while other brands would be kept im-mune from counterfeiting. If I define the authentic company’s
2. Athey and Schmutzler (2001) and Ellickson (2004) also theorize and iden-tify examples that show quality investments as strategic complements and waysof sustaining market dominance.
3. I collected and analyzed city-level data as well, and I found that authenticprices do not vary a great deal across regions. They differ by about US$1, whichapproximately accounts for transportation costs. There is a lack of variation incounterfeit entry across regions. However, I still conduct city-level IV estimationsas robustness checks.
IMPACTS OF ENTRY BY COUNTERFEITERS 1581
strategy profile as σ = (Quality, Enforcement Expenditures, Ad-vertisement, Licensed Company Stores, Price), then the questionof entry effects on each element in σ could simply be addressedwith OLS regressions of the element on the binary indicator vari-able of entry. Formally,
log(σ at) = β0 + β1 × Counterfeitat + βT2 × Year Dummiest
+βT3 × Firm Dummiesa + εat,(1)
where σ at denotes the response variable of authentic company a inyear t, and the indicator variable Counterfeitat equals 1 if there arepositive amounts of counterfeits for brand a in the year t. The fixedeffects for year (12 years) and firm (31 branded companies) con-trol for year-specific confounding factors and time-invariant firmattributes. The exogeneity of counterfeit entry, however, may nothold in reality, because entry is more likely to occur if the originalproducer has a larger markup, easier-to-copy quality, or a loosertrademark management team. These unobserved time-variantfirm characteristics are not captured by the fixed effects, resultingin correlation between Counterfeitat and εat in equation (1). Sim-ple OLS without accounting for this entry endogeneity will leadto biased β1 estimates.4
Given these concerns, I seek appropriate instruments forthe counterfeit entry variable to identify its effects. The IV(instrumental variable) strategy relies on a natural experimentin Chinese IPR enforcement change and its differential impactson different brands. The remainder of this section explains thenecessary details.
The advantage of studying the Chinese shoe industry pri-marily comes from the natural experiment, which stems froman enforcement change around the year 1995, due to externalshocks exogenous to the shoe sector. In China, copyright andtrademark laws were restored after 1976. In 1985, the Chinesegovernment established the Quality and Technology Supervision
4. The omitted variable bias potentially enters OLS in two directions: an up-ward bias due to brand effects, which correlate positively with the price outcomeand counterfeit entry; and a downward bias due to internal management effects,which are positively correlated with the price outcome but negatively correlatedwith the brand’s counterfeit entry. In particular, a brand with good internal man-agement may effectively ward off counterfeits as well as maintain high-standardproducts with relatively high prices. In fact, when log prices are simply regressedon the fake entry dummy and a year trend, the entry coefficient is very large (0.78).Although the company fixed effects help control for the omitted brand effects, theydo not control for the time-variant management effects. The resulting OLS entrycoefficient is, therefore, biased downward, as compared to the IV estimates.
1582 QUARTERLY JOURNAL OF ECONOMICS
Bureau (QTSB),5 with a branch in each city and joint forces na-tionwide, to supervise product quality and outlaw counterfeit lo-calities. Due to a series of accidents arising from low-quality orcounterfeit agricultural products and gas tanks, the Chinese gov-ernment issued notifications around 1995 to enhance quality su-pervision and combat counterfeits in seven main sectors prone tohazardous materials.6 The majority of the Bureau workforce andfunding went into these sectors, leaving loopholes for counterfeitsto enter the footwear industry. For instance, in the early 1990s,approximately 10%–12% of the Bureau’s resources were devotedto the footwear sector; this number, however, fell to 2% after 1995(QTSB yearbooks). As seen in the data, authentic companies ex-perienced significant counterfeit entry after this loosening of gov-ernmental monitoring and enforcement, with the highest level ofentry occurring in 1996.
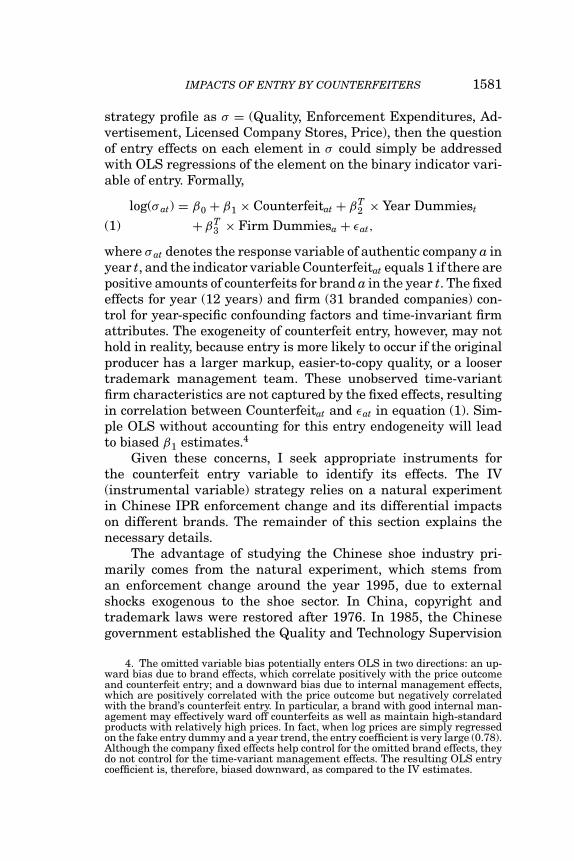
As expressed in interviews, authentic shoe producers weresurprised at the massive entry of counterfeits but soon reacted.The branded companies that had been infringed upon set up theirown brand-protection offices to compensate for the lack of gov-ernment monitoring. As Figure I shows, the drop in governmenttrademark-enforcement expenditures in the shoe sector corre-sponds to both massive counterfeiting entries and investmentsin self-enforcement by authentic producers in the sample after1995. The solid line in Figure I plots the total private deflated en-forcement expenditures of these branded companies over time.7
The company fixed-effects regression of the log of company en-forcement investments on a legislation dummy is positive andsignificant at the 5% level (coefficient = 3.2).
In light of the enforcement changes, which are shown tohave instigated massive counterfeit entries, the ideal experiment
5. It was recently renamed the “Administration of Quality Supervision, In-spection and Quarantine.” The Bureau enlarged its personnel and funding in 1991in a joint effort with legislation to protect IPR and monitor product quality.
6. These sectors included pharmaceuticals; agricultural products (includingfertilizers, pesticides, and other materials or instruments); fiber and cotton (partic-ularly bacteria-infected or bleached counterfeits); food; tobacco; alcohol; and gas.Notification No. 52 of late 1994 highlighted fiber and cotton quality supervision,and Notification No. 10 of early 1996 highlighted gas and other major hazardousproducts.
7. The self-enforcement costs include all costs associated with brand protec-tion activities in each brand-protection office. They consist of expenses for sendingemployees to monitor the market, working with the government to track downcounterfeit localities, and organizing or engaging in anti-counterfeit conferences,etc. Litigation costs are included but, in accordance with the law, are mostly paidby the party that lost in court (in this case, the counterfeiters).

IMPACTS OF ENTRY BY COUNTERFEITERS 1583
15866.97647
4389 4551.954356
0 4320
3584.67
0
2,000
4,000
6,000
8,000
10,000
12,000
14,000
16,000
18,000
1992 1994 1996 1998 2000 2002 2004 2006Year
10,0
00 c
onst
ant yu
an (or pai
rs)
QTSB expenditure Total private enforcement expenditure in the sample Total counterfeits in the sample
FIGURE IPublic and Private Enforcement Expenditures
Note. This figure plots the trademark enforcement expenditure (in 10,000 con-stant Chinese yuan, deflated by the WDI CPI index with 1995 as the base year) inthe shoe sector by the Quality and Technology Supervision Bureau (QTSB) and thesampled companies, and the total number (in 10,000 pairs) of counterfeits in thesample each year. Only three data points are available for the QTBS expenditure inthe shoe sector.
would translate into randomly loosening IPR enforcements fora group of brands in China at a certain time, while leaving theIPR enforcements of the other brands unchanged. Although thegovernment enforcement change mainly presents itself with timevariations, I was able to bring in brand-level variations throughmeasuring the relationship between each sampled authenticproducer and the government. Pertinent details will be discussedin the following paragraphs, but the bottom line is straightfor-ward: After the enforcement-legislation change, the monitoringof counterfeits became decentralized, resulting in company-levelsupervision, carried out primarily through authentic manufac-turers’ own initiatives to protect their own brands. However, theauthentic companies still had to rely on the government to outlawthe counterfeit localities once these were discovered by their ownenforcement employees, because only the government had this au-thority. Therefore, companies that had a poor relationship with thegovernment received less attention and experienced more coun-terfeits. I thus exploit the interaction between the enforcement-legislation change and a proxy for the relationship between an
1584 QUARTERLY JOURNAL OF ECONOMICS
authentic company and the government to identify “randomized”counterfeit entry decisions8 and to infer entry impacts.
Before the enforcement change, the QTSB conducted regularinspections of shoe markets and factories. They confiscated andshut down counterfeit localities on the spot. The monitoring mech-anism was, therefore, quite uniform across different brands. Afterthe enforcement change, however, companies that had a good re-lationship with the government received faster responses whenthey reported counterfeit cases. All else being equal, this type ofphenomenon reduced the incentives of counterfeiters to infringeupon these brands.9 Brand-level variation in relationships withthe government (the QTSB in particular) is therefore helpful forexploring the variation in the effects of the policy shift on coun-terfeit entry and sales for different brands and, in turn, its effectson different authentic prices and other norms. The challenge isto obtain a proxy for such a relationship.10 I seek a relationshipproxy that is most relevant in explaining brand-level variation incounterfeiting and least influential on authentic-price and mar-keting outcomes, except when it affects counterfeiting. Based onthese criteria, the number of days it took a branded company toobtain ISO certificates nationwide is the most appropriate proxy.
Since the late 1980s, all registered companies in China havebeen mandated to meet the standards set by the International
8. Circumstances under which counterfeiters of a brand are more likely toenter for exogenous reasons that are not related to the brand holder’s price andquality prospects.
9. Chinese news agencies broadcast counterfeit-confiscation news and con-sequently counterfeiters are likely to know which brands are harder to infringeupon.
10. Previous literature on political connectedness largely measures country-level corruptions. Fisman (2001) pioneered such company-level measurement bylinking the response of the share returns of firms traded on the Jakarta stock ex-change to a string of rumors about the adverse state of President Suharto’s health.However, it is hard to identify a political figure similar to Suharto in the Chinesecontext that I am examining. The shareholders or directors of the sampled shoecompanies also did not participate in electoral votes, a scenario used in Khwajaand Mian (2005) to document the political connectedness of firms in Pakistan.The World Bank World Business Environment Survey (WBES) measures politicalconnectedness with managers’ impressions of how fast things get done in dealingwith governments (Batra, Kaufmann, and Stone 2003). The only other alternativeI found is a recent paper by Mobarak and Purbasari (2006), who propose thatwhether an Indonesian company acquired import licenses reflects its political con-nectedness. In the event that the political-connectedness element might play arole in the Chinese import-licensing system, I gather data for the sampled compa-nies (see online Appendix A). However, I use them only in supplemental analysesbecause they do not reflect a company’s relationship with the government agencyof interest, that is, the agency that is in charge of IPR enforcements and thatinfluences counterfeit entry and quantities.
IMPACTS OF ENTRY BY COUNTERFEITERS 1585
Standards Organization (ISO).11 For the shoe industry, the ISOsets standards for the basic equipment a company uses and thebasic rules pertaining to the environment and labor. The QTSB isin charge of ISO certification. For some companies, one month wassufficient to obtain the ISO certificate, but for others, the applica-tion date and grant date were more than 300 days apart. Of thecompanies that spent a long time fulfilling the ISO requirements,some were small, and others medium or large.
Through close readings of documents and multiple interviewswith companies and the QTSB, I was able to confirm that the stan-dards were rather basic and the differences in application timeswere largely due to bureaucracy. Notably, the standard for compa-nies to be registered as legal enterprises surpassed the basic qual-ity standard specified by the ISO. The companies also had to passinternal qualifications as outlined by the ISO before submittingtheir applications to the QTSB (QTSB 2000). Thus, the variationin application time is largely due to relationships and not prod-uct quality or other company factors. Each registered branch of abranded company needed to apply for an ISO certificate throughits local QTSB office.12 I use the number of work days it took eachbranded company to obtain ISO certificates, averaged across allthe relevant cities where that company had production or man-agement branches, as a proxy for the company’s relationship withthe government in the national market. This is a more objectiverelationship proxy than managers’ impressions recorded in WorldBank surveys (Batra, Kaufmann, and Stone 2003).
The sampled shoe companies had to comply with two sets ofISO standards, one established in 1994 and the other in 2000.I obtain each company’s application and grant dates for an ISOcertificate corresponding to each set of standards and calculatethe number of workdays between each pair of application andgrant dates. I then construct a variable that equals the numberof workdays between the application and grant dates for the 1994certificate through the year 2000 and that equals the number ofworkdays to obtain the 2000 certificate from the year 2001 on.The correlation between the number of days to obtain both sets of
11. This differs from the United States, where companies adopt ISO standardsvoluntarily.
12. For instance, the brand Senda originated in Yancheng city and appliedfor an ISO certificate there; its subsidiaries in Shanghai, Jianhu, Beijing, Jilin,etc., also applied for and obtained ISO certificates from the corresponding QTSBbranches.

1586 QUARTERLY JOURNAL OF ECONOMICS
ISO certificates is very high, 0.96, suggesting that the relationshipbetween a company and the government was rather steady in theperiod under examination. Further, there are more variations inthe ISO indicator across brands or firms within the same localarea than across regions. When I regress the ISO values on theseries of dummies indicating the city of application, none of thecities carry statistically significant coefficients. The p-values ofthese coefficients range from .23 to .64.13
There is also no significant correlation between this relation-ship proxy and the company’s size, sales, product quality, or pro-duction costs in my data. The largest correlation amounts to only0.08. The manager of a famous Chinese-branded company com-plained about its poor relationship with the QTSB and the con-sequent slow response in fighting its counterfeits: “Our companybases success on our ability and product quality and [we] nevercared to work on relationships [guanxi]. It is frustrating that wehave to go through slow processes in some applications such as theISO and wait months before the government outlaws the reportedlocalities of our counterfeits.”14 In addition, Chinese consumershardly notice these ISO certificates. Therefore, the ISO does notsignal product quality and is not likely to influence prices in anyway other than through affecting counterfeit entry and quantity.15
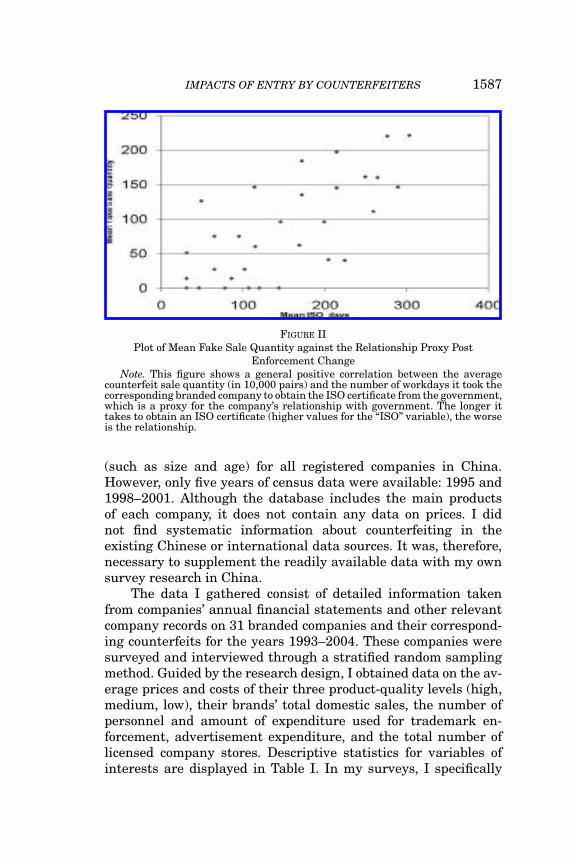
Figure II exhibits a generally positive relationship betweenthe average number of workdays a branded company took to ob-tain the ISO certificates and the mean quantity of counterfeit salesit experienced after 1995. This correlation remains significant inregressions of counterfeit entry or sales on ISO days, after takingout company- and year-fixed effects. Section IV.B provides moredata to support IV validity.
III. DATA
I collected data through a combination of external datasources and original survey research. I acquired the ChineseBureau of Statistics Industrial Census database, which containsdetailed financial information and basic company characteristics
13. I also regress the number of days for passing each of the two sets of ISOstandards, respectively, on the application city’s per-capita income, growth rate,CPI, and income inequality measure for the relevant years and find no significantcoefficients.
14. I have translated these quotations into English from the original Chinese.15. Many sectors are privatized in China, the footwear industry included.
None of the companies in my sample is state-owned. Shoe prices are also freelyset by supply and demand.
IMPACTS OF ENTRY BY COUNTERFEITERS 1587
FIGURE IIPlot of Mean Fake Sale Quantity against the Relationship Proxy Post
Enforcement ChangeNote. This figure shows a general positive correlation between the average
counterfeit sale quantity (in 10,000 pairs) and the number of workdays it took thecorresponding branded company to obtain the ISO certificate from the government,which is a proxy for the company’s relationship with government. The longer ittakes to obtain an ISO certificate (higher values for the “ISO” variable), the worseis the relationship.
(such as size and age) for all registered companies in China.However, only five years of census data were available: 1995 and1998–2001. Although the database includes the main productsof each company, it does not contain any data on prices. I didnot find systematic information about counterfeiting in theexisting Chinese or international data sources. It was, therefore,necessary to supplement the readily available data with my ownsurvey research in China.
The data I gathered consist of detailed information takenfrom companies’ annual financial statements and other relevantcompany records on 31 branded companies and their correspond-ing counterfeits for the years 1993–2004. These companies weresurveyed and interviewed through a stratified random samplingmethod. Guided by the research design, I obtained data on the av-erage prices and costs of their three product-quality levels (high,medium, low), their brands’ total domestic sales, the number ofpersonnel and amount of expenditure used for trademark en-forcement, advertisement expenditure, and the total number oflicensed company stores. Descriptive statistics for variables ofinterests are displayed in Table I. In my surveys, I specifically

1588 QUARTERLY JOURNAL OF ECONOMICS
TABLE ISUMMARY STATISTICS BEFORE AND AFTER THE POLICY CHANGE
Variable Pre-1995 Post-1995
Share of government 0.11 0.02resources devoted tomonitoring the shoe sector
(0.004) (0.001)
Workdays authentic company 142 149took to pass ISO (relationshipproxy)
(116.5) (112.6)
Number of company stores 0 684(retail stores established byan authentic brand)
(0) (533.5)
Authentic brand-protection 0.17 4.0office personnel (head count) (0.46) (2.23)
Quantity (in 10,000 pairs)Fake sale quantity Median 0 85.71
When exists, ranges from 1.2 to 1.87 (75.85)Authentic sale quantity 309.38 558.28
(725.76) (995.82)Prices, costs, and other numerairs (deflated, in US$)
Fake shoe price Median 0 7.32When exist, range from 8.33 to 10.4 (4.2)
Fake shoe cost Median 0 2.66When exist, range from 2.2 to 3.56 (1.56)
Authentic high-end shoe price 43.3 61.48(20.46) (40.58)
Authentic high-end shoe cost 33.53 47.01(19.14) (30.03)
Authentic medium-end shoe 27.25 32.32price (10.24) (18.71)
Authentic medium-end 19.61 24.71shoe cost (8.97) (13.50)
Authentic low-end shoe price 16.94 18.81(8.18) (10.48)
Authentic low-end shoe cost 14.8 14.42(6.70) (7.67)
Self-enforcement costs of 520 81,380authentic brands (1,550) (83,140)
Advertising expenditure 1,496,700 2,381,500(2,724,200) (3,329,300)
Real GDP per capita PPP 310.25 488.13(5.57) (2.83)
Annual sales and consumption (deflated, in million US$)Total sales of an authentic 50.47 78.29
brand (89.88) (105.0)Domestic sale of authentics 46.41 49.18
(90.03) (71.91)Household consumption 3,150 4,800
(20) (30)

IMPACTS OF ENTRY BY COUNTERFEITERS 1589
TABLE I(CONTINUED)
Variable Pre-1995 Post-1995
Percentages (×100%)Economic growth 12.99 8.43
(0.15) (0.03)Gini 37.13 43.82
(0.34) (0.08)Consumption as share of national income 57.76 57.40
(0.32) (0.02)N obs. 62 310
Note. This table presents the summary statistics of the data set, slicing it into two parts: data priorto the year 1995, when the Chinese government reallocated enforcement resources away from the footwearsector to fill in the needs of the safety sectors, and data after 1995. Each row reports the means and standarddeviations (in parentheses) of a variable in the two time lines. All company-level data are gathered throughoriginal interviews and surveys. The percentage of government resources devoted to monitoring the shoesector is obtained from the Quality and Technology Supervision Bureau. Real GDP per capita PPP, growthrates, consumption over income, and household consumption are obtained from the World Bank World Devel-opment Indicators (WDI). Prices and costs are deflated using the Consumer Price Index published in the WDI(Year 1995 was set as the base year in the database). Gini coefficients are extracted from the U.N. HumanDevelopment Reports.
requested the companies’ assistance in obtaining data from theirdatabases.16 The data provided by the companies corroboratethose recorded in the Industrial Census for the years available.The sales, sale costs, profits, and export aggregates of my samplemirror the trends in the census of shoe companies. In addition,the price data in my surveyed sample mirror the general pricetrends of the three quality levels in the eBay data set collected byresearchers at the University of Chicago. All the data checks aswell as sampling and survey methods are detailed in the onlineAppendices.
In addition, I coded and compiled product-level data fromthe companies’ and stores’ annual catalogs. These product cata-logs helped in better controlling for quality and costs. I compileda data set of the different characteristics for each type of shoelisted in the catalogs, consisting of the material, comfort level,decorative patterns, support and cushioning features, ventilation,etc. Recognizing the importance of validating the data from firmreports (Bresnahan 1989), I ran hedonic regressions of the unitproduction costs, as provided by the sampled companies, on thecorresponding material, machinery, and other characteristics of
16. The company contacts put a premium on accuracy and most of the timewould not even give casual estimates during interviews. Every time I had a follow-up question, they would respond only after having checked their files.
1590 QUARTERLY JOURNAL OF ECONOMICS
the shoes, as recorded in the catalogs. I conducted the analyseson the samples of leather shoes and sport shoes separately. Thesecharacteristics together account for 90% of the cost variation (on-line Appendix A.1). These results lend credibility to the companydata.
I then collected data on counterfeit sale quantities, prices, andcosts from the brand-protection office of each authentic company.Because the branded companies and the government, the QTSB inparticular, worked together to track down counterfeits, the QTSBshared with each branded company their statistics on the corre-sponding brand’s counterfeits and the corresponding counterfeit-ers’ internal financial statements that they confiscated. Given theunusual nature of the data, it is important to consider both theirreliability and limitations. On the very basic question of authen-ticity, I have no reason to doubt that the data actually representthe branded companies’ records of discovered counterfeits, theQTSB’s records of counterfeits eradicated from the marketplaceand production locations, and the counterfeiters’ financial records.These bookkeeping records were kept internally as a tool for man-aging day-to-day operations of the counterfeiting companies andwere confiscated along with all the counterfeits when the govern-ment investigated and shut down these illegal entities. The QTSBalso shared some statistics on the characteristics of the shoes theyconfiscated from the counterfeiters. The details are discussed inonline Appendix A.
To understand the potential biases and limitations of thedata, it is worth noting that these data on counterfeits were madeavailable in sums for each brand. That is, each branded companysent me the aggregated number of counterfeits and the averagecounterfeiting prices and costs of a particular brand in eachsampled year. According to these brand-protection offices andthe QTSB, the variation in terms of counterfeiting sophistication(production costs) is small. Counterfeiters consistently usedinferior and cheap materials to produce shoes and usually onlycharged a fraction of the authentic product’s price, to attractcustomers. Another limitation is that only the discovered orcaptured counterfeits are reflected in the data. Although thebranded companies reported that they were able to track downmost of their counterfeits and the remaining ones were minor anddid not greatly affect them, it is prudent to view the counterfeitsales as the lower bounds of the true values. To ameliorate this

IMPACTS OF ENTRY BY COUNTERFEITERS 1591
potential bias, I generate a dummy variable for a counterfeitingpresence, which takes on a value of one if a branded companyexperiences any amount of counterfeiting, and zero otherwise. Iprimarily study the impact of counterfeiter entry and presenceon the authentic brands. I then supplement the analyses andcheck the robustness of the results by examining the impacts ofthe level of counterfeiting on the authentic brands.
To control for the overall economic environment and con-sumer purchasing power, I extract the GDP, per capita PPP(henceforth “pcPPP”), GDP growth, Consumer Price Index (CPI),household consumption, and total consumption as a share of GDPfor China in the sampled years from the World Development Indi-cators (WDI) database. I also extract the annual Gini coefficientsin China from the U.N. Human Development Reports. As dis-cussed in Section II, neither the counterfeiting treatment variablenor the policy-shift experiment (supplemented with brand-levelvariation in relationships with the local governments) exhibitsregional variation. This implies that regional factors are not likelyto cause bias in estimates even if omitted. Nonetheless, I collectregional-level income per capita, growth, price, and inequalitydata and conduct robustness checks, as reported in the onlineAppendices.
IV. EMPIRICAL ANALYSIS AND RESULTS
IV.A. A General Picture of the Counterfeiting Era
To provide a general sense of the trends, Table I displaysthe descriptive statistics of the variables used in the analysespre- and post-1995, the benchmark year for the government’sallocation of resources away from the shoe industry to tightlymonitor the safety sectors. The drop in the mean percentage ofgovernment resources devoted to monitoring the shoe sector from11% to 2% is accompanied by a massive entry of counterfeiters.Whereas the median of the counterfeit-sale quantity acrossbrands was zero before 1995 (with some 10,000 pairs for just afew brands), counterfeits reached 857,100 pairs on average acrossthe sampled brands in the years after. It is interesting to observethe subsequent changes in the authentic companies. They beganto invest enormously in self-enforcing their trademarks (651,014deflated yuan, approximately US$81,377, on average post-1995).
1592 QUARTERLY JOURNAL OF ECONOMICS
0
1
2
3
4
5
6
1993 1994 1995 1996 1997 1998 1999 2000 2001 2002 2003 2004
Year
100
yuan
Highprice
Mediumprice
Lowprice
Costhigh
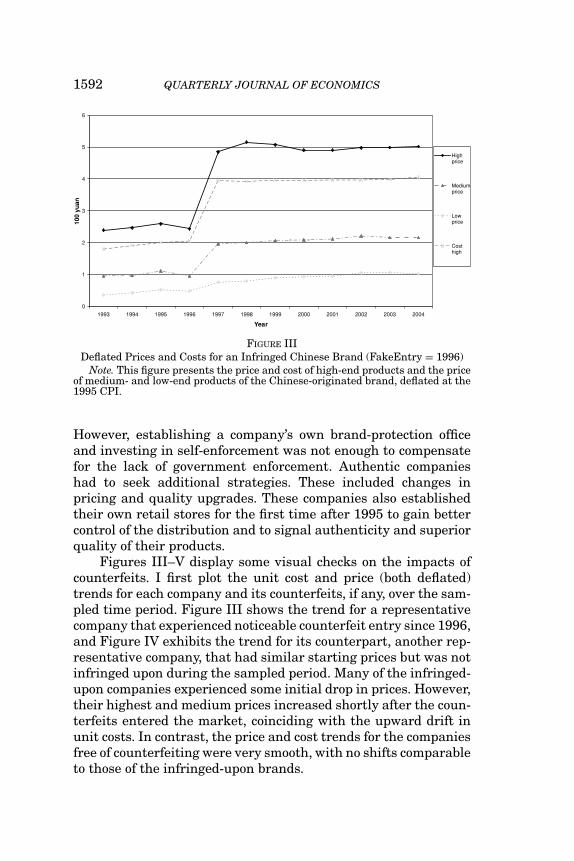
FIGURE IIIDeflated Prices and Costs for an Infringed Chinese Brand (FakeEntry = 1996)
Note. This figure presents the price and cost of high-end products and the priceof medium- and low-end products of the Chinese-originated brand, deflated at the1995 CPI.
However, establishing a company’s own brand-protection officeand investing in self-enforcement was not enough to compensatefor the lack of government enforcement. Authentic companieshad to seek additional strategies. These included changes inpricing and quality upgrades. These companies also establishedtheir own retail stores for the first time after 1995 to gain bettercontrol of the distribution and to signal authenticity and superiorquality of their products.
Figures III–V display some visual checks on the impacts ofcounterfeits. I first plot the unit cost and price (both deflated)trends for each company and its counterfeits, if any, over the sam-pled time period. Figure III shows the trend for a representativecompany that experienced noticeable counterfeit entry since 1996,and Figure IV exhibits the trend for its counterpart, another rep-resentative company, that had similar starting prices but was notinfringed upon during the sampled period. Many of the infringed-upon companies experienced some initial drop in prices. However,their highest and medium prices increased shortly after the coun-terfeits entered the market, coinciding with the upward drift inunit costs. In contrast, the price and cost trends for the companiesfree of counterfeiting were very smooth, with no shifts comparableto those of the infringed-upon brands.

IMPACTS OF ENTRY BY COUNTERFEITERS 1593
0
0.2
0.4
0.6
0.8
1
1.2
1.4
1.6
1.8
2
1993 1994 1995 1996 1997 1998 1999 2000 2001 2002 2003 2004
Year
100
yuan
HighP
MediumP
LowP
HighCost
FIGURE IVDeflated Prices for a Noninfringed Chinese Company
Note. This figure presents the time trends of the authentic prices for the high-,medium-, and low-end products and the costs of authentic high-end products, alldeflated at the 1995 CPI.
Year relative to entry
Co
effi
icen
ts o
n t
he
tim
e d
um
mie
s
FIGURE VTime Plot of Average Log Deflated Authentic Prices and Costs
Note. This figure plots the regression coefficients on the dummies (indicatingthe year relative to counterfeit entry), with log deflated authentic price or cost asthe response variable.

1594 QUARTERLY JOURNAL OF ECONOMICS
To examine the cost and price dynamics pre- and post-entrymore formally, I regress the log of the deflated authentic costs andprices on a set of dummies indicating the years relative to counter-feit entry (from five years prior to entry to five years after) and plotthe coefficients on these time lines (the dashed diamond line forthe price specification and the solid circle line for the cost specifica-tion in Figure V). The pattern is similar to that of single-companyplots: rather smooth price movement prior to entry, an initial dropupon entry, an upward drift shortly after entry (again coincidingwith the upward jump in unit costs), and finally leveling off.17 Acounterfactual experiment based on the price trend pre-entry18
shows a smooth and slightly upward trend in authentic priceover time, as plotted by the dotted squared line. The discrepancybetween the forecast prices based on pre-entry trends and the ac-tual post-entry prices clearly reveals a discontinuous change inprice levels after counterfeit entry. Similarly, unit costs experi-enced a discontinuous change post-entry. This corresponds to theupgrades in shoe materials and technologies, illustrated in thehedonic regression results (online Appendix A) and reported bymanagers to be a means of differentiating their products fromcounterfeits.
The discontinuous changes in authentic prices are not theresult of a fashion trend, because the deflated price trend forthe footwear industry in the American market over the sameperiod has been smooth and even declining (online Figure A.1;American Apparel and Footwear Association 2005). Besides qual-ity upgrades, the sampled authentic companies also differentiatedthrough vertical integration. Online Figure A.2 demonstrates arepresentative case in which the number of company stores cor-related with a decline in the counterfeit sale quantities.
In addition to the above descriptive statistics, a series of OLSregressions demonstrates a positive correlation between counter-feit entry and the authentic company’s product quality (as proxiedby the unit costs), advertising expenditures, the number of com-pany stores, enforcement expenditures, and the price. Details areincluded in online Appendix B.1.
17. The coefficient on the dummy for one year after entry is negative in thefigure, although some companies had already raised prices. This is mainly dueto the heterogeneous response times across companies. Some authentic manufac-turers were able to improve quality or engage in other countervailing strategieswithin a year, but most companies took two or more years to do so.
18. I regress the actual coefficients on these year dummies on the years beforeentry and predict the coefficients in the counterfactual experiment (i.e., no entry)from this regression.

IMPACTS OF ENTRY BY COUNTERFEITERS 1595
IV.B. Testing Counterfeiting Effects with Instrumental VariableEstimations
In this section, I start with the first-stage estimation resultsto further illustrate the IV’s validity. I then discuss the overall IVestimation results when various authentic producers’ strategiesand outcomes are regressed on lagged counterfeit entry (instru-mented). Finally, I trace the authentic price dynamics over timeand test the price signaling effects. This analysis provides someinsight into the short- and long-run impacts of counterfeit entryand the implications of asymmetric information.
First Stage Instrumental Variable Estimates. I constructan IV, Loose, to benchmark the years with diverted governmentenforcement efforts for shoes (Loose = 0 prior to 1995 and 1starting from 1995). As explained in Section II, I use thisenforcement change and its interaction with the relationshipbetween a branded company and the government (proxied by thedays it took the brand to pass ISO standards, averaged acrossits subsidiaries in various regions) as the main instrumentalvariables for counterfeit entry. Because the enforcement changewas due to a series of accidents that took place in other industries,it is plausibly exogenous. The IV exclusion restrictions are alsofulfilled because tightened government enforcement elsewhereis not expected to affect shoe prices directly. Because authenticprices are set by market equilibrium, and the ISO time proxiesfor the relationship of a company only with the QTSB, this ISOproxy does not affect prices or other norms directly.
The first-stage regression model is
Counterfeitat = γ 0 + γ 1 × (Relation × Loose)at + γ 2 × Looset
+ γ 3 × Relationat + γ T4 × Year Dummiest
+ γ T5 × Firm Dummiesa + εat,(2)
where Counterfeitat is defined similarly to its definition in (1).Relationat is the ISO proxy for the relationship between authen-tic company a and the government, and (Relation × Loose)atstands for the interaction variable between this relationship proxyand the enforcement-change indicator.19 In alternative specifica-tions, I replace the counterfeit entry dummy with counterfeit sale
19. I only include the most important instruments because additional weakerinstruments might reduce IV effectiveness. The results in this paper are robustqualitatively to alternative statistical models as in Qian and Xie (2008).
1596 QUARTERLY JOURNAL OF ECONOMICS
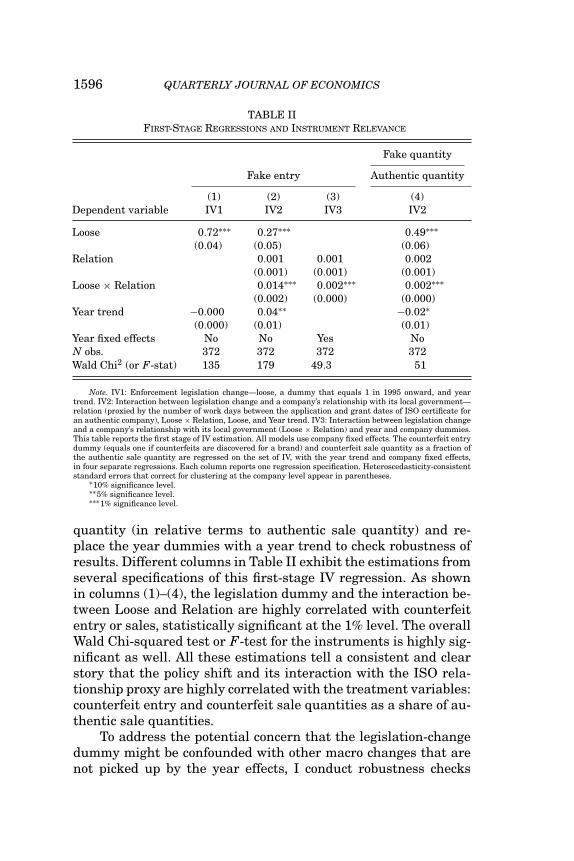
TABLE IIFIRST-STAGE REGRESSIONS AND INSTRUMENT RELEVANCE
Fake quantity
Fake entry Authentic quantity
(1) (2) (3) (4)Dependent variable IV1 IV2 IV3 IV2
Loose 0.72∗∗∗ 0.27∗∗∗ 0.49∗∗∗(0.04) (0.05) (0.06)
Relation 0.001 0.001 0.002(0.001) (0.001) (0.001)
Loose × Relation 0.014∗∗∗ 0.002∗∗∗ 0.002∗∗∗(0.002) (0.000) (0.000)
Year trend −0.000 0.04∗∗ −0.02∗(0.000) (0.01) (0.01)
Year fixed effects No No Yes NoN obs. 372 372 372 372Wald Chi2 (or F-stat) 135 179 49.3 51
Note. IV1: Enforcement legislation change—loose, a dummy that equals 1 in 1995 onward, and yeartrend. IV2: Interaction between legislation change and a company’s relationship with its local government—relation (proxied by the number of work days between the application and grant dates of ISO certificate foran authentic company), Loose × Relation, Loose, and Year trend. IV3: Interaction between legislation changeand a company’s relationship with its local government (Loose × Relation) and year and company dummies.This table reports the first stage of IV estimation. All models use company fixed effects. The counterfeit entrydummy (equals one if counterfeits are discovered for a brand) and counterfeit sale quantity as a fraction ofthe authentic sale quantity are regressed on the set of IV, with the year trend and company fixed effects,in four separate regressions. Each column reports one regression specification. Heteroscedasticity-consistentstandard errors that correct for clustering at the company level appear in parentheses.
∗10% significance level.∗∗5% significance level.∗∗∗1% significance level.
quantity (in relative terms to authentic sale quantity) and re-place the year dummies with a year trend to check robustness ofresults. Different columns in Table II exhibit the estimations fromseveral specifications of this first-stage IV regression. As shownin columns (1)–(4), the legislation dummy and the interaction be-tween Loose and Relation are highly correlated with counterfeitentry or sales, statistically significant at the 1% level. The overallWald Chi-squared test or F-test for the instruments is highly sig-nificant as well. All these estimations tell a consistent and clearstory that the policy shift and its interaction with the ISO rela-tionship proxy are highly correlated with the treatment variables:counterfeit entry and counterfeit sale quantities as a share of au-thentic sale quantities.
To address the potential concern that the legislation-changedummy might be confounded with other macro changes that arenot picked up by the year effects, I conduct robustness checks

IMPACTS OF ENTRY BY COUNTERFEITERS 1597
using the fraction of the resources the QTSB devoted to the shoeindustry as an alternative instrument to the legislation dummy. Idiscuss the estimation details in online Appendix B; all the resultsare similar to those presented here.
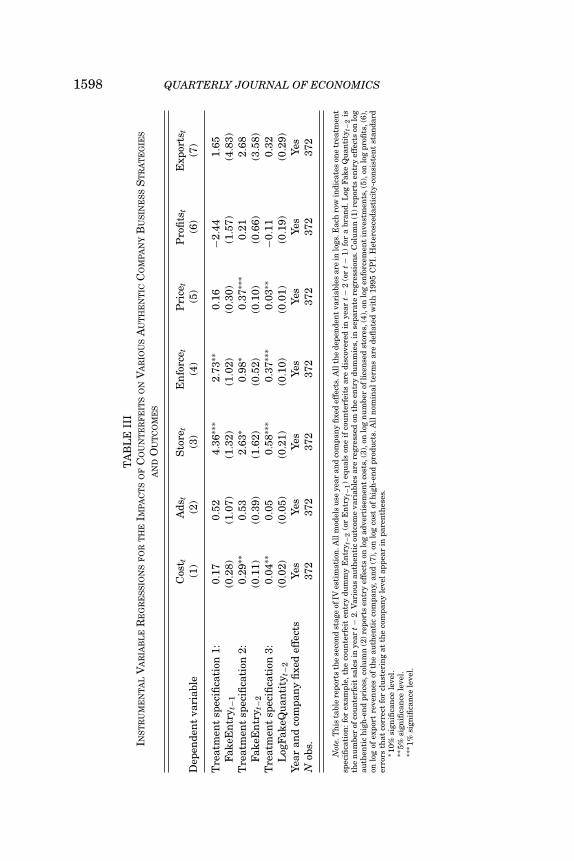
Instrumental Variable Regressions for Various AuthenticStrategies and Outcomes. I estimate equations (1) and (2) simul-taneously (2SLS), to test the counterfeit entry effect on each of theauthentic producers’ strategy proxies in σ (as defined in SectionII) and on their profits and export revenues (Table III). Standarderrors are clustered at the company level. Using the counterfeitsale quantity and the counterfeit entry dummy lagged by differentyears as alternative treatment variables, I arrive at robust results.Counterfeiter entry and sales induce most authentic producers toupgrade quality with more expensive materials and differentiatetheir products from counterfeits, as reflected in the significantincrease in unit production costs two years later (column (1);coeff = 0.29 for entry lagged by two years, implying a 33.6%increase). Whereas most authentic companies started investing inenforcement activities and establishing licensed company storeswithin one year (columns (3) and (4)), advertisement costs werenot significantly influenced by counterfeits (column (2)). This isplausibly due to two opposing forces: On one hand, being counter-feited could have been a form of advertisement for the brand, andon the other hand, low-quality counterfeits could have ruined thebrand’s reputation, forcing the authentic company to invest morein advertising. In the interviews, the brand managers commentedthat they trained employees in their licensed company stores toinform consumers about the differences between their authenticproducts and counterfeits. Authentic prices rose significantly twoyears after counterfeit entry (column (5); coeff = 0.37 translatesinto a 45% increase) due to endogenous sunk costs includingquality investments, self-enforcement, the vertical integration ofretail stores, and other nonprice signals. Additional price signal-ing strategies might have been employed and are explored in thenext section. There is no significant effect of counterfeit entry onauthentic profits or export revenues (columns (6) and (7)).
The hedonic regressions described in Section III and onlineAppendix A.1 establish the high correspondence between the unitcosts and the shoe characteristics from the annual catalogs. Thesignificant coefficients in the log cost specification as reportedabove therefore indicate a significant impact of counterfeit entry
1598 QUARTERLY JOURNAL OF ECONOMICS
TA
BL
EII
II N
ST
RU
ME
NT
AL
VA
RIA
BL
ER
EG
RE
SS
ION
SF
OR
TH
EIM
PA
CT
SO
FC
OU
NT
ER
FE
ITS
ON
VA
RIO
US
AU
TH
EN
TIC
CO
MP
AN
YB
US
INE
SS
ST
RA
TE
GIE
S
AN
DO
UT
CO
ME
S
Cos
t tA
dst
Sto
ret
En
forc
e tP
rice
tP
rofi
tst
Exp
orts
tD
epen
den
tva
riab
le(1
)(2
)(3
)(4
)(5
)(6
)(7
)
Tre
atm
ent
spec
ifica
tion
1:0.
170.
524.
36∗∗
∗2.
73∗∗
0.16
−2.4
41.
65Fa
keE
ntr
y t−1
(0.2
8)(1
.07)
(1.3
2)(1
.02)
(0.3
0)(1
.57)
(4.8
3)T
reat
men
tsp
ecifi
cati
on2:
0.29
∗∗0.
532.
63∗
0.98
∗0.
37∗∗
∗0.
212.
68Fa
keE
ntr
y t−2
(0.1
1)(0
.39)
(1.6
2)(0
.52)
(0.1
0)(0
.66)
(3.5
8)T
reat
men
tsp
ecifi
cati
on3:
0.04
∗∗0.
050.
58∗∗
∗0.
37∗∗
∗0.
03∗∗
−0.1
10.
32L
ogFa
keQ
uan
tity
t−2
(0.0
2)(0
.05)
(0.2
1)(0
.10)
(0.0
1)(0
.19)
(0.2
9)Ye
aran
dco
mpa
ny
fixe
def
fect
sYe
sYe
sYe
sYe
sYe
sYe
sYe
sN
obs.
372
372
372
372
372
372
372
Not
e.T
his
tabl
ere
port
sth
ese
con
dst
age
ofIV
esti
mat
ion
.All
mod
els
use
year
and
com
pan
yfi
xed
effe
cts.
All
the
depe
nde
nt
vari
able
sar
ein
logs
.Eac
hro
win
dica
tes
one
trea
tmen
tsp
ecifi
cati
on:f
orex
ampl
e,th
eco
un
terf
eit
entr
ydu
mm
yE
ntr
y t−2
(or
En
try t
−1)
equ
als
one
ifco
un
terf
eits
are
disc
over
edin
year
t−2
(or
t−1)
for
abr
and.
Log
Fake
Qu
anti
tyt−
2is
the
nu
mbe
rof
cou
nte
rfei
tsa
les
inye
art−
2.V
ario
us
auth
enti
cou
tcom
eva
riab
les
are
regr
esse
don
the
entr
ydu
mm
ies,
inse
para
tere
gres
sion
s.C
olu
mn
(1)r
epor
tsen
try
effe
cts
onlo
gau
then
tic
hig
h-e
nd
pric
es,c
olu
mn
(2)r
epor
tsen
try
effe
cts
onlo
gad
vert
isem
ent
cost
s,(3
),on
log
nu
mbe
rof
lice
nse
dst
ores
,(4)
,on
log
enfo
rcem
ent
inve
stm
ents
,(5)
,on
log
profi
ts,(
6),
onlo
gof
expo
rtre
ven
ues
ofth
eau
then
tic
com
pan
y,an
d(7
),on
log
cost
ofh
igh
-en
dpr
odu
cts.
All
nom
inal
term
sar
ede
flat
edw
ith
1995
CP
I.H
eter
osce
dast
icit
y-co
nsi
sten
tst
anda
rder
rors
that
corr
ect
for
clu
ster
ing
atth
eco
mpa
ny
leve
lapp
ear
inpa
ren
thes
es.
∗ 10%
sign
ifica
nce
leve
l.∗∗
5%si
gnifi
can
cele
vel.
∗∗∗ 1
%si
gnifi
can
cele
vel.

IMPACTS OF ENTRY BY COUNTERFEITERS 1599
or quantity on the authentic shoe quality upgrades. To probe intothe quality changes, I analyze each aspect of the shoe characteris-tics pre- and post-entry, using the IV estimates on the overall qual-ity proxy I extract from the product catalogs and rank sum tests oneach characteristic as detailed in Qian (2006) and Appendix B.3.The analysis yields interesting results: The authentic producersused fancier surface and side materials and improved the shoe ap-pearance tremendously (especially for leather shoes) after coun-terfeit entry. Equipment and technologies were improved; notably,these companies imported Italian production lines. There is nomatching improvement in functionality, possibly due to the factthat the companies always described their high-end shoes as com-fortable, versatile, having cushioning effects, etc. If functionalityindeed did not change significantly in practice, then it interest-ingly reflects that authentic companies upgraded quality dimen-sions that could most directly distinguish their products fromthose of counterfeiters. The overall quality shifted up by fifteenpercentile points after the brand experienced counterfeits (themodes of the distributions for quality ranks are approximatelyequal to 20).
Exploring licensed stores, I regress the log of the number oflicensed stores an authentic company established on the lagged-year counterfeit entry or quantity, the log pcPPP, economic growth,the Gini coefficient, the year trend, and company fixed effects. Theresults demonstrate that the number of licensed stores is posi-tively (statistically significantly at the 1% level) correlated withthe lagged-year counterfeit entry or quantity and the current-yearGini coefficient. The intuition is that the prevalence of counter-feits in the market induced incumbents’ countervailing responses.Original products in a licensed store are usually sold at a higherprice, because building or renting a space to set up a licensed storepushes up fixed and marginal costs. This is profitable if consumersfind it worthwhile to have this type of indicator to assure them ofthe product’s authenticity. In other words, a licensed store can beconsidered as an information service, separating authentic prod-ucts from counterfeits. Regression analysis also reveals that thenumber of licensed stores is positively correlated with income dis-tribution: The higher the Gini coefficient, the more wealthy peoplethere are who can afford luxury products or who are willing to paymore for famous brands.
Instrumental Variable Estimates to Trace Log AuthenticPrice Trends. Whereas the previous section tests the impacts of

1600 QUARTERLY JOURNAL OF ECONOMICS
counterfeit entry on various market norms, this section tracesthe entry effects on authentic prices over a longer time horizon.In addition, I empirically disentangle the price increase into twoparts: the part due to quality improvement and the part due tosignaling effects. To tease out these two parts, I include the log ofunit production costs as a control variable in the second-stage IVestimation (equation (1)). As online Table A.1 shows, shoe charac-teristics help explain over 90% of the variations in shoe costs and80% of the price variations. The part of the price increase due toquality improvement can be reflected by a positive coefficient onthe cost variable, whereas the signaling part is likely captured bya positive coefficient on the entry dummy in the same regression.I therefore run two sets of regressions. The first set regresses thelog authentic price on the instrumented counterfeit-entry dummylagged by zero to five years, respectively, simply controlling for theyear trend and company fixed effects (columns (1), (3), and (5) inTable IV). This set of regressions yields the overall entry effectson authentic prices in the five-year time frame. The second setof regressions adds authentic unit production costs as a control,together with the other control variables discussed in the nextparagraph, to shed light on the potential price signaling effect netof quality upgrades (columns (2), (4), and (6) in Table IV).
To address the concern that prices can rise due to positivedemand shifts, I control for a set of macroeconomic variables.20
Price can also be correlated with a company’s prestige, which Icontrol for by including the age of the company, defined by thepresent year minus the incorporation year. I further control forthe macroeconomic environment by using annual data on the Chi-nese real pcPPP, growth rate, Gini coefficient, total consumptionas a share of GDP, and deflated household consumption in thatyear. I convert prices, deflated household consumption, and pcPPPto logarithms in order for the data distributions to be approxi-mated better as normal distributions. Furthermore, regressionson log terms capture the rates of change in variables instead oftheir levels, which vary across companies. Because the macroeco-nomic factors are the same for all companies in each year, they are
20. In separate specifications, I also add the company’s domestic sale quanti-ties to the controls, and the results do not change much. The negative coefficienton the domestic sale quantity variable, while insignificant, provides some evidencethat a shift in demand may not be a good explanation for the price increase, al-though it cannot entirely rule out that possibility. Positive demand shocks wouldlogically raise both the domestic price and sale quantities and lead to a positivecorrelation between these two variables.

IMPACTS OF ENTRY BY COUNTERFEITERS 1601
TABLE IVINSTRUMENTAL VARIABLES ESTIMATES FOR COUNTERFEIT EFFECTS ON AUTHENTIC
PRICES: ENTRY DUMMY LAGGED BY 0, 2, OR 4 YEARS
Log deflated prices for high-end authentic products—log(Pt)
Current year 2-year lag 4-year lag
Dependent variable (1) (2) (3) (4) (5) (6)
Fake entry 0.02 −0.01 0.43∗∗∗ 0.08∗∗ 0.25∗∗ 0.06(0.06) (0.01) (0.13) (0.04) (0.12) (0.05)
log cost 1.02∗∗∗ 0.82∗∗∗ 0.93∗∗∗(0.01) (0.05) (0.03)
Age 0.001∗∗ 0.001 0.001∗(0.000) (0.001) (0.000)
log(GDPpcPPP) 0.11 0.04 0.09(0.15) (0.21) (0.12)
Growth 0.001 0.001 0.002(0.001) (0.001) (0.005)
Gini 0.005∗ 0.004∗∗ 0.002(0.002) (0.002) (0.006)
C/Y 0.000 0.003 0.002(0.001) (0.003) (0.003)
log(HHC) 0.01 0.08 0.04(0.02) (0.08) (0.08)
Year trend 0.00 −0.01 0.04∗∗∗ −0.01 0.03∗∗∗ 0.00(0.00) (0.01) (0.01) (0.02) (0.01) (0.00)
N obs. 372 372 372 372 372 372
Note. This table reports the IV estimates of the counterfeit entry effect on the log of deflated authentichigh-end prices. All models use company fixed effects. Each column represents a regression specification, withthe counterfeit entry dummy defined at different lags as specified in the column header. For instance, columns(3) and (4) correspond to the Entryt−2 dummy, which equals 1 if a counterfeit of a brand entered in year t − 2;log Cost is the authentic cost of high-end products in year t, proxying for its quality; age is defined as thecurrent year minus a company’s incorporation year. Real GDP per capita PPP, growth rates, consumptionover income (C/Y ), and household consumption (HHC) are obtained from the World Bank World DevelopmentIndicators. Gini coefficients are extracted from the U.N. Human Development Reports. Heteroscedasticity-consistent standard errors that correct for clustering at the company level appear in parentheses.
∗10% significance level.∗∗5% significance level.∗∗∗1% significance level.
collinear with the year dummies. I replace year dummies with theyear trend in these regressions in order to preserve the interestingcoefficients on these macro variables.
The coefficients in the regression specification with entrylagged by one year resemble those with current-year entry. Simi-larly, regression results with entry lagged by three years resemblethose lagged by two years, and five-year-lag estimates resemblethose lagged by four years. For brevity, Table IV presents onlyresults with entry lagged by zero, two, and four years. The
1602 QUARTERLY JOURNAL OF ECONOMICS
immediate pricing impact of counterfeit entry may be negative;however, it is not statistically significant (columns (1) and (2)).This indicates that it took time for the authentic companies to re-spond to counterfeit entry. Entry evidently induced authentic com-panies to raise prices from two years on (columns (3)–(5)). Notably,prices rose by a factor of 1.5 on average after counterfeits entered,proving significant at the 5% level (column (3); coefficient = 0.43for the log price). When including the log of unit costs (proxying forquality) in the regression, this variable explains a substantial partof the price increase (columns (4) and (6)). The results help to teaseout the potential confounding effect: If the price jumps were dueto a brand effect, the price of the same product, not one of higherquality (made with higher unit costs and better materials, asshown in online Appendices A and B), should have been affected.
Moreover, even after controlling for cost, counterfeit entryinduced the log authentic price to rise by 8% on average, with astandard error of 3.7%, two years after entry (column (4)). One ex-planation for this result is price signaling effects: Prices rose abovea level that could be explained by improvements in quality. How-ever, this effect fades away when log authentic prices are regressedon the four-year-lag entry variable (column (6)). This is consistentwith the predictions in Bagwell and Riordan (1991) and echoesfindings in Curry and Riesz (1988) that, in the durables market,firms may first signal high quality with a price higher than thecomplete-information optimal price, and then decrease the priceas information spreads. Results are robust when including year-fixed effects, with IV3 as specified in Table II or with controllingfor the set of shoe characteristics in place of log costs (onlineAppendix B, Table A.8). I conduct additional robustness checksby adding the number of company stores and advertisement andenforcement expenditures (in logs) to the right-hand side of the re-gression model. Although company stores and advertisement ex-penditures are positively correlated with authentic prices and aresignificant at the 5% level, there is remaining predictive power onthe counterfeit entry coefficient (online Table A.8). This analysisprovides evidence for the presence of subtle price-signaling effects.
It is worth noting the positive and significant coefficients onthe age variable in column (2). Together with the negative correla-tion between this age variable and the counterfeit entry dummy,this suggests that the longer an authentic brand remains on themarket (greater age), the more information may be released toconsumers, resulting in counterfeit entry imposing less influence

IMPACTS OF ENTRY BY COUNTERFEITERS 1603
on short-run authentic prices. The role of information is againrevealed.
V. THEORY FOUNDATIONS FOR THE FINDINGS
I build upon a vertical differentiation model (Gabszewicz andThisse 1979, 1980; Shaked and Sutton 1983) with endogenousquality and other endogenous sunk costs (ESC) (Sutton 1991) toexplain the effects of counterfeit entry, as observed in the em-pirical sections. In light of the finding that authentic producerschose different quality levels pre- and post-entry of counterfeit-ers, I introduce quality options for the authentic producer, whochooses quality according to its potential to yield higher profits. Ifirst analyze price competition with a given quality (one per firm)under the Stackelberg game and then look at the ex ante choice ofquality. I take asymmetric information into account by buildingon the literature of quality uncertainty. Asymmetric informationis important in the context of counterfeits, as many news storieshave revealed how consumers are conned into buying counter-feits.21 Price is the conventional signal for product quality, butNelson (1974) points out the importance of advertisement as aform of nonprice signal. Milgrom and Roberts (1986) argue thatprices are better signals for quality than nonprice signals (notablyadvertisements) unless repeated purchase is assumed. Despitethe sophistication of these models, they only consider a monopo-listic market and assume exogenous quality levels. Metrick andZeckhauser (1999) use a simplified vertical differentiation frame-work to model competition under asymmetric information. How-ever, their models are still confined to exogenous quality, and theyderive equilibrium market shares in a price-pooling equilibrium,which is helpful for explaining certain sector equilibria but notapplicable to most counterfeit markets. I argue that ESC can playan important role in the context of price rivalry and asymmetricinformation.
The stylized model as detailed in Qian (2006) predicts thatthe incumbent is induced to improve quality and raise prices aftera new entry into the market, provided that the entrant’s prod-uct quality is lower than a certain value relative to the quality
21. Chinese media reported a few years ago that a woman bought a pairof Nike shoes on sale, but only one month later they fell apart. Her happinessin catching the sale turned into indignation, and she sued the Nike branch inShanghai. She then found out the pair she got was counterfeit.
1604 QUARTERLY JOURNAL OF ECONOMICS
of the incumbent’s product. This can be linked to the findingsby Aghion et al. (2005) that firms sometimes innovate to escapecompetition. However, their model does not reconcile with thefact that the authentic firms did not engage in innovation whenthere was already significant competition from all the other au-thentic producers. Innovation occurred and prices jumped onlyafter these authentic brands were infringed upon by counterfeits.My model provides intuitive rationales. If the entrant’s quality isvery high relative to the highest quality an authentic producerwould like to attain, then competition can still be fierce even ifthe incumbent upgrades quality. The incumbent may be betteroff engaging in limit-pricing strategies. It is only when an en-trant’s quality is below a certain threshold that the incumbentsees enough innovation gains to justify additional costs. This rela-tive cost structure explains why certain sectors may protect theirIPR differently or respond to entrants of varying quality levelsdifferently.
In addition to spacing out on the quality ladder by innovat-ing, the authentic quality upgrades also can serve as a signal-ing device to disentangle asymmetric information created by theentry of counterfeiters. This helps to explain the empirical find-ings that the sampled authentic companies mainly upgraded theshoe surface materials, pattern-press equipment and techniques,and other appearance-related features. The predictions also shedlight on alternative signaling strategies. Even without a qualitychange, authentic producers may choose to set prices higher thanthe complete-information ones to signal their product’s superiorquality relative to that of the counterfeit. This signal is crediblebecause counterfeiters may imitate only at the cost of losing someexpert consumers, who would not buy counterfeits if their pricewere as high as the authentic price. In the theoretical framework,I convey this intuition when the constrained separating equi-librium prevails with the counterfeiter’s Incentive Compatibil-ity constraint binding. Under this circumstance, the constrainedprice is the profit-maximizing price for the authentic producer andcan be considered a signaling device to separate authentic prod-ucts from counterfeits. The detailed derivations in Qian (2006)clearly lay out the various parameters with price and qualitydynamics.
The theoretical framework explains the use of enforcement,licensed company stores, and holograms as a means of counter-vailing counterfeiting. The intuition in a nutshell is as follows:

IMPACTS OF ENTRY BY COUNTERFEITERS 1605
Tightened enforcement, either governmental or company-level,add to the risk of outlawing counterfeits and translate into aloss function for counterfeiters. The implementation of companystores and holograms is a nonprice signal for quality or authen-ticity. All these measures would widen the parameter range forthe authentic producer to effectively separate herself from coun-terfeiters. In sum, my model enriches the set of instruments au-thentic producers can use to combat counterfeits, as observed inpractice: quality, enforcement activities, price, vertical integra-tion, and other signaling devices. Analyzing and abstracting fromthe managers’ comments during the interviews, I find that thecompanies initially employed this set of strategies to disentanglethe asymmetric information counterfeiters generated and to pro-tect authenticity. These strategies are in essence also the ESCthat helped sustain the authentic producers’ competitive posi-tions in the market, as some managers seem to have realized inretrospect.22
All these aforementioned separating strategies push up au-thentic prices. The theoretical framework I propose here is, there-fore, more complete in explaining the data than prior theories.Notably, Frank and Salkever (1997) conjecture that the entry ofgeneric drugs lures away price-sensitive consumers and leavesbehind a more inelastic demand curve for the brand-name drugsto opt for higher prices. However, this segmentation story can-not fully explain the empirical findings in my study. First, I ob-serve that, unlike the generic-drug case, authentic quality roseafter the entry of counterfeits. The price increases largely cor-responded to the increases in costs to produce a higher qualityproduct post-entry instead of merely to the change in demand.
22. During the interview, one company’s manager said, “Starting from 1996,our company products have reduced using the wholesale market and we switchedthe channel to licensed retailing. We established a well-managed retail distributionsystem nationwide. This is one of the most effective ways to combat counterfeits,and it almost deterred counterfeiting.” Another sales manager told me, “Counter-feits pushed us to establish our [licensed] stores. We have now discovered a newchannel [of retailing] and we are now trying to build our personality into it.”One brand-protection officer stated that “Once our licensed company stores wereopened, we had an influx of customers come and purchase even at much higherprices than the old wholesale prices. Why? We later learned that many customerswho bought counterfeit shoes felt very uncomfortable due to the inferior shoe ma-terials, and some [counterfeits] even fell apart in public, which caused embarrass-ment. These customers undoubtedly would rather pay more to secure authenticpurchases. In the end, we had higher mark-ups for our shoes and more resourcesto develop new models of higher quality, which certainly would charge furtherhigher prices and bring in more profits. As the gap between our products and thecounterfeits widens, customers like ours more. We call this a virtuous cycle.”

1606 QUARTERLY JOURNAL OF ECONOMICS
Second, the segmentation model may be extended to suggest thatauthentic firms upgraded quality to target high-valuation con-sumers and gave up on consumers at the other end of the spec-trum. However, if there was no asymmetric information aboutcounterfeiting, it would be hard to understand why companies in-vested as much as they did, according to data, in self-enforcementand company retailing. Third, the negative associations of coun-terfeit sales with company age and lagged-year production costsare also difficult to resolve with models with complete information.Without asymmetric information, the more established (greaterage) an authentic company was and the more higher-end prod-ucts it held, the more abundant were the incentives for imitationand the larger was the low-end market to capture.23
VI. CONCLUSION AND POLICY IMPLICATIONS
The economic impact of counterfeits is an urgent concern forbusiness managers and policy makers. In this paper, I collect paneldata on Chinese shoe companies to investigate the pricing andmarketing impacts of counterfeit entry. In particular, I identifyan exogenous change in government enforcement efforts to moni-tor footwear trademarks, occurring since 1995, and its differentialimpacts on counterfeit entry for branded companies with varyingdegrees of closeness with the government. Using the interactionbetween legislation change and the relationship proxy as an IV,I obtain empirical results that are robust across various specifi-cations and consistent with theory predictions. To my knowledge,this study is the first attempt to combine theory and empirics tounveil the economics of counterfeits.
My analysis shows that counterfeit entry may exert down-ward pressure on prices by lowering expected quality in the shortrun. More importantly, however, counterfeit entry also stimulates
23. Finally, there are other notable differences between generic drugs andcounterfeit products. First, the pharmaceutical market has complicated demandstructures. Typically, doctors who prescribe medicine do not directly pay for it, andstudies show that doctors tend to prescribe branded drugs even when generics areavailable. The health care system further makes drug demand inelastic. This is notthe case in other industries. Second, the vast majority of Chinese consumers arevery price-sensitive because their income level (in PPP terms) is lower than that ofthe Americans. The switch by these consumers to purchasing counterfeits thus low-ers the possibility of charging a higher authentic price within the market. Third,generic drugs can be considered perfect substitutes for branded drugs in terms offunctionality or quality, but this is not usually true with counterfeits. This lastpoint goes back to the key difference between counterfeits and generic/imitativegoods—the intent to deceive, which creates asymmetric information.

IMPACTS OF ENTRY BY COUNTERFEITERS 1607
the original producer to offer a higher quality product at a higherprice. This suggests innovation as a successful business strategyto mitigate copycat competition. In addition, counterfeit entry in-duces authentic companies to invest in self-enforcement activitiesand downstream vertical integration. I show that company-levelenforcement activities and licensed company stores are ways todeter counterfeit entry or to reduce counterfeit sales. As a re-sult of these costly differentiation strategies or ESC, authenticprices rise two and three years after counterfeit entry. It is alsointeresting to note empirically that companies with a worse re-lationship with the government experience more counterfeitinginfringements. This alludes to another strategy against counter-feits, especially in countries like China: Foster a good relationshipwith the government.
My empirical findings have rich implications for IPR policies.Public enforcement efforts tend to outperform private ones in lightof the fact that, after the loosening of government enforcement,authentic companies have to tolerate a higher level of counterfeit-ing even after implementing a set of business strategies againstcounterfeits.24 The fact that authentic companies innovated afterthe government loosened enforcement indicates that stronger IPRis not a necessary condition for innovation. This finding, there-fore, complements previous research on IPR, which shows thatstronger IPR is not a sufficient condition for innovation (Schererand Weisburst 1995; Sakakibara and Branstetter 1999; Bessenand Maskin 2000; Qian 2007). The findings point to the possibil-ity of an optimal level of IPR protection (Gallini 1992; Qian 2007).This optimum may vary from sector to sector.
This study also lends general guidance to other possible publicpolicy interventions that may be useful for combating counterfeits.Because both empirical findings25 and theory illustrate the impor-tance of information in ameliorating counterfeit impact, leverag-ing both the government’s authority and the authentic companies’techniques of distinguishing product authenticity can be helpfulin disseminating information and deterring counterfeits. In fact,starting from the year 2006, the Chinese government has initiated
24. The importance of government enforcement is also reflected through thefact that the seven safety sectors stayed clear of major accidents during thoseyears when they were monitored under high priority. Speculating from this factand the observation that the footwear industry witnessed innovation and moreproduct variety, the reallocation of government resources in 1995 may have beenwise.
25. See Section IV.B on the interpretation of company-age coefficients.

1608 QUARTERLY JOURNAL OF ECONOMICS
multiple television programs to broadcast new efforts and casesto combat counterfeiters and educate citizens on how to detectvarious counterfeits. The Chinese education system has also in-troduced IPR knowledge into textbooks to help the younger gener-ation recognize that counterfeiting is illegal and shameful. Theseare efforts both to solve the asymmetric information problem andto eliminate the market for counterfeits in the long run.
This paper is a first step in exploring the complex impactsof counterfeits. Although the current analysis sheds light on adiverse set of business strategies and policies against counterfeit-ing, there may be others that are not explored here due to datalimitations. Obtaining parallel and more detailed data from othersectors and countries remains an important challenge.
KELLOGG SCHOOL OF MANAGEMENT, NORTHWESTERN UNIVERSITY
REFERENCES
Aghion, Philippe, Nick Bloom, Richard Blundell, Rachel Griffith, and Peter Howitt,“Competition and Innovation: An Inverted U Relationship,” Quarterly Journalof Economics, 120 (2005), 701–728.
American Apparel and Footwear Association, ShoeStats (2005).Athey, Susan, and Armin Schmutzler, “Investment and Market Dominance,”
RAND Journal of Economics, 32 (2001), 1–26.Bagwell, Kyle, and M. H. Riordan, “High and Declining Prices Signal Product
Quality,” American Economic Review, 81 (1991), 224–239.Batra, G., Daniel Kaufmann, and Andrew H. W. Stone, Investment Climate Around
the World: Voices of the Firms from the World Business Environment Survey(Washington, DC: World Bank Publications, 2003).
Bessen, Jim, and Eric Maskin, “Sequential Innovation, Patents, and Imitation,”Department of Economics, Massachusetts Institute of Technology WorkingPaper No. 00-01, 2000.
Branstetter, Lee, Raymond Fisman, and Charles F. Foley, “Do Stronger Intellec-tual Property Rights Increase International Technology Transfer?” QuarterlyJournal of Economics, 121 (2006), 321–349.
Bresnahan, Timothy, “Empirical Methods for Industries with Market Power,”in Handbook of Industrial Organization, Vol. II, Richard Schmalensee andRobert Willig, eds. (Amsterdam: Elsevier Science Publishers B.V., 1989).
Curry, D. J., and P. C. Riesz, “ Prices and Price/Quality Relationships: A Longitu-dinal Analysis,” Journal of Marketing, 52 (1988), 36–51.
Darby, M., and E. Karni, “Free Competition and the Optimal Amount of Fraud,”Journal of Law and Economics, 16 (1973), 67–88.
Ellickson, Paul, “Supermarkets as a Natural Oligopoly,” Working Paper(http://www.econ.duke.edu/paule/SupermarketsAsNO.pdf), 2004.
Fisman, Raymond, “Estimating the Value of Political Connections,” American Eco-nomic Review, 91 (2001), 1095–1102.
Frank, Richard G., and D. S. Salkever, “Generic Entry and the Pricing of Pharma-ceuticals,” Journal of Economics & Management Strategy, 6 (1997), 75–90.
Gabszewicz, J., and J.-F. Thisse, “Price Competition, Quality and Income Dispari-ties,” Journal of Economic Theory, 20 (1979), 340–359.
——, “Entry (and Exit) in a Differentiated Industry,” Journal of Economic Theory,22 (1980), 327–338.

IMPACTS OF ENTRY BY COUNTERFEITERS 1609
Gallini, Nancy, “Patent Policy and Costly Imitation,” Rand Journal of Economics,23 (1992), 52–63.
Gans, Joshua, David Hsu, and Scott Stern, “The Impact of Uncertain IP Rightson the Market for Ideas: Evidence from Patent Grant Delays,” mimeo, North-western University, 2003.
Jaffe, Adam, and Josh Lerner, Innovation and Its Discontents (Princeton, NJ:Princeton University Press, 2004).
Khwaja, Asim I., and Atif Mian, “Do Lenders Favor Politically Connected Firms?Rent Provision in an Emerging Financial Market,” Quarterly Journal of Eco-nomics, 120 (2005), 1371–1411.
Kortum, Samuel, and Josh Lerner, “Stronger Protection or Technological Revo-lution: What Is behind the Recent Surge in Patenting?” Carnegie-RochesterConference Series on Public Policy, 48 (1998), 247–304.
Lanjouw, Jean, and Iain Cockburn, “New Pills for Poor People? Empirical Evidenceafter GATT,” World Development, 29 (2001), 265–289.
Levitt, Steve, and S. Venkatesh, “An Economic Analysis of a Drug-Selling Gang’sFinances,” Quarterly Journal of Economics, 115 (2000), 755–789.
McCalman, Phillip, “Reaping What You Sow: An Empirical Analysis of Interna-tional Patent Harmonization,” Journal of International Economics, 55 (2001),161–186.
Metrick, Andrew, and Richard Zeckhauser, “Price versus Quantity: Market-Clearing Mechanisms When Consumers Are Uncertain about Quality,” Jour-nal of Risk and Uncertainty, 17 (1999), 215–242.
Milgrom, Paul, and J. Roberts, “Price and Advertising Signals of Product Quality,”Journal of Political Economy, 94 (1986), 796–821.
Mobarak, A. M., and D. P. Purbasari, “Corrupt Protection for Sale to Firms: Evi-dence from Indonesia,” Colorado University Working Paper, 2006.
Moser, Petra, “How Do Patent Laws Influence Innovation? Evidence fromNineteenth-Century World Fairs,” NBER Working Paper 9909, 2003.
Nelson, P., “Advertising as Information,” Journal of Political Economy, 82 (1974),729–754.
Qian, Yi, “Pricing and Marketing Impacts of Entry by Counterfeiters and Imita-tors,” Harvard University Working Paper, http://www.nber.org/∼yiqian/, 2006.
——, “Do National Patent Laws Stimulate Domestic Innovation in a Global Patent-ing Environment? A Cross-Country Analysis of Pharmaceutical Patent Pro-tection: 1978–2002,” Review of Economics and Statistics, 89 (2007), 436–453.
——, “Are Intellectual Property Rights the Blossoming Rain?—Evidences from In-novations, Technology Transfer, and International Trade,” forthcoming in TheDevelopment Agenda: Global Intellectual Property and Developing Countries,Neil Netanel, ed. (London: Oxford University Press, 2008).
Qian, Yi, and Hui Xie, “Bayesian Inference in a Simultaneous Equation Model withRandom Changepoints,” Northwestern University and University of IllinoisWorking Paper, 2007.
Quality and Technology Supervision Bureau of China (also named “General Ad-ministration of Quality Supervision, Inspection and Quarantine”), Year Books(1991–2004).
——, Guidelines for ISO Applications and Frequently Asked Questions (2000).Sakakibara, Mariko, and Lee Branstetter, “Do Stronger Patents Induce More In-
novation? Evidence from the 1988 Japanese Patent Law Reforms,” NBERWorking Paper 7066, 1999.
Scherer, Fred M., and S. Weisburst, “Economic Effects of Strengthening Pharma-ceutical Patent Protection in Italy,” International Review of Industrial Prop-erty and Copyright Law 26 (1995), 1009–1024.
Shaked, A., and John Sutton, “Natural Oligopolies,” Econometrica, 51 (1983),1469–1483.
Sutton, John, Sunk Costs and Market Structure: Price Competition, Advertising,and the Evolution of Concentration (Cambridge, MA: The MIT Press, 1991).
World Customs Organization, “Counterfeiting Congress Calls for Public-PrivateCooperation” (http://www.wcoomd.org/ie/En/Press/press.html), May 25, 2004.