impacts, maintenance and sustainability of irrigation in ...€¦ · this report comprises...
TRANSCRIPT

Impact Evaluation Report 112
Esdras ByiringoMaria JonesFlorence KondylisJohn LoeserJeremy MagruderChristophe Ndahimana
Agriculture, fishing and forestry
Impacts, maintenance and sustainability of irrigation in Rwanda March 2020

About 3ie
The International Initiative for Impact Evaluation (3ie) promotes evidence-informed, equitable, inclusive and sustainable development. We support the generation and effective use of high-quality evidence to inform decision-making and improve the lives of people living in poverty in low- and middle-income countries. We provide guidance and support to produce, synthesise and quality assure evidence of what works, for whom, how, why and at what cost.
3ie impact evaluations
3ie-supported impact evaluations assess the difference a development intervention has made to social and economic outcomes. 3ie is committed to funding rigorous evaluations that include a theory-based design and that use the most appropriate mix of methods to capture outcomes and are useful in complex development contexts.
About this report
3ie accepted the final version of the report, Impacts, maintenance and sustainability of irrigation in Rwanda, as partial fulfilment of requirements under grant DPW1.1085 awarded through Development Priorities Window 1. The report is technically sound and 3ie is making it available to the public in this final report version as it was received. No further work has been done.
The 3ie technical quality assurance team for this report comprises Rosaine Yegbemey, Deeksha Ahuja, Sayak Khatua, Marie Gaarder, an anonymous external impact evaluation design expert reviewer and an anonymous external sector expert reviewer, with overall technical supervision by Marie Gaarder. The 3ie editorial production team for this report comprises Anushruti Ganguly and Akarsh Gupta.
All of the content is the sole responsibility of the authors and does not represent the opinions of 3ie, its donors or its board of commissioners. Any errors and omissions are also the sole responsibility of the authors. All affiliations of the authors listed in the title page are those that were in effect at the time the report was accepted. Please direct any comments or queries to the corresponding author, Jeremy Magruder at: [email protected].
Funding for this impact evaluation was provided by UK aid through the Department for International Development. A complete listing of all of 3ie’s donors is available on the 3ie website.
Suggested citation: Byiringo, E, Jones M, Kondylis F, Loeser J, Magruder, J and Ndahimana, C, 2020. Impacts, maintenance and sustainability of irrigation in Rwanda, 3ie Impact Evaluation Report 112. New Delhi: International Initiative for Impact Evaluation (3ie). Available at: https://doi.org/10.23846/DPW1IE112
Cover photo: Rwanda Green Fund / Flickr
© International Initiative for Impact Evaluation (3ie), 2020

Impacts, maintenance and sustainability of irrigation in Rwanda
Esdras Byiringo World Bank, Rwanda
Maria Jones World Bank, Washington DC Florence Kondylis World Bank, Washington DC John Loeser World Bank, Washington DC Jeremy Magruder University of California, Berkeley Christophe Ndahimana World Bank, Rwanda
Impact Evaluation Report 112
March 2020
i
Acknowledgements
We thank Emanuele Brancati and Guillaume Gatera for superb field coordination and Roshni Khincha for excellent research assistance. We are grateful to the Ministry of Agriculture and Animal Resources in Rwanda and the staff from the Land Husbandry, Water Harvesting, and Hillside Irrigation Project for their leadership in this work. Innovations for Poverty Action deserve recognition for excellent implementation of all data collection and field activities. We thank 3ie for funding, technical review, and support throughout the study. The European Union, the International Growth Centre (IGC) and the i2i Trust Fund for Impact Evaluation also provided generous funding. This research would not have been possible without support from DIME.

ii
Summary
The following report summarizes results from the Impacts and Sustainability of Irrigation in Rwanda study, conducted between 2014 and 2019. The impact evaluation is a collaboration between the Ministry of Agriculture and Animal Resources in Rwanda (MINAGRI), the World Bank’s Development Impact Evaluation (DIME), and the University of California – Berkeley. We examine the impacts of irrigation on smallholder welfare, through the lens of the Land Husbandry, Water Harvesting and Hillside Irrigation (LWH) project, a flagship of MINAGRI. LWH introduces sustainable land husbandry measures for hillside agriculture on selected sites and develops hillside irrigation for subsections of each site.
Irrigation investments create significant economic development opportunities for smallholder farmers who otherwise depend on rainfed agriculture, by increasing yields, adding additional cultivating seasons, and reducing risk. The key evaluation question for this study is: what are the impacts of irrigation on smallholder welfare? Specifically, we examine impacts of large-scale irrigation on yields, cropping and input choices, expenditures, labor supply and employment, land sales and rentals, migration, and whether those impacts differ by gender.
The irrigation study context consists of 4 LWH hillside irrigation schemes and their surrounding terraced land across 5 districts of Rwanda. The study is based on 4 waves of primary data collection across four years following construction of the irrigation infrastructure. We use Spatial Regression Discontinuity analysis to capture the effects of irrigation. In our baseline, collected when only a limited fraction of study sites had access to water, we find balance in household characteristics and modest relationships between irrigation and farm practices, consistent with the limited access to irrigation at that time. Our primary findings are based on the discontinuity in access to water in our follow-up surveys. Over the three years of full irrigation access in our follow-up surveys, we find that irrigation has large, positive welfare impacts for smallholders. However, adoption is inefficiently low, constrained by labor market failures.
The key results from the study are: Hillside irrigation increases smallholder yields and cash profits by 70%.
Horticultural crops are much higher value than staple crops and shifting production decisions increases returns. Dry season yields are 90% higher for plots in the command area, compared to plots outside. Profits increase by 400,000 RWF/ha (approximately $435/ha) on irrigated plots.
Hillside irrigation primarily impacts dry season cultivation 1 in 4 plots in the irrigation schemes are irrigated in the dry season, compared to only 1 in 20 plots outside the scheme. In the rainy season, irrigation usage is much lower on all plots. Access to irrigation does not increase the likelihood a plot is cultivated during the dry season; however, it does significantly shift which crops are cultivated.
Farmers with access to irrigation are much more likely to grow horticultural crops Nearly all irrigated plots are used for horticulture. In the dry season, plots in the irrigation scheme are 4 times more likely to be used for horticulture than plots

iii
outside. In the rainy season, irrigation is nearly 2 times more likely for plots in the schemes. Horticulture replaces production of staple crops such as bananas.
Despite potential profitability, adoption is partial: only 1 in 4 plots are irrigated Moreover, adoption has not increased over time; 2-4 years after the schemes came online dry season cultivation has remained constant at about 25%. If all plots in the irrigation schemes were irrigated, welfare impacts would be 2-3 times higher.
Labor market failures are a key constraint to adoption Most households rely on their own labor for agriculture. However, horticultural production is significantly more labor-intensive than staple production. Thin labor markets present a significant barrier to wider adoption.
In the early irrigation schemes, we implement 3 randomized control trials to document the impact of complementary interventions that have the potential to increase the returns and sustainability of irrigation. The complementary RCTS answer the following questions:
1. Do self-demonstration kits increase farmers’ propensity to experiment with new high-value crops and long-run use of the irrigation infrastructure?
2. What is the impact of escalating irrigation fees on farmer behavior? Will a short window of subsidized fees will induce farmers to experiment with high-value crops?
3. Does the placement of a monitor within the irrigation scheme affect resource sharing? We will measure the impact of empowering any monitor within a WUG, and of imposing that the monitor cultivates a plot in the area most likely to be harmed by overuse of water.
We do not find significant impacts from the various trials. Instead, our analysis reveals that factor markets failures, particularly thin land and labor markets, are the operative constraint for adoption of irrigation. The study shows that smaller households are less likely than large households to irrigate multiple plots, implying smaller households are not able to meet labor demands.

iv
Contents Acknowledgements ........................................................................................................ i Summary ........................................................................................................................ ii List of figures and tables .............................................................................................. v Acronyms ..................................................................................................................... vi 1. Introduction ............................................................................................................... 1 2. Intervention ................................................................................................................ 2
2.1 Description ............................................................................................................ 2 2.2 Theory of Change ................................................................................................. 5 2.3 Intervention monitoring plan .................................................................................. 7
3. Evaluation questions, design, methods, sampling and data collection ................ 8 3.1 Primary and secondary evaluation questions ......................................................... 8 3.2 Evaluation design and methods ............................................................................ 9 3.3 Power calculations .............................................................................................. 11 3.4 Follow up qualitative work ................................................................................... 12 3.5 Timeline .............................................................................................................. 13 3.6 Ethics .................................................................................................................. 13 3.7 Sampling and data collection............................................................................... 14 3.8 Specifications ...................................................................................................... 17
4. Findings ................................................................................................................... 19 4.1 Intervention implementation fidelity ..................................................................... 19 4.2 Descriptive statistics and balance ....................................................................... 19 4.3 Impact analyses .................................................................................................. 21 4.4 Heterogeneity of impacts ..................................................................................... 23 4.5 Follow up qualitative work ................................................................................... 23
5. Cost analysis ........................................................................................................... 23 6. Discussion ............................................................................................................... 24
6.1 Introduction ......................................................................................................... 24 6.2 Policy and program relevance: evidence uptake and use .................................... 25 6.3 Challenges and lessons ...................................................................................... 26
7. Conclusions and recommendations ...................................................................... 27 Online appendixes ...................................................................................................... 28 References ................................................................................................................... 30
v
List of figures and tables
Figure 1: An image of the Karongi 12 site ........................................................................ 4 Figure 2: Theory of change ............................................................................................. 5 Figure 3: Study Timeline ............................................................................................... 13 Figure 4: Sample plots in relation to irrigation canal ...................................................... 15 Figure 5: Excerpt from LWH project document indicating long run nature of project ...... 24 Figure 6: Reference to study in SAIP project document ................................................ 26 Table 1: Canal details ...................................................................................................... 3 Table 2: Composition of agricultural minikits.................................................................... 9 Table 3: Fee schedules ................................................................................................. 10 Table 4: Overlap of samples across interventions ......................................................... 11 Table 4: Power calculations ........................................................................................... 12 Table 5: Distribution of sample plots .............................................................................. 15 Table 6: Baseline survey modules ................................................................................. 16 Table 7: Indicators of interest ........................................................................................ 17

vi
Acronyms
CA Command Area
CAC Command Area Catchment
GoR Government of Rwanda
IE Impact Evaluation
LWH Land Husbandry, Water Harvesting and Hillside Irrigation Project
MINAGRI Rwandan Ministry of Agriculture
MINECOFIN Rwandan Ministry of Finance
O&M Operations and Maintenance
RCT Randomized controlled trial
SPIU MINAGRI’s Special Project Implementation Unit
SPRD Spatial Regression Discontinuity Analysis
SWAP Sector Wide APproach
WUG Water User Group
17A Agricultural season running from September 2016 – February 2017
17B Agricultural season running from February 2017 – June 2017
17C Agricultural season running from June 2017 – September 2017
18A Agricultural season running from September 2017 – February 2018
18B Agricultural season running from February 2018 – June 2018
18C Agricultural season running from June 2018 – September 2018

1
1. Introduction
The Government of Rwanda (GoR) considers agriculture an engine for the economy (cf. Rwanda Vision 2020; Rwanda’s Economic Development and Poverty Reduction Strategy) and aims to reduce poverty and achieve food security through commercialized and professional agriculture. This calls for improved and sustainable productivity. The LWH is a flagship project of the Ministry of Agriculture designed to meet this objective through a modified watershed approach. It introduces sustainable land husbandry measures for hillside agriculture on selected sites and develops hillside irrigation for subsections of each site. Our study context consists of 4 such hillside irrigation schemes and their surrounding terraced land across 5 districts of Rwanda.
Irrigation investments have enormous potential to improve the lives of smallholder farmers in the Rwandan context. Rainfed irrigation in and around these sites is seasonal, with three potential seasons per year. During the main rainy season (“Rainy 1''; September - January), rainfall is sufficient for production in most years. In the second rainy season (“Rainy 2''; February - May), rainfall is sufficient in an average year but insufficient in dry years. In the dry season (“Dry''; June - August), rainfall is insufficient for agricultural production for seasonal crops. Absent irrigation, agricultural production in these sites consists of a mix of staples (primarily maize and beans) which are cultivated seasonally and primarily consumed by the cultivator, as well as perennial bananas which are sold commercially. Absent irrigation, therefore, most farmers adopt either a rotation of staples, fallowing land in the dry season, or cultivate bananas.
The research team has strong reasons to expect results from this impact evaluation program to have deep policy impacts. MINAGRI has ambitious expansion and scale-up plans for hillside irrigation: between 2014 and 17, the ministry planned to invest in 9,392 ha of hillside irrigation, accelerating in 2017/20 to 15,300 ha. Hence, the lessons learned from LWH have the potential to affect both ongoing and future investments. In addition, this study builds on DIME’s ongoing program of impact evaluation with MINAGRI. As such, MINAGRI is an informed consumer of IE, and has a demonstrated commitment to using impact evaluation results to inform policy design and scale-up.
The study also has the potential for broader policy impacts, as irrigation is a priority for the region. As of 2010, only 6% of total cultivated area in Africa was irrigated; all other production was rainfed (IFPRI 2010). This impact evaluation will contribute data on the returns to hillside irrigation and lessons for scheme management, critical to informing the discussion on how to smartly invest in irrigation infrastructure to boost agricultural productivity and manage increasing climate variability. Irrigation investments are costly, and many have failed in the past to deliver the anticipated benefits. Many schemes fail for lack of collective action over basic maintenance issues, absence of a coordination mechanism to allocate water across users in the system, or for lack of adoption of a higher-value crop.
We build on a literature that studies the role of different governance structures in achieving public good provision (Alesina, Baqir, and Easterly 2000; Galliani, Gertler, and Schargrodsky 2005; Glennerster, Miguel, and Rothenberg 2013). Our contribution includes the randomized design, and the fact that we carefully measure an important, homogeneous public good with nearby natural variations in the underlying governance

2
structure across contiguous plots. To our knowledge, this is the first study to use a natural experiment to estimate the returns to irrigation in sub-Saharan Africa, Existing work that estimates the returns to irrigation using natural experiments is predominantly from groundwater irrigation in South Asia, leveraging variation in slope characteristics of river basins (Duflo and Pande 2007), aquifer characteristics (Sekhri 2014), or well-failures (Jacoby 2017) for identification. Estimates of the return to irrigation in Africa include Dillon (2011). While there is some evidence of the returns to irrigation in the literature (see surveys in Hussain and Hanjra 2004; Dayton-Johnson 2000; Dillon and Fishman 2019), our identification strategy relies on weaker assumptions to identify the effects of irrigation than have typically been available. Dillon and Fishman (2019) comment specifically on the scarcity of impact assessment estimates of irrigation: they note “Measuring the direct and spillover benefits and costs of dams is econometrically challenging. Impact assessments from observational data that address sources of selection bias are remarkably scarce.”
In addition, we contribute to the recent literature on technology adoption, which suggests moving away from traditional extension models and taking advantage of peer-to-peer learning and learning-by-doing (e.g. Kondylis, Mueller, and Zhu 2014; BenYishay and Mobarak 2015; Jones, Kondylis, Mobarak & Stein 2019). We provide further insights by rigorously testing self-demonstration in lieu of traditional demonstration plots.
The impact evaluation report proceeds as follows: Section 2 describes the context we study, the theory of change, and the intervention monitoring plan. Section 3 details the main evaluation questions, the study timeline, our sources of data and the model specifications. Section 4 presents the findings from the study. Section 5 provides a cost analysis, and section 6 discusses results. We conclude in Section 7.
2. Intervention
2.1 Description
We study 4 hillside irrigation schemes: Nyanza, Karongi 12, Karongi 13, and Rwamagana. Table 1 below provides details about these sites. Rainfed agriculture in and around these sites is seasonal, with three potential agricultural seasons per year. During the main rainy season (“Rainy 1”; September - January), rainfall is sufficient for all agricultural production in most years. In the second rainy season (“Rainy 2”; February - May), rainfall is sufficient in an average year but insufficient in dry years. In the dry season (“Dry”; June - August), rainfall is insufficient for production of seasonal crops. Absent irrigation, agricultural production in these sites consists of a mix of staples (primarily maize and beans), cultivated in the rainy seasons and primarily consumed by the cultivator; and bananas, which are cultivated perennially and sold commercially.1 Absent irrigation, therefore, most farmers adopt either a rotation of staples, fallowing land in the dry season, or cultivate bananas.
1 Staple rotations also include smaller amounts of sorghum and tubers. There is also some perennial cultivation of cassava and other minor crops. In our data, maize, beans, or bananas are the main crop for 85% of plots, excluding horticultural production.
3
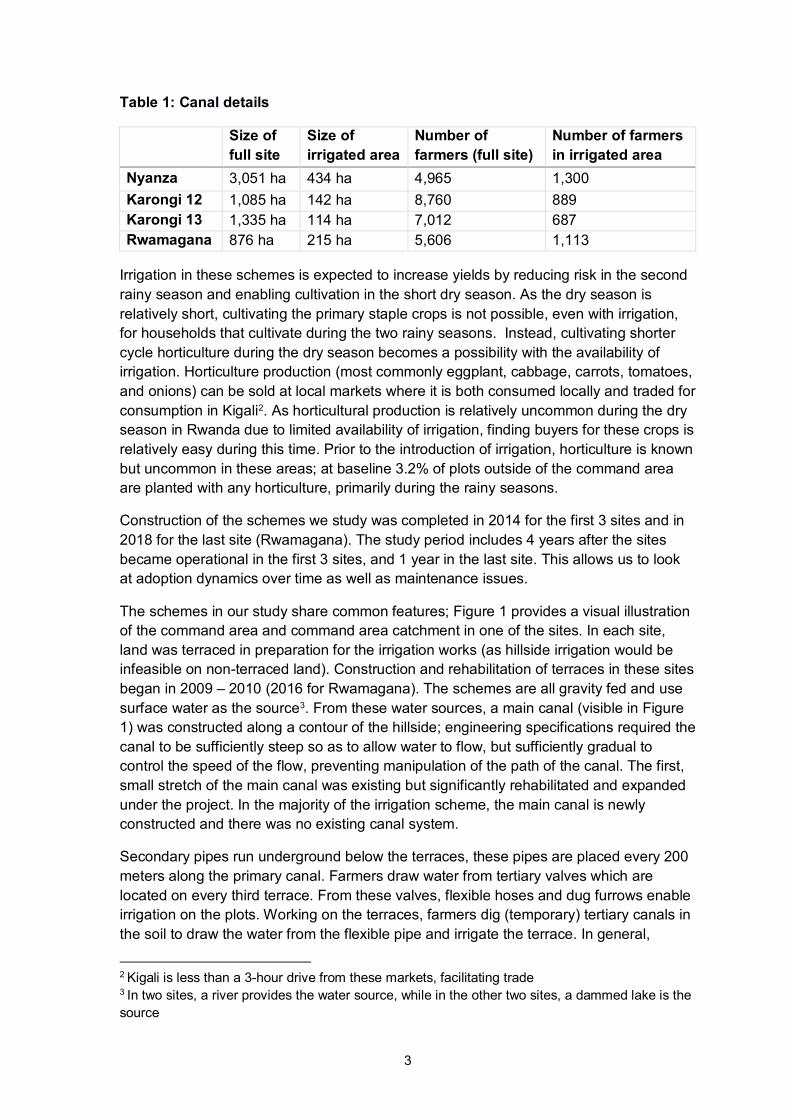
Table 1: Canal details
Size of full site
Size of irrigated area
Number of farmers (full site)
Number of farmers in irrigated area
Nyanza 3,051 ha 434 ha 4,965 1,300 Karongi 12 1,085 ha 142 ha 8,760 889 Karongi 13 1,335 ha 114 ha 7,012 687 Rwamagana 876 ha 215 ha 5,606 1,113
Irrigation in these schemes is expected to increase yields by reducing risk in the second rainy season and enabling cultivation in the short dry season. As the dry season is relatively short, cultivating the primary staple crops is not possible, even with irrigation, for households that cultivate during the two rainy seasons. Instead, cultivating shorter cycle horticulture during the dry season becomes a possibility with the availability of irrigation. Horticulture production (most commonly eggplant, cabbage, carrots, tomatoes, and onions) can be sold at local markets where it is both consumed locally and traded for consumption in Kigali2. As horticultural production is relatively uncommon during the dry season in Rwanda due to limited availability of irrigation, finding buyers for these crops is relatively easy during this time. Prior to the introduction of irrigation, horticulture is known but uncommon in these areas; at baseline 3.2% of plots outside of the command area are planted with any horticulture, primarily during the rainy seasons.
Construction of the schemes we study was completed in 2014 for the first 3 sites and in 2018 for the last site (Rwamagana). The study period includes 4 years after the sites became operational in the first 3 sites, and 1 year in the last site. This allows us to look at adoption dynamics over time as well as maintenance issues.
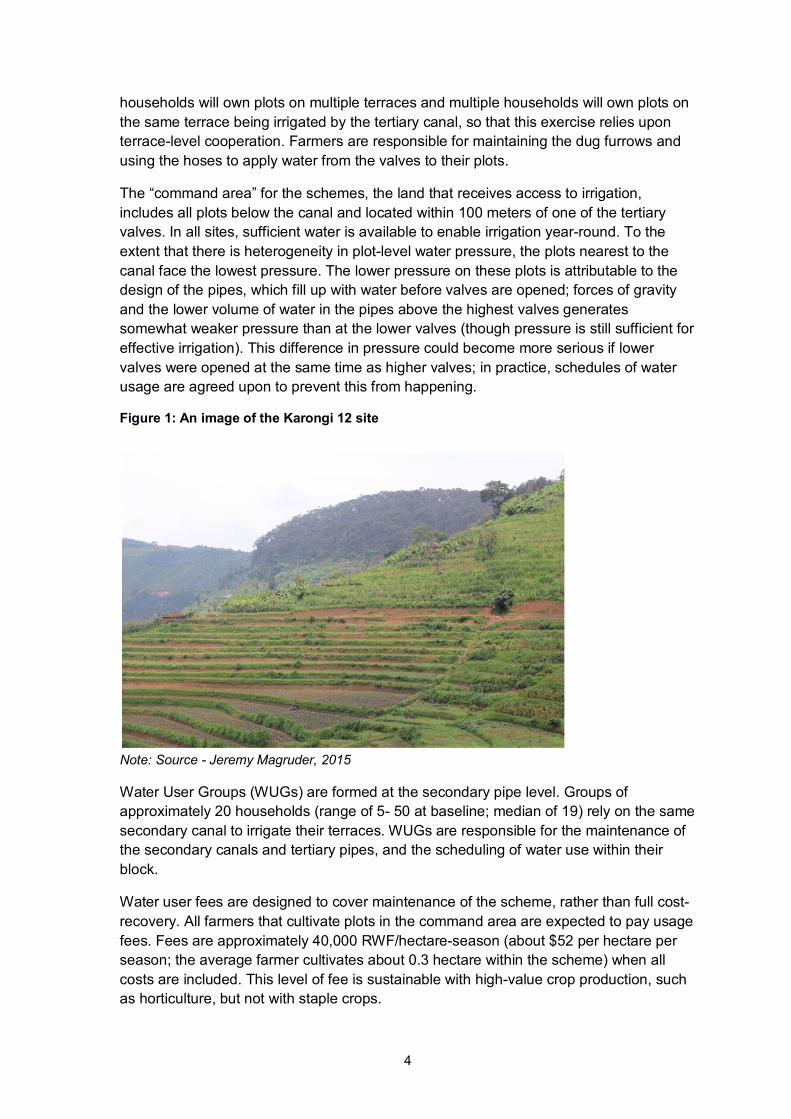
The schemes in our study share common features; Figure 1 provides a visual illustration of the command area and command area catchment in one of the sites. In each site, land was terraced in preparation for the irrigation works (as hillside irrigation would be infeasible on non-terraced land). Construction and rehabilitation of terraces in these sites began in 2009 – 2010 (2016 for Rwamagana). The schemes are all gravity fed and use surface water as the source3. From these water sources, a main canal (visible in Figure 1) was constructed along a contour of the hillside; engineering specifications required the canal to be sufficiently steep so as to allow water to flow, but sufficiently gradual to control the speed of the flow, preventing manipulation of the path of the canal. The first, small stretch of the main canal was existing but significantly rehabilitated and expanded under the project. In the majority of the irrigation scheme, the main canal is newly constructed and there was no existing canal system.
Secondary pipes run underground below the terraces, these pipes are placed every 200 meters along the primary canal. Farmers draw water from tertiary valves which are located on every third terrace. From these valves, flexible hoses and dug furrows enable irrigation on the plots. Working on the terraces, farmers dig (temporary) tertiary canals in the soil to draw the water from the flexible pipe and irrigate the terrace. In general,
2 Kigali is less than a 3-hour drive from these markets, facilitating trade
3 In two sites, a river provides the water source, while in the other two sites, a dammed lake is the source
4
households will own plots on multiple terraces and multiple households will own plots on the same terrace being irrigated by the tertiary canal, so that this exercise relies upon terrace-level cooperation. Farmers are responsible for maintaining the dug furrows and using the hoses to apply water from the valves to their plots.
The “command area” for the schemes, the land that receives access to irrigation, includes all plots below the canal and located within 100 meters of one of the tertiary valves. In all sites, sufficient water is available to enable irrigation year-round. To the extent that there is heterogeneity in plot-level water pressure, the plots nearest to the canal face the lowest pressure. The lower pressure on these plots is attributable to the design of the pipes, which fill up with water before valves are opened; forces of gravity and the lower volume of water in the pipes above the highest valves generates somewhat weaker pressure than at the lower valves (though pressure is still sufficient for effective irrigation). This difference in pressure could become more serious if lower valves were opened at the same time as higher valves; in practice, schedules of water usage are agreed upon to prevent this from happening.
Figure 1: An image of the Karongi 12 site
Note: Source - Jeremy Magruder, 2015
Water User Groups (WUGs) are formed at the secondary pipe level. Groups of approximately 20 households (range of 5- 50 at baseline; median of 19) rely on the same secondary canal to irrigate their terraces. WUGs are responsible for the maintenance of the secondary canals and tertiary pipes, and the scheduling of water use within their block.
Water user fees are designed to cover maintenance of the scheme, rather than full cost-recovery. All farmers that cultivate plots in the command area are expected to pay usage fees. Fees are approximately 40,000 RWF/hectare-season (about $52 per hectare per season; the average farmer cultivates about 0.3 hectare within the scheme) when all costs are included. This level of fee is sustainable with high-value crop production, such as horticulture, but not with staple crops.

5
2.2 Theory of Change
Figure 2 below presents a simplified theory of change behind the interventions to be evaluated, including its main components/inputs, activities, outputs, and the hypothesized causal chain to select outcomes of interest.
Figure 2: Theory of change
The theory of change is that irrigation access and experimentation with high-value crops create a virtuous cycle: productivity improves as farmers learn how to cultivate high-value crops; farmers use the irrigation system, and pay the requisite water user fee, because it is necessary for cultivation of high-value crops; and farmers properly use and maintain the irrigation system because their profitable production becomes dependent on it. Additionally, this constant use of the irrigation system allows LWH to collect enough fees to make the irrigation scheme sustainable.
In the study area, the relevant high-value crops are horticultural crops, most commonly eggplant, cabbage, carrots, tomatoes, and onions. These can be sold at local markets; they are both consumed locally and traded for consumption in Kigali. Horticultural crops have a sufficiently short cropping cycle to allow for cultivation in the relatively short “Dry” season, unlike staple crops.
There are two main assumptions behind the theory of change.

6
First, we postulate that farmers cannot afford the water usage fees (which cover the costs of maintaining the infrastructure) while cultivating traditional crops but can while cultivating high-value crops, such as horticulture. This is confirmed both by numbers from a crop model used by our partner organization, LWH, and in data from our baseline, in which observed horticultural revenue per hectare is double or more revenue from traditional crops. Access to irrigation infrastructure enables off-season cultivation of high-value crops and reduces the yield risk associated with cultivating high-value crops the rest of the year. At baseline, very few of the sampled farmers used any type of irrigation on any of their plots, and as a result few commercially cultivate high-value crops. Farmers may not experiment with adoption of high-value crops if the gains from adoption are not clear. Compared to staple crop production, horticulture is more input-intensive and requires more market access. If access to inputs is a binding constraint to initial experimentation with horticulture; reducing that constraint could catalyze the virtuous cycle of high-value production and irrigation described in the main theory of change.
Second, we assume that the irrigation infrastructure cannot add value unless farmers coordinate both their usage of the irrigation water (operations) and contribute to maintaining the public good, while adopting high-value crops. WUGs have been organized to monitor and coordinate O&M. O&M will not occur in the absence of a switch to high-value crops, as irrigation does not add value in cultivation of traditional crops in the irrigation sites we study. Moreover, even under adoption of high-value crops, incentives to coordinate vary within the water user group. Farmers with tertiary valves near the bottom of their secondary pipe can use water even when other farmers are using their tertiary valves, while the reverse is not true, and as a result, farmers near the bottom have no private incentive to coordinate operations. For instance, farmers with plots furthest from the secondary pipe need the furrows which carry water from the tertiary valves to their plot to be properly maintained, or else they cannot use the water.
Within 3 of the 4 irrigation schemes, we ran three experiments that target these causal pathways at the inputs stage. First, we give some farmers agricultural minikits to experiment with high-value horticultural crops. These minikits include small quantities of inputs for cultivation of high-value crops on a small plot of land. Additionally, we provide them to farmers before the off season, enabling low-cost experimentation with cultivating high-value crops using the irrigation infrastructure in the newly added season. Second, we vary the season in which farmers begin to pay water usage fees, delaying the first season of payments one or two seasons for some farmers. Third, we randomize how monitors are chosen within water user group and whether these monitors have incentives to ensure optimal operations and maintenance activities. The monitor are either an employee of LWH, appointed by the water user group, or appointed by the water user group with the spot reserved for a farmer with plots near the top of their secondary pipe (the farmers near the top are most negatively impacting by over-use of water).
We can now fit these interventions into the theory of change. Agricultural minikits reduce the cost of experimentation with high-value crops. Experimentation and eventually cultivation at scale of high-value crops is only possible while the irrigation system is properly maintained and used, since the high-value crops are more dependent on access to water than traditional crops. Delaying implementation of fees reduces the riskiness of experimentation, but also weakens the push for farmers to adopt high-value

7
crops. Common-pool resources are subject to overuse; farmers who are most negatively impacted by collective action failures may be the most effective monitors. By targeting all these barriers to adoption simultaneously, we can move households in the irrigation schemes into a new equilibrium where the irrigation infrastructure is actively used to cultivate high-value crops year-round, significantly increasing profits for these households.
2.3 Intervention monitoring plan
2.3.1 Monitoring RCT implementation and compliance Minikits experiment: Mini-kits were allocated through a lottery in the field, which was monitored by representatives from the research team. From January-February 2017, we conducted an on-farm monitoring survey among the treated households of the demonstration kits intervention, to collect data on the experience with the horticultural crop included in the mini-kit. Our sample was composed of 427 households (number of households that collected the mini-kit), and we managed to interview 391, or a response rate of 91.57%. We confirmed that the household received the mini-kit, what was included in the package, and whether the seeds were planted and, if not, the reason why.
Subsidies experiment: Water fee subsidies were allocated through a lottery in the field, which was monitored by representatives from the research team. Farmers received cards with water fee subsidy results; these were photographed during the follow-up survey as a check. During each season, LWH staff worked with the WUGs to measure and document cultivated area, to assess water user fees. We monitored the repayment of the water user fees by farmers, with the help of the WUA managers. The WUA managers had sheets with lists of farmers in each WUG, area of land, and the amount of fees they have to pay for each season. They filled in the fee information whenever they visited the farmers to collect the fees. We helped the WUA managers by printing invoices depending on the lottery type and the WUA managers provided us receipts for each payment.
O&M experiment: we worked jointly with LWH staff to develop Operations and Maintenance trainings, which were implemented through a ToT model to all farmers at the Water User Group (WUG) level. Details of the training are provided in Appendix C. Farmers were instructed on the purpose of the WUGs, and trainers collected details of WUG members. Farmers selected their Monitor, and the name of the Monitor was recorded. We monitored the training of trainers and training of farmers closely to make sure the materials were taught as planned and that monitors were elected according to the study protocols. We monitored ongoing adherence to the treatment by entering and reviewing the data from the monitors’ weekly worksheets, which were collected regularly through the Water User Group. In case submissions were not made on time, there was a follow-up to the Monitor to make sure that s/he was still performing his/her duties. In a few cases, the Monitor resigned partway through and was replaced with a new WUG member, who was trained by LWH staff. In the household surveys, we confirmed the identity of the WUG monitor as applicable.

8
2.3.2 Monitoring data quality All quantitative data collection was done by Innovations for Poverty Action (IPA). To ensure quality, data checks were run daily, and the monitoring activity was scheduled and designed such that each surveyor was observed, spot checked or back checked at minimum, once a week. The different quality control measures put in place during the baseline are listed below.
o High frequency checks: data checks were run daily to gather information regarding quality of the data, enumerator performance, programming errors in the digital data collection program, and any systemic flaws in the data flow. Any errors identified were rectified daily.
o Accompaniments (random): To better check the survey quality, a minimum of 10% of respondents surveyed by each surveyor were observed. This was done through random field visit to enumerators in different households.
o Spot check survey (random): Spot checks (surveys which a supervisor completes while observing an enumerator) were implemented to help monitor enumerators and verify the enumerator is following the survey protocols. In the first two weeks, most of the enumerators were visited. The monitoring activity was scheduled and designed so that each surveyor was observed at minimum, once a week.
o Back check survey: A back check survey consisting of a bare minimum of 10 questions were asked for 15% of the sample. This was used as a method of monitoring and auditing data quality. If differences occurred on comparison with the main survey, households were revisited, and corrections were made where necessary.
3. Evaluation questions, design, methods, sampling and data collection
3.1 Primary and secondary evaluation questions
There are four primary research questions being addressed by the study: 1. What are the impacts of irrigation on smallholder welfare? Specifically, we will
examine impacts of large-scale irrigation on yields, cropping and input choices, expenditures, labor supply and employment, land sales and rentals, migration, and whether those impacts differ by gender.
2. Minikits experiment: Do self-demonstration kits encourage experimentation and long-run adoption? If so, how does this interact with water usage fees? We hypothesize that farmers who receive minikits will be more likely to experiment with high-value crops, and that effects will be larger when water usage fees are higher. Moreover, we hypothesize that farmers who experiment will be more likely to continue using the irrigated land when charged full water usage fees in the future.
3. Subsidies experiment: What is the impact of escalating irrigation fees on farmer behavior? In the long-run, farmers will have to pay substantial fees. Fees will outweigh benefits if farmers continue to produce low-value crops; therefore, for sustainability, farmers will have to either adopt high-value crops or reallocate land (through sales or rental). We hypothesize that a short window of subsidized fees will induce farmers to experiment with high-value crops.

9
4. O&M experiment: Does the placement of a monitor within the irrigation scheme affect resource sharing? A key dimension of heterogeneity in irrigation schemes relates to plot location: people living near the main canal will have different incentives to maintain the secondary and tertiary canals than those who live far from it. They will also have different incentives to (over)use water. We will measure the impact of empowering a monitor within a WUG, and of imposing that the monitor cultivates a plot in the area most likely to be harmed by overuse of the resource.
3.2 Evaluation design and methods
3.2.1 Impacts of Irrigation We exploit a spatial discontinuity in irrigation coverage to estimate the impacts of irrigation. Because the main canals must conform to prescribed slopes relative to a distant and originally inaccessible water source, the geologic accident of altitude relative to this source determines which plots will and will not receive access to irrigation water. Hence, before construction, plots just above the canal should be similar to plots just below the canal, and importantly, should be managed by similar farmers. Following construction, however, the plots just below the canal fall inside the command area and have access to irrigation, while the terraces just above the canal fall outside the command area and do not have access to irrigation.
3.2.2 Minikits experiment We give some farmers agricultural minikits to experiment with high-value horticultural crops. These minikits include small quantities of inputs for cultivation of high-value crops on a small plot of land. We will provide the minikits to farmers before the Dry season, enabling low-cost experimentation with cultivating high-value crops using the irrigation infrastructure. The agricultural minikits are small packages containing seeds for horticultural crops (see table below for quantities), compost (200 Kg), chemical fertilizer, and pesticides sufficient to cultivate a plot of 2 ares.4 shows the composition of agricultural minikits provided.
Table 2: Composition of agricultural minikits
Crop Quantity of Seeds Carrot 60 gr Onion 60 gr Eggplant 50 gr French bean 500 gr / 1.7 kg Garlic 7 gr Tomato 10 gr Watermelon 25 gr
Random assignment of minikits was done at the household level, with crops allocated by zone. Farmers who were offered the minikit chose if they wanted to use it. To use it, farmers had to prepare the land to plant the crop included in their minikit; they were
4 Are, a common unit of measurement in Rwanda, is equivalent to 0.01 hectares.

10
assisted by horticulturists during this process. The district agronomists provided extension advice during the season. 5
The intervention took place in two seasons, Season 17A and Season 17C. It was initially supposed to take place in season 17A only, but due to delays with procurement of inputs, farmers faced production challenges. Hence, we decided to repeat the intervention during season 17C, to be able to provide the farmers with all the inputs at the right time.
During season 17A, treated farmers were offered a minikit that included seed and compost. During season 17C, farmers that had collected the minikit during 17A were offered a second package, which included seeds, compost, fertilizer, and pesticide.
3.2.3 Subsidies experiment Our experiment randomly allocated subsidies to different farmers. Since learning may take more than one season for full results, we randomized a path of subsidies over two seasons. Fees were around 40,000 RWF/hectare-season (about $52 per hectare; the average farmer cultivates about 0.3 hectare within the scheme) with costs are included; this level of fees was to be collected from all cultivating plots. After discussing the eventual fee with farmers, they took part in a lottery to pay according to one of four schedules as detailed in Table 3.
Table 3: Fee schedules
Option 2016 Season C Fee (RWF/hectare)
2017 Season A Fee (RWF/hectare)
2017 Season B/C Fee (RWF/hectare)
Approximate Number Farmers
1 0 0 40000 300 2 0 20000 40000 300 3 0 40000 40000 300 4 40000 40000 40000 800
We vary the season in which farmers begin to pay water usage fees, delaying the first season of payments one or two seasons for some farmers. The first season in which water usage fees were charged was season 17A (September 2016 – February 2017). Prior to this season, a lottery was conducted to allocate subsidies for both Season A and Season B Fees. At the lottery, farmers received cards they could keep with the outcome of the lottery; the template for the card is provided in Appendix D.
3.2.4 O&M Experiment We use a Randomized Control Trial (RCT) to test the optimal monitoring structure. The randomization determines which member is empowered as a monitor within a Water User Group. In 76 random WUGs, the WUG will elect a monitor from its members. In another 76 random WUGs, the WUG will elect a monitor, but the position will be reserved for a farmer who cultivates land close to the main canal. Counterintuitively, these are the farmers most exposed to collective action problems in our context, since
5 Control households also had access to the zone horticulturalist. Hence the treatment effect we estimate is the additional effect of minikits, and not the combination of minikits and extension advice.

11
they cannot draw water while farmers below them are using the water. The remaining 100 groups will continue to have an employee of LWH monitoring their water use.
We randomize how monitors are chosen within water user group and whether these monitors have incentives to ensure optimal operations and maintenance activities. The monitor will either be an employee of LWH, appointed by the water user group, or appointed by the water user group with the spot reserved for a farmer with plots near the top of their secondary pipe (the farmers who are most negatively impacting by collective action failures). Across treatment arms, a subset of monitors will be paid based on how often water flows from the tertiary valves on their secondary pipes at the scheduled times.
A series of training were organized to introduce farmers to the irrigation schemes and to key organizations and staff. Trainings were done at the WUG level. WUGs assigned to the monitoring treatments elected their monitors during the training.
Monitors were tasked with completing simple worksheets on function of the irrigation infrastructure for their group on a weekly basis. First, monitors were asked to mark the days in which there was irrigation in their block, or to leave it blank if there was no irrigation at all. Second, they were asked to indicate whether any of a list of possible maintenance events had occurred. The list included 11 events, related to routine maintenance and water sharing.
3.2.5 Overlap of samples across interventions Table 4 below details the overlap of households across each treatment arm.
Table 4: Overlap of samples across interventions
Treatment combinations No of HHs RD Treatment No minikits No subsidies No O&M 780 RD Treatment No minikits No subsidies Received O&M 212 RD Treatment No minikits Received subsidies Received O&M 86 RD Treatment Received minikits No subsidies Received O&M 40 RD Treatment Received minikits Received subsidies Received O&M 291 RD Control No minikits No subsidies No O&M 477 RD Control No minikits No subsidies Received O&M 99 RD Control No minikits Received subsidies Received O&M 47 RD Control Received minikits No subsidies Received O&M 3 RD Control Received minikits Received subsidies Received O&M 151
3.3 Power calculations
Power calculations as presented in the initial proposal used baseline data (the baseline of this project was funded from a separate source) and therefore have not changed. Here, we show the addition of a fourth irrigation scheme, which boosts power for measuring the overall impact of access to irrigation. Note that we do not have to update the power calculations for the other interventions as no other interventions were implemented in the fourth site. To quantify, using the same assumptions submitted along with the proposal, addition of the households from the Rwamagana site (340 below the

12
primary canal and 359 above) to the initial sample, the MDES now is between 0.11 – 0.13 (depending on the assumed level of autocorrelation), as shown in Table 4 below. The outcome variable of interest for the power calculations is agricultural yields measured in Rwandan Francs per hectare.
Table 5: Power calculations
Parameter Test 1: high autocorrelation
Test 2: medium autocorrelation
Definition
α 0.05 0.05 Significance level β 0.8 0.8 Desired power of the test Tail 2 2 One-tailed or two-tailed test
µ 12761 12761 Pooled mean of outcome variable (yield in RWF/ha)
σy
24233 24233 Pooled standard deviation of outcome variable (yield in RWF/ha)
Р 0.52 0.52 The proportion of the study sample randomly assigned to treatment
n 690 690 The size of the study sample
pre 1.00 1.00 Number of baseline measurements post 2.00 2.00 Number of follow-up measurements
ρ 0.75 0.50 Correlation between baseline and follow-up measurements
stata code
sampsi 12761 15930, sd1(24233) method(change) pre(1) post(2) n1(359) n2(331) r1(.75)
sampsi 12761 17240, sd1(24233) method(change) pre(1) post(2) n1(359) n2(331) r1(.5)
stata package: sampsi
δ 0.13 0.18 Minimum detectable effect (in standard deviations)
Please refer to the spreadsheet in Appendix E for additional details on the calculations, including software package used and all assumptions.
3.4 Follow up qualitative work
We used qualitative research as a follow up to the data collection to be able to supplement the findings from the evaluation and better understand reasons for unanswered questions from the quantitative research. We employed focused group discussions as the main tool to understand reasons for low irrigation take up; a focus group discussion outline was developed for this. While the FGD guide was left flexible to have a free-flowing conversation, challenges to irrigation adoption and potential solutions to optimize irrigation adoption was the central theme.
Three (3) Focus Group Discussions (FGD) were conducted in one of the four sites (Karongi 13). We first held a focus group discussion with 6 village leaders and 2 Water User Association committee members, followed by another two FGDs with 35
13
participants from two randomly selected Water User Groups. Through these discussions, we navigated through understanding farmers agriculture practices to set the tone of the conversation. Extensive notes were kept by the team conducting the FGDs and the major learnings from these were used to motivate the discussion around the findings from the evaluation.
3.5 Timeline
Figure 3 below provides a pictorial representation of the timeline for our data collection alongside the project implementation. Please note that each wave of survey data collection included a year of retrospective agricultural data. Although the baseline survey took place when the scheme construction was finalizing in the first 3 sites, as it was retrospective, the seasons covered in the survey were not affected by the new infrastructure.
Figure 3: Study Timeline
3.6 Ethics
The research team applied for and received ethical clearance from the Human Subjects Committee for Innovations for Poverty Action IRB, UC-Berkeley, and the Rwanda National Ethics Committee. A survey visa from the Rwandan National Institute of Statistics was also applied for and received.
We anticipate no major risks to participants in the study - treatments all involve no gifts or unforeseen benefits; we took all possible precautions to guarantee that subject data is kept confidential, and subjects were reassured that they have the prerogative to exit the study without loss of benefits.
The study is registered with the AEA RCT registry with the title ‘Technology Adoption and Public Good Provision: Evidence from Hillside Irrigation in Rwanda’. The registered study can be found here.
2009-2010: Terracing
2015: Irrigation construction
completed in K12, K13, and N23
May 2015: Baseline (K12, K13,
and N23)
April 2016: O&M Intervention
June 2016: Subsisdies Intervention
December 2016: Minikits intervention
(17A)
May 2017: Follow-up 1(K12, K13, and N23)
June 2017: Minikits intervention
(17C)
Nov 2017: Follow-up 2(K12, K13, and N23)
Dec 2017:Baseline (RW34)
2018: Irrigation construction completed in RW34
June 2018: Qualitative Interviews
Nov 2018: Endline (K12, K13, and N23)
Dec 2018: Follow-up 1 (RW34)
Jan-Mar 2019: Qualitative Interviews

14
3.7 Sampling and data collection
3.7.1 Sample selection For three of the sites that are being used for the spatial regression discontinuity analysis (K12, N23, and R34), we divided the site into 3 areas – CA buffer (BCA), CA Catchment buffer (BCAC), and CA terraces (TCA). BCA is the area inside of the CA (CA, below main canal) within 50m of the boundary of the CA. BCAC is the area in the CA Catchment (CAC, above main canal) within 50m of the boundary of the CA. TCA is the terraced farmland that is in the CA, but more than 50m from the boundary of the CA. The third site will be used for the within-CA experimental designs only, and as a result we focused our sampling in one area – the CA terraces (TCA).
We constructed our household sampling by dropping a uniform grid of points across the full site at 2-meter resolution, and then sampling points within the grid. After each point was sampled, we excluded any points within 10m of that point (to keep from selecting multiple points too close together).
Enumerators were then given GPS devices with the locations of the points, and sent to each point, with a key informant (often the village leader). For each point, they were asked to identify if the point was on cultivable land (this was to discard forest, swamps, thick bushes, bodies of water, or other terrain which would make cultivation impossible). They were asked to record, for points in cultivable land, in SurveyCTO, the following:
1. The name of the point visited (which was displayed on the GPS); 2. The name of the cultivator, the location of their residence, and their phone
number; 3. A description of the plot detailed enough that the cultivator would be able to
identify the exact plot described
Additionally, they were asked to save their GPS track at the end of the day, as a way of tracking the number of hours they spent checking points and to verify that they visited each point. We used the data from this listing to construct a roster of all the unique names of cultivators, clustering points together when the names seemed identical. This roster (which contained the name of the individual, their village and phone number, the descriptions of the plots, and the villages in which the plots were located (identified using village shapefiles) and were organized by village) were then used to contact village leaders and verify that the listed individuals in fact existed. Multiple follow-ups were sometimes needed when village leaders suggested that one individual lived in a different village, or multiple village leaders said an individual lived in their village.
Finally, a sample plot was selected for each verified 2689 households. To select this sample plot, one point was randomly selected for each household. The probability of selecting a particular point was weighted – a weight of 1 was assigned to points in the BCA and BCAC, and a different weight was assigned for points in the TCA, to balance the number of sample plots in these areas (see Table 5 for the full list, and Figure 4 for an illustration of the geographic relationship between the sample plots and the canal).

15
Table 6: Distribution of sample plots
Site Sampled Households Area Sampling Weight # Sample Plots N23 877 BCA 1 323
BCAC 1 362 TCA 2 192
K12 593 BCA 1 185 BCAC 1 211 TCA 0.25 197
K13 409 TCA -- 409 RW34 810 BCA+BCAC 1 810
Figure 4: Sample plots in relation to irrigation canal
Source: Mapping of geo-coordinates of canal and sample plot collected by the team
The baseline in K12, K13, and N23 was conducted in May 2015. There were 3 follow up household surveys conducted in K12, K13, and N23. The first one took place in May and June 2017, the second one took place in November and December 2017, and the third took place in November and December 2018. For RW34, the baseline household survey was conducted in January 2018 and the first follow up was conducted in December 2018. All were panel surveys, including the same set of respondents.
3.7.2 Data description The questionnaire was structured such that agricultural data is collected plot-by-plot, for each agricultural season. The plots were identified with plot descriptions (from the farmer) and geo-tags, to construct a plot-level panel. The survey was answered by the decision makers in the household. Table 6 lists the survey modules. Table 7 lists outcomes of interest. The complete instruments have been attached as a supporting document.

16
Table 7: Baseline survey modules
Module Content Level Identification Identification of enumerator and respondent; informed
consent Household
Household Roster
Sex, age, education, employment, migration Household member
Plot Roster Plot identification, ownership status, cultivation by season, past land transactions
Plot
Crop Production
Crops produced (cash vs. subsistence), amount of seed, amount harvested, amount consume, amount sold, amount lost to spoilage
Crop (by Plot and by Season)
Use of Irrigation
Use of irrigation, source, method, frequency Sample plot
Farm Labor Use of household and hired labor for agriculture By plot and by season
Agricultural Inputs
Quantity, source, and amount spent on all organic and chemical inputs
By plot and by season
Irrigation (general)
Experience with irrigation, knowledge of maintenance, participation in maintenance activities, participation in trainings
Household
Extension Interaction with public, private, and not-for-profit sources of agricultural extension
Household, by season
Housing Construction material of walls and floors, source of drinking water, sanitation
Household
Farmer Group Participation in farmer group, cooperative, water user group, and water user association
Household
Social Networks
Interactions, transfers to/from, and loans to/from, community work with neighbors and members of water user groups
Income & Expenditures
Disaggregated income over the past 1 year; access to market; disaggregated expenditures over the past 1 month (frequent categories like communications and transportation); disaggregated expenditures over the past 1 year (infrequent categories like school fees and health insurance)
Household
Animals & Assets
Total owned; sales and purchases over the past one year for: cows, goats, pigs, poultry, radios, mobile phones, furniture, bicycles, hoes and shovels, and other agricultural equipment
Household
Rural Finance Bank accounts; formal savings; contributions to ROSCAs Household Credit Number of loans requested; amount and purpose of loans
received Household
Shocks Crop failure in the past year associated with drought; amount of loss and means of coping
Household, by season
Future Expectations
Future expectations and perceptions of agricultural production, household wellbeing, impacts of irrigation, asset purchases, participation in contract farming
Household
Food Security Food Consumption Score (developed by World Food Program)
Household
Plot mapping Map of two plots of interest: Sample plot and most important plot
Household

17
Table 8: Indicators of interest
Outcome Type Outcome Name Definition Measurement Level Primary Gross
Agricultural Yield Total value of output per hectare Agricultural plot
Primary Net Agricultural Yield
Total value of output per hectare minus total value of inputs (including labor) per hectare
Agricultural plot
Primary Expenditures Household expenditures in the past month (frequent) and year (infrequent)
Household
Secondary Adoption of high-value crops
Choice of crop(s) cultivated, per season
Agricultural plot
Secondary Payment of water-usage fee
Amount paid as a proportion of the amount owed (given subsidy)
Agricultural plot
Primary Primary employment
Primary source of employment, self-reported
Household member
Primary Land sales and rentals
Land sales over the past 5 years; ownership status and decision to rent out or in by plot
Agricultural plot
Primary Migration Dummy for whether the HH member migrated for work during the reference period
Household member
Primary Maintenance of irrigation scheme
Score based on objective measures of level / quality of maintenance performed, directly observed through monitoring
Tertiary Valve
Extensive qualitative data was conducted in mid-2018 and led by Christophe Ndahimana, a local researcher. Focus group discussions were conducted with water user groups in Karongi to unpack the findings from the quantitative surveys. Details of the qualitative work done are explained in Section 4.
3.7.3 Secondary survey and administrative data LWH staff collected data on payment of water user fees from the Water User Groups which we use to corroborate the self-reports of fees payment made.
3.8 Specifications
3.8.1 Impacts of Irrigation To estimate the impacts of irrigation, we make use of the fact that the position of the main canals is largely proscribed by engineering specifications: in a hillside context like Rwanda, canal water must flow within a narrow range of slopes along a contour of the hillside. Thus, the canal was constructed without consideration for the characteristics of specific plots, and presumably there are very similar plots just above and just below the canal.
For this report, we focus on a simple boundary discontinuity specification; our identifying assumption is that for plots within 50m of the boundary of the command area, it is as good as random whether the plot is inside the command area (and has access to irrigation) or is outside the command area (and does not have access to irrigation). We therefore estimate:

18
𝑦𝑦𝑖𝑖𝑖𝑖𝑖𝑖 = β0 + β1CA𝑖𝑖𝑖𝑖 + α𝑖𝑖𝑖𝑖 + ϵ𝑖𝑖𝑖𝑖𝑖𝑖
Where yist is outcome y of household i located in site s in season t, CAis is an indicator for the household’s sample plot being in the command area, and 𝛼𝛼𝑖𝑖𝑖𝑖 are site-by-season fixed effects meant to control for any differences or trend differences across sites (including market access or prices). To interpret these site-by-season fixed effects, note that this regression is equivalent to estimating this regression (without the fixed effect) separately for each site in each season, and then averaging across the estimated effects from each site in each season. To ensure that our plots are representative, these sample plots that we focus on are the plots we randomly selected through an aerial sampling procedure, described above.
3.8.2 Minikits experiment We estimate the impact of minikits using the specification
𝑦𝑦𝑖𝑖𝑖𝑖𝑖𝑖 = β0 + β1Assigned minikit𝑖𝑖 + β2Minikit saturation𝑖𝑖 + 𝑋𝑋𝑖𝑖𝑖𝑖𝑖𝑖′ γ+ ϵ1𝑖𝑖𝑖𝑖𝑖𝑖
Assigned minikiti is a dummy for whether household i was randomly assigned to receive a minikit, Minikit saturationi is the probability of receiving a minikit for households in the water user group of household i sample plot, and X1is includes the stratification variables (Zone fixed effects and O&M treatment status), as well as indicator variables reflecting the probability that a household would receive a minikit6 and in some specifications 2016 Dry horticulture adoption. As minikit saturation is assigned at the water user groups level, robust standard errors are clustered at the water user group level.
3.8.3 Subsidies experiment We estimate the treatment effects for subsidies using T-C comparison after stratifying on covariates using the regression form listed below.
𝑦𝑦𝑖𝑖𝑖𝑖𝑖𝑖 = 𝛽𝛽0 + 𝛽𝛽1𝑆𝑆𝑇𝑇𝑖𝑖𝑖𝑖𝑆𝑆 + 𝑋𝑋𝑖𝑖𝑖𝑖𝑖𝑖′𝛾𝛾 + ℇ𝑖𝑖𝑖𝑖𝑖𝑖
where 𝑇𝑇𝑖𝑖𝑆𝑆 = 1 if farmer i in site s receives subsidy of type S in season t, and 𝑋𝑋𝑖𝑖𝑖𝑖𝑖𝑖 are stratifying covariates.
3.8.4 O&M experiment For the treatments on O&M, since treatment is randomly assigned, we can simply estimate
𝑦𝑦𝑖𝑖𝑖𝑖 = 𝛽𝛽0 + 𝛽𝛽1𝑇𝑇𝑖𝑖𝑖𝑖 + 𝑋𝑋𝑖𝑖𝑖𝑖𝑖𝑖′𝛾𝛾 + ℇ𝑖𝑖𝑖𝑖𝑖𝑖
Where 𝑇𝑇𝑖𝑖 indicates the treatment status of household I in site s and other variables are defined as before. For O&M specifications, we include in 𝑋𝑋𝑖𝑖𝑖𝑖𝑖𝑖 all stratifying variables and cluster at the WUG level.
6 After matching names from the lists of water user group members to our baseline survey, we found that 32% of households either had multiple household members on the lists of water user group members or had a single household member listed multiple times; these households are more likely to be assigned to receive a minikit and may differ from other households

19
4. Findings
4.1 Intervention implementation fidelity
For the sites of Karongi and Nyanza, we saw 5.3% (90/1695) farmers attrite from the sample between the baseline and the third follow up. In Rwamagana, the attrition was 12% (89/736). We instituted careful field protocols to assure the highest possible response rate. A major component of these protocols was sending in field mobilizers to visit the village before the enumerators to inform the village leaders about the upcoming survey and give respondents appointments. Collaboration with the local leaders in the villages was critical to mobilizing respondents for the survey. In case a respondent was not available at the first appointment, up to 2 more attempts were made to survey the respondent before marking them as unavailable. The main reasons for attrition are some households have permanently moved away from the site, households dissolved (no longer exists: or the main respondent missed more than 3 appointments during our survey period in the village.
There are two other major implementation challenges. First, mini kits were distributed behind schedule, which limited take-up. To mitigate this, we worked with the government to provide a second round of mini kits to the randomly-assigned farmers during Season C. Second, water user fees are not being implemented as planned by the government: in one of the three sites, the government approved a 50% reduction in fees. In all three sites, compliance with fee repayment is incomplete, and repayment is not being strongly enforced. This mitigates the power of our fee subsidies within the study, as it changes the expectations on penalties for those who do not pay their fees. This may reduce the effectiveness of the subsidy intervention. We are working with the government to understand how fee repayment infrastructure can be strengthened, as the recovery of operation & maintenance costs is paramount to ensuring the sustainability of irrigation investments. This policy concern will likely yield new policy ideas to be tested in the near term. Appendix A provides all the results and findings detailed below7.
4.2 Descriptive statistics and balance
The survey respondent is the household head. On average, the head is 49 years old. 27.8% of the household heads are female. Female household heads tend to be older; averaging 56 years old compared to 46 for men. Approximately 1/3 of household heads have no formal education, 1/3 have some primary education, and 1/3 have completed primary education or higher. At baseline, most reside in dwellings with adobe walls and dirt floors and rely on a pit latrine.
The sample population is rural households that rely on subsistence farming for their livelihoods. The median household owned 4 plots and cultivated 5 (rentals are common). Plots are very small: the median size is 5 ares (.05 hectares) and the average is 12 ares. The most commonly grown crops in the rainy seasons are dry beans, maize and sorghum. In the dry season, less than 1 in 5 plots are cultivated, and farmers typically only cultivate bananas.
7 Note that the table numbers listed in this section refer to the table numbers from Appendix A.

20
Crucially, in terms of balance, Table A2 indicates that our sample plots are balanced in terms of ownership and rentals, and that most sample plot owners on both sides of the canal owned the land for at least 5 years, or prior to the start of the irrigation construction. There is, however, some imbalance on plot size: log area (measured in hectares) is larger inside the command area than outside the command area.
4.2.1 Baseline impacts In Table A15, we consider two additional impacts of command area construction. First, terracing occurred jointly with hillside irrigation. Although there was also meaningful terracing outside the command area to protect against erosion, there was more terracing inside the command area, as it is impossible to have hillside irrigation without terracing (as water would run off the sloped hillsides). We therefore note that our effects are the combined effect of terracing and access to irrigation; however, the absence of effects during the rainy season (and large effects during the dry season) suggest our results are driven primarily by access to irrigation (and not terracing). Second, rentals out to commercial farmers occurred inside the command area, as these commercial farmers were keen to take advantage of access to irrigation. These commercial farmers were private businesses exporting vegetables and they had negotiated land lease rates with the government. We do not have data on production by commercial farmers but note that these farmers were exclusively cultivating high-value horticultural crops; as such, the absence of these plots render our estimates conservative.
We also note that hillside irrigation systems were online in a small part of the sites in 2014 Dry and hillside irrigation was just beginning to come online in the 2015 Rainy seasons, the first surveys covered by the baseline. Thus, the baseline survey was completed shortly after the construction of the hillside irrigation schemes was completed. Tables A16 and A17 report impacts on agricultural outcomes in 2014 Dry and the 2015 Rainy seasons. Consistent with irrigation not having come fully online, we observe limited adoption of irrigation. In contrast to our main results from follow up surveys, at baseline cultivation is lower in the dry season inside the command area. This is driven by a combination of low adoption of irrigation and horticulture, and lower cultivation of bananas. These banana effects are partially explained by terracing, during which bananas were torn up to construct the terraces. These banana effects are smaller than in follow up surveys, and the share of plots cultivated with bananas is also lower outside the command area than in follow up surveys. Together, we interpret these results as farmers beginning to replant bananas following terracing, but less replanting occurring inside the command area than outside. As irrigation had come online by 2015 Rainy 1 and 2, rainy season results look similar to rainy season results in subsequent seasons – modestly lower cultivation, and significant but modest increases in adoption of irrigation and horticulture, and reduced banana cultivation. Third, we estimate impacts on inputs in Table A4, and output in Table A5. Consistent with the small increases in horticulture and modestly larger decreases in low input intensive bananas, we do not find consistent significant effects on input use, yields, sales, or measures of profits in the dry season or rainy season.

21
4.3 Impact analyses
4.3.1 Impacts of Irrigation First, we note that all reported estimates are ITT unless otherwise specified. Any TOT estimates use adoption of irrigation as the endogenous treatment variable. The definitions of all constructed variables have been added as Appendix H.
Tables under section 4.1 in the appendix summarize the results of the overall impacts of irrigation. Command area plots are 15-19pp more likely to be irrigated during the dry season than plots outside the command area, and almost all this increase is explained by the transition to cultivation of high-value horticulture during this dry season. In contrast, adoption of irrigation during the rainy season is much lower, with increases of just 4-6pp. This transition to dry season horticulture substitutes for cultivation of perennial bananas, a less productive but less input intensive commercial crop; we estimate a decrease of 13-15pp in the command area, and therefore we observe no impacts on cultivation in the dry season8.Second, we find large increases in dry season input use, which are dominated by increases in household labor. These results are consistent with the transition from perennial bananas, which require little inputs and labor, into horticulture, which is highly input and labor intensive. To interpret these results, we conduct a treatment on the treated analysis under the assumption that the command area increases input use only through its effect on irrigation. Doing so, we find that adoption of irrigation increases household labor use, input expenditures, and hired labor expenditures by 350-430 person-days/ha, 25,000-35,000RwF/ha, and 15,000-25,000 RwF/ha, respectively. The impacts on household labor are particularly large – valued at a typical wage of 800 RwF/person-day, this labor would be priced at 280,000-345,000 RwF/ha, an order of magnitude larger than the effects on input expenditures or hired labor expenditures. Additionally, as reference, applying this labor to 0.3 ha (median household landholdings) of command area land would require roughly 4 person-months of labor during the 3-month dry season. In contrast, we find no effects on input use during the rainy seasons; this is consistent with access to irrigation, and not terracing, being the primary cause of these results.
Consistent with our estimates of impacts on input use, we find large increases in dry season agricultural production. Treatment on the treated analysis suggests adoption of irrigation increases yields by 300,000-400,000 RwF/ha, 50-70% of annual agricultural production. As horticulture is primarily commercial: each 1 RwF/ha increase in yields is associated with a 0.79-0.86 RwF/ha increase in sales. Once again, these results on outputs are consistent with differences between bananas and horticulture production. Additionally, these impacts on yields are much larger than our estimates of impacts on input and hired labor expenditures; our results suggest irrigation increases yields net of expenditures by 240,000-360,000 RwF/ha, a 46-70% increase in annual yields net of expenditures. However, we should not interpret this as impacts on profits, as it implicitly places no value on the large increases in household labor. If we instead value household labor at 800RwF/person-day, the median wage we observe, these impacts vanish 8 As bananas are perennials, plots cultivated with bananas typically have harvests in each season. In contrast, the rotations of staples and horticulture (or simply horticulture) that replace bananas may only involve two plantings and harvests, and we therefore see a modest decrease in cultivation during the rainy seasons of 5-10pp on a baseline of 81%.

22
completely. Therefore, the profitability of the transition to dry season horticulture enabled by irrigation depends crucially on the shadow wage at which household labor is valued.
Taken together, these results together suggest that irrigation leads to a large change in production practices for a minority of farmers. Those farmers cultivate horticulture in the dry season and a mix of horticulture, staples, and fallowing in the rainy seasons, they have substantially higher earnings in the dry season but similar earnings in the other seasons, and they invest more in inputs and much more in household labor in the dry seasons. Our estimates suggest that irrigation has the potential to be transformative in Africa, in light of the 46-70% increases in yields net of expenditures that we document from just three months of cultivation. At the same time, these results also suggest that the shadow wage, and therefore labor market frictions, are likely to be important for the decision to cultivate horticulture.
We include some additional tables to test the robustness of our results. First, Tables A25 – A28 present results using a difference-in-differences design. As there were already impacts of the command area construction in 2014 Dry and the 2015 Rainy seasons, discussed above, these results can be interpreted as the difference between the impacts of the command area construction in these seasons, and the impacts of the command area construction in later seasons. All emphasized results are robust to this specification. Second, Tables A29 – A32 present results controlling for the WUG having a member empowered as a monitor. The estimated impact of the command area in these specifications can be interpreted as restricting the analysis to use command area plots which did not have a member empowered as a monitor. As such, the estimated coefficients are very similar to the difference between our primary estimates of the impacts of the command area, and our estimates of the impacts of having a member empowered as a monitor; as the latter are typically not statistically significant, our estimates do not change much.
4.3.2 Minikits experiment Minikits were first distributed in 17A. Section 3.2 present results of regressions which examines season-by-season effects of access to minikits. Table A33 indicates that there was a 44 percentage points increase in take up of the minikits in the 2017 rainy season and 36 percentage points increase in the 2017 dry season. The rate was less than 100% as farmers offered minikits were not obligated to receive them. We do not see significant impacts of the take up of minikits on outcomes of interest.
4.3.3 Subsidies experiment Section 3.3 present results of regressions which examines season-by-season effects of the monitoring treatment. FF refers to receiving full subsidies in both seasons, FN refers to the treatment in which the farmer receives full subsidy in season 1 and no subsidy in season 2, and HF refers to the treatment arm in which farmers receive hall and full subsidy.
Column 1 of table A40 depict that those receiving the FN subsidy are significantly more likely (at 5% level) to cultivate their land in the dry season. Similarly, as seen in column 1 of table A42, those receiving the FN subsidy are significantly more likely (at 5% level) to cultivate their land in the rainy season. Though cultivation increases for other treatments these are not significant. Similarly, farmers receiving the FN subsidy are significantly more likely (at 10% level) to irrigate their land in both, rainy and dry, seasons.
23
4.3.4 O&M experiment Section 3.4 present results of regressions which examines season-by-season effects of the monitoring treatment. T1 refers to the treatment of empowering a monitor who could be selected from anywhere in the WUG and T2 is the treatment requiring a monitor to be selected from the top third of the secondary pipe.
For both, the rainy and dry seasons, we see that assignment of either WUG treatments does not lead to significant effects on almost all outcomes considered.
4.4 Heterogeneity of impacts
We test for heterogeneity of the impacts of each of our interventions with respect to gender of the household head; we find no consistent meaningful differences in the impacts of our interventions with respect to gender of the household head, and results are available upon request.
4.5 Follow up qualitative work
As mentioned in section 3.2, 3 Focus Group Discussions (FGDs) were conducted in one of the four sites (Karongi 13) to understand reasons for low irrigation take up. Through these discussions, we navigated through understanding farmers agriculture practices to set the tone of the conversation. This lead to asking understanding why most of the land in the irrigated area is not cultivated during the dry season, characteristics of the owners of the uncultivated land and what they think could be done for that land to be used. Following this, the conversation was taken towards understanding irrigation take up and challenges to the same. Through the discussions it became clear that one of the main reasons for low irrigation take up in the dry season land and labor market frictions. This is because the horticulture crops that are grown in the dry season require large amounts of labor and those farmers who have land in the irrigated areas do not necessarily have the amount of labor and are unable to hire the required to be able to make productive use of the land in the dry season.
5. Cost analysis
The construction of the irrigation canal cost USD 5.5 million in Nyanza; approximately $12,700 per hectare of command area. In the two Karongi sites, the total cost is USD 2.4 million, approximately $9,400 per hectare of command area. In Rwamagana, the construction of the 14.5 km long canal was contracted out for a value of USD 2.7 million. The irrigated area is 292 hectares; hence the approximate cost per irrigated hectare is $9,250.
Building large scale irrigation canals are a huge economic cost which are not intended to be recovered in a span of 4 years. This is also indicated in the World Bank project document which says the costs are estimated to be recovered in 26 years (Figure 5). Therefore, the short-run benefits we document in the main RDD intervention are not usefully compared to the costs of overall scheme construction. Instead, we run cost-benefit analysis for the smaller interventions, which are more likely to have immediate impacts.

24
Figure 5: Excerpt from LWH project document indicating long run nature of project
Source: Project Appraisal Document for the LWH project, World Bank Internal document
We conduct an economic evaluation of the O&M intervention and find a net benefit of $125 per farmer. The complete cost-benefit analysis has been shared along with the report as Appendix D. The main costs involved were training the monitors and logistics ins setting each of the trainings up. As the training was conducted in 2016, we inflate the costs to current year using an inflation factor of 0.1.9 For the benefits, we use the use in yields in the dry season as the benefits. We note that we can neither reject that the benefit of the intervention on yield was zero, nor can we reject that the intervention was cost effective.
6. Discussion
6.1 Introduction
6.1.1 Impacts of irrigation Treatment on the treated estimates reveal that irrigation enables the transition to dry season cultivation of horticulture. While we find no effects on rainy season yields, labor, or inputs, dry season estimates correspond to 70% growth in annual cash profits. Despite the large effects we estimate, adoption is low: only 30% of plots are irrigated 4 years after canals became operational. At this level of adoption, the sustainability of hillside irrigation systems is in doubt: even the large gains in cash profits to adopters are unable to generate enough surplus to pay for routine maintenance costs.
6.1.2 Minikit experiment We find no effects of receiving minikits on adoption of horticulture in our context, in contrast to existing work. The results suggest that access to agricultural inputs (seeds and fertilizer) was not the binding constraint. A closer analysis indicates that the farmers 9 We round up the inflation rate for 2016 and 2-17 as provided by the World Bank data to create the inflating factor.

25
who take up the minikits are the same farmers who would have been likely to cultivate horticulture absent the intervention. We see a 1-for-1 substitution of market inputs for the provided inputs. The results suggest that financial and informational constraints are unlikely to be a primary explanation for low and inefficient adoption of irrigation.
6.1.3 Subsidies experiment We find no impact of fee subsidies. The reason for this is clear -- although we have a strong and large first stage on fees owed by farmers in administrative data, the impacts of subsidies on feed paid by farmers were 10% of the size of the impacts on fees owed, both in administrative data and self-reports. Moreover, the fees were implemented as land taxes and not charged based on irrigation use so as not to discourage adoption. In sum, at the low levels of enforcement observed during the 2017 Rainy seasons, they should not have affected farmers' production decisions, consistent with the results we find.
6.1.4 O&M experiment We find no impact of empowering monitors. This is because O&M was highly effective in these irrigation schemes, and empowering monitors therefore had limited scope for changing O&M practices. Farmers reported 14% as many days without enough water during the dry seasons as they reported days using irrigation. Any event where conflict among water user group members caused insufficient water at some point during the dry season was reported for 3% of irrigated plots. This success was far from guaranteed in the early years of the schemes; site engineers have suggested that the combination of lower adoption of irrigation than the schemes are designed for and high compliance with water usage schedules among farmers have been the cause of this. Moreover, during the 2018 Dry season we found evidence that control water user groups adopted the intervention, as some members of control water user groups adopted the roles that were assigned to monitors.
6.2 Policy and program relevance: evidence uptake and use
The research team has a long-standing interaction with the Government of Rwanda, with PIs updating key stakeholders including Ministers, Permanent Secretaries, and Director Generals in the Ministry of Agriculture and RAB multiple times per year.
Results from the existing evaluation have already influenced the policy dialogue in the country and there is a strong appetite for evidence on best practices to improve the use of irrigation infrastructure. Because of this policy engagement, the government’s senior leadership adopted a resolution “to exploit underutilized irrigated land leveraging efforts of young agricultural professionals while improving land use planning and resettlement” at the most recent (Mar 8-11, 2019) country leadership retreat. Results on effects of irrigation have also informed a core elements of the current strategic plan (Strategic Plan for Structural Transformation in Agriculture Number 4, PSTA-410).
Given the low take up of irrigation despite high productivity of irrigation in Rwanda, the next step towards understand the constraints to adoption of irrigation and alleviating the same have been well received by the Ministry of Agriculture. In the academic paper
10 The irrigation study is cited on Page 48 of the PSTA-4
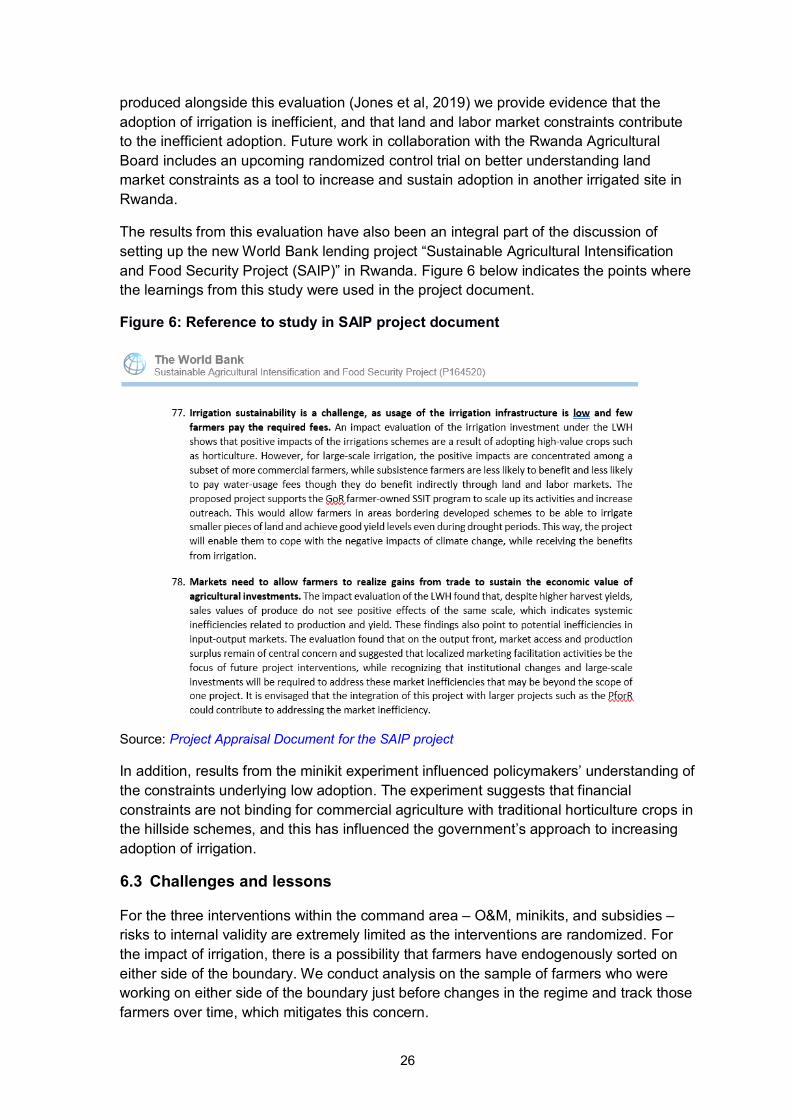
26
produced alongside this evaluation (Jones et al, 2019) we provide evidence that the adoption of irrigation is inefficient, and that land and labor market constraints contribute to the inefficient adoption. Future work in collaboration with the Rwanda Agricultural Board includes an upcoming randomized control trial on better understanding land market constraints as a tool to increase and sustain adoption in another irrigated site in Rwanda.
The results from this evaluation have also been an integral part of the discussion of setting up the new World Bank lending project “Sustainable Agricultural Intensification and Food Security Project (SAIP)” in Rwanda. Figure 6 below indicates the points where the learnings from this study were used in the project document.
Figure 6: Reference to study in SAIP project document
Source: Project Appraisal Document for the SAIP project
In addition, results from the minikit experiment influenced policymakers’ understanding of the constraints underlying low adoption. The experiment suggests that financial constraints are not binding for commercial agriculture with traditional horticulture crops in the hillside schemes, and this has influenced the government’s approach to increasing adoption of irrigation.
6.3 Challenges and lessons
For the three interventions within the command area – O&M, minikits, and subsidies – risks to internal validity are extremely limited as the interventions are randomized. For the impact of irrigation, there is a possibility that farmers have endogenously sorted on either side of the boundary. We conduct analysis on the sample of farmers who were working on either side of the boundary just before changes in the regime and track those farmers over time, which mitigates this concern.
27
There are potentially more serious issues of external validity. Our sample is based on only four irrigation sites in Rwanda. Since variation is at the individual or block level, we can still achieve statistical power in our estimation framework. However, there are not enough sites to guarantee that results would be similar at other sites which may be built. This problem seems likely generic to infrastructure interventions. On the other hand, close work with the SPIU and MINAGRI interest in results suggest that implications from our evaluation will have strong impact on policy.
7. Conclusions and recommendations
We present results on the impacts and sustainability of four hillside irrigation sites in Rwanda. Comparing plots just above the main canal (command area) to those just below the canal (command area catchment) allows us to retrieve causal estimates of irrigation on a range of outcomes, including plot-level productivity.
Using data from very proximate plots which receive differential access to irrigation, we document that the construction of an irrigation system leads to a 70% increase in cash profits. These profits are generated by a switch in cropping patterns from perennial bananas towards a rotation of dry-season horticulture and rainy-season staples, which itself is associated with an increase in input intensity. In our context, the primary increase in input demands is for household labor, which is utilized intensively on horticulture and minimally on banana cultivation. The results show that irrigation has a positive and significant impact on value of production and sales.
Additional RCTs run on the margin of this large investment suggest that minikits, irrigation fee subsidy and free demonstration resources do not have a significant impact. Our recommendation is to carefully think through the design of such programs so that each program works well in complement to the other.
Irrigation has huge potential benefits for smallholder farmers; the increases in yield and profits realized in the schemes are large and economically meaningful for smallholder farmers. However, we observe only a minority of farmers adopting this technology four years after introduction. Given the returns identified above, we take this as evidence that the existence of a productive technology is not itself sufficient to generate majority adoption in all agricultural contexts.
As a grants reporting document rather than an academic paper, this report is meant to present only on the raw impact evaluation of the irrigation scheme and the associated randomized controlled trials. In the academic paper produced as part of this effort (Jones et al, 2019) we explore further which factors may constraint irrigation take-up. In that paper, we use a series of tests to document that the low take-up of irrigation is inefficient, and we provide further evidence that land and labor market constraints reduce irrigation-take-up. We therefore conclude that addressing land and labor market constraints is key to increasing and sustaining adoption.

28
Online appendixes
Online appendix A https://www.3ieimpact.org/sites/default/files/2020-03/DPW1.1085-Rwanda-Irrigation-Online-appendix-A.pdf
Online appendix B
Online appendix B1 https://www.3ieimpact.org/sites/default/files/2020-03/DPW1.1085-Rwanda-Irrigation-Online-appendix-B1-BL-enumerator-manual.pdf Online appendix B2 https://www.3ieimpact.org/sites/default/files/2020-03/DPW1.1085-Rwanda-Irrigation-Online-appendix-B2-BL-RW-enumerator-manual.pdf Online appendix B3 https://www.3ieimpact.org/sites/default/files/2020-03/DPW1.1085-Rwanda-Irrigation-Online-appendix-B3-BL-RW-survey-instrument.xlsx Online appendix B4 https://www.3ieimpact.org/sites/default/files/2020-03/DPW1.1085-Rwanda-Irrigation-Online-appendix-B4-BL-survey-instrument.xlsx Online appendix B5 https://www.3ieimpact.org/sites/default/files/2020-03/DPW1.1085-Rwanda-Irrigation-Online-appendix-B5-FUP1-enumerator-manual.pdf Online appendix B6 https://www.3ieimpact.org/sites/default/files/2020-03/DPW1.1085-Rwanda-Irrigation-Online-appendix-B6-FUP1-RW-enumerator-manual.pdf Online appendix B7 https://www.3ieimpact.org/sites/default/files/2020-03/DPW1.1085-Rwanda-Irrigation-Online-appendix-B7-FUP1-RW-survey-instrument.xlsx Online appendix B8 https://www.3ieimpact.org/sites/default/files/2020-03/DPW1.1085-Rwanda-Irrigation-Online-appendix-B8-FUP1-survey-instrument.xlsx Online appendix B9 https://www.3ieimpact.org/sites/default/files/2020-03/DPW1.1085-Rwanda-Irrigation-Online-appendix-B9-FUP2-enumerator-manual.pdf Online appendix B10 https://www.3ieimpact.org/sites/default/files/2020-03/DPW1.1085-Rwanda-Irrigation-Online-appendix-B10-FUP2-survey-instrument.xlsx Online appendix B11 https://www.3ieimpact.org/sites/default/files/2020-03/DPW1.1085-Rwanda-Irrigation-Online-appendix-B11-FUP3-enumerator-manual.pdf Online appendix B12 https://www.3ieimpact.org/sites/default/files/2020-03/DPW1.1085-Rwanda-Irrigation-Online-appendix-B12-FUP3-survey-instrument.xlsx
Online appendix C https://www.3ieimpact.org/sites/default/files/2020-03/DPW1.1085-Rwanda-Irrigation-Online-appendix-C.pdf
29
Online appendix D https://www.3ieimpact.org/sites/default/files/2020-03/DPW1.1085-Rwanda-Irrigation-Online-appendix-D.pdf
Online appendix E https://www.3ieimpact.org/sites/default/files/2020-03/DPW1.1085-Rwanda-Irrigation-Online-appendix-E.xlsx
Online appendix F https://www.3ieimpact.org/sites/default/files/2020-03/DPW1.1085-Rwanda-Irrigation-Online-appendix-F.xlsx

30
References
Alesina, A., Baqir, R., & Easterly, W. (2000). Redistributive public employment. Journal of Urban Economics, 48(2), 219-241.
Baird, S., Bohren, A., McIntosh, C., & Ozler, B. (2012). Designing experiments to measure spillover and threshold effects. IZA WP6681.
BenYishay, A., & Mobarak, A. M. (2015). Social Learning and Incentives for Experimentation and Communication. Manuscript Submitted for Publication.
Benyishay, A & Jones, M R & Kondylis, F.& Mobarak, A. M., 2016. "Are gender differences in performance innate or socially mediated ? ," Policy Research Working Paper Series 7689, The World Bank.
Conley, T. G., & Udry, C. R. (2010). Learning about a new technology: Pineapple in Ghana. The American Economic Review, 35-69.
Dayton-Johnson, J. (2000). Determinants of collective action on the local commons: a model with evidence from Mexico. Journal of Development Economics, 62(1), 181-208.
Dillon, A. (2011). The effect of irrigation on poverty reduction, asset accumulation, and informal insurance: Evidence from Northern Mali. World Development, 39(12), 2165–2175.
Dillon, A. and R. Fishman (2019). Dams: Effects of Hydrological infrastructure on Development. Annual Review of Resource Economics.
Duflo, E. & Pande, R. (2007). Dams. The Quarterly Journal of Economics, 122(2), 601–646.
Galiani, S., Gertler, P., & Schargrodsky, E. (2005). Water for life: The impact of the privatization of water services on child mortality. Journal of political economy, 113(1), 83-120.
Glennerster, R., Miguel, E., & Rothenberg, A. D. (2013). Collective action in diverse Sierra Leone communities. The Economic Journal, 123(568), 285-316.
Goldstein, M. and Udry, C. (1999), ‘Agricultural Innovation and Resource Management in Ghana’, report to International Food Policy Research Institute.
Hussain, I., & Hanjra, M. A. (2004). Irrigation and poverty alleviation: review of the empirical evidence. Irrigation and Drainage, 53(1), 1-15.
IFPRI (2010), IFPRI 2010 Annual Report
Jacoby, H. G. (2017). “Well-fare” Economics of Groundwater in South Asia. The World Bank Research Observer, 32(1), 1–20.
Jones, M. R., Kondylis, F., Mobarak, A. M., & Stein, D. (2019). Learning by doing: Evidence from Bangladesh. Manuscript in Preparation.
31
Jones, M.R., Kondylis, F., Loeser, J. A., and J. Magruder (2019). “Factor Market Failures and the Adoption of Irrigation in Rwanda”. World Bank Policy Research Working Paper no 9092.
Kondylis, F., Mueller, V., & Zhu, S. J. (2014). Seeing is believing? Evidence from an extension network experiment. Evidence from an Extension Network Experiment (August 1, 2014). World Bank Policy Research Working Paper, (7000).
Magruder, J. R. (2012). High unemployment yet few small firms: The role of centralized bargaining in South Africa. American Economic Journal: Applied Economics, 138-166.
Magruder, J. R. (2013). Can minimum wages cause a big push? Evidence from Indonesia. Journal of Development Economics, 100(1), 48-62.
Ministry of Finance and Economic Planning (MINECOFIN) (I), Republic of Rwanda, Rwanda Vision 2020, http://www.minecofin.gov.rw/fileadmin/templates/documents/NDPR/Vision_2020_.pdf
Sekhri, S. (2014). Wells, water, and welfare: the impact of access to groundwater on rural poverty and conflict. American Economic Journal: Applied Economics, 6(3), 76–102.

32
Other publications in the 3ie Impact Evaluation Report Series
The following reports are available from http://3ieimpact.org/evidence-hub/publications/impact-evaluations
Continuous Emissions Monitoring Systems (CEMS) in India, 3ie Impact Evaluation Report 111. Greenstone, M, Pande, R, Ryan, N and Sudarshan A, 2020.
Evaluating the impacts of the Dar es Salaam Bus Rapid Transit System, 3ie Impact Evaluation Report 110. Morten, M, Bryan, G, Siddiqi, B, Balboni, C, 2020.
Access to safe drinking water: experimental evidence from new water sources in Bangladesh, 3ie Impact Evaluation Report 109. Cocciolo, S, Ghisolfi, S, Habib, A, Rashid, SMA and Tompsett, A, 2020.
Impact of alternate wetting and drying on farm incomes and water savings in Bangladesh, 3ie Impact Evaluation Report 108. Chakravorty, U, Dar, MH, Emerick, K, 2020.
The effects of vouchers for essential household items on child health, mental health, resilience and social cohesion among internally displaced persons in the Democratic Republic of Congo, 3ie Impact Evaluation Report 107. Quattrochi, J, Bisimwa, G, Thompson, T, van der Windt, P and Voors, M, 2020.
Measuring impacts of conservation interventions on human well-being and the environment in Northern Cambodia, 3ie Impact Evaluation Report 106. Clements, T, Neang, M, Milner-Gulland, EJ and Travers, H, 2020.
The 5 Star Toilet Campaign: improving toilet use in rural Gujarat, 3ie Impact Evaluation Report 105. Chauhan, K, Schmidt, WP, Aunger, R, Gopalan, B, Saxena, D, Yashobant, S, Patwardhan, V, Bhavsar, P, Mavalankar, D and Curtis, V, 2020.
How education about maternal health risk can change the gender gap in the demand for family planning in Zambia, 3ie Impact Evaluation Report 104. Ashraf, N, Field, E, Voena, A and Ziparo, R, 2019.
In search of the holy grail: can unconditional cash transfers graduate households out of poverty in Zambia?, Impact Evaluation Report 103. Handa, S, Tembo, G, Natali, L, Angeles, G and Spektor, G, 2019.
Increasing HIV self-testing and linkage to care for partners of women in antenatal care in Uganda, Impact Evaluation Report 102. Wanyenze, R, Buregyeya, E, Matovu, J, Kisa, R, Kagaayi, J, Vrana-Diaz, C, Malek, A, Musoke, W, Chemusto, H, Mukama, S and Korte, J, 2019.
Improving the quality of care for children with acute malnutrition in Uganda, 3ie Impact Evaluation Report 101. Marzia, L, Wanzira, H, Lochoro, P and Putoto, G, 2019.
Impacts of increasing community resilience through humanitarian aid in Pakistan, 3ie Impact Evaluation Report 100. Avdeenko, A and Frölich, M, 2019.

33
Impacts of community monitoring of socio-environmental liabilities in the Ecuadorian and Peruvian Amazon, 3ie Impact Evaluation Report 99. Pellegrini, L, 2019.
Increasing HIV testing demand among Kenyan truck drivers and female sex workers, 3ie Impact Evaluation Report 98. Kelvin, E, George, G, Mwai, E, Kinyanjui, S, Inoti, S, Chetty, T, Strauss, M, Romo, M, Oruko, F, Odhiambo J, Nyaga, E, Mantell, J and Govender, K, 2019.
Impacts of community stakeholder engagement interventions in Ugandan oil extractives, 3ie Impact Evaluation Report 97. Parker, R, Coleman, E, Manyindo, J, Schultz, B and Mukuru, E, 2019.
The impacts of formal registration of businesses in Malawi, 3ie Impact Evaluation Report 96. Campos, F, Goldstein, M and McKenzie, D, 2019.
Unpacking the determinants of entrepreneurship development and economic empowerment for women in Kenya, 3ie Impact Evaluation Report 95. McKenzie, D, Puerto, S and Odhiambo, F, 2019.
Impacts of key provisions in Ghana’s Petroleum Revenue Management Act, 3ie Impact Evaluation Report 94. Edjekumhene, I, Voors, M, Lujala, P, Brunnschweiler, C, Owusu, CK and Nyamekye, A, 2019.
Using information to break the political resource curse in natural gas management in Mozambique, 3ie Impact Evaluation Report 93. Armand, A, Costa, AI, Coutts, A, Vicente, P and Vilela, I, 2019.
Harnessing transparency initiatives to improve India's environmental clearance process for the mineral mining sector, 3ie Impact Evaluation Report 92. Pande, R and Sudarshan, A, 2019.
Impacts of removing user fees for maternal health services on universal health coverage in Kenya, 3ie Impact Evaluation Report 91. Abuya, T, Dennis, M, Matanda, D, Obare, F and Bellows, B, 2018.
Impact of voice reminders to reinforce harvest aggregation services training for farmers in Mali, 3ie Impact Evaluation Report 90. Osei, RD, Dzanku, FM, Osei-Akoto, I, Asante, F, Hodey, LS, Adu, PN, Adu-Ababio, K and Coulibaly, M, 2018.
Impacts of Breakthrough’s school-based gender attitude change programme in Haryana, India, 3ie Impact Evaluation Report 89. Jayachandran, S, Jain, T and Dhar, D, 2018.
Hotspot interventions at scale: the effects of policing and city services on crime in Bogotá, Colombia, 3ie Impact Evaluation Report 88. Blattman, C, Green, D, Ortega, D and Tobón, S, 2018.
Impact evaluation of the Philippine Special Program for Employment of Students, 3ie Impact Evaluation Report 87. Beam, E, Linden, L, Quimbo, S and Richmond, H, 2018.

34
Community-based distribution of oral HIV self-testing kits: experimental evidence from Zambia, 3ie Impact Evaluation Report 86. Hensen, B, Ayles, H, Mulubwa, C, Floyd, S, Schaap, A, Chiti, B, Phiri, M, Mwenge, L, Simwinga, M, Fidler S, Hayes, R, Bond, V and Mwinga, A, 2018.
Evaluating the economic impacts of rural banking: experimental evidence from southern India, 3ie Impact Evaluation Report 85. Field, E and Pande, R, 2018.
Direct provision versus facility collection of HIV tests: impacts of self-testing among female sex workers in Uganda. 3ie Impact Evaluation Report 84. Ortblad, K, Musoke, DK, Ngabirano, T, Oldenburg, C and Bärnighausen, T, 2018.
Increasing female sex worker HIV testing: effects of peer educators and HIV self-tests in Zambia, 3ie Impact Evaluation Report 83. Chanda, MM, Ortblad, KF, Mwale, M, Chongo, S, Kanchele, C, Kamungoma, N, Fullem, A, Bärnighausen, T and Oldenburg, CE, 2018.
Community delivery of antiretroviral drugs: a non-inferiority matched-pair pragmatic cluster-randomized trial in Dar es Salaam, Tanzania, 3ie Impact Evaluation Report 82. Francis, JM, Geldsetzer, P, Asmus, G, Ulenga, N, Ambikapathi, R, Sando, D, Fawzi, W and Bärnighausen, T, 2018.
Nourishing the future: targeting infants and their caregivers to reduce undernutrition in rural China, 3ie Impact Evaluation Report 81. Cai, J, Luo, R, Li, H, Lien, J, Medina, A, Zhou, H and Zhang, L, 2018.
Impacts of the World Food Programme’s interventions to treat malnutrition in Niger. 3ie Impact Evaluation Report 80. Brück, T, Ferguson, NTN, Ouédraogo, J and Ziegelhöfer, Z, 2018.
Impact evaluation of the World Food Programme’s moderate acute malnutrition treatment and prevention programmes in Sudan. 3ie Impact Evaluation Report 79. Guevarra, E, Mandalazi, E, Balegamire, S, Albrektsen, K, Sadler, K, Abdelsalam, K, Urrea, G and Alawad, S, 2018.
Impact evaluation of WFP’s programs targeting moderate acute malnutrition in humanitarian situations in Chad. 3ie Impact Evaluation Report 78. Saboya, M, Rudiger, J, Frize, J, Ruegenberg, D, Rodríguez Seco, A and McMillon, C, 2018.
Improving midday meal delivery and encouraging micronutrient fortification among children in India, 3ie Impact Evaluation Report 77. Shastry, GK, Berry, J, Mukherjee, P, Mehta, S and Ruebeck, H, 2018.
Evaluation of infant development centres: an early years intervention in Colombia, 3ie Impact Evaluation Report 76. Andrew, A, Attanasio, O, Bernal, R, Cordona, L, Krutikova, S, Heredia, DM, Medina, C, Peña, X, Rubio-Codina, M and Vera-Hernandez, M, 2018.
Can the wounds of war be healed? Experimental evidence on reconciliation in Sierra Leone. 3ie Impact Evaluation Report 75. Cilliers, J, Dube, O and Siddiqi, B, 2018.

35
Impact evaluation of the Menabe and Melaky development programme in Madagascar, 3ie Impact Evaluation Report 74. Ring, H, Morey, M, Kavanagh, E, Kamto, K, McCarthy, N, Brubaker, J and Rakotondrafara, C, 2018.
Impact evaluation of the Smallholder Dairy Commercialization Programme in Kenya, 3ie Impact Evaluation Report 73. Bonilla, J, McCarthy, N, Mugatha, S, Rai, N, Coombes, A and Brubaker, J, 2018.
Impact and adoption of risk-reducing drought-tolerant rice in India, 3ie Impact Evaluation Report 72. Yamano, T, Dar, MH, Panda, A, Gupta, I, Malabayabas, ML and Kelly, E, 2018.
Poverty and empowerment impacts of the Bihar Rural Livelihoods Project in India, 3ie Impact Evaluation Report 71. Hoffmann, V, Rao, V, Datta, U, Sanyal, P, Surendra, V and Majumdar, S 2018.
How should Tanzania use its natural gas? Citizens’ views from a nationwide Deliberative Poll, 3ie Impact Evaluation Report 70. Birdsall, N, Fishkin, J, Haqqi, F, Kinyondo, A, Moyo, M, Richmond, J and Sandefur, J, 2018.
Impact evaluation of the conditional cash transfer program for secondary school attendance in Macedonia, 3ie Impact Evaluation Report 69. Armand, A and Carneiro, P, 2018.
Age at marriage, women’s education, and mother and child outcomes in Bangladesh, 3ie Impact Evaluation Report 68. Field, E, Glennerster, R, Nazneen, S, Pimkina, S, Sen, I and Buchmann, N, 2018.
Evaluating agricultural information dissemination in western Kenya, 3ie Impact Evaluation Report 67. Fabregas, R, Kremer, M, Robinson, J and Schilbach, F, 2017.
General equilibrium impact assessment of the Productive Safety Net Program in Ethiopia, 3ie Impact Evaluation Report 66. Filipski, M, Taylor, JE, Abegaz, GA, Ferede, T, Taffesse, AS and Diao, X, 2017.
Impact of the Uddeepan programme on child health and nutrition in India, 3ie Impact Evaluation Report 65. Kochar, A, Sharma, A and Sharma, A, 2017.
Evaluating oral HIV self-testing to increase HIV testing uptake among truck drivers in Kenya, 3ie Impact Evaluation Report 64. Kelvin, EA, Mwai, E, Romo, ML, George, G, Govender, K, Mantell, JE, Strauss, M, Nyaga, EN and Odhiambo, JO, 2017.
Integration of EPI and paediatric HIV services for improved ART initiation in Zimbabwe, 3ie Impact Evaluation Report 63. Prescott, M, Boeke, C, Gotora, T, Mafaune, HW, Motsi, W, Graves, J, Mangwiro, A and McCarthy, E, 2017.
Increasing male partner HIV testing using self-test kits in Kenya, 3ie Impact Evaluation Report 62. Gichangi, A, Korte, JE, Wambua, J, Vrana, C and Stevens, D, 2017.
Evaluating the impact of community health worker integration into prevention of mother-to-child transmission of HIV services in Tanzania, 3ie Impact Evaluation Report 61. Nance, N, McCoy, S, Ngilangwa, D, Masanja, J, Njau, P and Noronha, R, 2017.

36
Using HIV self-testing to promote male partner and couples testing in Kenya, 3ie Impact Evaluation Report 60. Thirumurthy, H, Omanga, E, Obonyo, B, Masters, S and Agot, K, 2017.
Increasing male partner HIV self-testing at antenatal care clinics in Kenya, 3ie Impact Evaluation Report 59. Gichangi, A, Korte, JE, Wambua, J, Vrana, C and Stevens, D, 2017.
Impact of free availability of public childcare on labour supply and child development in Brazil, 3ie Impact Evaluation Report 58. Attanasio, O, Paes de Barros, R, Carneiro, P, Evans, D, Lima, L, Olinto, P and Schady, N, 2017.
Estimating the effects of a low-cost early stimulation and parenting education programme in Mexico, 3ie Impact Evaluation Report 57. Cardenas, S, Evans, D and Holland, P, 2017.
The Better Obstetrics in Rural Nigeria study: an impact evaluation of the Nigerian Midwives Service Scheme, 3ie Impact Evaluation Report 56. Okeke, E, Glick, P, Abubakar, IS, Chari, AV, Pitchforth, E, Exley, J, Bashir, U, Setodji, C, Gu, K and Onwujekwe, O, 2017.
The Productive Safety Net Programme in Ethiopia: impacts on children’s schooling, labour and nutritional status, 3ie Impact Evaluation Report 55. Berhane, G, Hoddinott, J, Kumar, N and Margolies, A, 2016.
The impact of youth skills training on the financial behaviour, employability and educational choice in Morocco, 3ie Impact Evaluation Report 54. Bausch, J, Dyer, P, Gardiner, D, Kluve, J and Mizrokhi, E, 2016.
Using advertisements to create demand for voluntary medical male circumcision in South Africa, 3ie Impact Evaluation Report 53. Frade, S, Friedman, W, Rech, D and Wilson, N, 2016.
The use of peer referral incentives to increase demand for voluntary medical male circumcision in Zambia, 3ie Impact Evaluation Report 52. Zanolini, A, Bolton, C, Lyabola, LL, Phiri, G, Samona, A, Kaonga, A and Harsha Thirumurthy, H, 2016.
Using smartphone raffles to increase demand for voluntary medical male circumcision in Tanzania, 3ie Impact Evaluation Report 51. Mahler, H and Bazant, E, 2016.
Voluntary medical male circumcision uptake through soccer in Zimbabwe, 3ie Impact Evaluation Report 50. DeCelles, J, Kaufman, Z, Bhauti, K, Hershow, R, Weiss, H, Chaibva, C, Moyo, N, Braunschweig, E, Mantula, F, Hatzold, K and Ross, D, 2016.
Measuring the impact of SMS-based interventions on uptake of voluntary medical male circumcision in Zambia, 3ie Impact Evaluation Report 49. Leiby, K, Connor, A, Tsague, L, Sapele, C, Koanga, A, Kakaire, J and Wang, P, 2016.

37
Assessing the impact of delivering messages through intimate partners to create demand for voluntary medical male circumcision in Uganda, 3ie Impact Evaluation Report 48. Semeere, AS, Bbaale, DS, Castelnuovo, B, Kiragga, A, Kigozi, J, Muganzi, A, Kambugu, A and Coutinho, AG, 2016.
Optimising the use of economic interventions to increase demand for voluntary medical male circumcision in Kenya, 3ie Impact Evaluation Report 47. Thirumurthy, H, Omanga, E, Rao, SO, Murray, K, Masters, S and Agot, K, 2016.
The impact of earned and windfall cash transfers on livelihoods and conservation in Sierra Leone, 3ie Impact Evaluation Report 46. Bulte, E, Conteh, B, Kontoleon, A, List, J, Mokuwa, E, Richards, P, Turley, T and Voors, M, 2016.
Property tax experiment in Pakistan: Incentivising tax collection and improving performance, 3ie Impact Evaluation Report 45. Khan, A, Khwaja, A and Olken, B, 2016.
Impact of mobile message reminders on tuberculosis treatment outcomes in Pakistan, 3ie Impact Evaluation Report 44. Mohammed, S, Glennerster, R and Khan, A, 2016.
Making networks work for policy: Evidence from agricultural technology adoption in Malawi, 3ie Impact Evaluation Report 43. Beaman, L, BenYishay, A, Fatch, P, Magruder, J and Mobarak, AM, 2016.
Estimating the impact and cost-effectiveness of expanding access to secondary education in Ghana, 3ie Impact Evaluation Report 42. Dupas, P, Duflo, E and Kremer, M, 2016.
Evaluating the effectiveness of computers as tutors in China, 3ie Impact Evaluation Report 41. Mo, D, Bai, Y, Boswell, M and Rozelle, S, 2016.
Micro entrepreneurship support programme in Chile, 3ie Impact Evaluation Report 40. Martínez, CA, Puentes, EE and Ruiz-Tagle, JV, 2016.
Thirty-five years later: evaluating the impacts of a child health and family planning programme in Bangladesh, 3ie Impact Evaluation Report 39. Barham, T, Kuhn, R, Menken, J and Razzaque, A, 2016.
Effectiveness of a rural sanitation programme on diarrhoea, soil-transmitted helminth infection and malnutrition in India, 3ie Impact Evaluation Report 38. Clasen, T, Boisson, S, Routray, P, Torondel, B, Bell, M, Cumming, O, Ensink, J, Freeman, M and Jenkins, M, 2016.
Evaluating the impact of vocational education vouchers on out-of-school youth in Kenya, 3ie Impact Evaluation Report 37. Hicks, JH, Kremer, M, Mbiti, I and Miguel, E, 2016.
Removing barriers to higher education in Chile: evaluation of peer effects and scholarships for test preparation, 3ie Impact Evaluation Report 36. Banerjee, A, Duflo E and Gallego, F, 2016.
Sustainability of impact: dimensions of decline and persistence in adopting a biofortified crop in Uganda, 3ie Impact Evaluation Report 35. McNiven, S, Gilligan, DO and Hotz, C 2016.

38
A triple win? The impact of Tanzania’s Joint Forest Management programme on livelihoods, governance and forests, 3ie Impact Evaluation Report 34. Persha, L and Meshack, C, 2016.
The effect of conditional transfers on intimate partner violence: evidence from Northern Ecuador, 3ie Impact Evaluation Report 33. Hidrobo, M, Peterman, A and Heise, L, 2016.
The effect of transfers and preschool on children’s cognitive development in Uganda, 3ie Impact Evaluation Report 32. Gillian, DO and Roy, S, 2016.
Can egovernance reduce capture of public programmes? Experimental evidence from India’s employment guarantee, 3ie Impact Evaluation Report 31. Banerjee, A, Duflo, E, Imbert, C, Mathew, S and Pande, R, 2015.
Improving maternal and child health in India: evaluating demand and supply strategies, 3ie Impact Evaluation Report 30. Mohanan, M, Miller, G, Forgia, GL, Shekhar, S and Singh, K, 2016.
Smallholder access to weather securities in India: demand and impact on production decisions, 3ie Impact Evaluation Report 28. Ceballos, F, Manuel, I, Robles, M and Butler, A, 2015.
What happens once the intervention ends? The medium-term impacts of a cash transfer programme in Malawi, 3ie Impact Evaluation Report 27. Baird, S, Chirwa, E, McIntosh, C and Özler, B, 2015.
Validation of hearing screening procedures in Ecuadorian schools, 3ie Impact Evaluation Report 26. Muñoz, K, White, K, Callow-Heusser, C and Ortiz, E, 2015.
Assessing the impact of farmer field schools on fertilizer use in China, 3ie Impact Evaluation Report 25. Burger, N, Fu, M, Gu, K, Jia, X, Kumar, KB and Mingliang, G, 2015.
The SASA! study: a cluster randomised trial to assess the impact of a violence and HIV prevention programme in Kampala, Uganda, 3ie Impact Evaluation Report 24. Watts, C, Devries, K, Kiss, L, Abramsky, T, Kyegombe, N and Michau, L, 2014.
Enhancing food production and food security through improved inputs: an evaluation of Tanzania’s National Agricultural Input Voucher Scheme with a focus on gender impacts, 3ie Impact Evaluation Report 23. Gine, X, Patel, S, Cuellar-Martinez, C, McCoy, S and Lauren, R, 2015.
A wide angle view of learning: evaluation of the CCE and LEP programmes in Haryana, 3ie Impact Evaluation Report 22. Duflo, E, Berry, J, Mukerji, S and Shotland, M, 2015.
Shelter from the storm: upgrading housing infrastructure in Latin American slums, 3ie Impact Evaluation Report 21. Galiani, S, Gertler, P, Cooper, R, Martinez, S, Ross, A and Undurraga, R, 2015.
Environmental and socioeconomic impacts of Mexico’s payments for ecosystem services programme, 3ie Impact Evaluation Report 20. Alix-Garcia, J, Aronson, G, Radeloff, V, Ramirez-Reyes, C, Shapiro, E, Sims, K and Yañez-Pagans, P, 2015.

39
A randomised evaluation of the effects of an agricultural insurance programme on rural households’ behaviour: evidence from China, 3ie Impact Evaluation Report 19. Cai, J, de Janvry, A and Sadoulet, E, 2014.
Impact of malaria control and enhanced literacy instruction on educational outcomes among school children in Kenya: a multi-sectoral, prospective, randomised evaluation, 3ie Impact Evaluation Report 18. Brooker, S and Halliday, K, 2015.
Assessing long-term impacts of conditional cash transfers on children and young adults in rural Nicaragua, 3ie Impact Evaluation Report 17. Barham, T, Macours, K, Maluccio, JA, Regalia, F, Aguilera, V and Moncada, ME, 2014.
The impact of mother literacy and participation programmes on child learning: evidence from a randomised evaluation in India, 3ie Impact Evaluation Report 16. Banerji, R, Berry, J and Shortland, M, 2014.
A youth wage subsidy experiment for South Africa, 3ie Impact Evaluation Report 15. Levinsohn, J, Rankin, N, Roberts, G and Schöer, V, 2014.
Providing collateral and improving product market access for smallholder farmers: a randomised evaluation of inventory credit in Sierra Leone, 3ie Impact Evaluation Report 14. Casaburi, L, Glennerster, R, Suri, T and Kamara, S, 2014.
Scaling up male circumcision service provision: results from a randomised evaluation in Malawi, 3ie Impact Evaluation Report 13. Thornton, R, Chinkhumba, J, Godlonton, S and Pierotti, R, 2014.
Targeting the poor: evidence from a field experiment in Indonesia, 3ie Impact Evaluation Report 12. Atlas, V, Banerjee, A, Hanna, R, Olken, B, Wai-poi, M and Purnamasari, R, 2014.
An impact evaluation of information disclosure on elected representatives’ performance: evidence from rural and urban India, 3ie Impact Evaluation Report 11. Banerjee, A, Duflo, E, Imbert, C, Pande, R, Walton, M and Mahapatra, B, 2014.
Truth-telling by third-party audits and the response of polluting firms: Experimental evidence from India, 3ie Impact Evaluation Report 10. Duflo, E, Greenstone, M, Pande, R and Ryan, N, 2013.
No margin, no mission? Evaluating the role of incentives in the distribution of public goods in Zambia, 3ie Impact Evaluation Report 9. Ashraf, N, Bandiera, O and Jack, K, 2013.
Paying for performance in China’s battle against anaemia, 3ie Impact Evaluation Report 8. Zhang, L, Rozelle, S and Shi, Y, 2013.
Social and economic impacts of Tuungane: final report on the effects of a community-driven reconstruction programme in the Democratic Republic of Congo, 3ie Impact Evaluation Report 7. Humphreys, M, Sanchez de la Sierra, R and van der Windt, P, 2013.

40
The impact of daycare on maternal labour supply and child development in Mexico, 3ie Impact Evaluation Report 6. Angeles, G, Gadsden, P, Galiani, S, Gertler, P, Herrera, A, Kariger, P and Seira, E, 2014.
Impact evaluation of the non-contributory social pension programme 70 y más in Mexico, 3ie Impact Evaluation Report 5. Rodríguez, A, Espinoza, B, Tamayo, K, Pereda, P, Góngora, V, Tagliaferro, G and Solís, M, 2014.
Does marginal cost pricing of electricity affect groundwater pumping behaviour of farmers? Evidence from India, 3ie Impact Evaluation Report 4. Meenakshi, JV, Banerji, A, Mukherji, A and Gupta, A, 2013.
The GoBifo project evaluation report: Assessing the impacts of community-driven development in Sierra Leone, 3ie Impact Evaluation Report 3. Casey, K, Glennerster, R and Miguel, E, 2013.
A rapid assessment randomised-controlled trial of improved cookstoves in rural Ghana, 3ie Impact Evaluation Report 2. Burwen, J and Levine, DI, 2012.
The promise of preschool in Africa: A randomised impact evaluation of early childhood development in rural Mozambique, 3ie Impact Evaluation Report 1. Martinez, S, Naudeau, S and Pereira, V, 2012.

Smallholder farmers in Rwanda depend on rain-fed agriculture for their livelihood, which is vulnerable to climate variation. Investing in irrigation infrastructure can support cultivation during dry seasons and mitigate the effects of climate variability. Since the implementation of such irrigation schemes can be costly, it is important to consider both the cost-effectiveness and the sustainability of these investments. Authors of this study examine the impacts of five hillside irrigation schemes on the welfare of smallholder farmers in five districts in Rwanda.
Impact Evaluation Series
International Initiative for Impact Evaluation 202-203, Rectangle One D-4, Saket District Centre New Delhi – 110017 India
[email protected] Tel: +91 11 4989 4444
www.3ieimpact.org