impacts as a source of acoustic pulse-echo energy for ...impacts as a source of acoustic pulse-echo...
TRANSCRIPT

AD-A264 368 Technical IAeport REMR-CS-40ftill'llAprr 1993 " "' 'uO Army ",orps
of EngineersWaterways ExperimentStation
Repair, Evaluation, Maintenance, and Rehabilitation Research Program
Impacts as a Source of Acoustic Pulse-EchoEnergy for Nondestructive Testingof Concrete Structures
by A. Michel AlexanderStructures Laboratory
DTIC_S ELECTE
MAY 191993 US~A
Reproduced From
Approved For Public Release; Distribution Is Unlimited Best Available Copy
93-11076
93 5 18 037
Prepared for Headquarters, U.S. Army Corps of Engineers

The folIow inc tww letters used as pan of the number dci gnating technmc:l reponri,,I ro a .I n i-under the Repair. Evaluation. Maintenance. and Rehahilitation iREMR) Re,can .h Pr cg awproblem area under ,.khich the report wa.s prepared:
Problem Area Prohlem' \rca
CS Concrete and Steel Structures E\ Electrical and .MechanieaIGTY Geotechnicat El Environmental Ilnipaci,HlY Hydraulics OM Operatons Marnacemc'tCo Coastal
The contents of this report are not to be used tor advertising.publication, or promotional purpo.;es. Citation of tradenames does not constitute an official endorsement or appro•:1 ofthe use of such commercial products.
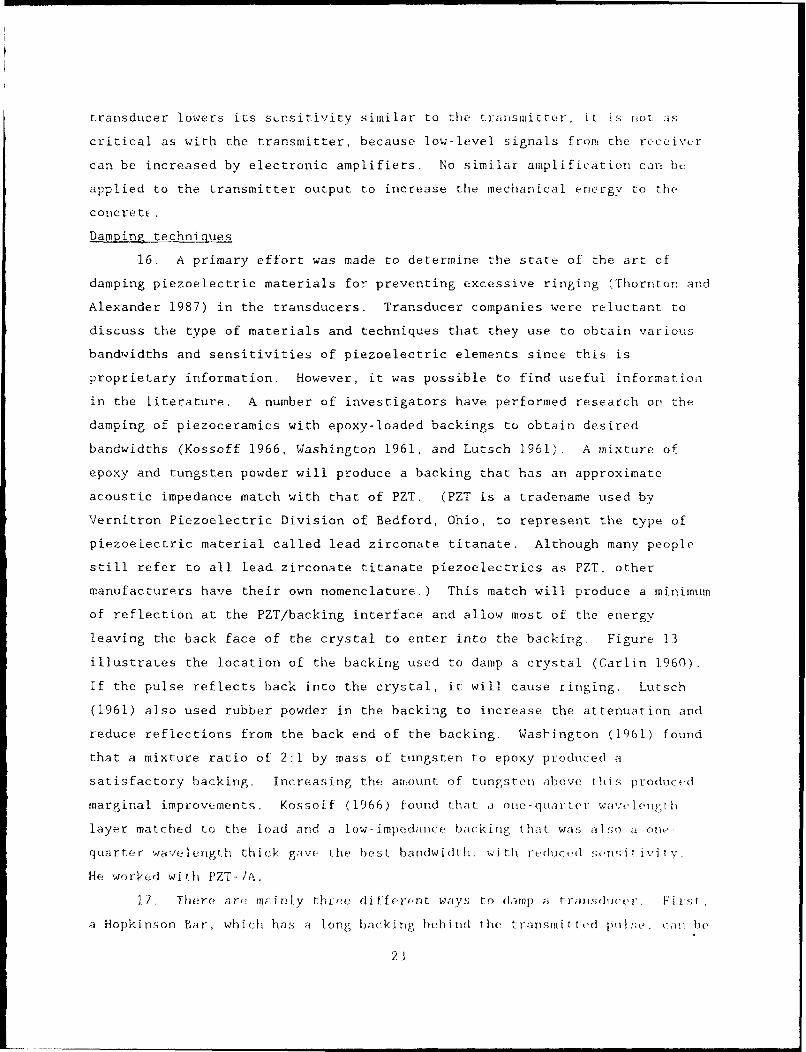
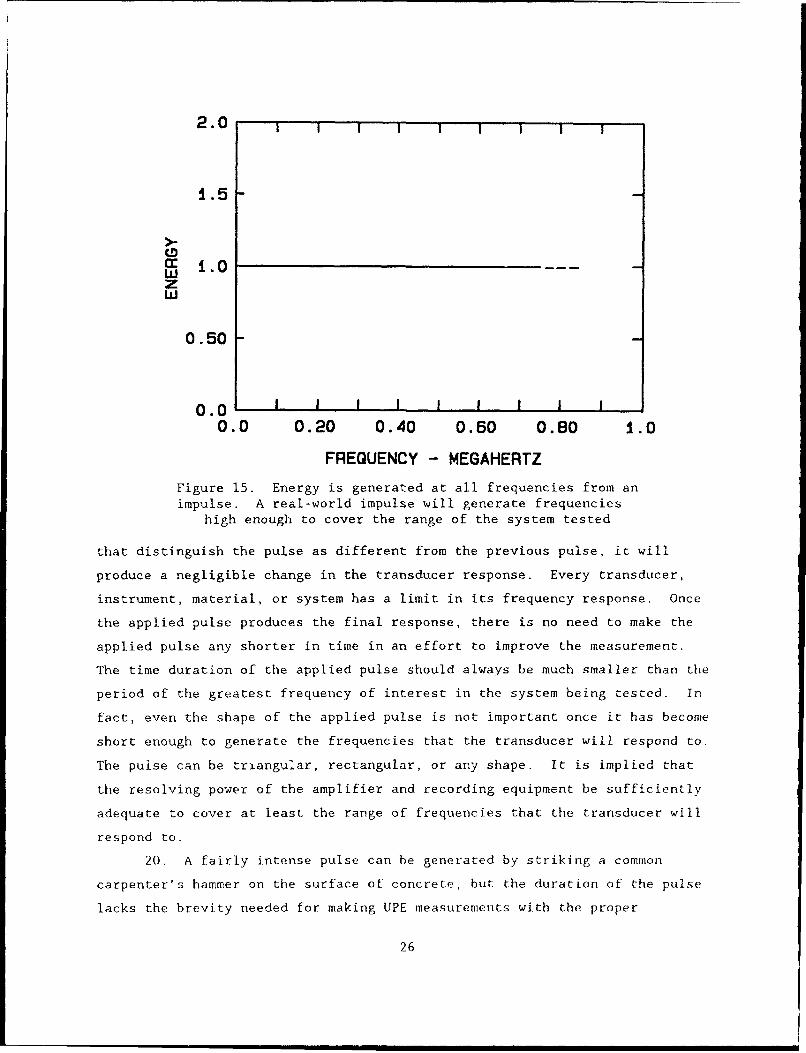
PRINTED ON RECYCLED PAPER
Repair, Evaluation, Maintenance, and Technical Report REMR CS-40Rehabilitation Research Program Aprd 1993
Impacts as a Source of Acoustic Pulse-EchoEnergy for Nondestructive Testingof Concrete Structuresby A. Michel Alexander
Structures Laboratory
U.S. Army Corps of EngineersWaterways Experiment Station3909 Halls Ferry RoadVicksburg, MS 39180-6199
................................................. ....... ....
Di it
Final report
Approved for public release; distribution is unlimited
Prepared for U.S. Army Corps of EngineersWashington, DC 20314-1000
,-/
US Army Corps /of EngineersWaterways Experiment N
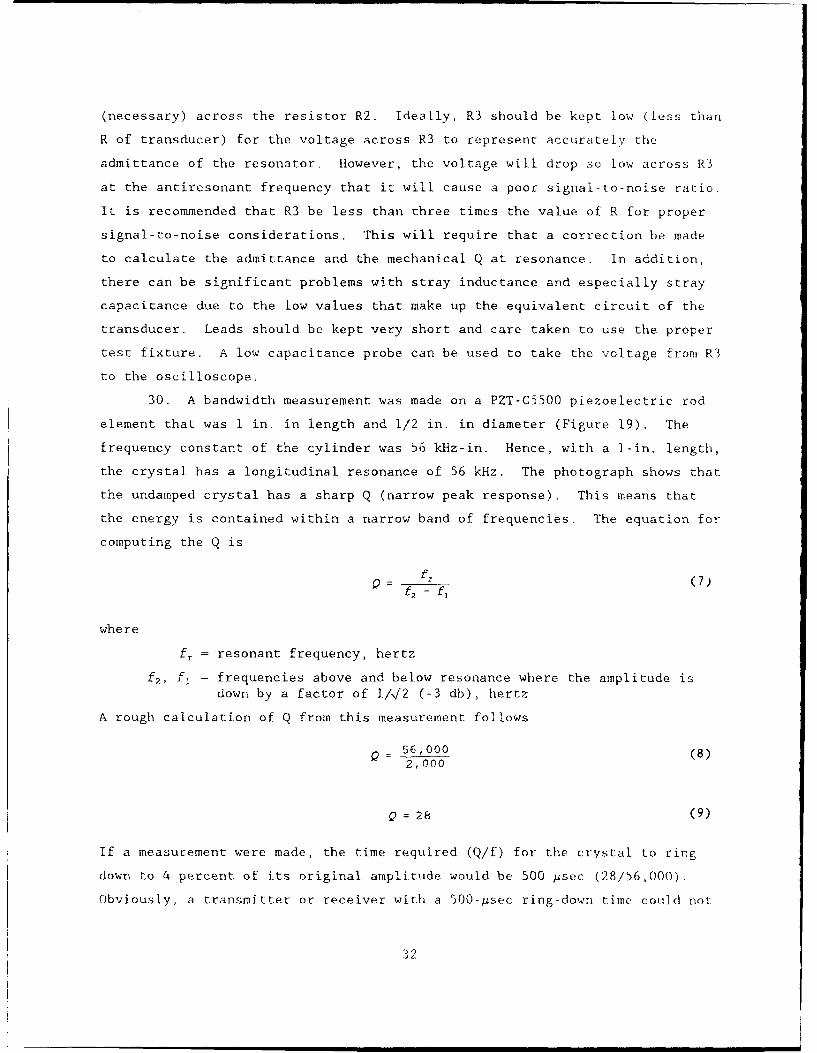
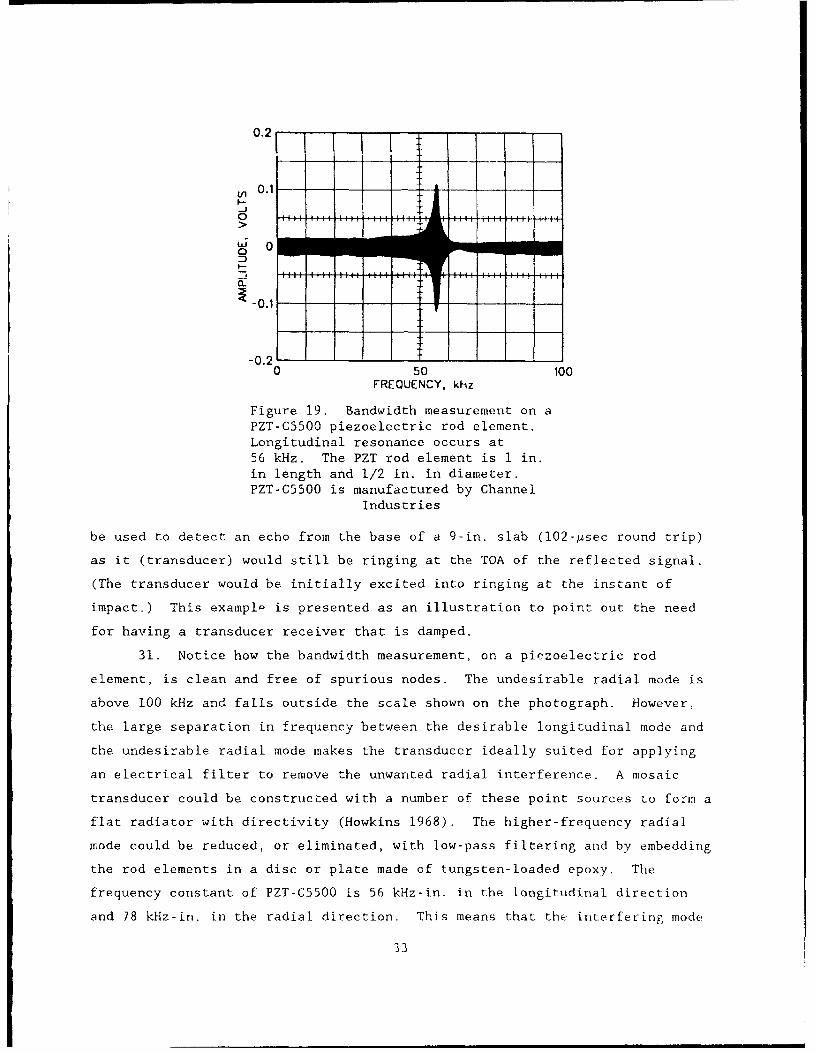
Station'rE CkOMOG Y
-AR A TEO Y S
7/
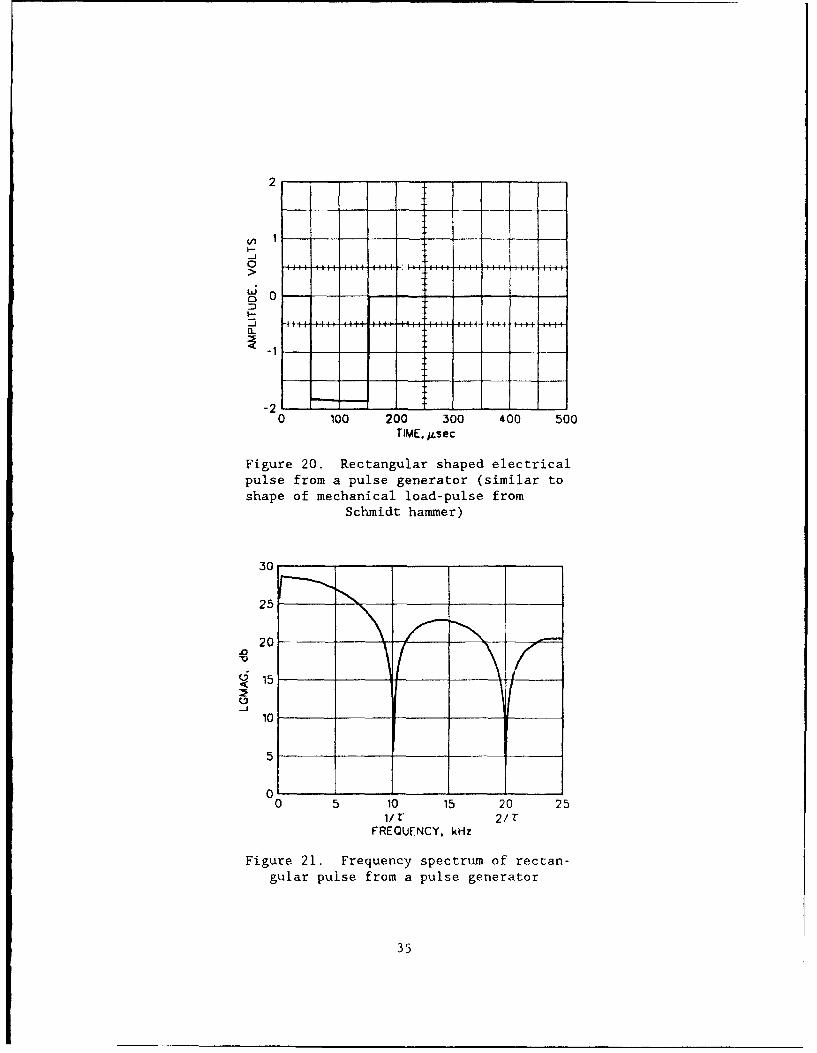
"U S. ARM E GI EE
WAERAS SERNNTSATO
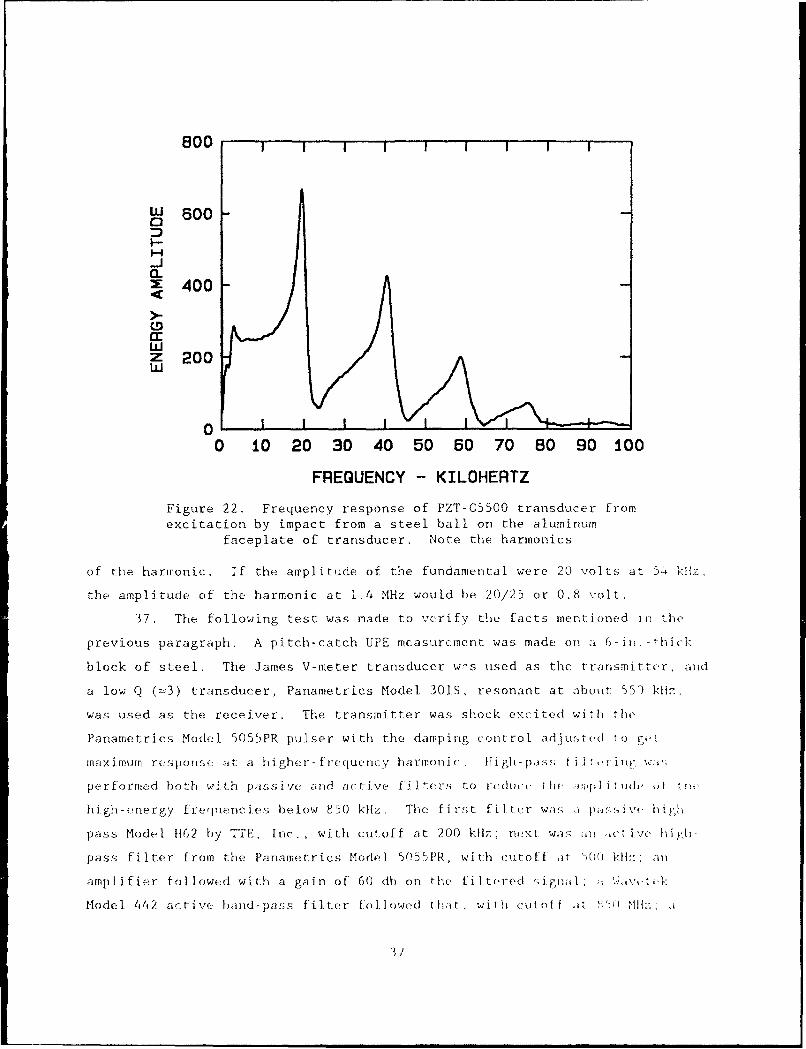
3909 HALLS FERRY ROAD
VHAKSSURG, MISSISSIPPC 391N0-1R9
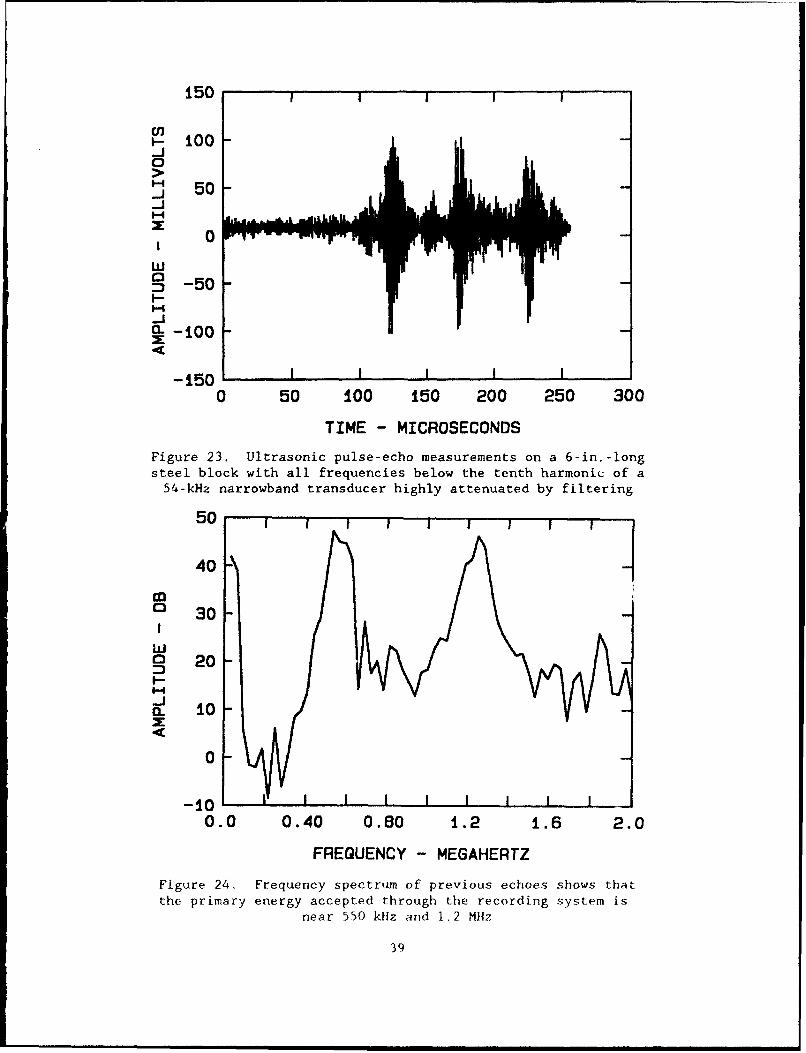
PHONE r (901)34-2502
MAIN ~ ~ ~ URESERHCWtENTRANCEALABORATOR
Waterways Experiment Station Cataloging-in-Publication Data
Alexander, A. Michel.Impacts as a source of acoustic pulse-echo energy for nondestructivetesting of concrete structures / by A. Michel Alexander ; prepared forU.S. Army Corps of Engineers.
84 p. :ill. ;28 cm.-• (Technical report ; REMR-CS-40)lncludes bibliographical references.1. Concrete construction - Testing. 2. Nondestructive testing. 3. Ul-
trasonic testing. R. United States. Army. Corps of Engineers. Il. U.S.Army Engineer Waterways Experiment Station. Ill. Repair, Evaluation,
Maintenance, and Rehabilitation Research Program. IV. Title. V. Se-ries: Technical report (U.S. Army Engineer Waterways Experiment Sta-tion) ;REMR-CS-40.TA7 W34 no.REMR-CS-40
PREFACE
The research reported herein was authorized by Headquartteirs US Arm';
Corps of Engineers (HQUSACE), as part of the Concrete and Steel Problem Art-a
of the Repair, Evaluation, Maintenance, and Rehabilitation (REMR) Research
Program. The work was performed under Work Unit 32638. Mr. William F.
McCleese, US Army Engineer Waterways Experiment Station (WES), was the Pi.MR
Program Manager. Dr. Tony C. Liu, HQUSACE, was the Technical Monitor.
Mr. William N. Rushing was the Coordinator at the Directorate of Research and
Development, HQUSACE. Mr. James E. Crews, HQUSACE, and Dr. Liu served as the
Overview Committee.
Mr. James E. McDonald, Concrete Technology Division (CTD), Structures
Laboratory (SL), WES, was Problem Area Lead..r. Mr. A. Michel Alexander, CTD,
was the Principal Investigator of Work Unit 32638 during the research.
Mr. Alexander performed the research and wrote the report. Appreciation is
extended to Mr. Charles R. Welch, Explosion Effects Division, SL, for his help
in the underwater explosives investigation.
The study was conducted under the general supervision of Mr. Bryant
Mather, Director, SL; Mr. James T. Ballard, Assistant Director, SL;
Mr. Kenneth L. Saucier, Chief, CTD; and Mr. Steven A. Ragan, Chief,
Engineering Mechanics Branch, CTD.
At the time of publication of this report, Director of WES was
Dr. Robert W. Whalin. Commander was COL Leonard G. Hassell, EN.

TABLE OF CONTENTS
PREFACE ............................ .................................
LIST OF FIGURES ........... . .......................
LIST OF SYMBOLS ... . . . . . . . . . .
CONVERSION FACTORS, NON-SI TO (METRIC) UNITS OF MEASUREMENT ......
PART I: INTRODUCTION ............................................
Background . . . . . . . . ... . .
Shortcomings of Piezoelectrics . . . . . .. . . . . . .. . .Advantages of Impacts ............ ..................... 13Disadvantages of Impacts ...... .
PART II: THEORETICAL CONSIDERATIONS .......... ................. 18
General Signal Characteristics .... ................. 18
impact Signal Characteristics ................. .................. 21Tratisducer Characteristics ........................ 21Harmonics ............................... ..................... 34Digital Signal Processing ............ .................... .. 40Bandwidth Considerations ............. .................... 46
PART III: LITERATURE REVIEW ............... ..................... 48
Impact Measurements Research ........... .................. 48Sonic Impact Pulse-Echo Research ......... ................ 49
PART IV: LABORATORY WORK ON BROADBAND TRANSDUCERS ... .......... 53
Using Resonant Transducers as Broadband Receivers .......... .. 53PZT-Steel Rod Transducer and Rebound Hammer ... ........... .. 55PZT-Steel Rod Transducer and Shot Pellet (BB) Pistol ...... 52PZT Aluminum Rod Transducer ................ ................... . 8
James V-meter Transducer and Lead Ba~king .... ............ .. 58Underwater Explosive Measurements on Concrete ... .......... .. 59Accelerometer and Rebound Hammer on Basement Floor ....... .. 63
PART V: LABORATORY WORK ON RESONANT TRANSDUCERS ......... ........... 65
Considerations ................... ......................... 65Impact Measurements on Steel ....................... 65High-Frequency Energy Transmitted through Concrete . ...... 68Rebound Hammer and Lithium Sulfate Receiver .... ........... 68PZT-C5500 Transducer and Rebound Hammer .... ............. 71
PART VI: CONCLUSIONS ................................... 76
PART VII: RECOMMENDATIONS ................. ...................... . .79
REFERENCES ............... .................................. 80
2

LIST OF FICGIRES
-No
I Quality of concrete tested by auditory response to impact .... 11
2 Wavelength must be equal to or larger than dimensions ofcoarse aggregate for material to appear homogeneous tostress wave ... . . . . . . . . .. . . ........................
3 Lead-metaniobate wideband transducer with reduced ring-imeof about three cycles at center frequency of 200 kHz. Thelarge amplitude pulse arriving at 100 psec is an echo fromthe back surface of a 9-in.-thick concrete slab ......... 14
4 The use of impacts to generate high levels of stress waveenergy is important for geotechnical applications. Theseismic refraction technique is used for engineeringsite evaluations and oil exploration ..... ............. .. 14
5 Problem of mode conversion and presence of spurious waveswhen incident longitudinal wave is not normal to targetsurface .................... ............................ 16
6 A small-diameter source relative to the wavelength generat:esa spherical wave with considerable mode conversion whichcomplicates an ultrasonic pulse-echo measurement ....... .. 16
7 A large-diameter source generates a plane wave without modeconversion and simplifies ultrasonic pulse-echo measurements 17
8 Any real waveform can be produced by the correct combinationof sine waves (Hewlett-Packard 1981) ....... ............. 19
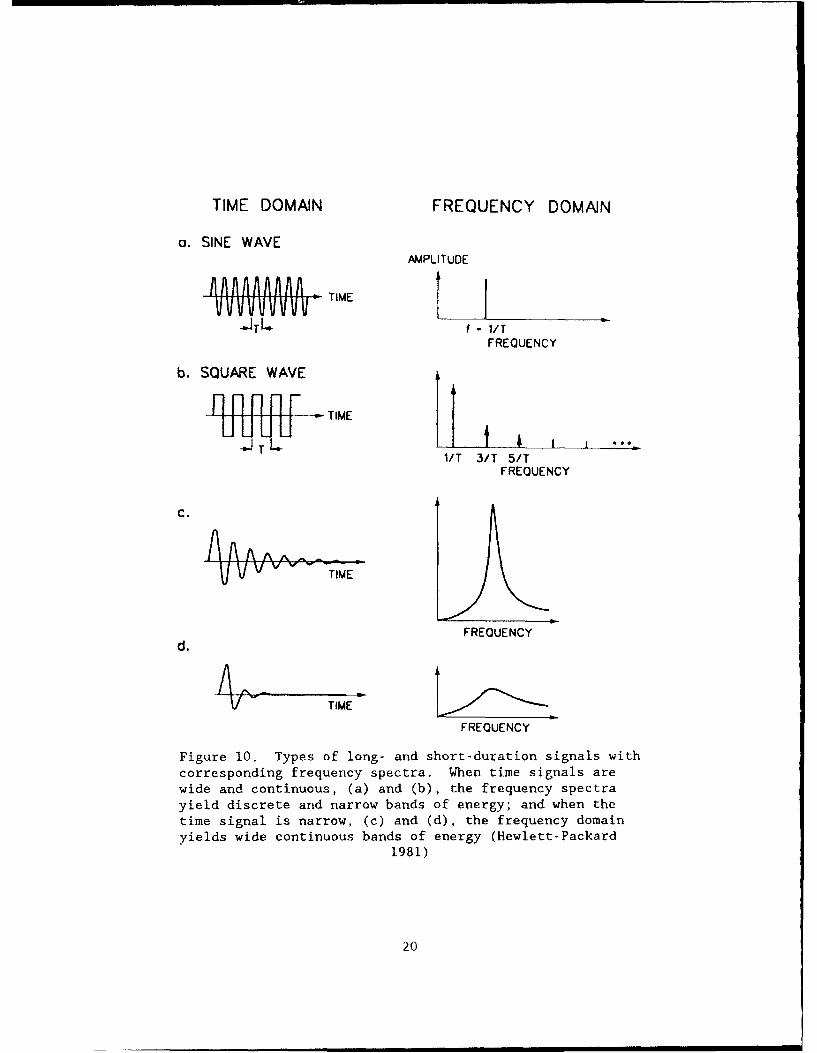
9 The relationship between the time and frequency domains:(a) three-dimensional coordinates showing time, frequency,and amplitude, (b) time-domain view, and (c) frequency-domain view (Hewlett-Packard 1981) ....... .............. 19
10 Types of long- and short-duration signals with correspondingfrequency spectra. When time signals are wide and continuous,(a) and (b), the frequency spectrum yields discrete and narrowbands of energy; and when the time signal is narrow, (c) and(d), the frequency domain yields wide continuous bands ofenergy (Hewlett-Packard 1981) .............. ................. 20
11 Typical shape of force-time load-pulse from impact of hammer oncoal•.. rte surface. The shorter the pulse duration, the higherthe resolut iori of the measurement ........ ............... 2.
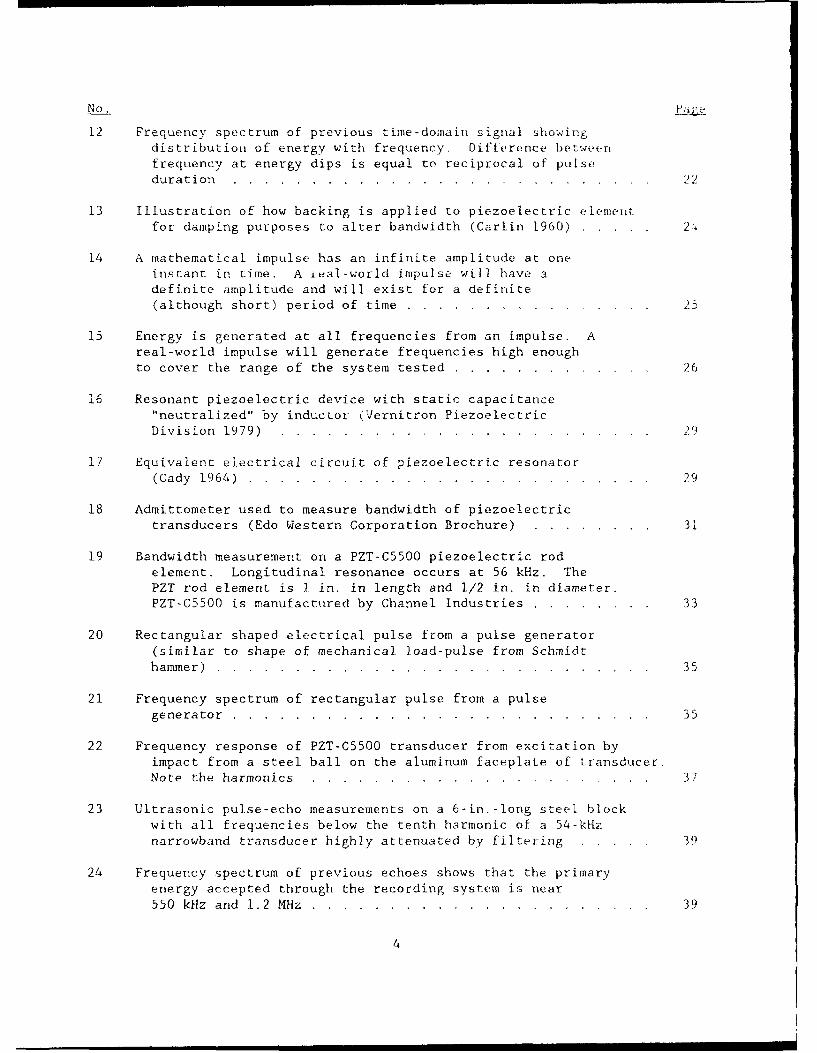
No.
12 Frequency spectrum of previous time-domain signal showingdistribution of energy with frequency. Difference betweenfrequency at energy dips is equal to reciprocal of pulseduration ................... ........................... 22
13 Illustration of how backing is applied to piezoelectric elementfor damping purposes to alter bandwidth (Carlin 1960) ... ..... 24
14 A mathematical impulse has an infinite amplitude at oneinstant in time. A ieal-world impulse will have adefinite amplitude and will exist for a definite(although short) period of time ............ ................ 25
15 Energy is generated at all frequencies from an impulse. Areal-world impulse will generate frequencies high enoughto cover the range of the system tested .... ............. 26
16 Resonant piezoelectric device with static capacitance"neutralized" by inductor (Vernitron Piezoelectric
Division 1979) ................. ........................ 29
17 Equivalent electrical circuit of piezoelectric resonator(Cady 1964) .................. .......................... .. 29
18 Admittometer used to measure bandwidth of piezoelectrictransducers (Edo Western Corporation Brochure) .. ........ 31
19 Bandwidth measurement on a PZT-C5500 piezoelectric rodelement. Longitudinal resonance occurs at 56 kHz. ThePZT rod element is I in. in length and 1/2 in. in diameter.PZT-C5500 is manufactured by Channel Industries .......... .. 33
20 Rectangular shaped electrical pulse from a pulse generator(similar to shape of mechanical load-pulse from Schmidthammer) .................... ............................ 35
21 Frequency spectrum of rectangular pulse from a pulsegenerator .................. ........................... .. 35
22 Frequency response of PZT-C5500 transducer from excitation byimpact from a steel ball on the aluminum faceplate of transducer.Note the harmonics ..................... ...................... 37
23 Ultrasonic pulse-echo measurements on a 6-in.-long steel blockwith all frequencies below the tenth harmonic of a 54-kHz
narrowband transducer highly attenuated by filtering ..... 39
24 Frequency spectrum of previous echoes shows that the primaryenergy accepted through the recording system is near550 kHz and 1.2 MHz .............................. 39
4

No. p
25 Illustration of method to perform digital filtering. This !is sometimes called "Fast Convolution" ....... .............
26 Echoes generated mathematically to si mu late possible ac ioz
in cou-crete . The center frequency of t:he transducer i s50 kHz and the echoes occur every 128 psec ..........
27 FFT (Spectrum) of previous echoes. Spacing of frequency peaksis 7.8 kHz or reciprocal of times of arrival of echoes of12 8 us e c . . . . . . . . . . . . . . . . . . . . . . . . . . .
28 Impulse response of a high-pass digital filter with cutoffat 25 kHz .................... . ...........................
29 Frequency response of digital filter showing cutoff at 25 kflz ,.
30 Resulting frequency response after convolving time-domainecho signal with impulse response of filter, Note theattenuation of energy below 25 kHz ... ......... . Z
31 Inverse FFT of previous signal showing that echoes can beseen after the attenuation of the low-frequency energyby filtering ................................. 45
32 80-ft-long concrete pile, sledge hammer, and piezoelectric
receiver used in making a scnic pulse-echo measurement .... 50
33 Crack in pile located 16 ft from end of pile ... ..........
34 Arrival of echoes from end of pile and from crack. Five
echoes can be seen from crack before the large amplitude-~'-ho aýirr4 ' F-orn t" niIeP end . . . 51
35 Typical load-pulse produced from impact on concrete with aSchmidt rebound hammer. Pulse is about 70 psec wide withamplitude near 5,000 lb of force. Rise time is less than10 i s ec . . . . . . . . . . . . . . . . . . . . . . . . . . . . 4
36 A typical model of a Schmidt rebound hammer traditionallyused to measure the rebound number of concrete (ASTMC 805) (ASTM 1992). In this investigation it was usedto generate stress wave energy for ultrasonic pulse-echomeasurements . . . . . . . . . . . . . . . . . . . . . .. . .
37 PZT piezoelectric element bonded to end of 7-ft steel rodused to make pulse-echo measurements on concrete slab.Analogous to function of a Hopkinson Bar ........... 6

N o. P , _
transducer. iipact made on steel pl•te• hundud to
concrete surface . . . . . . . . . . . . . . . . . . .
39 Echoes from concrete slab detected with PZT-steel rodtransducer. Impact made directly on conicrete surface,
40 PZT mosaic transducer with epoxy/lead backinrg .......... .
41 Bandwidth of a PZT mosaic transducer, u.daupvd
42 Bandw i.dth of a PZT mosaic transducer, damped .....
43 Thickness measurement on 9-in. - thick concrete slab with PZTepoxy/lead-backed transducer . . . . .. . . . .. .. . . . I Q
44 A longitudinal echo reflected from base of a 4-ft-thlck Okia
having a TOA of 0.74 msec. The stress wave energy wascreated by an impact from a 0.87-g charge explodingunderwater 0.5 ft above the concrete ..... ............ .
45 Response spectrum from a 1.5-ft-thick concrete slab from animpact with a rebound hammer. This represents an impart-resonance measurement rather than an impact - ecco
measurement ................ ................... . .. ..
46 Measurement setup for making an ultrasonic pulse-echomeasurement on a 6-in.-high metal block with stresswave generation by impact from dropping a steel ballfrom a height of about I ft ............... .................. 66
47 Echoes from a 2.4-in.-thick steel block with the stress wave
energy introduced by impact from dropping a steel ball ontothe surface. Center frequency of trar'sducer is 2.5 MHz ........ 6.
48 Measurement setup for detecting frequency of energy with lead-metaniobate transducer through 3 ft of concrete from impactwith a rebound hammer ...... ..... .....................
49 Spectrum of energy through 3-ft-long concrete beam. (oincfe,-passed 190 kHz energy. Energy has been attenuated b-low100 kHz by electrical filtering ...... .................
50 Measurement setup to make impact pulse-echo measurement on
6-in.-thick concrete slab using rebound hammer and lithiumsul.fate transducer ....... ... . .... . ....... .......... .. .
5i (INtrasonic pulse-echo m:ieasurement or 6-ir, - thirk cncruv, CA
using a rebound hamme r and litbhium-stIfate transducer . . . . .
6
diam. And Iji-i,!. ength) ...... . .............
A~d Vaio08 transucer U c Qonlst ructed for At trasoli c pul socc
!.'.;iskrtl' I" ts iI concrete . Not,: PZT-C-(>),• () t-a uc~
rci~c~ v'rW 18C in loe lf-haiMi cornrh~ of phlotograp4h. h
cr. -uc- has a - . Ig /,,.-i -di m alumi;num. Lfpl l and a V-in. hacking ot tuiTg;;ten-n.poxy
54 a . .idtt• 1,3ur.ement of damped PZT-C55( tr• nsdu~cer ..
55 Puls-e•.ho measurements on 9-in.-thick slob using PZT-AVOW)Ttr.nsd"i .cer receiver and Schm idt rebound hammer .r ... .. . A
1 6 Me asurx eme'nt setup to make ultrasonic pulse-echo moaso remonan 3-at-long conucrete beam from impact with rebound hammsvr.
Detection is with PZT-C5500 transducer. Frequencies below500 kHzI were highly attenuated by elect rical filtering ....
57 Ultrasonic pulse-echoes on 3-ft beam yields equally spacedechoes of approximat.el 500 I )s ec. Fret qunc v of eneurgv
is 750 ki.z .................... ...........................
58 Ultrasoni.c pulse-echo measurement on 3-tt-rIng concrete, beamWy impact from a rebound hammer anmd us.inz•g 1/in.-dia:iimPZT-0('5(1)0 transducer ................. ...................... .-
LIST OF SYMBOLS
A area of crystal, square metresý!' angle of incident longitudinal waveas5 angle of reflected shear wave
static capacitance of transducer, faradsfrequency of pure tone, hertzfrequency of resonance in concrete, hertzr -esonant frequency of transducer, hertzfrequency of response at -3 db down on one side of peak, hertz
2 frequency of response at -3 db down on other side of peak, hertz-r(f) frequency response of filter
(f). -input. signal in frequency domainS(f), - output signal in frequency domain
- impulse response of filter'3 dielectric constant of piezoelectric crystalL, inductance of external transducer inductor, henries
thickness of concr:ete slab, feetQ Quality factor of transducerR internal resistance of transducer, ohmsF.l. P2. R3 - resistances of admittometer, ohmsT period of wave, microsecondsth -thickness of crystal, metres
V velocity of longitudinal velocity in concrete, feet/second17("), input signal in time domainV(ct) output signal in time domain0, - angle of refracted shear waver37 - angle of refracted longitudinal waveEQ -permittivity of free space, 6.85 x 10⁻²² farads/metreA wavelength of stress wave, feetv- vclocity of longitudinal wave, feet/second
- velocity of shear wave, feet/second
w width of rectangular pulse, microseconds
8

CONVERSION FACTORS, NON-SI TO SI (METRIC)UNITS OF MEASUREMENT
Non-SI units of measurement used in this report can be converted to S1
(metric) units as follows:
Multiply By To Obt 1in
degrees (angle) 0.01745329 radians
feet 0.3048 metres
inches 25.4 millimetres
pounds (force) 6.448222 newtons
9

IMPACTS AS A SOURCE OF ACOUSTIC PULSE-ECHO ENERGY FOR
NONDESTRUCTIVE TESTING OF CONCRETE STRUCTURES
PART I: INTRODUCTION
Background
I. The construction industry lags behind some of the other industries
in the development of nondestructive testing (NDT) systems for one of its
primary materials, concrete. No ultrasonic pulse-echo (UPE) system exists
that will permit measurements to be made deep within a structure. Stress
waves techniques are needed to probe the hidden features of concrete
structures to make their interior characteristics and condition visible.
2. Traditionally, to determine the integrity of concrete structures
nondestructively by stress waves, diagnosticians have listened to the auditory
response of the concrete both to an impact with a hammer and by dragging a log
chain across the structure. A clear ringing sound is heard when a chain is
dragged or a steel rod or hammer is tapped over nondelaminated concrete
(American Society for Testing and Materials (ASTM) 1992). This is the method
of ASTM D 4580 as illustrated in Figure 1. A dull or hollow sound occurs when
dragging or tapping on deiaminated concrete. Impacts might have greater
potential for flaw detection and deterioration measurements in concrete if the
energy level and frequency content of the complicated waveforms generated by
these impacts and reflected from the concrete interfaces could be classified
in clear scientific terminology. If the auditory response could be replaced
with a transducer and electronic display, they would better perform the
"listening" arid would provide quantitative data for analysis.
Shortcomings of Piezoelectrics
3. For reasons of repeatability and the advantages of electronic
operation, it is desirable to use piezoelectric materials to generate and
detect the stress wave energy needed to interrogate the quality of materials.
10
V AHAMMER
DELAMINATION
Figure 1. Quality of concrete tested by auditory response to impact,
However, piezoelectrics have shortcomings at the frequencies necessary for
operation in concrete. Due to the large grain size from coarse aggregates in
the concrete, concrete flaw detection measurements require operation at a
frequency of 200 kHz or less (Jones 1953). Otherwise, the concrete will not
appear homogeneous to the stress wave, and excessive scattering will result,
Figure 2. (This obviously places a lower limit on the size of the defect that
can be detected.) The problem is that 200 kHz is on the low-frequency side of
efficient piezoelectric operation. The stress level generated from a
piezoelectric element is directly proportional to the square of the frequency-
therefore, piezoelectric materials do not perform well in the kiloHertz range
required for proper operation in concrete. Impacts generate high energy at
low frequencies and, therefore, appear especially useful as a source of low-
frequency energy for pulse-echo measurements in concrete.
4. Piezoelectric transmitters that operate at low frequencies have an
excessive ring-time and, hence, pulse length for proper operation in concrete.
Jones (1962) reports that due to the difficult-v of damping low-frequency
piezoelectric transducers (100 kHz), it is impossible to operate a common
transmitter-receiver system to perform ultrasonic pulse-echo measurements in
concrete as is so common with high-frequency pulse-echo measurements on
metals. Even if the transmitter ringdown could be reduced to as low as five
1]
Figure 2. Wavelength must be equal to or largerthan dimensions of coarse aggregate for material
to appear homogeneous to stress wave
cycles, the pulse length in the concrete would be about 7 in.* for a
transducer operating at a resonant frequency of 100 kHz. Since five cycles is
equivalent to five wavelengths in the concrete, then
V (1)f
i 15,000 (2)100,000
1= 0.15 ft (3)
whereA = wavelength, feet
v = ultrasonic pulse velocity in concrete,feet/second
f = transducer frequency, hertz
the pulse length would be 0.75 ft (5A). This means that the resolution
obtained from a thickness measurement on concrete pavement or floor slab (less
than 10 in. thick) would be poor. The resolution would be even worse for
detecting discontinuities a few inches from the top surface than it would be
for detecting the back surface (thickness measurement), As a minimum, the
pulse length should be no longer than 10 percent of the travel path (the
travel path is twice the thickness) to obtain proper resolution. The pulse
length at 100 kHz for a ring-time of five cycles is simply too large a
percentage of the total travel path for the low frequencies that concrete
A table of factors for converting non-SI units of measurement to SI(metric) units is presented on page 9.
12
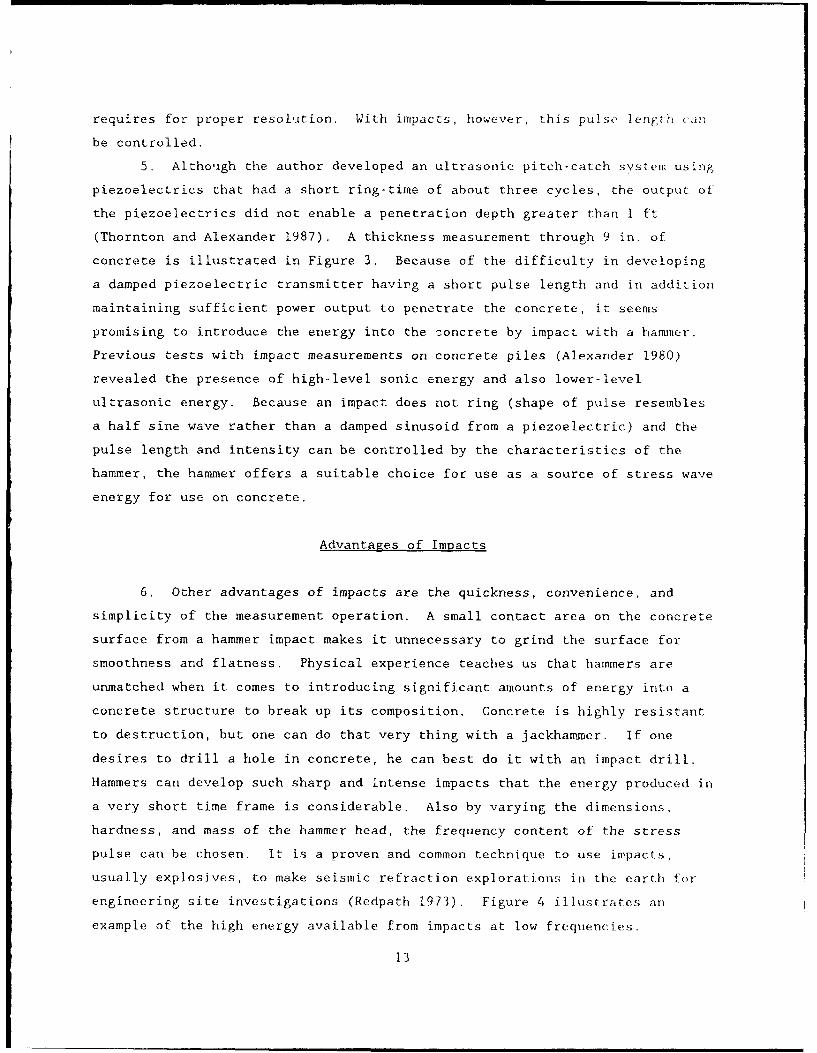
requires for proper resolution, With impacts, however, this pulse length (cain
be controlled.
5t Althoagh the author developed an ultrasonic pitch-catch sostem using
piezoelectrics that had a short ring-time of about three cycles, the output of
the piezoelectrics did not enable a penetration depth greater than 1 ft
(Thornton and Alexander 1987). A thickness measurement through 9 in. of
concrete is illustrated in Figure 3. Because of the difficulty in developing
a damped piezoelectric transmitter having a short pulse length and in addition
maintaining sufficient power output to penetrate the concrete, it seems
promising to introduce the energy into the concrete by impact with a hammer.
Previous tests with impact measurements on concrete piles (Alexander 1980)
revealed the presence of high-level sonic energy and also lower-level
ultrasonic energy. Because an impact does not ring (shape of pulse resembles
a half sine wave rather than a damped sinusoid from a piezoelectric) and the
pulse length and intensity can be controlled by the characteristics of the
hammer, the hammer offers a suitable choice for use as a source of stress wave
energy for use on concrete.
Advantages of Impacts
6, Other advantages of impacts are the quickness, convenience, and
simplicity of the measurement operation. A small contact area on the concrete
surface from a hammer impact makes it unnecessary to grind the surface for
smoothness and flatness. Physical experience teaches us that hammers are
unmatched when it comes to introducing significant amounts of energy into a
concrete structure to break up its composition. Concrete is highly resistant
to destruction, but one can do that very thing with a jackhammer. If one
desires to drill a hole in concrete, he can best do it with an impact drill.
Hammers can develop such sharp and intense impacts that the energy produced in
a very short time frame is considerable. Also by varying the dimensions,
hardness, and mass of the hammer head, the frequency content of the stress
pulse can be chosen. It is a proven and common technique to use impacts,
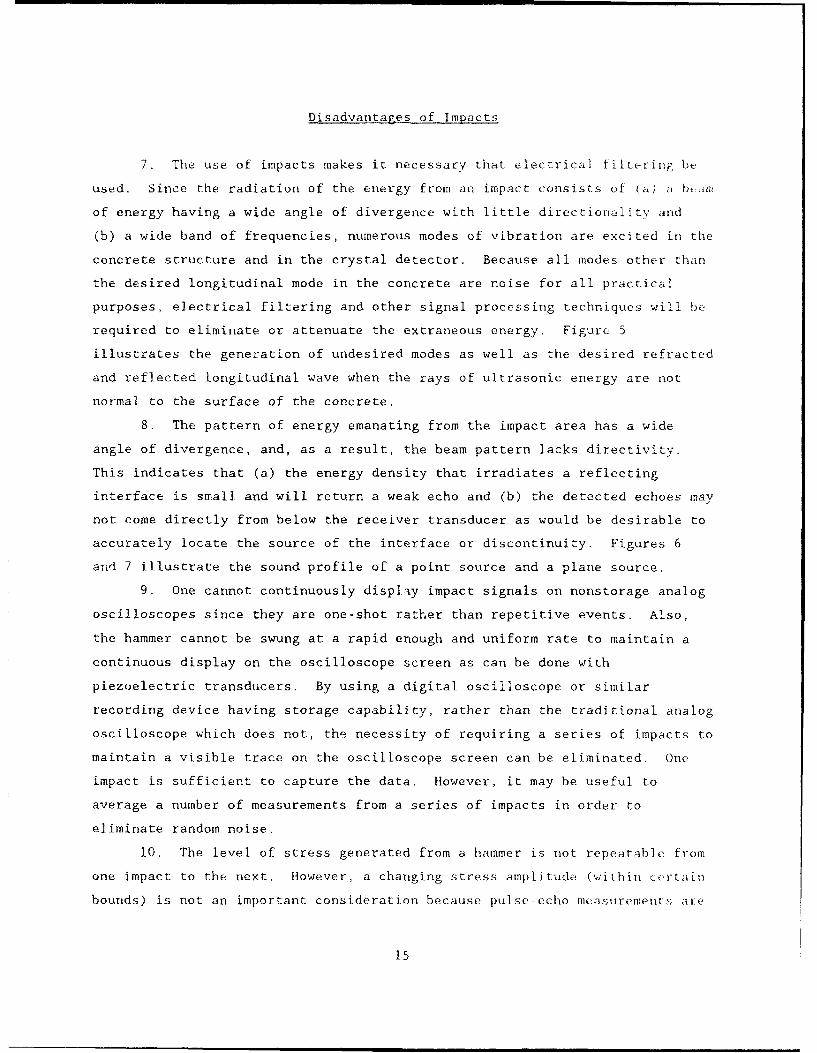
usually explosives, to make seismic refraction explorations in the earth for
engineering site investigations (Redpath 1973). Figure 4 illustrates an
example of the high energy available from impacts at low frequencies.
13

100
cnI---jo 50
0
W
'- -50-J
0~o-100IIII
-50 0 50 100 150 200
TIME - MICROSECONDS
Figure 3. Lead-metaniobate wideband transducer with reducedring-time of about three cycles at center frequency of200 kHz. The large amplitude pulse arriving at 100 psec is
an echo from the back surface of a 9-in.-thick concrete slab
EXPLOSIVE GEOPHONE
Figure 4. The use of impacts to generate high levelsof stress wave energy is important for geotechnicalapplications. The seismic refraction technique isused for engineering site evaluations and oil
exploration
1-4
Disadvantages of Impacts
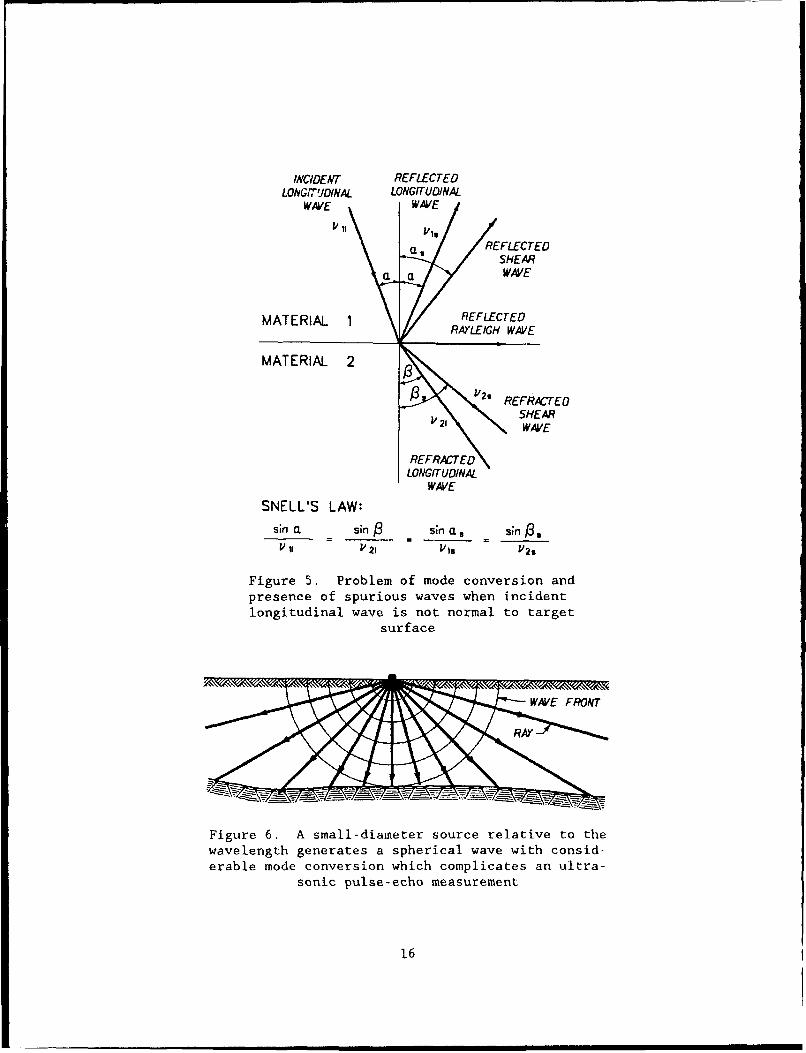
7. The use of impacts makes it necessary that electrical filteriug be
used. Since the radiation of the energy from an impact consists of (a) a Lam
of energy having a wide angle of divergence with little directionality and
(b) a wide band of frequencies, numerous modes of vibration are excited in the
concrete structure and in the crystal detector. Because all modes other than
the desired longitudinal mode in the concrete are noise for all practical
purposes, electrical filtering and other signal processing techniques will be
required to eliminate or attenuate the extraneous energy. Figure 5
illustrates the generation of undesired modes as well as the desired refracted
and reflected longitudinal wave when the rays of ultrasonic energy are not
normal to the surface of the concrete.
8. The pattern of energy emanating from the impact area has a wide
angle of divergence, and, as a result, the beam pattern lacks directivity.
This indicates that (a) the energy density that irradiates a reflecting
interface is small and will return a weak echo and (b) the detected echoes may
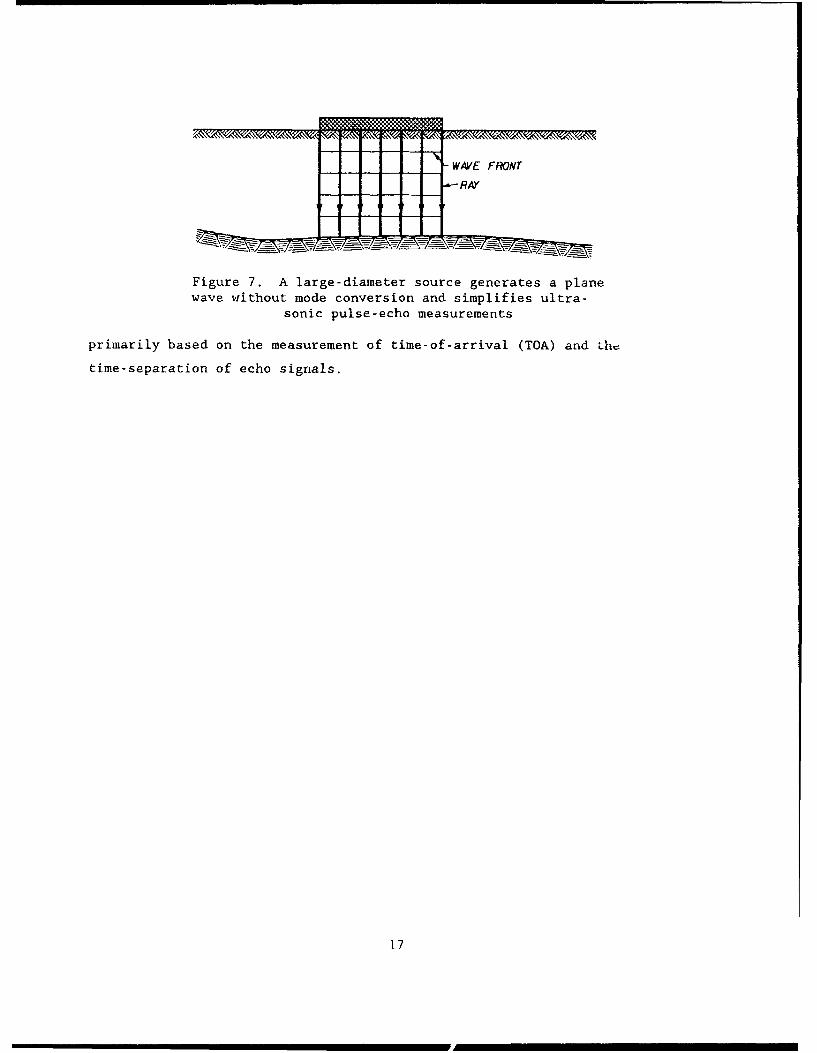
not come directly from below the receiver transducer as would be desirable to
accurately locate the source of the interface or discontinuity. Figures 6
and 7 illustrate the sound profile of a point source and a plane source.
9. One cannot continuously displiy impact signals on nonstorage analog
oscilloscopes since they are one-shot rather than repetitive events. Also,
the hammer cannot be swung at a rapid enough and uniform rate to maintain a
continuous display on the oscilloscope screen as can be done with
piezoelectric transducers. By using a digital oscilloscope or similar
recording device having storage capability, rather than the traditional analog
oscilloscope which does not, the necessity of requiring a series of impacts to
maintain a visible trace on the oscilloscope screen can be eliminated. One
impact is sufficient to capture the data. However, it may be useful to
average a number of measurements from a series of impacts in order to
eliminate random noise.
10. The level of stress generated from a hammer is not repeatable from
one impact to the next. However, a changing stress amplitude (within (Pt rt .i3i
bounds) is not an important consideration because pulse-echo measurement.s are
15
INCIDENT REFLECTEDLO1VGr, YDINAL LONGITUDINAL
WAVE WAVE
REFLECTEDSHEAR
a a WAVE
MATERIAL 1REFLECTED
MATERIAL 2
/3 REFRACTED
V A 21 H WAVE
REFRACTEDLONGITUDINAL
WAVE
SNELL'S LAW:sin a sin sin a, sin
V 11 V 21 pis V2s
Figure 5. Problem of mode conversion andpresence of spurious waves when incidentlongitudinal wave is not normal to target
surface
Figure 6. A small-diameter source relative to thewavelength generates a spherical wave with consid-erable mode conversion which complicates an ultra-
sonic pulse-echo measurement
16
WAVE FRONT
ýRAY
Figure 7. A large-diameter source generates a planewave without mode conversion and simplifies ultra-
sonic pulse-echo measurements
primarily based on the measurement of time-of-arrival (TOA) and Lh•
time-separation of echo signals.
17

-IRT II: THEORETICAL CONSIDERATIONS
General Signal Characteristics
11. One important aspect in understanding ultrasonic puls•-echo
measurements using impacts is a knowledge of the frequency characteristics of
various continuous waves and transient signals. Any signal can be repressetited
by the sum of individual sine waves having various frequencies, amplitudes.
and phases. A pure tone is a sinusoidal wave of infinite duration, and its
representation in the frequency domain is a single spectral line at the
frequency, F = l/T , where T is the period of the sinusoidal wave. In
Figure 8, a complex harmonic tone is made up of the sum of the fundamental
frequency and the second harmonic. This is a signal of infinite duration
(continuous wave) although represented in an abbreviated form.
12. There are two important waysto view or picture information in a
signal as shown in Figure 9: the time domain and the frequency domain. A
general principle observed is that signals which are broad in one domain are
narrow in the other domain. The sinusoidal signals are continuous (broad) in
the time domain, but the resulting frequency spectrum has discrete (narrow)
lines at the frequency where the energy exists. Figures 9b and 9c illustrate
the two views of a signal: a signal in the time domain consisting of the sum
of a fundamental frequency and the second harmonic and two narrow spectral
lines in the frequency domain representing the two sine wave components making
up the complex harmonic tone in the time domain.
13. Figure 10 shows (a) one sine wave of continuous duration, (b) one
square wave signal of continuous duration, and (c and d) two transient
signals, a damped and a highly damped sinusoid, of finite duration (Hewlett-
Packard 1981). As mentioned, the sine wave and square wave of continuous
duration have spectra of energy that exist at discrete frequencies which are
represented by narrow vertical lines of various amplitude. The energy of a
continuous sine wave exists only at one discrete frequency. The energy of a
continuous square wave exists only at the discrete harmonic frequencies. How-
ever, the opposite of that is true with the next two signals having short
duration in the time domain. Each of these signals develops spectra that are
18
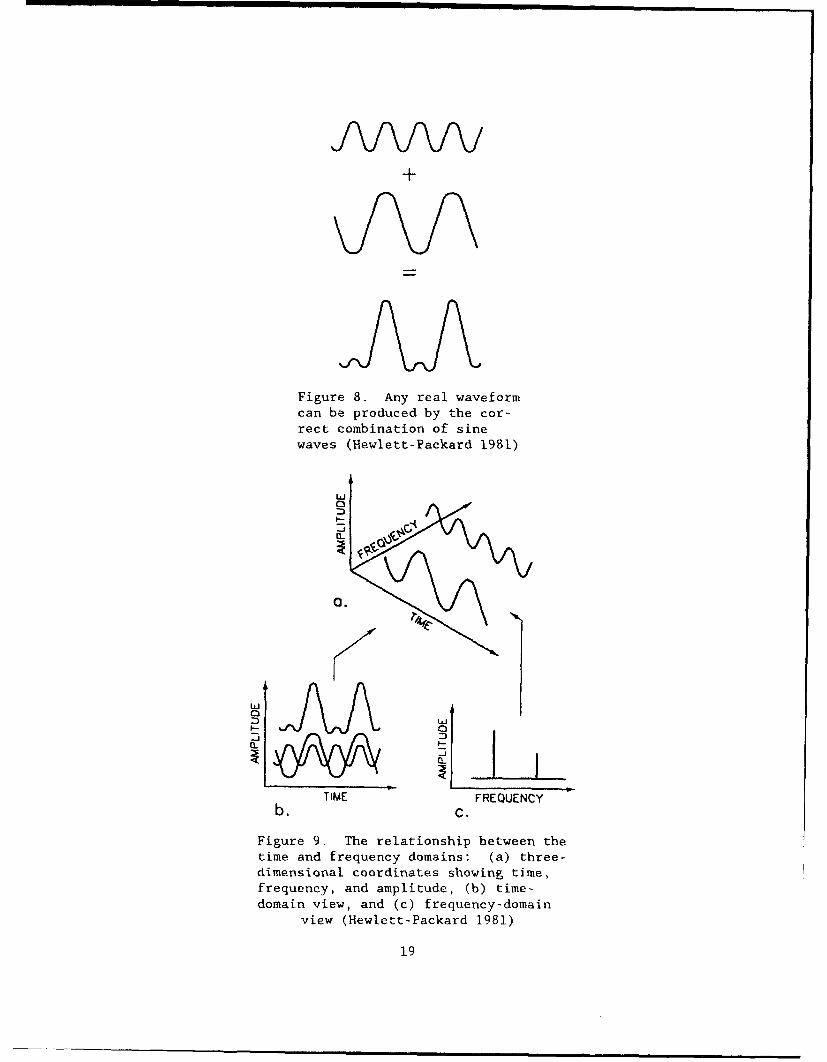
JVVVfV+
Figure 8. Any real waveformcan be produced by the cor-rect combination of sinewaves (Hewlett-Packard 1981)
ELj
i j
CL
TIME FREQUENCYb. c.
Figure 9. The relationship between thetime and frequency domains: (a) three-dimensional coordinates showing time,frequency, and amplitude, (b) time-domain view, and (c) frequency-domain
view (Hewlett-Packard 1981)
19
TIME DOMAIN FREQUENCY DOMAIN
o. SINE WAVEAMPLITUDE
VVVVVVVV TIME
-,JTfL. . V/TFREQUENCY
b. SQUARE WAVE
nfl nJni1FL-TIMEIUUUU ,U U U .. _. I D--T 1/T 3/T 5/T
FREQUENCY
C.
TIME
FREQUENCY
d.
v TIME
FREQUENCY
Figure 10. Types of long- and short-duration signals withcorresponding frequency spectra. When time signals arewide and continuous, (a) and (b), the frequency spectrayield discrete and narrow bands of energy; and when thetime signal is narrow, (c) and (d), the frequency domain
yields wide continuous bands of energy (Hewlett-Packard1981)
20
qJ
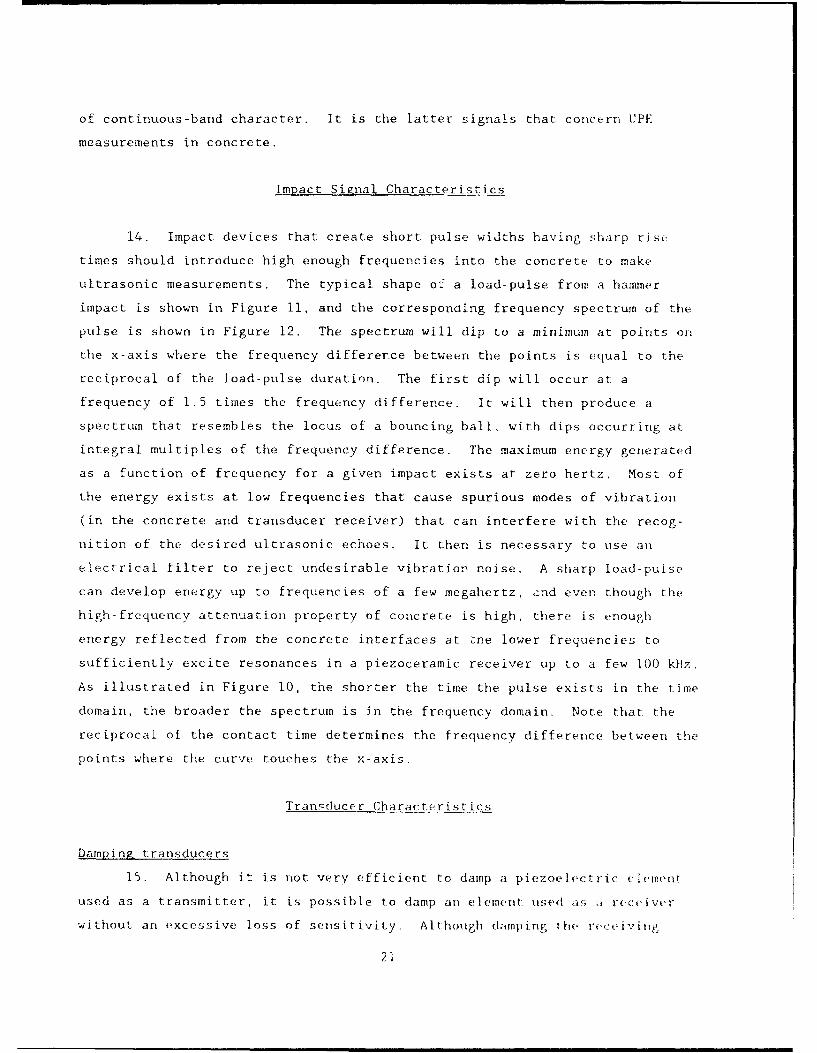
of continuous-band character. It is the latter signals that concern UPE
measurements in concrete.
Impact Signal Characteristics
14. Impact devices that create short pulse widths having sharp rise
times should introduce high enough frequencies into the concrete to make
ultrasonic measurements. The typical shape of a load-pulse from a hammer
impact is shown in Figure 11, and the corresponding frequency spectrum of the
pulse is shown in Figure 12. The spectrum will dip to a minimum at points on
the x-axis where the frequency differerce between the points is equal to the
reciprocal of the load-pulse duration. The first dip will occur at a
frequency of 1.5 times the frequency difference. It will then produce a
spectrum that resembles the locus of a bouncing ball, with dips occurring at.
integral multiples of the frequency difference. The maximum energy generated
as a function of frequency for a given impact exists at zero hertz. Most of
the energy exists at low frequencies that cause spurious modes of vibration
(in the concrete and transducer receiver) that can interfere with the recog-
nition of the desired ultrasonic echoes. It then is necessary to use an
electrical filter to reject undesirable vibration noise. A sharp load-puise
can develop energy up to frequencies of a few megahertz, ;nd even though the
high-frequency attenuation property of concrete is high, there is enough
energy reflected from the concrete interfaces at ýne lower frequencies to
sufficiently excite resonances in a piezoceramic receiver up to a few 100 kHz,
As illustrated in Figure 10, the shorter the time the pulse exists in the time
domain, the broader the spectrum is in the frequency domain. Note that the
reciprocal of the contact time determines the frequency difference between the
points where the curve touches the x-axis.
Transducer Characteristics
Damping transducers
15. Although it is not very efficient to damp a piezoelectric lAement
used as a transmitter, it is possible to damp an element used as a receiver
without an excessive loss of sensitivity. Although damping the receivi eg
21,
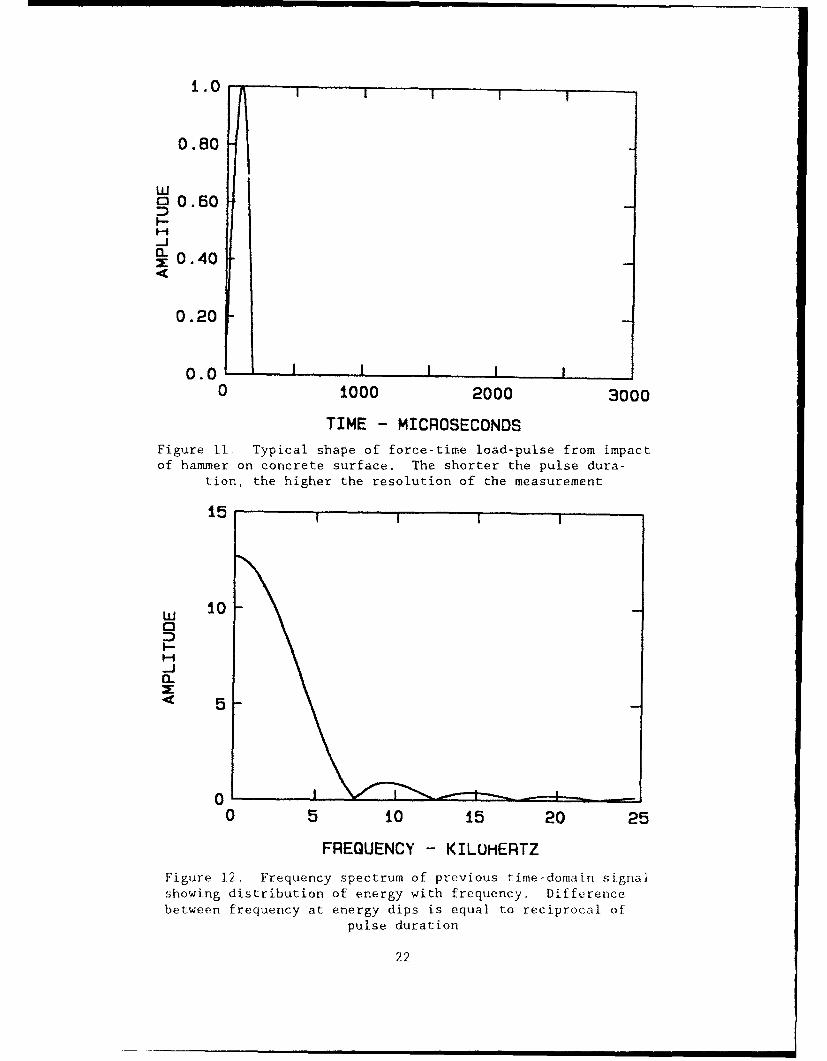
1.0
0.80
wo 0.60
_-
S0.40
0.20
0.0 I I I I I0 1000 2000 3000
TIME - MICROSECONDS
Figure II Typical shape of force-time load-pulse from impactof hammer on concrete surface. The shorter the pulse dura-
tion, the higher the resolution of the measurement
15
w 100
5-
010 5 10 15 20 25
FREQUENCY - KILOHERTZ
Figure 12. Frequency spectrum of previous time-domain signalshowing distribution of energy with frequency. Differencebetween frequency at energy dips is equal to reciprocal of
pulse duration
22
transducer lowers its sLJnsitivity similar to the transmitter, it is not as
critical as with the transmitter, because low-level signals from the receiver
can be increased by electronic amplifiers. No similar amplification can llb
applied to the transmitter output to increase the mechanical energy to the
concretc.
Damping techniques
16. A primary effort was made to determine the state of the art of
damping piezoelectric materials for preventing excessive ringing (Thornton and
Alexander 1987) in the transducers. Transducer companies were reluctant to
discuss the type of materials and techniques that they use to obtain various
bandwidths and sensitivities of piezoelectric elements since this is
proprietary information. However, it was possible to find useful informatioi
in the literature. A number of investigators have performed research on the
damping of piezoceramics with epoxy-loaded backings to obtain desired
bandwidths (Kossoff 1966, Washington 1961, and Lutsch 1961,. A mixture of
epoxy and tungsten powder will produce a backing that has an approximate
acoustic impedance match with that of PZT. (PZT is a tradename used by
Vernitron Piezoelectric Division of Bedford, Ohio, to represent the type of
piezoelectric material called lead zirconate titanate. Although many people
still refer to all lead zirconate titanate piezoelectrics as PZT, other
manufacturers have their own nomenclature.) This match will produce a minimum
of reflection at the PZT/backing interface and allow most of the energy
leaving the back face of the crystal to enter into the backing. Figure 13
illustraLes the location of the backing used to damp a crystal (Carlin 1.960).
If the pulse reflects back into the crystal, it will cause ringing. Lutsch
(1961) also used rubber powder in the backing to increase the attenuation and
reduce reflections from the back end of the backing. Washington (1961) found
that a mixture ratio of 2:1 by mass of tungsten to epoxy produced a
satisfactory backing. Increasing the amount of tungsten above this produced
marginal improvements. Kossoff (1966) found that a onee-quarter wavelet th
layer matched to the load and a low-impedance, backing that was also a one-
quarter waveleigt~h thick gave the hest handwidt-h , with reduced sonsitivi v
He worked with PZT-TA.
17. There are ma inly throe different ways to damp a triajn.sducer. F'i Ist
a Hopkinson Bar, which has a Long backing hi ehind the transmitted pullse, ciinb ho
21~

S. -DAM, PING
- _CRYSTAL
WORK
Figure 13. Illustration
of how backing is ap-plied to piezoelectricelement for damping pur-poses to alter bandwidth
(Carlin 1960)
used. This serves to delay the echo from the back end of the bar until echoes
have been received by the transducer from the concrete. Second, a shorter
backing can be used to damp the transducer. This backing matches the crystal
in impedance but has high attenuation properties to dissipate the energy
leaving the back face of the crystal to eliminate the development of standing
waves in the backing. This same idea is used with electrical power
transmission lines to prevent reflections. And finally, the third technique
involves using a one-quarter wavelength backing that does not compromise the
sensitivity of the transducer as much but gives a wider bandwidth. Canfield
and Moore (1967) tried to use this technique in a transducer to measure the
thickness of concrete but had limited success. The purpose then of matching
impedances is to terminate the back face of a crystal in its characteristic
impedance. By definition, the characteristic impedance of a material is the
impedance required to eliminate reflections. As in electrical cables, an
infinite length is not required for a backing in ultrasonics to eliminate
standing waves.
Impulse response
18. A theoretical. waveform that is used in physics and mathematics to
describe many concepts (point mass, point charge, point sources, etc.) is the
impulse (Figure 14). An impulse is a mathematical pulse having an infinitely
24

2 .0 1 . 1 1 1 1 1 1 1
1.5
WoD
-i1.0_ja .O
0.50
0.50.O I I I I I I I I
0 10 20 30 40 50 60 70 80 90 100
TIME - MICROSECONDS
Figure 14. A mathematical impulse has an infinite amplitudeat one instant in time. A real-world impulse will have adefinite amplitude and will exist for a definite (although
short) period of time
large amplitude and a width of zero units of time in duration. It therefore
contains energy at all frequencies uniformly across the spectrum (Figure 15).
The application of a mechanical impulse to a mechanical system produces an
effect which defines the system in the limit. A system is totally described
by the application of an impulse. If a transducer is excited by an impulse,
it will exhibit all fundamental modes of vibration with all of the respective
harmonics for that fundamental. None will be left out and the response will
approach a definite limit dependent on the system characteristics of the
transducer. This definite limit is called the impulse response of the
transducer.
19. Imagine the process to be started by exciting the transducer with a
fairly wide pulse and observing the response. As this process is continued by
making the exciting pulse somewhat shorter each time, the response will
finally settle down to a definite form. From that point on, the response will
be final. Even though the applied pulse contains higher-frequency components
25
2.0 1 1
i.5
CC1.0W "zW
0.50
0 .0 I I I I I I I I
0.0 0.20 0.40 0.60 0.80 1.0
FREQUENCY - MEGAHERTZ
Figure 15. Energy is generated at all frequencies from animpulse. A real-world impulse will generate frequencies
high enough to cover the range of the system tested
that distinguish the pulse as different from the previous pulse, it will
produce a negligible change in the transducer response. Every transducer,
instrument, material, or system has a limit in its frequency response. Once
the applied pulse produces the final response, there is no need to make the
applied pulse any shorter in time in an effort to improve the measurement.
The time duration of the applied pulse should always be much smaller than the
period of the greatest frequency of interest in the system being tested. In
fact, even the shape of the applied pulse is not important once it has become
short enough to generate the frequencies that the transducer will respond to.
The pulse can be triangular, rectangular, or any shape. It is implied that
the resolving power of the amplifier and recording equipment be sufficiently
adequate to cover at least the range of frequencies that the transducer will
respond to.
20. A fairly intense pulse can be generated by striking a common
carpenter's hammer on the surface of concrete, but the duration of the pulse
lacks the brevity needed for making UPE measurements with the proper
26

resolution. Fairly short pulses can be generated by dropping steel balls
against the surface of concrete, but the applied pulse lacks the necessary
intensity for measurements of deep penetration in the concrete. An impact is
needed that will have both attributes for efficient pulse-echo measurements in
concrete.
21. The textbooks that deal with the response of various systems
(filters, transducers, etc.) use an idealized stimulus such as an i.ipulse to
describe the transient response (Pender and Mcllwain 1950). Although the
impulse (infinitesimal width and infinite amplitude) does not exist in the
real world, it can be approximated close enough with a rectangular pulse. The
pulse need only be short enough in duration to contain the frequency
components that cover the bandwidth of the particular transducer. As the
rectangular pulse becomes shorter and shorter, the response of the transducer
finally reaches a limit so that the waveform changes no more. This final
waveform is called the transient response.
Tuning of transducers
22. It is important that the electrica] impedance of the transducer
matches the electrical impedance of the receiving or transmitting circuitry.
Electrical matching of impedances is important to obtain maximum efficiency
from a transmitter or receiver (Walker and Lumb 1964). When the bandwidth of
a receiving transducer has been increased [Quality Factor (Q) lowered] by an
external backing member, the sensitivity will be reduced from that of an
air-backed element. However, some of that sensitivity can be regained,
without degrading the bandwidth, by tuning out the reactance of the static
capacitance of the transducer by the addition of an inductor. Even if the
piezoelectric transducer does not require heavy damping with a backing
material, its output can still be boosted by the addition of an inductor. The
frequency of electrical resonance created by the combination of the externally
added inductor and the transducer capacitance is tuned to equal the mechanical
resonance of the crystal.
23. The shunting effect of the static capacitance generally is un-
desirable, whether the device is designed for operation at resonance or for
broadband (below resonance) operation. In electrically driven devices, it
(static capacitance) shunts the driving amplifier or other signal source
requiring that the source be capable of supplying extra current. In the case
27

of mechanically driven devices, such as is the case here, the static
capacitance acts as a load on the active part of the transducer, reducing the
electrical output. In nonresonant devices, little can be done about the shunt
capacitance except choose a type of piezoelectric material that has maximum
activity. In resonant devices, however, the static capacitance may be
"neutralized" by employing a shunt or series inductor chosen to resonate with
the static capacitance at the operating frequency. This is illustrated in
Figure 16 (Vernitron Piezoelectric Division 1979).
24. The static capacitance (C) can be measured with an impedance bridge
or calculated. If measured, it should be made at a low frequency near i kHz.
If calculated, one can use the following equation (Edo Western Corporation
Brochure)
C- =K 3eA (4)th
where
K3 = relative permittivity, dielectric constant of crystal
c, = permittivity of free space, 8.85 x 10⁻¹² farads/metre
A = area of crystal, square metres
th = thickness of crystal, metres
C = static capacitance, farads
25. Impedance matching on a transducer is achieved with an external
inductor, once the inductance value is determined from Equation 6. At the
frequency of resonance, the inductive reactance is equal to the capacitive
reactance of the series branch shown in the equivalent circuit of Figure 17
(Cady 1964). At that frequency, the total impedance of the series branch is
purely resistive and equal to R. The inductive reactance cancels the
capacitive reactance. Since Cl will reduce the output voltage coming from R
(the generator), an inductor can be placed in parallel with Cl to form a high-
impedance parallel resonant circuit. Of course, the resonant frequency of the
parallel circuit is made equal to the resonant frequency of the series circuit
by choosing an inductor that matches the value of the static capacitance. The
familiar equation for the resonant condition is rearranged in the following
steps to solve for the inductance
28

IMPEDANCE REPRESENTING RESONANT MECHANICAL SYSTEM
SERIES INDUCTOR STATIC CAPACITANCE
LOWIMPEDANCEELECTRICAL
SOURCEOR LOAD j
RESONANT PIEZOELECTRIC DEVICE
IMPEDANCE REPRESENTING RESONANT MECHANICAL SYSTEM
SHUNT INDUCTOR STATIC CAPACITANCE.7
HIGHIMPEDANCEELECTRICAL
SOURCEOR LOAD ______- _ J
RESONANT PIEZOELECTRIC DEVICE
Figure 16. Resonant piezoelectric device with
static capacitance "neutralized" by inductor(Vernitron Piezoelectric Division 1979)
C1
R L
Figure 17. Equivalent electricalcircuit of piezoelectric resonator
(Cady 1964)
29
f _--L - (5)
L (6)(2nf)
2 C
where
L = inductance of coil, henries
C = static capacitance, farads
f = resonant frequency of transducer, hertz
26. The addition of an inductor across the piezoelectric transducer
tuned to the appropriate frequency of the thickness mode oscillations is also
useful to avoid undue excitation of the lateral ringing of the transducer
elements at a different frequency (Bradfield 1948). It is necessary for
admittance (reciprocal of impedance) measurements to be made in the process of
constructing a transducer. The admittance of the piezoelectric transducer
will change from its undampened condition in air. As elements are bonded
together into a mosaic in various series or parallel combinations, the
admittance will change. Other factors that alter the admittance are: the
addition of external damping, the installation of the piezoelectric elements
into a housing, the associated electrical impedance placed on the transducer
by the cable, various receiving circuitry, and the mechanical loading by the
test specimen.
Bandwidth measurements
27. Evaluation of the characteristics of the piezoelectric resonator is
dependent upon accurate measurements of the physical and dielectric properties
and impedance of the element or resonator. While the measurements of
capacitance and dissipation factor are relatively simple (requires a
capacitance bridge), the evaluation of the critical frequencies must be
carefully performed. The recommended test circuit for determining the
critical frequencies and impedances of the piezoelectric resonator is shown in
Figure 18. With this type of measurement, the following parameters can be
measured: the resonant frequency of the transducer (frequency of series
branch in Figure 7), antiresonant frequency of the transducer (frequency of
both branches in parallel), output impedance of transducer (R), Q or
30

VOLTAGEDIVIDER
GENERATOR TRASDUCER
AMMETER
SWEEPI OSCILLOSCOPE
Figure 18. Admittometer used tomeasure bandwidth of piezoelec-tric transducers (Edo Western
Corporation Brochure)
bandwidth, presence of interfering modes of vibration, and other useful
information (Edo Western Corporation Brochure).
28. An automatic sweep oscillator was used in the admittance
measurements. However, the measurements can be made by adjusting the
frequency manually. The sweep oscillator used is capable of providing a
direct-current sweep voltage for the horizontal axis of the oscilloscope that
is directly proportional to the output frequency of the oscillator. By
repeating the sweep at a suitable repetition rate, a continuous band-width
curve is displayed on the oscilloscope as a function of frequency. The sweep
rate must be lowered when the transducer has a high Q. A high Q transducer
requires a definite amount of time for the amplitude to build up to maximum
when excited near resonance. (Thornton and Alexander 1987) If the Q of the
transducer is 10, it will take 10 cycles of sinusoidal excitation to build up
to 96 percent of the full amplitude. A Q of 100 will require 100 cycles, etc.
29. Although the circuit seems relatively simple, there are some things
to be aware of. The sum of Rl and R2 should match the output impedance of the
sweep generator. The value of R2 should be kept much lower than the R of the
transducer so that it will not introduce damping into the transducer circuit.
Also, the low impedance will help maintain a fairly constant supply voltage
31
(necessary) across the resistor R2. Ideally, R3 should be kept low (less than
R of transducer) for the voltage across R3 to represent accurately the
admittance of the resonator. However, the voltage will drop so low across R3
at the antiresonant frequency that it will cause a poor signal-to-noise ratio.
It is recommended that R3 be less than three times the value of R for proper
signal-to-noise considerations. This will require that a correction be made
to calculate the admittance and the mechanical Q at resonance. In addition,
there can be significant problems with stray inductance and especially stray
capacitance due to the low values that make up the equivalent circuit of the
transducer. Leads should be kept very short and care taken to use the proper
test fixture. A low capacitance probe can be used to take the voltage from R3
to the oscilloscope,
30. A bandwidth measurement was made on a PZT-C5500 piezoelectric rod
element that was 1 in. in length and 1/2 in. in diameter (Figure 19). The
frequency constant of the cylinder was 56 kflz-in. Hence, with a 1-in. length,
the crystal has a longitudinal resonance of 56 kHz. The photograph shows that
the undamped crystal has a sharp Q (narrow peak response). This means that
the energy is contained within a narrow band of frequencies. The equation for
computing the Q is
_ f (7)
where
fr = resonant frequency, hertz
f 2 , f 1 = frequencies above and below resonance where the amplitude isdown by a factor of 1,/•2 (-3 db), hertz
A rough calculation of Q from this measurement follows
56,000 (8)2,000
Q = 28 (9)
If a measurement were made, the time required (Q/f) for the crystal to ring
down to 4 percent of its original amplitude would be 500 psec (28/56,000).
Obviously, a transmitter or receiver with a 500-ysec ring-down time could not
32
0.2
0.1
-j
0
-0.1
-0.2 -
0 50 100FREQUENCY, kHz
Figure 19. Bandwidth measurement on aPZT-C5500 piezoelectric rod element.Longitudinal resonance occurs at56 kHz. The PZT rod element is 1 in.in length and 1/2 in. in diameter.PZT-C5500 is manufactured by Channel
Industries
be used to detect an echo from the base of a 9-in. slab (102-psec round trip)
as it (transducer) would still be ringing at the TOA of the reflected signal.
(The transducer would be initially excited into ringing at the instant of
impact.) This examplP is presented as an illustration to point out the need
for having a transducer receiver that is damped.
31. Notice how the bandwidth measurement, on a piezoelectric rod
element, is clean and free of spurious nodes. The undesirable radial mode is
above 100 kHz and falls outside the scale shown on the photograph. However,
the large separation in frequency between the desirable longitudinal mode and
the undesirable radial mode makes the transducer ideally suited for applying
an electrical filter to remove the unwanted radial interference. A mosaic
transducer could be constructed with a number of these point sources to form a
flat radiator with directivity (Howkins 1968). The higher-frequency radial
mode could be reduced, or eliminated, with low-pass filtering and by embedding
the rod elements in a disc or plate made of tungsten-loaded epoxy. The
frequency constant of PZT-C5500 is 56 kHz-in. in the longitudinal direction
and 78 kHz-in. in the radial direction. This means that the interfering mode
33

would be three times as high in frequency as the desired mode for a 1-in.-
long, 1/2 - in. -diam rod element. Also, the concrete itself would act as a loy-
pass filter, since the attenuation property of concrete is very i~LLi, whui the.
wavelength of the input signal is equal to, or smaller than, the dimensions of
the aggregate.
Harmonics
32. According to transducer theory, the pulse width of a one-half sine
wave impact should be one-half of the period of the natural frequency of the
crystal to produce maximum excitation of the crystal at resonance (Stein
1964). As an example, this means that a transducer would be highly sensitive
if an impact from a steel ball on the concrete produced a 20-psec-wide pulse,
and the transducer had a rcsonance at 25 kHz (f = 1/(2 (20 usec))). (The
concrete slab would need to be much thicker than 3 or 4 in. to eliminate
setting up a thickness resonance in the slab near 25 kHz and interfering with
the measurement.) The preceding discussion refers to enhancing a pulse-echo
condition in the concrete; not a resonance condition.
33. Spectrum-analysis tests on the impact load-pulse from the Schmidt
hammer show the frequency content to follow the "bouncing ball" spectrum of a
rectangular pulse (see the negative-going rectangular pulse in Figure 20 and
the corresponding frequency spectrum in Figure 21). The width of the pulse
(r) is 100 psec from an electrical pulse generator. The first null of the
frequency content curve is at 1/r = 10 kHz ; the second null is at 2 /r
(20 kHz), etc. (Remember, as shown in Figure 12, t1i- t- • . - the
first null for a one-half sine wave is calculated differently than for a
rectangular pulse and is 1.5 times the reciprocal of the pulse duration.)
However, the frequency band of the highest energy exists from 0 to 5 kHz. The
next main energy peak would be at 15 kHz, then 25 kHz, etc. We can see that
there is a component of energy that exists at higher frequencies from the
energy spectrum of the electronic rectangular pulse that could be used to
excite a high-frequency crystal.
34. It can be seen that the broadband spectrum of energy from the
impact of a rebound hammer can excite, for example, the 15th harmonic of a
crystal. One could use a crystal having a fundamental resonant frequency of
34
2
0 -20 0 0
o 0
I.-
-2 1 - -I0 100 200 300 400 500
TIME. Mgsec
Figure 20. Rectangular shaped electricalpulse from a pulse generator (similar to
shape of mechanical load-pulse fromSchmidt hammer)
30
25
20
~15 -
10
5
0-0 5 10 15 20 25
l/T 2/ TFREQUJENCY, kHz
Figure 21. Frequency spectrum of rectan-gular pulse from a pulse generator
35

7,143 Hz (1/(2 (70 kisec))) and, by use of electrical filters, pass only the
fifteenth harmonic of the crystal (107,000 H1z) through the recording sysz:vm.
35. Piezoelectric plates vibrate in numerous fundaiuetal modes vi
their respective harmonics when the crystal is excited (Kraw°.amer and
Krautkramer 1977). An interesting fact that may be useful for impact-echo
measurements is that: the Q, which is inversely related to the damping
factor, decreases with the order of the harmonic. If the fundamental has a Q
of 20, then the fifth harmonic would have a Q of 4. Since ultrasonic pulse-
echo testing requires short pulses, it may be of benefit to pass only one of
the higher frequency harmcnics. All the harmonics of vibration are beirF.
excited by the broadband energy from an impact. Also, the sensitivity of each
harmonic decreases as the order of the harmonic. Figure 22 shows a bandwidth
measurement performed by exciting the PZT-C5500 transducer by an i:ýpact from
dropping a steel ball on the faceplate of the transducer. Note that the
fundamental is slightly less than 20 kHz, and harmonics occur at integral
multiples of the fundamental.
36. An undamped transducer such as PZT will have too high a Q to permit
ultrasonic pulse-echo measurements to be made through a penetration depth of
less than a few feet when operating at the fundamental resonant frequency of
the transducer. UPE measurements, whether for concrete or other materials,
require low Q (wide bandwidth) transducers for proper operation. However, it
is possible to perform ultrasonic pulse-echo measurements at one of the
harmonic frequencies of the transducer since the Q decreases as the order of
the harmonic (Krautkramer and Krautkramer 1977). If a transducer is excited
by a gated sine wave pulse with the center frequency of the pulse at the
resonant frequency of the transducer, the transducer will respond around that
frequency only. If the transducer is shock excited with a very short impulse,
it will respond at the fundamental resonant frequency and at all of its
harmonics. One of the popular narrowband transducers used for through-
transmission measurements in concrete is the James V-meter Model C-4898
transducer resonant near 54 kHz. The Q of the fundamental frequency is high,
near 200, since the transducer is undamped. The twenty-fifth harmonic will
have a Q of 200/25 or 8 as discussed. The frc-quency of the twent•y-fifith
harmonic will he 25 times the fundamental of 54 ki-z or 1.4 Mliz. The.
sensitivity of the harmonic also decreases in inverse p roport itn to t:ht o1rd(,'
36
800 I ......
"W 6000
I--
_j0.- 400
C.D
z 200w
01
0 10 20 30 40 50 60 70 80 90 100
FREQUENCY - KILOHERTZ
Figure 22. Frequency response of PZT-C5500 transducer fromexcitation by impact from a steel ball on the aluminum
faceplate of transducer. Note the harmonics
of the harmonic. If the amplitude of the fundamental were 20 volts at 54 kliz,
the amplitude of the harmonic at 1.4 MHz would be 20/25 or 0.8 volt.
37, The following test was made to verify the facts mentioned ii the
previous paragraph. A pitch-catch UPE measurement was made on a 6-it. -thick
block of steel. The James V-meter transducer wis used as the transmitter. and
a low 0 (=3) transducer, Panametrics Model 301S, resonant at about 55' V)s.
was used as the receiver. The transmitter was shock excited with the
Panametrics Model 5055PR pulser with the damping conltrol adjusted to get
maxi.muim response at: a higher-Freque ncy : ha rinonic g fl i teeril q.
performed both Wit h passiVe and active filters to red(uc 4L1 eitpI , t od nt,
high- energy frequencies below 850 kliz. The fi rs t. ft iter was t i pai .;•;eiv hi h -
pass Model H62 by TTE, Inc. , with cut-off at 200 kHz; noxt waa; , c ctive hiirh -
pass filter from the Panametrics Model 505 SPR, witth cut off at 5)00 klz; all
amplifier followed with a gain of 60 d) on the filt Ite red 0ignalii Sv -tC.K
Model 442 active hand-pass filter fol]lowed that, with citof , it ;'1 Mi;

rolloff attenuation of 48 db/octave, and a stop-band attenuation of 80 d(.
Multiple echoes were received with a duration of 51 jisec between c.choes with
the spectrum of the echoes having the main energy at about 350 ký,z and
1.2 MHz. See the echoes in the time domain in Figure 23 and the echoes in the
frequency domain in Figure 24. The peak at 550 kHz is larger than the 1.2 MHz
peak due to the fact that the transducer receiver is more sensitive at that
frequency, although the lower frequency received some filtering. The
following observations were noted. Surface waves which normally would have
been present at the low frequency of 54 kHz and would have totally prevented
the detection of echoes have been eliminated by operating at a higher
frequency. The twenty-fifth harmonic has a Q of about 8 and is not too high
for making UPE measurements through a penetration depth of less than 1 ft in a
small-grain material, since the wavelength is sc short at that frequency.
Howevcr, the attenuation in concrete is simply too high to permit a UPE
measurement at 1.2 MHz as was done in the metal. This tr•t illustrates that
pulse-echo measurements are at least possible with a hig:. Q (narrowband)
transducer by op-rating at one of the harmonics of the fundamental.
38. To illustrate tne potential of harmonic operation, assume that the
thickness of a section of concrete floor slab is being measured. The
round-trip time of a longitudinal pulse for a thickness of 9 in. is about
100 psec. For proper resolution, the pulse length should not be longer than
one-tenth of the path length (10 usec or less). Assume that we are using an
undamped transducer with a resonant frequency of 20 kHz for the fundamental
,node. If the fundamental had a Q of 22, then the eleventh harmonic would have
a Q of 2 (as discussed) and, once excited, would ring for about two cycles
before dying. At a frequency of 220 kHz (eleventh harmonic), the two-cycle
pulse would be slightly less than 10 tsec and that meets the proper criteria.
39. If a different concrete structure is chosen and the thickness of
the concrete is 900 in., this is an increase in travel path of 100 times over
the first case. The round-trip time of the longitudinal pulse in the concrete
would now be 10,000 izsec. For proper resolution, the pulse le ,tgthi could not
exceed 1.,00() ;isec. If the imaginary band-ppa c;• filter i. . ilove,(I ai lld it, pa •,5.
the fnrldnlu ft_1 fr(e tu cy (first harrinon i.c) onl', it 11! a peri od of )() ,c
;ja d wi I rill;, for ;b..olt- 22 cycle'.s . That ('(,t-ruspolnd, to a p . lc Itlcýngt
1, 100 1lsec That may be! a lit I.e longer 1thiaf do'.;ired. ,tfd pro:pei rt-!;501 t i 1I
38
150
cn1- 100 -_j
-j 50 I -
40 17 --
W
50
'-4
-J 50
-
-
- 0 -
00 50. 100 0.0 .200 . 250 .00
TIMEUNY - MICOECONDST
Figure 23. Ulreauenicy puse-echomofsprements ecoes ahw 6-hat
the primaryobn tnransducerpihy teuted bhryg filecrinytemring
na550 k1 a 1 d 1. 1 1 1z
400
I-
-io00 0.4 00 0 150 1200 . 250 .00
Figure 23. Ulrasoenicy spulechrmof mreasourmns econs ahw 6-iha-on
thell nriaryoneand tansdcerpihy teuted bhog h eodn ysfitering
:39

can be reached by moving on to the second or third harmonic. Notice, however,
that the operation of the piezoelectric plate corresponds to the resolution
and sensitivity needed for the particular thickness measured in the coi.crete.
That is, when thickness is short and more resolution and less penetration is
required, a higher frequency harmonic can be passed. When the distances are
long and less resolution and more penetration is needed, one can pass a lower-
frequency harmonic or possibly the fundamental. This remains to be tested in
concrete.
Digital Signal Processing
40. A software package, Computer-Aided Circuit Analysis, Optimization,
and Measurement (COMTRAN), was designed for AC circuit analysis by Jensen
Transformers, Inc. This software was used in conjunction with a Hewlett-
Packard (HP) series 300 computer and a HP 5182A waveform recorder to acquire
impact-echo response signals in the time domain and compute the Fast Fourier
Transform (FFT) of the signals. The software package was capable of
performing Fast Convolution as shown in Figure 25, as well as many other
digital signal processing (DSP) techniques.
41. A small computer program was written to generate digitized echoes
having a user-defined center frequency, a constant time between echoes, and a
fixed attenuation of multiple echoes. Another program was modified from
another computer language to compute a digital band-pass filter in the HP
Rocky Mountain Basic language. The filter was capable of being adjusted to
various cutoff frequencies both above and below the center frequency.
42. Figure 26 shows a series of mathematically calculated echoes
occurring every 12.8 1isec with the transducer having a center fr-,quency at
50 kHz. An FFT of the time domain signal in Figure 27 shows the energy
centered about 50 kHz with various harmonics separated by the difference
frequency of 7.8 kHz. The envelope of the wave-form represents the frequency
response of the transducer while the "comb" pattern is due to the echoes. The
difference frequency of 7.8 kHz (difference between "teeth" of "comb") is the
reciprocal of the time between echoes, 1.28 ;tsec. See paragraph 14.
43. One of the signaL processing operations that 6OMTRAN will perf.orm
is convolut i. on. The counterpart of convolu t. ion in the time domain, is comipplex
40

INPUT SIGNAL FILTER SIGNAL(TIME) (TIME)
FAST FOURIER FAST FOURIERTRANSFORM TRANSFORM
SPECTRUM SPECTRUM
COMP:LEXMULTIPLY & INVERSEFOURIER TRANSFORM
(IFT)
OUTPUT SIGNAL(TIME)
Figure 25. Illustration of method to perform digital filtering.This is sometimes called "Fast Convolution"
41

1O000 i i i i
_-
0 Soo
0-500
01
0 200 400 600
TIME - MICROSECONDS
Figure 26. Echoes generated mathematically to simulate possi-ble action in concrete. The center frequency of the trans-
du-er is 50 kHz and the echoes occur every 128 tisec
so
WU 60w 0I.-I-4
_ja.Z 40
wZ 20w
0.0 0.10 0.20 0.30 0.40 0.50
FREQUENCY -MEGAHERTZ
Figure 27. FFT (Spectrum) of previous echoes. Spacing of fre-quency peaks is 7.8 kHz or reciprocal of times of arrival of
echoes of 128 /isec
142

multiplication in the frequency domain. In the time domain, the input signal
is convolved with the impulse response of the filter to generate the output
signal, also in the time domain. If the FFT is taken of the input signal and
complex multiplied by the FFT of the filter's impulse response (frequency
response function of filter), one will obtain the output signal in the
frequency domain (same as the FFT of the output signal gotten by convolution
in the time domain). So convolution in the time domain is equivalent to
complex multiplication in the frequency domain. Equation 10 shows the
convolution process in the time domain
V(t)o = V(tOii(t) (10)
where
V(t), = input signal in the time domain
1(t) = impulse response of the filter in the time domain
V(t). = output signal in the time domain
Equation 11 represents the convolution process in the frequency domain
S(f)° = S(f)iFr(f) (11)
where
S(f)i ý input signal in the frequency domain
S(f)o = output signal in the frequency domain
Fr(f) = frequency response of the filter
44. A high-pass digital filter was computed that only passed energy
above 25 kHz. This is shown in Figure 28 as the impulse response of the
filter. The FFT of the impulse response yields the frequency response
function shown in Figure 29. This view of the filter is more informative as
it is clear that the filter only passes information above 25 kHz. Figure 30
is the result of convolving the signal, Figure 27, with the filter. All
frequencies below 25 kHz have been attenuated. By doing an inverse FFT on the
result as shown in Figure 31, the sharpness of the front of the echoes has
been reduced somewhat, and the pulse has been lengthened due to the low
frequency filtering.
45. The point to be made is that the large, spurious low frequencies
created by an impact could be filtered from the composite signal without
destroying the desirable higher frequencies. Because the handwidth must be
43

1000
En1- 800
iI
- 600-J
400
w0M 200I-.. JnL 0
-200 1 I I I 10 200 400 600
TIME - MICROSECONDS
Figure 28. Impulse response of a high-pass digital filterwith cutoff at 25 kHz
1.2
1.0
H 0.80Z0
0.60Eni.n
In 0.40Z
• 0.20
0 .0 I I I I I I I
0.0 0.20 0.40 0.60 0.80 1.0
FREQUENCY - MEGAHERTZ
Figure 29. Frequency response of digital filter showing cut-off at 25 kHz
44

80
W 600
X 40< !,CDZ 20w
0
0.0 O.10 0.20 0.30 0.40 0.50
FREQUENCY - MEGAHERTZ
Figure 30. Resulting frequency response after convolving time-
domain echo signal with impulse response of filter. Note the
attenuation of energy below 25 klz
1000
cn-jo 500
0
W0
- -500
-1000 ,
0 200 400 600
TIME - MICROSECONDS
Figure 31. Inverse FFT of previous signal showing that echoes
can be seen after the attenuation of the low-frequency energyby filtering
45
adequate to pass the high-frequency components and yet reject the extraneous
low frequencies that necessarily occur when an impact on concrete is made, it
is probably better to use a high-pass filter rather than a band-pass filter.
Bandwidth Considerations
46. The designer of a digital filter must consider information about
the signal's bandwidth if it is desired to reproduce the desired signal
accurately. An adequate bandwidth is especially important when transmitting
short pulses. Yet, since an impact excites so many extraneous modes of
vibration, it is important that the bandwidth be kept to its smallest possible
value to prevent interference from undesired signals. If some of the
important component frequencies are suppressed by the electrical system, ther
the transmission distorts the pulse and, in particular, lengthens it. To
transmit a pulse of duration T, a frequency bandwidth of B = 1/T is
sufficiently wide to pass the pulse witnout considerable distortion even if
the amplitude of the frequencies passed on either end of the band is only 70
percent of that passed at the center of the band (Krautkramer and Krautkramer
1977).
47. A filter with a bandwidth of 100 kHz, therefore, could transmit
with practically no distortion a pulse of 1/100 kHz = l0-jusec duration, e.g.
five oscillations of a 500-kHz frequency (period is 2 psec). Any pulse is a
complex wave, containing many sine-wave components. If the pulse is
repetitive, then the lowest-frequency component, the fundamental frequency, is
exactly equal to the pulse repetition rate. The other components are
harmonics of this value (DeFrance 1963). For example, a pulse with 10-psec
duration and a repetition rate of 10 kHz (approximate longitudinal echo rate
in a 9-in.-thick concrete slab) would contain frequency components from 10 kHz
to at least 600 kHz. But, as explained, one could reproduce the pulse with a
fair degree of accuracy with a 100 kliz-bandwidth centered at 500 kHz.
48. The rise time of a rectangular shaped pulse determines the highest-
frequency component present in the pulse. (This is a common method to test
the bandwidth of a hi-fi system.) A system will ring at its resonant
frequency when excited by a rectangular pulse sufficiently short in duration
to contain energy at that frequency. There is no build-up time required for
46
the system to r'spond with maximum amplitude, such as is the ca.se wht.n r11 t
system is excited by sine-wave bursts at the resonant frequency of the
transducer. If the Q of a transducer is equal to 2, it will take two cycles
of a sine-wave stimulus for the transducer to reach 96 percent of its maximuml)
amplitude. However, with shock (impulse) excitation, the transducer will
reach its maximum amplitude in a fraction of one-quarter of a cycle of the
tLfansducer resonant frequency (Hueter and Bolt 1955). This is an important
factor to understand when measuring the exact TOA of an echo. The front of
the pulse will be sharp and will have maximum amplitude for shock excitation.
49. There is still another factor in the consideration of bandwidth.
Since concrete is a highly attenuative material, it will tend to act as a
mechanical low-pass filter on the higher frequencies and distort the pulse.
It may be necessary to provide equalization by means of an electrical network
to boost the high-frequency components in conjunction with the high-pass
filter previously discussed. It is necessary to pass the high-frequency
harmonics of a pulse to prevent distortion and lengthening.
4 7
PART III: LITERATURE REVIEW
Impact Measurements Research
50. The load-pulse duration from a hammer impact does not necessarily
correspond with the period of longitudinal resonance of the concrete when
making impact-echo measurements as is the case with impact-resonance
measurements (Alexander 1991). The width of the load-pulse (contact time)
should be equal to one-half of the period (T) of the longitudinal resonant
frequency in the concrete to cause maximum response when making resonant-
frequency measurements. However, it is necessary that the contact time of he
hammer be no more than 10 percent of the two-wave travel time in the concrete
to properly resolve echoes for impact-echo measurements. If the pulse
duration is equal to 1/2 T, it would create a .:esonant condition rather than a
pulse-echo signal. A number of sinusoidal reverberations are generally
measured for a resonant condition which is effectively an averaging process.
If the pulse duration is less than 10 percent of the period, then a pulse-echo
condition will dominate over a resonance condition and only cne echo must be
detected for a proper measurement.
51. In 1981, the author impacted a 200-lb mass against an insitu
concrete pier having a mass of about 1,000,000 lb on the Lake Superior Control
Structure near SaulL Sainte Marie, MI (Alexander 1981). It was possible to
resonate the structure in its flexural mode. Although that investigation
demonstrated the potential of impacts to make resonant-frequency measurements.
this report primarily deals with pulse-echo measurements.
52. Howkins (1968) used a 40-in. steel rod with the top end case
hardened to receive a small steel ball shot from an air gun. He was able to
produce a pulse as short as 10 psec. He used a condenser microphone
(ultramicrometer) as a receiver. The receiver was designed for the low
acoustic impedance of air and, therefore, presented a serious mismatch with
the acoustic impedance of concrete, The system was subject to noise as the
sensitivity of the microphone was very low. However, he measured the
thickness of a 10-in. slab of concrete using the impact-echo technique.
53. Sanasalone and Carino (1986) have duveloped an improved impact
resonant-frequency system for detecting interfaces in concrete. Small steelI
48
balls with dianieters of about 3/8 ill. and largt-r ar-e used to .v-iviat e,:-:FV
primarily in the sonic range (< 20 kHz). Sinusoidal reverberat1ion(is are
measured with a sensitive, broadband receiver. It will penetrat~e to a depth
of a few feet.
54. Muenow has developed an impact-echo system for which detai is have
not been made public except in a general sense (Muenow 1990). Although the
claims of the system are significant, not enough is known about the system to
evaluate its accuracy and to verify the physics of the measuremeont.
55. Desai et al. (1974) tested a large dam in India for cracks by an
impact-echo technique by dropping a large-diameter (dimensions unknown) steel
ball on the top surface and detecting echoes from a crack plane estimated to
be 15 m across. The frequency of the energy was estimated to be in the low
end of the sonic range at about 240 Hz. The actual depth of the crack is not
known.
Sonic Impact Pulse-Echo Research
56. Sonic pulse-echo tests were made on a pile 80 ft long and 14 in.
square in cross section and lying on the soil (Alexander 1980). Figure 32
shows the concrete pile, sledge hammer, and transducer used to make pulse-echo
measurements. A 12-lb sledge hammer was used to impact the end of the pile.
The reflection was received with a James Electronics, Inc., Model C-4966
transducer with resonance near 50 kHz. Operation took place in the broadband
region of the transducer response curve below resonance. No filtering or
signal processing was required. Figure 33 shows the cracked pile and
Figure 34 presents the echo signal. The load-pulse can be seen at the time of
impact and also four reflections from a crack located 16.2 ft from the impact
end of the pile. Since the location of the crack is about 20 percent of the
length of the pile, five reflections will occur from the crack and arrive at
the transducer before the reflection arrives from the opposite end of the
pile. The large reflection arriving at a point located about 2/3 of the way
along the x-axis is the load-pulse reflecting off the opposite end of the
81.625-ft-long pile. Two more echoes are seen on the trace from the crack <s
the energy continues to reverberate in the pile.
57. The load-pulse introduced into the concrete is about 1 .2 insec long.
49

r P
Figure 32. 80-ft-long concrete pile, sledge hammer, and piezoelectricreceiver used in making a sonic pulse-echo measurement
Figure 33. Crack in pile located 16 ft from end of pile
50

Figure 34. Arrival of echoes from end of pile and from crack. Five
echoes can be seen from crack before the large amplitude echo arrivesfrom the pile end
This corresponds to energy existing primarily at a frequency of about 833 Hz.
The first dip in energy would occur at 1,250 Hz as described earlier in this
report. The total travel time down and back the length of the pile is 11.46
msec for the 14,245 ft/sec longitudinal-velocity wave. So the pulse length in
units of time is about 10 percent of the round-trip time for the pulse in the
concrete pile. -
"In setting up the pulse system, the length (distance)of the pulse should be adjusted according to the minimum
distance of transmission. For example, if an operator
were testing a part that was I in. thick, he would wantthe pulse to be a very small fraction of an inch. Thetime it takes for ultrasonic wavew. to trav(el I li. in.;t I or alumnutt~hm Is about 8 /ps1 so a good lngth for"the puls!e would be 2 psec . If hl wvro te-stti g a part
that was 20 ft long, the ope rator" cou ld 1 av, i pu I;v,
Itig•th of 5 to 10 psvc. Th is lotipgvr puls, I si , 1i 1,,I himto gt:,( somewlit mor( ijowe r into thi, illmed him1 and tl 1wrulOrt
greater pceietratlon." (Carl in 1960)
51
In this case the pulse length is 17 ft long or about 10 percent o( the
163.25-ft round-trip travel path in the pile. In most cases , tkh, pV.l ,.e
should not be m-ore than 10 percent of the total roundd-trip fror.' I i ., I (4 .h,
pulse for impact-echo measurements to obtaiin tht prope r rkesolutti(0. TwIh pw11.•
can be longer for impact-resonance measurements. This report is primarily
concerned with ultrasonic pulse-echo measurements by imnact.
58. For a typical concrete pavement thickness of 9 in., the round-trip
travel time is about 100 psec. Therefore, the pulse length should not be much
longer than 10 Asec to properly resolve echoes. One cycle of ai sinusoidal
pulse would correspond to a center frequency of 100 kHz. Since the upp.-r
frequency limit for concrete is close to 200 kHz, to prevent e:xcessive
scattering, the pulse length could not be much shorter thaln >5 ks.C
(T = 1/200 kHz). This represents a fairly narrow window (5 pssec < pulse
length < 10 psec) for measuring thickness or locating flaws in concrete
pavements and floor slabs using impact-echo measurements.
59. The locg slender pile acts as a waveguide to keep thi:. energy
contained within thcf pile. However, with a slab the energy spreads out in all
directions with only a small percentage of the original energy reflecting troom
the base of the slab, This makes the slab measurement much more difficult
than a pile measurement.
PART IV: LABORATORY WORK ON BROADBAND TRANSDUCERS
Using Resonant Transducers as Broadband Receiver-,s
60. To accurately reproduce the shape of transients with an undamped
(resonant) transducer receiver, it is necessary that the natural period of the
transducer be much lower than the width of the transient pulse being measured.
This ensures that operation will occur in the broadband portion of the
frequency-response curve of the transducer and that the pulse will not cause
the transducer to resonate. With one-half sine or triangular shaped
transients, the transducer's natural period should be less than- cn-fifih Th-
pulse duration (Stein 1964) for faithful. reproduction.
61. This becomes much more critical with short, square trarnsients like
one produced by sharp impacts from a Schmidt rebound hammer. A typical impact
waveform from the rebound hammer impacting a load cell on concrete is shown in
Figure 35. The trace is load versus time, and the width of the wain load
pulse is about 70 /sec. A wider pulse will be created from an impact on
concrete because the concrete is softer than the metal load-cell. liowex'er,
the rise time will still be sharp when the hammer impacts the concrete
directly. A typical rebound hammer is shown in Figure 36.
62. With these sharp impact pulses, the rise time of the pulse becomes
the determining criterion that creates the high-frequency energy rather than
the pulse width as is the case with the sine wave. If the rise time is short
in comparison with the pulse width, as much as 100-percent overshoot is
present (caused by subsequent excitation of the transducer natural period).
If filtering is not used to attenuate the ringing, then it is desirable for
the transducer to have a natural period of one-third the rise time, or less.
If it takes 5 jjsec for a 70-pL-ec-wide pulse to rise, then a resonant
transducer with a natural period of 1-2/3-psec, or less, would he rcquirkid to
accurately reproduce the pulse without ringing and overshoot. That
corresponds to a transducer having a resonant frequency of 600 klIz.
63. In summary, a transducer must have much shorter na t 1ural period to
reproduce the actual shape of a rect anguI lar pul se than is reqiri, d to
repro duce, a half -cycle sinuso id[ l pulse I Or, (( 1u1iva lent ly, thI rI sioII o It
8000
6000
L~j4000
F ..- ())"-
_ ° ° .... .... . .....i'44'4 -H- H4- H'-. -4.IHI HI4 --
2000----
20 40 60 80 100TIME, gsec
Figure 35. Typical load-pulse produced from
impact on concrete with a Schmidt rebound
hammer. Pulse is about 70 psec wide with
amplitude near 5,000 lb of force. Rise timeis less than 10 tisec
Figure 36. A typical model of aSchmidt rebound hammer tradition-ally used to measure the reboundnumber of concrete (ASTM C 805)
(ASTM 1992). In this investiga-tion it was used to generatestress wave energy for ultra-
sonic pulse-echo measurements
frequency of the transducer must be much higher to reproduce rectangular
pulses than to reproduce sinusoidal pulses.
PZT-Steel Rod Transducer and Rebound Hammer
64. Figurn 37 shows the first impact-echo transducer built at the
US Army Engineer Waterways Experiment Station (USAEWES) for use on concrete.
A piezoelectric element was bonded to a steel rod 7 ft long and 1/2 in. in
diameter. A 1/2-in.-diam PZT element, about 1/16 in. thick and initially
resonant at 1.2 MHz while unbonded, was bonded with silver epoxy to the lower
end of the rod. A short piece of rod 1-1/2 in. long was bonded to the other
face of the crystal. It took 840 psec for a longitudinal pulse to travel from
the piezoceramic to the top of the rod and bc'k to the crytal. This allowed
enough time to receive a number of echoes from the 9-in.-thick slab shown in
the photograph before the pulse emanating from the back side of the crystal
could return and interfere with the pulse that left the front face of the
crystal. The two-way travel time in the slab was 102 psec. The energy was
introduced into the slab with a Schmidt hammer (Figure 36). Initially, to
increase the introduction of high frequencies into the concrete, a piece of
1/4-in.-thick steel was bonded to the surface of the concrete, and the impact
was made on the steel plate. The sonic pulse-echo measurement is shown in
Figure 38. At least three echoes can be seen at 100, 200, and 300 /tsec. The
top of the waveform is clipped as the input amplifier is being overdriven due
to the high-amplitude acoustic energy from the hammer. This Hopkinson Bar
type of transducer demonstrated that measurements can be made when a sensitive
broadband receiver is available. However, the long rod is not practical for
field work and would probably never be feasible for detecting interfaces in
concrete. In Figure 39, a pulse-echo measurement is shown wherv ,an impc ( ,,:a
made directly on concrete, remote from the stepl plate. The f9..A iKa
approximately 100 isec, The rise time is 0. obviouslv too slow for w:;,1<i "ran
accurate thickness measuremlent .t Howeve r, the measu"remnt itu'; 1P 4 isfa rv
over a longer penet:rat ion depth.

Figure 37. PZT piezoelectric element bonded to end of7-ft steel rod used to make pulse-echo measurementson concrete slab. Analogous to function of a
Hopkinson Bar
0.2 |
0.-
vi
vl0 . ... .. A : . . .. . . .. . ... .
-0.
0 100 2il 0 -. 40 5
-- . .0---
""4-I .._i +44 i +4-" 1--* -0.1 " _ _ -
-0.2------------------I0 100 200 300 400 500
TIME, pgsec
Figure 38. Echoes from concrete slab de-tected with PZT-steel rod transducer.Impact made on steel plate bonded to
concrete surface
56

0.4-
b0. 3 -
00.2 i
0 "0 100 200
TIME, psec
Figure 39. Echoes from concrete slab de-tected with PZT-steel rod transducer.Impact made directly on concrete surface
PZT-Steel Rod Transducer and Shot Pellet (BB) Pistol
65. At this point, measurements of the reflected impact pulse showed
that it lacked the necessary rise time and sensitivity for the accuracy needed
in pulse-echo measurements in concrete for thin sections. Too much of the
energy was in the sonic range rather than the ultrasonic range. In other
words, a much shorter load-pulse was needed with higher intensity. An air
pistol that shot standard commercial pellets was obtained. The small
projectiles were fired onto a steel plate epoxied to the surface of the
concrete. Successful measurements were made on a 3-in.-thick slab using the
steel rod transducer. However, even though the impact pulse was about 2 0-ýisec
wide, the measurements lacked sufficient accuracy. Since the first dip in the
frequency spectrum would occur at 75 kHz, as explained in Part I, the main
energy would lie below that value. Steel balls, which are much harder than
the air gun pellets, might yield shorter load pulses. This was not tested.
57

PZT Aluminum Rod Transducer
66. Another rod transducer was built, this time, from aluminum. It
also consisted of a PZT element resonant at 1.2 MHz, before damping. The
acoustic impedance of aluminum is closer to concrete than steel, and it was
hoped this might improve measurements. Also, the rod was only about 3 ft long
as compared with the steel rod of 7 ft. No significant improvement was noted.
James V-meter Transducer and Lead Backing
67. A mosaic of PZT elements taken from a James Electronic's transducer
resonant at 54 kHz, shown in Figure 40, was uscd with a backing of epoxy mixed
with lead powder. The transducer was 20 in. long and weighed 35 lb. The idea
was to terminate the back side of the crystal in its own characteristic
impedance with the backing sufficiently long and sufficiently attenuative to
totally prevent reflections. This would allow the transducer to be shorter in
length than the rod transducers and field-worthy. Here, the idea was to match
the backing with the PZT in its acoustic impedance so that the transmission
Figure 40. PZT mosaic transducer with opoxy/lead backing
58
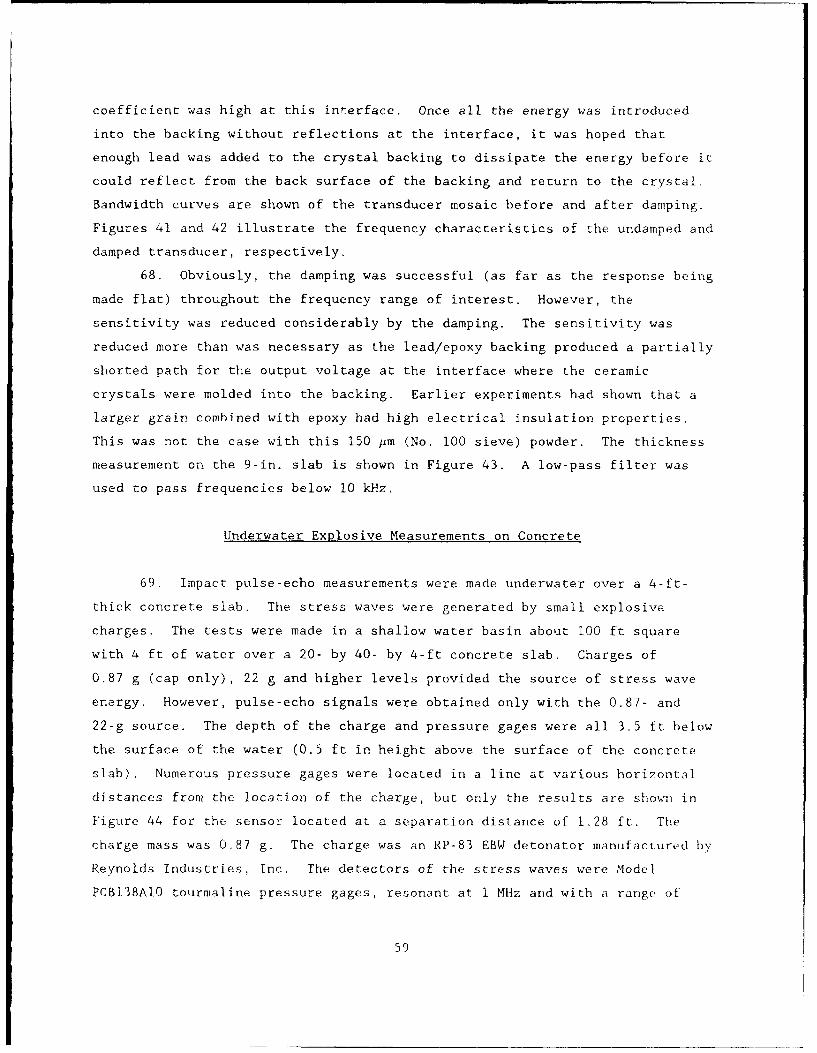
coefficient was high at this interface. Once all the energy was introduced
into the backing without reflections at the interface, it was hoped that
enough lead was added to the crystal backing to dissipate the energy before it
could reflect from the back surface of the backing and return to the crystal.
Bandwidth curves are shown of the transducer mosaic before and after damping.
Figures 41 and 42 illustrate the frequency characteristics of the undamped and
damped transducer, respectively.
68. Obviously, the damping was successful (as far as the response being
made flat) throughout the frequency range of interest. However, the
sensitivity was reduced considerably by the damping. The sensitivity was
reduced more than was necessary as the lead/epoxy backing produced a partially
shorted path for the output voltage at the interface where the ceramic
crystals were molded into the backing. Earlier experiments had shown that a
larger grain combined with epoxy had high electrical insulation properties.
This was not the case with this 150 ym (No, 100 sieve) powder. The thickness
measurement on the 9-in. slab is shown in Figure 43. A low-pass filter was
used to pass frequencies below 10 kHz.
Underwater Explosive Measurements on Concrete
69. Impact pulse-echo measurements were made underwater over a 4-ft-
thick concrete slab. The stress waves were generated by small explosive
charges. The tests were made in a shallow water basin about 100 ft square
with 4 ft of water over a 20- by 40- by 4-ft concrete slab. Charges of
0.87 g (cap only), 22 g and higher levels provided the source of stress wave
energy. However, pulse-echo signals were obtained only with the 0.87- and
22-g source. The depth of the charge and pressure gages were all 3.5 ft below
the surface of the water (0.5 ft in height above the surface of the concrete
slab). Numerous pressure gages were located in a line at various horizontal
distances from the location of the charge, but only the results are shown in
Figure 44 for the sensor located at a separation distance of 1.28 ft. The
charge mass was 0.87 g. The charge was an RP-83 EBW detonator manufactured by
Reynolds Industries, Inc. The detectors of the stress waves were Model
PCB138AIO tourmaline pressure gages, resonant at 1 MHz and with a range of
59

0.2 - -
L 0.1
LU 00
-0.1
0 50 100FREQUENCY, kHz
Figure 41. Bandwidth of a PZT mosaic
transducer, undamped
0.2
( 0.1
0
-0.20 50 100
FREQUENCY, kHz
Figure 42. Bandwidth of a PZT mosaictransducer, damped
60

0.4
LO 0.3
0 .. .. . '/
>-- i- H-H 4-+ 4IH4T T
H-
0--0 100 200
TIME,/ sec
Figure 43. Thickness measurement on 9-in.-thick concrete slab with PZT epoxy/lead-
backed transducer
2500 "
2000.
4-H
.1500
1i 1000C-
U)W 500Q.
0
-500 , ! I I I I I ,
0.0 0.20 0.40 0.60 0.80 1.0
Time of Arrival - milliseconds
Figure 44. A longitudinal echo reiflee ted from base oI -1 4-t -
thick slab having a TOA of 0.74 rset. ThV stress wave eneywas created by an impact from a 0.8/-;g chlarge exploding,
underwater 0.5 ft above theC coi,'-rete
r

10,000 psi, manufactured by PCB Piezotronics. Operation of the gage occurred
in the broadband portion of the frequency response curve below resonanc,-
70. Numerous arrivals of waves can be seen from Figure 44, a typical
TOA plot. The wave with the sharpest front and highest amplitude is the
longitudinal direct wave arriving at 0.24 msec. The expected arrival time was
calculated to be 0.256 msec based on the separation distance of 1.28 ft
between the charge and the sensor and an approximate textbook velocity of
5,000 ft/sec for the longitudinal velocity in water.
71. Arriving just behind the direct wave is the lower-amplitude
reflected longitudinal wave from the top surface of the concrete with a TA of
about 0.31 msec. The expected TOA was calculated to be 0.325 msec based on a
calculated distance of 1.62 ft and the approximate textbook water velocity of
5,000 ft/sec. Finally, the low amplitude pulse with a TOA of 0.74 msec was
the main pulse of interest. The TOA agrees with the time required for the
pulse to travel from the explosive source to the concrete surface, refract
into the concrete, reflect from the base of the concrete slab to the top
surface of the concrete and to refract into the water to be received by the
pressure gage (Krautkramer and Krautkramer 1977). Although rays of energy are
emanating from the explosive source from many angles, there is only one
particular angle and ray path that will satisfy 7nell's law of refraction and
reflection in the water and concrete and permit detection at the receiver.
The angle of incidence from the water calculates to a value of 6.5 deg and the
angle of refraction into the concrete is 8.3 deg.
72. Only the smaller charges, the 0. 8 7 -g and 22-g charges. produced
unmistakable echoes from the base of the slab. The larger charges did not
produce visible echoes. In both cases, the data record was untreated in terms
of signal processing. The reason for the lack of echoes from rhe larger
charges is not understood but may be a result of the differenctl betwken tthe
shape of the wave front produced by the variable sizes of the charges 1n
relation to the gage location distance. The small charges will approximltn, a
better point source (and hence a better splbe,rical wave front-) tinc-e h- ra.ti.o
of the charge di arne te r to the trave l. path i s <;ma Iet" t: r : i fo r lhi I r)- •,r
di amet-er chharges.
The rat ( 0o of tlie (lI( i rab 1c phu I ;t. - c, lo ;p 1 i ui ii ] d . tk th,0
undesirahl) dixoreet wave aiilJ other noise must he improvted it -the t I'¶1ll !; 1;
62

to be used in the future for crack detection measurements in concrete.
However, due to the fact that very little progress has been made by
investigators in performing pulse-echo measurements in concrete by any means,
it is an encouraging development that echoes were detected with this method.
To the author's knowledge, there is no published report of any pulse-echo
results from the testing of concrete by the use of explosives in water or air.
It was not known a priori the longitudinal velocity of the field concrete or
whether the concrete had been damaged by the previous blasts. This test
verified the soundness of the concrete as the longitudinal velocity was
calculated to be 13,470 ft/sec. Test cylinders measured at 28 days had shown
that the average velocity was 14,000 ft/sec. However, one can never be sure
that the samples taken are clearly representative of the final field-placed
concrete. No more than a 5-percent difference in velocities for most
situations is expected. The results are within that range of variation.
Accelerometer and Rebound Hammer on Basement Floor
74. Limited tests were made on determining the thickness of a concrete
slab with an impact-resonant technique (Thornton and Alexander 1987).
Previously, resonant-frequency measurements had been made in the time domain
using continuous waves (Muenow 1963). However, these later impact tests
involved analysis in the frequency domain. The received signal was displayed
on a frequency analyzer. In this test the longitudinal resonance in the
thickness direction was detected with a broadband pickup, i.e. a pickup that
was broadband in the frequency range of the particular resonance of interest.
Figure 45 shows a resonance at 4,200 Hz. The concrete slab tested was 1.5 ft
thick and was backed by soil. The energy was introduced with a Schmidt
rebound hammer, and the reverberations were detected with an accelerometer.
The equation describing the relationship is
v = 2fl (12)
where
v = concrete velocity, feet/second
t = frequency of resonance, hertz
I = thickness, feet
63
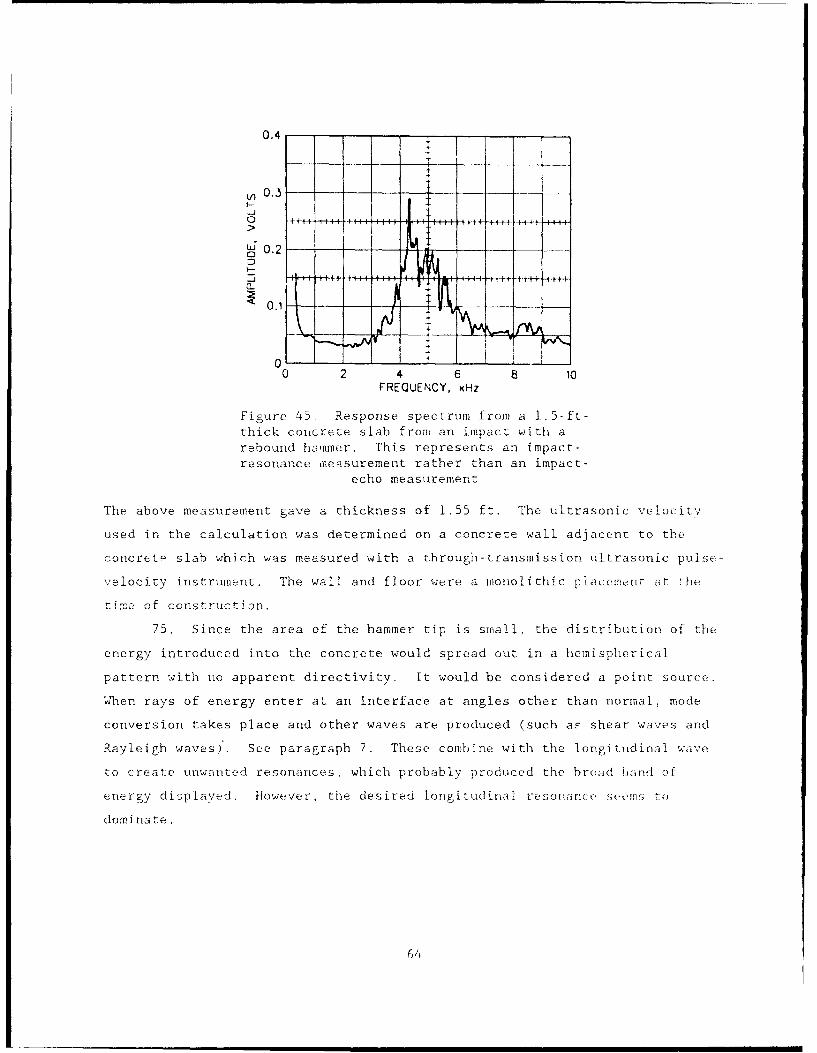
0.4 -..
(n 0.3 - 7 7 I0 0.24 6 - 1
0
0.1- -_
0 2 4 6 8 10FREQUENCY, kHz
Figure 45. Response spectrum from a 1.5-ft-thick concrete slab from an impact with arebound hammer, This represents an impact-resonance easurement rather than an impact-
echo measurement
The above measurement gave a thickness of 1.55 ft. The ultrasonic velocitv
used in the calculation was determined on a concrete wall adjacent to the
concreto slab which was measured with a through-transmission ultrasonic pulse-
velocity instrument. The wall and floor were a monolithic placement at ithe
time of construction.
75. Since the area of the hammer tip is small, the distribution of the
energy introduced into the concrete would spread out in a hemispherical
pattern with no apparent directivity. It would be considered a point source.
When rays of energy enter at an interface at angles other than normal, mode
conversion takes place and other waves are produced (such aF shear waves and
Rayleigh waves). See paragraph 7. These combine with the longitudinal wave
co create unwanted resonances, which probably produced the broiud bnd of
energy displayed. However, the desired longi tud inal resoiiarirc s(,ems to
dominate.
(6 4

PA~ '' .' BOYA^TOFPY 7WOFi 0"' H ISONA%'; TP: S LA' :!I,
Cons1~ i dt-ra t i 010;
At-V ýhe b,1jnli.tiii of this rn.-Sc:%iuI !opa!. L i!
d~np a i::o~ LAcii LA so as t.o produc', oi fveqk, cv r
,,ss unifurir' (f lat~) (Thorntoirl and Ale::aride w 1' i
,: as p elm i s blIo fr tly',,he I ra n sduc e.r t~o rin i Lýfora t.- v
i-_spouse curv, would have. a peak) wi cl-outý obsui ni 7 tho arci~i
ý1f he exxcess * iv-ri ng ing i n the t ransduc ers th I'; rtJ-pors 1)
zhe lirrivai of eioc s. Somne ringiurF Is in; or dot e I-easit.
a rge fraic ti oo nolf t I w his i trorp, d s c o Iti'.
.1 a rs duc or to ;t cop beftore a st-c orid k.cho frcom inoh)vier' :1
IhE cco cdedI The sol u tion is to redc ciOlte mc- chantic~l c , ftk
"w:i choutl kexces~sivols' Sacrif ic irig its seris itt lvi yt
77 The idoea of us ring a re sonriat u 1n tIa n1 e. IW r aietar
Ooreon u~ ,n a thfe-n con1siderled, The great~est- sensi tivi"% A; C, t 1;-
c,1
in "efn ex:i st ',s a- t he1 r(.so)ii -,fr.tI-qui-ucy. Ti ng1 n ffin !!(( (11 , .V
i3thle 2 i Si -nc' Src ýi1 lin i coof'
'4atCd toý I *u," them hi Flier 0f. I~w i ý1:'' lt ii i
C) rh d; tý cl o(1 ux c: - i1 1 p d w (t1) rp tn Ii t I c i'' 'T ' iW Ull I t105ýt', C il
c ()irltoe Ir" . lt_ (co zId h e fi E t reod o uir of th c., l~i c, c) Si n ~ r 1) oi sr ItO sI
cý111 p tar- :Ic pilrposes;. 1-irious u ciir m;ipod Crafilý,ucc- wer iW iQ tI
linost_ sc:1! t~hk resorianck wals 50 low" i ýmlpill I i ~ I l~ot
see ii the p c soin of te Io r- f i f- .1 COIa''.1 c: 'po~i (
us i io a p -v ; f ii I f. f I ......' ~ 1;
1j l 1 1

DIGITAL OSCILLOSCOPE
AMPLIFIER/FiLTER
STEEL BALL BEARING II mHz HIGH PASS FILTER
2.25 mHz TRANSDUCER
6" HIGH STEEL BLOCK
Figure 46. Measurement setup for making an ultra-sonic pulse-echo measurement on a 6-in. high metalblock with stress wave generation by impact fromdropping a steel b~ll from a height of about 1 ft
verified this. A small 3/16-in.-diam steel ball was dropped from a height of
10 or 12 in. on a 6-in.-high steel block. (The smaller the diameter of the
steel ball, the greater the production of higher-frequency energy). Steel was
used to indicate the presence of high-frequency energy from an impact, since
it is a better physical model than concrete. Even with the steel having a
much smaller grain size with very low attenuation properties compared with
concrete, the detection of the low level 2.25-MHz signal was pushing the
limits of the capability of our electronics. The transducer has a Q of about
5 arid was resonant: at 2.25 MHz. It was .- /50 in. ini diameter, a Gamma serii-s
Model D25907, manufactured by K. B. Aerotech, Inc.
79. An impact generates various modes of enerSy including longitudinal.
transverse, and surface waves. Also, since the impact occurs over a small
area, 1/2 in. in diameter (rebound hammer), it would be considered a point
source for the frequencies below 100 kHz. Since the energy from a point
source has a wide angle of divergence, varioots; mode s and iwa ot e(1d waves Art,
created, Becalsf-e of. tire Iflany modes of vibrat.iol ana d the -,'ari otls tilt- rasopnir
waves creat•e(d e isp cial I y at Iow frequencis; i t is itwces;-ary (o pT-Eoviht- Iri,;h.-
pass filtering to eliminrate the lower- frequency wavis.
66
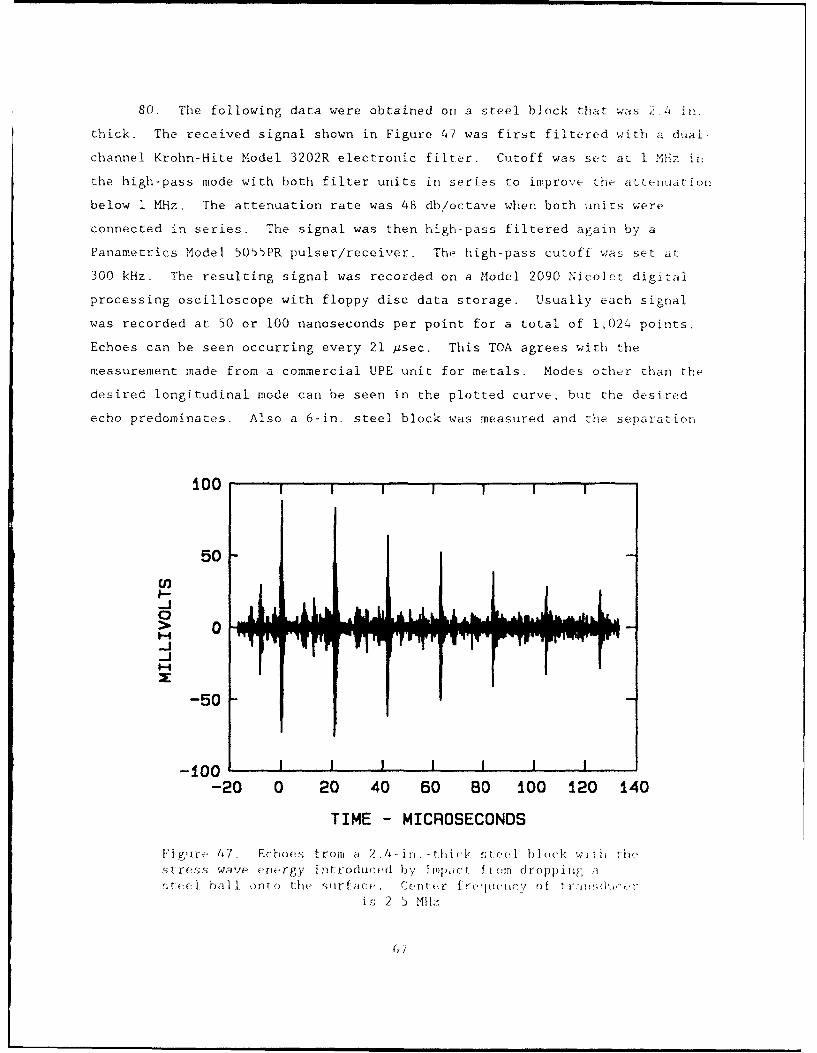
80. The following data were obtained on a steel block that was 2Z4 in.
thick. The received signal shown in Figure 47 was first filtered with a dual-
channel Krohn-Hite Model 3202R electronic filter. Cutoff was set at I MHz in
the high-pass mode with both filter units in series to improve the atltelllationl
below 1 MHz. The attenuation rate was 48 db/octave when both units were
connected in series. The signal was then high-pass filtered again by a
Panametrics Model 5055PR pulser/receiver. The high-pass cutoff was set at
300 kHz. The resulting signal was recorded on a Model 2090 Nicolet digital
processing oscilloscope with floppy disc data storage. Usually each signal
was recorded at 50 or 100 nanoseconds per point for a total of 1,024 points.
Echoes can be seen occurring every 21 jisec. This TOA agrees with the
measurement made from a commercial UPE unit for metals. Modes other than the
desired longitudinal mode can be seen in the plotted curve, but the desired
echo predominates. Also a 6-in. steel block was measured and the separation
100 I
50> 0U,
-50
-100 I ! I I I I I
-20 0 20 40 60 BO 100 120 140
TIME - MICROSECONDS
Fi gure 47. Echoes f rom a 2./4 - l t. bli k h ock wi h thIhestresis wave energy int.roduc ed by i ep ct fro)m droppilq i ;aýtee(- b all on; o the suirface . Cent~-er f re(hqh1.ck(V of trn~ir
is 2 5 MHz
6/

time was 51 psec for those echoes. The Panamet rics Model 301 S traiasdua>-r
resonant at about 500 kHz, was also used successfully with both nwetal pi,:-es.
81. Because of the large grain size, a transducer frequenc'; of 2_2-) "l{i
obviously produces a wavelength too short for typical concrete (less tiU,
0.1 in.). However, the test demonstrated the potential of an i.:,pact t fro:!
steel ball to produce high-frequency ultrasonic energy. The reasure:tt oni
steel help to define the type of signal processing that will be iieeded for
similar lower-frequency impact measurements on concrete. The author is not:
aware of any literature that references UPE measurements on steel b., impact.
High- Frequency Energy Transmitted through Concrete
82. A test was set up to determine if 200-kHz energy could be
transmitted through 3 ft of concrete. The lead metaniobate ( r a,,r
has its primary resonance at about 190 kHz (Figure 3). The reboutnd hama:,r % ,s
used to impact one end of the 3-ft concrete beam and the 12-1 transducer *.:a=-
used as a receiver at the opposite end. The test setup is shown in Figure, 8.
The filter from the Panametrics Model 5055PR pulser/receiver was use to hig'h-
pass the energy above 100 Khz. A Wavetek Model 446B spectrum analyzer ,-;as
used to measure the frequencies of the transmitted energy. Energy was
transmitted that caused the 12A transducer to resonate at 190 kin (Figure ."a
Rebound Hammer and Lithium Sulfate Receiver
83. In Figure 50 a measurement setup is shown for makinig an UPF
measurement on a 6-in.-thick concrete slab. The energy was introduced into
the concrete with a rebound hammer and the echoes received by a damped
Ii t a, il - 1fate re(;ceivyer custom-built by Automation Sperry Comrpmn", Thb)
transdu(.100r was resonant at 100 ktz with a 0 of 3. An electc-o(ilc ducl-Oii it
fiLter Model ý'202P by Krohil-Ili.te was ul( d to harit)a-s eImri'-' rat. O)ris .-;I
100 kltz. I'oth 11 its we::re connected i.nj ,(-I Tla* I wtý I toft fI- C1,1, 93 f.
-ct at P( kll/z, and the upper cutoff freque, ntcy wil!, ct, i 15(0 k II::. .-
Can ho ee inl Vigure 1 The echloes5 are !iua I'' o o. (I lot I HO 11Hc" ,iI
wh, i ch i's t he correcnt two - way ravel t i.•e for thV loneit tl l l), ili, pi 1' T!
10 loc(1t ii this iorlcrer ( i S coT;: ih•re d low 10 t 0 (100) ft/;,

REBOUNDHAMMER
4
CONCRETEBEAM't
a 31
v HIGHPASS DIGITAL SPECTRUM1 ACTIVE OSCILLOSCOPE ANALYZER
FILTER
100KHzLEAD -
METANIOBATETRANSDUCER
Figure 48. Measurement setup for detecting frequency ofenergy with lead-metaniobate transducer through 3 ft of
concrete from impact with a rebound hammer
r-.
0.2
22 if
Ln•
0 40 80 120 160 200FREQUENCY, kHz
long concre:te• bo.,om. .•Oric r4 I 0 pas';.od, 191) 1<11::e•nergy. Eli;rgy has5 le(•n at ttll~lat.((i b0,low
100 k~lz by el]ect r ical. filte•rin~g
>~ (D
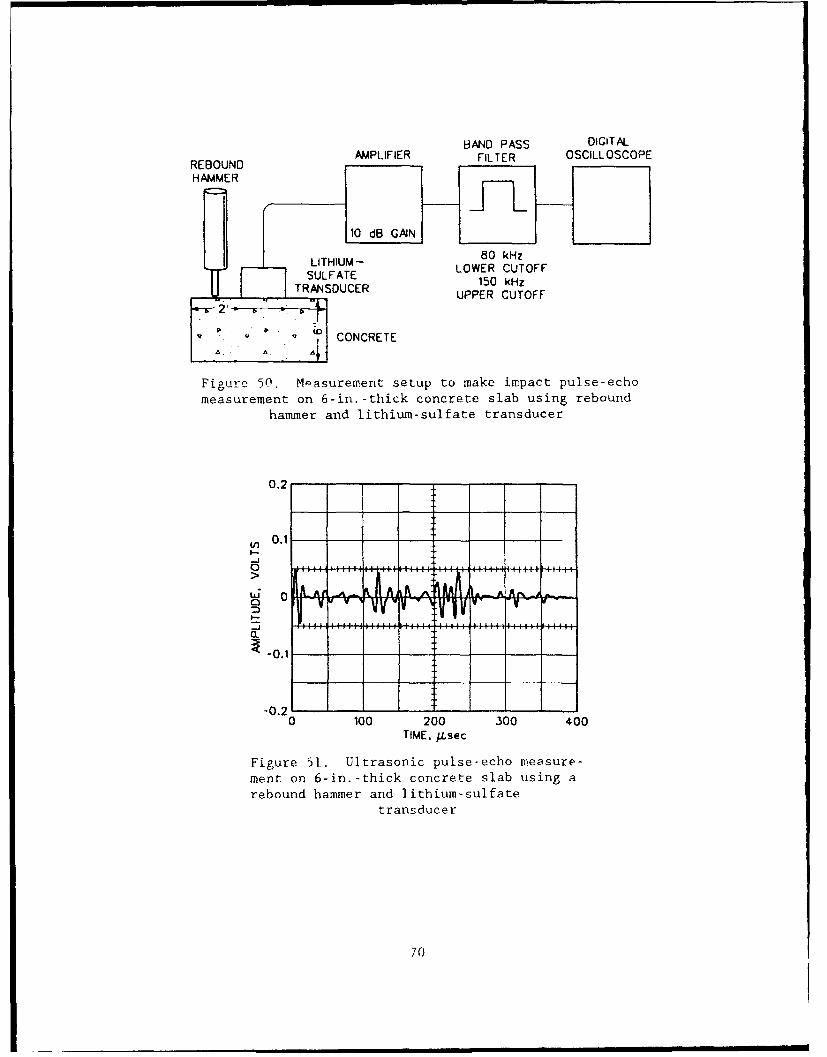
BAND PASS DIGITAL
REBOUND AMPLIFIER FILTER OSCILLOSCOPEHAMMER
LITHIUM - 80 kHz
LOWER CUTOFF
TRANSDUCER 150 kHzUPPER CUTOFF
CONCRETE
Figure 50. Measurement setup to make impact pulse-echo
measurement on 6-in.-thick concrete slab using reboundhammer and lithium-sulfate transducer
0.2
(n 0.1
......~ .. .. .... ..
-0.1
-0.2 -0 100 200 300 400
TIME, j.Lsec
Figure 51. Ultrasonic pulse-echo measure-
ment on 6-in.-thick concrete slab using arebound hammer and lithium-sulfate
transducer
70

PZT-C5500 Transducer and Rebound Hiaimimer
84. A number of PZT-C5500 ceramic elements were purchased for tI~e
purpose of attempting to detect echoes in concrete from impact measuremtt.
The elements were 1/4 in. in diameter and 1/4 in. in length. The undamped
natural frequency was about 200 kHz. The bandwidth measurement is shown in
Figure 52. A 2-in. backing of tungsten-loaded epoxy was used to damp the PZT
element. The tungsten has a high acoustic impedance and closely matches that
of the PZT. A 1/4-in.-long faceplate of aluminum was installed on the front
face of the crystal. The transducer is shown in the lower left-hand corner of
Figure 53. A small wire was soldered to the silver electrodes on the back
side, and a thin foil of brass was cemented with silver epoxy between the
aluminum face plate and front electrode of the crystal. The ground end was
tied to this foil. The bandwidth measurements of the damped ceramic are shown
in Figure 54. The main resonance has been reduced to 180 kHz and various
extraneous modes of vibration are present due to the high mode-conversion
properties of PZT.
85. Again, UPE measurements were made on the 9-in.-thick slab using the
Model L-6 Schmidt hammer directly on the concrete (Figure 55). Disregarding
the first pulse (beginning of oscilloscope trace does not coincide with
beginning of impact), each succeeding pulse is roughly 100 psec apart. (The
velocity in this concrete is high at appro:.imately 15,400 ft/sec) However,
the response from a second impact would not always duplicate the previous one.
Results were somewhat confusing but hopefully future investigation should
reveal the source of confusion. It appears that surface waves are not that
serious a problem even though, according to diffraction theory, there is no
directivity in the beam profile created from a small-area impact.
86. Figure 56 shows the measurement setup used to make an UPE
measurement on the 3-ft-long concrete beam. The rebound hammer was 1used to
introduce the stress wave energy into the concrete, and the small. diameter
PZT-C5500 transducer was used to detect the echoes. A voltage divider was
used to reduce the high impact-voltage so that it would not, paralvz(e the iliput
amplifier of the Panametrics Model 5055PR pulser-amplT ifier-[1 1 The hiigi-
pass filter was set to a cutoff frequency of 300 kflz, and the tollowiing Krohn -
Hite Model 3202R active high-pass filter was set to a cutoff frequel•cy of
71)
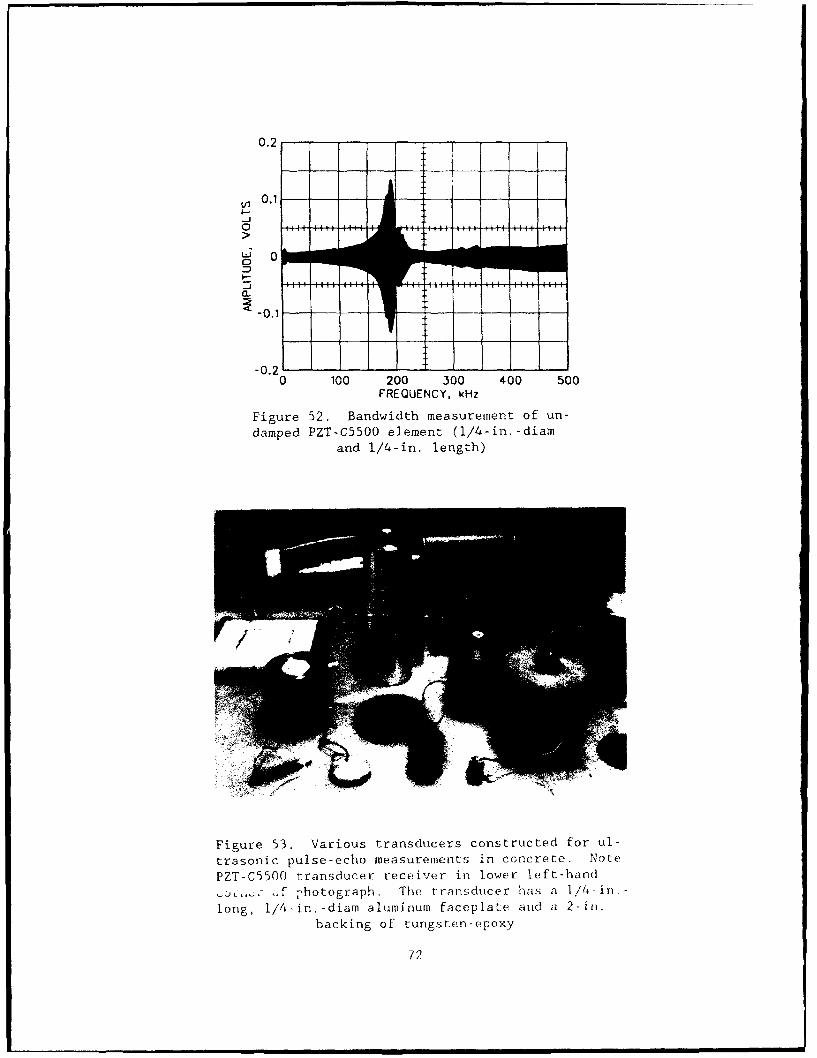
0.2--
S0.1
-j
-0 .
-0.-
0 100 200 300 400 500FREQUENCY. kHz
Figure 52. Bandwidth measurement of un-damped PZT-C5500 element (1/4-in. -diarn
and 1/4-in, length)
Figure 53. Various transducers constructed for ul-
trasonic pulse-echo measurements in concrete. Note
PZT-C5500 transducer receiver in lower left-hand-f hotograph. The t ransduicer has a 1/14 - i n,
long, 1/4-in. -diam aluminum faceplate and a 2-in.
backing of tungsten-epoxy
72
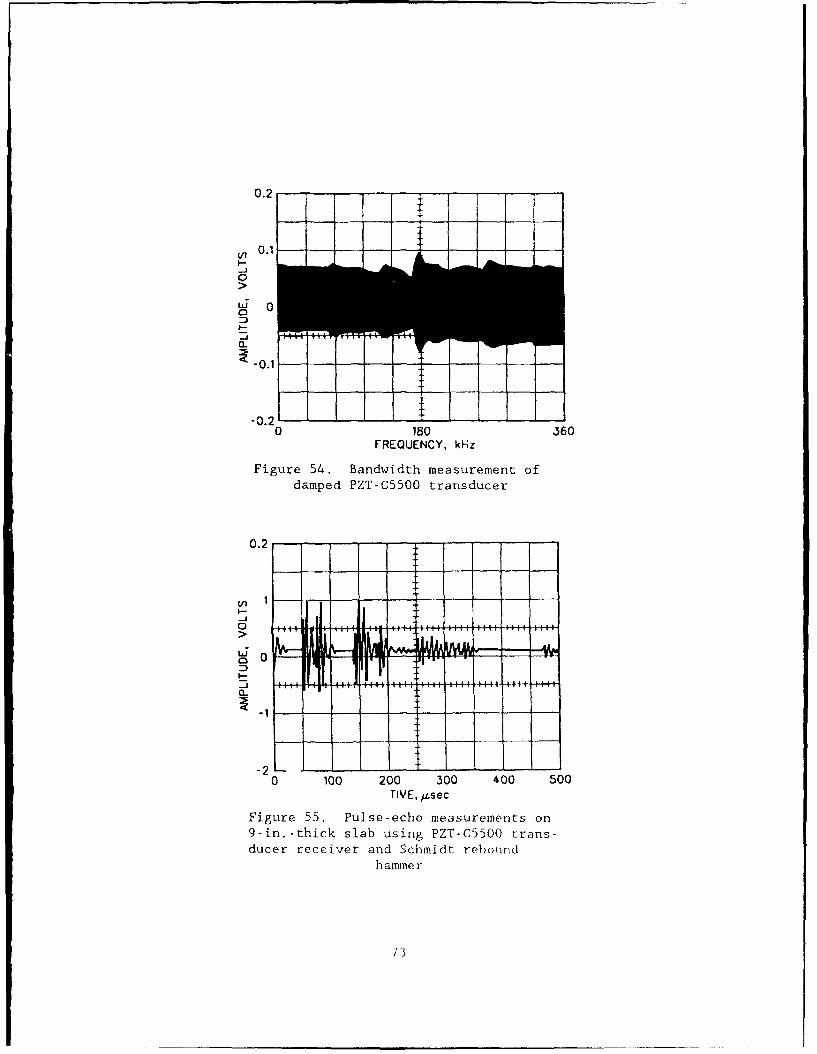
0.2
0 .1I-
0
Lzj 0a_
0
I-
-0.1
-0.20 180 360
FREQUENCY, khz
Figure 54. Bandwidth measurement ofdamped PZT-C5500 transducer
0.2
V,
-,-
-' .... ... ........ .... ....
0
-20 100 200 300 400 500
TIME. gsec
Figure 55. Pulse-echo measurements on9-in.-thick slab using PZT-C5500 trans-ducer receiver and Schmidt rebound
haminer
73

REBOUND HIGHPASS HIGHPASS DIGITALHAMMER ATTENUATOR ACTIVE ACTIVE OSCILLOSCOPE
FILTER/AMPLIFIER FILTER
b0 m
4
I CONCRETEBEAM
43
S6"-+
Figure, 56. Measurement setup to make ultrasonic pulse-echo measurement on 3-ft-long concrete beam from impactwith rebound hammer. Detection is with PZT-C5500
transducer. Frequeacies below 500 kHz were hi 6 hlyattenuated by electrical filtering
500 kHz. The resulting signal was recorded on a Nicolet Model 2090 digital
oscilloscope. The filtering attenuated the low-frequency sonic and ultrasonic
energy considerably and permitted the higher frequency ultrasonic energy to
dominate. As can be seen in Figure 57, echoes were received with separation
times of approximately 500 psec which, incidentally, is the correct two-way
travel time in the 3-ft-long concrete beam for a longitudinal pulse. This
funding is significant in that such high-frequency energy would not be
expected to be transmitted through the highly attenuative concrete. The
frequency of the pulses is centered around 750 kHz. Significant scattering,
of course, occurred from the coarse aggregate as one would expect for that
short a wavelength (= 0.2 in).
87. Finally, in Figure 58 sonic echoes are shown resulting from an
impact of the rebound hammer on one end of the 3-ft-long beam. The echoes
were detected by the small PZT-C5500 transducer with operation occurring in
the low-frequency broadband part of the frequency response curve without
filtering. Every other echo is the correct echo time of 500 ysec. The impact
pulse width from the rebound hammer is about 120 jusec.
74
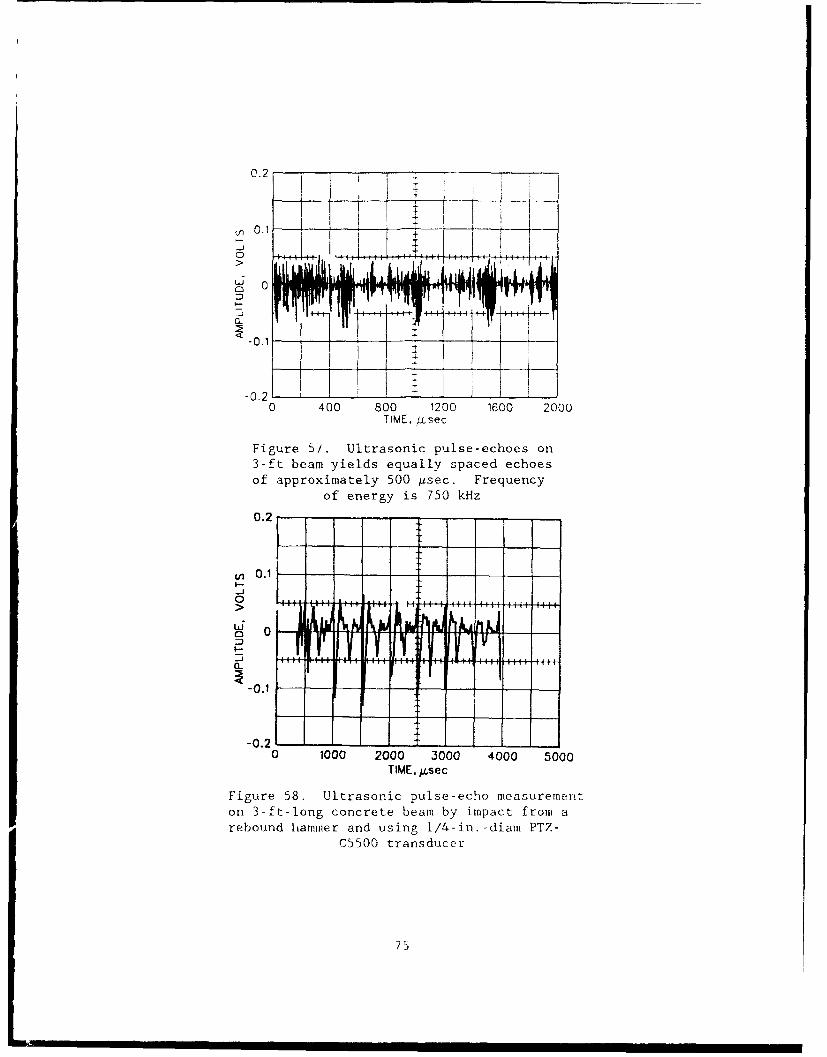
C.2
~,0.1>*
_0.
-0.20 400 800 1200 1600 2000
TIME, /isec
Figure 51. Ultrasonic pulse-echoes on3-ft beam yields equally spaced echoesof approximately 500 .tsec. Frequency
of energy is 750 kHz
0.2 - ,
V) 0.1 - -- - - - _
0 400 H-0 120H 1600+ 20H 0
0 ,2 ........
-0.
-0.1----------------- -
-0.20 1000 2000 3000 4000 5000
TIME. jLsec
Figure 58. Ultrasonic pulse-echo measurementon 3-ft-long concrete beam by impact from arebound hammer and using l/4-in.-diam PTZ-
C5500 transducer
75

PART VI: CONCLUSIONS
88. It is presently possible to make ultrasonic through-transmission
measurements on hardened concrete. This can be accomplished through disuinces
of about 25 ft using undamped transducers operating around 50 kHz with
commercially available equipment. Intuitively one would suspect that UPE
measurements could at least be made over a number of feet, even though the
wideband transducers required for UPE measurements are not as sensitive as the
narrowband transducers used in through-transmission measurements. So far,
there does not exist in the literature any measurement data on the important
property of concrete wave attenuation. This missing information makes it
difficult to predict the potential penetrating power of an UPE system. The
present use of impacts for crack-detection measurements is almost limited to
listening by ear to the sounds emanating from sound and deteriorated concrete.
(However, impact resonant-frequency measurements using a transducer receiver
are common.) The results are highly subjective and are not useful above the
range of hearing, the sonic range.
89. A number of sources of impact devices were tested in this
investigation. Showing potential as app-:opriate sources of UPE energy for
concrete structures are: steel balls shot from a compressed air gun, Schmidt
rebound hammer, and small explosives. The pulse duration from a BB impact is
around 10-20 Asec, which, fortunately, generates the highest energy in the
range of frequencies optimum for concrete. The primary energy appears to be
somewhat less than 100 kHz in frequency, although energy at harmonic
frequencies would be higher. Also, the force level should be high enough to
permit penetration depths of, possibly, tens of feet into concrete. When
dropping large steel balls having diameters of 3/8 to 1/2 in., this is an
excellent source of energy for performing resonant-frequency measurements
mainly in the sonic range to just within the ultrasonic range. For smaller
steel balls, 1/8 in. in diameter or less and shot from a compressed-air gun,
this is a potential source of higher-frequency ultrasonic energy for making
impact pulse-echo measurements in concrete.
90. The Schmidt hammer has a wide pulse-duration of about 70 ;isec.
This would appear at first thought to limit the generation of Stress wavo
energy in the ultrasonic frequency range based on the large pillse width, but
76
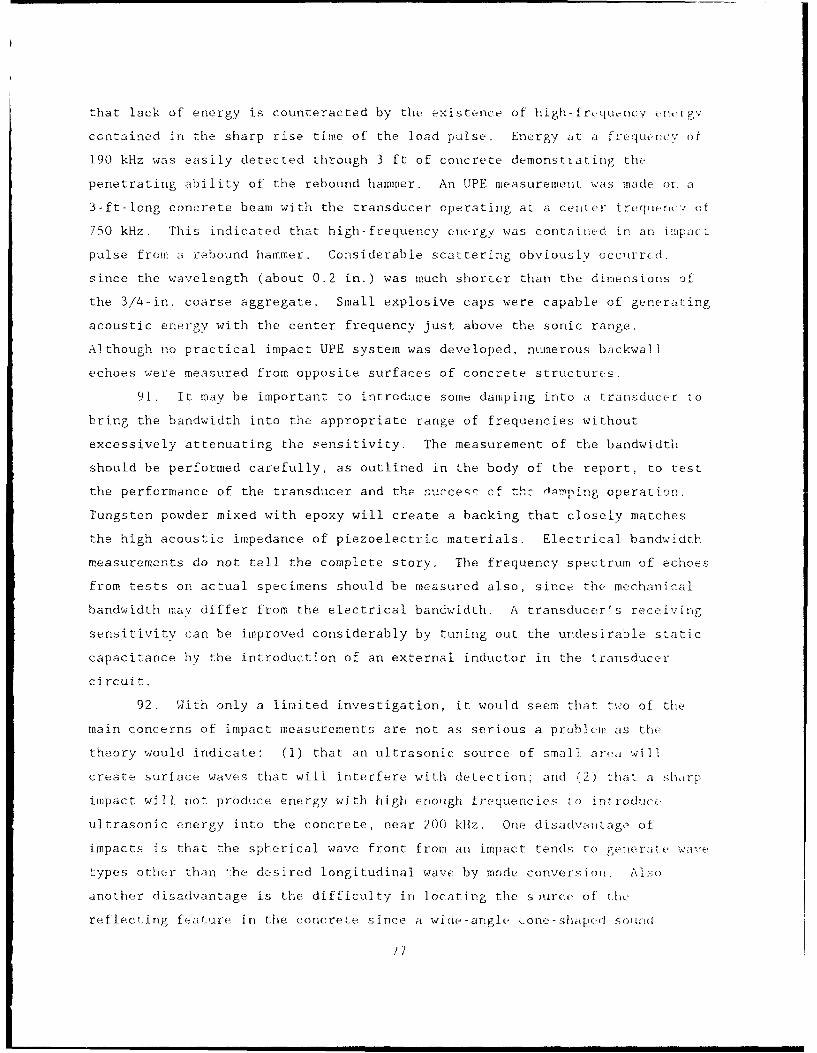
that lack of energy is counteracted by the existence of high-frequency •,rgv
contained in the sharp rise time of the load pulse. Energy at a frequency of
190 kHz was easil.y detected through 3 ft of concrete demonstrating the
penetrating ability of the rebound hammer. An UPE measurement was made or. a
3-ft-long concrete beam with the transducer operating at a cenlter frequency; of
750 kHz. This indicated that high-frequency energy was contaitied in an imipac-
pulse from a rebound hammer. Considerable scattering obviously occurred.
since the wavelength (about 0.2 in.) was much shorter than the dimensions of
the 3/4-in. coarse aggregate. Small explosive caps were capable of generat~ing
acoustic energy with the center frequency just above the sonic range.
Although no practical impact UPE system was developed, numerous backwali
echoes were measured from opposite surfaces of concrete structureýs.
91. It may be important to introduce some damping into a transducer to
bring the bandwidth into the appropriate range of frequencies without
excessively attenuating the sensitivity. The measurement of the bandwidth
should be performed carefully, as outlined in the body of the report, to test
the performance of the transducer and thr nurceý cf thr- dpmping operation.
Tungsten powder mixed with epoxy will create a backing that closely matches
the high acoustic impedance of piezoelectric materials. Electrical bandwidth
measurements do not tell the complete story. The frequency spectrum of echoes
from tests on actual specimens should be measured also, since the mechanical
bandwidth may differ from the electrical bandwidth. A transducer's receiving
sensitivity can be improved considerably by tuning out the undesirable static
capacitance by the introduction of an external inductor in the transducer
circuit.
92. With only a linited investigation, it would seem that two of the
main concerns of impact measurements are not as serious a problem as the
theory would indicate: (1) that an ultrasonic source of small area will
create surface waves that will interfere with detection; and U2) that a sharp
impact will not produce energy with high enough frequencies to inttroduce
ultrasonic energy into the concrete, near 200 kHz. One disadvantýage of
impacts is that the spherical wave front from an impact tends to gen.e rate wave
types other thin Jhe desired longitudinal wave by mode conversion. A .so
another disadvantage is the difficulty in locating the s- urce of thl.
reflecting fe ature in the concretre since a wi de-angle Q-one-shi pod soun(l
17

pattern will transmit (and reflect) energy over a large voluse umderne-th Tht
hammer. If the source produced a small-angle cone-shaped pattern, all
reflecting features could be easily located; they would be directly undler tthe
hammer. An impact hammer with a short contact time will generate ultrasonoic
energy (> 20,000 Hz) as well as even higher amplitude sonic energy
(< 20,000 Hz).
93. The response from a piezoelectric receiving element due to an
impact made on a concrete plate might have a dynamic range as high as 80 db
(100,000 times) or greater separating the amplitude level of the sonic
frequencies from the ultrasonic frequencies. Most electronic amplifiers,
oscilloscopes, and filters will not respond over such a large range. It is
then necessary to perform high-pass filtering to recover the low-level
amplitude high-frequency components from the high-level amplitude
low-frequency components. It is not recommended that resistive networks be
used to attenuate the signal because all frequencies will be affected equally.
Active filters cannot be used in the front-end stage because the operational
amplifier would be paralyzed by the high-voltage output from the transducer.
Passive filters which consist of passive components such as resistors,
capacitors, and inductors do not saturate and breakdown due to high signal
levels and, therefore, should be used. Because of the large dynamic range, it
will be necessary to have at least a rolioff attenuation of about 24 db/octave
and a larger rolloff may be necessary. A one-pole filter yields only a
rolloff of 6 db/octave.
94. Specific details are given in this report on model numbers and
manufacturers of equipment so that interested parties can easily continue this
research. It is believed that significant gains will be made in this research
when some sophisticated DSP techniques are applied to the problem. The
surface has only been scratched in applying DSP to this prohlcm ald that
appears to be the key for bringing out the desired hidden information.
78

PART VII: RECOMMENDATIONS
95. The investigation showed promise that an impact-echo system could
be developed to operate in the ultrasonic frequency range. It is recommended
that the research be continued under the Repair, Evaluation, Maintenance, and
Rehabilitation (REMR) II Research Program to develop an impact UPE system that
will hopefully penetrate tens of feet into large Corps of Engineers structures
such as locks and dams. The following steps are recommended as one approach
to UPE development by impact.
a. A large concrete structure (physical model having a thicknessof tens of feet with large lateral dimensions to reducereflections from the sides of the structure) should be found orbuilt to use for testing. The first model should contain nosteel or foreign objects to interfere with the signals.
b. A variety of impact hammers should be tested having short pulsedurations with high-force levels. The rebound hammer should bemodified to obtain a variety of signal characteristics from theload-pulse. A BB gun should be tested for firing high-velocitysteel projectiles.
c. Various undamped transducers should be tested at the differentharmonics of the fundamental and slightly damped withtungsten/epoxy, if necessary. Bandwidth curves should bemeasured to determine the effect of the damping.
d. The total signal should be captured, if possible, withoutprefiltering until the signals can be treated using a suitablesignal processing software package. A waveform recorder shouldbe used that can store as many bits as possible but not lessthan 16 bits due to the large dynamic range of signals andnoise. It may be necessary to find signals that are 80 to100 db below the level of the noise.
g. An automatic processing system should be developed that cansearch for weak but definite echoes in the complicated signals.The system should be capable of automatically adjusting to setthe correct center frequency, bandwidth, and amplification fordisplay.
.f. The automatic filter system should be installed into a real-time DSP chip that will permit instant results in the field.
79
REFERENCES
American Society for Testing and Materials. 1992. "Standard Practice for
Measuring Delaminations in Concrete Bridge Decks by Sounding (D 4580),"1987 Annual Book of ASTM Standards, Vol 04.03, Philadelphia, PA.
_ 1992. "Standard Test Method for Rebound Number of HardenedConcrete (C 805)," 1992 Annual Book of ASTM Standards, Vol 04.02,Philadelphia, PA.
Alexander, A. Michel. 1980 (Apr). "Development of Procedures forNondestructive Testing of Concrete Structures; Report 2, Feasibility of SonicPulse-Echo Technique," Miscellaneous Paper C-77-11, US Army Engineer WaterwaysExperiment Station, Vicksburg, MS.
1981 (Nov). "Development of Procedures for NondestructiveTesting of Concrete Structures; Report 3, Feasibility of Impact Technique forMaking Resonant Frequency Measurements," Miscellaneous Paper C-77-11, US ArmyEngineer Waterways Experiment Station, Vicksburg, MS.
_ 1991 (Oct). "Resonant-Frequency and Pulse-Echo Measurements,"International Advances in Nondestructive Testing, Volume 16, Gordon and BreachPublishers, Inc., Philadelphia, PA, pp 193-215.
Bradfield, G. 1948 (Mar). "New Electro-Acoustic Transducer Operating withShort Pulses," Electronic Engineering. Vol 20, No. 241, pp 74-78.
Cady, Walter Guyton. 1964. "Piezoelectricity," Dover Publications, Inc., NewYork, Vol I, p 335.
Canfield, Joe R., and Moore, Willard H. 1967 (Jun). "Development ofInstrument for Nondestructive Measurement of Concrete Pavement Thickness,"Research Project No. 1-9-63-61 Report No. 61-1F, Materials and Test Division,Texas Highway Department in cooperation with US Department of Transportation,Federal Highway Administration, and Bureau of Public Roads, Austin, TX.
Carlin, Benson. 1960. Ultrasonics, 2nd ed., McGraw-Hill, New York.
DeFrance, J. J. 1963. General Electronics Circuits, Holt, Rinehart andWinston, New York, p 448.
Desai, P. J., Marwadi, S. C., Wedpathak, A. V., Guha, S. K., and Nand,Krishna. .1974. "A Sonic Method for the Detection of Deep Cracks in largeStructures," Indian Concrete Journal. Vol 48.
Edo Western Corporation Brochure. "Piezoelectric Ceramics," EWC 02025-8302,
Western Division, Salt Lake City, Utah, 36 pp.
Culton Industries, Inc. 1980. "Design Notes on Piezoceramics," ICN8011,
Plezo Products Division, Fullerton, CA.
Hewlett-Packard Co. 1981 (Nov). "The Fundamentals of Signal Analysis,"Application Note 243, Palo Alto, CA, 57 pp,
Howkins, S. D, 1968. "Measurement of Pavement Thickness by Rapid andNon-destructive Methods," NCHRP - National Cooperative Highway ResearchProgram Report 52, Washington, DC.
80

Hueter, T. F., and Bolt, R. H. 1955. Sonics: Techniques for the Use of Sound
and Ultrasound in Engineering and Science, Wiley, New York.
Jones, R. 1953 (Jan). "Testing of Concrete by Ultrasonic-Pulse Technique,"Proceedings of the 32nd Annual Meeting, Highway Research Board, Washington,DC, p 260.
1962. Non-destructive Testing of Concrete, Road ResearchLaboratory, Cambridge University Press, Cambridge, Great Britain, p 47.
Kossoff, G. 1966 (Mar). "The Effects of Backings and Matching on thePerformance of Piezoelectric Ceramic Transducers," IEEE Transactions on Sonicsand Ultrasonics, Vol su-13, No. 1, pp 20-30.
Krautkramer, J., and Krautkramer, H. 1977. Ultrasonic Testing of Materials,2nd ed., Springer-Verlag, New York.
Lutsch, A. 1961 (Sep). "Solid Mixtures with Specified Impedances and HighAttenuation for Ultrasonic Waves," Journal of Acoustical Society, Vol 34,pp 131-132.
Malhotra, V. M. 1976. "Testing Hardened Concrete: Nondestructive Methods,"ACI Monograph No. 9, American Concrete Institute, Detroit, MI.
Muenow, Richard. 1963 (Sep). "A Sonic Method to Determine PavementThickness," Journal of the Portland Cement Association Research, Vol 5, No. 3,pp 8-21.
1990 (Oct). "Concrete Nondestructive Testing-Equipment andApplication," Proceedings Nondestructive Evaluation of Civil Structures andMaterials, University of Colorado, Boulder, CO.
Pender, Harold, and Mcllwain, Knox. 1950. Electrical Engineers Handbook, 4thed., pp 5-27, Wiley, New York.
Redpath, Bruce B. 1973 (May). "Seismic Refraction Exploration forEngineering Site Investigations," Technical Report E-73-4, US Army EngineerWaterways Experiment Station, Vicksburg, MS.
Sansalone, Mary, and Carino, Nicholas J. 1986 (Sep). "Impact-echo: A Methodfor Flaw Detection in Concrete Using Transient Stress Waves," NBSIR 86-3452,National Bureau of Standards, Gaithersburg, MD.
Stein, Peter K. 1964. Measurement Engineering; Vol 1. Basic Principles.Stein Engineering Services, Inc., Phoenix, AZ.
Thornton, H. T., and Alexander, A. M. 1987 (Dec). "Repair, Evaluation,Maintenance, and Rehabilitation Research Program, Development of Non-destructive Testing Systems for In Situ Evaluation of Concrete Structures,"Technical Report REMR-CS-10, US Army Engineer Waterways Experiment Station,Vicksburg, MS.
Vernitron Piezoelectric Division. 1979 (Feb). "Modern PiezoelectricCeramics," Bulletin PD-9247 and 9247-2, Bedford, OH,
Walker, D. C. B., and Lumb, R, F. 1964 (Jul), "Piezoelectric Probes forImmersion Ultrasonic Testing," Anvlied Materials Research, pp 176-183.
Washington, A. B. G. 1961. "The Design of Piezoelectric Ultrasonic Probes,"British Journal of Nondestructive Testing, Vol 3, pp 56-63.
81

REPORT DOCUMENTATION PAGE ) For. Approved0MB No. 0704-0188Pubhoic repoing burden for this c ollection of information is estimated to average I hour per response, includi the time for -u on. searching e = i data sources,gal ern and m -,ntaing the data needed, and completing and reviewing the collection of information. Send omments regarding this burden estimate o% 1 any othe aet of thiscOllection of information, including sugetions for reducing lu ti 1iurden. to Washington Headquarters Services, Directorate for information Operations and Reports. 111 JeffersonDavi Hlighway. Sukite 1204, Arltngton, VA 2,202.4302, and to the Office of Management gnd Budget. Paperwork Reduction Project (0704.0180). Washington, DC 20S0 .
1. ,AGENCY USE ONLY (Leave blank) 2. REPORT DATE 13. REPORT TYPE AND DATES COVEREDIApril 1993 Final reoort
4. TITLE AND SUBTITLE S. FUNDING NUMBERS
Impacts as a Source of Acoustic Pulse-Echo Energy for Civil WorksNondestructive Testing of Concrete Structures Research
6. AUTHOR(S) Work Unit 32638
A. Michel Alexander
7. PERFORMING ORGANIZATION NAME(S) AND ADDRESS(ES) 8. PERFORMING ORGANIZATIONREPORT NUMBER
USAE Waterways Experiment StationStructures Laboratory Technical Report3909 Halls Ferry Road REMR-CS-40Vicksburg, MS 39180-6199
9. SPONSORING/MONITORING AGENCY NAME(S) AND ADDRESS(ES) 10. SPONSORING/ MONITORINGAGENCY REPORT NUMBER
US Army Corps of EngineersWashington, DC 20314-1000
11. SUPPLEMENTARY NOTES
Available from National Technical Information Service, 5285 Port Royal Road,Springfield, VA 22161
12a. DISTRIBUTION/ AVAILABILITY STATEMENT 12b. DISTRIBUTION CODE
Approved for public release; distribution is unlimited.
13. ABSTRACT (Maximum 200 words)
The construction industry lags behind the aerospace, automotive, and otherindustries in the development of nondestructive testing systems for assessing thecondition of one of their primary building materials, concrete. A researchinvestigation was made to determine the feasibility of using impacts to createhigh-energy, high-resolution stress waves for making sonic and ultrasonic pulse-echo (UPE) measurements in concrete. No method presently exists to probe thedeep interior of large concrete structures such as locks and dams. Impacts fromair guns that shoot steel balls, the Schmidt rebound hammer, and small explosivesdemonstrate the potential for generating the appropriate kind of energy for UPEmeasurements. Measurements were made to demonstrate that the frequenciesgenerated by these types of impacts are in the proper range for making UPEmeasurements in concrete, i.e. less than 200 kitz. Also, it was demonstrated thatthe energy level from these impact sources was high, suitable for penetratinglarge distances. Various criteria are discussed in this study that have abearing on the development of a practical impact UPE system for concretestructures.14. SUBJECT TERMS 15. NUMBER OF PAGESConcrete Nondestructive testing SonicsConstruction Pulse-echo Ultrasonics 'IT PRICE CODEImpact-echo Resonant frequency t17. SECURITY CLASSIFICATION I11 SECURITY CLASSIFICATION 19. SECURITY CLASSIFICATION 20. LIMITATION OF ABSTRACT
OF REPORT OF THIS PAGE OF ABSTRACT
UNCLASSIFf~I) ID -. UNCLASSIFIEh __
NSN 7540.01.280.1100 standard fnort .19R (Rev 2 R8)Fi.U.s' i d ti aia, i is a