impact study on early education use and child …...development (seed): impact study on early...
TRANSCRIPT

Study of Early Education and Development (SEED): Impact Study on Early Education Use and Child Outcomes up to age four years Research Report
September 2018
Edward Melhuish – University of Oxford, and Birkbeck, University of London
Julian Gardiner – University of Oxford

2
Acknowledgments The authors wish to thank the families and children in the longitudinal study who gave their valuable time to contribute to the collection of the data for this report.
We would like to thank the SEED research teams at the National Centre for Social Research (NatCen), Action for Children and Frontier Economics for their contribution to the project. We are also grateful to Hannah Collyer, Max Stanford and colleagues at the Department for Education and to the SEED Advisory Board for comments and advice throughout the work.

3
Table of Contents Executive Summary 8
Introduction 8
Sample 9
Early Childhood Education & Care (ECEC) 9
Measures 10
Results 12
Conclusions 21
Chapter 1: Introduction 24
Background 24
ECEC and child development 24
Recent policy and ECEC in England 26
Study of Early Education and Development (SEED) 27
Objectives of this report 28
Chapter 2: The SEED longitudinal study: Design and methodology 30
Research objectives 30
Sample selection 30
Longitudinal study 31
ECEC use 31
Measures 33
Chapter 3: The relationship between early childhood education and care (ECEC) aged two to four and children’s cognitive and socio-emotional outcomes at age four 38
Key findings 38
Introduction 39
Methods 39
Analysis 39
4
Results 41
Chapter conclusions 60
Chapter 4: The quality of formal group ECEC and child outcomes 65
Key Findings 65
Introduction 65
Methods 65
Analysis 66
Results 68
Conclusion 69
Chapter 5: The home environment and child outcomes 71
Key findings 71
Introduction 71
Measures 71
Effects of home environment on four-year-old child outcomes 72
Comparing the effect sizes associated with ECEC use aged two to four, home environment variables and demographic variables 74
Interactions between ECEC use and the Home Learning Environment 87
Chapter conclusions 87
Chapter 6: Discussion and conclusions 90
Aims 90
Results and Discussion 90
Final conclusions 94
References 96

5
List of Tables Table 1: Summary of the statistically significant associations between children’s time in ECEC from two to four years (mean hours per week) and children’s outcomes at age four. ................................................................................................................................. 13
Table 2: Summary of associations between children’s time (hours per week) in ECEC aged two to four and children’s outcomes at age four; models with separate effects for PVI and maintained formal ECEC. ................................................................................... 16
Table 3: Summary of associations between the quality of the ECEC settings which children attended and children’s outcomes at age four. ................................................... 18
Table 4: Summary of the associations between home environment variables at ages two and three and children’s outcomes at age four. ............................................................... 20
Table 5: Mean of outcome variables, broken down by disadvantage group. ................... 40
Table 6: Numbers of children using formal group, formal individual and informal individual ECEC aged two to four. ................................................................................................... 42
Table 7: Summary of associations between children’s time (hours per week) in ECEC aged two to four and children’s outcomes at age four. .................................................... 43
Table 8: Comparison of child outcomes at age four between children with high formal group ECEC use aged two to four (more than 35 hours per week) and all other children. ......................................................................................................................................... 55
Table 9: Breakdown of sample by age at which formal group ECEC was first used and whether usage aged two to four was greater than 35 hours per week. ............................ 56
Table 10: Summary of associations between children’s time in formal individual ECEC (mean hours per week) aged two to four and children’s Emotional Symptoms at age four. ......................................................................................................................................... 57
Table 11: Summary of the associations between children’s time (hours per week) in ECEC aged two to four and children’s outcomes at age four; models with separate effects for PVI and maintained formal ECEC. .................................................................. 59
Table 12: Summary of the quality of the ECEC settings in the SEED study. ................... 66
Table 13: Summary of the associations between the quality of the ECEC settings attended and children’s outcomes at age four. ................................................................ 68
Table 14: Summary of the associations between home environment variables and children’s outcomes at age four. ...................................................................................... 72

6
List of Figures Figure 1: Association of ECEC use aged two to four and children’s Naming Vocabulary at age four. ........................................................................................................................... 47
Figure 2: Association of ECEC use aged two to four and children’s Picture Similarities score at age four. ............................................................................................................. 48
Figure 3: Association of ECEC use aged two to four and children’s SDQ Emotional Symptoms at age four. ..................................................................................................... 50
Figure 4: Association of ECEC use aged two to four and children’s SDQ Conduct Problems at age four. ...................................................................................................... 51
Figure 5: Association of ECEC use aged two to four and children’s SDQ Peer Problems at age four. ....................................................................................................................... 52
Figure 6: Association of ECEC use aged two to four and children’s SDQ Prosocial Scale at age four. ....................................................................................................................... 53
Figure 7: Association of ECEC use aged two to four and children’s Behavioural Self-regulation at age four. ...................................................................................................... 54
Figure 8: Comparing effect sizes for Naming Vocabulary in terms of formal group, formal individual and informal individual ECEC use aged two to four and home environment and demographic covariates. .................................................................................................. 75
Figure 9: Comparing effect sizes for Picture Similarities in terms of formal group, formal individual and informal individual ECEC use aged two to four and home environment and demographic covariates. .................................................................................................. 76
Figure 10: Comparing effect sizes for HTKS Score in terms of formal group, formal individual and informal individual ECEC use aged two to four and home environment and demographic covariates. .................................................................................................. 77
Figure 11: Comparing effect sizes for SDQ Total Difficulties in terms of formal group, formal individual and informal individual ECEC use aged two to four and home environment and demographic covariates. ...................................................................... 78
Figure 12: Comparing effect sizes for SDQ Hyperactivity in terms of formal group, formal individual and informal individual ECEC use aged two to four and home environment and demographic covariates. .................................................................................................. 79
Figure 13: Comparing effect sizes for SDQ Emotional Symptoms in terms of formal group, formal individual and informal individual ECEC use aged two to four and home environment and demographic covariates. ...................................................................... 80

7
Figure 14: Comparing effect sizes for SDQ Conduct Problems in terms of formal group, formal individual and informal individual ECEC use aged two to four and home environment and demographic covariates. ...................................................................... 81
Figure 15: Comparing effect sizes for SDQ Peer Problems in terms of formal group, formal individual and informal individual ECEC use aged two to four and home environment and demographic covariates. ...................................................................... 82
Figure 16: Comparing effect sizes for SDQ Prosocial Scale in terms of formal group, formal individual and informal individual ECEC use aged two to four and home environment and demographic covariates. ...................................................................... 83
Figure 17: Comparing effect sizes for Behavioural Self-regulation in terms of formal group, formal individual and informal individual ECEC use aged two to four and home environment and demographic covariates. ...................................................................... 84
Figure 18: Comparing effect sizes for Emotional Self-regulation in terms of formal group, formal individual and informal individual ECEC use aged two to four and home environment and demographic covariates. ...................................................................... 85
Figure 19: Comparing effect sizes for Co-operation Scale in terms of formal group, formal individual and informal individual ECEC use aged two to four and home environment and demographic covariates. .................................................................................................. 86

8
Executive Summary
Introduction
Research over several decades has accumulated indicating that early years education can have a positive effect on children’s educational, cognitive, behavioural and social outcomes, in the short and long term, particularly if the quality is good (Sylva et al., 2010; Melhuish et al., 2015). From September 2004 all three- and four-year-olds in England have been entitled to some funded early education. Since September 2010 this entitlement was for 570 hours per year (commonly taken as 15 hours per week for 38 weeks of the year). From September 2017, the entitlement was doubled to 1140 hours per year (equivalent to 30 hours per week for 38 weeks of the year) for families where parents are each earning at least the equivalent of the National Minimum Wage or Living Wage for 16 hours a week1.
Research has also shown the benefits of high quality early education exist when it starts as young as two-years of age (Smith et al., 2009; Sammons et al., 2002). In 2013 the UK government expanded the funded entitlement to two-year-old children living in disadvantaged households in England. This included two-year-olds looked after by the Local Authority (LA) and those from families in receipt of specified benefits, who might be regarded as the most disadvantaged. It was further extended in September 2014 to two-year-olds from low income families, two-year-olds with special needs and two-year-olds who have left care.
The Study of Early Education and Development (SEED)2, commissioned in 2012, includes a major longitudinal study designed to help the Department for Education (DfE) by providing evidence on the effectiveness of early years education and by identifying any short- and longer-term benefits from this investment. The study is being undertaken by a consortium including the National Centre for Social Research, the University of Oxford, Action for Children and Frontier Economics. SEED aims to study children at age two, three, four, five and seven to seek information on how variation in early childhood education and care (ECEC) experience may be associated with cognitive and socio-emotional development. This report is part of SEED, and focuses on exploring how ECEC may be related to children’s development at age four. This report addresses three main objectives:
1 30 hours childcare is available if parents and partners with whom the child lives are in work (including on parental leave, sick leave or annual leave) and each earning at least the equivalent of the national minimum wage for 16 hours a week and less than £100,000 per year. 2 Further information about the SEED study and reports published to date are available at http://www.seed.natcen.ac.uk/.

9
1. To study the associations between the amount of differing types of ECEC that children receive aged two to four years and child development at age four.
2. To investigate the relevance of the home environment and the quality of the parent/child relationship on child development at age four.
3. To study the associations between the quality of the ECEC settings that children have attended and child development at age four.
Sample
For this Study on Early Education Use and Child Outcomes up to age four years, the participants were 3,930 children and their families with data collected at Waves 1, 2 and 3, when children were two, three and four years old, respectively.
Children were sampled to come, in approximately equal numbers, from three levels of family disadvantage defined by family income and benefits received3:
1. The 20% most disadvantaged families (“most disadvantaged” group) 2. The 20-40% most disadvantaged families (“moderately disadvantaged” group) 3. The 60% least disadvantaged families (“least disadvantaged” group)
Early Childhood Education & Care (ECEC)
Children in SEED may attend any form of ECEC, although only those settings referred to as ‘formal’ are eligible for government funding. Settings classified in this report as ‘group’ based are those that are in a non-domestic group setting; those classified as ‘individual’ are in a domestic (i.e. home) setting. A three-way classification of ECEC was used for this report:
1. Formal group - ECEC in a non-domestic setting and eligible for government funding (e.g. day nurseries, nursery classes or schools and playgroups)
2. Formal individual - ECEC in a domestic setting and eligible for government funding (i.e. childminders)
3. Informal individual - ECEC in a domestic setting and not eligible for government funding (e.g. relatives, friends, neighbours or nannies4)
3 These categories of family disadvantage were defined based on eligibility criteria for 15 hours funded childcare for disadvantaged two-year olds. The proportion of families in each group is approximately in line with the population distribution at the time. 4 The DfE Survey of Parents indicates that grandparents are by far the largest informal provider of ECEC in England (DfE, 2017)
10
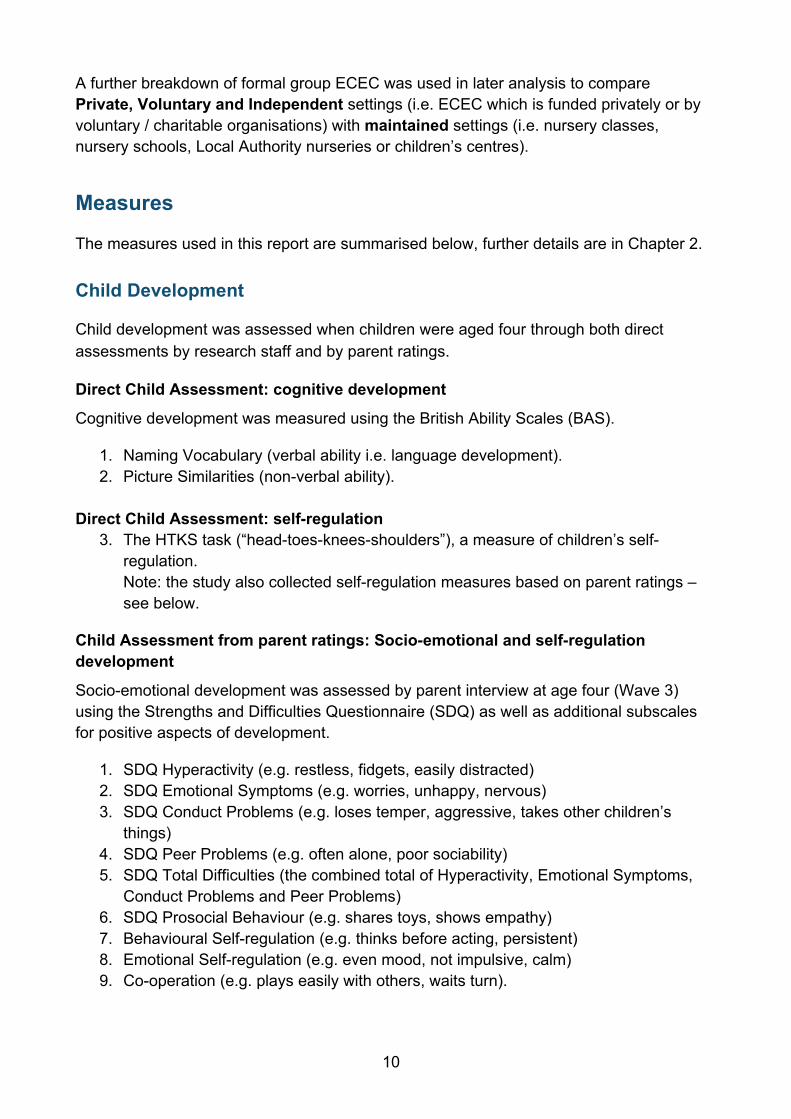
A further breakdown of formal group ECEC was used in later analysis to compare Private, Voluntary and Independent settings (i.e. ECEC which is funded privately or by voluntary / charitable organisations) with maintained settings (i.e. nursery classes, nursery schools, Local Authority nurseries or children’s centres).
Measures
The measures used in this report are summarised below, further details are in Chapter 2.
Child Development
Child development was assessed when children were aged four through both direct assessments by research staff and by parent ratings.
Direct Child Assessment: cognitive development
Cognitive development was measured using the British Ability Scales (BAS).
1. Naming Vocabulary (verbal ability i.e. language development). 2. Picture Similarities (non-verbal ability).
Direct Child Assessment: self-regulation
3. The HTKS task (“head-toes-knees-shoulders”), a measure of children’s self-regulation. Note: the study also collected self-regulation measures based on parent ratings – see below.
Child Assessment from parent ratings: Socio-emotional and self-regulation development
Socio-emotional development was assessed by parent interview at age four (Wave 3) using the Strengths and Difficulties Questionnaire (SDQ) as well as additional subscales for positive aspects of development.
1. SDQ Hyperactivity (e.g. restless, fidgets, easily distracted) 2. SDQ Emotional Symptoms (e.g. worries, unhappy, nervous) 3. SDQ Conduct Problems (e.g. loses temper, aggressive, takes other children’s
things) 4. SDQ Peer Problems (e.g. often alone, poor sociability) 5. SDQ Total Difficulties (the combined total of Hyperactivity, Emotional Symptoms,
Conduct Problems and Peer Problems) 6. SDQ Prosocial Behaviour (e.g. shares toys, shows empathy) 7. Behavioural Self-regulation (e.g. thinks before acting, persistent) 8. Emotional Self-regulation (e.g. even mood, not impulsive, calm) 9. Co-operation (e.g. plays easily with others, waits turn).

11
Home environment and demographics
Home environment measures
Home environment measures were completed at ages two and three (Waves 1 and 2).
1. Home Learning Environment (exposure to learning activities in the home such as reading, nursery rhymes)
2. Household disorder (CHAOS scale) 3. Parent’s Psychological Distress score (e.g. symptoms of depression or anxiety) 4. Limit Setting score (e.g. time out, telling off) 5. MORS Warmth score (a measure of parent/child closeness)5 6. MORS Invasiveness score (a measure of parent/child conflict)
Demographic measures
Demographic information was collected at age three (Wave 2).
1. Child’s sex 2. Child’s ethnic group 3. Child’s birth weight 4. Child’s birth order 5. Maternal age at birth of child 6. Number of siblings living in the same household as child 7. Whether child is living in a couple or lone parent household 8. Whether child is living in a workless or working household 9. Household income 10. Area deprivation (Index of Multiple Deprivation, IMD)6 11. SEED disadvantage group (most disadvantaged, moderately disadvantaged, least
disadvantaged) according to household income and benefits at baseline 12. Type of accommodation tenure (renting / owner occupier) 13. Mother’s highest academic qualification 14. Highest parental socio-economic status
Quality measures
The quality of 1000 settings was assessed using observational ratings: 402 settings for children at age two (Wave 1), and 598 settings for children at age three (Wave 2).
At age two (Wave 1), setting quality was assessed using these measures:
5 The MORS warmth and invasiveness scales were measured at Wave 2 only. 6 A ranking of small areas in England based on income deprivation, employment deprivation, education, skills and training deprivation, health deprivation and disability, crime, barriers to housing and services, living environment deprivation.

12
1. Sustained Shared Thinking and Emotional Well-being (SSTEW) scale – measuring the quality of staff / child interaction
2. Infant and Toddler Environment Rating Scale – Revised (ITERS-R) – an overall measure of quality for under-threes (e.g. activities, interactions, routines)
At age three (Wave 2) setting quality was assessed using these measures:
1. SSTEW – measuring the quality of staff / child interaction 2. Early Childhood Environment Rating Scale – Revised (ECERS-R) – an overall
measure of quality for over-threes (e.g. activities, interactions, routines) 3. Early Childhood Environment Rating Scale – Extended (ECERS-E) – an extension
of ECERS-R focussing on several aspects of educational learning opportunities
Results
This is an overview of findings, further details of which are available in the research report. Key findings are also summarised at the beginning of the relevant chapters.
Are variations in ECEC use associated with child development?
Results by the amount of ECEC use
When controlling for home environment and demographic factors, the average number of hours per week in ECEC between ages two and four years was associated with differences in cognitive and socio-emotional outcomes at age four years (see Table 1).
Results are given as the change in the standardized outcome corresponding to a 10 hour per week change in the ECEC usage covariate. Using standardized outcomes, that is outcomes measured in units of the standard deviation, allows the size of effects to be compared between the different outcomes. Effects between 0.02 and 0.05 units may be considered small; effects between 0.05 and 0.1 may be considered to be of medium size.7
7 Effects over 0.1 units would be considered large.

13
Table 1: Summary of the statistically significant8 associations between children’s time in ECEC from two to four years (mean hours per week) and children’s outcomes at age four.
Child outcome Type of early education and care (ECEC)
Formal ECEC Informal ECEC Group Childminders Relatives, friends, nannies
Cognitive development Naming Vocabulary (verbal) +0.014 +0.053 +0.048* Picture Similarities (non-verbal) +0.044* +0.048 +0.010 Self-regulation direct assessment
HTKS Task (self-regulation) +0.018 +0.045 +0.007 Socio-emotional problems SDQ Total Difficulties -0.014 -0.018 +0.035 Hyperactivity +0.001 +0.005 +0.036 Emotional Symptoms -0.025 -0.073* +0.007 Conduct Problems +0.044*‡ +0.032 +0.036 Peer Problems -0.087*** -0.043 +0.021 Socio-emotional strengths Prosocial Behaviour +0.041* +0.048 -0.012 Behavioural Self-regulation +0.056** +0.047 +0.008 Emotional Self-regulation -0.018 -0.028 -0.020 Co-operation +0.018 +0.014 -0.010 Sample size = 3,930. The table displays coefficients for associations between hours of each type of ECEC and each outcome. Statistically significant coefficients are in bold italics, the level of significance is indicated by stars: * = p < .05, ** = p < .01, *** = p < .001. Coefficients give the change in the standardized outcome corresponding to a 10 hour per week change in the ECEC use covariate. For cognitive development and socio-emotional strengths, higher scores indicate a positive outcome, and a positive association (+) indicate that more hours in ECEC are associated with a better score in this outcome. For socio-emotional problems, lower scores are a positive outcome, and a negative association (-) indicates that more hours in ECEC are associated with a better score for this outcome. ‡ In later analysis, this negative association was significant only for children with high formal group ECEC use, i.e. greater than 35 hours per week over the 38 weeks of the school terms (2.98% of the sample).
In most cases ECEC use has a positive benefit regardless of household income disadvantage level. Positive impacts were observed for use of formal and informal ECEC:
• Better language development was associated with more hours spent in informal individual ECEC (e.g. with relatives and friends).
8 A statistically significant association is one that is unlikely to be due to chance.

14
• Better non-verbal reasoning ability was associated with more hours spent in formal group ECEC (e.g. nursery classes, nursery schools, day nurseries and playgroups).
• Better socio-emotional outcomes were associated with more hours spent in formal group ECEC settings, specifically higher levels of Prosocial Behaviour and Behavioural Self-regulation and lower levels of Peer Problems.
• More hours with childminders was associated with lower levels of Emotional Symptoms.
• More hours spent in formal group ECEC was also associated with children having higher levels of Conduct Problems. Subgroup analysis found that this effect was limited to a small group of children (N = 117) who spent over 35 hours per week of formal group ECEC from age two to four. Findings suggest, however, that the behaviour of these children was in fact no different to that of the majority of children using fewer hours in ECEC. Rather, these high ECEC use children failed to show the lower levels of Conduct Problems that would have been expected given their demographic characteristics and home environment (generally coming from higher qualified families with lower levels of household disorder in comparison with lower ECEC use children). Comparison with the SEED results at age three also suggests that this negative impact has lessened over time.
The associations between ECEC and child outcomes were consistent across regions9 and area disadvantage (using the Index of Multiple Deprivation).
Given the timing of measurement, and because an extensive number of factors are controlled for in the analyses, the relationships between ECEC and child outcome may be assumed to be causal and therefore the associations identified in this report are referred to as evidence of ‘impact’ based on this assumption.10
Results by specific levels of ECEC use
The findings presented above indicate a number of relationships where more hours in ECEC per week are associated with better child cognitive and socio-emotional development. Analyses of the specific levels of ECEC use (in categories of average hours spent in ECEC per week) generally also indicate increasing benefits associated with more hours spent in ECEC. However, given that associations vary across different outcomes and for each type of provision, because the number of hours is an average across a two-year period and because the number of children within some of the time
9 The nine government office regions were aggregated into five geographical regions (The North, The Midlands, East of England, London, The South), see Technical Report for further detail. 10 Further discussion of the causal relationships is given in the associated Technical Report.
15
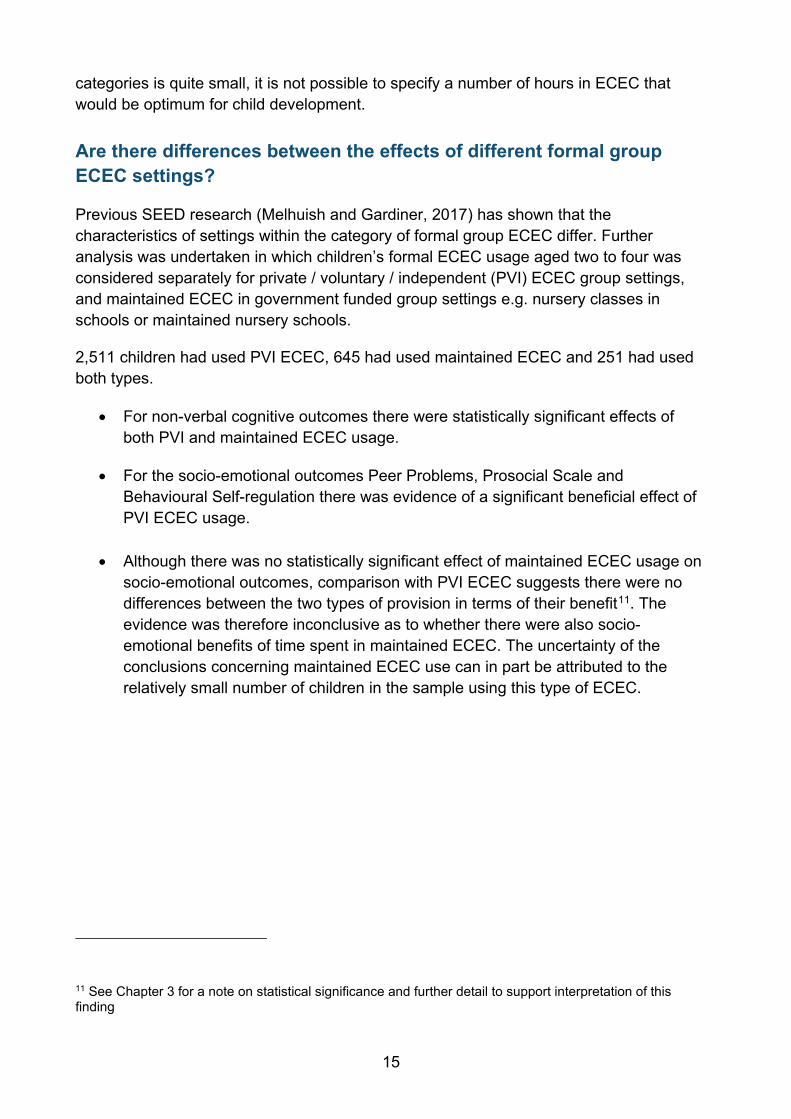
categories is quite small, it is not possible to specify a number of hours in ECEC that would be optimum for child development.
Are there differences between the effects of different formal group ECEC settings?
Previous SEED research (Melhuish and Gardiner, 2017) has shown that the characteristics of settings within the category of formal group ECEC differ. Further analysis was undertaken in which children’s formal ECEC usage aged two to four was considered separately for private / voluntary / independent (PVI) ECEC group settings, and maintained ECEC in government funded group settings e.g. nursery classes in schools or maintained nursery schools.
2,511 children had used PVI ECEC, 645 had used maintained ECEC and 251 had used both types.
• For non-verbal cognitive outcomes there were statistically significant effects of both PVI and maintained ECEC usage.
• For the socio-emotional outcomes Peer Problems, Prosocial Scale and Behavioural Self-regulation there was evidence of a significant beneficial effect of PVI ECEC usage.
• Although there was no statistically significant effect of maintained ECEC usage on socio-emotional outcomes, comparison with PVI ECEC suggests there were no differences between the two types of provision in terms of their benefit11. The evidence was therefore inconclusive as to whether there were also socio-emotional benefits of time spent in maintained ECEC. The uncertainty of the conclusions concerning maintained ECEC use can in part be attributed to the relatively small number of children in the sample using this type of ECEC.
11 See Chapter 3 for a note on statistical significance and further detail to support interpretation of this finding
16
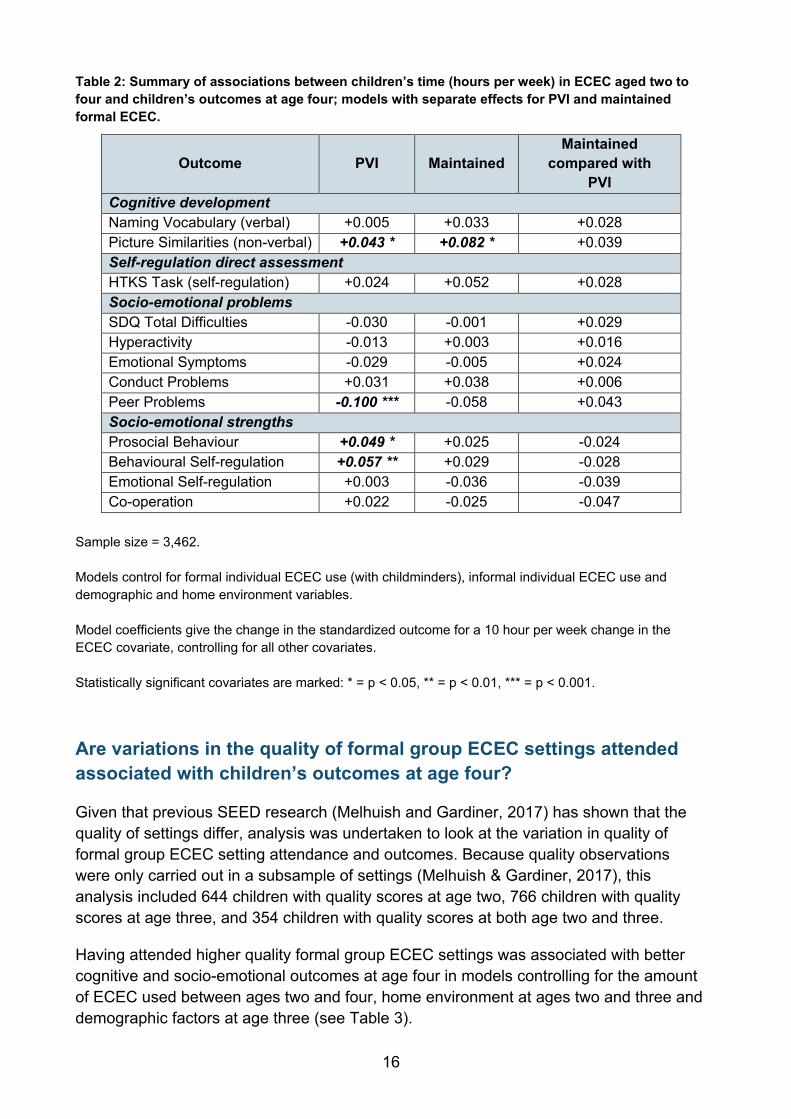
Table 2: Summary of associations between children’s time (hours per week) in ECEC aged two to four and children’s outcomes at age four; models with separate effects for PVI and maintained formal ECEC.
Outcome PVI Maintained Maintained
compared with PVI
Cognitive development Naming Vocabulary (verbal) +0.005 +0.033 +0.028 Picture Similarities (non-verbal) +0.043 * +0.082 * +0.039 Self-regulation direct assessment HTKS Task (self-regulation) +0.024 +0.052 +0.028 Socio-emotional problems SDQ Total Difficulties -0.030 -0.001 +0.029 Hyperactivity -0.013 +0.003 +0.016 Emotional Symptoms -0.029 -0.005 +0.024 Conduct Problems +0.031 +0.038 +0.006 Peer Problems -0.100 *** -0.058 +0.043 Socio-emotional strengths Prosocial Behaviour +0.049 * +0.025 -0.024 Behavioural Self-regulation +0.057 ** +0.029 -0.028 Emotional Self-regulation +0.003 -0.036 -0.039 Co-operation +0.022 -0.025 -0.047
Sample size = 3,462. Models control for formal individual ECEC use (with childminders), informal individual ECEC use and demographic and home environment variables. Model coefficients give the change in the standardized outcome for a 10 hour per week change in the ECEC covariate, controlling for all other covariates. Statistically significant covariates are marked: * = p < 0.05, ** = p < 0.01, *** = p < 0.001.
Are variations in the quality of formal group ECEC settings attended associated with children’s outcomes at age four?
Given that previous SEED research (Melhuish and Gardiner, 2017) has shown that the quality of settings differ, analysis was undertaken to look at the variation in quality of formal group ECEC setting attendance and outcomes. Because quality observations were only carried out in a subsample of settings (Melhuish & Gardiner, 2017), this analysis included 644 children with quality scores at age two, 766 children with quality scores at age three, and 354 children with quality scores at both age two and three.
Having attended higher quality formal group ECEC settings was associated with better cognitive and socio-emotional outcomes at age four in models controlling for the amount of ECEC used between ages two and four, home environment at ages two and three and demographic factors at age three (see Table 3).
17
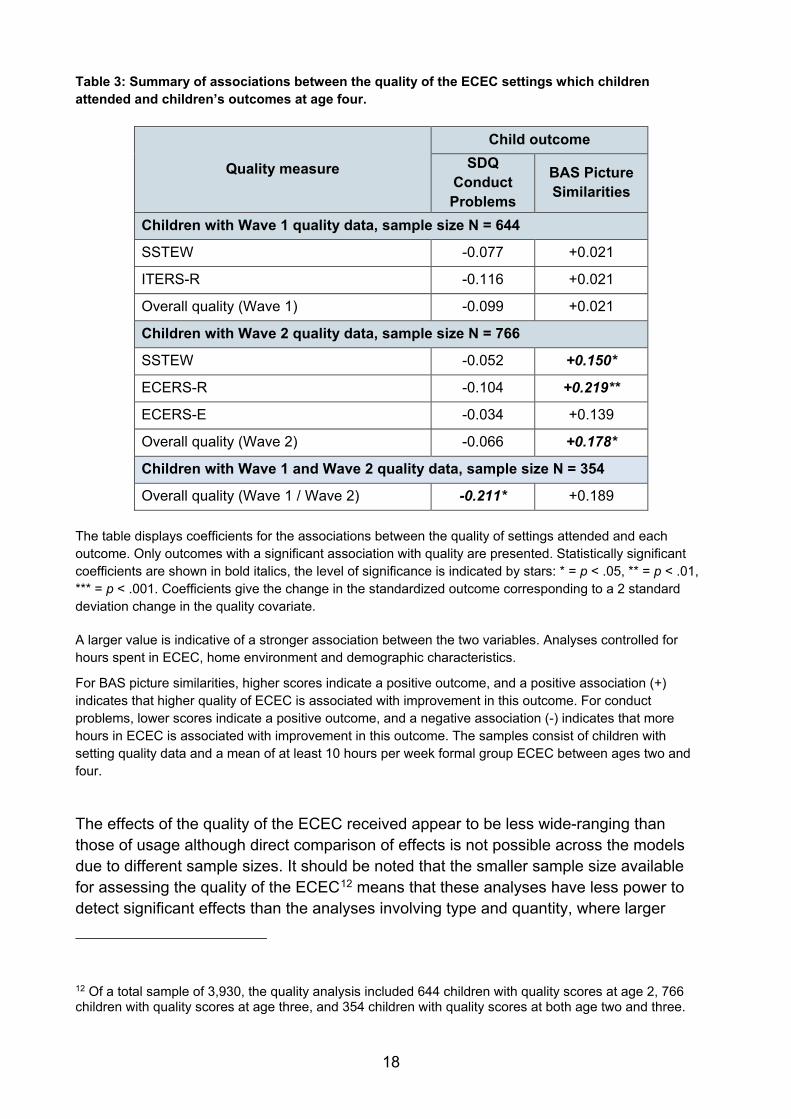
• Higher quality of formal group ECEC attended at age three (measured by the SSTEW measure of staff child interaction quality, ECERS-R measure of setting quality as well as a composite overall quality measure) was associated with better non-verbal cognitive ability at age four.
• Attending higher quality formal group ECEC at age two and three (measured by composite overall quality) was associated with lower levels of Conduct Problems at age four.
• There was no significant relationship between formal group ECEC quality and verbal cognitive development, or between ECEC quality and any other measure of socio-emotional development.
18
Table 3: Summary of associations between the quality of the ECEC settings which children attended and children’s outcomes at age four.
Quality measure
Child outcome SDQ
Conduct Problems
BAS Picture Similarities
Children with Wave 1 quality data, sample size N = 644
SSTEW -0.077 +0.021
ITERS-R -0.116 +0.021
Overall quality (Wave 1) -0.099 +0.021
Children with Wave 2 quality data, sample size N = 766
SSTEW -0.052 +0.150*
ECERS-R -0.104 +0.219**
ECERS-E -0.034 +0.139
Overall quality (Wave 2) -0.066 +0.178*
Children with Wave 1 and Wave 2 quality data, sample size N = 354
Overall quality (Wave 1 / Wave 2) -0.211* +0.189 The table displays coefficients for the associations between the quality of settings attended and each outcome. Only outcomes with a significant association with quality are presented. Statistically significant coefficients are shown in bold italics, the level of significance is indicated by stars: * = p < .05, ** = p < .01, *** = p < .001. Coefficients give the change in the standardized outcome corresponding to a 2 standard deviation change in the quality covariate.
A larger value is indicative of a stronger association between the two variables. Analyses controlled for hours spent in ECEC, home environment and demographic characteristics.
For BAS picture similarities, higher scores indicate a positive outcome, and a positive association (+) indicates that higher quality of ECEC is associated with improvement in this outcome. For conduct problems, lower scores indicate a positive outcome, and a negative association (-) indicates that more hours in ECEC is associated with improvement in this outcome. The samples consist of children with setting quality data and a mean of at least 10 hours per week formal group ECEC between ages two and four.
The effects of the quality of the ECEC received appear to be less wide-ranging than those of usage although direct comparison of effects is not possible across the models due to different sample sizes. It should be noted that the smaller sample size available for assessing the quality of the ECEC12 means that these analyses have less power to detect significant effects than the analyses involving type and quantity, where larger
12 Of a total sample of 3,930, the quality analysis included 644 children with quality scores at age 2, 766 children with quality scores at age three, and 354 children with quality scores at both age two and three.

19
sample size applies. It is possible that there are further effects of ECEC quality on child outcomes that could not be detected with the smaller sample size. The reduced relative impact of quality in relation to previous findings such as those of EPPE may also be related to the increase in quality over time as indicated in the SEED: Study of Quality of Early Years Provision in England (Melhuish & Gardiner, 2017). This has meant the spread of quality (and therefore statistical variation) may have narrowed, reducing the potential impact of variation in quality on outcomes.
Are variations in the home environment associated with child development?
Several cognitive and socio-emotional outcomes at age four were associated with variations in the home environment13 when controlling for demographic factors14 and amount and type of ECEC use between age two and age four (see Table 4):
• Children from families with a more stimulating Home Learning Environment (HLE) had better cognitive outcomes (verbal and non-verbal ability), and higher levels of Prosocial Behaviour and self-regulation (both HTKS task and parent ratings of Behavioural Self-regulation). In an unexpected finding, a higher HLE score was also associated with lower levels of children’s Emotional Self-regulation.
• Children from families reporting a higher level of household disorder (as measured by the CHAOS scale) had poorer outcomes on all socio-emotional measures.
• A higher level of parent’s psychological distress was associated with lower child self-regulation (measured by poorer performance on the HTKS task), higher levels of socio-emotional problems and lower levels of child Emotional Self-regulation.
• Mixed findings occur for parents setting limits around behaviour. Where parents set more limits for behaviour children had better cognitive outcomes and Behavioural Self-regulation, less Emotional Symptoms and Peer Problems.
• Where parents set more limits around behaviour also had higher levels of Hyperactivity and Conduct Problems and lower levels of Emotional Self-regulation and Co-operation.
• Children from families with a higher parent/child conflict (measured by MORS Invasiveness) had poorer cognitive and socio-emotional outcomes overall.
• Children from families with a higher parent/child closeness (measured by MORS Warmth) had better cognitive and socio-emotional outcomes on all measures.
13 Averaged from age two and three 14 Measured at age three

20
Table 4: Summary of the associations between home environment variables at ages two and three and children’s outcomes at age four.
Child outcome
Home environment variables
Home Learning Environ
ment
Household
chaos
Parent's psycholo
gical distress
Limit setting
MORS invasive-
ness
MORS warmth
Cognitive development Naming Vocabulary (verbal) +0.260*** +0.051 -0.028 +0.228*** -0.132*** +0.158*** Picture Similarities (non-verbal) +0.161*** +0.003 -0.011 +0.123*** -0.084* +0.070*
Self-regulation direct assessment HTKS Task (self-regulation) +0.178*** +0.010 -0.073* +0.121** -0.104** +0.082* Socio-emotional problems SDQ Total Difficulties +0.029 +0.236*** +0.229*** +0.044 +0.610*** -0.265*** Hyperactivity -0.016 +0.234*** +0.147*** +0.128*** +0.431*** -0.187*** Emotional Symptoms +0.056 +0.094** +0.280*** -0.114** +0.445*** -0.104** Conduct Problems +0.043 +0.249*** +0.129*** +0.203*** +0.596*** -0.161*** Peer Problems +0.020 +0.074* +0.148*** -0.196*** +0.324*** -0.356*** Socio-emotional strengths Prosocial Behaviour +0.139*** -0.174*** -0.043 +0.008 -0.238*** +0.513*** Behavioural Self-regulation +0.179*** -0.094** -0.046 +0.124*** -0.299*** +0.285*** Emotional Self-regulation -0.075* -0.251*** -0.136*** -0.089** -0.607*** +0.136*** Co-operation +0.059 -0.185*** -0.051 -0.098** -0.415*** +0.414*** Sample size = 3,930 The table displays coefficients for the associations between the home environment variables and each outcome. Statistically significant coefficients are shown in bold italics, the level of significance is indicated by stars: * = p < .05, ** = p < .01, *** = p < .001. Coefficients give the change in the standardized outcome corresponding to a 2 standard deviation change in the home environment variable. For cognitive development and socio-emotional strengths, higher scores indicate a positive outcome, and a positive association (+) indicates that a higher level of the home environment covariate is associated with improvement in this outcome. For socio-emotional problems, lower scores are a positive outcome, and a negative association (-) indicates that a higher level of the home environment covariate is associated with a better (i.e. lower) score on this outcome.
Relative effects of ECEC, home environment and demographics
Although hours spent in ECEC is associated with a number of child outcomes, demographic characteristics (particularly maternal education), the parent-child relationship (particularly warmth and invasiveness) and the quality of the home learning environment have a greater influence on children’s cognitive development and on socio-emotional development than hours spent in ECEC.

21
Interactions between ECEC and HLE
Analyses found that the beneficial effects of ECEC use and of a rich Home Learning Environment (HLE) are largely independent of each other. This indicates that even children having very stimulating home environments still benefit from hours in ECEC.
Conclusions The amount and type of ECEC attended between ages two and four are both associated with a number of cognitive and socio-emotional outcomes at age four. Many findings are in line with those observed in the previous report of outcomes at age three (Melhuish, Gardiner & Morris, 2017). A key difference is additional gains in non-verbal development at age four that have been found for children spending time in group settings. Taken together, these findings indicate the wide ranging benefits of attending ECEC between ages two and age four. These results correspond, in part, with previous research15 that has frequently found beneficial effects associated with more hours in formal group ECEC for aspects of cognitive development as well as socio-emotional development, such as Peer Problems, Prosocial Behaviour and Self-regulation.
Specifically, the study found that more hours spent in informal individual ECEC settings (e.g. with relatives, friends, neighbours) was associated with better language development at age four. In addition, more hours spent with individual formal ECEC providers (childminders) was associated with fewer Emotional Symptoms, although subgroup analysis indicated that the effect was only significant in the moderately disadvantaged group. Verbal development was not associated with hours spent in formal group ECEC settings, which is inconsistent with findings from EPPE which suggested long-term language and literacy outcomes relating to attending group ECEC (Sylva et al., 2004). Although short-term language benefits of group settings have not been found in SEED, language outcomes in the longer term once children start school will be considered in future SEED reports. Given the importance of language development in longer term outcomes (Blanden, 2006), future research should consider ways in which practice can be enhanced to increase language development in children attending group ECEC settings.
Although benefits of group ECEC for language are not yet seen in SEED, a number of areas of socio-emotional and cognitive development, which are also important for longer term outcomes, are shown to benefit from group ECEC. More hours spent in formal group ECEC (e.g. day nurseries, nursery classes or schools and playgroups) was associated with better cognitive non-verbal reasoning ability at age four. More hours spent in formal group ECEC was also associated with several aspects of socio-emotional
15 This research is reviewed comprehensively in Melhuish et al. (2015).

22
development; more Prosocial Behaviour, better Behavioural Self-regulation and fewer Peer Problems.
A small association was observed between hours spent in formal group ECEC and higher conduct problems; further analysis showed that this effect was restricted to children spending over 35 hours per week in formal group settings. This negative impact of high formal group ECEC use on conduct problems was reduced in comparison with the effect found at age three;16 this is in line with findings from EPPE that such negative impacts are reduced over time (Melhuish et al., 2010).
Increased time spent in ECEC in both PVI and maintained settings was associated with cognitive benefits, and ECEC received in PVI settings was also associated with socio-emotional benefits. The evidence was inconclusive as to whether there were also socio-emotional benefits of time spent in maintained ECEC. The uncertainty of the conclusions concerning maintained ECEC use can in part be attributed to the relatively small number of children in the sample using this type of ECEC.
In most instances, associations between ECEC and child development were identified across the whole range of disadvantage in the SEED sample, suggesting that use of ECEC has a largely positive benefit on cognitive and socio-emotional outcomes at age four for children across the advantage-disadvantage spectrum. However, given the lower starting point among disadvantaged children (Speight et al., 2015), and reduced likelihood to take up childcare (DfE, 2017), ECEC may be of particular importance for the most disadvantaged children.
Further, this report presents associations between the quality of childcare attended and child outcomes. The study found evidence that attending better quality childcare settings between ages two and four had a positive impact on some aspects of children’s cognitive and socio-emotional outcomes measured at age four. This indicates the value of high quality ECEC provision, and suggests that efforts to further improve the quality of provision may be expected to lead to further improved child outcomes. The recently published SEED quality report (Melhuish & Gardiner, 2017) indicates a number of structural characteristics of settings, including staff qualifications and training, which may be instrumental in achieving the high quality provision that is seen to be associated with the best child outcomes.
The study also found that several cognitive and socio-emotional outcomes at age four were significantly associated with variations in the home environment, particularly the quality of the parent/child relationship, maternal qualifications and the Home Learning Environment. Findings also suggest that outcomes are generally more strongly associated with demographics and home environment than they are with time spent in ECEC settings. Nevertheless, in line with findings from the same sample at age three
16 Reported in an earlier SEED report (Melhuish et al., 2017).

23
(Melhuish et al., 2017), the advantages of a more stimulating and responsive Home Learning Environment and the beneficial effects of time in ECEC are largely independent. This suggests that even children with the most stimulating home learning environments still stand to benefit from spending time in ECEC.
Whether the pattern of outcomes observed at age four continues in the longer term will be addressed in future SEED reports.

24
Chapter 1: Introduction
Background
Internationally, the number of children attending non-parental childcare and education services before school entry has been increasing since the 1960s, and in developed countries some preschool education or care is the norm for most children.
‘Today’s rising generation in the countries of the OECD is the first in which a majority are spending a large part of their early childhoods not in their own families but in some form of childcare’ (UNICEF Innocenti Research Centre, 2008:3).
The terms ‘day care’, ‘child care’ and ‘early childhood education and care’ (ECEC) have all been used to refer to non-parental childcare and early education occurring before school. This includes childcare with relatives, childminders, and group or centre-based childcare and early education. The Organisation for Economic Co-operation and Development (OECD) and the European Commission have adopted the term ‘early childhood education and care’ (ECEC) in their publications to encompass all these forms of childcare and early education. Sometimes ECEC has an explicit educational component and sometimes not. However, in that all experience can potentially be educational, this distinction is not clear-cut.
ECEC has the potential to benefit families as well as children. It can enable parents to work, re-enter the labour market, undergo training to improve employability and work more hours. Thus, it can play a role in improving family income, reducing welfare dependency and poverty, and improving social mobility for families – and later for the children themselves. Also, ECEC provision may have implications for fertility rates and is embedded in a broader context of educational and family policies (e.g. European Commission, Directorate-general for Education, Youth, Sport and Culture, 2014). Rates and type of ECEC use, and the content and quality of ECEC differ by child age and socio-political context. For instance, on average across OECD countries, 70 per cent of three-year-olds, 85 per cent of four-year-olds and 95 per cent of five-year-olds were enrolled in paid ECEC of some form (or primary education) in 2014 (OECD, 2017). In England in 2016, 95 per cent of three- and four-year-olds received some government-funded ECEC (Melhuish et al., 2017). For children under three years of age, amongst OECD countries, ECEC use varies greatly, from ten per cent and lower in some countries (e.g. Czech Republic and Poland) to around 60 per cent in Scandinavian countries, with the OECD average being 33 per cent (OECD 2016).
ECEC and child development
A great deal is already known about the benefits of early years education in terms of benefits for educational, cognitive, behavioural and social outcomes of children, both in the short and long term. There is good evidence that early education has a considerable

25
influence on school readiness, long-term school attainment and lifelong outcomes (e.g. Melhuish, 2004; Smith et al., 2009; Sylva et al., 2004, 2010). Attending high quality ECEC helps prepare young children to be ‘school ready’, i.e. achieving the level of development that helps their ability to learn when they start school (Becker, 2011), which is important as a foundation for a successful educational career and long-term life outcomes.
For provision from three years onwards, the evidence is consistent that preschool provision is beneficial to educational and social development for the whole population (e.g. Sylva et al., 2010). An example of the multi-national nature of positive ECEC effects is provided by an OECD (2011) report on PISA results, reporting that 15-year-olds who had attended some pre-primary education outperformed students who had not by about a year of achievement. ECEC interventions also boost children’s confidence and social skills, which provides a better foundation for success at school (and subsequently in the workplace). Reviews of the research often infer that it is the social skills and higher motivation that lead to lower levels of special education and school failure, and higher educational achievement in children exposed to early childhood development programmes (e.g. Oden et al., 1996). Longer-term socio-emotional outcomes may not only be driven by short term socio-emotional benefits of ECEC, but also by the cognitive and academic outcomes. For example, studies into adulthood have indicated that educational success is likely to be followed by increased success in employment, social integration and sometimes reduced criminality (e.g. Barnett, 2011; Muennig, Schweinhart, Montie, and Neidell, 2009).
Studies have also indicated that there are a number of characteristics of ECEC which lead to improved outcomes. For example, the benefits are often seen to be greater for high-quality provision (Sylva et al., 2004). There is also evidence that a starting age from two years of age onwards is most effective for preschool education (Sammons et al., 2002), and that the duration in months in ECEC may be have a stronger influence than the number of hours per week (Sylva et al., 2004). There has also been some evidence that high levels of childcare, particularly group care in the first two years, may elevate the risk for developing antisocial behaviour (Belsky, et al., 2007; Eryigit-Madzwamuse & Barnes, 2013). However subsequent research indicates that this may be related to high levels of poor quality care, particularly in group care and in the first two years (Melhuish et al., 2015).
ECEC has been used as an intervention strategy to improve the lives and development of specific groups, particularly children living in disadvantaged households. Children from disadvantaged family backgrounds often enter school with fewer academic skills than their more advantaged peers, and they often lag behind in their cognitive development during the later school years (Stipek & Ryan, 1997; Sylva et al., 2012). More than 40 years of research have shown that good quality preschool experiences can produce benefits for cognitive, language and social development for disadvantaged children (e.g. Ramey et al., 2000) and help prepare them for school entry (see, for example, reviews by Barnett, 1995; Brooks-Gunn, 2003; Heckman, 2006; Melhuish, 2004; Yoshikawa et al.,

26
2013). Some evidence suggests that early education can have the greatest impact on children from disadvantaged families (e.g. Cattan et al., 2014), and may at least be of particular importance to disadvantaged children who are already behind their peers from an early age (Speight et al., 2015). Therefore, ECEC is crucial in narrowing the gap in development and attainment between groups of children. However, children from disadvantaged families are less likely to attend early years settings, even for provision that is funded by the Government (Department for Education, 2017).
With regard to provision for three years onwards, disadvantaged children benefit particularly from high-quality early education provision (e.g. Muennig et al., 2009; Reynolds et al., 2011). Research also suggests that children benefit more in socially mixed groups rather than in homogeneously disadvantaged groups (Melhuish et al., 2008a). Some interventions have shown improvements in cognitive development, but such benefits may not persist throughout children’s school careers. This may be because subsequent poor school experiences for disadvantaged children overcome earlier benefits from high-quality ECEC experience (Barnett, 1995; Karoly et al., 1998).
There may also be geographic and regional differences in the benefits of ECEC which may relate in part to regional variation in quality (Melhuish & Gardiner, 2017). A recent DfE publication using data from the Millennium Cohort Study also suggests the number of hours per week that children spend in ECEC contributes to regional differences in early years attainment, although a number of other factors such as ethnic composition contribute more strongly to this variation and much regional variation remains unexplained (Dunatchik et al., 2018).
Child development is affected by a range of children’s experiences, and the early years can be a particularly sensitive period of development (e.g. Tierney & Nelson, 2009). ECEC is one such influence that constitutes a substantial part of young children’s experiences, which can influence short and longer-term outcomes (e.g. Sylva et al., 2010). Home environment, parenting and demographic characteristics are also seen to play a role in child development. Some evidence suggests that these factors do not function alone, but interact with each other. Hence the potential effects of ECEC experience may be partly moderated by family factors, such as disadvantage and the Home Learning Environment (e.g. Sammons et al., 2008).
Recent policy and ECEC in England
Since the late 1990s, policy for early childhood education and care (ECEC) in England has developed rapidly. Following the evidence from the Effective Pre-school, Primary and Secondary Education (EPPSE) study of the positive effects of ECEC upon children’s development (Sylva et al., 2004), the government implemented policies to provide a free part-time early education place (12.5 hours per week for 38 weeks of the year) for every child from their third birthday until the start of school; this policy came into effect in 2004. From September 2010 all three- and four-year-olds in the England have been entitled to funded early education for 570 hours per year (commonly taken as 15 hours per week for
27
38 weeks of the year). In 2013 the early education offer was extended to two-year-olds looked after by the LA and those from families in receipt of specified benefits. It was further extended in September 2014 to two-year-olds from low income families, two-year-olds with special needs and two-year-olds who have left care. This measure was taken to increase the life chances of children from disadvantaged families following EPPSE evidence (Sammons et al., 2002; Sylva et al., 2010) that ECEC could be beneficial from two years of age upwards. These policy changes have been motivated by the desire to improve early child development and school readiness and to enable and encourage parents to undertake paid employment. These developments have been underpinned by measures to raise the quality and availability of provision to provide support for the development of the quality of the workforce. Financial support for early education has included reimbursement of early education expenses in tax credits (currently being replaced by Universal Credit) and childcare vouchers which is being replaced by Tax Free Childcare from 2017.17
From September 2017 funded provision for three- and four-year-old children has been extended from 15 to 30 hours each week (for 38 weeks of the year). To receive the extended entitlement, parents must be working and each earning at least the equivalent of the national minimum wage for 16 hours a week, and not more than £100,000 each a year.18
It should be noted that SEED commenced before the Childcare Act 2016 and was not designed to study the 30 hours free childcare policy. When this policy was introduced in September 2017 the children within the SEED sample were already of school age and therefore ineligible for 30 hours free childcare. As such, the impact of 30 hours of free childcare policy will not be directly addressed by this study.
Study of Early Education and Development (SEED)
The Study of Early Education and Development (SEED) is a major eight year study commissioned by the Department for Education to explore how early education can give children the best start in life and to investigate the factors that are important for the delivery of high quality ECEC provision.19 The study is being undertaken by a consortium including the National Centre for Social Research, the University of Oxford, Action for Children and Frontier Economics. The aim of SEED overall is to provide a robust evidence base to inform policy development to improve children’s readiness for school by:
17 See the childcare service website, available at: https://childcare-support.tax.service.gov.uk/ 18 See the Childcare Act, 2016, available at: http://www.legislation.gov.uk/ukpga/2016/5/enacted. 19 Further information about the SEED study and reports published to date are available at http://www.seed.natcen.ac.uk/.

28
• Giving evidence of the potential impact of current early years provision on
children’s outcomes and providing a basis for the longitudinal assessment of any impact on later attainment.
• Assessing the role and influence of the quality of ECEC provision on children’s outcomes.
• Assessing the overall value for money of ECEC and the relative value for money associated with different types of early childhood education and care (e.g. private, voluntary, local authority) and the quality of ECEC provision.
• Exploring how the Home Learning Environment may interact with early education use (age two to four years) in affecting children’s outcomes.
To address these aims, SEED has several inter-related research strands:
• A longitudinal survey that initially included 5,642 families with preschool children from the age of two years to the end of Key Stage 1 (age seven years).
• Around 1,000 visits to early years group settings and to around 100 childminders to study the quality, characteristics and process of provision.
• Case studies of good practice in early years settings. • A value for money study involving the collection of cost data from 166 early years
settings. • Qualitative studies of childminders and of early education provision for children
with special educational needs and/or disabilities (SEN/D). • A study of experiences of the Early Years Pupil Premium (EYPP).
Objectives of this report
This is the second report from the longitudinal study.20 This report has three main objectives:
1. To study the associations between the amount of differing types of ECEC which children receive aged two to four and child development at age four.
2. To investigate the impact of the home environment and the quality of the parent/child relationship on child development at age four.
3. To explore the associations between the quality of the childcare settings which children have attended and child development at age four.
Given the timing of measurement, and because an extensive number of factors are controlled for in the analyses, the relationships between ECEC and child outcome, and
20 The first report from the longitudinal study “Study of Early Education and Development (SEED): Impact Study on Early Education Use and Child Outcomes up to Age Three, July 2017” is available from https://www.gov.uk/government/uploads/system/uploads/attachment_data/file/627098/SEED_ECEC_impact_at_age_3.pdf

29
between home environment and child outcome, are assumed to be causal.21 Based on this assumption, the associations identified in this report are often referred to as evidence of ‘impact’, although it is possible that there may be other unmeasured factors also playing a role in the relationship between ECEC and child outcome.
The remainder of this report is structured in the following way:
• Chapter 2 describes the research design and methodology of the longitudinal study.
• Chapter 3 analyses the associations between the use of ECEC from two to four years of age and child cognitive and socio-emotional outcomes at age four, having controlled for a range of demographic, parenting and home environment variables.
• Chapter 4 examines the associations between the quality of the childcare provision which children have attended between aged two and four and their cognitive and socio-emotional outcomes at age four.
• Chapter 5 uses the analyses described in Chapter 3 to examine the associations of parenting and home environment with child cognitive and socio-emotional outcomes at age four years.
• Chapter 6 draws the findings of the report together and discusses the results in relation to other UK and international research.
21 Further discussion of causal relationships is available in the associated Technical Report.

30
Chapter 2: The SEED longitudinal study: Design and methodology This chapter describes the main elements of the SEED longitudinal study design including details of the sample used within this report. A more detailed account of the methods is given in the Technical Report accompanying this report. The SEED study uses a longitudinal, multi-cohort, sample survey research design.
Research objectives
The SEED longitudinal study was designed to meet several related objectives:
1. To explore the impact on take-up of early education of the introduction of the policy of free early education for disadvantaged two-year-olds, in the year following the introduction of the policy.22
2. To study factors affecting development and behaviour during the early years among a representative sample of children. The focus was on effects of ECEC, in particular ECEC between two and four years of age, on cognitive and socio-emotional development. Other factors explored were parenting including the Home Learning Environment, household disorder, parental distress, the parent/child relationship and parental Limit Setting, as well as family demographics.
3. To study the impact of the quality of the childcare settings which children attended on their cognitive and socio-emotional development.
Sample selection
A three-stage clustered sample design was implemented for this study, with sample members selected from Child Benefit records (Speight et al. 2015). In the first stage postcode districts were designated primary sampling units (PSUs). As the second stage groups of postal sectors were identified within each PSU and designated Secondary Sampling Units (SSUs). Finally, eligible families with children of the relevant age were selected for interview within each SSU. This approach was adopted in order to generate a highly clustered sample of children and also a sample of childcare settings within the SSUs that the sampled children were likely to use. The sample was selected so that children were chosen from three groups varying in level of disadvantage to match as closely as possible the policy eligibility criteria:
22 The results of this research objective can be found in the earlier report “Study of Early Education and Development (SEED): Impact Study on Early Education Use and Child Outcomes up to Age Three, July 2017”. https://www.gov.uk/government/uploads/system/uploads/attachment_data/file/627098/SEED_ECEC_impact_at_age_3.pdf

31
1. Most disadvantaged 20% who had a parent in receipt of one of: • Income-based Jobseeker’s Allowance (JSA-IB); • Income-related Employment Support Allowance (ESA-IR); • Income Support (IS); • Guaranteed element of the State Pension Credit (PC with Guarantee
Credit); • Child Tax Credit only (not in receipt of an accompanying Working Tax Credit
award) with household gross earnings of less than £16,190.
2. Moderately disadvantaged 20-40% who had a parent in receipt of Working Tax Credits with household gross earnings of less than £16,190.
3. Least disadvantaged 60% who had parents not in receipt of any of the qualifying benefits or tax credits.
The sampling frame ensured that families from all levels of disadvantage were included in the study. By design the disadvantaged and moderately disadvantage groups are over-represented in the sample.
Longitudinal study
The study is designed to collect information from families at four time points:
• Wave 1 (baseline) when the target child is about two years old • Wave 2 when the child is about three years old • Wave 3 when the child is about four years old • Wave 4 when the child is about five years old
Further, the study aims to link survey data to educational outcomes from the Early Years Foundation Stage Profile (EYFSP) assessment in reception, and Key Stage 1 assessments at age seven.
In total, 5,642 families were seen in the baseline survey (overall response rate was 63%). The sample for the analyses in this report consists of 3,930 of these families (70% of those seen in the baseline survey) for whom data were available from Wave 1, Wave 2 and Wave 3. The mean age of children at the Wave 3 survey was 4 years 4 months. Some degree of family dropout from follow-up assessments in this type of longitudinal research is to be expected, and the follow-up rate of 70% would be considered acceptable such that interpretation of results is unlikely to be significantly affected by non-response bias, i.e. the potential difference between families in the sample and those who choose not to participate.
ECEC use
ECEC in England is of various types including:

32
1. Childminder 2. Nursery school 3. Nursery class attached to a primary/infant school 4. Private day nursery 5. Local Authority day nursery 6. Pre-school or playgroup 7. SEN day school, nursery or unit 8. Relative, friend or neighbour 9. Nanny or au pair 10. Other early education
Children in SEED may have attended any form of ECEC, although only the first seven are eligible for government funding. In the classification of setting types for this report, settings eligible for government funding are referred to as ‘formal’. Settings classified as ‘group’ based are those that are in a non-domestic setting, while those classified as ‘individual’ are in a domestic (i.e. home) setting.
A three-way classification of ECEC was used for this report:
1. “Formal group” ECEC in a non-domestic setting and eligible for government funding (e.g. day nurseries, nursery classes or schools and playgroups)
2. “Formal individual” ECEC in a domestic setting and eligible for government funding (i.e. childminders)
3. “Informal individual” ECEC in a domestic setting and not eligible for government funding (e.g. relatives, friends neighbours or nannies)23
A further breakdown of the formal group ECEC category was used in later analysis to compare Private, Voluntary and Independent settings with maintained settings, as follows24:
1. Private, Voluntary and Independent (PVI) ECEC, which is funded privately or by voluntary / charitable organisations
2. Maintained ECEC, which is local government administered (i.e. nursery classes, nursery schools, Local Authority nurseries or children’s centres)
23 The DfE Survey of Parents indicates that grandparents are by far the largest informal provider of ECEC in England (DfE, 2017) 24 Further detail of how settings were classified is available in the technical report

33
Measures
Home Environment Measures
These measures were assessed at Wave 1 and Wave 2 interviews carried out with parents when the children were aged two and three, respectively.
1. Home Learning Environment (HLE) index, i.e. home activities that allow learning opportunities for the child; e.g. child read to, taken to library, painting/drawing, play with letters/numbers, songs/rhymes; (Melhuish et al. 2001; 2008a)
2. Household Disorder (CHAOS scale including confusion, hubbub and disorder scale), adapted from Matheny et al. 1995 by NESS (2005) and Melhuish et al. (2008b)
3. Parent’s Psychological Distress (using the Kessler scale) e.g. symptoms of depression or anxiety
4. Limit Setting (i.e. how often parents set limits on their child’s behaviour such as time out or telling off)
5. MORS Warmth (a measure of closeness in the parent/child relationship e.g. relationship characterised by affection, doing things together)25
6. MORS Invasiveness (a measure of conflict in the parent/child relationship e.g. regarding child as demanding of attention, feeling annoyance toward child)25
The MORS scales were available from the Wave 2 interview only.
The home environment variables included in the present analysis were the mean of the values collected at Waves 1 and 2 except for the MORS scales where only Wave 2 data was available.26
Demographic Measures
These measures were assessed at the Wave 1 and Wave 2 interviews carried out with parents when the children were aged two and three, respectively.
1. Child’s gender 2. Child’s ethnic group 3. Child’s birth weight
25 See Simkiss et. al. (2013). 26 The Wave 1 and Wave 2 home environment variables were moderately correlated, with correlation coefficients in the range 0.45–0.65. Further details are given in the Technical Report.

34
4. Child’s birth order 5. Maternal age at birth of child 6. Number of siblings living in the same household as child 7. Whether child is living in a couple or lone parent household 8. Whether child is living in a workless or working household 9. Household income 10. Area Deprivation (Index of Multiple Deprivation, IMD)27 11. SEED disadvantage group 12. Type of accommodation tenure 13. Mother’s highest academic qualification 14. Highest parental socio-economic status
Where demographic measures varied over time, the Wave 2 values were used in the analyses.
Families were also classified according to region. The nine government office regions were aggregated into five geographical regions (The North, The Midlands, East of England, London, The South).28 Child development
Child development measured at age four (Wave 3) was used in this report.29 Aspects of cognitive development and socio-emotional development were chosen based on validity of measurement, their use in similar studies of this kind30 and potential importance for longer-term outcomes.
Child development was assessed both through direct assessments and by parent ratings.
Direct Child Assessment
Direct child assessment of cognitive development and self-regulation was measured when the children were aged four.
Cognitive development • Naming Vocabulary (verbal ability i.e. language development). • Picture Similarities (non-verbal ability).
27 A measure which ranks every small area (average 1,500 residents) in England from most to least deprived (based on income deprivation, employment deprivation, education, skills and training deprivation, health deprivation and disability, crime, barriers to housing and services, living environment deprivation). 28 Further detail on the categorisation by geographical region is given in the Technical Report. 29 Child development using the BAS and SDQ were also measured at age three (wave 2), the results of which are reported in the technical appendix of this report and the SEED impact age three report (Melhuish et al., 2017). 30 For example, the Effective Pre-school, Primary and Secondary Education (EPPSE) study (Sylva et al., 2004), Millennium Cohort Study, 2010; the National Evaluation of Sure Start (Melhuish et al., 2008).

35
Self-regulation direct assessment
• The HTKS task (“head-toes-knees-shoulders”), a measure of children’s self-regulation (Ponitz et. al., 2008) which taps into aspects of cognitive flexibility, working memory and inhibitory control (McClelland et al., 2014).31
Child Assessment from parent ratings: Socio-emotional, and self-regulation development
Assessments of children’s socio-emotional development were carried out at age four. The assessment consisted of a parental questionnaire from which nine socio-emotional measures were derived; these are used as child outcome variables. Six outcomes were derived from the Strength and Difficulties Questionnaire (SDQ) plus three additional, related scales. The SDQ provides four measures of negative aspects of socio-emotional development. These can be used individually or combined into a single SDQ Total Difficulties score. There is also one measure of a positive aspect of socio-emotional development (prosocial behaviour). To balance the measures, three extra scales measuring socio-emotional strengths were added. This strategy was followed by the Millennium Cohort study (2010) and the National Evaluation of Sure Start (Melhuish et al., 2008). The nine socio-emotional measures were:
• Strengths and Difficulties Questionnaire (SDQ, Goodman 1997) 1. SDQ Total Difficulties Score 2. Hyperactivity Scale (e.g. restless, fidgets, easily distracted) 3. Emotional Symptoms (e.g. worries, unhappy, nervous) 4. Conduct Problems (e.g. loses temper, aggressive, takes other children’s
things) 5. Peer Problems (e.g. often alone, poor sociability) 6. Prosocial Behaviour (e.g. includes child sharing, showing empathy)
• Additional items 7. Behavioural Self-regulation (e.g. thinks before acting, persistent, chooses
own activities) 8. Emotional Self-regulation (e.g. even mood, not impulsive, calm) 9. Co-operation (e.g. calm, plays easily with others, waits turn)
Settings quality measures
The quality of 1000 childcare settings was assessed though half day observations by trained observers. These observations took place in 402 settings that children had
31 This was the first time point at which this direct assessment of self-regulation was used with children in SEED. Self-regulation measures based on parent ratings are also used, see below.

36
attended at age two (Wave 1), and 598 settings that children had attended at age three (Wave 2).
At Wave 1, settings were assessed using the SSTEW and ITERS-R scales. At Wave 2, settings were assessed using the SSTEW, ECERS-R and ECERS-E scales.32
The Sustained Shared Thinking and Emotional Well-being scale (SSTEW)33 focuses on the quality of interactions between staff and children, and was used in the SEED study to assess settings (both for under-threes and over-threes) across 5 domains:
I. Building Trust, Confidence and Independence II. Supporting and Extending Language and Communication III. Supporting Emotional Well-being IV. Supporting Learning and Critical Thinking V. Assessing Learning and Language
The Infant and Toddler Environment Rating Scale – Revised (ITERS-R)34 is an overall measure of quality for the under-threes, and assesses settings across 6 domains:
I. Space and Furnishings II. Personal Care Routines III. Listening and Talking IV. Activities V. Interaction VI. Program Structure
The Early Childhood Environment Rating Scale - Revised (ECERS-R)35 is an overall measure of quality for the over-threes, and was used in the SEED study to assess settings across 5 domains:
I. Personal Care Routines II. Language Reasoning III. Activities IV. Interaction V. Programme Structure
The Extension to the Early Childhood Environment Rating Scale (ECERS-E)36 focuses on the educational aspects of experience for the over-threes, and was used in the SEED study to assess settings across 3 domains:
32 More detail on these measures is available in the SEED Study of Quality of Early Years Provision in England (Melhuish et al., 2017). 33 For more information on this scale see: Siraj, Kingston & Melhuish, 2015. 34 Harms, Cryer & Clifford, 2006. 35 Harms, Cryer & Clifford, 2005.

37
I. Literacy II. Mathematics III. Diversity
Because only a subsample of settings was assessed for quality, only a subgroup of the main sample of children was able to be included in analysis of quality. Of the 3,930 children in Waves 1 to 3 of the SEED study, 760 had attended settings at Wave 1 for which quality data were available, 1,118 had attended settings at Wave 2 for which quality data were available and 413 had attended settings at Wave 1 and Wave 2 for which quality data were available. Use of a subsample for quality analysis has implications for interpreting the results given that a smaller sample size may make it harder to detect small effects.
36 Sylva, Siraj-Blatchford & Taggart, 2011.

38
Chapter 3: The relationship between early childhood education and care (ECEC) aged two to four and children’s cognitive and socio-emotional outcomes at age four
Key findings
• There was good evidence that children’s cognitive and socio-emotional outcomes at age four were associated with their use of ECEC between ages two and four, and that different types of ECEC are associated with different benefits. These effects were apparent after controlling for demographic and home environment factors.
• More hours spent in formal group ECEC (e.g. day nursery, nursery class, nursery school, playgroup) was associated with improved non-verbal reasoning ability and better socio-emotional outcomes (more prosocial behaviour and behavioural self-regulation and fewer peer problems).
• More hours spent in informal individual ECEC (e.g. relatives, friends, neighbours) was associated with higher verbal ability (language development).
• More hours spent in formal individual ECEC (i.e. childminders) was associated with lower levels of emotional symptoms (e.g. nervousness, worries).
• Children with high levels of formal group ECEC aged two to four (greater than 35 hours per week) had higher levels of conduct problems than would be expected, controlling for demographic and home environment factors. This group (N = 117) made up 2.98% of the sample. However, comparison with the SEED results at age three suggest that the severity of the impact is reduced over time.
• In most cases the effects of ECEC use did not differ according to family disadvantage, neighbourhood deprivation, or region. The one exception was that the beneficial effect of formal individual ECEC (i.e. childminders) use on children’s emotional symptoms was statistically significant only in the moderately disadvantaged group. In all other cases where ECEC use had a positive benefit for cognitive and socio-emotional outcomes at age four this was not dependent on a child’s family disadvantage level. However, given the lower starting point among disadvantaged children (Speight et al., 2015), ECEC may be of particular importance for these groups.
• Increased time spent in ECEC in both PVI and maintained settings was associated
with cognitive benefits, and ECEC received in PVI settings was also associated with socio-emotional benefits. The evidence was inconclusive regarding the benefit of maintained ECEC to children’s socio-emotional outcomes.

39
Introduction
This chapter considers the relationship between the amount and type of early ECEC use aged two to four and children’s cognitive and socio-emotional outcomes at age four. Furthermore, the chapter aims to consider whether any relationships between ECEC use and developmental outcomes are moderated by family disadvantage. These analyses examine the type and quantity of the ECEC which children receive. The effects of ECEC quality are discussed in Chapter 5.
Methods
Measuring child development at four years of age
Child developmental outcomes were assessed at the Wave 3 interview when the children were aged four. Cognitive development was measured for verbal and non-verbal ability using the British Ability Scales (BAS; Elliot, Smith, & McCulloch, 2011). As a direct measure of an aspect of children’s self-regulation the HTKS (“head, toes, knees, shoulders”) task (Ponitz et. al., 2008) was used. Socio-emotional development was measured using the Strengths and Difficulties Questionnaire (SDQ) and three additional scales as used in the Millennium Cohort Study and the National Evaluation of Sure Start. The socio-emotional measures were derived from parental report. Further detail for these measures is available in Chapter 2. Summary statistics for the outcome variables are given in Table 5.37
Classifying ECEC use
For the purposes of these analyses a three-way classification of ECEC was adopted:
1. Formal group ECEC, e.g. in day nurseries, nursery class, nursery school, playgroup.
2. Formal individual ECEC, i.e. with childminders. 3. Informal individual ECEC, with relatives, friends, neighbours or nannies.
Analysis
Of the 3,930 children seen at Wave 2, 3,803 (96.8%) had results for Naming Vocabulary, 3,817 (97.1%) had results for Picture Similarities, 3,672 (93.4%) had results from the HTKS task and 3,904 (99.3%) had a parental report from which the eight socio-emotional scales were derived. The mean values of the outcome variables are given in Table 5, for
37 Further details are available in the Technical Report.

40
all children and separately by disadvantage group. The findings suggest differences in scores between the disadvantage groups, with the least disadvantaged group showing fewest difficulties and higher socio-emotional strengths and cognitive scores.
Table 5: Mean of outcome variables, broken down by disadvantage group.
Outcome All
children N = 3930
Most disadvantaged
group N = 958
Moderately disadvantaged
group N = 1398
Least disadvantaged
group N = 1574
SDQ Total difficulties 9.09 9.31 9.07 8.97 SDQ Hyperactivity 3.64 4.34 3.68 3.19 SDQ Emotional Symptoms 1.61 1.91 1.65 1.39 SDQ Conduct Problems 2.31 2.90 2.32 1.94 SDQ Peer Problems 1.31 1.69 1.33 1.06 SDQ Prosocial Scale 8.15 7.92 8.20 8.25 Behavioural Self-regulation 7.32 6.90 7.35 7.54 Emotional Self-regulation 6.44 5.81 6.38 6.87 Co-operation Scale 7.81 7.42 7.84 8.04 BAS Naming Vocabulary 56.08 52.50 54.91 59.22 BAS Picture Similarities 52.36 48.97 51.74 54.91 HTKS Score (self-regulation) 18.85 14.09 17.59 22.71 The analyses use multiple imputation to control for the presence of missing data in the outcome variables and the covariates. The imputation model included all outcome variables, home environment variables, demographic covariates and ECEC usage data. Ten imputed data sets were generated and used for all statistical models, and the results were combined. Further details of the multiple imputation process are given in the Technical Report.
The analyses were principally interested in the association between amount of ECEC of differing types used by children between age two and age four and children’s outcomes at age four.38 Partly because legislation is particularly focussed on ECEC from age two upwards and also because there is a high correlation between amount of ECEC use aged one to two and amount of ECEC use aged two to four, these analysis models did
38 Because the data were clustered, linear mixed-effects regression models were used in all cases. Random effects were fitted for government region, for stratum within government region and for primary sampling unit within stratum. Models were unweighted as analyses were not concerned with population prevalence rates.
41
not control for earlier ECEC use.39 This high correlation indicates considerable continuity of ECEC use over time.
All models controlled for six home environment measures, and fourteen demographic measures, further details of which are available in Chapter 2. These initial models also tested for interaction effects between ECEC usage and disadvantage group, region and area deprivation (IMD).
A note on statistical significance and effect sizes
Statistical models give us two sorts of information: information about effect sizes and information about statistical significance.
As an example of an effect size, a statistical model may tell us that a certain outcome variable increases by 0.2 units for every 10 hour per week increase in the amount of out of home ECEC that a child has received.
However, in addition to the systematic relationships between the variables we have measured, the data also contains random variation. For this reason, the confidence that we can place on the effects we estimate varies according to the sample size, the size of the effects and the amount of random “noise” in the data. In order to draw firm conclusions, we need to be confident that a particular effect did not arise by chance. When this is the case, we say that an effect is statistically significant, or significantly different from zero. That is, whilst there is always uncertainty in the exact value of an effect, we can be sufficiently confident that a particular effect is not due to chance alone.
We can also test whether two different effects are significantly different; that is, whether we can be confident that the difference between the size of the two effects is real, or whether an apparent difference between the size of the two effects could be due to chance alone.
Results
Results by amount of ECEC use
The numbers of children using ECEC of each type aged two to four are shown in Table 6. Almost all children included in this sample (99%) participated in some sort of formal group ECEC between age two and four.
39 Because of the high correlation between ECEC use aged one to two and ECEC use aged two to four, a model including both sets of covariates would be subject to multicollinearity, making model interpretation difficult.

42
Table 6: Numbers of children using formal group, formal individual and informal individual ECEC aged two to four.
Type of ECEC N % Formal group 3875 98.6 Formal individual (childminders) 505 12.8 Informal individual (relatives, friends etc.) 2045 52.0
Child outcomes were analysed in terms of the amount (mean hours per week) of ECEC use in three categories: formal group ECEC, formal individual ECEC and informal individual ECEC. Analyses controlled for home environment and demographic measures. Seven of the 12 outcomes showed statistically significant associations with time spent in ECEC aged two to four years. A summary of the results is shown in Table 7.

43
Table 7: Summary of associations between children’s time (hours per week) in ECEC aged two to four and children’s outcomes at age four.
Child outcome Type of early education and care (ECEC)
Formal ECEC Informal ECEC Group Childminders Relatives, friends, nannies
Cognitive development Naming Vocabulary (verbal) +0.014 +0.053 +0.048* Picture Similarities (non-verbal) +0.044* +0.048 +0.010 Self-regulation direct assessment HTKS Task (self-regulation) +0.018 +0.045 +0.007 Socio-emotional problems SDQ Total Difficulties -0.014 -0.018 +0.035 Hyperactivity +0.001 +0.005 +0.036 Emotional Symptoms -0.025 -0.073* +0.007 Conduct Problems +0.044*‡ +0.032 +0.036 Peer Problems -0.087*** -0.043 +0.021 Socio-emotional strengths Prosocial Behaviour +0.041* +0.048 -0.012 Behavioural Self-regulation +0.056** +0.047 +0.008 Emotional Self-regulation -0.018 -0.028 -0.020 Co-operation +0.018 +0.014 -0.010 Sample size = 3,930. Table displays coefficients for the associations between hours of each type of ECEC and each outcome. Statistically significant coefficients are shown in bold italics, the level of significance is indicated by stars: * = p < .05, ** = p < .01, *** = p < .001. Coefficients give the change in the standardized outcome corresponding to a 10 hour per week change in the ECEC use covariate. For cognitive development and socio-emotional strengths, higher scores are a positive outcome, and a positive association (+) indicates that more hours in ECEC is associated with improvement in this outcome. For socio-emotional problems, lower scores are a positive outcome, and a negative association (-) indicates that more hours in ECEC is associated with improvement in this outcome.
A larger value is indicative of a stronger association between the two variables. Analyses controlled for home environment and demographic characteristics. ‡ Later subgroup analysis identified that this negative association was found only for children with high formal group ECEC use, i.e. over 35 hours per week of term time (2.98% of the sample).
Formal group ECEC (e.g. day nursery, nursery class, nursery school, playgroup)
Higher use of formal group ECEC was associated with higher levels of non-verbal ability (BAS Picture Similarities Score). More hours spent in formal group ECEC was also associated with several better socio-emotional child outcomes, namely higher Prosocial and Behavioural Self-regulation scores and lower levels of Peer Problems.

44
There was also an unfavourable association between more hours spent in formal group ECEC use and higher levels of Conduct Problems. The context for this finding is considered more closely in the following section considering outcomes associated with specific levels of ECEC use.
Formal individual ECEC with childminders
Higher use of formal individual ECEC with childminders was associated with lower levels of Emotional Symptoms. However, subgroup analysis indicated that this effect was confined to the moderately disadvantaged group.
Informal individual ECEC with relatives, friends, neighbours or nannies
More hours spent in informal individual ECEC was associated with higher language ability (BAS Naming Vocabulary).
Outcomes showing no effect of ECEC use
For five of the 12 outcomes analysed there were no statistically significant effects of time spent in ECEC use aged two to four:
1. The HTKS task (self-regulation) 2. SDQ Total Difficulties score 3. SDQ Hyperactivity 4. Emotional Self-regulation 5. Co-operation score
Results by specific levels of ECEC use
Following on from the initial analysis assessing whether the overall amount of ECEC was associated with child outcomes, further analyses considered how outcomes were associated with specific levels of ECEC use.
For this analysis, formal group ECEC use was classified according to eight levels of use, with the lowest level (up to 5 hours per week) used as the reference level. The levels of formal group ECEC use were:
• Five hours or below (reference level) per week • Above 5 hours to 10 hours per week • Above 10 hours to 15 hours per week • Above 15 hours to 20 hours per week • Above 20 hours to 25 hours per week • Above 25 hours to 30 hours per week • Above 30 hours to 35 hours per week • Above 35 hours per week
Because the usage of formal individual and informal individual ECEC was lower, it was necessary to adopt a different set of usage bands for these types of ECEC in order that

45
the numbers of children in each usage band were sufficient for reliable analysis:40
• No ECEC of this type (reference level) • Up to 5 hours per week • Above 5 to 10 hours per week • Above 10 to 20 hours per week • Above 20 hours per week
To reduce the risk of finding spuriously significant results through testing a large number of hypotheses, only outcomes that had significant effects in the initial models were included in this analysis.
Subgroup analysis indicates that although only a few statistically significant relationships are seen between specific ranges of hours per week in ECEC and child outcomes, the direction and size of effects often show generally linear relationships between hours in ECEC and child developmental outcomes, such that more hours in ECEC leads to improved outcomes. Some effects appear to suggest moderate amounts of ECEC have the largest effect on an outcome. However, when looking at specific time categories, it should be noted that these were averaged across two years, and as such the average figure may mask that children may have attended for different weekly durations over time and therefore these findings should be interpreted with caution.
For some outcomes where the relationship appears non-linear, or where effects appear roughly linear but are not seen to be statistically significant this may also relate to the small sample size within certain groups, and therefore a wider margin for error.41
For formal group ECEC, more hours in ECEC does appear to show a generally linear relationship across a number of outcomes, particularly peer problems and behavioural self-regulation where increased hours in ECEC is generally associated with better outcomes. For some outcomes, effect sizes suggest that a moderate amount of time in ECEC appears to show the greatest association with outcomes relative to low use in comparison with lower or higher use. This is particularly seen in non-verbal development where the strongest associations are seen for an average usage between age two to age four of over 20 and up to 25 hours, and for prosocial behaviour where the strongest associations are seen for an average usage between age two to age four of over 25 and up to 30 hours. Finally, some negative outcomes are seen for spending the longest hours in ECEC, specifically spending an average of over 35 hours in formal group ECEC between age two to four is associated with higher conduct problems.
40 Details of the numbers of children in each usage band for each type of ECEC as well as justification for the boundaries of the usage bounds are given in the Technical Report. 41 Sample sizes for each level of ECEC use are given in the Technical Report.
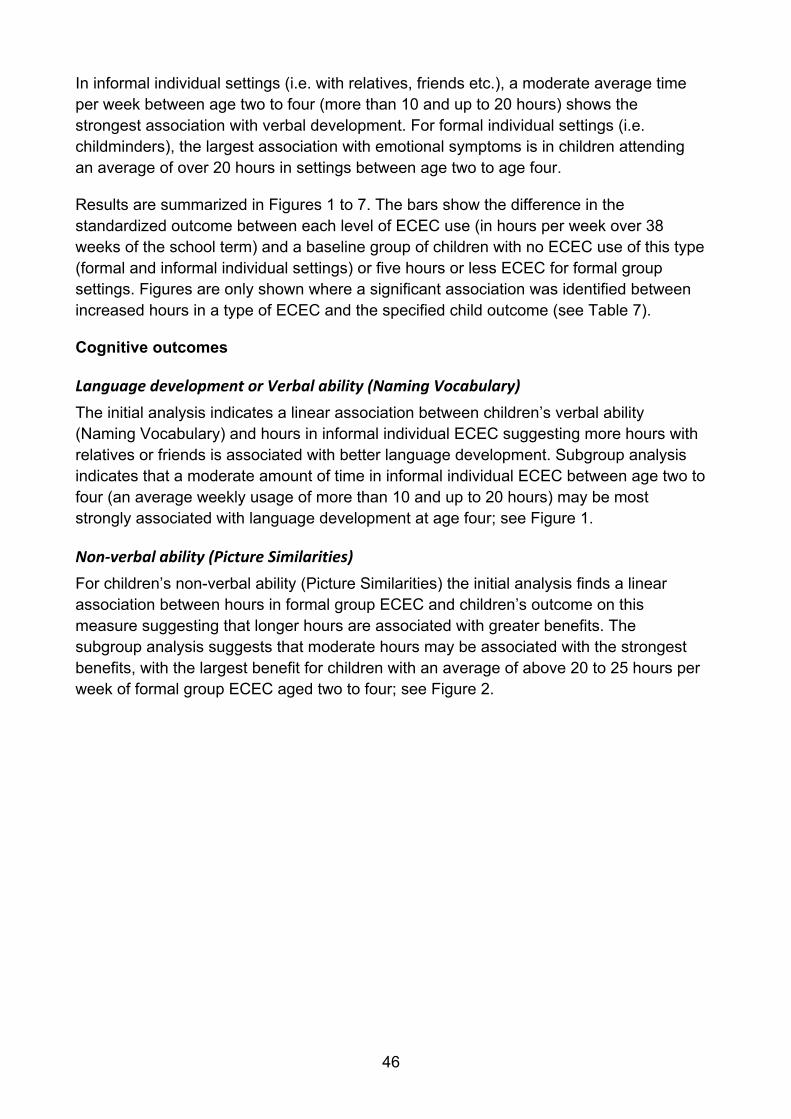
46
In informal individual settings (i.e. with relatives, friends etc.), a moderate average time per week between age two to four (more than 10 and up to 20 hours) shows the strongest association with verbal development. For formal individual settings (i.e. childminders), the largest association with emotional symptoms is in children attending an average of over 20 hours in settings between age two to age four.
Results are summarized in Figures 1 to 7. The bars show the difference in the standardized outcome between each level of ECEC use (in hours per week over 38 weeks of the school term) and a baseline group of children with no ECEC use of this type (formal and informal individual settings) or five hours or less ECEC for formal group settings. Figures are only shown where a significant association was identified between increased hours in a type of ECEC and the specified child outcome (see Table 7).
Cognitive outcomes
Language development or Verbal ability (Naming Vocabulary) The initial analysis indicates a linear association between children’s verbal ability (Naming Vocabulary) and hours in informal individual ECEC suggesting more hours with relatives or friends is associated with better language development. Subgroup analysis indicates that a moderate amount of time in informal individual ECEC between age two to four (an average weekly usage of more than 10 and up to 20 hours) may be most strongly associated with language development at age four; see Figure 1.
Non-verbal ability (Picture Similarities) For children’s non-verbal ability (Picture Similarities) the initial analysis finds a linear association between hours in formal group ECEC and children’s outcome on this measure suggesting that longer hours are associated with greater benefits. The subgroup analysis suggests that moderate hours may be associated with the strongest benefits, with the largest benefit for children with an average of above 20 to 25 hours per week of formal group ECEC aged two to four; see Figure 2.

47
Figure 1: Association of ECEC use aged two to four and children’s Naming Vocabulary at age four.
Sample size = 3,930. The plot shows the effect on the standardized outcome of specific mean weekly usage bands of informal individual ECEC compared to a reference group of children with no ECEC usage of this kind. 95% confidence intervals are shown by error bars. Models control for home environment and demographic covariates. Statistically significant effects are shown in bold.

48
Figure 2: Association of ECEC use aged two to four and children’s Picture Similarities score at age four.
Sample size = 3,930. The plot shows the effect on the standardized outcome of specific mean weekly usage bands of formal group ECEC compared to a reference group of children with up to 5 hours per week of formal group ECEC. 95% confidence intervals are shown by error bars. Models control for home environment and demographic covariates. Statistically significant effects are shown in bold.

49
Socio-emotional outcomes
Emotional Symptoms Average hours in formal individual ECEC (with childminders) was associated with lower levels of Emotional Symptoms. The relationship is approximately linear suggesting more hours with childminders is associated with lower emotional symptoms. Significant benefits on this outcome are largest among the highest use group (an average of over 20 hours between age two to age four) but also found even in the lowest use group, which has a mean of up to 5 hours per week of formal individual ECEC aged two to four; see Figure 3.
Conduct Problems Higher levels of Conduct Problems were only statistically significantly associated with children having had a particularly high level of formal group ECEC use aged two to four (more than 35 hours per week averaged over the 38 weeks of the school terms). The outcomes for this small subgroup of high ECEC use are likely to be driving the overall linear effects seen in the initial analysis; see Figure 4.
Peer Problems The relationship between hours spent in formal group ECEC aged two to four and children’s Peer Problems at age four is broadly linear, with more hours in formal group ECEC associated with lower levels of Peer Problems. Children with a mean weekly usage of over 20 hours aged two to four generally showed benefits on this outcome; see Figure 5.
Prosocial Behaviour The initial model shows a linear association between increased hours in formal group ECEC aged two to four and higher levels of Prosocial Behaviour at age four. The subgroup analysis broadly supports this finding, although the largest associations are seen among children with a moderate average weekly usage between age two to four (over 25 and up to 30 hours); see Figure 6.
Behavioural Self-Regulation The initial model indicates a linear association between increased hours in formal group ECEC aged two to four and higher levels of Behavioural Self-regulation. The subgroup analysis supports this finding with increasing effect sizes with increasing hours in ECEC, although the effects were only statistically significant for children attending an average of over 35 hours of formal group ECEC between age two to four; see Figure 7.

50
Figure 3: Association of ECEC use aged two to four and children’s SDQ Emotional Symptoms at age four.
Sample size = 3,930. The plot shows the effect on the standardized outcome of specific mean weekly usage bands of formal individual ECEC compared to a reference group of children with no ECEC usage of this kind. 95% confidence intervals are shown by error bars. Models control for home environment and demographic covariates. Statistically significant effects are shown in bold.
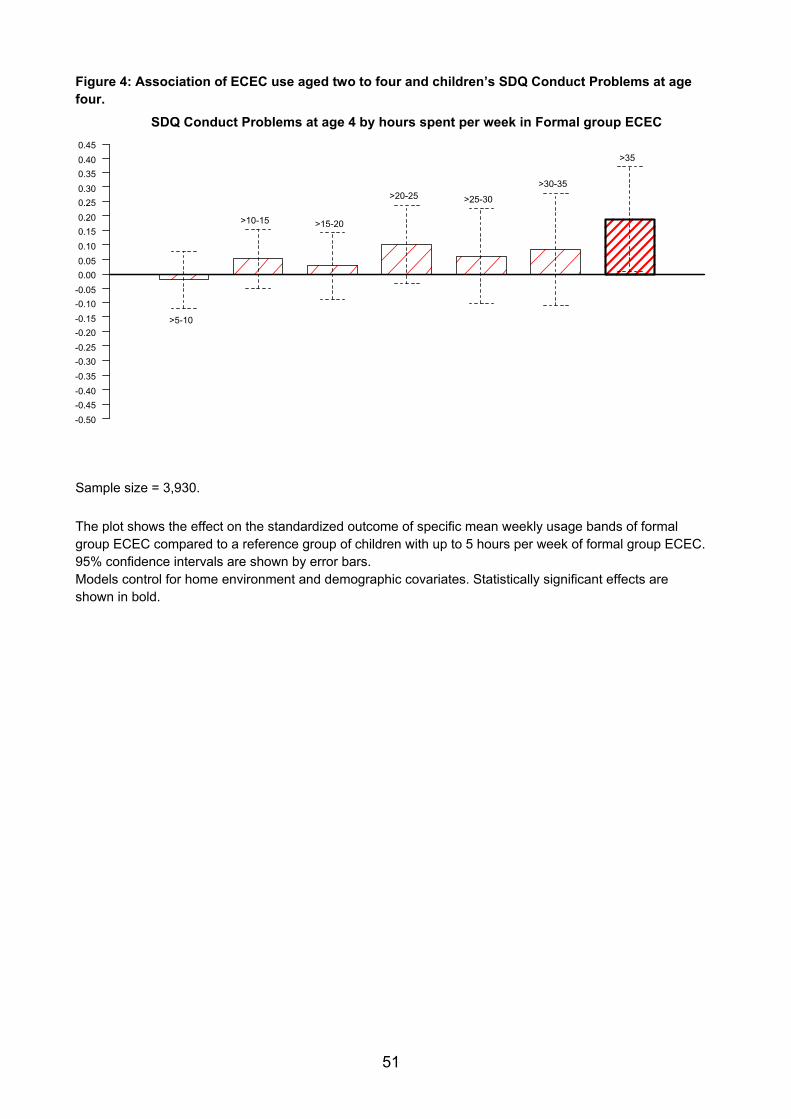
51
Figure 4: Association of ECEC use aged two to four and children’s SDQ Conduct Problems at age four.
Sample size = 3,930. The plot shows the effect on the standardized outcome of specific mean weekly usage bands of formal group ECEC compared to a reference group of children with up to 5 hours per week of formal group ECEC. 95% confidence intervals are shown by error bars. Models control for home environment and demographic covariates. Statistically significant effects are shown in bold.

52
Figure 5: Association of ECEC use aged two to four and children’s SDQ Peer Problems at age four.
Sample size = 3,930. The plot shows the effect on the standardized outcome of specific mean weekly usage bands of formal group ECEC compared to a reference group of children with up to 5 hours per week of formal group ECEC. 95% confidence intervals are shown by error bars. Models control for home environment and demographic covariates. Statistically significant effects are shown in bold.

53
Figure 6: Association of ECEC use aged two to four and children’s SDQ Prosocial Scale at age four.
Sample size = 3,930. The plot shows the effect on the standardized outcome of specific mean weekly usage bands of formal group ECEC compared to a reference group of children with up to 5 hours per week of formal group ECEC. 95% confidence intervals are shown by error bars. Models control for home environment and demographic covariates. Statistically significant effects are shown in bold.
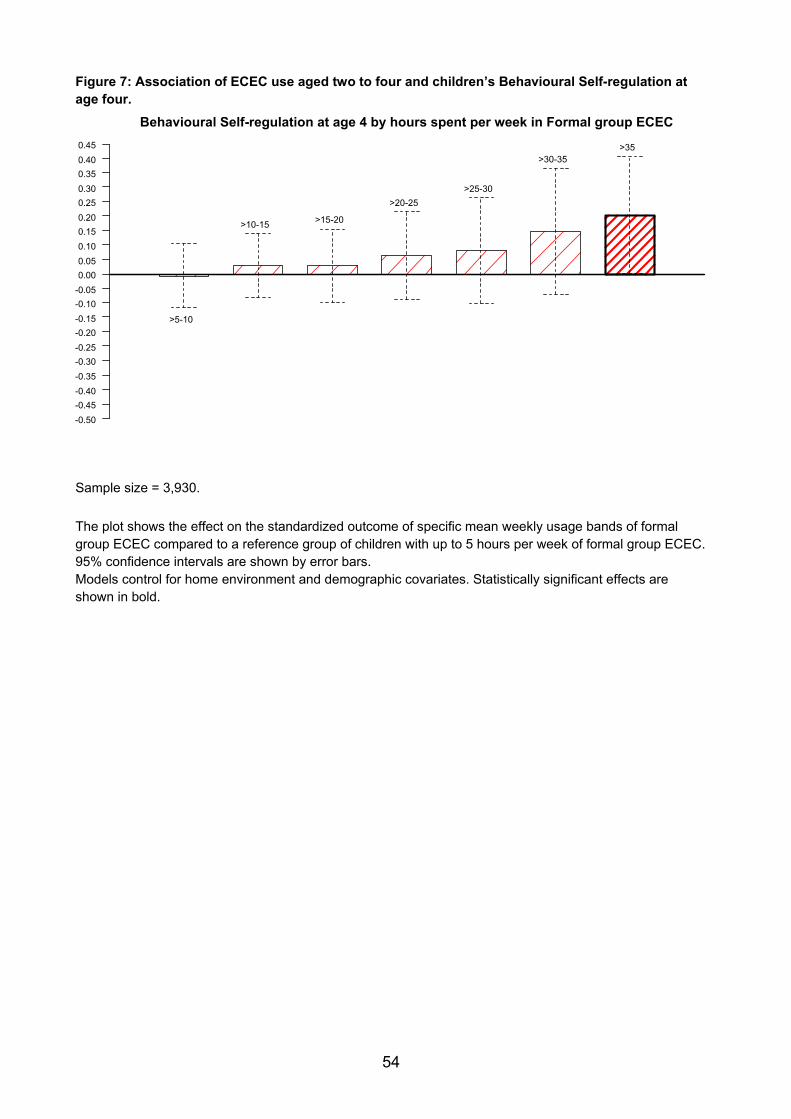
54
Figure 7: Association of ECEC use aged two to four and children’s Behavioural Self-regulation at age four.
Sample size = 3,930. The plot shows the effect on the standardized outcome of specific mean weekly usage bands of formal group ECEC compared to a reference group of children with up to 5 hours per week of formal group ECEC. 95% confidence intervals are shown by error bars. Models control for home environment and demographic covariates. Statistically significant effects are shown in bold.

55
Investigating outcomes for children with high formal group ECEC use
In further investigation of the relationship observed between more hours spent in formal group ECEC between age two and four and conduct problems at age four, it was observed that only high formal group ECEC use between the ages of two and four (more than 35 hours per week) was statistically significantly associated with higher levels of SDQ Conduct Problems at age four in controlled regression models. There were 117 children with this high level of formal group ECEC use, making up 2.98% of the sample.
To further understand this finding, a comparison of child outcomes at age four between children with high formal group ECEC use and other children is shown in Table 8.
Table 8: Comparison of child outcomes at age four between children with high formal group ECEC use aged two to four (more than 35 hours per week) and all other children.
Outcome All other children
(N = 3813) High formal ECECE
use children (N = 117) p-value from Wilcoxon test Mean SD Mean SD
SDQ Total difficulties 9.10 5.40 8.66 5.87 0.158 SDQ Hyperactivity 3.66 2.34 3.21 2.52 0.008 ** SDQ Emotional Symptoms 1.62 1.54 1.29 1.29 0.029 * SDQ Conduct Problems 2.31 1.90 2.14 1.83 0.355 SDQ Peer Problems 1.32 1.49 0.87 1.36 <0.001 *** SDQ Prosocial Scale 8.14 1.78 8.43 1.60 0.094 Behavioural Self-regulation 7.30 1.80 7.78 1.77 0.004 ** Emotional Self-regulation 6.43 2.15 6.81 1.98 0.091 Co-operation Scale 7.81 1.75 8.03 1.84 0.093 BAS Naming Vocabulary 56.02 12.13 57.89 12.79 0.030 * BAS Picture Similarities 52.29 12.41 54.62 13.40 0.055 HTKS Score (self-regulation) 18.66 18.53 25.12 19.33 <0.001 ***
The p-value from the Wilcoxon test shows whether there is a statistically significant difference between the means in the two groups. Statistically significant differences are marked: * = p < 0.05, ** = p < 0.01, *** = p < 0.001. The findings suggest that children with high formal group ECEC use tend to have lower levels of Hyperactivity, Emotional Symptoms and Peer Problems than other children, higher levels of Behavioural Self-regulation and better cognitive performance on verbal ability (Naming Vocabulary) and the HTKS (self-regulation) task. Note that in contrast to the results of the models reported in the rest of this chapter, these comparisons do not control for demographic or home environment variables, in order to make clear the contextual differences between the high formal group ECEC subsample and the rest of the sample. It is notable that although more use of formal ECEC is related to higher Conduct Problems, there is no significant difference between the levels of Conduct Problems among high formal group ECEC use children and other children in these uncontrolled comparisons. This may relate to characteristics of the high formal group
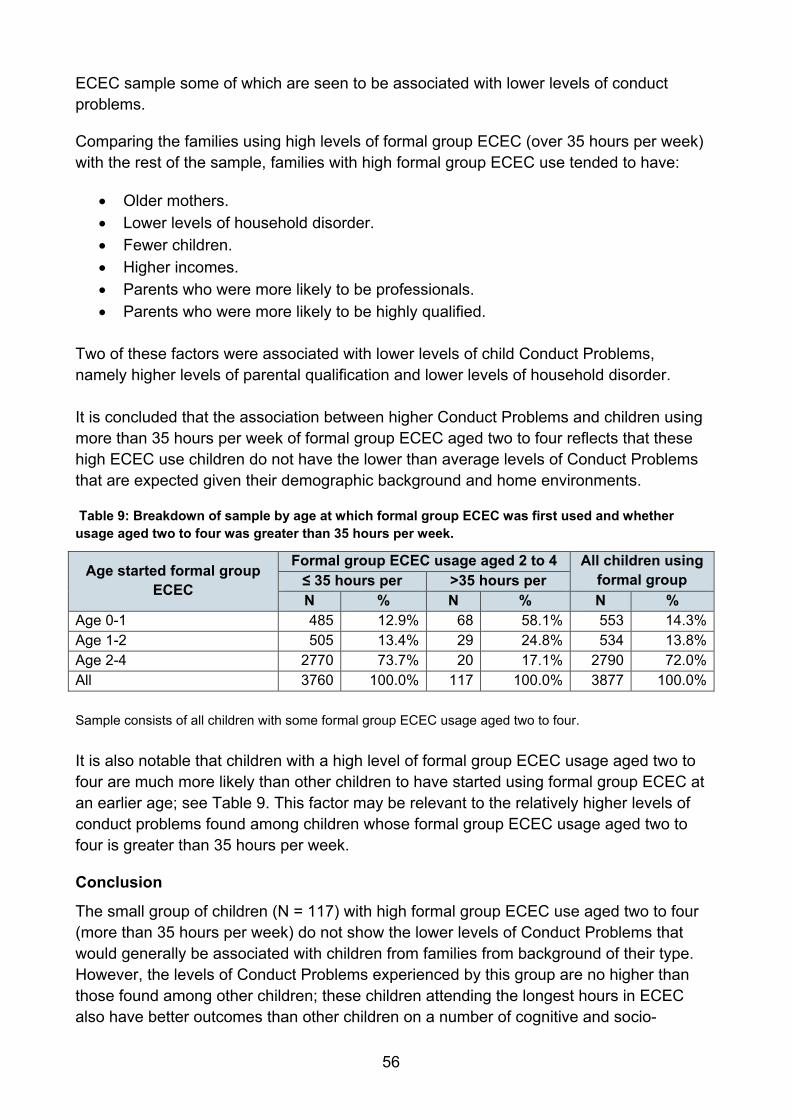
56
ECEC sample some of which are seen to be associated with lower levels of conduct problems.
Comparing the families using high levels of formal group ECEC (over 35 hours per week) with the rest of the sample, families with high formal group ECEC use tended to have:
• Older mothers. • Lower levels of household disorder. • Fewer children. • Higher incomes. • Parents who were more likely to be professionals. • Parents who were more likely to be highly qualified.
Two of these factors were associated with lower levels of child Conduct Problems, namely higher levels of parental qualification and lower levels of household disorder. It is concluded that the association between higher Conduct Problems and children using more than 35 hours per week of formal group ECEC aged two to four reflects that these high ECEC use children do not have the lower than average levels of Conduct Problems that are expected given their demographic background and home environments.
Table 9: Breakdown of sample by age at which formal group ECEC was first used and whether usage aged two to four was greater than 35 hours per week.
Age started formal group ECEC
Formal group ECEC usage aged 2 to 4 All children using formal group
≤ 35 hours per
>35 hours per
N % N % N % Age 0-1 485 12.9% 68 58.1% 553 14.3% Age 1-2 505 13.4% 29 24.8% 534 13.8% Age 2-4 2770 73.7% 20 17.1% 2790 72.0% All 3760 100.0% 117 100.0% 3877 100.0% Sample consists of all children with some formal group ECEC usage aged two to four. It is also notable that children with a high level of formal group ECEC usage aged two to four are much more likely than other children to have started using formal group ECEC at an earlier age; see Table 9. This factor may be relevant to the relatively higher levels of conduct problems found among children whose formal group ECEC usage aged two to four is greater than 35 hours per week.
Conclusion
The small group of children (N = 117) with high formal group ECEC use aged two to four (more than 35 hours per week) do not show the lower levels of Conduct Problems that would generally be associated with children from families from background of their type. However, the levels of Conduct Problems experienced by this group are no higher than those found among other children; these children attending the longest hours in ECEC also have better outcomes than other children on a number of cognitive and socio-

57
emotional measures, which may in part be explained by their family demographic characteristics but are to at least some extent also explained by more hours in ECEC, for example there is a statistically significant relationship between spending over 35 hours in formal group ECEC and reduced peer problems, when controlling for demographic and home environment factors.
Investigating outcomes by disadvantage, deprivation and region
Disadvantage
Analysis investigated whether the associations between ECEC use for each type of ECEC and child outcomes were similar across the disadvantage groups (most disadvantaged 20%, moderately disadvantaged 20-40% and least disadvantaged 60%). With one exception, the amount of ECEC used was associated with similar effects on children’s outcomes, regardless of their level of disadvantage. A statistically significant difference between the disadvantage groups was found in one instance. Investigation of the interaction found between amount of formal individual ECEC and disadvantage for Emotional Symptoms indicated that increased hours in formal individual ECEC (with childminders) was associated with lower levels of Emotional Symptoms for children in the moderately disadvantaged group (see Table 10) whilst there was no statistically significant association in the most disadvantaged or the least disadvantaged group.
Table 10: Summary of associations between children’s time in formal individual ECEC (mean hours per week) aged two to four and children’s Emotional Symptoms at age four.
Child outcome
Effect of formal individual ECEC (with childminders) Disadvantage group
20% most disadvantaged
20-40% most disadvantaged
60% least disadvantaged
Sample size 958 1,398 1,574 Socio-emotional
Emotional Symptoms -0.030 -0.162*** +0.020 Table displays coefficients for the statistically significant associations between hours of formal individual ECEC and the outcome (* = p < .05, ** = p < .01, *** = p < .001). Coefficients give the change in the standardized outcome corresponding to a 10 hour per week change in the ECEC use covariate.
For emotional symptoms, lower scores are a positive outcome and a negative association (-) indicates that more hours in ECEC is associated with an improvement in this outcome.
Index of Multiple Deprivation (IMD)
Analysis tested for associations between the impact of more ECEC use and level of area deprivation as measured by the Index of Multiple Deprivation (IMD) based on family postcode. No significant interactions were found. It was concluded that there was no evidence that the associations between ECEC use and child outcomes differed by area deprivation such that ECEC was associated with similar outcomes for children across all levels of deprivation.
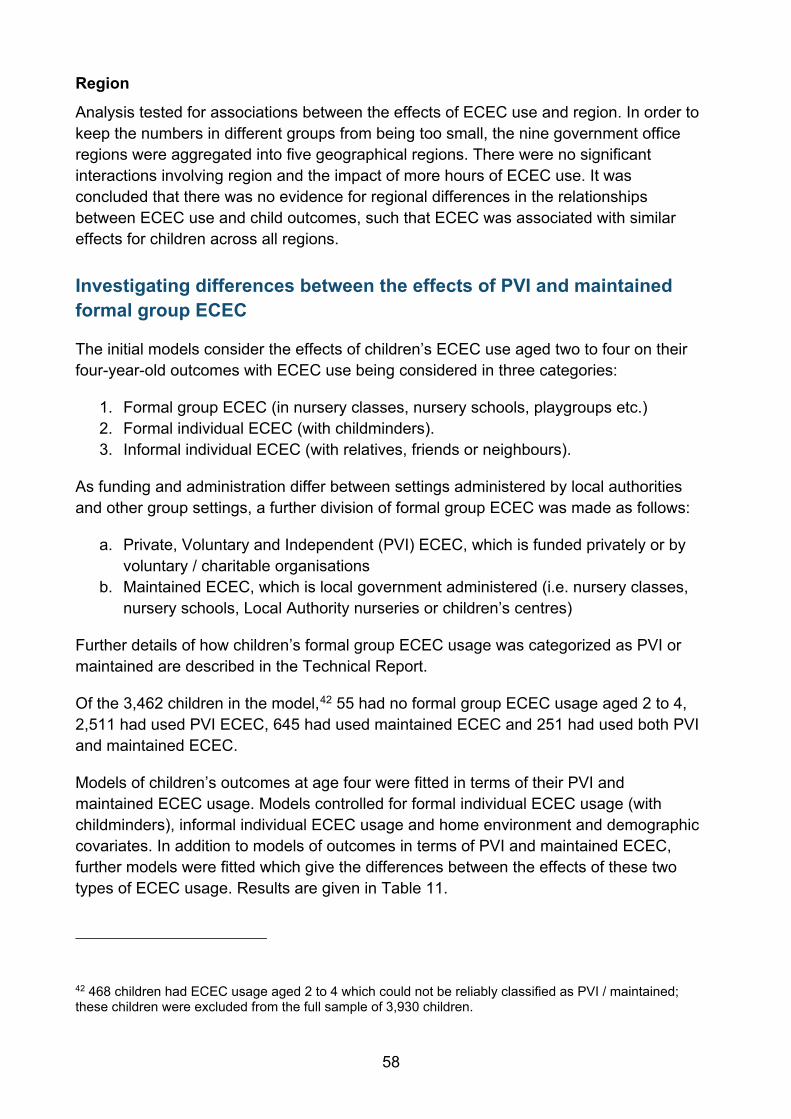
58
Region
Analysis tested for associations between the effects of ECEC use and region. In order to keep the numbers in different groups from being too small, the nine government office regions were aggregated into five geographical regions. There were no significant interactions involving region and the impact of more hours of ECEC use. It was concluded that there was no evidence for regional differences in the relationships between ECEC use and child outcomes, such that ECEC was associated with similar effects for children across all regions.
Investigating differences between the effects of PVI and maintained formal group ECEC
The initial models consider the effects of children’s ECEC use aged two to four on their four-year-old outcomes with ECEC use being considered in three categories:
1. Formal group ECEC (in nursery classes, nursery schools, playgroups etc.) 2. Formal individual ECEC (with childminders). 3. Informal individual ECEC (with relatives, friends or neighbours).
As funding and administration differ between settings administered by local authorities and other group settings, a further division of formal group ECEC was made as follows:
a. Private, Voluntary and Independent (PVI) ECEC, which is funded privately or by voluntary / charitable organisations
b. Maintained ECEC, which is local government administered (i.e. nursery classes, nursery schools, Local Authority nurseries or children’s centres)
Further details of how children’s formal group ECEC usage was categorized as PVI or maintained are described in the Technical Report.
Of the 3,462 children in the model,42 55 had no formal group ECEC usage aged 2 to 4, 2,511 had used PVI ECEC, 645 had used maintained ECEC and 251 had used both PVI and maintained ECEC.
Models of children’s outcomes at age four were fitted in terms of their PVI and maintained ECEC usage. Models controlled for formal individual ECEC usage (with childminders), informal individual ECEC usage and home environment and demographic covariates. In addition to models of outcomes in terms of PVI and maintained ECEC, further models were fitted which give the differences between the effects of these two types of ECEC usage. Results are given in Table 11.
42 468 children had ECEC usage aged 2 to 4 which could not be reliably classified as PVI / maintained; these children were excluded from the full sample of 3,930 children.
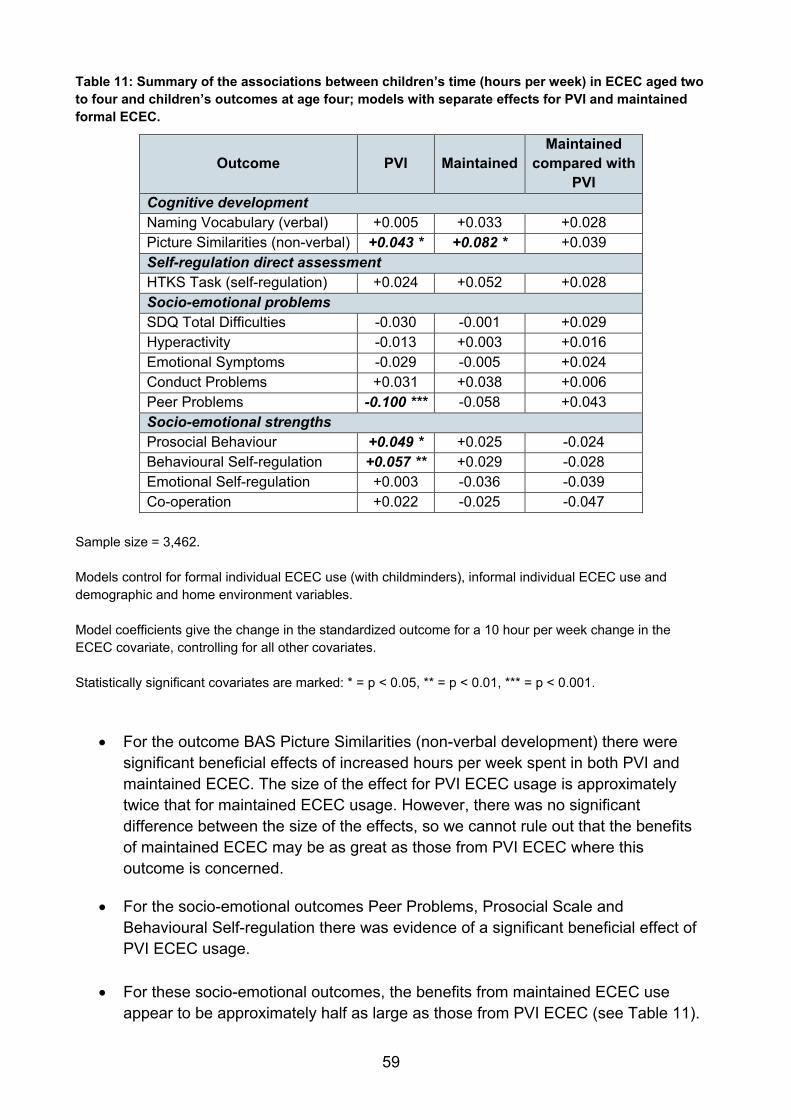
59
Table 11: Summary of the associations between children’s time (hours per week) in ECEC aged two to four and children’s outcomes at age four; models with separate effects for PVI and maintained formal ECEC.
Outcome PVI Maintained Maintained
compared with PVI
Cognitive development Naming Vocabulary (verbal) +0.005 +0.033 +0.028 Picture Similarities (non-verbal) +0.043 * +0.082 * +0.039 Self-regulation direct assessment HTKS Task (self-regulation) +0.024 +0.052 +0.028 Socio-emotional problems SDQ Total Difficulties -0.030 -0.001 +0.029 Hyperactivity -0.013 +0.003 +0.016 Emotional Symptoms -0.029 -0.005 +0.024 Conduct Problems +0.031 +0.038 +0.006 Peer Problems -0.100 *** -0.058 +0.043 Socio-emotional strengths Prosocial Behaviour +0.049 * +0.025 -0.024 Behavioural Self-regulation +0.057 ** +0.029 -0.028 Emotional Self-regulation +0.003 -0.036 -0.039 Co-operation +0.022 -0.025 -0.047
Sample size = 3,462. Models control for formal individual ECEC use (with childminders), informal individual ECEC use and demographic and home environment variables. Model coefficients give the change in the standardized outcome for a 10 hour per week change in the ECEC covariate, controlling for all other covariates. Statistically significant covariates are marked: * = p < 0.05, ** = p < 0.01, *** = p < 0.001.
• For the outcome BAS Picture Similarities (non-verbal development) there were significant beneficial effects of increased hours per week spent in both PVI and maintained ECEC. The size of the effect for PVI ECEC usage is approximately twice that for maintained ECEC usage. However, there was no significant difference between the size of the effects, so we cannot rule out that the benefits of maintained ECEC may be as great as those from PVI ECEC where this outcome is concerned.
• For the socio-emotional outcomes Peer Problems, Prosocial Scale and Behavioural Self-regulation there was evidence of a significant beneficial effect of PVI ECEC usage.
• For these socio-emotional outcomes, the benefits from maintained ECEC use appear to be approximately half as large as those from PVI ECEC (see Table 11).

60
However, these results are not significantly different from “no effect”, nor are they significantly different from the results for PVI ECEC use. In other words, on the one hand we cannot conclude that maintained ECEC is providing any benefit to children where these outcomes are concerned, but on the other hand the benefit could be as large as that from using PVI ECEC. The uncertainty of the conclusions concerning the benefits of maintained ECEC use can in part be attributed to the relatively small number of children in the sample using this type of ECEC.43
Chapter conclusions
These analyses offer good evidence that the amount of ECEC that children receive between the ages of two and four is associated with a number of positive effects on cognitive and socio-emotional outcomes measured at age four although variation is seen according to the type of ECEC attended44. These associations were present after controlling for a number of home environment and demographic measures. Because a wide range of potentially confounding demographic and home environment factors are controlled for in the analyses, it may be cautiously concluded that the associations which are found are likely to result from causation of the outcomes by the use of ECEC.45
The pattern of associations generally indicates that increased hours in ECEC is associated with improved child outcomes, and additional subgroup analyses are presented which for the most part also show that moderate to high levels of ECEC are associated with the best outcomes. However, implications of the effects for specific categories of time are limited. Specifically, hours spent in ECEC each week is averaged over two years and therefore is not able to fully distinguish the duration of use (in terms of weeks) from the intensity of use (in terms of hours per week). Further, significant associations are based on comparison with a reference category of attending no ECEC or less than five hours per week, rather than a comparison to spending slightly shorter or longer hours in ECEC. This limits the extent to which comparisons can be made between different categories of use. Therefore, these findings are most appropriately used to consider overall patterns of outcome (i.e. that more hours in ECEC is generally associated with improved outcomes) rather than to suggest the specific optimum amount of hours to spend in particular settings.
Children’s higher performance on verbal abilities were particularly associated with more hours spent in informal individual ECEC. This is in accord with findings from the SEED
43 See the earlier note on statistical significance and further detail to support interpretation of this finding 44 The benefits of the different types of ECEC are regardless of other types of ECEC received given that usage of other types is controlled in the models. 45 An alternative explanation would be that children’s socio-emotional and cognitive attributes are influencing the amount and type of ECEC which parents choose for them. Whilst effects of this type are probably present to some extent, we suggest that this is unlikely to be the main cause of the associations found. Further discussion of the issue of causality is given in the Technical Report.

61
impact age three report (Melhuish et al., 2017) and findings from Millennium Cohort Study data, looking in particular at grandparent care, which was linked with a higher vocabulary at age three years (Hansen & Hawkes, 2009). This suggests that the cognitive benefits of informal ECEC seen at age three continue at age four. This finding may relate to previous indications that high quality adult-child interactions are particularly important in speech and language development (Melhuish et al., 2017). The association between childminder use and verbal development seen at age three in SEED (Melhuish et al., 2017) is not seen in the present findings, suggesting the impact of childminder use on verbal development may be most influential at age two to three. However, it is also of note that although they were not statistically significant, the effects reported for childminder provision on a number of outcomes at age four, particularly for cognitive development, were similar in size to those which were statistically significant in the other types of provision. This may suggest there could still be small benefits of childminder provision, which do not reach statistical significance because of the small number of children in the childminder group relative to the group sizes in formal group or informal individual settings. In line with the SEED impact age three report (Melhuish et al., 2017), there was no association between hours spent in formal group settings and verbal development. Although short term language benefits of group settings are not yet seen in SEED, language outcomes in the longer term once children start school will be considered in future SEED reports. Given the importance of language development, future research should consider ways in which practice can be enhanced to increase language development in children attending group settings. Although benefits of group ECEC for language are not yet seen in SEED, a number of other areas of socio-emotional and cognitive development, which are also important for longer term outcomes, are shown to benefit from group ECEC. These are discussed below.
Higher performance on non-verbal cognitive abilities were particularly associated with more hours in formal group settings (nursery classes, nursery schools, playgroups and day nurseries). This finding of the beneficial effects of time in group care settings on non-verbal ability may be compared with that of an earlier UK longitudinal study which found that, controlling for other factors, higher cognitive development and particularly non-verbal ability was associated with an earlier start in group care and with more hours per week in group care from 0 to 51 months (Barnes & Melhuish, 2016). The earlier SEED impact age three report did not find a relationship between formal group ECEC and non-verbal development at age three (Melhuish et al., 2017), suggesting that non-verbal cognitive benefits of formal group ECEC begin to emerge by age four. The finding is also consistent with research from the Effective Provision of Pre-School Education (EPPE) study which found that children who had attended group settings had improved cognitive performance, including non-verbal reasoning (Sylva et. al., 2004), although EPPE also reported improvements in verbal development which were not seen for formal group ECEC in the SEED study.

62
Better socio-emotional outcomes, particularly reduced peer problems and improved prosocial behaviour and self-regulation were associated with more hours in formal group settings. These results correspond in part with previous research46 that has frequently found beneficial effects associated with more time in formal group ECEC for aspects of socio-emotional development, such as sociability, Prosocial Behaviour and Self-regulation. In comparison with similar socio-emotional benefits seen in the SEED impact age three report, the previously seen association with improved emotional symptoms is no longer observed, although benefits for behavioural self-regulation have emerged which were not seen previously (Melhuish et al., 2017). Variation in impact at age three and age four may relate to different benefits of ECEC at different ages. However differences may also relate to use of different informants for socio-emotional outcomes at each time point given that socio-emotional outcomes were reported by the child’s ECEC provider at age three but were parent reported at age four.47
More hours in formal individual ECEC (i.e. childminders) was associated with improved emotional symptoms, although subgroup analyses indicated that this was only significant among the moderately disadvantaged group. The previous impact age three report also indicated that attending childminders between ages two to three was associated with improved emotional symptoms, as well as improved behavioural self-regulation outcomes (Melhuish et al., 2017). The latter effect is no longer observed at age four, which may suggest that some of the early socio-emotional benefits associated with attending childminder settings are not sustained in the longer term. However, this difference between reports may again relate to use of provider reported outcomes at age three and parent reported outcomes at age four, or may again relate to the smaller sample in childminder settings reducing the power to detect small benefits that may be present.
Findings that indicate benefits from hours in childminder provision and informal (home) settings are of particular interest given the limited existing research into the effects of ECEC of these types on children’s outcomes; for example, the previous EPPE study did not include a measure of time spent with childminders.
The small group of children (N = 117) having an average of over 35 hours per week of formal group ECEC aged two to four showed in controlled models higher levels of Conduct Problems as compared to children with up to five hours per week of formal group ECEC. There was no absolute difference between the level of Conduct Problems in this group and those of other children, rather they failed to show the lower levels of Conduct Problems that would have been expected given the demographic characteristics and home environment of these children (i.e. that they generally came from higher qualified families with lower levels of household disorder, which are seen to be
46 This research is reviewed comprehensively in Melhuish et al. (2015). 47 Teacher/provider reported outcomes were not collected at age four and therefore could not be used for analysis. This point does not apply to the cognitive outcomes which were directly assessed with children at both time points.
63
independently related to behaviour). This should be compared with the situation regarding Conduct Problems at age three of children having more than 35 hours per week of formal group ECEC aged two to three. Here, in addition to the association between high levels of Conduct Problems and high ECEC use found in controlled models, Conduct Problems were absolutely higher among the high formal group ECEC use children compared to the level among other children.48 This comparison between the SEED results at age three and age four suggests a reduction over time in the severity of the impact of a high level of formal group ECEC use on Conduct Problems. This is consistent with previous research which has also found higher levels of Conduct Problems associated with greater group ECEC use, but that this association gradually reduced with child age and disappeared during the elementary school years (Melhuish et al., 2010).49 Further, the association between more hours spent in formal group provision and lower emotional self-regulation at age three (Melhuish et al., 2017) is also no longer seen in outcomes at age four, also indicating a reduction over time in the negative impact of time spent in formal ECEC.
There was no evidence for difference in the effects of ECEC use by area deprivation (IMD) or by region of the country. This is inconsistent with expectations based on findings from the SEED quality report which did indicate regional variation in quality of group settings (Melhuish & Gardiner, 2017), suggesting that although there may be variation in quality this variation is insufficient to lead to actual differences in observed outcomes. There was limited evidence that the effects of ECEC use differed by disadvantage group; with benefits on the Emotional Symptoms outcome found from time in formal individual ECEC (with childminders) for the moderately disadvantaged group only.
This suggests that, generally speaking, ECEC use has benefits for cognitive and socio-emotional outcomes at age four regardless of a child’s family disadvantage level, the level of disadvantage in their area or the region within which they live. Some previous research, for example in the US, has found that the benefits of ECEC are greater for children from more disadvantaged families (e.g. Reynolds et al., 2011) but other research has found similar effects of ECEC use for different levels of family disadvantage (e.g. the EPPE study, Sylva et al., 2004). Findings from the Millennium Cohort Study also indicated that the benefits of grandparental care on verbal development were only seen for advantaged families and not those who are disadvantaged (Hansen & Hawkes, 2009). Findings in previous research may vary depending on the way in which disadvantage is classified, investigation in different time periods and across countries with differing welfare provision.
48 See “Study of Early Education and Development (SEED): Impact Study on Early Education Use and Child Outcomes up to Age Three, July 2017” https://www.gov.uk/government/uploads/system/uploads/attachment_data/file/627098/SEED_ECEC_impact_at_age_3.pdf 49 Similar results were found in a parallel study in Northern Ireland (Melhuish, et al., 2006).

64
Although the present findings indicate that ECEC is beneficial for children whether or not they are disadvantaged, the baseline SEED report indicates that disadvantaged children had a lower starting point in terms of both language skills and social behaviour (Speight et al., 2015). Furthermore, disadvantaged children have been seen to be less likely to use formal ECEC than those from more advantaged families (DfE, 2017). This indicates that disadvantaged children may have more to gain from ECEC, which can help to close the cognitive and socio-emotional gap between disadvantaged and advantaged children.
Significant benefits for non-verbal cognitive development were associated with increased hours spent in both PVI ECEC and maintained ECEC, while significant benefits for a number of socio-emotional outcomes (increased prosocial behaviour and behavioural self-regulation and reduced peer problems) were associated with increased hours spent in PVI ECEC. The results were inconclusive with regard to the effects of maintained ECEC usage on these socio-emotional outcomes; it was not possible to conclude with confidence that there was any benefit from maintained ECEC usage, on the other hand it could also not be ruled out that the benefits from maintained ECEC usage might be as large as those from PVI ECEC. The recently published SEED quality report (Melhuish & Gardiner, 2017) indicated that the quality of early years provision may be slightly higher in the maintained sector when compared with the PVI sector. However, these impact findings suggest that the small differences in quality between the sectors may not be sufficiently large to lead to observable differences in child outcome.

65
Chapter 4: The quality of formal group ECEC and child outcomes
Key Findings
• Children who attended higher quality formal group ECEC settings between ages three and four tended to have higher levels of non-verbal ability at age four.
• Children who attended higher quality formal group ECEC settings between ages two and four tended to have lower levels of Conduct Problems at age four.
• Finding a smaller number of effects of the quality of childcare used than of the quantity of childcare used may in part be due to the smaller sample size available for the quality analyses.
Introduction
This chapter considers the effects on children’s outcomes measured at age four of the quality of the formal group ECEC that was received between the ages of two and four. Quality assessments were not available for all settings that children had attended. The sample size for these analyses was therefore smaller than for the analyses discussed in Chapters three and five. More detail on the quality study is available in the recent SEED quality report (Melhuish & Gardiner, 2017).
Methods
Because of the intensive nature of the quality observational assessments, a subsample of overall settings attended by children in the study were selected for this component. At Wave 1, the quality of 402 settings attended by children at age two to three was assessed. At Wave 2, the quality of 598 settings attended by children at age three was assessed. A breakdown of the settings by quality band is given in Table 12.

66
Table 12: Summary of the quality of the ECEC settings in the SEED study.
Quality band Wave 1 settings
N = 402 Wave 2 settings
N = 598 SSTEW ITERS-R SSTEW ECERS-R ECERS-E
Inadequate: < 3 12.2 4.0 9.0 2.2 17.2 Minimal: ≥ 3 and < 4 20.1 7.5 17.7 8.9 27.4 Adequate: ≥ 4 and < 5 31.8 22.9 28.9 26.3 28.9 Good: ≥ 5 and < 6 27.1 40.8 29.8 36.0 20.7 Excellent: ≥ 6 8.7 24.9 14.5 26.8 5.7 All 100.0 100.0 100.0 100.0 100.0
Percentage breakdown of the SEED ECEC settings by quality band.
Because only a subsample of settings was assessed for quality, only a subgroup of the main sample of children was able to be included in analysis of quality. Use of a subsample for quality analysis has implications for interpreting the results given that a smaller sample size may make it less likely that small effects may be detected.
The settings for children aged two were assessed using:
• Sustained Shared Thinking and Emotional Well-being Scale (SSTEW) • Infant and Toddler Environment Rating Scale – Revised (ITERS-R)
The settings for children age three were assessed using:
• Sustained Shared Thinking and Emotional Well-being Scale (SSTEW) • Early Childhood Environment Rating Scale – Revised (ECERS-R) • Early Childhood Environment Rating Scale – Extended (ECERS-E)
Further details of these measures are given in Chapter 2.
Analysis
The quality of the formal group ECEC that children had experienced was analysed in three different ways:
1. For children with quality data from Wave 1, the quality of the setting which children had attended at age two was assessed using three different measures:
a. Sustained Shared Thinking and Emotional Well-being Scale (SSTEW). b. Infant and Toddler Environment Rating Scale – Revised (ITERS-R). c. A composite measure of overall quality.50
50 This was the mean of the SSTEW and ITERS-R measures.

67
2. For children with quality data from wave 2, the quality of the setting which children had attended at age three was assessed using four different measures:
a. Sustained Shared Thinking and Emotional Well-being Scale (SSTEW). b. Early Childhood Environment Rating Scale – Revised (ECERS-R). c. Early Childhood Environment Rating Scale – Extended (ECERS-E). d. A composite measure of overall quality.51
3. For children with quality data from Waves 1 and 2, the composite overall quality of the settings which children had attended at age two and at age three.52
In order for there to be a realistic expectation that the quality of settings which children had attended would have an impact on their outcomes it was necessary that children had a significant level of exposure to the settings. In order to meet this requirement the sample was restricted to children who had a mean level of formal group ECEC use aged two to four of at least 10 hours per week.53
Of the children with at least 10 hours per week formal group ECEC use aged two to four, 644 had attended settings with quality assessments at Wave 1, 766 children had attended settings with quality assessments at Wave 2 and 354 children had quality scores from both Wave 1 and Wave 2.
The outcome variables were modelled in terms of each of the quality measures. Models controlled for ECEC use aged two to four (formal group / formal individual / informal individual) and all home environment and demographic measures.54
In order to understand any differences from the full sample, the demographic and home environment variables between children with quality data and those without quality data were compared. There were some differences found between children who did and did not have quality data. In particular, children of Asian ethnicity were under-represented in the quality sample, as were children from larger families and children later in the birth order. Disadvantaged children and lower income families were somewhat over-represented in the age two quality sample. These differences were generally small in magnitude and partly explained by the fact that children were more likely to appear in the quality sample if they had a higher level of formal group ECEC usage.55 Although small,
51 This was extracted from the SSTEW, ECERS-R and ECERS-E measurements using factor analysis. Full details are given in the Technical annex. 52 This was extracted from the SSTEW and ITERS-R measures from Wave 1 and the SSTEW, ECERS-R and ECERS-E measurements from Wave 2 using factor analysis. Full details are given in the Technical annex. 53 See the Technical annex for discussion of the decision to omit children with low formal group ECEC usage from the quality models 54 The demographic covariates were those measured at Wave 2. The home environment variables were the mean of the Wave 1 and Wave 2 values (Home Learning Environment, Household Chaos, Parent’s Psychological Distress and Limit Setting) / the Wave 2 values (MORS Warmth and Invasiveness). 55 Further details are given in the Technical annex.

68
these differences may suggest that the findings in this section might be different if tested across the whole sample.
Results
Results for those outcomes which had statistically significant associations with quality scores are summarized in Table 13. Full results are given in the Technical annex. Table 13: Summary of the associations between the quality of the ECEC settings attended and children’s outcomes at age four.
Quality measure
Child outcome SDQ
Conduct Problems
BAS Picture Similarities
Children with Wave 1 quality data, sample size N = 644
SSTEW -0.077 +0.021
ITERS-R -0.116 +0.021
Overall quality (Wave 1) -0.099 +0.021
Children with Wave 2 quality data, sample size N = 766
SSTEW -0.052 +0.150*
ECERS-R -0.104 +0.219**
ECERS-E -0.034 +0.139
Overall quality (Wave 2) -0.066 +0.178*
Children with Wave 1 and Wave 2 quality data, sample size N = 354
Overall quality (Wave 1 / Wave 2) -0.211* +0.189 Table displays coefficients for the associations between the quality of settings attended and each outcome. Only outcomes with a significant association with quality are presented. Statistically significant coefficients are shown in bold italics, the level of significance is indicated by stars: * = p < .05, ** = p < .01, *** = p < .001. Coefficients give the change in the standardized outcome corresponding to a 2 standard deviation change in the quality variable.
For BAS picture similarities, higher scores are a positive outcome, and a positive association (+) indicates that higher quality of ECEC is associated with improvement in this outcome. For conduct problems, lower scores are a positive outcome, and a negative association (-) indicates that more hours in ECEC is associated with improvement in this outcome. A larger value is indicative of a stronger association between the two variables. Analyses controlled for hours spent in ECEC, home environment and demographic characteristics. The samples consist of children with settings quality data and a mean of at least 10 hours per week formal group ECEC between ages two and four.

69
BAS Picture Similarities
Children who had attended higher quality settings aged three to four tended to have higher non-verbal ability (Picture Similarities) at age four. This was found for settings quality measured using the SSTEW scale, the ECERS-R scale, and for the composite overall quality factor extracted from the SSTEW, ECERS-R and ECERS-E scales.
SDQ Conduct Problems
Children who had attended higher quality settings at age two and age three, as measured by the combined Wave 1 / Wave 2 composite overall quality factor, tended to have lower levels of Conduct Problems at age four.
Conclusion This chapter considered the effects on children’s outcomes measured at age four of the quality of the formal group ECEC that was received between the ages of two and four for a sub-group of children where quality assessments took place for the settings they attended. Findings suggest that:
• In formal group ECEC settings at age three to four, non-verbal development is associated with higher setting quality (ECERS-R) and quality of interactions (SSTEW), as well as with a composite measure of overall quality. This indicates a number of characteristics of the ECEC setting and staff activities are associated with aspects of improved cognitive development.
• Pedagogical quality (ECERS-E) is not associated with non-verbal development, suggesting that the educational aspects of the setting specifically are less closely associated with cognitive development than the non-educational aspects.
• A composite measure of overall quality from age two to four is linked with reduced Conduct Problems at age four.
• Statistically significant effects of quality are found for only two outcomes, whilst the quantity of ECEC used has effects on seven outcomes (see Chapter 3). This may suggest that quality of ECEC is relatively less important than quantity. However, this may also be in part due to the relative homogeneity of the quality of settings and the smaller sample size for the quality analyses.
Comparing the present findings with previous research, EPPE also found a relationship between quality and child outcomes. However, there is some variation between SEED and EPPE in terms of which specific quality measures are associated with which outcome. For example, in contrast to the present findings, EPPE found that non-verbal development was associated with the ECERS-E but not the ECERS-R (Sylva et al., 2004). Furthermore, EPPE also identified that the ECERS-E as well as subscales of the ECERS-R were related to verbal development, and this was not identified in the present study. These differences may be because of the improved quality of ECEC since the

70
EPPE study (Melhuish & Gardiner, 2017). Consideration of the SEED data in terms of subscale relationships may provide an opportunity for further insight.
The findings from SEED and EPPE are in contrast to those of a recent study considering quality in terms of Ofsted data, which has suggested only a small association between quality of ECEC settings and child outcomes in reception on the EYFSP (Blanden et al., 2018). However, studies using Ofsted ratings may be less sensitive to variation in quality in comparison than the more in depth measures used in the SEED study given that Ofsted ratings are scored across a number of domains and are not specific to the observed learning environment of children, and the timing of inspections is not always in line with the time children are in their ECEC settings. This research by Blanden et al. (2018) also focuses on Ofsted ratings of PVI settings while the present study includes a range of PVI and maintained provision.
The finding of benefits of quality for Conduct Problems suggests that the reported association between longer hours in ECEC and Conduct Problems may be moderated in higher quality settings.
In consideration of limitations in the present findings, because data on the quality of ECEC used was available for only a subset of the children in the study, the power of the quality analyses to detect significant effects is lower than that of the other analyses in this report.56 It is therefore possible that there are further effects of ECEC quality on child outcomes which cannot be detected due to the smaller sample size of the quality analyses. Further, the nature of this analysis assumes a linear impact of quality such that increasing quality would be associated with improving outcomes, however this may underestimate impacts if they are non-linear, for example if quality does not matter as long as it is not poor.
However, findings do suggest a number of aspects of quality in formal group ECEC settings between ages two to four which are associated with improved child outcomes, including setting quality, quality of interactions and pedagogical quality. The recently published SEED quality report has indicated a number of setting characteristics that are associated with improved quality, including having a training plan in place, having higher staff qualification levels, and having a higher staff-to-child ratio (i.e. fewer children per member of staff). These may be potential targets to further improve setting quality and boost child outcomes.
56 The lower sample size for the quality analyses means that the minimum size of effect that is detectable is approximately two and a half times larger for these analyses than for the other analyses.
71
Chapter 5: The home environment and child outcomes
Key findings
• A higher Home Learning Environment (HLE) score was associated with higher cognitive scores, more Prosocial Behaviour and better Behavioural Self-regulation at age four.
• Better child cognitive outcomes and some better socio-emotional outcomes at age four were also associated with higher parental Limit Setting scores.
• The quality of the parent/child relationship as measured by either the MORS invasiveness and/or the MORS warmth scales was the strongest predictor across all socio-emotional outcomes, and was also related to cognitive development.
• Better socio-emotional outcomes were also related to lower household disorder.
• Several improved socio-emotional outcomes, and better scores on the HTKS (self-regulation) task were associated with lower parent psychological distress.
• Investigating the interaction between the effects of ECEC use and HLE found these to be largely independent of each other. This indicates that children having both poor and rich home learning environments still stand to benefit from spending time in ECEC. However, given that poorer outcomes are seen among children with a lower HLE score, ECEC may be of particular importance for these children.
Introduction
The previous chapter focussed on effects associated with different patterns of ECEC use. In the analyses a range of demographic and home environment variables acted as control measures. This is because not controlling for them might otherwise confound the relationship between ECEC use and children’s outcomes.
There is considerable evidence for the influence of both the home environment and the quality of the parent/child relationship on the child’s cognitive and socio-emotional outcomes. This chapter looks at the effects upon child outcomes associated with various home environment variables.
Measures
The child cognitive and socio-emotional developmental outcomes, home environment factors, and demographic characteristics that were included in these analyses are outlined in detail in Chapter 2.

72
Effects of home environment on four-year-old child outcomes
The effects of the home environment on child outcomes, controlling for demographic measures and the amount and type of ECEC used aged two to four, are summarised in Table 14. Table 14: Summary of the associations between home environment variables and children’s outcomes at age four.
Child outcome
Home environment variables Home
Learning Environ
ment
Household chaos
Parent's psychological
distress
Limit setting
MORS invasiveness
MORS warmth
Cognitive development Naming Vocabulary +0.260*** +0.051 -0.028 +0.228*** -0.132*** +0.158*** Picture Similarities +0.161*** +0.003 -0.011 +0.123*** -0.084* +0.070* Self-regulation direct assessment HTKS Task (self-regulation) +0.178*** +0.010 -0.073* +0.121** -0.104** +0.082*
Socio-emotional problems SDQ Total Difficulties +0.029 +0.236*** +0.229*** +0.044 +0.610*** -0.265*** Hyperactivity -0.016 +0.234*** +0.147*** +0.128*** +0.431*** -0.187*** Emotional Symptoms +0.056 +0.094** +0.280*** -0.114** +0.445*** -0.104** Conduct Problems +0.043 +0.249*** +0.129*** +0.203*** +0.596*** -0.161*** Peer Problems +0.020 +0.074* +0.148*** -0.196*** +0.324*** -0.356*** Socio-emotional strengths Prosocial Behaviour +0.139*** -0.174*** -0.043 +0.008 -0.238*** +0.513*** Behavioural Self-
+0.179*** -0.094** -0.046 +0.124*** -0.299*** +0.285***
Emotional Self-
-0.075* -0.251*** -0.136*** -0.089** -0.607*** +0.136*** Co-operation +0.059 -0.185*** -0.051 -0.098** -0.415*** +0.414*** Sample size = 3,930 Table displays coefficients for the associations between the home environment variables and each outcome. Statistically significant coefficients are shown in bold italics, the level of significance is indicated by stars: * = p < .05, ** = p < .01, *** = p < .001. Coefficients give the change in the standardized outcome corresponding to a 2 standard deviation change in the home environment variable. For cognitive development and socio-emotional strengths, higher scores indicate a positive outcome, and a positive association (+) indicates that a higher level of the home environment covariate is associated with improvement in this outcome. For socio-emotional problems, lower scores are a positive outcome, and a negative association (-) indicates that a higher level of the home environment covariate is associated with improvement in this outcome. A larger value is indicative of a stronger association between the two variables. Analyses controlled for hours spent in ECEC and demographic characteristics.

73
Home Learning Environment
Higher Home Learning Environment scores (e.g. more frequent activities in the home such as reading, drawing, rhymes) were associated with better performance on all three cognitive measures (see Table 14). Higher HLE scores were also associated with higher levels of Prosocial Behaviour and Behavioural Self-regulation. Higher Home Learning Environment scores were also associated with lower levels of Emotional Self-regulation.
Household disorder (CHAOS scale)
Higher levels of household disorder (CHAOS scale) were associated with higher levels of socio-emotional problems and lower levels of socio-emotional strengths.
Parent’s Psychological Distress
Higher levels of Parent’s Psychological Distress were associated with poorer outcomes on the HTKS task (self-regulation) and higher levels of socio-emotional difficulties. Higher Parent’s Psychological Distress was also associated with lower levels of children’s Emotional Self-regulation.
Limit Setting Scale
Higher levels of Limit Setting (e.g. setting boundaries around child behaviour) were associated with better child outcomes on all three cognitive assessments. Where the socio-emotional outcomes were concerned, the relationship with Limit Setting was two sided. On the one hand, higher levels of Limit Setting were associated with lower levels of Emotional Symptoms and Peer Problems and with higher levels of Behavioural Self-regulation. On the other hand, higher levels of Limit Setting were associated with higher levels Hyperactivity and Conduct Problems and lower levels of Emotional Self-regulation and Co-operation.
MORS Invasiveness
Higher levels of MORS Invasiveness in the parent/child relationship (e.g. regarding child as demanding of attention, feeling annoyance toward child) was associated with poorer child cognitive outcomes, higher levels of children’s socio-emotional difficulties and lower levels of children’s socio-emotional strengths.
MORS Warmth
Higher levels of MORS Warmth in the parent/child relationship (e.g. relationship characterised by affection, doing things together) were associated with better child cognitive outcomes, lower levels of children’s socio-emotional difficulties and higher levels of children’s socio-emotional strengths.

74
Comparing the effect sizes associated with ECEC use aged two to four, home environment variables and demographic variables
The analysis in this report has found that both ECEC use aged two to four and home environment variables had significant associations with children’s cognitive and socio-emotional outcomes at age four. Therefore the relative sizes of effects on child outcomes associated with formal group, formal individual and informal individual ECEC use aged two to four, home environment variables and demographic factors were investigated.57 The figures below show associations between child outcomes and home environment variables, demographic variables and ECEC use aged two to four. Figures include only those effects which were statistically significant. Reported associations indicate the association over and above the influence of other factors controlled for in the model. Across most measures, associations are similar to those seen at age three (Melhuish et al., 2017), with stronger influences for home environment and demographic characteristics relative to the associations between ECEC and the child outcomes. In some cases, comparison with findings at age three shows an increased influence of demographic and home environment factors on the child outcomes at age four relative to the influence of ECEC use on the outcomes.
57 Analysis also controlled for child’s ethnic group, but because of the small sizes of most of the ethnic groups ethnicity effects were omitted from the results.

75
Figure 8: Comparing effect sizes for Naming Vocabulary in terms of formal group, formal individual and informal individual ECEC use aged two to four and home environment and demographic covariates.
Sample size = 3,930. All statistically significant effects are shown in decreasing order of absolute size. HLE = Home Learning Environment. Language development or Verbal ability (BAS Naming Vocabulary)
Verbal development outcomes had significant associations with a number of demographic factors, home environment variables and with ECEC use; see Figure 8. Associations were similar to those seen at age three. At age four, the largest effect was a positive association with mother’s highest qualification. There were effects of all the home environment variables with the exception of household disorder (CHAOS scale) and Parent’s Psychological Distress. The largest of these was the positive effect of Home Learning Environment on Naming Vocabulary. There was a small positive effect of informal individual ECEC use aged two to four years.

76
Figure 9: Comparing effect sizes for Picture Similarities in terms of formal group, formal individual and informal individual ECEC use aged two to four and home environment and demographic covariates.
Sample size = 3,930. All statistically significant effects are shown in decreasing order of absolute size. HLE = Home Learning Environment. Non-verbal ability (BAS Picture Similarities)
Picture Similarities outcomes showed significant associations with demographic factors, home environment factors and with formal group ECEC use; see Figure 9. Similar associations were seen to those at age three. At age four, Picture Similarities scores tended to be higher where the mother was more highly qualified, for children from less disadvantaged families, for higher birthweight children and for girls. There were positive associations between children’s Picture Similarities scores and Home Learning Environment, Limit Setting and the MORS Warmth measure (not used at age three). There was a negative association with the MORS Invasiveness measure (not used at age three). There was a small significant effect for formal group ECEC use which was not seen at age three.

77
Figure 10: Comparing effect sizes for HTKS Score in terms of formal group, formal individual and informal individual ECEC use aged two to four and home environment and demographic covariates.
Sample size = 3,930. All statistically significant effects are shown in decreasing order of absolute size. HLE = Home Learning Environment. Self-regulation: HTKS Score
Children’s self-regulation scores at age four, as measured by the HTKS task, were associated with home environment and demographic factors, but not with ECEC use; see Figure 10. There were associations with all home environment factors with the exception of household disorder (CHAOS scale). The demographic factors most strongly associated with children having higher self-regulation scores on this scale were: coming from a family with professional/managerial SES, higher levels of maternal education and the child being a girl. This outcome was not measured at age three and so associations cannot be compared.

78
Figure 11: Comparing effect sizes for SDQ Total Difficulties in terms of formal group, formal individual and informal individual ECEC use aged two to four and home environment and demographic covariates.
Sample size = 3,930. All statistically significant effects are shown in decreasing order of absolute size. SDQ Total Difficulties Score
SDQ Total Difficulties score was associated with a number of home environment and demographic factors, but not with ECEC use; see Figure 11. At age four the strongest predictor of high Total Difficulties scores was high levels of MORS Invasiveness in the parent/child relationship. Other predictors of high levels of difficulties were household disorder (CHAOS scale), high levels of Parent’s Psychological Distress and a family coming from a deprived area. Protective factors included a more highly educated mother, high levels of MORS Warmth in the parent/child relationship and the child being a girl. This outcome measure was not reported at age three and so associations cannot be compared.

79
Figure 12: Comparing effect sizes for SDQ Hyperactivity in terms of formal group, formal individual and informal individual ECEC use aged two to four and home environment and demographic covariates.
Sample size = 3,930. All statistically significant effects are shown in decreasing order of absolute size. SDQ Hyperactivity
Hyperactivity outcomes showed effects of demographic and home environment variables but no effect of ECEC; see Figure 12. Demographic and home environment factors associated with hyperactivity at age three were similar to those seen at age four, although a number of additional relationships were apparent by age four. At age four, the strongest predictor of high levels of Hyperactivity was high MORS Invasiveness in the parent/child relationship, which is similar to the parent/child conflict variable which was seen to be the strongest home environment factor at age three. Other factors associated with high levels of Hyperactivity at age four were household disorder (CHAOS scale), high levels of Parent’s Psychological Distress and high levels of Limit Setting (the last being perhaps a response to Hyperactivity rather than a cause). Protective factors against Hyperactivity included the mother being more highly educated, the child being a girl (also seen at age three) and the child having three or more siblings living in the same house.

80
Figure 13: Comparing effect sizes for SDQ Emotional Symptoms in terms of formal group, formal individual and informal individual ECEC use aged two to four and home environment and demographic covariates.
Sample size = 3,930. All statistically significant effects are shown in decreasing order of absolute size. SDQ Emotional Symptoms
SDQ Emotional Symptoms scores were associated with home environment factors, demographic factors and ECEC use; see Figure 13. While most associations seen at age three (limit setting, formal individual ECEC and parent’s distress) were also seen at age four, a number of additional variables were also seen to be associated with emotional symptoms at age four. As a result of these additional home environment and demographic influences, the relative effect of formal individual ECEC appears less influential at age four in comparison to the relative influence seen at age three. At age four, the strongest predictor of high levels of Emotional Symptoms was high MORS Invasiveness in the parent/child relationship. High levels of Parent’s Psychological Distress, family living in a deprived area and household disorder (CHAOS scale) were also predictive of higher levels of Emotional Symptoms. Higher levels of Limit Setting, higher levels of MORS Warmth in the parent/child relationship and time in formal individual ECEC (with childminders) were associated with lower levels of Emotional Symptoms.58
58 The beneficial effect of formal individual ECEC was found only in the moderately disadvantaged group; see Chapter 3.

81
Figure 14: Comparing effect sizes for SDQ Conduct Problems in terms of formal group, formal individual and informal individual ECEC use aged two to four and home environment and demographic covariates.
Sample size = 3,930. All statistically significant effects are shown in decreasing order of absolute size. SDQ Conduct Problems
In addition to similar effects as those seen at age three, a number of additional factors are seen to be associated with Conduct Problems at age four. The relative influence of formal group ECEC on elevated Conduct Problems is therefore less than seen at age three. At age four, the strongest association with high levels of Conduct Problems was high levels of MORS Invasiveness in the parent/child relationship; see Figure 14. Higher levels of household disorder (CHAOS scale), Limit Setting and Parent’s Psychological Distress were also associated with higher levels of Conduct Problems. Factors associated with lower levels of Conduct Problems included high levels of MORS Warmth in the parent/child relationship, a more highly educated mother, the child being a girl and a higher birthweight child. There was also a small significant association between higher Conduct Problems and formal group ECEC use aged two to four, as discussed in the previous chapter.

82
Figure 15: Comparing effect sizes for SDQ Peer Problems in terms of formal group, formal individual and informal individual ECEC use aged two to four and home environment and demographic covariates.
Sample size = 3,930. All statistically significant effects are shown in decreasing order of absolute size. SDQ Peer Problems
At age four many associations were similar to those seen at age three, although the relative effect of formal group ECEC, which was the largest predictor at age three, has become less influential at age four in comparison with aspects of parenting and the home environment. At age four, SDQ Peer Problems was associated with home environment factors, demographic factors and ECEC use; see Figure 15. Peer Problems were influenced by all home environment variables except Home Learning Environment. Higher levels of MORS Invasiveness, Parent’s Psychological Distress and household disorder (CHAOS scale) were associated with higher levels of Peer Problems, whilst higher levels of MORS Warmth and Limit Setting were associated with lower levels of Peer Problems. Time spent in formal group ECEC aged two to four was associated with lower levels of Peer Problems at age four. Living in a deprived area was associated with higher levels of Peer Problems; the child being a girl and higher birthweight were associated with lower levels of Peer Problems.

83
Figure 16: Comparing effect sizes for SDQ Prosocial Scale in terms of formal group, formal individual and informal individual ECEC use aged two to four and home environment and demographic covariates.
Sample size = 3,930. All statistically significant effects are shown in decreasing order of absolute size. HLE = Home Learning Environment. SDQ Prosocial Scale
Most associations at age four were similar to those seen at age three. At age four, SDQ Prosocial Scale was associated with home environment factors, demographic factors and ECEC use; see Figure 16. Among the home environment factors, higher levels of MORS Warmth in the parent/child relationship, lower levels of MORS Invasiveness, lower levels of household disorder (CHAOS scale) and a higher Home Learning Environment score were associated with higher levels of Prosocial behaviour. Girls tended to have higher levels of Prosocial behaviour than boys. Time spent in formal group ECEC aged two to four had a small positive effect on children’s prosocial scores at age four.

84
Figure 17: Comparing effect sizes for Behavioural Self-regulation in terms of formal group, formal individual and informal individual ECEC use aged two to four and home environment and demographic covariates.
Sample size = 3,930. All statistically significant effects are shown in decreasing order of absolute size. HLE = Home Learning Environment. Behavioural Self-regulation
Many associations at age four were similar to those seen at age three. At age four, Behavioural Self-regulation was associated with home environment factors, demographic factors and ECEC use; see Figure 17. Higher levels of Behavioural Self-regulation were associated with lower levels of MORS Invasiveness in the parent/child relationship, higher levels of MORS Warmth, higher Home Learning Environment scores, higher levels of Limit Setting and lower levels of household disorder (CHAOS scale). Girls tended to have higher levels of Behavioural Self-regulation than boys, as did higher birth weight children. Time in formal group ECEC aged two to four was associated with higher levels of Behavioural Self-regulation at age four.

85
Figure 18: Comparing effect sizes for Emotional Self-regulation in terms of formal group, formal individual and informal individual ECEC use aged two to four and home environment and demographic covariates.
Sample size = 3,930. All statistically significant effects are shown in decreasing order of absolute size. HLE = Home Learning Environment. Emotional Self-regulation
A large number of additional demographic and home environment factors were associated with emotional self-regulation at age four compared to those seen at age three. (At age three only gender and parent/child conflict were associated with this outcome, as well as formal group ECEC which is no longer associated with this outcome at age four). At age four, Emotional Self-regulation was associated with home environment and demographic factors, but not with ECEC use; see Figure 18. Emotional Self-regulation was associated with all the home environment factors, with higher levels of MORS Invasiveness, household disorder (CHAOS scale), Parent’s Psychological Distress, Limit Setting and Home Learning Environment being associated with lower levels of Emotional Self-regulation. Higher levels of MORS Warmth were associated with higher levels of Emotional Self-regulation. Emotional self-regulation tended to be higher where the mother was more highly educated, where the child was a girl, where the mother was older and where the family were home owners rather than renting their accommodation.

86
Figure 19: Comparing effect sizes for Co-operation Scale in terms of formal group, formal individual and informal individual ECEC use aged two to four and home environment and demographic covariates.
Sample size = 3,930. All statistically significant effects are shown in decreasing order of absolute size. Co-operation Scale
A number of additional factors were associated with Co-operation at age four in comparison with those seen at age three (where only gender, working household and household chaos were associated). At age four, Co-operation scale was associated with home environment and demographic factors, but not with ECEC use; see Figure 19. Higher levels of MORS Invasiveness, household disorder (CHAOS scale) and Limit Setting were associated with lower levels of Co-operation scale. Higher levels of MORS Warmth were associated with higher levels of Co-operation scale. Among the demographic factors, the child being a girl and higher birth weight were associated with higher levels of Co-operation scale whilst the family having a higher social class was associated with lower levels of Co-operation scale.

87
Interactions between ECEC use and the Home Learning Environment
Analysis has shown that both ECEC use and Home Learning Environment Index were associated with child outcomes. It was hypothesised that there may be an interaction between ECEC use and the Home Learning Environment: specifically, that the effect of ECEC use on the outcomes would be smaller when the Home Learning Environment Index score was high and the effect would be larger when the Home Learning Environment Index score was low. This may be characterised as a saturation effect; i.e. children already experiencing a rich home learning environment may have received enough “learning opportunities” and thus may derive less benefit from time in an ECEC setting than those whose home learning environment was less rich. However, no interactions between ECEC use and Home Learning Environment were found, suggesting that even children experiencing a relatively rich home learning environment may still benefit from spending time in ECEC. 59
Chapter conclusions
Cognitive and socio-emotional outcomes reported in this chapter were significantly associated with aspects of parenting and the home environment at age two and three. Cognitive development (verbal, non-verbal) as well as directly assessed self-regulation were particularly associated with a high Home Learning Environment score and higher limit setting, as well as the quality of the parent/child relationship (reduced invasiveness). This finding suggests that child verbal and non-verbal development, as well as self-regulation, may be facilitated through provision of educational materials and opportunities (such as reading) in the home, as well as setting limits around child behaviour (e.g. time out or telling off) and a high quality, warm relationship between parent and child.
Positive socio-emotional development was particularly associated with the quality of the parent/child relationship (lower invasiveness and higher warmth), as well as with lower levels of household disorder. This suggests that these characteristics of the home environment and the parent-child relationship promote lower levels of child problem behaviour and higher levels of prosocial behaviour, behavioural and emotional self-regulation and co-operation.
Cognitive and socio-emotional outcomes were also associated with demographic factors, particularly with mother’s education, child gender, birth weight and owner-occupier status.
These findings are in line with previous research which has found a relationship between demographics and factors of the home learning environment and children’s cognitive and
59 More details of the interaction analysis are given in the Technical Report.

88
social development, for example the EPPE project (Sammons et al., 2003), as well as findings reported in the SEED impact age three report (Melhuish et al., 2017).
In addition to the benefits of the Home Learning Environment for cognitive development, prosocial behaviour and behavioural self-regulation, lower emotional self-regulation was associated with higher Home Learning Environment scores. This unexpected relationship could be due to children who experience a richer home environment becoming more demanding of parental attention than those who experience a relatively less rich home environment, although further research is needed to further understand this proposed explanation.
As with the findings in Chapter 3, it may be assumed that home environment predicts child developmental outcomes, although it is likely in the case of these factors that causation may be bi-directional such that child socio-emotional characteristics may also influence parenting. For example, the mixed association between Limit Setting and children’s socio-emotional strengths and difficulties may be explained by parental Limit Setting being both a response to children’s challenging behaviour and a cause of children’s improved behaviour. It is also important to note that the use of parental report for both socio-emotional outcome and home environment measures may influence the relationships observed. This is not the case for cognitive outcomes which were directly assessed with children. Further discussion on this point is available in the technical report.
Analyses also compared the effect sizes associated with ECEC use between ages two and four, home environment variables and demographic variables.
• For cognitive outcomes, the effects for demographics (particularly child gender and maternal education) and home environment factors (particularly HLE and Limit Setting) were considerably stronger than those for individual ECEC (both formal and informal).
• For most socio-emotional outcomes, the best predictor of children’s outcomes was the quality of the parent/child relationship as measured by the MORS Warmth and Invasiveness scales, with the use of formal ECEC being a small but statistically significant predictor in a number of cases, along with a range of other home environment and demographic factors.
Analyses also considered a potential interaction between the effects of Home Learning Environment and ECEC use. No interactions were found, suggesting that the advantages of a rich home learning environment and the beneficial effects of time in ECEC are largely independent, with even children having the most positive home environments still showing beneficial associations from spending time in ECEC in most cases. This is consistent with findings in SEED at age three (Melhuish et al., 2017) but inconsistent with previous research such as EPPE which has indicated that children with lower Home Learning Environment scores stand to benefit more from ECEC (e.g. Sammons et al., 2008). The difference between SEED findings and those of previous research may relate to increased quality of ECEC over time since the EPPE study (Melhuish & Gardiner,

89
2017). Higher quality ECEC may be better able to benefit children regardless of the quality of their home learning environments.

90
Chapter 6: Discussion and conclusions
Aims
This report was concerned with three main objectives:
1. To study the associations between the amount of differing types of ECEC which children receive aged two to four and child development to age four.
2. To investigate the impact of the home environment and the quality of the parent/child relationship on child development to age four.
3. To explore the associations between the quality of the childcare settings which children have attended and child development to age four.
Results and Discussion
Are variations in use of ECEC associated with child development outcomes?
The analyses provided evidence that the amount of ECEC that children received between the ages of two and four was associated with differences for cognitive and socio-emotional outcomes measured at age four. The differential effects of group and individual settings suggest the different characteristics of the education and care provided in these different settings are associated with different areas of child development. These associations were seen after allowing for the effects of a number of home environment and demographic measures. The results varied for formal group, formal individual (i.e. childminder) and informal individual ECEC use.
The pattern of associations generally indicates that increased hours in ECEC is associated with improved child outcomes, and additional subgroup analyses are presented which for the most part also show that moderate to high levels of ECEC are associated with the best outcomes. However, because associations vary across different outcomes and for each type of provision, because hours spent in ECEC each week is averaged over two years, and because of varying sample size within these groups, these findings are most appropriately used to consider overall patterns of association rather than to suggest the optimum amount of time to spend in particular settings.
Cognitive outcomes
The beneficial effect associated with more hours spent in informal individual ECEC (e.g. relatives, friends, neighbours) for language development suggests that settings providing opportunities for one-to-one interaction may be most beneficial for language development. The importance of this finding is reflected in wider research which has suggested that early language development is a key predictor of longer term child outcomes, for example vocabulary at age five is one of the best predictors of later social mobility in children from disadvantaged backgrounds (Blanden, 2006). Given the

91
importance of language development, future research should consider ways in which practice can be enhanced to increase language development in children attending group settings.
The association between hours spent in formal group ECEC and non-verbal abilities suggests that the educational and environmental characteristics of spending time in group settings may be supporting child development of reasoning and problem solving skills.
Socio-emotional outcomes
More hours in formal group ECEC was associated with higher levels of Prosocial Behaviour, Behavioural Self-regulation and lower levels of Peer Problems. Other research has frequently found similar beneficial effects associated with more time in formal group ECEC, as in the review by Melhuish et al. (2015). The element of peer interaction in group settings may be providing opportunities for children to build and develop social skills and learn to manage their behaviour in the context of its impact on others.
More hours in formal individual ECEC (with childminders) was associated with lower levels of Emotional Symptoms (e.g. worries, nervousness). However, sub-analysis indicates that this effect was only significant for children from moderately disadvantaged families. This suggests that there is no significant benefit of any type of ECEC for reduced emotional symptoms among children from advantaged families or those from the most disadvantaged families.
The relationship between receiving over 35 hours per week of formal group ECEC and higher Conduct Problems was only seen in a small subset of the sample, and the impact seems to be reduced in comparison with the effect seen at age three in the same sample (Melhuish et al., 2017). This suggests a reduction over time in the severity of the impact of high level of formal group ECEC use on Conduct Problems, which is consistent with previous research which has also found higher levels of Conduct Problems associated with greater group ECEC use, but that this association gradually reduced with child age and disappeared during the elementary school years (Melhuish et al., 2010).60
Interactions with area deprivation, region and family disadvantage
There was no evidence for difference in the effects of ECEC use by area deprivation (IMD) or by region of the country suggesting any possible regional differences in quality of ECEC are not associated with differential associations with child outcome. Further, in most instances, the associations were identified for children with all levels of family advantage or disadvantage. These findings suggest that ECEC use has a positive benefit on cognitive and socio-emotional outcomes at age four regardless of a child’s family
60 Similar results occurred in a parallel study in Northern Ireland (Melhuish, et al., 2006).

92
disadvantage level, the level of disadvantage in their area or the region within which they live. However, given that the baseline SEED report has indicated a lower starting point among disadvantaged children (Speight et al., 2015), and that disadvantaged children are less likely to attend childcare settings (DfE, 2016), ECEC may be of particular importance for this group.
Differences between the effects of PVI and maintained ECEC
Significant benefits for non-verbal cognitive development were associated with increased hours spent in both PVI ECEC and maintained ECEC, while significant benefits for a number of socio-emotional outcomes (increased prosocial behaviour and behavioural self-regulation and reduced peer problems) were associated with increased hours spent in PVI ECEC. The benefits of maintained ECEC usage for these socio-emotional outcomes were inconclusive; the data suggests some degree of benefit, but it cannot be ruled out that there may be no benefits from maintained ECEC usage, or that the benefits of maintained ECEC usage may be as large as those of PVI ECEC usage. The uncertainty of the conclusions concerning maintained ECEC use can in part be attributed to the relatively small number of children in the sample using this type of ECEC.
The recently published SEED quality report (Melhuish & Gardiner, 2017) indicated that the quality of early years provision may be slightly higher in the maintained sector when compared with the PVI sector. However, these impact findings suggest that the small differences in quality between the sectors may not be sufficiently large to lead to observable differences in child outcome.
The impact of the quality of the formal group ECEC which children receive
Even once the quantity and type of ECEC received had been controlled for (along with demographic and home environment factors), the quality of formal group ECEC received aged two to four had an impact on children’s cognitive and socio-emotional outcomes at age four.
Attending higher quality formal group ECEC settings at age three was associated with higher non-verbal cognitive ability at age four. The fact that non-verbal ability was more strongly related with SSTEW and ECERS-R than with ECERS-E suggests that high quality adult-child interaction as well as a range of factors across the setting environment may be involved in supporting and facilitating child development of reasoning and problem solving skills.
Attending higher quality formal group ECEC settings at age two to four (as measured by a composite across quality measures) was significantly associated with lower levels of Conduct Problems at age four. This suggests that the quality across a range of characteristics of the ECEC setting may be associated with reducing child worries and nervousness as well as problem or aggressive behaviour.

93
No relationship was found between any aspect of setting quality and verbal development or self-regulation as measured on the HTKS. This suggests that formal ECEC, no matter the quality, is not associated with outcomes in these domains. Some socio-emotional outcomes (peer problems, prosocial behaviour and behavioural self-regulation) were associated with more hours spent in formal group ECEC but not with quality of formal group ECEC, suggesting that the quality of the ECEC received may be less important to children’s achievement on these specific outcomes.
This study provides evidence that both the quantity and the quality of the formal group ECEC which children receive aged two to four have a significant effect on some aspects of their cognitive and socio-emotional outcomes at age four. Findings may be interpreted to suggest that quantity may have more wide ranging effects than quality given the larger number of outcomes for which significant effects were identified.61 However, because of the difference in sample size between the analyses, caution is needed in interpretation regarding the relative impacts of quantity and quality since it is likely that there are further effects of ECEC quality on child outcomes which cannot be detected due to the smaller sample size of the quality analyses. Are variations in the home environment associated with child development?
In line with previous research, analysis in this report showed that cognitive and socio-emotional outcomes were also significantly associated with variations in the home environment, including the quality of the parent/child relationship, aspects of parenting behaviour, Home Learning Environment (HLE) and with demographic factors.
The level of maternal education and the home learning environment were among the largest influences on children’s cognitive outcomes at age four, with the use of formal and informal ECEC associated with smaller effects on levels of non-verbal and verbal cognitive ability, respectively. These associations suggest that child cognitive development may be supported by having a more highly educated mother, as well as experiencing a richer home learning environment. Such an environment provides more learning opportunities for children, e.g. diverse and responsive verbal interactions and opportunities for reading and educational play.
Where the socio-emotional outcomes were concerned, the largest effects were of the quality of the parent/child relationship as measured by the MORS Warmth and invasiveness scales, with four of the nine socio-emotional outcomes also showing smaller beneficial effects of formal group ECEC use. These findings suggest that the parental relationship with the child is particularly important for facilitating socio-emotional
61 Analyses found significant effects of the amount of ECEC used by children aged two to four on seven of the 12 outcomes analysed at age four. For the quality of the ECEC which children use we have found significant effects for just two of the 12 outcomes considered.
94
development including behavioural and emotional self-regulation, social skills and cooperation.
Interactions between ECEC and Home Learning Environment (HLE)
Analysis found that the beneficial effects of ECEC use and of a rich Home Learning Environment (HLE) are largely independent of each other, suggesting that children with a rich home environment still benefit from ECEC use. This finding is inconsistent with findings from previous longitudinal research such as EPPE, which has indicated that children with a lower HLE score stand to gain more from ECEC (Sammons et al., 2008). This difference may relate to changes over time such as improvements in the overall quality of ECEC since the EPPE study (Melhuish & Gardiner, 2017).
Final conclusions
Findings indicate that more hours spent in formal and informal ECEC between ages two and four has benefits for child cognitive and socio-emotional development at age four. Group settings in particular (e.g. nurseries, playgroups, nursery classes) are associated with benefits for non-verbal ability and socio-emotional outcomes, although benefits for language development are associated only with time children spent in informal individual settings (e.g. with relatives, friends and neighbours). Negative impacts on conduct problems for a small subgroup of children spending particularly long hours in formal group settings appear to be reduced since age three, in line with findings from EPPE that these small negative impacts reduce over time and may disappear in the longer term (Melhuish et al., 2010).
Findings also indicate that the benefits of attending ECEC are similar across all levels of family disadvantage. However, given that poorer child outcomes have been found for disadvantaged children (Speight et al., 2015), and these children may be less likely to attend childcare settings (DfE, 2016), children from disadvantaged families may be considered to have more to gain from time in ECEC.
Increased time spent in ECEC in both PVI and maintained settings was associated with cognitive benefits, and ECEC received in PVI settings was also associated with socio-emotional benefits. Possibly due to the relatively small number of children in the sample, the findings do not provide a firm conclusion concerning the benefits of maintained ECEC usage on the socio-emotional outcomes.
In addition, there was evidence that receiving higher quality formal group ECEC aged two to four has a positive impact on aspects of children’s cognitive and socio-emotional development to age four. This indicates the additional benefit of ensuring the delivery of high quality ECEC on further improving child outcomes over and above the impact of attending ECEC settings.
Finally, the effects of home environment and demographic factors upon child development outcomes at age four years were often substantially greater in size than the

95
effects of ECEC. These findings highlight the important role the home environment can play in child cognitive and socio-emotional development, particularly warmth or invasiveness in the parent-child relationship, and the Home Learning Environment. This suggests potential benefits of approaches to support parenting and the Home Learning Environment.
The beneficial effects of ECEC use and of a stimulating Home Learning Environment (HLE) were found to be largely independent of each other suggesting that children from all types of home environments stand to benefit from attending ECEC.

96
References Barnes, J., Leach, P., Malmberg, L. E., Stein, A., Sylva, K., & FCCC Team. (2010). Experiences of childcare in England and socio‐emotional development at 36 months. Early Child Development and Care, 180, 1215-1229. doi: 10.1080/03004430902943959 Barnes, J & Melhuish, E. (2016). Amount and timing of group-based childcare from birth and cognitive development at 51 months: A UK study. International Journal of Behavioral Development, doi: 10.1177/0165025416635756 Barnett, W. S. (1995). Long-term effects of early childhood programs on cognitive and school outcomes. The Future of Children, 5(3), 25-50. doi: 10.2307/1602366 Barnett, W. S. (2011). Effectiveness of early educational intervention. Science, 333(6045), 975-978. doi: 10.1126/science.1204534 Becker, B. (2011). Social disparities in children's vocabulary in early childhood. Does pre‐school education help to close the gap? The British Journal of Sociology, 62(1), 69-88. doi: 10.1111/j.1468-4446.2010.01345.x Belsky, J. (2001). Emanuel Miller Lecture: Developmental risks (still) associated with early child care. Journal of Child Psychology and Psychiatry and Allied Disciplines, 42(7), 845-859. doi: 10.1111/1469-7610.00782 Belsky, J., Vandell, D. L., Burchinal, M., Clarke‐Stewart, K. A., McCartney, K., & Owen, M. T. (2007). Are there long‐term effects of early child care? Child Development, 78(2), 681-701. doi: 10.1111/j.1467-8624.2007.01021.x Blanden, J. (2006). “Bucking the trend”: What enables those who are disadvantaged in
childhood to succeed later in life? Retrieved from http://dera.ioe.ac.uk/7729/
Blanden, J., Hansen, K., McNally, S. (2018). Evaluating the Impact of Nursery Attendance on Children’s Outcomes. London: Nuffield Foundation.
Bornstein, M. H., Hahn, C. S., Gist, N. F., & Haynes, O. M. (2006). Long‐term cumulative effects of childcare on children's mental development and socioemotional adjustment in a non‐risk sample: the moderating effects of gender. Early Child Development and Care, 176(2), 129-156. doi: 10.1080/0300443042000266286 Brooks-Gunn, J. (2003). Do you believe in magic: What can we expect from early childhood intervention programs? Society for Research in Child Development, 17, 1-14. Callanan, M., Anderson, M., Haywood, S., Hudson R. & Speight, S. (2017). Study of Early Education and Development: Good Practice in Early Education. London: DfE.

97
https://www.gov.uk/government/uploads/system/uploads/attachment_data/file/586242/SEED__Good_Practice_in_Early_Education_-_RR553.pdf
Cattan, S., Crawford, C., & Dearden, L. (2014). The economic effects of pre-school education and quality (No. R99). IFS Reports, Institute for Fiscal Studies.
Department for Education (2016). Childcare and Early years Survey of Parents in England, 2014 to 2015. SFR 09/2016. London: DfE. https://www.gov.uk/government/uploads/system/uploads/attachment_data/file/504693/SFR09-2016_Childcare_and_Early_Years_Survey_of_Parents_2014-15_SFR.pdf
Department for Education (DfE) (2016). Provision for children under five years of age in England, January, 2016. SFR 23/2016. London: DfE. https://www.gov.uk/government/uploads/system/uploads/attachment_data/file/532575/SFR23_2016_Text.pdf Department for Education (2017). Childcare and Early Years Survey of Parents in England, 2017 SFR 73/2017. London: DfE. https://www.gov.uk/government/statistics/childcare-and-early-years-survey-of-parents-2017
Dunatchik, A., Wishart, R., Cartagena-Faris, J. & Smith, N. (2018) Regional differences in attainment in the early years. London: DfE.
Dunning, T. (2012). Natural experiments in the social sciences: A design-based approach. Cambridge, UK: Cambridge University Press. Elliot, C., Smith, P. & McCulloch, K. (2011). British Ability Scales Third Edition (BAS III). Windsor: GL-Assessment. Eryigit-Madzwamuse, S., & Barnes, J. (2014). Patterns of childcare arrangements and cognitive development. Journal of Child and Adolescent Behavior, 2(5). 1000165. Doi:10.4172/jcalb.1000165. European Commission, Directorate-general for Education, Youth, Sport and Culture. (2014). Study of the effective use of early childhood education and care (ECEC) in preventing early school leaving (ESL). Brussels: European Commission. http://bookshop.europa.eu/en/study-on-the-effective-use-of-early-childhood-education-and-care-ecec-in-preventing-early-school-leaving-esl--pbNC0414322/
Goodman R. (1997). The Strengths and Difficulties Questionnaire: A research note. Journal of Child Psychology and Psychiatry, 38 (5), 581-586. Hansen, K and Hawkes, D. (2009). Early Childcare and Child Development. Journal of Social Policy, 38, 211-239 doi:10.1017/S004727940800281X

98
Harris, F., Law, J., & Roy, P. (2005). The third implementation of the Sure Start Language Measure. SSU/2005/Fr/014. London, DCSF. http://webarchive.nationalarchives.gov.uk/20130401151715/http://www.education.gov.uk/publications/eOrderingDownload/SSU-2005-SF-014.pdf Heckman, J. J. (2006). Skill formation and the economics of investing in disadvantaged children. Science, 312(5782), 1900-1902 Hesterberg, T., Combining multiple imputation t, chi-square, and F inferences . Research report No 75. Seattle, WA; MathSoft, 1998. http://www.uvm.edu/~dhowell/StatPages/Missing_Data/tech75-mi-inference.pdf Hogan, A.E., Scott, K.G., & Bauer, C.R. (1992). The Adaptive Social Behavior Inventory (ASBI): A new assessment of social competence in high-risk three-year-olds. Journal of Psychoeducational Assessment, 10, 230-239. Honaker J, King G, Blackwell M. Amelia II (R package) 2010. http://cran.r-project.org/web/packages/Amelia/index.html. Huskinson, T., Kostadintcheva, K., Greevy, H., Salmon, C., Dobie, S., Medien K., with Gilby, N., Littlewood M., & D’Souza, J. (2014). Childcare and Early years Survey of Parents 2012 to 2013. SFR 06/2014. London: DfE. https://www.gov.uk/government/uploads/system/uploads/attachment_data/file/275992/SFR06-2014_Childcare_and_Early_Years_Survey_of_Parents_2012-13_final.pdf Huskinson, T., Hobden, S., Oliver, D., Keyes, J., Littlewood, M., Pye, J., & Tipping, S. (2016). Childcare and early years survey of parents 2014-2015. London; DfE. Huston, A. C., Bobbitt, K. C., & Bentley, A. (2015). Time spent in child care: How and why does it affect social development? Developmental Psychology, 51(5), 621-634. doi: 10.1037/a0038951 Jaffee, S. R., Van Hulle, C., & Rodgers, J. L. (2011). Effects of nonmaternal care in the first 3 years on children’s academic skills and behavioral functioning in childhood and early adolescence: A sibling comparison study. Child Development, 82(4), 1076-1091. Karoly, L. A., Greenwood, P. W., Everingham, S. S., Houbé, J., Kilburn, M. R., Rydell, C. P., . . . Chiesa, J. (1998). Investing in our children: What we know and don’t know about the costs and benefits of early childhood interventions. Santa Monica, CA: RAND. Kessler, R.C., Andrews, G., Colpe, .et al (2002). Short screening scales to monitor population prevalences and trends in non-specific psychological distress. Psychological Medicine, 32, 959-956.

99
Lee, V. E., Brooks-Gunn, J., & Schnur, E. (1988). Does Head Start work? A 1-year follow-up comparison of disadvantaged children attending Head Start, no preschool, and other preschool programs. Developmental Psychology, 24(2), 210-222. Lefebvre, P., & Merrigan, P. (2002). The effect of childcare and early education arrangements on developmental outcomes of young children. Canadian Public Policy/Analyse de Politiques, 28(2), 159-186. doi: 10.2307/3552323 Loeb, S., Bridges, M., Bassok, D., Fuller, B., & Rumberger, R. W. (2007). How much is too much? The influence of preschool centers on children's social and cognitive development. Economics of Education Review, 26(1), 52-66. Love, J. M., Harrison, L., Sagi‐Schwartz, A., Van IJzendoorn, M. H., Ross, C., Ungerer, J. A., . . . Brooks‐Gunn, J. (2003). Child care quality matters: How conclusions may vary with context. Child Development, 74(4), 1021-1033. Matheny A P, Wachs T, Ludwig J L, Phillips K. (1995). Bringing order out of chaos: Psychometric characteristics of the Confusion, Hubbub and Order Scale. Journal of Applied Developmental Psychology, 16, 429-444. Mathers, S., & Smees, R. (2014). Quality and Inequality: Do Three- and Four-year-olds in Deprived Areas Experience Lower Quality Early Years Provision? London: Nuffield Foundation. McCartney, K., Burchinal, M., Clarke-Stewart, A., Bub, K. L., Owen, M. T., & Belsky, J. (2010). Testing a series of causal propositions relating time in child care to children’s externalizing behavior. Developmental Psychology, 46(1), 1 McClelland, M. M., Cameron, C. E., Duncan, R., Bowles, R. P., Acock, A. C., Miao, A., & Pratt, M. E. (2014). Predictors of early growth in academic achievement: The head-toes-knees-shoulders task. Frontiers in psychology, 5, 599.
Meadows, P. & NESS team (2006). Cost-effectiveness of Implementing SSLPS: An Interim Report. Research Report NESS/2006/FR/015. London: Department for Education and Skills. http://www.ness.bbk.ac.uk/cost-effectiveness/documents/1240.pdf
Melhuish, E. (2010). Why children, parents and home learning are important. In K. Sylva, E. Melhuish, P. Sammons, I. Siraj-Blatchford & B. Taggart (Eds.), Early Childhood Matters: Evidence from the Effective Pre-school and Primary Education Project. London: Routledge. Melhuish E. C. (2011). Preschool matters. Science, 333, 299-300. Melhuish, E. C., Lloyd, E., Martin, S., & Mooney, A. (1990). Type of childcare at 18 months: II relations with cognitive and language development. Journal of Child Psychology and Psychiatry, 31(6), 861-870.

100
Melhuish, E. C., Sylva, K., Sammons, P., Siraj-Blatchford, I., & Taggart, B. (2001). The Effective Provision of Pre-school Education Project, Technical Paper 7: Social/behavioural and cognitive development at 3-4 years in relation to family background. London: Institute of Education/DfES. Melhuish, E. C. (2004). A literature review of the impact of early years provision on young children, with emphasis given to children from disadvantaged backgrounds. London: National Audit Office. http://media.nao.org.uk/uploads/2004/02/268_literaturereview.pdf Melhuish, E., Quinn, L., Hanna, K., Sylva, K., Siraj-Blatchford, I., Sammons, P. & Taggart, B. (2006) The Effective Pre-school Provision in Northern Ireland Project, Summary Report. Belfast, N.I.: Stranmillis University Press. http://www.deni.gov.uk/researchreport41.pdf Melhuish, E.C., Sylva, K., Sammons, P., Siraj-Blatchford, I., Taggart, B., & Phan, M. (2008a) Effects of the Home Learning Environment and preschool center experience upon literacy and numeracy development in early primary school. Journal of Social Issues, 64, 95-114. Melhuish, E. Belsky, J., Leyland, A.H., Barnes, J. & NESS Team (2008b). Effects of fully-established Sure Start Local Programmes on 3-year-old children and their families living in England: a quasi-experimental observational study. Lancet, 372, 1641-1647. Melhuish, E., Ereky-Stevens, K., Petrogiannis, K., Ariescu, A., Penderi, E., Rentzou, K., Tawell, A., Slot, P., Broekhuizen, M., & Leseman, P. (2015). A review of research on the effects of early childhood Education and Care (ECEC) upon child development. CARE project; Curriculum Quality Analysis and Impact Review of European Early Childhood Education and Care (ECEC). http://ecec-care.org/resources/publications/ Melhuish, E., Quinn, L., Sylva, K., Sammons, P., Siraj-Blatchford, I., and Taggart, B. (2010). Pre-school Experience and Key Stage 2 performance in English and Mathematics. Belfast: DfE, Northern Ireland. www.deni.gov.uk/no_52_2010.pdf Melhuish, E., Quinn, L., Sylva, K., Sammons, P., Siraj-Blatchford, I., & Taggart, B. (2012). Preschool affects longer term literacy and numeracy: results from a general population longitudinal study in Northern Ireland. School Effectiveness and School Improvement: An International Journal of Research, Policy and Practice, 24, 234-250. Melhuish, E., Gardiner, J. & Morris, S. (DfE) (2017). Study of Early Education and Development (SEED): Impact Study on Early Education Use and Child Outcomes up to Age Three. DFE-RR706. London: DfE. https://www.gov.uk/government/uploads/system/uploads/attachment_data/file/627098/SEED_ECEC_impact_at_age_3.pdf

101
Melhuish, E. & Gardiner, J. (2017). Study of Early Education and Development (SEED): Study of Quality of Early Years Provision in England. DFE-RR706. London: DfE. https://www.gov.uk/government/uploads/system/uploads/attachment_data/file/665077/SEED_Quality_Report_December_2017.pdf
Millennium Cohort Study, ed. K. Hansen (2010). A guide to the datasets, fifth edition. London: Centre for Longitudinal Studies, Institute of Education, University of London. http://www.cls.ioe.ac.uk/library-media%5Cdocuments%5CMCS%20Guide%20to%20the%20Datasets%20v5.pdf Muennig, P., Schweinhart, L., Montie, J., & Neidell, M. (2009). Effects of a prekindergarten educational intervention on adult health: 37-year follow-up results of a randomized controlled trial. American Journal of Public Health, 99(8), 1431-1437. doi: 10.2105/AJPH.2008.148353 NESS (2005). Early impacts of Sure Start Local Programmes on children and families. Sure Start Report 13. London: Department for Education and Skills. http://www.ness.bbk.ac.uk/impact/documents/1183.pdf NICHD Early Child Care Research Network. (2000). The relation of child care to cognitive and language development. Child Development, 71, 960-980.
OECD. (2004). Learning for tomorrow's world: First results from Pisa 2003. Paris: Organisation for Economic Co-operation and Development (OECD)/UNESCO. OECD. (2006). Early childhood education and care. Paris: OECD Publishing. OECD. (2011). Pisa in focus 2011/1: Does participation in pre-primary education translate into better learning outcomes at school? Paris: OECD Publishing. OECD (2016). Who uses childcare? Background brief on inequalities in the use of formal early childhood education and care (ECEC) among very young children. Paris: OECD Publishing. https://www.oecd.org/els/family/Who_uses_childcare-Backgrounder_inequalities_formal_ECEC.pdf
OECD (2017), Starting Strong 2017: Key OECD Indicators on Early Childhood Education and Care. Paris: OECD Publishing. http://dx.doi.org/10.1787/9789264276116-en
Oden, S., Schweinhart, L., Weikart, D., Markus, S., & Xie, Y. (1996). Summary of the long term benefits of Head Start study. Head Start Third National Research Conference, Washington, DC. Pianta, R. C. (2001). The Student-Teacher Relationship Scale. Odessa FL: PAR.

102
Ponitz, C. E. C., et al. (2008). Touch your toes! Developing a direct measure of behavioral regulation in early childhood. Early Childhood Research Quarterly 23(2): 141-158. Ramey, C. T., Campbell, F. A., Burchinal, M., Skinner, M. L., Gardner, D. M., & Ramey, S. L. (2000). Persistent effects of early childhood education on high-risk children and their mothers. Applied Developmental Science, 4(1), 2-14. Reynolds, A. J., Temple, J. A., Ou, S.-R., Arteaga, I. A., & White, B. A. B. (2011). School-based early childhood education and age-28 well-being: Effects by timing, dosage, and subgroups. Science, 333(6040), 360-364. doi: 10.1126/science.1203618 Rubin, D. B. (1987). Multiple imputation for nonresponse in surveys. Chichester: Wiley. Sammons, P., Sylva, K., Melhuish, E., Taggart, B., Elliot, K., & Siraj-Blatchford, I. (2002). The Effective Provision of Pre-School Education (EPPE) Project: Measuring the impact of pre-school on children's cognitive progress over the pre-school period. London: Institute of Education, University of London/ Department for Education and Skills.
Sammons, P., Sylva, K., Melhuish, E., Siraj-Blatchford, I., Taggart, B., & Elliot, K. (2003). Measuring the impact of pre-school on children’s social/behavioural development over the pre-school period. The Effective Provision of Pre-School Education (EPPE) Project. Technical Paper 8b. London: University of London, Institute of Education.
Sammons, P., Sylva, K., Melhuish, E., Siraj-Blatchford, I., Taggart, B., & Hunt, S. (2008). Effective Pre-school and Primary Education 3-11 Project (EPPE 3-11): Influences on children’s attainment and progress in Key Stage 2: Cognitive outcomes in Year 6. London: Department for Children, Schools and Families.
Simkiss, D. E., et. al. (2013). Validation of the mothers’ object relations scales in 2–4-year-old children and comparison with the child–parent relationship scale. Health and Quality of Life Outcomes 11: 49. doi: 10.1186/1477-7525-11-49.
Solheim, E., Wichstrøm, L., Belsky, J., & Berg‐Nielsen, T. S. (2013). Does time in child care and peer group exposure predict poor socioemotional adjustment in Norway? Child Development, 84(5), 1701-1715. Speight, S., Smith, R., Lloyd, E., and Coshall, C. (2010a) Families Experiencing Multiple Disadvantage: Their Use of and Views on Childcare Provision, Research Report DCSF-RR191, London: Department for Children, Schools and Families. Speight, S., Smith, R., Lloyd, E., and Coshall, C. (2010b) Towards Universal Early Years Provision: Analysis of Take-up by Disadvantaged Families from Recent Annual Childcare Surveys, DfE Research Report DFE-RR066. London: DfE.
103
Speight, S., Maisey, R., Chanfreau, J., Haywood, S., Lord C., and Hussey, D. (2015). Study of Early Education and Development: Baseline survey of families. Research Report, July 2015. DFE-RR480. ISBN: 978-1-78105-509-0. London: DfE. http://www.seed.natcen.ac.uk/media/5645/Study_of_early_education_and_development_survey_of_families.pdf Stein, A., Malmberg, L-E., Leach, P., Barnes, J., Sylva, K. and the FCCC Team. (2013) The Influence of Different Forms of Early Childcare on Children’s Emotional and Behavioural Development. Child: Care, Health and Development, 39(5):676-87. doi: 10.1111/j.1365-2214.2012.01421.x Stipek, D. J., & Ryan, R. H. (1997). Economically disadvantaged preschoolers: Ready to learn but further to go. Developmental Psychology, 33(4), 711. Sylva, K., Melhuish, E., Sammons, P., Siraj-Blatchford, I., and Taggart, B. (2004). Effective Pre-school Provision. London: Institute of Education. Sylva, K., Melhuish, E., Sammons, P., Siraj-Blatchford, I., & Taggart, B. (2010). Early childhood matters: Evidence from the effective pre-school and primary education project. Oxon: Routledge. Sylva, K., Melhuish, E., Sammons, P., Siraj-Blatchford, I., & Taggart. B. (2012) Effective Pre-school, Primary and Secondary Education 3-14 Project (EPPSE 3-14) - Final Report from the Key Stage 3 Phase: Influences on Students' Development form age 11-14. Research Report DFE-RR202. London: Department for Education. https://www.education.gov.uk/publications/eOrderingDownload/DFE-RR202.pdf
Tierney, A. L., & Nelson, C. A. (2009). Brain Development and the Role of Experience in the Early Years. Zero to Three, 30(2), 9.
UNICEF Innocenti Research Centre. (2008). The child care transition. A league table of early childhood education and care in economically advanced countries. Florence, Italy: UNICEF. Wylie, C., Hodgen, E., Ferral, H., & Thompson, J. (2006). Contributions of early childhood education to age-14 performance. Wellington, New Zealand: Ministry of Education. www.educationcounts.govt.nz/__data/assets/pdf_file/0003/7716/Contributions-of-ECE-to-age-14-Performance.pdf Yamauchi, C., & Leigh, A. (2011). Which children benefit from non-parental care? Economics of Education Review, 30(6), 1468-1490. Yoshikawa, H., Weiland, C., Brooks-Gunn, J., Burchinal, M. R., Espinosa, L. M., Gormley, W. T., . . . Zaslow, M. J. (2013). Investing in our future: The evidence base on

104
preschool education. Ann Arbor, MI/ New York, NY: Society for Research in Child Development/ Foundation for Child Development. Zachrisson, H. D., Dearing, E., Lekhal, R., & Toppelberg, C. O. (2013). Little evidence that time in child care causes externalizing problems during early childhood in Norway. Child Development, 84(4), 1152-1170.
105
© NatCen Social Research, University of Oxford, and Action for Children 2018
Reference: DFE-RR843
ISBN: 978-1-78105-932-6
The views expressed in this report are the authors’ and do not necessarily reflect those of the Department for Education.
Any enquiries regarding this publication should be sent to us at: [email protected] or www.education.gov.uk/contactus
This document is available for download at www.gov.uk/government/publications