impact on p-12 student learning and development
TRANSCRIPT

Impact on P-12 Student Learning and Development In order to explore possible measures and processes that will allow the EPP to assess completers’ impact on P-12 student learning and development, pilot school districts in the Winthrop University-School Partnership Network (PN) were contacted for participation in a first wave of efforts around compliance with Standard 4 expectations. The EPP received student impact data from two districts in various forms and from a variety of instruments. Two additional districts are working to provide impact data, and the EPP hopes to update information on those efforts by summer 2019. In addition to district supplied data, recent EPP completers were contacted directly and asked to voluntarily share their state-mandated Student Learning Outcome reports. Although both efforts are still in their infancy these are initial steps in exploring possible, long-term strategies for compliance with Component 4.1. In addition to targeted efforts with pilot districts, the EPP maintains a voice in discussions with the State Department of Education to explore ways to expediently track completers’ employment in P-12 institutions across the state. As of spring 2019, the SC Legislature is exploring comprehensive legislation that would require state EPPs to report information on completers’ place of employment, retention and promotion. Although the legislation is intended to meet accreditation standards, the outcome could very well provide state EPPs a mechanism for meeting expectations defined by CAEP Standard 4. These efforts may affect the “next steps” provided in the plan at the end of this document and in the Standard 4 narrative. Pilot Districts The districts used for targeted Standard 4 data collection processes are profiled in the appendix and hyperlinked for ease in considering the characteristics of the samples. Matching Graduates in Pilot Districts Matching completers’ records to partner districts’ employee records has proven both difficult and time consuming. The EPP was able to secure data from the state on placement of completers in 2016, but the list provided did not include certification numbers, which are used to search for employees in human resources databases in many districts. In 2018, the first two pilot districts were willing to try to manually match our EPP’s completer’s records. To assist with this process, the EPP created a data file with a variety of personal identifiers. This was a time-consuming process for both the EPP and the district, thus we hope the EPP’s work with the state will result in the annual conferral of this information. In the meantime, the EPP’s efforts did help both the initial pilot districts to identify completers.
Measures of Academic Progress (MAP)
Partner districts in which many recent graduates are employed administer the Measures of Academic Progress (MAP), created by the Northwest Evaluation Association (NWEA). MAP tests are available in reading (K-11th grade), mathematics (K-11th grade), language usage (2nd-11th grade) and general science (3rd-10th grade). They are on an “equal interval scale” that spans across grade levels, allowing districts to track each student’s growth over his/her K-11th grade career. Although the scores are not grade-level specific, they are nationally normed, allowing

NWEA to publish reliable growth scores (on average) for students – by grade level and subject – from the beginning to mid-year, mid- to end-of-year, and beginning to the end-of-year. This enables teachers and administrators to compare their students’ growth scores with the average levels of growth nationally. (https://www.nwea.org/map-growth/) District One MAP Data The spring 2018 data reported below represent the MAP performance of K-5 learners – in mathematics and reading – taught by recent completers (graduation between 2015 and 2017) employed by District One. A large proportion of EPP graduates are employed in this district, however, not all of them have MAP scores within the districts’ database, as MAP is not administered to all grade levels. Among grade K-5 students taught by the seven completers included in the MAP data, the average percentile rank on the mathematics exam was comparable to that of the district – i.e., slightly larger, but due to normal error (+/- 3) associated with any test score, well within the range of values reported by the district overall. In addition, the median percentile was identical to that of the district overall. The most common score fell in the 66th percentile, which was lower than the district. The average percentile rank on the reading MAP exam was comparable to that of the district – i.e., slightly larger, but due to normal error (+/- 3) associated with any test score, well within the range of values reported by the district overall. In addition, as seen in mathematics, the median percentile was similar to that of the district overall and the most common score (which fell in the 73rd percentile) was lower than the district. The EPP notes that the mode is not a reliable indicator of differences in student performance on a scale, thus it will focus on the comparability of mean percentile rankings and median percentile rankings. In this case, both rankings fall within the center of the distribution between the students of WU EPP completers and the district as a whole, suggesting that the impact of completers on K-5 student learning is strong, despite, having less experience than most of the teachers in the district. Specifically, the average number of years educators have taught in District One is 14, as per usa.com. Average End of Year Percentile Rank of Completer’s Students
End-of-Year Percentile Rank 2018 Winthrop Completers in One District
Measures of Central Tendency
Mathematics N=138 K-5 learners
N= 7 teachers
Reading N=138 K-5 learners
N= 7 teachers
Mean Percentile Rank 65.48 68.68
Median Percentile Rank 69 73
Mode Percentile Rank 66 73
Standard Deviation 22.6 21.7
End-of-Year Percentile Rank All Teachers, Grades 1-5, Same District
Measures of Central Tendency
Mathematics N=5,729 K-5 learners
Reading N=5,729 K-5 learners
Mean Percentile Rank 64.12 67.93
Median Percentile Rank 69 75
Mode Percentile Rank 99 92
Standard Deviation 25.9 25.6

Examining data by grade level instead of aggregated across grades resulted in the same pattern of differences described above. That is, no practically significant differences between the performance of WU’s EPP completers and the district wide comparison groups, by grade level, were evident. However, the students of a recent completer of WU’s EPP – who taught fifth grade – outperformed the students of his/her district peers teaching the same grade to a moderate degree in mathematics as per the effect size listed below.
Comparison of Effect Sizes between Each Winthrop Completers (C) and All District Teachers (D) by Grade Level
Measure: 2018 Average End-of-Year Scores in Math and for MAP Subject C Student N C Mean C SD D Student N D Mean D SD *g
Grade 1 Math 20 187.60 12.89 1123 189.34 15.52 .11 Reading 182.95 10.65 185.62 14.19 .19
Grade 2 Math 19 198.58 7.67 1129 194.91 11.71 .31 Reading 197.89 11.46 195.84 14.46 .14
Grade 2 Math 20 194.15 7.49 1129 194.91 11.71 .06 Reading 195.95 9.76 195.84 14.46 .00
Grade 3 Math 18 205.72 6.37 1172 208.07 12.37 .19 Reading 205.61 8.04 1174 206.01 13.34 .03
Grade 3 Math 20 210.85 11.30 1172 208.07 12.37 .23 Reading 204.55 11.29 1174 206.01 13.34 .10
Grade 4 Math 20 214.90 12.64 1122 217.43 13.24 .19 Reading 213.40 11.08 213.57 12.54 .01
Grade 5 Math 21 232.57 14.05 1183 226.72 14.85 .39
Reading 222.81 14.16 1183 219.14 13.16 .28
*The column entitled “g” refers to Hedge’s g, which shows how much one group differs from another. Any value at or below .20 is considered a small difference; a value at or above .5 is considered a moderate difference, and a value at or below .8 is considered a relatively large difference.
District Two MAP Data District Two provided 2017-2018 MAP data for 17 recent completers in the district, but no comparison data were available. From the sample, the mean growth was 85.64% and the median growth was 82.15%. The range of scores indicated differences in growth between 40.38% and 167.95%. Interestingly the completer with 40.38% was a high school math teacher for which four different classes were reported. Two classes saw less than 10% growth and the other two saw 87% and 57%. The teacher receiving the highest overall growth was also a secondary teacher in English. This teacher had scores reported on two classes and both saw more than 100% growth. Individual MAP data are provided in the appendix.

Action Research
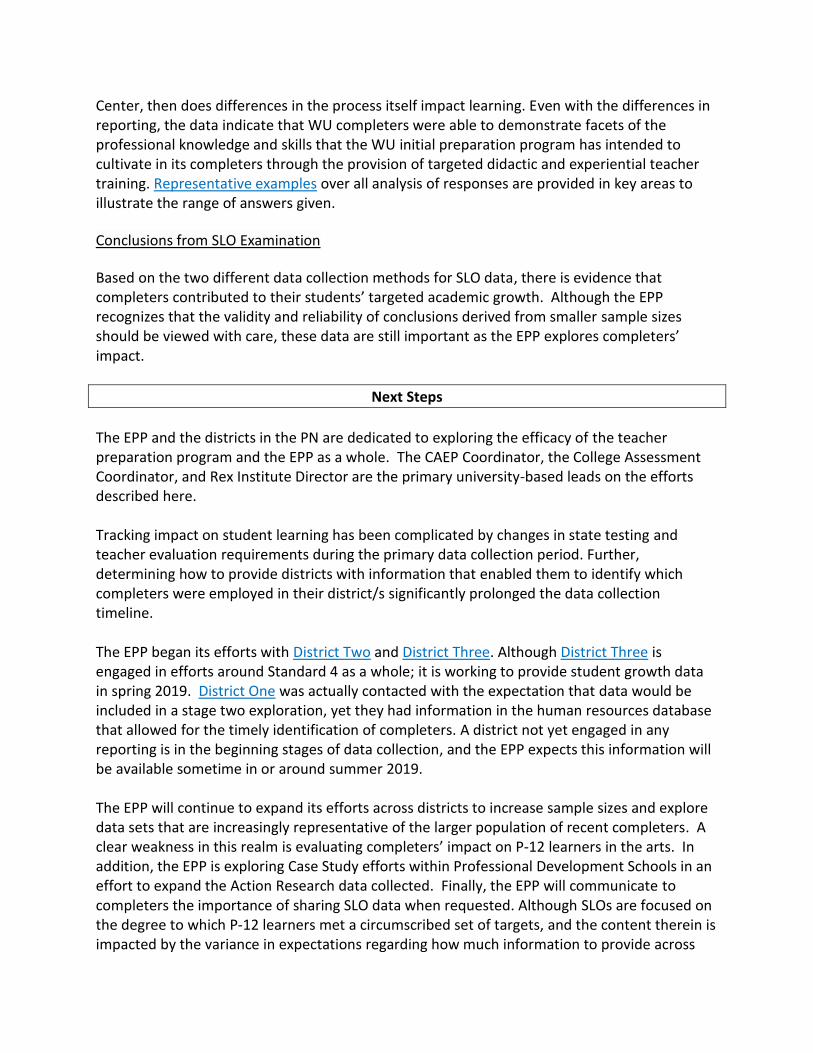
The EPP is exploring the possibility that action research could provide case study evidence to substantiate claims of candidates’ positive impact on student learning. Winthrop Faculty in Residence (WFIR) have been meeting across 2018-2019 to explore possible action research methods to facilitate implementation of a common model. Although the WFIRs have begun to explore this process with recent completers, data on these efforts are not yet available. It is important to note that the idea of action research with the partnership schools is not new, but past efforts have targeted interested teachers – not necessarily recent graduates. Data from action research conducted by recent completers in partnership with WFIRs will not be available until 2019-2020. The WFIR role is explained in the PN_Evidence file. However, through its partnership with District One, the EPP discovered that action research is a facet of the induction program (i.e., an informal action research project is conducted by induction teachers in their first year of teaching). This too may prove to be a further avenue for exploration of data sources. In addition to the more informal exploration that occurs around teacher observation in the induction process, District One is piloting more formal action research with early career teachers. Two recent graduates of the middle level program are involved in these preliminary explorations and agreed to provide the EPP with data from their first-year projects. The EPP learned of this action research initiative through the partner district participation in the National Network for Education Renewal conference hosted by Winthrop with support from the PN in fall 2018. These completers, both 2017 EPP graduates, presented their action research methods and findings, which include their students’ learning gains, in partnership with the district administrator who oversaw the induction project. [See PN_Evidence for more information on the partnership.] In relationship to Component 4.1, data indicate that the students did learn the course content based on the completer’s instruction, and that the percentage of students who mastered the material was higher in the “treatment” groups as compared to those in the “control” groups. Further, the completers considered why specific strategies influenced their students’ learning by observing/noting the factors contributing to this within the learning environment. A more complete summary of the projects and example data displays [Ms. S and Mr. B] from the presentation at NNER were shared with the EPP and are included in the appendix.
Student Learning Outcomes
General state expectations SLOs, as defined by the South Carolina Department of Education documentation, “are teacher-driven, student-centered, data-informed, standards-based goals that measure an educator’s impact on student learning growth within a given interval of instruction” (https://www.spart5.net/cms/lib07/SC01000802/Centricity/Domain/1208/SLOGuidebook.pdf, p. 4). Districts and schools have flexibility in how the SLOs are generated, reported, and

tracked, although the state provides a sample template for reporting. Within the EPP’s exploration of SLO processes, there are multiple reporting formats and many teachers appear to be encouraged to create common SLOs at a grade or course level to provide opportunities for comparing learners’ outcome data. Research has indicated that learners whose teachers created SLOs showed significant academic growth compared to those whose teachers did not create SLOs. The exploration of SLO efficacy has been a focus of the Community Training and Assistance Center. Several research briefs show positive impacts on student learning and these include: Slotnik, W. and Smith, M. Catalyst for Change (2004) and It’s More Than Money (2013). See a full description of findings in these reports at www.ctacusa.com. Due to the importance of learner’s continual growth, not just mastering specific skill sets, the state of South Carolina requires teachers who have successfully completed their first year of teaching to create SLOs that:
Define the standards for exploration;
Describe how the teacher will facilitate his/her students’ growth towards these ends;
Identify learner differences and apply this knowledge to the process of effectively differentiating instruction;
Assess learners’ construct-relevant growth over time;
Make the appropriate modifications to instruction, as per assessment data; and,
Reflect upon the most and least effective practices. This final point is focused on the intersection between practice and students’ relative assets/strengths, and ways to increase student growth over time in the coming year.
In addition to using SLOs to foster P-12 student learning, they are used to systematize teachers’ evaluations of their practices and mechanisms for facilitating their learners’ growth while holding them accountable for the degree to which their learners’ progress academically. Specifically, teachers in South Carolina must indicate whether their SLOs were “met” or “not met”, which is then used as an indicator of teacher effectiveness in the classroom. Collection of SLOs through Voluntary Process EPP faculty contacted recent completers (both collectively at the EPP level and directly through program faculty) in the spring, summer and early fall 2018 in order to request voluntary sharing of SLO information submitted through district processes. The EPP also requested that candidates complete a brief demographic survey to allow the EPP to explore whether the characteristics of those who participated match the characteristics of those who graduated from the EPP. This process will be repeated each spring – when SLOs are due – and communication will likely be through program contacts, as this was the most successful approach.

Eighteen recent completers with an average of 2.8 years of experience submitted their SLOs. Based on a comparison of the sample and 2017-2018 completers, the sample is representative of all EPP completers regarding their gender and race, ethnicity, but the proportion of participants from specific majors differs. The EPP recognizes the possible limitations this difference causes. Disaggregated completer demographics and results are provided in the appendix. Each SLO document was given a code number, so that completer’s names could be removed (all P-12 learners’ names and identifiers were also stripped from the SLOs prior to their submission to WU). Code numbers were linked to participants’ (in this case, completers who submitted an SLO) gender, race, grade level taught, subject level taught, and district. Again, these data were used to determine the representativeness of the sample, given the characteristics of the overall population of 2017-2018 completers. Reports include binary information regarding whether specific SLO was “met” or not. Some of the SLOs submitted to Winthrop by recent completers, however, did not explicitly indicate whether the outcome was met. Based on the data from the sample, the average percentage of students who met the SLO target was 85% and the most frequently reported percentage of students having met the SLO target was 94%. Although this pilot of a process to explore completer impact is in its preliminary stages, the analysis of voluntarily submitted data indicates that our completers are indeed having positive impact on student learning. SLO Data from District Two Data from an additional 30 recent WU completers working in District Two indicated that, from fall 2017 to spring 2018, 97% of the teachers’ students met their SLO target goals. This district provided only teacher assignment level and whether or not the SLO target growth was met or not met. Disaggregated data for this sample is available in the appendix. Influence of District-Specific Processes The state has identified expectations for the SLO process and provided a sample template for use; however, districts have the autonomy to make modifications and create expectations for processes that are locally defined. The differences in templates and supports potentially influences the information provided. In examining the information submitted, the EPP noted all templates contained goals, student characteristics, instructional practices enacted, measures used, and results. However, not all expected an explicit reflection. SLO report structures included cases where completers were asked to provide responses in a table format that allowed for bulleted lists while others allowed for more general narratives.
Structural and support differences likely influence depth of response and possibly level of reflection. Future efforts may explore the impact of these differences as compared to reported student growth. In other words, if the process of exploring an SLO can be linked the positive impacts on student learning as suggest by the work of the Community Training and Assistance
Center, then does differences in the process itself impact learning. Even with the differences in reporting, the data indicate that WU completers were able to demonstrate facets of the professional knowledge and skills that the WU initial preparation program has intended to cultivate in its completers through the provision of targeted didactic and experiential teacher training. Representative examples over all analysis of responses are provided in key areas to illustrate the range of answers given.
Conclusions from SLO Examination
Based on the two different data collection methods for SLO data, there is evidence that completers contributed to their students’ targeted academic growth. Although the EPP recognizes that the validity and reliability of conclusions derived from smaller sample sizes should be viewed with care, these data are still important as the EPP explores completers’ impact.
Next Steps
The EPP and the districts in the PN are dedicated to exploring the efficacy of the teacher preparation program and the EPP as a whole. The CAEP Coordinator, the College Assessment Coordinator, and Rex Institute Director are the primary university-based leads on the efforts described here. Tracking impact on student learning has been complicated by changes in state testing and teacher evaluation requirements during the primary data collection period. Further, determining how to provide districts with information that enabled them to identify which completers were employed in their district/s significantly prolonged the data collection timeline. The EPP began its efforts with District Two and District Three. Although District Three is engaged in efforts around Standard 4 as a whole; it is working to provide student growth data in spring 2019. District One was actually contacted with the expectation that data would be included in a stage two exploration, yet they had information in the human resources database that allowed for the timely identification of completers. A district not yet engaged in any reporting is in the beginning stages of data collection, and the EPP expects this information will be available sometime in or around summer 2019. The EPP will continue to expand its efforts across districts to increase sample sizes and explore data sets that are increasingly representative of the larger population of recent completers. A clear weakness in this realm is evaluating completers’ impact on P-12 learners in the arts. In addition, the EPP is exploring Case Study efforts within Professional Development Schools in an effort to expand the Action Research data collected. Finally, the EPP will communicate to completers the importance of sharing SLO data when requested. Although SLOs are focused on the degree to which P-12 learners met a circumscribed set of targets, and the content therein is impacted by the variance in expectations regarding how much information to provide across

districts, these data will most likely provide the most direct and complete picture of candidate’s impact on their individual students. The MAP assessment is also an excellent metric for assessing impact, but is limited by content focus and grade-level implementation.

Summary of Action Research with Two District One Recent Completers
Both Ms. S and Mr. B (pseudonyms used to protect the identity of recent EPP completers who conducted this action research project), wished to explore how to facilitate peer-to-peer structured discussions as a mechanism for enhancing their middle-school students’ learning. To that end, they developed specific goals and procedures, which included setting up a control group that did not use the selected discussion strategy. The following chart provides an overview of their action research methods.
Ms. S Mr. B.
Teaching Assignment
7th grade science 8th grade mathematics
Goal To determine if ‘Think, pair, share’ is an effective strategy for promoting classroom discussion
To determine if ‘jigsaw’ is an effective strategy for promoting classroom discussion.
Objective Explain and give examples of how organic evolution occurs through natural selection
Model and explain the hierarchy of the real number system including natural, whole, integers, rational, and irrational numbers.
Student Prompt in Intervention Group
Example or non-example? People breeding horses to run faster. Then she asked her students to discuss “both sides of the argument, is this an example or non-example of how organic evolution occurs through natural selection?
What categories in the real number system do the following numbers belong to and why”? Numbers used: -5/6, 0, -√4, √100, √16/2, and – 12.75 Number Systems: real, rational, irrational, integer, whole and natural
Post Instruction Assessment
What is not an example of organic evolution occurring through natural selection? What is the difference between natural selection and artificial selection?
Classify -8, 0.5, and √8 as real, whole, natural, irrational and/or rational.
Qualitative Data on discussion
During the jigsaw activity the instructor as well as induction specialist noted the range of student comments and function of the group. First the males and females approached the task differently and as gender-specific groups. A student also ask about the role of grades and this immediately changed the approach. The comments below show the range of things the students discussed.
Conclusion
Data indicated that the “Think, Pair, Share” pedagogical practice facilitated student learning, given the larger proportion of students who “met expectations” on both Q1 and Q2 in the treatment group, as compared to the control group.
Data indicated that the “jigsaw” pedagogical practice facilitated student learning, given the larger proportion of students who “met expectations” in the treatment group as compared to those in the control condition – particularly in the response to 0.5 and √8.

After having analyzed and discussed the quantitative and qualitative data they collected, Ms. S and Mr. B also generated questions that they felt, if answered, could enhance their students’ growth. These are
In the classroom, how does the demonstration of stereotypical gender roles influence content mastery?
Does student feedback lead to content mastery? Will students pursue high academic gains in the absence of graded assignments?
Sample Presentation Slides for Action Research Ms. S
Ms. S’s Quantitative Data Indicating Student Learning between the Two Groups Disaggregated by Question
Ms. S’s Qualitative Data
Mr. B
Mr. B’s Quantitative Data Indicating Student Learning between the Two Groups Disaggregated by Question
Mr. B’s Qualitative Data

Cover Sheet Winthrop University Exploration of Graduate Impact on K-12 Learners
The Richard W Riley College of Education needs your help to meet accreditation standards associated with showing the impact of our graduates on K-12 learners. In an effort to provide evidence to our accrediting body, we are hoping you will share SLO data collected this year. Please review the following protections and requests.
Although we are requesting your name and school here to help us with management of information over time and program, your name and school will not be identified in any accreditation or other report produced.
We are only using this data to evaluate the impact Winthrop’s program is having on teaching and learning and will not use this information in any way to evaluate individuals.
Although we identify below the kind of information that is helpful for us to have in order to address accreditation standards, we are not asking that you change the format in which you were expected to provide information to your school/district. We will work through the information you give us.
We have requested contact information in case we have questions. Demographic data
Name
Email address for questions
School
Grade Level(s)
Subject
Name while at Winthrop
Certification Program at Winthrop
Total # of Years teaching
Is this an Individually or Group created SLO?
The types of information that we are hoping to receive (please do not include student names on information shared):
Statement of the SLO and associated state standards or expectations.
Brief description of the content covered in the SLO exploration.
Description of the student population.
Description of the pre- and post-test measures with a brief description of the expected growth targets used for
the students.
Progress monitoring plan.
Instruction decisions made before, during, and/or after unit that were based on the data collected.
% of students that met the growth targets and the total number of students included.
Overall reflection provided to your school as part of the SLO process.

Student Learning Objective (SLO) Template
☐ This SLO serves as the Professional Growth and Development Plan (Section I only)
☐ This SLO serves as one of multiple goals of the Professional Growth and Development Plan. (Section I and II)
Section I. SLO
Teacher Name: Click here to enter text. Teacher School: Click here to enter text.
SLO Evaluator Name: Click here to enter text. SLO Evaluator Position/Role: Click here to enter text.
Grade Level: Click here to enter text.
SLO Content Area: Click here to enter text.
SLO Type: Choose One
☐ Individual (written by an individual teacher)
☐ Team (team of teachers focus on a similar goal but are held accountable for only their students)
SLO Approach: Choose One
☐ Class (covers all of the students in one class period i.e., 2nd period Biology, 4th period Beginning Pottery, etc.)
☐ Course (covers all of the students enrolled in multiple sections of the course (i.e., all of a teacher’s Biology 2 students, all of a teacher’s Beginning Pottery students, etc.)
SLO Interval of Instruction Choose One
☐ Year
☐ Semester
☐ Other If Other, provide rationale (i.e. quarter long course) and indicate days of instruction. Rationale: Click here to enter text. Days of Instruction: Click here to enter text.
Assessment Dates Pre-Assessment Date: Click here to enter text. Post-Assessment Date: Click here to enter text.
I. Student Population (Key Element 1.A) Provide a detailed description of the student population. Information should include, but is not limited to, the following: the number of students in the class, a description of students with exceptionalities (e.g., learning disability, gifted and talented, English language learner [ELL] status, etc.), and a description of academic supports provided to students (e.g., extended time, resource time with EC teacher, any classroom supports that students receive to help them access the core curriculum).
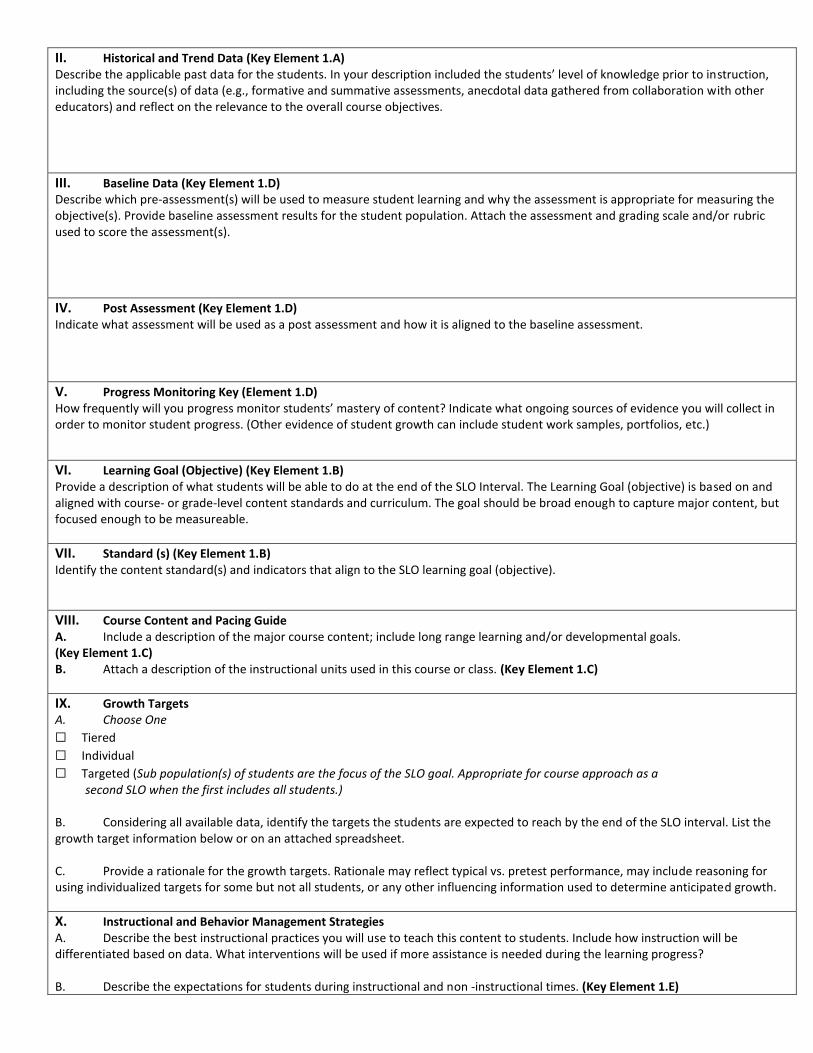
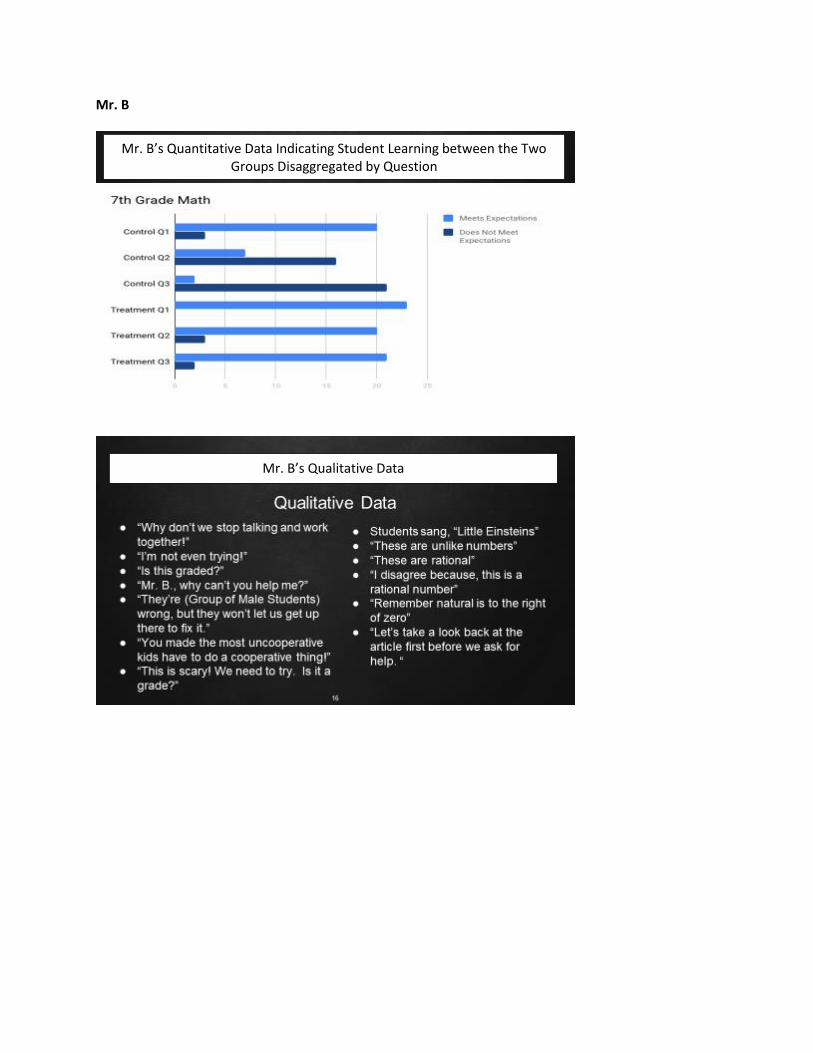
II. Historical and Trend Data (Key Element 1.A) Describe the applicable past data for the students. In your description included the students’ level of knowledge prior to instruction, including the source(s) of data (e.g., formative and summative assessments, anecdotal data gathered from collaboration with other educators) and reflect on the relevance to the overall course objectives.
III. Baseline Data (Key Element 1.D) Describe which pre-assessment(s) will be used to measure student learning and why the assessment is appropriate for measuring the objective(s). Provide baseline assessment results for the student population. Attach the assessment and grading scale and/or rubric used to score the assessment(s).
IV. Post Assessment (Key Element 1.D) Indicate what assessment will be used as a post assessment and how it is aligned to the baseline assessment.
V. Progress Monitoring Key (Element 1.D) How frequently will you progress monitor students’ mastery of content? Indicate what ongoing sources of evidence you will collect in order to monitor student progress. (Other evidence of student growth can include student work samples, portfolios, etc.)
VI. Learning Goal (Objective) (Key Element 1.B) Provide a description of what students will be able to do at the end of the SLO Interval. The Learning Goal (objective) is based on and aligned with course- or grade-level content standards and curriculum. The goal should be broad enough to capture major content, but focused enough to be measureable.
VII. Standard (s) (Key Element 1.B) Identify the content standard(s) and indicators that align to the SLO learning goal (objective).
VIII. Course Content and Pacing Guide A. Include a description of the major course content; include long range learning and/or developmental goals. (Key Element 1.C) B. Attach a description of the instructional units used in this course or class. (Key Element 1.C)
IX. Growth Targets A. Choose One
☐ Tiered
☐ Individual
☐ Targeted (Sub population(s) of students are the focus of the SLO goal. Appropriate for course approach as a second SLO when the first includes all students.) B. Considering all available data, identify the targets the students are expected to reach by the end of the SLO interval. List the growth target information below or on an attached spreadsheet. C. Provide a rationale for the growth targets. Rationale may reflect typical vs. pretest performance, may include reasoning for using individualized targets for some but not all students, or any other influencing information used to determine anticipated growth.
X. Instructional and Behavior Management Strategies A. Describe the best instructional practices you will use to teach this content to students. Include how instruction will be differentiated based on data. What interventions will be used if more assistance is needed during the learning progress? B. Describe the expectations for students during instructional and non -instructional times. (Key Element 1.E)

XI. Conference Reflection A. Percentage of Students Who Met Growth Targets ____________ % B. Reflection on Data How does the data inform your instructional practice, goal setting, or your professional development for next year?
Conference Date Signatures
SLO Preliminary Conference
SLO Mid-Course Conference
SLO Summative Conference
Section II. To be completed only if additional goals are needed.
Area to be addressed: (optional) Related ADEPT Performance Standard(s):
Area to be addressed: (optional) Related ADEPT Performance Standard(s):
Goal 2: Goal 3:
Strategies: Strategies:
Desired Outcome: Desired Outcome:
Reflect how these goals are related to your Professional Learning: (Teacher and Supervisor)

Evidence that the supervisor will consider in determining progress/goal accomplishment: Preliminary performance review (to be completed by the supervisor on the basis of the evidence) ___The educator has met the above goal. ___The educator is making satisfactory progress toward achieving this goal. ___The educator is not making satisfactory progress toward achieving this goal. Comments
The signatures below verify that the teacher has received written and oral explanations of the preliminary performance review.
Teacher Date:
Supervisor: Date:
Final performance review (to be completed by the supervisor on the basis of the evidence) ___ The educator has met the above goal. ___ The educator is making satisfactory progress toward achieving this goal. ___ The educator is not making satisfactory progress toward achieving this goal. Comments
The signatures below verify that the teacher has received written and oral explanations of the final performance review.
Teacher Date:
Supervisor: Date:
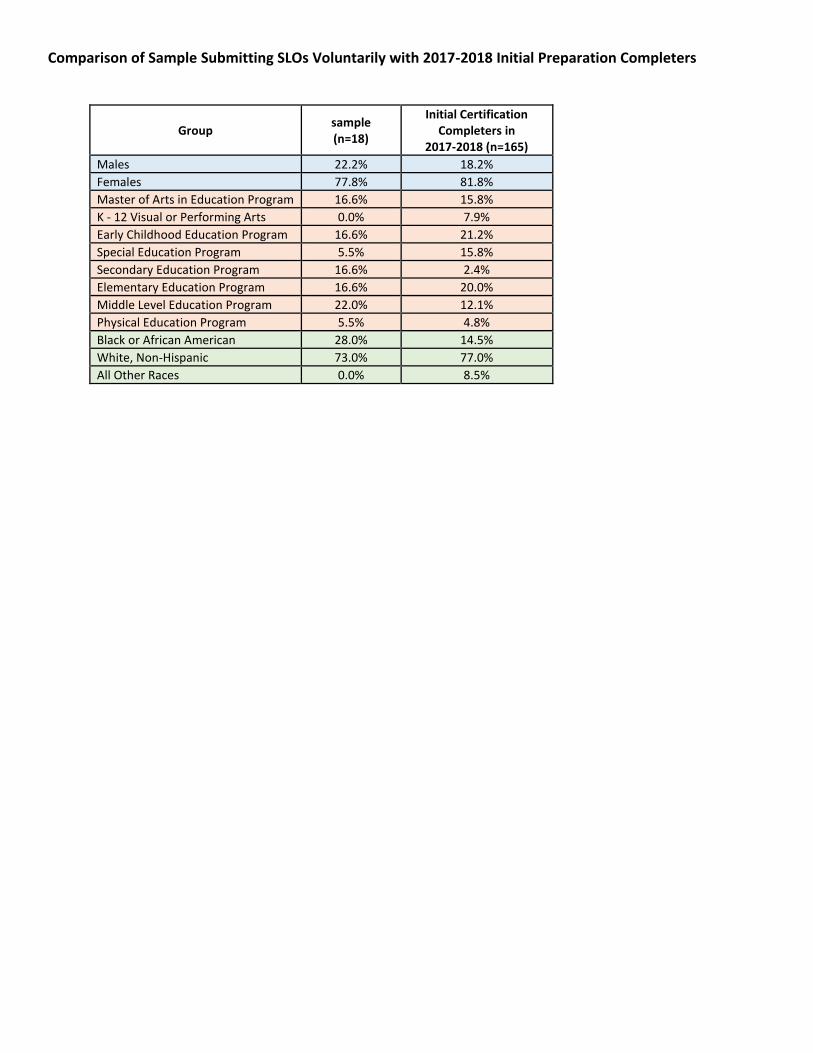
Comparison of Sample Submitting SLOs Voluntarily with 2017-2018 Initial Preparation Completers
Group sample (n=18)
Initial Certification Completers in
2017-2018 (n=165)
Males 22.2% 18.2%
Females 77.8% 81.8%
Master of Arts in Education Program 16.6% 15.8%
K - 12 Visual or Performing Arts 0.0% 7.9%
Early Childhood Education Program 16.6% 21.2%
Special Education Program 5.5% 15.8%
Secondary Education Program 16.6% 2.4%
Elementary Education Program 16.6% 20.0%
Middle Level Education Program 22.0% 12.1%
Physical Education Program 5.5% 4.8%
Black or African American 28.0% 14.5%
White, Non-Hispanic 73.0% 77.0%
All Other Races 0.0% 8.5%

Complete Demographic and Growth Target Data for SLO Voluntary Pilot
Program Gender Years of
Experience Grade / Subject Race Ethnicity District SLO outcome
Completer did not indicated whether SLO was individually or group created
Master of Arts in Teaching (Science)
Female 3 7th, Science White, Non-Hispanic Myrtle Beach unclear
Special Education Female 1 12+ English, Math, Life Skills
White, Non-Hispanic Lexington 01 unclear
Early Childhood Education Female 1 2nd Grade White, Non-Hispanic York County 03 94% met growth targets
Elementary Education Female 2 3rd grade White, Non-Hispanic York County 03 52% of students met target goal of 80%; 95% grew 20 points or more
Master of Arts in Teaching (English)
Female 2 9-12 English White, Non-Hispanic York Fort Mill unclear
SLO created individually
Master of Arts in Teaching (Math)
Male 4 9-12 Algebra/CS White, Non-Hispanic Dorchester 02 83% met growth targets
Master of Arts in Teaching (Science)
Female 5 9th Biology White, Non-Hispanic Greenville 01 91% met growth targets
Elementary Education Female 3 3rd, English/LA White, Non-Hispanic York Fort Mill
57% met ELA growth targets on MAP; 86% showed growth on the STAR assessment.
Master of Arts in Teaching Social Studies
Male 4 8th, Social Studies White, Non-Hispanic York District 1 100% met growth targets
Master of Arts in Teaching (Math)
Female 2 9-12 Math Black or African American
Chester 01 58% met growth targets
SLO created with other teachers
Middle Level Education Female 5 7th, Math Black or African American
Lexington 05 98% met growth targets
Middle Level Education Male 3 7 Math Black or African American
Anderson 05 unclear
Physical Education Male 3 6-8 Phys. Ed White, Non-Hispanic Richland County 01 96% met growth targets
Master of Arts in Middle Level Education
Female 2 8th Math Black or African American
Richland County 02 100% met growth targets
Middle Level Education Female 2 7th Science White, Non-Hispanic Greenville 01 unclear
Elementary Education Female 1 5, Reading White, Non-Hispanic York County 03 83% met growth targets
Early Childhood Education Female 3 2nd English/LA White, Non-Hispanic Chester 01 94% met growth targets
Early Childhood Education Female 5 PK Black or African American
Chester 01 94% met growth targets

Disaggregated SLO Data for District Two
Role % Growth in MAP
(Fall 2017 to Spring 2018) Overall % of Growth
SLO-MET or NOT MET
Classroom Teacher (Eng I Honors) 96.1% (Lang Arts 2A) 21.2% (Lang Arts 3A) 91.9% (Lang Arts 8H 4A)
70.0% 69.80% NOT MET
Classroom Teacher (Math 5A) 8.3% (Math 6A) 87.1% (Math 6H 1A) 9.1% (Math 6H 4A) 57.0% 40.38% MET
Classroom Teacher Area Not Tested MET
Prekindergarten (Child Development)
Grade Level Not Tested
MET
Classroom Teacher (Math) 62.6% (Reading) 69.9% 66.25% MET
Classroom Teacher (Math) 121.9% (Reading) 103.2% 112.55% MET
Classroom Teacher (Math) 52.7% (Reading) 50.0% 51.35% N/A
Classroom Teacher (Math) 77.6% (Reading) 82.4% (Language Usage) 75.2% 78.40% MET
Classroom Teacher (Math) 46.2% (Reading) 110.6% (Language Usage) 59.7% 72.17% MET
Classroom Teacher (Math) 59.3% (Reading) 81.3% (Language Usage) 73.8% 71.47% MET
Classroom Teacher Area Not Tested MET
Classroom Teacher Area Not Tested MET
Special Education (Self-Contained)
Area Not Tested MET
Classroom Teacher No comparative data (only tested once) MET
Classroom Teacher Area Not Tested MET
Special Education (Resource) Area Not Tested MET
Kindergarten (Math) 119.2% (Reading) 101.5% 110.35% MET
Classroom Teacher (Math) 75.6% (Reading) 95.3% (Language Usage) 82.2% 84.40% MET
Prekindergarten (Child Development)
Grade Level Not Tested
MET
Classroom Teacher (Lang Arts Gr 6-1)
65.9% (Lang Arts Gr 6-2)
68.4% (Lang Arts Gr 6-3) 135.1% (Math Gr 6-1) 59.2% 82.15% MET
Classroom Teacher Social Studies Area Not Tested MET
Classroom Teacher Area Not Tested MET
Classroom Teacher (English I-1) 154.3% (English I-2) 181.6% 167.95% MET
Classroom Teacher (Geometry 1) 82.1% 82.10% MET
Kindergarten (Math) 102.4% (Reading) 76.0% 89.20% MET
Classroom Teacher (Math) 101.6% (Reading) 109.5% 105.55% MET
Classroom Teacher (Math) 77.9% (Reading) 116.8% (Language Usage) 53.6% 82.77% MET
Classroom Teacher Area Not Tested MET
Classroom Teacher Area Not Tested MET

Role % Growth in MAP
(Fall 2017 to Spring 2018) Overall % of Growth
SLO-MET or NOT MET
Classroom Teacher Area Not Tested MET
Classroom Teacher (Math) 83.2% (Reading) 94.8% 89% MET
Special Education (Resource) Area Not Tested MET

Example or Summary SLO Responses from Voluntary Collection Methodology
SLO Statement and Associated State Standards
Sample one Sample two
Students will improve their reading accuracy and fluency of text, their comprehension of literary text and informational text, and their ability to convey information about what they have read.
RL/RI 4: Read with sufficient accuracy and fluency to support comprehension.
RL/RI 5: Determine meaning and develop logical interpretations by making predictions, inferring, drawing conclusions, analyzing, synthesizing, providing evidence, and investigating multiple interpretations.
RL/RI 6: Summarize key details and ideas to support analysis of thematic development (RL) or central ideas (RI).
RL7: Analyze the relationship among ideas, themes, or topics in multiple media, formats, and in visual, auditory, and kinesthetic modalities.
RL 8: Analyze characters, settings, events, and ideas as they develop and interact within a particular context.
Students in Mr. M’s 5th period class will demonstrate an understanding of the history of South Carolina and the role that the state and its people have played in the development of the United States as a nation. Students will show a 10% gain from their pre-assessment to their post assessment in their ability to read, comprehend, and answer social studies standard aligned multiple choice questions.
Content Covered
Sample one Sample two
The Lucy Caulkins unit of reading for non-fiction places an emphasis on challenging fifth grade readers to understand and interpret complex non-fiction text. Initially students were exposed to analyzing theme through fiction text. This unit of study will examine expository text, building on the reader's ability to analyze complex and challenging passages. In future units, students will tackle Argument and Advocacy and Researching Debatable Issues.
Spotlight on Strategies (Discovery Education).
Reinforcement activities such as labs and other hands-on learning strategies
Apps and websites including: BioMan, HHMI's Click and Learn, Ecology Lab, and other various apps and websites.
Re-teaching resources can include YouTube channels like: Amoeba Sisters, Crash Course Biology, Bozeman Biology, and Stated Clearly
Shared ideas during collaborative planning
Use of Mastery Connect
Performance of Understanding Assessments
Content Covered
Sample three
a) Lesson 1: Operations with Integers – While not an 8th grade standard, this lesson was needed to fill gaps my students had based on the pre-assessment. For warm-ups, students will work on 6th and 7th grade IXL’s focusing on adding, subtracting, multiplying and dividing integers. Students will also take notes in their Interactive Student Notebook’s (ISN’s) that included vocabulary, graphic organizers and practice problems students could use to study integer rules and operations. Students also worked on partner activities where they had to solve expressions involving integer rules while checking each other’s work.
b) Lesson 4: Solving Two-Step Equations – For warm-ups, students worked on IXL solving one-step and two-step equations for supplemental practice. Students took notes and completed a graphic organizer to place in their ISN’s. This helped them learn the main goal, the steps, and the inverse operations to use in order to solve two-step equations. To practice the skill (in class and at home), students did two-step equation relay races, practice problems, Digits pages, a two-step equation maze and worksheets. Furthermore, we spent a day solving real-world problems involving two-step equations. (6 days, standard: 8.EEI.7)
c) Lesson 5: Solving Perfect Square/Cube Equations – For warm-ups, students worked on IXL solving perfect square and cube problems, and working on basic exponents to supplement their understanding of exponents. In their ISN’s, students copied a graphic down to help them remember inverse operations of squares/cubes and the steps to solving perfect square/cube equations. Students engaged in partner work helping one another solve perfect square/cube equations. In addition, they worked on worksheets, models and real-world problems involving perfect square/cube equations. (3 days, standard: 8.EEI.7)
d) Lesson 6: Solving Equations by Combining Like Terms – For warm-ups students worked on IXL, solving two-step equations and multi-step equation where they had to combine like terms. Due to students’ understanding of integer rules being low, students were taught using dividers and colors to combine like terms before solving the equations (these notes were given in their ISN’s). To practice this skill, students solved problems across the room, solved equations on the desk by doing “desk races,” they worked on worksheets, and did homework in Digits. (4 days, standard: 8.EEI.7)

Description of Student Population
Sample one Sample two
My class is composed of seventeen students--nine males and eight females. Included are seven Caucasian students, three African American, three Indian, one Romanian, and three mixed-races. Four students are served by our Gifted and Talented program, one by special services for Math, and one by ELL services. I have one student with a 504 plan for behavioral issues and receives weekly services from our guidance counselor
My class is a transition special education setting for students ages 18-21. My students come from the following school zones: RB, WK, L, G, and P. All students have deficits in reading, writing, math, and adaptive behaviors. To meet their functional needs, they participate in an alternate curriculum, known as Unique Learning System. Their courses include functional ELA, functional Math, Daily Living, Vocational skills, and Communication. My student population consists of 9 students, 6 males and 3 females. All of my students are significantly below grade level compared to their typically developing age appropriate peers. My students have the following disabilities:
4 students have been diagnosed with Autism.
4 students have been diagnosed with Down Syndrome.
7 students are classified as having a speech/ language impairment and receive speech services at school.
1 student is classified as having a mild intellectual disability.
3 students are classified as having a moderate intellectual disability.
1 student is classified as a student with Other Health Impairments
Pre- and Post- Measures
Most SLO’s submitted contained norm-referenced, standardized tests as the pre- and post- measures to be used to assess student learning. Some, however, included teacher-generated rubrics.
Progress Monitoring Plan
Sample one Sample two
The standards covered in this SLO (Fif.4, Fif.5, Fif.6, and Fif.9) center around the students’ ability to analyze functions. As such, the standards are re-visited throughout the year as students are asked to analyze the multiple types of functions covered in Algebra 2 such as quadratic functions, polynomial functions, and exponential functions. In each of these units of study, students will be assessed on their ability to analyze these functions. I will be able to monitor the students’ growth throughout the year and see their conceptual knowledge applied in a variety of contexts. In addition to my in-class assessments students will also be assessed quarterly through summative benchmarks.
“A variety of resources will be used to monitor student progress in English Language Arts. Fountas and Pinnell Benchmark assessments and STAR testing will be utilized to track individual student growth throughout the year. MAP will be used to assess students’ reading growth in the Fall and Spring. I will administer individual assessments as students demonstrate growth during guided reading instruction and individual conferring. I will utilize running records frequently to further monitor student growth in reading. Running records, anecdotal notes, and individual student conferencing notes will be collected. I plan to inform students of reading progress during individual student conferences. I plan to inform parents of their child´s reading progress through weekly boomerang folders, emails, phone calls, and parent-teacher conferences.
Instructional Decisions
Completers described a wide range of instructional decisions that they made, and were continuing to make, in order to foster their students’ knowledge and competencies. Their ability to diagnose student difficulties emerged in the context of the pedagogical strategies they enacted and planned to enact. A representative example of responses indicated that the completer provided could determine which students had conceptual knowledge, irrespective of the strategy used, as well as which had conceptual knowledge, but performed well due to careless mistakes. The example also detected which students conceptual understanding was hampered by cognitive overload, due to their limited computational automaticity.
Final Reflection
Not all SLOs contained final reflections, however, many did and included therein is information regarding how completers applied their professional and interpretative skills to make improvements in a variety of areas that included
general reflection on monitoring process to inform practice;
use of a spiral curriculum to target student needs; and
attention to instructional processes such as grouping.

District Information for All Standard 4 Data Collection Efforts These data were collected from district websites and 2018 school report cards. District One Data Collection Activities
Interviews
Student Achievement Data
Employer Surveys
Completer Surveys
Characteristics District One is a suburban district of approximately 15,000 students across 16 schools. A rapidly growing district, employing close to 2000, the district has opened new schools regularly over the past 5 years. Based on the District’s most recent school report card, student performance on the SC Ready English Language Arts and Mathematics tests (grades 3 to 8) indicate that the percentages of students who scored at the met or exceeding levels were 66% and 72% respectively. Student performance on End-of-Course Exams in English 1 and Algebra 1 indicated that 81% and 87% earned a “C” or better, respectively. The average ACT composite is 22 and SAT Composite is 1143. These scores and the districts’ graduation rate of 94% are higher than the state average. The student population has a lower diversity index than the state, and approximately 20% of students in this district are eligible for “free or reduced lunch.” District Two Data Collection Activities
Interviews
Student Achievement Data
Employer Surveys
Completer Surveys
Characteristics District Two is a rural district with approximately 5300 students and more than 800 employees. The district includes 15 schools of various sizes and types. Based on the District’s most recent school report card, student performance on the SC Ready English Language Arts and Mathematics tests (grades 3 to 8) indicate that the percentages of students who scored at the met or exceeding levels were 27% and 25%, respectively. Student performance on End-of-Course Exams in English 1 and Algebra 1 indicated that 46% and 54% earned a “C” or better, respectively. The average ACT composite is 16.4 and SAT Composite is 1015. These scores are slightly lower than state averages, as is the district’s graduation rate of 84%. The student population has a higher diversity index than the state, and approximately 67% of students in this district are eligible for “free or reduced lunch.” District Three Data Collection Activities
Interviews
Employer Surveys
Completer Surveys
Characteristics District Three – which serves a medium size city – is comprised of approximately 18,000 students and more than 2,400 employees. The district includes 27 schools of various sizes and types. Based on the District’s most recent school report card, student performance on the SC Ready English Language Arts and Mathematics tests (grades 3 to 8) indicate that the percentages of students who scored at the met or exceeding levels were 39% and 43% respectively. Student performance on End-of-Course Exams in English 1 and Algebra 1 indicated that 57% and 67% earned a “C” or better, respectively. Their SC Ready scores (grades 3 to 8) were slightly lower than state percentages, yet the two end-of-course percentages were slightly higher than the state. The

average ACT composite is 18.3 and SAT Composite is 1041. The district has a graduation rate of 83% which exceeds the state average. The student population has a higher diversity index than the state, and approximately 53% of students in this district are eligible for “free or reduced lunch.” District Four Data Collection Activities
Interviews
Characteristics District Four is a rural district with approximately 5250 students and more than 800 employees. The district includes 15 schools of various sizes and types. Based on the District’s most recent school report card, student performance on the SC Ready English Language Arts and Mathematics tests (grades 3 to 8) indicate that the percentages of students who scored at the met or exceeding levels were 32.5% and 46.5% respectively. Student performance on End-of-Course Exams in English 1 and Algebra 1 indicated that 54% and 61% earned a “C” or better, respectively. These testing results are very similar to state averages, yet the district has a graduation rate of 85% which exceeds the state average. The average ACT composite is 18.3 and SAT Composite is 1011. The student population has a lower diversity index than the state, and approximately 57% of students in this district are eligible for “free or reduced lunch.” District Five Data Collection Activities
Interviews
Characteristics District Five is geographically large, and regions of the district range from suburban upper class to rural low income. A smaller city is included within the district. The district has approximately 13,000 students and includes 22 schools of various sizes and types. This district is growing, especially in the regions of the county that are accessible to a large metropolitan city. Based on the District’s most recent school report card, student performance on the SC Ready English Language Arts and Mathematics tests (grades 3 to 8) indicate that the percentages of students who scored at the met or exceeding levels were 40.5% and 46.5% respectively. Student performance on End-of-Course Exams in English 1 and Algebra 1 indicated that 51% and 56% earned a “C” or better, respectively. These testing results are very similar to state averages, yet the district has a graduation rate of 83% which exceeds the state average. The average ACT composite is 17.7 and SAT Composite is 1016. The student population has a slightly lower diversity index than the state, and approximately 47% of students in this district are eligible for “free or reduced lunch.” However, to illustrate the demographic diversity in socioeconomic status, the range by school for “free or reduced lunch” is from 17% to 92% (both of which are elementary schools).