impact of tumor progression on cancer - cancer research
TRANSCRIPT

Integrated Systems and Technologies: Mathematical Oncology
Impact of Tumor Progression on Cancer Incidence Curves
E. Georg Luebeck1, Kit Curtius3, Jihyoun Jeon2, and William D. Hazelton1
AbstractCancer arises through amultistage process, but it is not fully clear how this process influences the age-specific
incidence curve. Studies of colorectal and pancreatic cancer using themultistage clonal expansion (MSCE)modelhave identified two phases of the incidence curves. One phase is linear, beginning about age of 60 years, suggestingthat at least two rare rate-limitingmutations occur before clonal expansion of premalignant cells. A second phaseis exponential, seen in early-onset cancers occurring before the age of 60 years that are associated withpremalignant clonal expansion. Here, we extend the MSCE model to include clonal expansion of malignantcells, an advance that permits study of the effects of tumor growth and extinction on the incidence of colorectal,gastric, pancreatic, and esophageal adenocarcinomas in the digestive tract. After adjusting the age-specificincidence for birth-cohort and calendar-year trends, we found that initiating mutations and premalignant cellkinetics can explain the primary features of the incidence curve. However, we also found that the incidence data ofthese cancers harbored information on the kinetics of malignant clonal expansion before clinical detection,including tumor growth rates and extinction probabilities on three characteristic time scales for tumorprogression. In addition, the data harbored information on the mean sojourn times for premalignant clonesuntil occurrence of either the first malignant cell or the first persistent (surviving) malignant clone. Finally, thedata also harbored information on themean sojourn time of persistent malignant clones to the time of diagnosis.In conclusion, cancer incidence curves can harbor significant information about hidden processes of tumorinitiation, premalignant clonal expansion, and malignant transformation, and even some limited information ontumor growth before clinical detection. Cancer Res; 73(3); 1–11. �2012 AACR.
IntroductionUncontrolled cell proliferation is the sine qua non of carci-
nogenesis. However, long before symptoms signal cancergrowth, several initiating mutations are generally required toovercome normal homeostatic regulation in a tissue allowingthe gradual expansion of premalignant clones. Albeit slow andpossibly stagnant, this growth enhances the probability that apremalignant cell undergoes malignant transformation gen-erating a clone that either becomes extinct or progresses untilclinical detection. Therefore, at least 2 distinct but overlappingclonal expansion processes are likely to occur in a tissue beforeclinical detection of cancer. In the context of the multistageclonal expansion (MSCE) carcinogenesis model describedhere, the first clonal expansion begins after normal tissue stemcells acquire 2 rate-limiting mutations or epigenomic changesthat lead to abrogation of homeostatic tissue control, causinggradual outgrowth of occult premalignant clones over anextended time period that may range from years to decades(1). Clonal expansion of the premalignant cell populationenhances the probability that one or more of these cells suffer
Authors' Affiliations: Programs in 1Computational Biology and 2Biosta-tistics and Biomathematics, Fred Hutchinson Cancer Research Center;and 3Department of Applied Mathematics, University of Washington,Seattle, Washington
Note: Supplementary data for this article are available at Cancer ResearchOnline (http://cancerres.aacrjournals.org/).
Corresponding Author: E. Georg Luebeck, Fred Hutchinson CancerResearch Center, 1100 Fairview Ave N, M1-B514, Seattle, WA 98185.Phone: 206-667-4282; Fax 206-667-1319; E-mail: [email protected].
doi: 10.1158/0008-5472.CAN-12-2198
�2012 American Association for Cancer Research.
Major FindingsCancer incidence curves harbor information about hidden pro-
cesses of tumor initiation, premalignant clonal expansion,malignanttransformation, and even some limited information on tumorgrowth before clinical detection. Our analyses of the incidences offour digestive tract cancers show that the age-specific incidencecurves—upon adjustments for secular trends and, in the case ofesophageal adenocarcinoma, inclusion of an event describing theconversion of normal squamous to metaplastic Barrett's epitheli-um—are well approximated by a model, which explicitly incorpo-rates the stochastic growth kinetics of premalignant clones, thesporadic appearance of malignant cells within these clones, and aconstant time delay corresponding to the mean sojourn time of amalignant clone. While this sojourn seems very short for pancreaticcancer (<3 years), intermediate for colorectal cancer (5–7 years), itis much longer for gastric cancer and esophageal adenocarcinoma(10–12 years). Furthermore, with the exception of pancreatic cancer,our results are consistent with the assumption of a high (>95%)probability of tumor stem cell extinction or terminal differentiation.
CancerResearch
www.aacrjournals.org OF1
Research. on April 13, 2019. © 2012 American Association for Cancercancerres.aacrjournals.org Downloaded from
Published OnlineFirst October 10, 2012; DOI: 10.1158/0008-5472.CAN-12-2198
additional mutations or epigenomic alterations that causemalignant transformation, which enables tumors to accel-erate their growth and invade neighboring tissue, a processcaptured by the second (malignant) clonal expansion in themodel.
Here, we ask the basic question, how do the rate-limitingsteps involved in tumor initiation, malignant transforma-tion, and ensuing clonal expansions influence the shape ofthe cancer incidence curve? Conversely, what can wepossibly learn from observed incidence curves about thesehidden processes? In previous studies (1–4), we identified 2characteristic features, or phases, in the incidence curvesfor colorectal cancer (CRC) and pancreatic cancers usingdata from the Surveillance Epidemiology and End Results(SEER) registries (5). After adjusting for secular trendsrelated to birth-cohort and calendar-year (period), we wereable to identify an exponential phase in the incidence curvebeginning in early adult life and extending to approximate-ly the age of 60 years and a linearly increasing trend forlate-onset cancers extending beyond the age of 60 years. Inthis study, we ask the question whether the impact ofmalignant growth and fitness (defined as clone survival)on observed incidence patterns is actually discernable? Toaddress this question, we use a MSCE model that explicitlyincorporates distinct (but overlaping) clonal expansionsfor premalignant and malignant cells giving rise to adistribution of malignant tumors in a tissue and clinicalobservation of cancer via a stochastic detection event
occuring in a preclinical tumor. In contrast, earlier versionsof the MSCE model assumed that the first malignant cell ina tissue necessarily leads to clinical detection after apossibly random lag-time. Malignant transformations,however, are likely to occur in altered cells whose initialsurvival fitness may be compromised by genomic instabil-ity (6) and therefore, may be prone to extinction despitehigher cell proliferation. This is supported by comparativemeasurements of cell division rates and net cell prolifer-ation (using DNA labeling and radiographic imaging oftumors, respectively) in a variety of carcinomas, showinglarge differences in the 2 rates, which can only be explainedby the frequent death of tumor cells (7).
For this model-driven investigation of cancer incidence,we analyze SEER-9 (5) incidence data (1975–2008) for 4gastrointestinal malignancies: CRC, gastric cancer, pancre-atic cancer, and esophageal adenocarcinomas (EAC). Webegin by adjusting for period and birth-cohort effects, usingrigorous likelihood-based methods to estimate model para-meters for the extended MSCE model, including malignantclonal expansion rates for each cancer type. We then esti-mate 3 characteristic times: (i) the mean sojourn times forpremalignant clones until occurrence of the first malignantcell regardless of its fate, (ii) the analogous mean sojourntime to appearance of the first surviving (persistent) malig-nant clone, and (iii) the mean sojourn time of persistentpreclinical cancers from first malignant cell to time ofcancer diagnosis.
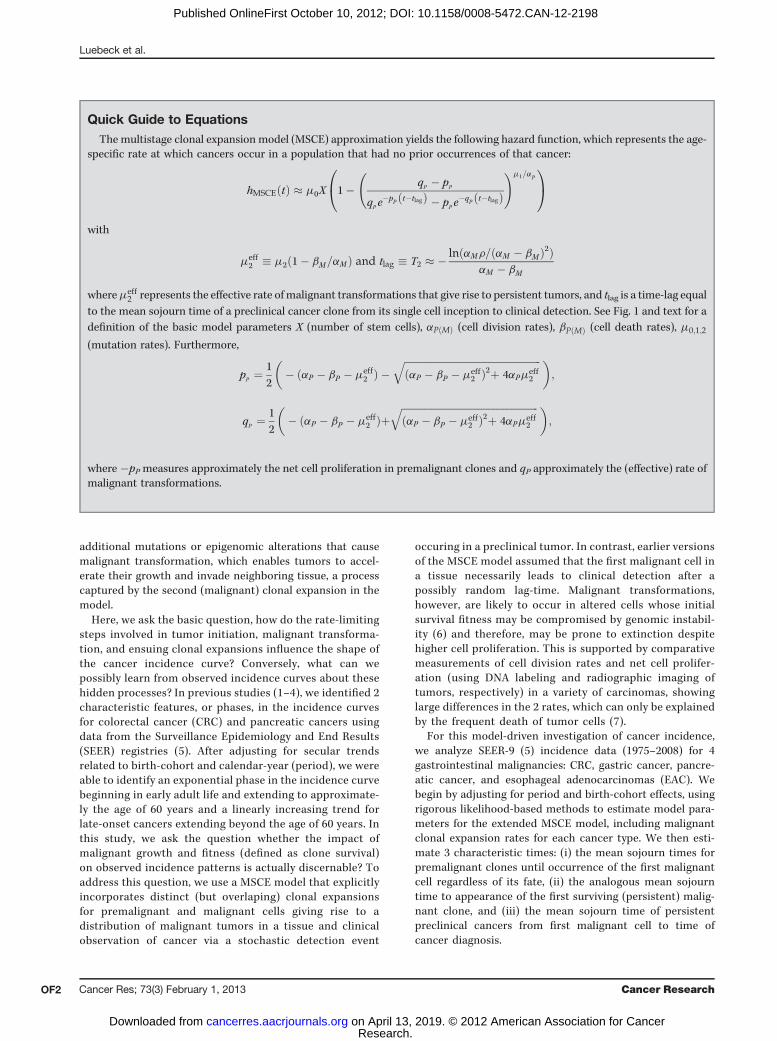
Quick Guide to EquationsThe multistage clonal expansion model (MSCE) approximation yields the following hazard function, which represents the age-
specific rate at which cancers occur in a population that had no prior occurrences of that cancer:
hMSCEðtÞ � m0X 1� qP � pP
qP e�pP t�tlagð Þ � pP e
�qP t�tlagð Þ
!m1=aP0@
1A
with
meff2 � m2ð1� bM=aM Þ and tlag � T2 � � lnðaMr=ðaM � bM Þ2Þ
aM � bM
wheremeff2 represents the effective rate ofmalignant transformations that give rise to persistent tumors, and tlag is a time-lag equal
to the mean sojourn time of a preclinical cancer clone from its single cell inception to clinical detection. See Fig. 1 and text for adefinition of the basic model parameters X (number of stem cells), aPðMÞ (cell division rates), bPðMÞ (cell death rates), m0;1;2
(mutation rates). Furthermore,
pP ¼1
2
�� ðaP � bP � meff
2 Þ �ffiffiffiffiffiffiffiffiffiffiffiffiffiffiffiffiffiffiffiffiffiffiffiffiffiffiffiffiffiffiffiffiffiffiffiffiffiffiffiffiffiffiffiffiffiffiffiffiffiffiffiffiffiffiffiðaP � bP � meff
2 Þ2þ 4aPmeff2
q �;
qP ¼1
2
�� ðaP � bP � meff
2 ÞþffiffiffiffiffiffiffiffiffiffiffiffiffiffiffiffiffiffiffiffiffiffiffiffiffiffiffiffiffiffiffiffiffiffiffiffiffiffiffiffiffiffiffiffiffiffiffiffiffiffiffiffiffiffiffiðaP � bP � meff
2 Þ2þ 4aPmeff2
q �;
where �pP measures approximately the net cell proliferation in premalignant clones and qP approximately the (effective) rate ofmalignant transformations.
Luebeck et al.
Cancer Res; 73(3) February 1, 2013 Cancer ResearchOF2
Research. on April 13, 2019. © 2012 American Association for Cancercancerres.aacrjournals.org Downloaded from
Published OnlineFirst October 10, 2012; DOI: 10.1158/0008-5472.CAN-12-2198

Combined with a mathematical exploration of the MSCEmodel hazard function (i.e., the model-derived function thatpredicts the age-specific cancer incidence) our numericalfindings support the hypothesis that the initiation of a benign(noninvasive) tumor, its malignant transformation, and per-sistence constitute major bottlenecks in the progression of apremalignant tumor to cancer. This is consistent with resultsfrom evolutionary models, which find neoplastic progressionto be driven mainly by mutations that confer only slightimprovements in fitness (8), whereas the transition from anoninvasive to an invasive tumor, which expands with asignificantly higher growth rate, constitutes a critical, rate-limiting event.
Materials and MethodsModel assumptions and properties
Tumor initiation. A hallmark of the MSCE model is thattumor initiation requires a number of rate-limiting mutationalevents before a stem cell can undergo a clonal expansion thatresults in a premalignant lesion (see Fig. 1). For colon andpancreatic cancer, we inferred previously that it takes 2 rarehits to transform a normal tissue stem cell into an initiatedtumor cell that is no longer under homeostatic control andundergoes a (first) clonal expansion (1). The 2 significant initialhits may represent biallelic inactivation of tumor suppressorgenes, such as Tp53 or P16 that occur frequently in many
Figure 1. A, the MSCE model for cancer with 2 stochastic birth-death-migration processes representing clonal expansions of premalignant and malignantcells. The model assumes a "two-hit" tumor initiation process with Poisson initiation rates m0, m1, which leads to the stochastic appearance ofpremalignant progenitor cells in the tissue. In the lower sample MSCE realization of the cellular process, premalignant cells undergo a first clonal expansiondescribed by a birth-death-migration process with cell division rate aP, cell death-or-differentiation rate bP, and malignant transformation rate m2.Malignant cells, in turn, undergo a second clonal expansion with cell division and death rates aM and bM, respectively, allowing for stochastic growthand possibly extinction of the malignant tumor. Clinical detection occurs through a size-based detection process with parameter r. The sample sojourntime T1 represents the time from the initiation of a premalignant clone until first malignant transformation. The sample sojourn time Teff
1 represents the timefrom the initiation of a premalignant clone to the first malignant cell in that clone that results in a persistent tumor, which escapes extinction. Finally, thesample sojourn time T2 represents the time for a persistent tumor to develop from a single malignant cell to detected clinical cancer. TheMSCEmodel is wellapproximated by MSCE-1 approximation (B), which includes an effective malignant transformation rate meff
2 (see text) and a constant lag-time for tumorprogression.
Impact of Tumor Progression on Cancer Incidence Curves
www.aacrjournals.org Cancer Res; 73(3) February 1, 2013 OF3
Research. on April 13, 2019. © 2012 American Association for Cancercancerres.aacrjournals.org Downloaded from
Published OnlineFirst October 10, 2012; DOI: 10.1158/0008-5472.CAN-12-2198

cancers, or theApc gene in CRC (9). Inactivation of TP53 is seenduring early development of many digestive tract cancers,including gastric cancer (10), pancreatic cancer (11, 12), andEAC (13–15). Inactivation of P16 often occurs early in thedevelopment of EAC (16) and other cancers. However, the 2 hitsmay also represent activation of an oncogene, such as Kras incombination with gain-of-function mutation in a tumor sup-pressor gene (12, 17). In addition, EAC is associatedwith earlierconversion of a section of normal esophageal squamous epi-thelium to intestinal type Barrett's metaplasia, called Barrett'sesophagus (BE). We model the transition to Barrett's esoph-agus as an additional one-time tissue alteration, which occursbefore the 2 initiating events leading to premalignant clonalexpansions in the development of EAC (3).
A mathematical consequence of the 2-hit hypothesis for(premalignant) tumor initiation is that the hazard function ofthe model (which represents the age-specific incidence) has alinearly increasing trend for older ages (1). The presence ofsuch a linear phase in the incidence curves for CRC andpancreatic cancer could indeed be shown by likelihood-basedcomparisons of models with 2 (or more) hits for initiation.Models with single-hit tumor initiations do not give rise to alinear phase in the hazard function (1, 2).
Tumor promotion. Before the transition into the initia-tion-associated linear phase, the MSCE hazard functionincreases exponentially with a rate, which is approximatelygiven by the net cell proliferation rate of premalignant P cells(1). The transition from the exponential phase to the linearphase occurs around the age of 60 years for CRC and pancreaticcancer. Clonal expansion of P cells is represented by a sto-chastic birth-death-mutation (bdm) process with cell divisionrate aP, death-or-differentiation rate bP, and mutation rate m2.The net cell proliferation rate of P cells is given by aP� bP�m2
and the asymptotic probability of extinction of P cells by theratio bP/aP (18), which is the probability that a premalignantcell, together with its progeny, will ultimately become extinct.Premalignant P cellsmay suffer furthermutations with ratem2,which transform them into malignant (M) cancer stem cells.Although the premalignant cell population is likely to undergoa complex evolutionary process involving multiple mutationsin critical regulatory pathways before acquiring a malignantphenotype (6), only 2 initial rate-limiting mutations beforeclonal expansion seem necessary to adequately describe themain shape of the incidence curve for the 4 digestive tractcancers studied here.
Tumor progression and cancer detection. Developmentof a preclinical tumor in the MSCE model begins with asingle (malignant) cell, which undergoes clonal expansionand eventually, if the clone survives extinction, progresses toclinically detectable cancer. In contrast to natural historymodels in which the preclinical state of a tumor is typicallyassumed to be screen-detectable, the preclinical tumordevelopment in the MSCE model starts off with a singlemalignant cell, which undergoes a clonal expansion andeventually, if the clone survives extinction, is detected ascancer. Mathematically, the growth of the malignant tumoris described by a stochastic birth–death (bd) process withcell division rate aM and cell death rate bM. Clinical detec-
tion of the tumor is similarly treated as a stochastic eventwith rate r per cell. This implies that a tumor of size n cellshas probability nrDt to be detected in a time interval Dtshort enough for the tumor to be constant in size. We referto this generalization of the birth–death process as a birth-death-observation (bdo) process. Note, all analyses reportedhere are with a fixed value of r ¼ 10�7. The rationale for thisparticular value of r is that a typical tumor contains about109 cells upon (symptomatic) detection and that only about1% of the tumor volume is occupied by actively dividingtumor cells (19). Results obtained with other values for r (inthe range of 10�6 � 10�8) were similar and did not changeour conclusions (see Supplementary Information).
The essential stochastic components of theMSCEmodel areillustrated in Fig. 1, including separate clonal-expansions forpremalignant and malignant cells. As we will show here (seeResults), theMSCEmodel contains an approximation (referredto asMSCE-1), which differs from the originalMSCEmodel in 2important aspects: (i) the rate at which P cells suffer a trans-formation event that gives rise to a detectable cancer isapproximated by an "effective" transformation rate, meff
2 , and(ii) the approximation requires a lag-time to allow for the timefrom firstmalignant cell that forms a persistent cancer clone tothe time of diagnosis. Furthermore, not all of the MSCE modelparameters are identifiable from incidence data—some para-meters must be fixed initially to achieve parameter identifia-bility, as discussed in the Results and in the SupplementaryInformation.
Whilemultistage generalizations of themodels shown in Fig.1 have also been explored by others (20–24), the general impactof malignant tumor progression on the hazard function (andthe age-specific incidences of the cancers modeled here) hasnot been fully characterized (1–4), especially in regard to thetime scales of premalignant and malignant clonal expansion.However, Fakir and colleagues (20, 21) modeled stochasticeffects of lung cancer progression by augmenting a similarmodel with a more realistic progression model, includingextinction and/or dormancy, proliferation, and invasivegrowth.
MSCE model hazard function. For the full versiondepicted in Fig. 1, which includes 2 stochastic clonal expan-sions, it is straightforward to derive the probability,PMSCE(t), for a cancer diagnosis/detection to occur by timet. A general approach is to solve the Kolmogorov backwardequations for the marginal probability generating functionsproperly conditioned on no cancer occurring before time t,as shown in the Supplementary Information. This yields theMSCE-survival function SMSCE(t) ¼ 1 � PMSCE(t). The MSCEhazard function—the rate at which preclinical cancer cellscollectively trigger a first clinical observation event—isgiven by:
hMSCEðtÞ ¼ � ddt
logSMSCEðtÞ ¼ � _SMSCEðtÞ=SMSCEðtÞ; ð1Þ
(where the dot represents a derivative with respect to t).hMSCE(t) can be computed by numerically solving a set ofordinary differential equations as described in the Supplemen-tary Information.
Luebeck et al.
Cancer Res; 73(3) February 1, 2013 Cancer ResearchOF4
Research. on April 13, 2019. © 2012 American Association for Cancercancerres.aacrjournals.org Downloaded from
Published OnlineFirst October 10, 2012; DOI: 10.1158/0008-5472.CAN-12-2198

DataWe used data from the SEER database by the National
Cancer Institute. Incidence data were for all races by single-years of ages between 10 and 84 years and calendar-yearbetween 1975 and 2008 for males and females (all races) inthe original 9 registries (SEER-9; ref. 5). Incident cancers weredefined using the International Classification of Diseases forOncology, Third Edition (ICD-O-3) as follows: CRC (C18-C20);EAC (C150-C159, 8140/3 adenocarcinoma NOS); gastric cancer(C16); and pancreatic cancer (C25). Population data were alsodownloaded for the 9 SEER catchment areas by gender andsingle-years of age and calendar-year. Methods for adjustingfor secular trends (period and cohort effects) are described inthe Supplementary Information.
ResultsWe find that modeling of cancer incidence data provides
new insights into the importance of clonal extinction andclonal growth rates (or doubling times) of premalignant andmalignant clones in relation to 3 underlying time scales incarcinogenesis: themean sojourn time for premalignant clonesuntil occurrence of the first malignant cell (T1), the meansojourn time for premalignant clones until the first survivingmalignant clone ðTeff
1 Þ, and themean sojourn time of persistentpreclinical cancers from first malignant cell to time of diag-nosis (T2). In the following, we show how these time scalescontribute to, and are estimable from, the age-specific inci-dence curves of 4 digestive tract cancers.
Mathematical properties of MSCE-1 approximationTo gain insights into how tumor progression is impacting
cancer incidence, we begin with a mathematical dissection ofthe hazard function generated by the MSCE model depictedin Fig. 1. This will show that the MSCE model (with a distinctclonal expansion for malignant cells) can be closely approx-imated by a reducedmodel (MSCE-1), which adjusts the rate ofmalignant transformation, m2, for nonextinction and furthermodels the outgrowth of persistent malignant clones as aconstant time-lag, tlag, which in turn is approximated by themean sojourn time of a surviving malignant clone, from itsinception to detection of cancer, T2. To better understand therelationship between tlag and the mean sojourn time T2 in theMSCE model, we show (proof given in Supplementary Infor-mation) that the hazard function of amodel with 2 consecutiveclonal expansions for premalignant and malignant cells ismathematically equivalent to a model with a single clonalexpansion of premalignant cells with a time-dependent muta-tion rate, that is, replacing m2 $ m2 (1 � SM(u)), where 1 �SM(u) is the unnormalized probability of detection of malig-nant clones a time u after the malignant clone is seeded. Anexact expression for SM(u) is given in the SupplementaryInformation for constant parameters. However, this mathe-matical "simplification" of the model from a double to a singleclonal expansion process comes at the cost of a time-depen-dent (conditional) mutation rate.The time-dependence of the conditional mutation rate
m2(1 � SM(u)) has 2 main effects: (i) it reduces the effective
rate of malignant transformation, and (ii) it creates a timedelay for a malignant clone to grow, conditional on its non-extinction, into a detectable tumor. The latter effect is mainlydue to a sharp transition of the conditional mutation rate from0 to its asymptotic value after a time, which equals approxi-mately T2, the mean sojourn time of the malignant clone todetection of cancer (see Supplementary Information). Becauseasymptotically SM(u) ! bM/aM as: u ! ¥, we definemeff2 � m2ð1� bM=aMÞ as the effective malignant transforma-
tion rate for the reduced (MSCE-1) model. Therefore, theapproximation amounts to
m2 meff2
tlag T2:
ðMSCE-1Þ ðMSCEÞ ð2Þ
Again, T2 is the mean sojourn time of a surviving malignantclone, which avoids stochastic extinction and which, in theabsence of death, would eventually be detected as cancer. Themean sojourn time of a premalignant clone to the first malig-nant cell (T1), the analogousmean sojourn time to the ancestorof the first persistent malignant clone ðTeff
1 Þ, and the meansojourn time of a persistent malignant tumor (T2) to detectionare functions of the cell kinetic parameters and are given by(see Supplementary Information)
T1 ¼Z ¥
01� 1� SPðuÞ
1� bP=aP
� �du � � lnðaPm2=ðaP � bPÞ2Þ
aP � bP
T eff1 ¼
Z ¥
01� 1� SeffP ðuÞ
1� bP=aP
� �du � � lnðaPm
eff2 =ðaP � bPÞ2ÞaP � bP
;
T2 ¼Z ¥
01� 1� SM ðuÞ
1� bM=aM
� �du � � lnðaMr=ðaM � bMÞ2Þ
aM � bM;
respectively, where SP and SeffP are survival functions defined
analogously to SM (see Supplementary Information).
Parameter identifiability and sensitivityNot all of the MSCE model parameters are identifiable from
incidence data—some parameters must be fixed initially toachieve parameter identifiability (see Heidenreich and collea-gues; 25). Furthermore, for estimability, the exponential-then-linear character of the multistage hazard function (see Sup-plementary Information) suggest a parametrization thatinvolves the slope of the linear phase l � m0Xm1p¥ and thegrowth parameter of the exponential phase gP� aP� bP� m2
(1). Note, the rates m0 and m1 cannot be estimated separatelybecause the slope l depends on their product. Analogous topremalignant growth, we introduce the malignant growthparameter gM � aM � bM � r. To identify m2 and r, we findit necessary tofix the cell division ratesaP andaM. Although theproduct aMr is mathematically identifiable, we were not ableto obtain stable estimates and therefore also fixed the (per cell)cancer detection parameter r (see Materials and Methods).
To explore the dependence of our parameter estimates onthefixed parametersaP,aM, and the cancer detection rater, we
Impact of Tumor Progression on Cancer Incidence Curves
www.aacrjournals.org Cancer Res; 73(3) February 1, 2013 OF5
Research. on April 13, 2019. © 2012 American Association for Cancercancerres.aacrjournals.org Downloaded from
Published OnlineFirst October 10, 2012; DOI: 10.1158/0008-5472.CAN-12-2198

have also conducted a systematic sensitivity analysis. Theresults of this analysis (specifically, the ranges of the obtainedmaximum likelihood estimates for the parameters l, gP, gM,and meff
2 , assuming constant birth-cohort and calendar-yeareffects) for each fixed parameter are given in SupplementaryTable S1. This analysis (although limited to CRC) shows thatthe estimates of gM, and therefore the mean sojourn time T2,vary only slightly when aP and aM are perturbed but may varyup to 20% as the detection rate r changes an order ofmagnitude. Therefore, the dependence of the preclinical can-cer sojourn time on r is modest but does not change ourconclusions.
Low fitness of malignant cellsWe use the above results to gain insight into the impor-
tance of clonal extinction. Figure 2 shows fits obtained withthe MSCE model (solid line) to SEER incidence data for (i)CRC, and (ii) gastric cancers. These fits include adjustmentsof the model-generated hazard function for secular trends(for details see Supplementary Information). It is instructiveto mathematically "dissect" the MSCE hazard function toexamine the underlying behavior of the incidence curves forthe different malignant ancestors. The combined effects ofextinction and time for (malignant) tumor growth on inci-dence can be seen by substituting the "full" rate m2 intothe MSCE-1 approximation and ignoring the lag-time, thatis, tlag¼ 0 (dotted line in Fig. 2). The higher predicted incidencesans malignant cell extinction or tumor growth shows thatthese processes greatly reduce and delay cancer incidence andchange the shape of the incidence curve. In comparison,reintroducing the effects of extinction by replacing m2 withmeff2 (without a lag-time) restores the general shape of the
incidence curve (dot-dash line) except for cancers occurringtoo early. Finally, reintroducing the time-lag associated withmalignant tumor growth (T2) in the MSCE-1 approximationaccounts for both processes (dashed line) and provides anexcellent approximation to the exact incidence curve gener-ated by the full MSCE model (solid line).
Time scales of tumor progressionThe MSCE model explicitly models malignant transforma-
tions in premalignant tissues of an organ. These tissues maynot be uncommon as they may arise independently from alarge number of normal ancestor cells. However, our resultssuggest that most malignant cells and nascent malignanciesundergo extinction. The time difference between the appear-ance of the first malignant cell in a premalignant clone,regardless of its fate, and the first ancestor cell that leads toa stable malignant clone that is bound to turn into symptom-atic cancer (unless a patient dies before this happens or anintervention occurs) may be as long as 30to 40 years for gastriccancer (see Table 1), as long as 20 years for CRC and EAC, or asshort as 3 years, or less, in the case for pancreatic cancer. It isnot clear whether these differences reflect transformation-specific differences in cell survival, exogenous factors, cellsenescence, or differences in the degree of genomic instability.Whatever the origin, with the exception of pancreatic cancer,
our findings suggest a generally low viability of cancer cellsdespite their aggressive and invasive behavior.
In contrast, the estimated mean sojourn times T2 of persis-tent malignant clones vary from 10 to 12 years for gastriccancer and EAC, 5 to 7 years for CRC, and down to less than 1year for pancreatic cancer (Table 1). The latter is consistentwith the observation that most pancreatic carcinoma arediagnosed at an advanced metastatic stage. Note, however,that Teff
1 , the estimated mean time to the appearance of the
Figure 2. Deconstruction of the MSCE hazard function: malignant cloneextinction and tumor growth influence the incidence curves for CRC (A)and gastric cancer (B). (Plots for EAC and pancreatic cancer are similar,but not shown). The SEER data (adjusted for calendar-year and birth-cohort trends) are shown as circles and the overall fit using the MSCEmodel by the thin solid line. The dotted line on the left shows theunderlying hazard for the first malignant cell regardless of its fate. Incontrast, the dash-dotted line shows the hazard for the first ancestor of apersistent (i.e., surviving) malignant clone and the dashed line representsthe hazard for the first persistent malignant clone shifted to the right bythe mean sojourn time of the malignant clone to cancer detection, T2(see text).
Luebeck et al.
Cancer Res; 73(3) February 1, 2013 Cancer ResearchOF6
Research. on April 13, 2019. © 2012 American Association for Cancercancerres.aacrjournals.org Downloaded from
Published OnlineFirst October 10, 2012; DOI: 10.1158/0008-5472.CAN-12-2198

first persistent cancer clone (measured from the time theancestral premalignant cell is born) is somewhat longer forpancreas than colon (52.3 vs. 50.6 years formales, 56.3 vs. 48.7 infemales). This suggests that premalignant precursor lesions inpancreas, such as pancreatic intraepithelial neoplasia (PanIN),may be present for many years before a stable malignanttransformation occurs.For EAC, we also estimate a (constant) tissue conversion
rate, nBE, from normal esophageal tissue to the metaplastictissue of Barrett's esophagus. The age-specific prevalence ofBarrett's esophagus is therefore approximately nBE � age andseems to be subject to strong-period effects (3). Although ourMCMC-based estimates for nBE and the slope parameter lrepresenting initiation of premalignant clones are highly antic-orrelated (see Supplementary Fig. S1g–h), the predictedBarrett's esophagus prevalence (about 1.5% for males and0.5% for females at age of 60 years in the year 2000) areconsistent with the range of epidemiologic estimates obtainedfrom studies in comparable populations (26).
Tumor growth ratesWe find highly stable estimates for the net cell proliferation
rate gP of premalignant cells, based on the posterior distribu-tions of the identifiable MSCE model parameters given theobserved cancer incidences in SEER (see Supplementary Fig.S1). The reason for this stability seems to lie in the prominenceof the exponential phase of the incidence curve and theresulting linear behavior of the log-incidence (see Supplemen-tary Fig. S3). Surprisingly, with the exception of gastric cancersin females, the estimated net cell proliferation rates for pre-malignant lesions are similar and stay within a range of 0.14 to0.18 per year, whereas estimates for the net cell proliferationrate gM of the malignant lesions are much more variable andrange from1 per year in gastric and esophageal cancers to ratesas high as 30 per year for pancreatic cancer (see Table 2). Thesevalues correspond to tumor volume doubling times of 250 daysand 8 days, respectively, for this group of cancers. While theformer is consistent with clinical observations for early gastric
carcinoma, which are generally slow growing (27), the latterappears too fast, but not inconsistent with tumor markerdoubling times. For example, using the pancreatic tumormarker CA19-9, Nishida and colleagues (28) estimated dou-bling times from measurements in patients with inoperablepancreatic cancer in the range of 6 to 313 days. For CRC, theestimated malignant tumor volume doubling times are about93 days for males and 119 days for females. They too appear atthe lower end of the clinical spectrum but are consistent withthe determination by Bolin and colleagues (29), who followed27 carcinomas radiographically in the colon and rectum,measuring a median of 130 days with a range of 53 to 1,570days. Despite considerable uncertainty and variability of theclinical observations, the general agreement of the MSCEmodel predictions with sparse measurements of tumor dou-bling times lends support to our claim that carefully collectedincidence data harbor quantitative information about thenatural history of a tumor, from initiation to promotion tomalignant tumor progression.
DiscussionEarly models of carcinogenesis recognized the importance
of rate-limiting mutations but provided only crude fits tocancer incidence andmortality (30). Subsequent incorporationof cell proliferationmade it possible to account for effects, suchas the initiation/promotion effects seen in chemical carcino-genesis (31, 32) or the inverse dose-rate effect for high-LETradiation (33), that were more difficult to explain with modelsthat did not include clonal expansion. More recently, multi-stage extensions of the original 2-stage clonal expansionmodelby Moolgavkar and Knudson (34) andMoolgavkar and Venzon(35) have emerged as useful instruments to explore cancerincidence curves and isolate important secular trends thatsegregate with birth-cohort and/or calendar-year (period)from age effects driven by common underlying biologic pro-cesses (3, 4, 36). While secular trends are of great interest toepidemiologists and cancer control researchers in understand-ing the impact of screening, potential exposures to carcinogens
Table 1. MCMC-based estimates of various tumor promotion and progression time scales
T1 (95% CI) Teff1 (95% CI) T2 (95% CI) Tlag (95% CI)
MalesCRC 32.6 (30.4–36.8) 50.6 (49.7–52.1) 5.2 (3.6–6.2) 5.4 (3.1–7.0)GaC 17.9 (13.6–22.3) 45.8 (43.8–47.9) 12.2 (9.8–14.7) 9.5 (7.7–12.0)PaC 49.1 (40.4–52.6) 52.3 (50.9–52.9) 0.7 (0.4–2.2) 3.0 (0.2–6.8)EAC 15.0 (7.2–24.7) 39.2 (34.2–44.0) 12.0 (6.3–16.8) 12.7 (3.1–16.5)
FemalesCRC 27.5 (25.1–30.5) 48.7 (47.6–49.9) 6.5 (5.2–7.6) 6.5 (5.1–8.2)GaC 20.1 (16.8–23.4) 58.6 (56.8–60.5) 11.7 (10.1–13.2) 10.6 (9.1–11.7)PaC 53.2 (44.7–56.7) 56.3 (55.2–57.1) 0.6 (0.4–1.8) 1.7 (0.1–4.9)EAC 15.8 (13.8–18.4) 37.9 (31.8–45.1) 10.6 (7.8–13.8) 10.2 (7.2–13.2)
NOTE: Estimates represent medians and 95%credibility regions of themarginal posterior distribution for each quantity listed. All unitsare in years.Abbreviations: GaC, gastric cancer; PaC, pancreatic cancer.
Impact of Tumor Progression on Cancer Incidence Curves
www.aacrjournals.org Cancer Res; 73(3) February 1, 2013 OF7
Research. on April 13, 2019. © 2012 American Association for Cancercancerres.aacrjournals.org Downloaded from
Published OnlineFirst October 10, 2012; DOI: 10.1158/0008-5472.CAN-12-2198

(e.g., tobacco smoking), infections, diet, and lifestyle factors oncancer incidence, in this study, we focus on nonspecific effectsthat have their origin in common cell-level processes that drivethe age-effect, in particular the impact of malignant tumorprogression on the age-specific incidence curve.
Incidence curves are consistent with two types of clonalexpansions, slow and fast
Our MSCE model fits to the incidences of 4 gastrointestinalcancers (CRC, gastric cancer, pancreatic cancer, andEAC) yieldparameter estimates suggesting that malignant tumor pro-gression is preceded by a prolonged period of premalignanttumor growth characterized by a low rate of net cell prolifer-ation (Tables 1 and 2). In contrast, malignant tumor growth isestimated to be many-fold faster than premalignant growth.The model distinguishes features of the incidence curves thatrelate to slow growth of premalignant lesions and fast growthof malignant lesions, and allows estimation of the timeperiod in which tumors sojourn as slowly growing massesbefore becoming invasive. The effective sojourn time Teff
1 ,that is, the time of appearance of the first persistent malig-nant clone that started with a single premalignant cell,seems to be much longer than estimated from clinical data.For colon, clinical estimates range from 20 to 25 years (37).However, this usually refers to the time starting with a smalladenoma, which must have been already present for sometime. It is not known how long adenomas sojourn beforethey can be observed. A clue can be found in the averagetime to cancer among patients with familial adenomatouspolyposis (FAP), which can be viewed as a lower estimate forthe mean sojourn time of an adenoma, as adenomas arelikely to form early in life in patients with FAP even thoughthe diagnosis of polyposis may not occur until later. Fromthe age distribution of cancer with polyposis in patients withFAP (see ref. 37), which peaks around the age of 40 years, weconclude that the mean sojourn of an adenoma that has thepotential to progress to cancer is likely longer than 40 years,
as this time generally represents the time of first diagnosis ofthe cancer—a first passage time in statistical parlance—andnot an average time across all adenomas with neoplasticpotential including some that will not turn cancerous in aperson's lifetime. Our estimates of 50 to 55 years for themean duration of an adenoma developing into a detectablecarcinoma are therefore not inconsistent with what can beinferred from the incidence of CRC in FAP.
Identifiability of a malignant progression parameterOur mathematical analysis shows the approximate equiva-
lency of the hazard functions generated by the MSCE modeland a model with a single clonal expansion (MSCE-1), which isadjusted for clonal extinction and delayed by a lag-timerepresenting the mean sojourn time T2 of the surviving malig-nancy (see Fig. 1). Thus, in practice, only the time-scaleassociatedwithmalignant tumor progression canbe estimatedfrom cancer incidence data but not the full malignant cellkinetics given by the rates of malignant cell division aM, celldeath, bM, and (per cell) detection r. However, assumingplausible values for the cell division rates (aM) and a (per cell)cancer detection rate r (see sensitivity analysis), we do obtainestimates for the net cell proliferation rate gM in malignanttumors that yield tumor volume doubling times, which areconsistent with clinical observations from radiographic imag-ing of carcinoma (see Results).
For pancreatic cancer, the estimated sojourn times T2 formale and female preclinical malignancies are very short,suggesting that the model only captures the short metastaticphase of the development but cannot identify the sojourn ofthe primary tumor. It is conceivable that noninvasive precur-sors, such as the PanINs, interact with stromal componentssuch as myofibroblasts that facilitate invasion and metastaticcolonization (38). The resulting colonies may initially growslowly, perhaps similar to their parental premalignant pre-cursors but may acquire an aggressive and expansive pheno-type at a later time.
Table 2. MCMC-based estimates of various tumor promotion and progression time scales
l (95% CI) � 10�4 gP (95% CI) gM (95% CI) meff2 (95% CI) � 10�6
MalesCRC 2.13 (2.10–2.15) 0.162 (0.160–0.164) 2.71 (2.22–4.15) 0.73 (0.55–0.86)GaC 0.51 (0.49–0.53) 0.140 (0.135–0.145) 1.00 (0.80–1.30) 3.21 (2.16–4.65)PaC 0.35 (0.34–0.36) 0.181 (0.177–0.186) 27.7 (7.44–49.1) 0.25 (0.21–0.32)EAC 52.9 (34.8–99.3) 0.163 (0.133–0.190) 1.02 (0.68–2.19) 4.65 (1.65–10.8)
FemalesCRC 1.57 (1.55–1.59) 0.149 (0.147–0.151) 2.12 (1.75–2.75) 1.56 (1.26–1.87)GaC 0.40 (0.36–0.44) 0.100 (0.096–0.105) 1.06 (0.91–1.25) 2.83 (2.36–3.39)PaC 0.34 (0.33–0.35) 0.161 (0.157–0.165) 30.0 (9.10–50.0) 0.30 (0.26–0.36)EAC 9.1 (2.4–30.9) 0.170 (0.132–0.218) 1.18 (0.86–1.71) 4.65 (Fixed)
NOTE:These identifiableparameters aredefinedas:l ¼ m0 � X � m1 � p¥,gP ¼ aP � bP � m2,gM ¼ aM � bM � r,meff2 ¼ m2 � p¥. Here,we
define p¥ � 1� bM=aM (see Supplementary Information for more details). Estimates represent medians and 95%credibility regions ofthe marginal posterior distribution for each quantity listed. All units are in years.Abbreviations: GaC, gastric cancer; PaC, pancreatic cancer.
Luebeck et al.
Cancer Res; 73(3) February 1, 2013 Cancer ResearchOF8
Research. on April 13, 2019. © 2012 American Association for Cancercancerres.aacrjournals.org Downloaded from
Published OnlineFirst October 10, 2012; DOI: 10.1158/0008-5472.CAN-12-2198

Carcinogenesis may well require more than 2 clonal expan-sions. However, as shown by Meza and colleagues (1) for CRCand pancreatic cancer, the main features of the age-specificincidence curve can almost entirely be explained by theinitiation and growth characteristics of premalignant tumors.Here, we posed the follow-up question: what impact does asecond clonal expansion (say, representing malignant tumorgrowth) have on incidence curves. Our mathematical analysisshows that the impact amounts to a time-translation of theincidence curve, which seems to be identifiable in the SEERincidences studied here. This is consistent with the commonview that premalignant tumors and malignant tumors resultfrom rather distinct clonal expansions, which markedly differsfrom cell kinetics.
Comparison with DNA sequencing studiesFor CRC, Jones and colleagues (39) determined the time
required from the founder cell of an advanced carcinoma tothe appearance of the metastatic founder cell throughcomparative lesion sequencing in a small number of sub-jects. They concluded that it takes on an average 2 years forthe metastatic founder cell to arise in a carcinoma and anadditional 3 years for the metastatic lesion to expand, thus atotal of 5 years to the detection of the (metastatic) cancerafter the carcinoma forms. Our model-derived estimates forT2, the mean sojourn time for preclinical CRC (5–7 years) aretherefore in good agreement with the estimates for CRCusing a molecular clock based on mutational data andevolutionary analysis (39).More recently, Yachida and colleagues (40) undertook a
similar study for pancreatic cancer sequencing the genomesof 7 metastatic lesions to evaluate the clonal relationshipsamong primary and metastatic cancers (see also ref. 41).They estimated 6.8 years for the length of time from theappearance of subclones in the primary tumor with meta-static potential to the seeding of the index metastasis andadditional 2.7 years to detection. However, our T2 estimatesfor pancreatic cancer are inconsistent with those derived byYachida and colleagues (see the MCMC-based posteriordistributions for T2 in Supplementary Fig. S1). Remarkably,we find shorter times that suggest (see Discussion earlier),that the subclones found by Yachida and colleagues in theprimary may already have been present in a slow growingprecursor lesion. The question is therefore whether meta-static dissemination in pancreas can occur before the pri-mary tumor undergoes a drastic transformation into arapidly growing tumor.
LimitationsWe previously conducted comparative analyses of inci-
dence data with a variety of models: simple Markov processmodels without clonal expansion [e.g., the Armitage and Dollmodel (42, 43)], the 2-stage clonal expansion (TSCE) model(44, 45), and with biologically motivated extensions of theTSCE model (1–4). Although the latter usually provide super-ior fits to cancer incidence data as compared with theformer (1, 2, 4), MSCE models are by no means complete
descriptions of the cancer process but should be consideredbiologically motivated schemata that help to identify criticalprocesses and time scales in carcinogenesis. The models lackmany clinical and biologic features that may or may not berelevant to our understanding of incidence curves. Forexample, secular trends may also be viewed as acting quitespecifically on biologic parameters, whereas in this study, weuse a statistical approach [the age-period-cohort model(3, 4, 36)] to effectively adjust cancer incidence for seculartrends. Moreover, our analyses assume that all clonal expan-sions give rise to (mean) exponential growth even thoughclinical evidence suggests that tumors may slow theirgrowth in a Gompertzian manner due to limited nutrient/oxygen supplies as the tumor develops vasculature (46). Wealso did not model effects of tumor dormancy or potentialincreases in tumor growth rates due to subtle selectioneffects in the somatic evolution of the tumor. The inferredcell kinetics does represent an average rate, which maycomprise passenger mutations that confer weak or noselection and possibly driver mutations that are not rate-limiting (or not requisite) but are likely to speed up thegrowth process, as well as spatial (niche) effects and clonalinterference (as suggested by Martens and colleagues 48)that have the potential to slow the tumor growth process.While modeling these processes may well improve our fitsand alter certain parameter estimates, it is unlikely that suchfine-tuning will alter the parameters associated with thebasic 2 (exponential-then-linear) phases of the incidencecurves in a significant way. It is remarkable that in itspresent form, the MSCE model identifies mean sojourntimes for tumors that are broadly consistent with clinicalestimates despite the considerable uncertainties of ourestimates and ambiguities in clinical observations.
One way to improve the MSCE model and test modelassumptions is to incorporate data from screening andimaging of premalignant as well as malignant tumors.Screening for CRC provides information on the number andsizes of adenomatous polyps and screen-detected carcino-ma; whereas screening for EAC may include assessment ofthe presence or absence of dysplasia and/or chromosomalabnormalities in endoscopic biopsies and surveillance forearly cancer. Mechanistic models such as the MSCE modelmay use these different outcomes to enhance our under-standing of tumor initiation, growth, persistence, and pre-clinical sojourn.
In this study, we show that the preclinical phase ofmalignant tumor progression subtly influences the shapeof the age-specific incidence curve, leaving a "footprint" thatmay be identified through likelihood-based analyses of inci-dence data after adjusting for secular trends. We identifyand estimate 3 characteristic times scales of carcinogenesis:the mean sojourn time from premalignant cell to firstmalignant cell, T1; the mean sojourn time from premalignantcell to first malignant ancestor that generates a persistentclone, Teff
1 ; and the mean sojourn time it takes for persistenttumors to develop from a single malignant cell to clinicalcancer, T2. We conclude that malignant clone extinction andtumor sojourn times play important roles in reducing and
Impact of Tumor Progression on Cancer Incidence Curves
www.aacrjournals.org Cancer Res; 73(3) February 1, 2013 OF9
Research. on April 13, 2019. © 2012 American Association for Cancercancerres.aacrjournals.org Downloaded from
Published OnlineFirst October 10, 2012; DOI: 10.1158/0008-5472.CAN-12-2198

delaying cancer incidence and influencing the shape ofincidence curves for colorectal, gastric, pancreatic, andesophageal cancers.
Disclosure of Potential Conflicts of InterestNo potential conflicts of interest were disclosed.
Authors' ContributionsConception and design: E.G. Luebeck, W.D. HazeltonDevelopment of methodology: E.G. Luebeck, K. Curtius, W.D. HazeltonAcquisition of data (provided animals, acquired and managed patients,provided facilities, etc.): W.D. HazeltonAnalysis and interpretation of data (e.g., statistical analysis, biostatistics,computational analysis): E.G. Luebeck, K. Curtius, J. Jeon, W.D. HazeltonWriting, review, and/or revision of the manuscript: E.G. Luebeck, K.Curtius, J. Jeon, W.D. Hazelton
Administrative, technical, or material support (i.e., reporting or orga-nizing data, constructing databases): K. CurtiusStudy supervision: E.G. Luebeck
AcknowledgmentsThe authors thank Dr. Rafael Meza (University of Michigan) for helpful
discussions.
Grant SupportThis research was supported by the NCI under grants R01 CA107028 and UO1
CA217155 (to E.G. Luebeck, J. Jeon, and W.D. Hazelton) and by the NationalScience Foundation (NSF) under grant no. DGE-0718124 (to K. Curtius).
The costs of publication of this article were defrayed in part by the payment ofpage charges. This article must therefore be hereby marked advertisement inaccordance with 18 U.S.C. Section 1734 solely to indicate this fact.
Received June 5, 2012; revised August 31, 2012; accepted September 18, 2012;published OnlineFirst October 10, 2012.
References1. Meza R, Jeon J, Moolgavkar SH, Luebeck EG. Age-specific incidence
of cancer: phases, transitions, and biological implications. Proc NatlAcad Sci U S A 2008;105:16284–9.
2. Luebeck EG, Moolgavkar SH. Multistage carcinogenesis and theincidence of colorectal cancer. Proc Natl Acad Sci U S A 2002;99:15095–100.
3. Jeon J, Luebeck EG,Moolgavkar SH. Age effects and temporal trendsin adenocarcinoma of the esophagus and gastric cardia (UnitedStates). Cancer Causes Control 2006;17:971–81.
4. Meza R, Jeon J, Renehan AG, Luebeck EG. Colorectal cancer inci-dence trends in the United States and United kingdom: evidence ofright-to left-sided biological gradients with implications for screening.Cancer Res 2010;70:5419–29.
5. Surveillance, Epidemiology, and End Results (SEER) Program.SEER*Stat Database: Incidence SEER 9 Regs Limited-Use, Nov2009 Sub (1973–2007) (Katrina/Rita Population Adjustment)—linked to county attributes—total U.S., 1969–2007 counties. April2010, based on the November 2009 submission ed: National Can-cer Institute, DCCPS, Surveillance Research Program, Cancer Sta-tistics Branch. [cited 2012 Mar 13]. Available from: http://seer.cancer.gov/.
6. Cahill DP, Kinzler KW, Vogelstein B, Lengauer C. Genetic instabilityand Darwinian selection in tumours. Trends Cell Biol 1999;9:M57–60.
7. Moffett BF, Baban D, Bao L, Tarin D. Fate of clonal lineages duringneoplasia and metastasis studied with an incorporated genetic mark-er. Cancer Res 1992;52:1737–43.
8. Beerenwinkel N, Antal T, Dingli D, Traulsen A, Kinzler KW, VelculescuVE, et al. Genetic progression and the waiting time to cancer. PLoSComput Biol 2007;3:e225.
9. Powell SM, Zilz N, Beazer-Barclay Y, Bryan TM, Hamilton SR, Thibo-deau SN, et al. APC mutations occur early during colorectal tumor-igenesis. Nature 1992;359:235–7.
10. Karaman A, Kabalar ME, Binici DN, Ozturk C, Pirim I. Genetic altera-tions in gastric precancerous lesions. Genet Couns 2010;21:439–50.
11. Norfadzilah MY, Pailoor J, Retneswari M, Chinna K, Noor LM. P53expression in invasive pancreatic adenocarcinoma and precursorlesions. Malays J Pathol 2011;33:89–94.
12. Morton JP, Timpson P, Karim SA, Ridgway RA, Athineos D, Doyle B,et al. Mutant p53 drives metastasis and overcomes growth arrest/senescence in pancreatic cancer. Proc Natl Acad Sci U S A2010;107:246–51.
13. Ramel S, Reid BJ, Sanchez CA, Blount PL, Levine DS, Seshat K,et al. Evaluation of p53 protein expression in Barrett's esophagus bytwo-parameter flow cytometry. Gastroenterology 1992;102(Pt 1):1220–8.
14. Moore JH, Lesser EJ, Erdody DH, Natale RB, Orringer MB, Beer DG.Intestinal differentiation and p53 gene alterations in Barrett's esoph-agus and esophageal adenocarcinoma. Int J Cancer 1994;56:487–93.
15. Galipeau PC, Prevo LJ, Sanchez CA, Longton GM, Reid BJ. Clonalexpansion and loss of heterozygosity at chromosomes 9p and 17p inpremalignant esophageal (Barrett's) tissue. JNatl Cancer Inst 1999;91:2087–95.
16. Wong DJ, Paulson TG, Prevo LJ, Galipeau PC, Longton G, Blount PL,et al. p16(INK4a) lesions are common, early abnormalities that undergoclonal expansion in Barrett's metaplastic epithelium. Cancer Res2001;61:8284–9.
17. Hingorani SR, Wang L, Multani AS, Combs C, Deramaudt TB, HrubanRH, et al. Trp53R172H and KrasG12D cooperate to promote chro-mosomal instability and widely metastatic pancreatic ductal adeno-carcinoma in mice. Cancer Cell 2005;7:469–83.
18. Harris TE. The theory of branching processes. New York: DoverPublications, Inc.; 1989.
19. O'Brien CA, Pollett A, Gallinger S, Dick JE. A human colon cancer cellcapable of initiating tumour growth in immunodeficient mice. Nature2007;445:106–10.
20. Fakir H, Tan WY, Hlatky L, Hahnfeldt P, Sachs RK. Stochastic pop-ulation dynamic effects for lung cancer progression. Radiat Res2009;172:383–93.
21. Fakir H, Hofmann W, Sachs RK. Modeling progression in radiation-induced lung adenocarcinomas. Radiat Environ Biophys 2010;49:169–76.
22. Dewanji A, Moolgavkar SH, Luebeck EG. Two-mutation model forcarcinogenesis: joint analysis of premalignant and malignant lesions.Math Biosci 1991;104:97–109.
23. LittleMP.Are twomutations sufficient to cause cancer?Somegeneral-izations of the two-mutation model of carcinogenesis of Moolgavkar,Venzon, and Knudson, and of the multistage model of Armitage andDoll. Biometrics 1995;51:1278–91.
24. Little MP, Heidenreich WF, Li G. Parameter identifiability and redun-dancy in a general class of stochastic carcinogenesis models. PLoSONE 2009;4:e8520.
25. HeidenreichWF, Luebeck EG,Moolgavkar SH. Some properties of thehazard function of the two-mutation clonal expansionmodel. Risk Anal1997;17:391–9.
26. Ronkainen J, Aro P, Storskrubb T, Johansson S, Lind T, Bolling-Ster-nevald E, et al. Prevalence of Barrett's esophagus in the generalpopulation: an endoscopic study. Gastroenterology 2005;129:1825–31.
27. Teixeira CR, HarumaK, TeshimaH, YoshiharaM, Sumii K, KajiyamaG.Endoscopic therapy for gastric cancer in patients more than 80 yearsold. Am J Gastroenterol 1991;86:725–8.
28. Nishida K, Kaneko T, Yoneda M, Nakagawa S, Ishikawa T, Yamane E,et al. Doubling time of serum CA 19-9 in the clinical course of patientswith pancreatic cancer and its significant associationwith prognosis. JSurg Oncol 1999;71:140–6.
29. Bolin S, Nilsson E, Sjodahl R. Carcinoma of the colon and rectum-growth rate. Ann Surg 1983;198:151–8.
Luebeck et al.
Cancer Res; 73(3) February 1, 2013 Cancer ResearchOF10
Research. on April 13, 2019. © 2012 American Association for Cancercancerres.aacrjournals.org Downloaded from
Published OnlineFirst October 10, 2012; DOI: 10.1158/0008-5472.CAN-12-2198

30. Renan MJ. How many mutations are required for tumorigenesis?Implications from human cancer data. Mol Carcinog 1993;7:139–46.
31. Luebeck EG, Buchmann A, Stinchcombe S, Moolgavkar SH, SchwarzM. Effects of 2,3,7,8-tetrachlorodibenzo-p-dioxin on initiation andpromotion of GST-P-positive foci in rat liver: a quantitative analysisof experimental data using a stochastic model. Toxicol Appl Pharma-col 2000;167:63–73.
32. Moolgavkar SH, Luebeck EG, de Gunst M, Port RE, Schwarz M.Quantitative analysis of enzyme-altered foci in rat hepatocarcinogen-esis experiments-I. Single agent regimen. Carcinogenesis 1990;11:1271–8.
33. LuebeckEG,HeidenreichWF,HazeltonWD,ParetzkeHG,MoolgavkarSH. Biologically based analysis of the data for the Colorado uraniumminers cohort: age, dose and dose-rate effects. Radiat Res 1999;152:339–51.
34. Moolgavkar SH, Knudson AG. Mutation and cancer: a model forhuman carcinogenesis. J Natl Cancer Inst 1981;66:1037–52.
35. Moolgavkar SH, Venzon DJ. Two-event models for carcinogenesis:incidence curves for childhood and adult tumors. Math Biosci1979;47:55–77.
36. Holford TR, Zhang Z, McKay LA. Estimating age, period and cohorteffects using the multistage model for cancer. Stat Med 1994;13:23–41.
37. Muto T, Bussey HJ, Morson BC. The evolution of cancer of the colonand rectum. Cancer 1975;36:2251–70.
38. Brentnall TA, Lai LA, Coleman J, Bronner MP, Pan S, Chen R. Arousalof cancer-associated stroma: overexpression of palladin activatesfibroblasts to promote tumor invasion. PLoS ONE 2012;7:e30219.
39. Jones S, Chen WD, Parmigiani G, Diehl F, Beerenwinkel N, Antal T,et al. Comparative lesion sequencing provides insights into tumorevolution. Proc Natl Acad Sci U S A 2008;105:4283–8.
40. Yachida S, Zhong Y, Patrascu R, DavisMB,Morsberger LA, GriffinCA,et al. Establishment and characterization of a new cell line, A99, from aprimary small cell carcinoma of the pancreas. Pancreas 2011;40:905–10.
41. Luebeck EG. Cancer: genomic evolution of metastasis. Nature2010;467:1053–5.
42. Moolgavkar SH. Carcinogenesis models: an overview. Basic Life Sci1991;58:387–96.
43. Moolgavkar SH, Luebeck EG. Multistage carcinogenesis: popu-lation-based model for colon cancer. J Natl Cancer Inst 1992;84:610–8.
44. Heidenreich WF, Luebeck EG, Moolgavkar SH. Effects of exposureuncertainties in the TSCE model and application to the Coloradominers data. Radiat Res 2004;161:72–81.
45. Meza R, Hazelton WD, Colditz GA, Moolgavkar SH. Analysis of lungcancer incidence in the Nurses' Health and the Health Professionals'Follow-Up Studies using a multistage carcinogenesis model. CancerCauses Control 2008;19:317–28.
46. Xu XL. The biological foundation of the Gompertz model. Int J BiomedComput 1987;20:35–9.
47. Brosnan JA, Iacobuzio-Donahue CA. A new branch on the tree: next-generationsequencing in thestudyof cancer evolution. SeminCell DevBiol 2012;23:237–42.
48. Martens EA, Kostadinov R, Maley CC, Hallatschek O. Spatial structureincreases the waiting time for cancer. New J Phys 2011;13:1–22.
Impact of Tumor Progression on Cancer Incidence Curves
www.aacrjournals.org Cancer Res; 73(3) February 1, 2013 OF11
Research. on April 13, 2019. © 2012 American Association for Cancercancerres.aacrjournals.org Downloaded from
Published OnlineFirst October 10, 2012; DOI: 10.1158/0008-5472.CAN-12-2198

Published OnlineFirst October 10, 2012.Cancer Res E. Georg Luebeck, Kit Curtius, Jihyoun Jeon, et al. Impact of Tumor Progression on Cancer Incidence Curves
Updated version
10.1158/0008-5472.CAN-12-2198doi:
Access the most recent version of this article at:
Material
Supplementary
http://cancerres.aacrjournals.org/content/suppl/2012/10/10/0008-5472.CAN-12-2198.DC1
Access the most recent supplemental material at:
E-mail alerts related to this article or journal.Sign up to receive free email-alerts
Subscriptions
Reprints and
To order reprints of this article or to subscribe to the journal, contact the AACR Publications
Permissions
Rightslink site. (CCC)Click on "Request Permissions" which will take you to the Copyright Clearance Center's
.http://cancerres.aacrjournals.org/content/early/2013/01/22/0008-5472.CAN-12-2198To request permission to re-use all or part of this article, use this link
Research. on April 13, 2019. © 2012 American Association for Cancercancerres.aacrjournals.org Downloaded from
Published OnlineFirst October 10, 2012; DOI: 10.1158/0008-5472.CAN-12-2198