impact of the us wireless telecom industry on the us economy
TRANSCRIPT

Impact of the US wireless telecomindustry on the US economy
A study for CTIA – The Wireless Association
David Lewin
Roger Entner
September 2005
TM

The Impact of the US Wireless Telecom Industry on the US Economy
A study for CTIA-The Wireless Association™
Roger Entner & David Lewin September 2005
Ovum 18 Tremont Street Boston, Massachusetts 02108 617 523 1294 www.ovum.com Indepen Diespeker Wharf 38 Graham Street London N1 8JX +44 20 7324 1800 www.indepen.co.uk

Executive summary ......................................................................................................................... 3
Overview.......................................................................................................................................... 4 I Introduction......................................................................................................................... 4 II Supply side benefits from wireless services....................................................................... 5 III Productivity gains from wireless services........................................................................... 6 IV Future benefits from wireless services ............................................................................... 7
1 Supply side impacts of the US wireless industry .................................................................... 8 1.1 Introduction......................................................................................................................... 8 1.2 The US Wireless Industry Value Chain .............................................................................. 9 1.3 The GDP contribution of the US wireless telecom industry ............................................. 10 1.4 Employment Effects.......................................................................................................... 12 1.5 US Government Revenues from Wireless Services......................................................... 15
2 US productivity gains from for use of wireless telecom services.......................................... 17 2.1 Summary .......................................................................................................................... 17 2.2 Labor Productivity Growth and use of Information Technology, Computers and Telecommunications .................................................................................................................. 18 2.3 The Role of Wireless Telecommunications in Boosting Labor Productivity Growth ........ 19 2.4 Productivity gains from wireless voice services ............................................................... 19 2.5 Productivity gains from wireless data services................................................................. 20
3 The consumer surplus from wireless voice services ............................................................ 24 3.1 Summary .......................................................................................................................... 24 3.2 Consumer surplus as a measure of economic welfare .................................................... 24 3.3 Previous Estimates of the Consumer Surplus.................................................................. 25 3.4 Estimates of the Current Consumer Surplus.................................................................... 26 3.5 The relative size of the US consumer surplus.................................................................. 27
4 Future economic benefits...................................................................................................... 30 4.1 Summary .......................................................................................................................... 30 4.2 Future benefits from wireless services ............................................................................. 30 4.4 Wireless Services and US Global Competitiveness......................................................... 33 4.5 The scale of additional benefits over the next decade ..................................................... 33
Annex A The process of quantifying the Value Chain............................................................ 35
Annex B The Geographic Distribution of the Value Add ........................................................ 38 B1 Introduction....................................................................................................................... 38 B2 Value Add by Geography – Handset Suppliers................................................................ 39 B3 Value Add by Geography – Handset Component Suppliers ............................................ 40 B4 Value Add by Geography – Network Equipment Suppliers.............................................. 40 B5 Value Add by Geography – Network Equipment Component Suppliers.......................... 41 B6 Value Add by Geography – Results ................................................................................. 42
Annex C Case Studies on productivity gains.......................................................................... 43
Ovum 18 Tremont Street Boston, Massachusetts 02108 617 523 1294 www.ovum.com Indepen Diespeker Wharf 38 Graham Street London N1 8JX +44 20 7324 1800 www.indepen.co.uk

© Ovum & Indepen, 2005
Executive summary After a review of the data available to us, we conclude that the economic impact of the US wireless telecom industry in 2004 included the following:
• 3.6 million jobs are directly and indirectly dependent on the US wireless telecommunications industry;
• the industry generated $118 billion in revenues and contributed $92 billion to the US GDP;
• the industry is currently slightly smaller than the computer, automobiles, publishing and agriculture industry segments;
• the wireless telecom industry is expected to become a larger sector of the US economy than the agriculture and automobile sectors within 5 years, based on the wireless industry’s current 15% annual growth rate;
• the industry and its employees paid $63 billion to the US Government, including federal, state and local fees and taxes;
• the use and availability of wireless telecom services and products created a $157 billion consumer surplus which is the difference between what end-users are willing to pay for a service and what they are actually having to pay.
To put the findings of this report in context:
• 2.5% of all jobs in the United States depend on the wireless industry;
• If the wireless telecom industry was a country, its economy would be bigger than that of Egypt, and would rank as the 46th largest country in the world, as measured by GDP.
We estimate that the use of wireless telecom services in the US generated a consumer surplus of $157 billion per annum for 2004. Were US carriers to charge at EU levels, we estimate that the US consumer surplus from wireless services would be halved. US consumers and businesses enjoy substantially greater economical welfare from wireless services than their EU counterparts do. In plain English, US consumers and businesses are getting a much better deal on wireless than their EU counterparts.
Based on the conservative assumption that no additional services beyond what are available today, we are predicting that over the next 10 years, the US wireless telecom industry will:
• create an additional two to three million new jobs;
• add a cumulative additional $450 billion in GDP;
• create another $700 billion in consumer surplus; and
• provide cost savings to US businesses of more than $600 billion.
3

© Ovum & Indepen, 2005
Overview
I Introduction This report presents an independent analysis of the impact that the US wireless telecom industry had on the US economy in just the year 2004, and as projected over the next ten years. The conclusions reached in this report are based largely on publicly available data concerning wireless carriers, wireless handset and equipment manufacturers and the overall wireless telecom industry, as well as on Ovum’s own independent analysis and research.
Figure O1: Principal economic impacts of the US wireless industry on the US Economy in 2004
US cellularwireless
Industry…
…increases US GDP, employment and Government
revenues
… improves the productivity of US business through
use of…
…wireless voice services
…wireless data services
Demand sideSupply side
We analyzed the categories of economic impact depicted above and confirmed the following:
• In 2004, the US wireless telecom services industry generated a contribution to US GDP of $92 billion US, supported 3.6 million jobs and paid to US federal and state governments revenues of over $63 billion in the form of taxes and fees. These supply side effects are discussed in Chapter 1 of our report.
• Use of wireless services led to substantial productivity gains for US businesses, which in turn led to GDP growth and increased global competitiveness. These gains are discussed in Chapter 2 of our report.
• Looking at the use of just five wireless data applications, we estimate that US business users enjoy at least $15 billion per annum in productivity gains. This estimate is very much a lower limit because it is premised on use of just a few of the currently available wireless data applications. Chapter 2 provides more details.
• Wireless voice services have played a central role in enabling productivity growth. One measure of how the use of wireless voice services has enabled increases in productivity
4

© Ovum & Indepen, 2005
is to assess the consumer surplus1 from wireless services, which we estimate at $157 billion per year at the end of 2004. Chapter 3 of our report provides more detail.
• It is Ovum’s considered opinion that the US wireless telecom industry will continue to generate substantial additional economic benefits over the next 10 years, both in demand side and supply side effects. Over the next 10 years, we estimate that the supply of wireless telecom services and handsets will generate over $450 billion in additional US GDP and between two and three million more jobs. On the demand side, we estimate an additional $750 billion in consumer surplus from use of voice services and an additional $600 billion in productivity gains from use of wireless data services. Chapter 4 provides details.
II Supply side benefits from wireless services
The value chain
US businesses and consumers spent $118 billion on wireless telecom products and services in 2004. This revenue flows along the US industry value chain as shown in Figure 1.2 in Chapter 1. We can see that during 2004, inter alia:
• US end-users spent $104.4 billion to purchase wireless telecom services.2 $101.2 billion flowed to facilities-based carriers while $3.2 billion flowed to resellers such as Virgin Mobile USA and Tracfone Wireless;
• of their $3.2 billion in service revenues, resellers remitted $0.9 billion to their wireless carrier wholesalers for airtime, leaving resellers and their other upstream suppliers with valued added revenues of $2.2 billion; 3
• facilities-based wireless carriers paid wireline operators $4.1 billion for leased lines for their networks and to terminate calls on the wireline networks;
• wireless carriers paid a substantial proportion of their revenues to the suppliers of support services. These suppliers, together with their own upstream suppliers, generated a value add of $40.4 billion in 2004.
• wireless carriers received $12.0 billion in end-users payments for handsets and related accessories and $0.9 billion in payments from wireline carriers for terminating wireline to wireless calls;
• in 2004, end-users purchased just over 50% of their wireless services, handsets and related accessories from independent retailers like Best Buy and Radio Shack. Although these end-user payments are booked by the facilities-based carriers rather than by the
1 The consumer surplus measures the difference between what is person is willing to pay for a product or service and the amount he/she actually is required to pay. 2 This includes contract, prepay, roaming and value added services. 3 We define value add for any particular supplier as its employment costs and operating income plus capital expenditure less depreciation.
5

© Ovum & Indepen, 2005
independent retailers/dealers, independent retailers/dealers receive commission on each sale, and in 20044 these commissions totalled $9.8 billion, forming the bulk of independent retailer/dealer revenues in 2004;
• the network equipment suppliers had a value add of $6.0 billion.
The value add to the US economy in 2004
Figure 1.3 in Chapter 1 shows what proportion of the revenues in the value chain resulted in value add retained in the US, and the proportion of revenues that flowed to non-US firms. We can see that more than 70% of the value add generated by the wireless telecom industry was retained in the US.
Figure 1.4 in Chapter 1 provides a comparison of the contribution of the wireless telecom services industry to US GDP as compared to that of other selected US industries. The wireless industry’s contribution is measured by the value add from Figure 1.3 which is retained in the US. This was $92 billion in 2004. This means that the wireless telecom services industry is already more than twice as big as the motion picture and sound recording industry.
Employment effects
The US wireless telecom industry is now a major generator of employment in the US. We estimate that 3.6 million jobs in the US are dependent on the industry.
Government revenues Collected from the wireless industry
The industry paid $63 billion5 to federal, state and local government6 in 2004 in the form of various taxes and other fees, as shown in Figure 1.6 in Chapter 1. The wireless industry is a major contributor to US government revenues and this contribution will likely continue to grow barring the imposition of excessive and new taxes and regulatory requirements that inhibit the industry’s growth.
III Productivity gains from wireless services For several decades before 1995, the US lagged both Japan and the European Union in GDP growth. But, over the last ten years, the US has outpaced Japan and the European Union in labor productivity growth. While the Internet and computers have won much of the credit for improving productivity, telecommunications, and especially wireless telecommunications, have become an essential component in generating productivity gains for US businesses. It is clear that wireless voice services play a central role in enabling productivity growth. Increases in productivity are typically hard to quantify; however, one measure is the consumer surplus generated by the use of wireless voice services. We estimate that the use of wireless services in the US, largely for voice
4 $250 per sale is common. 5 We did not include fees paid by the industry to the US government to purchase spectrum because there was no major wireless auction in 2004. It should be noted, however, that since 1994, the wireless industry has paid more than $24 billion to purchase wireless spectrum to deliver service to end-users. 6 Local, state and federal combined.
6

© Ovum & Indepen, 2005
applications, generated a consumer surplus of $157 billion per annum for 2004. Were US carriers to charge at EU levels,7 we estimate that the US consumer surplus from wireless services would be halved.
The relatively new wireless data services are also now starting to improve US productivity. In 2004, we estimate that these productivity gains were worth in excess of $8 billion. To put this saving in context, the nascent wireless data segment is roughly as large as the entire economy of the country of Bahrain, one of the oil producing countries in the Persian Gulf.
IV Future benefits from wireless services Over the next 10 years, we can expect:
• the use and supply of wireless services and handsets will generate over $450 billion in additional US GDP and will create an additional two to three million jobs;8
• the industry to generate a further $700 billion in additional consumer surplus from use of voice wireless voice services as volumes of use grow and prices decline further;
• the productivity gains from wireless data services to become much more important. We estimate that productivity gains will generate over $600 billion in additional GDP over the next decade.
To put these gains in context:
• the tax cuts of the Bush Administration are estimated to be worth approximately $670 billion to the US economy over the next 10 years
• the recent repeal of the Estate Tax is estimated to be worth around $290 billion over the next 10 years.
7 Prices for outbound calls in the US are less than half the level charged in the EU and outbound minutes of use per subscriber are more than four times higher. 8 Where revenues have grown at more than 15% per annum over the past three years. One must put this in context however. The industry actually become cash-flow positive for the first time in 2004.
7

© Ovum & Indepen, 2005
1 Supply side impacts of the US wireless industry
1.1 Introduction In this chapter, we quantify the supply side benefits generated by the US wireless telecom industry in 2004 in terms of its contribution to US GDP, to US employment and to US government revenues. It is important to note that our quantification deals only with the supply side contribution that the US wireless services industry makes to the US economy. It does not consider the supply side contribution which US equipment suppliers, such as Motorola, and Lucent, make to the US economy through export of wireless telecom network equipment and handsets.
We use the model shown in Figure 1.1 to quantify the supply side impacts. The model is essentially a three-step process:
• Step 1: we started by quantifying the value chain for the industry - from the purchase of services and handsets by end users through to the creation of the components, which include making the network equipment used to supply these services.
• Step 2: we then consider how the value added9 at each step in the chain is distributed geographically between the US and the rest of the world.
• Step 3: we then use our findings to estimate the GDP, employment and government revenues generated by the wireless telecom services industry.
Figure 1.1 Ovum’s model for estimating supply side effects
Analysisof accountsof mobileoperators
Other parameters
The valuechain
Geographic distribution
Home country vsrest of World
GDPcontribution
for US
Employment impacts on
US
USgovernment
revenues
Analysisof accountsof mobileoperators
Other parameters
The valuechain
Geographic distribution
Home country vsrest of World
GDPcontribution
for US
Employment impacts on
US
USgovernment
revenues
9 We use the terms value add and GDP contribution interchangeably since they are both terms for labelling the contribution to overall GDP that a firm makes.
8

© Ovum & Indepen, 2005
1.2 The US Wireless Industry Value Chain Figure 1.2 presents our estimates of the flows of revenues along the value chain generated by the US wireless telecom industry. We describe them below. Annex A then outlines the process and sources from which we produce our estimates.
Figure 1.2 The value chain for wireless services in the US
End users
Resellers
$2.2bn
US wireless carriers$22.5bn
Dealers (1)$9.8bn
Handsetsuppliers
$5.5bn
Handsetcomponentsuppliers (1)
$11.7bn
Suppliers of support
services (1)$40.4bn
Other suppliersof capitalitems (1)$5.3bn
Platform andcomponent
suppliers (1)$11.2bn
Network equipmentsuppliers$6.0bn
Wireline carriers (1)
$2.9bn
$3.2bn
$101.2bn
Payments for mobile services
$12.0bn
$0.4bnPayment for terminalsand accessories
$9.8bn$0.4bn
$16.8bn
$11.7bn
$40.4bn$5.3bn$4.1bn$1.2bn
$16.0bn
Interconnectpayments
$11.2bn
$0.9bnWirelineoperators
$0.9bn
Payments for wirelineto wireless calls
(1) And their upstream suppliers (excluding wireless carriers)
From an examination of Figure 1.2 we can see that, during 2004:
• US end-users spent $104.4 billion on wireless telecom services.10 $101.2 billion was paid directly to facilities-based wireless carriers, with $3.2 billion flowing to resellers such as Virgin Mobile USA and Tracfone Wireless;
• the facilities-based wireless carriers received $12.0 billion in end-users payments for handsets, and $0.9 billion in payments from wireline carriers for terminating wireline to wireless calls;
• of their $3.2 billion service revenues, resellers paid facilities-based carriers $0.9 billion for airtime, leaving resellers and their other upstream suppliers with valued added revenues of $2.3 billion;11
10 This includes contract, prepay, roaming and value added services.
9

© Ovum & Indepen, 2005
• end-users purchased just over 50% of their wireless services, handsets and related accessories from independent retailers such as Best Buy and Radio Shack. Although these end-user payments are booked by the facilities-based carriers, the independent retailers receive commission on each sale12 which we estimate at $9.8 billion and which formed the bulk of independent retailer revenues in 2004. Thus, the independent retailers and their upstream suppliers13 generated a value add of $9.8 billion in 2004;
• wireless handset suppliers such as Motorola, Nokia and Samsung earned revenues of $16.814 billion from the sale of handsets and related accessories to wireless carriers and $0.4 billion from the sale of same to independent retailers. In turn, handset suppliers paid their component suppliers15 $11.7 billion, so generating a value add of $5.5 billion;
• facilities-based wireless carriers made substantial capital investments in 2004 – with payments of $16.0 billion to network equipment suppliers and $5.3 billion to other suppliers of capital equipment, such as for IT systems and vehicles. As noted earlier in the Report, we do not include spectrum related auction payments in this CapEx figure because no major auction was completed in 2004;
• facilities-based wireless carriers paid wireline operators $4.1 billion for leased lines and to terminate calls on the wireline networks;
• wireless carriers paid a substantial proportion of their revenues to the suppliers of support services such as advertising agencies and associated media, professional service firms such as law firms, and outsourcing companies providing customer support and IT services. These suppliers, together with their own upstream suppliers, generated a value add of $40.4 billion in 2004;
• these payments and revenues added together result in a value add of $22.5 billion from wireless carriers;
• network equipment suppliers earned revenues of $16.0 billion from facilities-based wireless carriers, and a further $1.2 billion from wireline carriers for the supply of the equipment used to provide wireless carriers with their leased lines and call termination services. The network equipment suppliers then paid their own component suppliers $11.2 billion leaving them with a value add of $6.0 billion.
1.3 The GDP contribution of the US wireless telecom industry As reflected in Figure 1.2, the US wireless services industry generated $118 billion of value add in 2004, but as reflected in Figure 1.3, the industry generated $92 billion of additional GDP in 2004.
11 We define value add for any particular supplier as its employment costs and operating income plus capital expenditure less depreciation. 12 $250 per sale is common. 13 Excluding the wireless carriers. 14 This compares with handset sales of $12.0 billion and shows that the wireless carriers subsidised the sale of handsets to a significant degree. 15 Components such as chip sets, handset casings, aerials, keyboards and displays.
10

© Ovum & Indepen, 2005
Figure 1.3 shows how the distribution of this GDP between the USA and the rest of the world changes as we move along the value chain. Annex B provides details on how we made these estimates.
Figure 1.3 The GDP impact of the US wireless services industry
0 5 10 15 20 25 30 35 40 45
Resellers
Dealers
Wireless carriers
Wireline carriers
Other capex suppliers
Support services
Terminal suppliers
Components for terminals
Network equipment suppliers
Hardware platforms etc
Value add ($bn)
USA
RoW
Upstream
Downstream
We can see from the Figure 1.3 that:
• the downstream end of the value chain is dominated by the value added contribution of wireless carriers and their suppliers of support services;16
• this part of the value chain accounts for 70% of the total value added;
• virtually all of this 70% value add is retained in the US;
• the upstream end of the value chain, involving network and handset equipment supply, provides the other 30% of the value add;
• a major part (68%) of this 30% portion of the upstream end of the value add flows to the economies of foreign countries rather than to the US; however, this is offset by the exports of US wireless equipment suppliers.
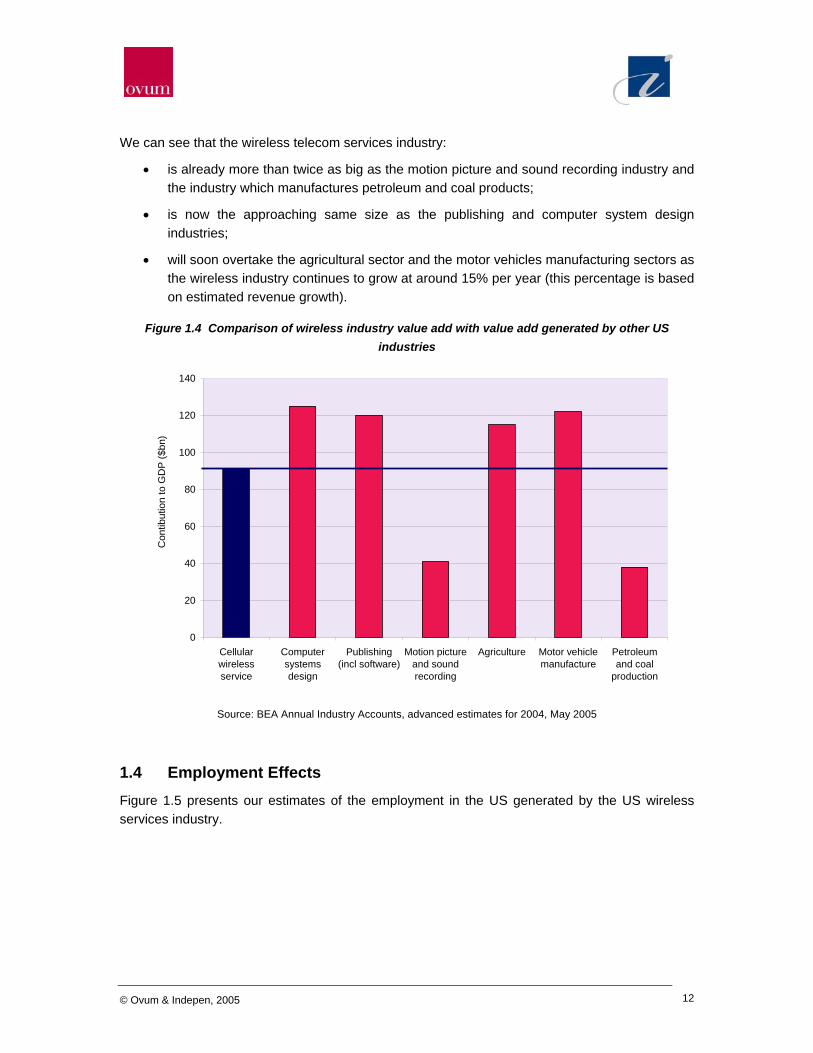
Figure 1.4 provides a comparison of the contribution to US GDP made by the wireless telecom services industry versus other US industries. The wireless contribution is measured by the value add from Figure 1.3 which is retained in the US. We estimate this at $92 billion for 2004.
16 Such as advertising, customers support and IT services.
11
© Ovum & Indepen, 2005
We can see that the wireless telecom services industry:
• is already more than twice as big as the motion picture and sound recording industry and the industry which manufactures petroleum and coal products;
• is now the approaching same size as the publishing and computer system design industries;
• will soon overtake the agricultural sector and the motor vehicles manufacturing sectors as the wireless industry continues to grow at around 15% per year (this percentage is based on estimated revenue growth).
Figure 1.4 Comparison of wireless industry value add with value add generated by other US industries
0
20
40
60
80
100
120
140
Cellularwirelessservice
Computersystemsdesign
Publishing(incl software)
Motion pictureand soundrecording
Agriculture Motor vehiclemanufacture
Petroleumand coal
production
Con
tibut
ion
to G
DP
($bn
)
Source: BEA Annual Industry Accounts, advanced estimates for 2004, May 2005
1.4 Employment Effects Figure 1.5 presents our estimates of the employment in the US generated by the US wireless services industry.
12

© Ovum & Indepen, 2005
Figure 1.5 Employment in the USA generated by wireless services
Employment from wireless services in USA (000) Direct Support Indirect TotalResellers 18 19 7 44Dealers 109 82 82 272Wireless carriers 226 113 137 476Support services suppliers 0 901 225 1126Wireline carriers 21 32 16 69Other capex suppliers 59 59 30 149Terminal suppliers 19 27 6 52Terminal component suppliers 18 25 6 48Network equipment suppliers 29 41 9 79Network equipment component suppliers 33 46 10 90Total 534 1344 527 2405
For each link in the value chain there are three main components:
• 534,000 jobs are generated by direct employment in the industry;
• firms which provide support services to the industry employ a further 1,344,000 staff; and
• the industry generates a further 527,000 jobs indirectly.17
We arrived at the estimates in Figure 1.5 by dividing the value added for the US by the appropriate hourly wage rates. The process is shown in Figure 1.6.
Finally, we needed to take account of the multiplier effect, which induces further employment. The 2,405,000 US jobs that depend either directly or indirectly on the US wireless telecom services industry generate expenditure in the economy, which, in turn, create other jobs. For example, employees of wireless carriers spend money on restaurants, vacations, clothing, food etc and generate additional jobs as a result. There are various estimates of this multiplier effect. For example:
• after a review of the literature, the Employment Policy Institute assumed a multiplier of 1.5 when estimating these effects;18
• the Association Francaise des Operateurs Mobiles19 assumes a multiplier of 1.7 when estimating this effect in a similar study;
• the UK Office of National Statistics estimates a multiplier of 1.5 for telecommunications.
We take a cautious approach and use a multiplier of 1.5. Applying this multiplier increases the number of jobs dependent on the US wireless services industry from 2,405,000 to a total of 3,608,000.
The overall results of our calculations on employment are then summarised in Figure 1.7.
17 This is estimated on the assumption that Governments spend the taxes raised from the industry, and that owners and funders spend their returns from the industry in a way that generates further employment. 18 See Working Paper on Updated Employment Multipliers for the US Economy, J Bevens, August 2003. 19 La Filiere Mobile: quel impact sur l’economie Francaise?, July 2003.
13

© Ovum & Indepen, 2005
Figure 1.6 Estimating employment from wireless telecom services industry in the US
VA area VA ($m) Split of VA % US wage % in US Employcosts ($k) USA
(000)
Resellers (12) 2240 Wage costs 40% 2 49.7 7 100% 9 18.0Other opex 30% 2 35.9 7 100% 9 18.7Other VA 30% 2 35.9 7 40% 9 7.5
Dealers (12) 9775 Wage costs 40% 1 35.9 7 100% 9 108.9Other opex 30% 1 35.9 7 100% 9 81.7Other VA 30% 1 35.9 7 100% 9 81.7
Wireless carriers 22514 Wage costs 50% 3 50 7 100% 9 226.1Interest 23% 3 35.9 7 80% 10 113.1Other VA 27% 3 35.9 7 80% 10 136.6
Wireline carriers 2859 Wage costs 40% 4 53.4 7 100% 9 21.4Other opex 40% 4 35.9 7 100% 9 31.9Other VA 20% 4 35.9 7 100% 9 15.9
Other capex (12) 5339 Wage costs 40% 5 35.9 7 100% 9 59.5Other opex 40% 5 35.9 7 100% 9 59.5Taxes, profit, interest 20% 5 35.9 7 100% 9 29.7
Support services (12) 40414 Wage costs 40% 5 35.9 7 100% 9 450.3Other opex 40% 5 35.9 7 100% 9 450.3Taxes, profit, interest 20% 5 35.9 7 100% 9 225.1
Terminal suppliers 5502 Wage costs 45% 6 50 8 39% 11 19.2Other opex 45% 6 35.9 7 39% 11 26.8Taxes, profit, interest 10% 6 35.9 7 39% 11 6.0
Components for terminals (12) 11692 Wage costs 45% 6 50 8 17% 11 17.9Other opex 45% 6 35.9 7 17% 11 24.9Taxes, profit, interest 10% 6 35.9 7 17% 11 5.5
Network equipment mfrs 6034 Wage costs 45% 6 50 8 54% 11 29.2Other opex 45% 6 35.9 7 54% 11 40.7Taxes, profit, interest 10% 6 35.9 7 54% 11 9.0
Hardware platforms etc (12) 11207 Wage costs 45% 6 50 8 33% 11 33.3Other opex 45% 6 35.9 7 33% 11 46.4Taxes, profit, interest 10% 6 35.9 7 33% 11 10.3
Total 117576 2405
1 From analysis of accounts of dealers2 Assume split same as for dealers3 From value chain analysis4 Based on analysis of ILEC accounts5 Assumed same as for wireline carriers6 Based on accounts of Nokia, Motorola and Ericsson7 From Bureau of Labour statistics8 Based on accounts of Nokia, Motorola and Ericsson9 Assumed 100% US activity10 Assumes payments to T-Mobile ($400m) and Vodafone ($1000m)11 See text12 And their upstream suppliers (other than wireless carriers)
14

© Ovum & Indepen, 2005
Figure 1.7 US jobs dependent on the US wireless services industry
0 500 1000 1500 2000 2500 3000 3500 4000
US jobs dependent on the US wireless industry (000)
Direct employment
Support servicesemployment
Indirect employment
Induced employment
The effects estimated above are very substantial. Nevertheless, they need to be interpreted with care:
• On one hand, they do not mean that were the US wireless industry to disappear 3.6 million people would be permanently out of work. In this hypothetical event, there would be severe economic disruption but the economy would adjust in various ways and the long term impact on jobs would be relatively modest.
• On the other hand, the employment figures noted above do not take into account the impact of wireless telecom services on growth and innovation in the US economy as a whole. Nor do they take into account the many social and economic benefits that wireless services have the potential to provide through new services such as location-based services and high-speed data services.
1.5 US Government Revenues from Wireless Services The US wireless industry also generates tax and other revenues for the US government at the federal, state and local levels. For purposes of this Report, we estimate the tax and fee revenues generated from four main sources: income tax on employee wages, sales taxes, payments into federal universal service funds and social security contributions. We ignore corporation tax revenues that the US government receives given the variable and modest profit levels within the industry. We also do not reflect any spectrum-related auction payments made in 2004 as there were no significant auctions that year.
15

© Ovum & Indepen, 2005
We estimate that:
• directly or indirectly, 3.6 million jobs were dependent on the US wireless services industry at the end of 2004;
• the average wage in the US was $33,400 per annum. The average worker paid 7.5% in social security payments and 13.8% in income tax;20
• employers, in addition to paying employees, paid 7.5% of their employees’ wages in social security payments to the government;
• on average, end-users paid federal, state and local taxes, fees and surcharges of 14% on $104.4 billion in wireless service sales;21
• on average, end-users paid sales tax of 6.9%22 on handset equipment sales of $12.3 billion;
• wireless carriers contributions to federal Universal Service Funds equalled 33% of the total contributions to federal Universal Service Funds.
Overall, the wireless telecom services industry and its employees paid $62.6 billion to the US government in 2004. This figure is comprised of:
• $14.6 billion (14% of $104.4 billion) in federal, state, and local sales and transaction taxes and surcharges on wireless services;
• $0.9 billion (6.9% of $12.3 billion) in sales taxes on handset purchases;
• $9.0 billion (7.5% of $33,400 x 3.61 million jobs) in employer-paid social security payments;
• $9.0 billion (7.5% of $33,400 x 3.61 million jobs) in employee-paid social security payments;
• $26.5 billion (22% of $33,400 x 3.61 million jobs) in income tax from workers dependent on the wireless services industry;
• $2.6 billion in contributions to federal and state Universal Service funds.
20 10% on the first $7,300 and 15% on the rest. 21 11% in local/state tax (weighted average) plus 3% federal tax. See State Tax Notes, July 2004. 22 Weighted average of local/state taxes. See State Tax Notes, July 2004.
16

© Ovum & Indepen, 2005
2 US productivity gains from for use of wireless telecom services
2.1 Summary This chapter looks at the productivity gains that the US wireless industry generates. For several decades before 1995, the United States lagged both Japan and the European Union in GDP growth; however, over the last ten years, the United States has outpaced Japan and the European Union in labor productivity growth. One of the causes for this has been the uncompromising and relentless adoption of information technology, computers, and telecommunications to reengineer business practices and improve productivity.
Figure 2.1 reflects this trend.
Figure 2.1 Labor productivity growth – EU vs. US vs. Japan
0
1
2
3
1983 1988 1993 1998 2003
Ann
ual %
gro
wth Japan
US
EU-15
Source: European Commission
While the Internet and computers have grabbed the lion’s share of the glory for improving productivity, telecommunications and especially wireless telecommunications have become an essential component in generating productivity gains for US businesses. As discussed herein, it is clear that wireless voice services play a central role in enabling productivity growth. The relatively new wireless data services are also now starting to improve US productivity. In 2004, we estimate that these productivity gains were worth in excess of $8 billion. To put this savings in context, the productivity gains generated by the nascent wireless data services segment of the overall wireless telecom industry are almost as large as the total GDP of Bahrain (based on World Bank GDP estimates).
17

© Ovum & Indepen, 2005
2.2 Labor Productivity Growth and use of Information Technology, Computers and Telecommunications
In the last few years, academics and policymakers around the world have focused on measuring the impact which Information Technology, Computers and Telecommunications (ICT) has on labor productivity growth.23 Figure 2.2 which shows that:
• ICT has had an impact on labor productivity growth, and hence GDP growth, which is quite disproportionate to its size. So, in the EU, ICT contributes 6% of GDP but 18% of investment and 42% of productivity growth;
• ICT has had a much greater impact on labor productivity growth in the US than in the EU. So whilst ICT again contributes 6% to GDP in the US, it contributes 29% to investment and 80% to productivity growth (cf 18% and 42% in the EU);
• these differences explain virtually all of the differences observed in Figure 2.1.
Figure 2.2 ICT contribution to GDP, investment and productivity growth
6.5.8%
Source data: IMF 2004, O’Mahony and Van Ark CD-ROM (2003), and Timmer, Ypma and Van Ark (2003)
This boost to labor productivity in the US is a result of more effective use of ICT rather than greater production of ICT products and services. US companies across a wide range of industry sectors have reengineered their business processes to take advantage of ICT. Such reengineering requires flexible labor markets24 and flexible product markets25 which the US has. Therefore, US businesses can take full advantage of ICT, generate greater returns on its ICT investment, and hence invest more in ICT and boosts labor productivity growth more than businesses in the EU.
23 We define use of ICT as use of computer software and hardware, use of IT services and use of the fixed and mobile telecommunications networks. 24 I.e., the ability to hire and fire staff at low cost to the employer. 25 With few restrictions on the products sold and the ability to start up and close down companies easily.
80%
29%
42%
18%
3%
Productivity growth share
hareGDP s
Investmentshare
EuropeUnited States
18

© Ovum & Indepen, 2005
2.3 The Role of Wireless Telecommunications in Boosting Labor Productivity Growth
Waverman et al26 and others27 have subsequently attempted to isolate the impact of mobile service penetration on GDP growth and hence labor productivity growth. Waverman for example found that:
• differences in mobile penetration rates help explain differences in GDP growth rates. So the US, with a wireless penetration rate 10% higher than that of its neighbor Canada, might expect to enjoy a GDP growth rates 0.3% per annum higher as a result;
• the impact of higher mobile penetration rates on economic growth is greater in low and middle-income countries than in high-income countries. This reflects the fact that wireless telecom penetration take up of mobile phones increases the number of people with access to telecommunications more in middle and low income countries. In the EU and US fixed lines reach well over 90% of households and mobile phones offer an alternative means of telecommunications.
This analysis uses a top down econometric approach; however, it is also instructive to consider productivity gains from a bottom-up case study approach. We do this in the next two sections. Section 2.4 deals with wireless voice applications, and Section 2.5 deals with wireless data applications.
2.4 Productivity gains from wireless voice services It is clear that wireless voice services play a central role in enabling productivity growth. At the end of 2004, more than 60% of Americans or roughly 182 million used wireless phones. Employers of approximately one third, or 60.6 million US wireless consumers, believed that the use of a mobile wireless devices had such a significant impact on productivity that the employer paid at least part of their employee’s wireless bill.
Examples of productivity gains from the wireless voice services include:
• reduce unproductive travelling time. Using wireless voice services enable field engineers and sales staff can to use otherwise unproductive travel time to in talking to customers, colleagues and suppliers, conduct business, confirm appointments and follow-up on questions. Increasingly they also supply relevant data, which the traveller can use whilst on the move.
• significantly improve logistics. Companies can contact field staff armed with wireless devices to schedule meetings and reassign tasks more efficiently. Traffic and other travel related information can be communicated real-time while employees are in transit thereby improving the employees’ ability to travel between jobs and assignments along the most
26 The impact of telecommunications on economic growth in developing countries, Waverman, Meschi and Fuss, March 2005, Vodafone Policy Paper 2. 27 E.g., Telecommunications Infrastructure and Economic Growth, Sridhar and Sridhar, National Institute of Public Finance and Policy, Working Paper 14, 2004.
19

© Ovum & Indepen, 2005
efficient route. Companies dependent on fleet management can also better coordinate deliveries, pick-ups and other logistical issues.
• enable faster and more efficient decision-making. Employees can contact each other from any location at any time to convene a teleconference or otherwise organize and host virtual meetings to reach time-sensitive, important decisions. Without the mobility and immediate accessibility that wireless devices provide, such meetings could take days or weeks to schedule and occur, thereby delaying progress or completion of tasks.
• empower small businesses. Farmers, plumbers, contractors, builders, real estate agents and other businesses and workers who spend a high proportion of their work-day away from a fixed location can take advantage of the resource and management efficiencies created by a less capitol intensive mobile, virtual office.
These gains are hard to quantify; however, one measure is the consumer surplus from wireless services, which we estimate in Chapter 3 at $157 billion per year at the end of 2004.
2.5 Productivity gains from wireless data services To quantify the productivity gains US businesses receive or will receive from wireless telecommunications technology, we conducted a thorough bottom-up review based on the job classification data from the Department of Commerce’s Bureau of Labor Statistics. We looked at the 8,172 different job types involving 132.7 million employees as outlined in the Current Employment Statistics. We then determined which jobs would benefit from the use of wireless voice and data technology. We identified 4,983 job types with 75.8 million employees that would benefit from wireless in a wider sense. At the end of 2004, only 60.6 million of these employees were actually using wireless.
Based on conversations with wireless carriers and publicly available information from financial reports, Ovum estimates that only 10% of the 60.6 million current wireless enterprise users actually have deployed a wireless data solution. As shown in Figure 2.3, we expect this number to grow by 2015 to 80% of the 75.8 million that Ovum has determined to be employed in tasks that are benefited by use of wireless services and products.
20

© Ovum & Indepen, 2005
Figure 2.3 Wireless Data Penetration among Wireless Business Users
Year Penetration of Wireless Data among Wireless Business Users
Already using in 2004 10%
2005 15.0%
2006 25.0%
2007 35.0%
2008 50.0%
2009 60.0%
2010 65.0%
2011 70.0%
2012 73.0%
2013 75.0%
2014 77.5%
2015 80.0%
Source: Ovum 2005
While many of the benefits of using wireless services and products in a business environment are tangible, few are actually quantifiable. With the help from businesses already using wireless technology to improve their productivity and reduce cost, Ovum was able to identify five data applications in which wireless is undoubtedly providing tangible economic benefits:
1. personnel management and documentation
2. health care efficiency enhancements
3. enhancements in field service automation
4. inventory loss reduction
5. sales force automation
These five categories impact 1,562 job types and more than 29.3 million employees that could verifiably benefit from wireless technology. To be as conservative as possible in the quantification of the benefits we used, when applicable, labor cost reductions rather than sales increases from the productivity gain. For example, in assessing the economic impact of Field Service Automation on tree trimmers in the agriculture and forestry industry, we used a multiple of the tree trimmers’ average hourly wage of $12.68 rather than the increased revenue of $25 per hour and up.
In total, Ovum was able to identify in 2004 an economic benefit through productivity gains of more than $8.5 billion from these five applications of mobile wireless technology and services. This is, according to the World Bank, more than the size of the economy of Senegal. This estimate represents a lower limit on the current productivity gains generated by the use of current wireless telecom service. It does not include the impact of the many additional wireless
21

© Ovum & Indepen, 2005
data applications not covered by our quantification. We set out below the assumptions that we used to generate the productivity estimates for each of the five applications. We also provide in Annex C descriptions of nine case studies which show that the productivity gains from wireless data applications are considerable, despite the service being in its infancy.
More efficient management and documentation
As described in several case studies, supervisors, managers, and executives can save at least 30 minutes per day by answering email on the PDA, Blackberry, or Treo devices or by taking down information on their handheld and then synchronizing with the office PC laptop rather than copying paper notes onto the computer at a later point in time. This has already lead to an economic benefit for American business of almost $4.4 billion in 2004 with approximately 1.4 million business users.
Health care efficiency enhancements
Health care is one of the most labor intensive industries as well as one of the most sensitive to error. One of the ways that health care providers have been able to reduce the cost associated with providing outstanding health care is through wireless technology. By directly inputting patient information into a wireless handheld computer, health care providers have been able to reduce the amount of call-backs due to illegible notes and prescriptions. PatientKeeper estimates that currently at least one hour per day is spent verifying patient information by record keepers, nurses, and physicians. We estimate that approximately 616,000 health care professionals are already using wireless technology, which is saving more than $2.9 billion by reducing non-productive time spent on the making calls to phone checking records or deciphering the proverbially illegible handwriting of a doctor.
Enhancements in Field Service Automation
By replacing paper and telephone tracking to automatic GPS location detection and least- distance routing, companies are able to utilize their work force more effectively and efficiently. For example, ICEE reports that as soon as it implemented its wireless automation system its drivers reduced unproductive work time by more than two hours per week. We estimate that these two hours savings per week are consistent among the roughly 734,000 mobile field workers that are using wireless. This created an economic benefit to businesses of $914 million in 2004.
Inventory Loss Reduction through Wireless Automation
Several companies, such as OrthoRehab, state that they were able to reap substantial savings, consistently around $1,250 per month per employee, in loss prevention due to wireless inventory management. Companies employing the approximately 22,600 transportation workers that were already using wireless inventory management solutions in 2004 were able to reduce inventory shrinkage by almost $272 million.
22

© Ovum & Indepen, 2005
Sales Force Automation
US businesses have been aggressive in rolling out sales force automation and issuing wireless modem cards to their respective sales forces. One of the case studies in Annex C quotes that a very large transportation and logistics firm is saving $553 per month in saved time. By applying the time savings from this case study across the approximately quarter million sales people already using wireless data services, we estimate an 2004 economic benefit to US corporations of around $1.5 million.
23

© Ovum & Indepen, 2005
3 The consumer surplus from wireless voice services
3.1 Summary Based on a review of previous estimates of the consumer surplus from wireless services made in the US and the UK, we estimate that the use of wireless services for voice applications in the US generated a consumer surplus of $157 billion per annum for 2004. This consumer surplus is:
• largely associated with wireless voice rather than wireless data applications;
• considerably larger than the service revenue generated by the US wireless industry;28
• more than 15 times larger than the economic surplus that flows to the wireless carriers which, measured by the operating income of the wireless carriers, was $10.3 billion in 2004. We estimate that the producer surplus in the US is less than half of that enjoyed by EU wireless carriers;
• even bigger than the producer surplus in previous years. The wireless industry only started to generate free cash flow in 2004. Over the previous 10 years it made cumulative investments of $155 billion29 and almost all of the benefits from this investment have flowed to the consumer;
• a significantly higher proportion of the total30 surplus than that generated by the EU wireless industry because the US wireless industry is considerably more competitive and therefore provides US consumers with a better deal for wireless services.
If US carriers priced their services at EU levels we estimate that the US consumer surplus from wireless services would be halved. Based on this analysis we conclude that US consumers and businesses enjoy a substantially greater economical welfare from wireless voice services than their EU counterparts do.
3.2 Consumer surplus as a measure of economic welfare The consumer surplus which US consumers and businesses enjoy as a result of using wireless services is a function of:
• the price which users are prepared to pay, on average, for wireless service less
• the price which they actually pay multiplied by
• the number of subscribers.
28 $107 billion in 2004. 29 From CTIA’s Wireless Industry Indices, Year End 2004. 30 Producer plus consumer surplus.
24

© Ovum & Indepen, 2005
Consumer surplus is depicted by the area ABC shown in Figure 3.1.
Figure 3.1 A definition of the consumer surplus
Number of subscribers
Price/unit cost
Consumer X
Price paid permonth = P0
Price willingto pay = P1
A
B C
Consumer surplus
Producer surplus
Unit costof supply
This shows that Consumer X is willing to pay a price P1 per month for mobile service, but actually pays price P0. Therefore, Consumer X enjoys a consumer surplus of P1 less P0 per month. This is disposable income, which Consumer X can spend on other goods or services, or invest in the economy in some way. The area ABC represents the total consumer surplus, which covers both early adopters, with a high valuation of wireless services, and marginal consumers, for whom the current price just tempts use of wireless. The consumer surplus measures the combined social and commercial benefits which US users generate from purchasing wireless mobile services.
In addition, the use of mobile services generates a producer surplus – the other shaded area of Figure 3.1. This is the price paid per month less the cost of supply per month times the number of subscribers or, more simply, the profit to wireless operators from supplying service. Together the consumer and producer surplus measure the overall economic welfare from wireless services.
3.3 Previous Estimates of the Consumer Surplus Various authors have estimated the consumer surplus from wireless telecom services in the past. In particular:
• Jerry Hausman first estimated the consumer surplus for the US in 199731. He used price elasticity models to establish the demand curve from which to estimate the consumer surplus. In 2003 he updated his estimates32 and placed the US consumer surplus in the
31 Hausman J, Valuing the Effect of Regulation of New Services in Telecommunications, Brookings Papers on Economic Activities, Microeconomics, 1997, 1-38. 32 See Shann Lecture, March 2003.
25

© Ovum & Indepen, 2005
range of $80 billion to $150 billion per year in mid 2002. During 2002 the industry generated $77 billion in revenues.
• Thomas Hazlett33 testified before the US Senate that the estimated US consumer surplus was at least $80 billion per year in 2003.
• the UK’s Radio Communications Agency also estimated a consumer surplus for wireless services there, using a willingness to pay survey. In 1999, wireless services generated revenues of £5.0 billion while the consumer surplus was estimated at £7.2 billion for the year.
3.4 Estimates of the Current Consumer Surplus Based on the estimates discussed above, we estimate that the US wireless services generated a consumer surplus of $157 billion per annum at the end of 2004. This surplus was generated almost entirely from the provision and use of voice applications.
Figure 3.2 provides our calculations which assume that the ratio of consumer surplus to wireless telecom services revenues has remained constant since 2002.
Figure 3.2 Current US consumer surplus for wireless services
Estimate Consumer surplus Revenues Consumer surplus/Revenues
Hausman estimate for mid 2002 $115bn pa34 $77bn pa 1.49
UK Radio Communications Agency estimate for UK
£7.2bn pa £5.0bn pa 1.44
Estimate for end 2004 $157bn pa $107bn pa35 1.4736
Because we were not able to obtain the empirical US data needed to construct the demand curve to estimate the consumer surplus, we plotted revenue per minute at 2004 prices against the volume of use per year in billable minutes. This provides the curve shown in Figure 3.3.
This curve forms a lower bound on the demand curve of Figure 3.1 – with the number of subscribers exchanged for the number of minutes of use on the X-axis. Clearly, the subscribers who used wireless telecom services in 2000 are willing to pay at least the price shown at that time; however, we can also see that the true demand curve is likely to be to the right of that shown in Figure 3.3. This is the diffusion effect which means that, without a change from the 2000 price for wireless telecom services, the volume of use by subscribers who joined before 2000 would have grown between 2000 and 2004 as these subscribers found new ways of using wireless services. Therefore, the data point for 2000 on the current demand curve is to the right of
33 Exit Strategies for the Digital TV Transmission, testimony before the US Senate Commerce Committee, T Hazlett, June 2004. 34 Mid point of Hausman range between $80 billion and $150 billion per annum. 35 From CTIA Semi Annual Survey – estimate of annualised service revenues at December 2004. 36 Mid point of two previous ratios.
26

© Ovum & Indepen, 2005
that shown in Figure 3.3. This means that the area under the curve of Figure 3.3 represents a lower limit, and substantially underestimates the current consumer surplus.
Figure 3.3 A lower bound on the current US consumer surplus37
0.086
0.186
0.286
0.386
0.486
0.586
0.686
0.786
0.886
0 200000 400000 600000 800000 1000000 1200000
Mobile billable minutes (m)
Rev
enue
s pe
r min
($)
20042003
20022001
2000
1999
1998
1997
1996
This second approach is consistent with the first. Measuring the area under the curve of Figure 3.3 gives us a lower bound on the current consumer surplus of $96 billion per year compared with the estimate of $157 billion from Figure 3.2.
3.5 The relative size of the US consumer surplus The US consumer surplus measures the extent to which commercial US businesses and US consumers (for social purposes) value wireless services in excess of the price they pay for them. An important question to ask is whether a consumer surplus of $157 billion per year is a good thing. We can answer this question in two ways.
First, we can compare consumer surplus with the producer surplus. In Chapter 1 we estimate the producer surplus flowing to the US wireless industry as $10.3 billion per year.38 Therefore, we can see the producer surplus represents 6%39 of the total surplus which means a very high proportion of the total surplus goes to consumers rather than to the producers. In other countries, producers receive a significantly higher proportion of the total surplus – generating profit levels that are often double those of US wireless carriers. In the EU, for example wireless carriers generate EBITDAs
37 Source: CTIA Semi Annual Survey 2004. 38 The operating income of the industry in 2004. 39 $157 billion/($10.3 billion + $157 billion)
27

© Ovum & Indepen, 2005
of 40% compared with 30% for US wireless carriers.40 When we subtract depreciation and amortization charges, typically 20% of revenues, from these margins we are left with an operating income (EBIT) of 10% in the US and 20% in EU. This is confirmed when we compare the estimates of welfare gains in the UK with our estimates for the US. The UK’s Radio Communications Agency estimates the producer surplus at 12% of the total compared with 6% in the US.
Second, we can consider how much the US consumer surplus would be reduced if the US wireless industry charged at EU price levels. Figure 3.4 compares mobile prices,41 minutes of use per subscriber per month and per capita per month, and levels of wireless penetration for the US and for the four biggest countries in the EU.
Figure 3.4 US and EU wireless services compared Item EU4 USA
Penetration level of wireless – end 2004 95% 62%
Price for outbound calls (US cents per min) 2142 9
Minute of use per subscriber (outbound + inbound per month) 139 626
Minute of use per head of population (outbound + inbound per month)
132 388
Source: Merrill Lynch, “Global Wireless Matrix Q105”, June 2005
40 See e.g., Merrill Lynch “Global Wireless Matrix Q105,” June 2005. 41 As measured by retail mobile revenue per outbound minute from wireless handsets. 42 Assumes that mobile termination rates and average retail prices are equal.
28

© Ovum & Indepen, 2005
We can see that:
• at 626 minutes of use per month per subscriber, usage levels are much higher in the US than in the EU (139 minutes);
• after allowing for the significantly higher subscriber penetration rates in the EU, the level of use in the US, as measured by outbound minutes per month per head of population, is still nearly three times that in the EU (388 minutes versus 132 minutes);
• average prices per minute of use in the US (at 9 cents per minute) are under half what they are in the EU (21 cents per minute).
Therefore, US users enjoy much lower prices and make substantially more use of their wireless mobile phones than EU users. This means that the US consumer surplus per capita is substantially larger than it is for EU consumers.
One way to estimate the relative difference is provided by Figure 3.5 – an annotated version of Figure 3.3. The area ABC under the curve provides a lower bound on the current US consumer surplus; however, if we increase price levels from those in the US to those in the EU the area ABC shrinks to the area ADE. We can see that the latter area is only 50% of the former. This suggest that lower prices and higher volume of use in the US leads to a consumer surplus which is twice what it would be at EU price levels.
Figure 3.5 The impact of EU price levels on the US consumer surplus
0.086
0.186
0.286
0.386
0.486
0.586
0.686
0.786
0.886
0 200000 400000 600000 800000 1000000 1200000
Mobile billable minutes (m)
Rev
enue
s pe
r min
($)
20042003
20022001
2000
1999
1998
1997
1996
A
B C
D EEU price level
29

© Ovum & Indepen, 2005
4 Future economic benefits
4.1 Summary As we argue in Chapter 2, wireless data applications are only just beginning to make an impact on the productivity of US workers and businesses. Over the next 10 years, we expect that:
• the wireless industry will generate further productivity gains from data services of more than $600 million;
• the industry will add another $450 billion to GDP through supply side effects;
• between two and three million more jobs will be dependent on the wireless industry; and
• use of mobile wireless services will generate an additional consumer surplus of over $700 billion.
This stimulus to the US economy exceeds significantly the Bush Administration’s Tax Cut, which represents a cost-savings of $670 billion over 10 years. It is also many times larger than the Estate Tax Repeal, which is valued at $294 billion of 10 years.
This is just the beginning of the revolutionizing effect the wireless telecom industry will have on the US economy. Over time, as has happened in the computer industry and with the Internet, additional productivity benefits will be uncovered that will enhance the competitive positioning of US businesses and increase the benefits discussed in this paper.
4.2 Future benefits from wireless services Wireless telecom services, and especially the new high-speed data and location-based services, will have a central role to play in maintaining US competitiveness in world markets. In Chapter 2, we identified and quantified the current productivity benefits from a number of current wireless data services. To estimate future benefits we use a conservative approach in which we:
• consider only the five wireless data applications identified in Chapter 2, where we can already observe tangible productivity benefits;
• assume that the employees using wireless data services will grow from the current 60 million to 75 million by 2015; and
• assume that, for each of the five wireless data applications discussed in Chapter 2, the proportion of relevant employees using them will grow from 10% to 80% of the potential user base as shown in Figure 4.1.
30

© Ovum & Indepen, 2005
Figure 4.1 Wireless Data Penetration among Wireless Business Users
Year Penetration of Wireless Data
among Wireless Business Users
Already using in 2004 10%
2005 15.0%
2006 25.0%
2007 35.0%
2008 50.0%
2009 60.0%
2010 65.0%
2011 70.0%
2012 73.0%
2013 75.0%
2014 77.5%
2015 80.0%
Source: Ovum 2005
As illustrated in Figure 4.2, the sum of the annual future benefits of the five tasks identified where use of wireless data applications will have the most impact is going to rise from approximately $13.1 billion in 2005 to $85.5 billion in 2015. Use of wireless data services in 2005 will generate an economic contribution to US GDP that is roughly equal to the total economy of Bahrain, and by 2015 will make a contribution almost as large as the total current economy of Chile.
31

© Ovum & Indepen, 2005
Figure 4.2 Total Annual Economic Benefits of the Five Tasks Identified
-
10.00
20.00
30.00
40.00
50.00
60.00
70.00
80.00
90.00
2005 2007 2009 2011 2013 2015
More Eff icient Managementand Documentation
Health Care Eff iciencyEnhancements
Enhanced Field ServiceAutomation
Inventory Loss Reduction
Enhanced Field SalesAutomation
Source: Ovum 2005
We can delineate the future economic benefits for each of the five identified tasks:
More efficient management and documentation will yield at least an additional 30 minutes per day that can be put to productive use, representing savings for US companies which translates into an economic benefit that will increase from $6.7 billion in 2005 to over $48.8 billion in 2015.
The benefits derived from health care efficiency enhancements through implementing wireless telecom solutions will increase from almost $4.5 billion in 2005 to $29.2 billion in 2015. This is due to the ability of wireless solutions eliminate the need for costly and burdensome call-backs and re-work.
Enhancements in field service automation through wireless telecom will yield $1.4 billion in cost savings for US business in 2005, increasing to $9.1 billion in 2015.
Improved inventory loss reduction through wireless technology will create savings of approximately $416 million in 2005, rising to roughly $2.7 billion in 2015 as shown in Figure 4.6.
Sales Force Automation will create cost savings of at least $2 million in 2005, increasing to almost $16 million in 2015.
Other applications
In addition to these five tasks that will be enhanced and made more efficient through implementation of wireless telecom solutions, there are many other wireless telecom applications that will emerge over the next five years that will take the gains discussed herein and increase them exponentially. For example, we expect that business processes are going to be reengineered to fully utilize the mobility aspects of wireless data applications, thereby increasing
32

© Ovum & Indepen, 2005
productivity beyond current levels. Further, field employees will become more productive in the field and as they connect directly to data that residing on a company’s servers. This will benefit asset management and tracking, knowledge transfer, as well as on-site and mobile inventory.
Telematics is another area that promises significant economic benefits to US businesses and in particular to the US utility industry. Utilities are will be able to replace manual meter reading with automatic meter reading. Currently, utilities have not rolled out telematics solutions for any sizable project. Based on Ovum research in the US, the cost of manual meter reading in rural areas is often in excess of $20 per month. At a cost of often less than $13 per month combined with declining equipment costs, telematics solutions for meter reading will become the next avenue of cost savings in the utilities industry.
4.4 Wireless Services and US Global Competitiveness For the moment, the US has a substantial lead over the EU with respect to the rollout of wireless telecom services with high-speed data capability. Figure 4.9 illustrates. At the end of 2004, 33% of US mobile subscribers had access to high-speed data services.43 In contrast, the corresponding proportion in the EU was just over 2%. Ovum believes regulation that eliminates the investment incentives needed to continue deploying high-speed data services in the US could undermine the ability of the US to remain competitive in the area of ICT, and wireless in particular.
Figure 4.9 High speed data services – US vs. Western Europe
Technology Number of users (m)
EU USA
W-CDMA 7 0
EDGE 1 5
CDMA 2000 0 55
Total
8 60
Total wireless subscribers 355 182
% with access to high speed data services
2% 33%
Source: Ovum 2005
4.5 The scale of additional benefits over the next decade We estimate that the economic benefits generated by the wireless telecom industry through the proliferation of wireless data services will grow substantially over the next ten years. There are three main effects for which we can provide quantification:
43 We define these as services which use CDMA 2000, EDGE or W-CDMA technologies.
33

© Ovum & Indepen, 2005
• productivity gains from the five major wireless data applications discussed herein. In 2004, use of these applications was in its infancy with total economic benefits of only $8.5 billion per annum. We estimate that productivity gains from these applications will grow to $63 billion per annum by 2010 and almost $86 billion by 2015.44
• the economic welfare gains from growth in use of wireless voice services. Using Mobile@Ovum forecasts, we expect that the volume of wireless mobile voice calls will grow by over 200% while prices will drop by nearly 50% over the next five years. This will increase the consumer surplus from wireless voice services to $263 billion per annum by 2010 – an increase of $106 billion per annum above the 2004 surplus. It is more difficult to project further gains over the following 5 years. But it would be reasonable to assume that the consumer surplus would reach at least $300 billion per annum by 2015.
• on the supply side, in 2004, the US wireless telecom industry generated a $92 billion contribution to US GDP, 3.6 million jobs and government revenues of $63 billion. However, the US wireless telecom industry has grown at an average rate of more than 15% over the last five years and shows little sign of slowing. Therefore, we can expect the supply side effects listed above to increase by 50% or more over the next 5 years and to perhaps double over the next decade.
These estimates cover the bulk of the additional economic benefits that the US wireless telecom industry will generate over the next 10 years based on current resources. This omits the payments to the US Treasury that may be generated by future spectrum auctions, such as the DTV (700 MHz) spectrum45 or the additional economic and social benefits of subsequent investment and the services provided via future spectrum licenses. Over time, similar to the developments in the computer industry and with the Internet, additional productivity benefits will be uncovered that will enhance the competitive positioning of US businesses even further and increase the benefits discussed in this paper.
44 We assume that five data applications generate of 10% of potential value in 2005, rising to 65% by 2010. 45 Estimated at $28 billion for 60 MHz by the Brattle Group earlier this year. See Letter from William Zarakas, Brattle Group, to Rep. Joe Barton, et al., Committee on Energy and Commerce, US House of Representatives, May 18, 2005. The US Congressional Budget Office (CBO) estimates of the value of Advanced Wireless Services Spectrum approximate $15 billion. CBO Budget and Economic Outlook, Fiscal Years 2006 to 2015, January 2005, at 62.
34

© Ovum & Indepen, 2005
Annex A The process of quantifying the Value Chain We quantified the value chain of Figure 1.2 using the sources and assumptions listed in Figures A1 and A2. In summary we:
• use the results of the CTIA Semi-Annual Wireless Industry survey for December 2004 to estimate end-users services and roaming revenues for 2004;
• analyze the accounts of the main wireless carriers46 to estimate handset sales, depreciation, equipment costs, operating income, interest charges and capital expenditure;
• estimate wireless carrier staff costs based on the CTIA estimate of the number of wireless carrier staff, Bureau of Labor statistics on wage rates and the specified assumptions on staff commissions specified in Figure A1;
• estimate revenues from, and charges paid to, other operators using the assumptions specified in Figure A2;
• calculate support service costs as the balancing item between revenues on the one hand and all known operating costs plus operating income on the other.
Using this process, we calculate the cash flow of the wireless carriers in 2004. We then combine these cash flows with the additional estimates and assumption of Figure A2 to produce the value chain of Figure 1.2. In doing so, it is important to note that we excluded payments between wireless carriers. These do not add value to the chain but are simply internal transfer payments between wireless carriers.
46 Cingular, AT&T Wireless, Sprint, T-Mobile, Nextel, Alltel, US Cellular, Western, Dobson, Rural Cellular and Nextel Partners.
35

© Ovum & Indepen, 2005
Figure A1 Key inputs to the cash flow for US wireless carriers in 2004
36

© Ovum & Indepen, 2005
Figure A2 Other estimates used to quantify the value chain flows Item Estimate ($m) Sources/assumptions
Resellers mark up on airtime from wireless operators
242% Based on charges of Virgin and Tracfone
Reseller revenues as a % of wireless carriers revenues
3.1% Reseller accounts - we assume that total revenues are twice the revenues of Virgin and Tracfone combined
Direct end user spend with dealers as % of wireless equipment revenues
3% Based on expert opinion and EU practices
Average price paid by wireless carriers for terminals ($)
201 Based on EU prices paid with $10 uplift for CDMA payments to Qualcom
Number of handsets sold (m) 86 Cost of handset supply/price paid
% of terminal revenues retained as VA by terminal manufacturers
32% Based on analysis of accounts of Motorola, Ericsson and Nokia
% of network equipment revenues retained as VA by network equipment manufacturers
35% Based on analysis of accounts of Motorola, Ericsson and Nokia
% wireless capex on network equipment
75% CTIA survey adjusted to exclude IT equipment
% of wireline revenues from wireless carriers spent on network equipment
30% Based on analysis of ILEC accounts
37

© Ovum & Indepen, 2005
Annex B The Geographic Distribution of the Value Add
B1 Introduction Having estimated the value added by each type of player in the value chain we next need to consider how the value add is distributed geographically between the USA and the rest of the world (RoW). To do this we estimate the split of value add for each player type into value add categories and estimate the geographic split of value add for each combination of player type and value add category between the US and rest of the world.
The categories of value add are:
• wage costs i.e., wages and associated employer costs;
• other operating expenditures which convert into value add for upstream suppliers of this player; and
• taxes, profits and interest payments.
Figure B1 presents our estimates and assumptions with respect to splitting the value add categories.
Figure B1 Splitting the value add by category Type of player Source
wages operating income
opex (1)
Resellers and dealers 40% 30% 30% Analysis of accounts of Radio Shack and EU dealersWireless carriers (2) 73% 27% 0% From value chain analysisWireline carriers 40% 20% 40% ILEC accountsOther capex suppliers 40% 20% 40% As for ILECsSupport service suppliersTerminal manufacturers 45% 10% 45% Analysis of manufacturers accountsTheir component suppliersNetwork equip manufacturers 45% 10% 45% Analysis of manufacturers accountsTheir component suppliers
(1) For upstream value add by their suppliers(2) Sales commission to staff included in wages
% split of VA
38

© Ovum & Indepen, 2005
Figure B2 presents our estimates of the geographic split of the value add for each combination of player type and value add category.
Figure B2 Splitting the value add between the US and the rest of the World Type of player Source
US RoWReseller 80% 20% Two main resellers are both partly owned by UK and Mexican companiesDealer 100% 0% These activities are assumed100% nationalWireline operator 100% 0% These activities are assumed100% nationalOther capex supplier 100% 0% These activities are assumed100% nationalSupport service suppliers 100% 0% These activities are assumed100% national
Wireless carrier wages 100% 0% These activities are assumed100% national operating income 80% 20% Reflects payments to Vodafone and T-Mobile in the EU
Terminal manufacturer 39% 61% See textTerminal component suppliers 17% 83% See textNetwork equipment manufacturer 54% 46% See textNetwork equipment component suppliers 33% 67% See text
% value add
In many cases, the geographic distribution is obvious. All of the value added by the US independent retailer/dealer network remains in the US. In other cases, the geographic distribution is much less obvious; however, it is important to estimate the distribution if we are to measure the contribution of US wireless services to the US economy properly. We discuss the four most important cases in the remainder of this section.
B2 Value Add by Geography – Handset Suppliers Figure B3 estimates how the value added by the wireless handset suppliers is distributed. In calculating this percentage, we have taken account of the fact that different handset suppliers procure handsets in different ways and are based in different regions of the world.
Figure B3 Value add in handset equipment supply by geography
Supplier US Market share
S&M R&D Mfr Admin S&M R&D Mfr AdminNokia 25% 70% 10% 0% 20% 30% 90% 100% 80%LG 13% 70% 10% 0% 20% 30% 90% 100% 80%Motorola 30% 95% 80% 10% 80% 5% 20% 90% 20%Samsung 14% 70% 10% 0% 20% 30% 90% 100% 80%Sony Ericsson 3% 70% 10% 0% 20% 30% 90% 100% 80%Others 15% 70% 10% 0% 20% 30% 90% 100% 80%
100%
Average of all suppliers 78% 31% 3% 38% 23% 69% 97% 62%% of value add by function 31% 38% 25% 6% 31% 38% 25% 6%% of value add by region 38.8% 61.2%
% US VA by Function % RoW VA by Function
Source: Mobile@Ovum; Goldman Sachs June 2003; analysis of supplier annual reports
39

© Ovum & Indepen, 2005
B3 Value Add by Geography – Handset Component Suppliers We assume that the geographical distribution of the value added in supplying the handset suppliers with components is the same as the production capacity of the world’s semiconductor suppliers, as measured by the capital expenditure over the last four years. Figure B4 provides estimates of these proportions.
Figure B4 Global semi conductor production capacity
Region % (2004)
US 16%
EU 9%
Japan 23%
Taiwan 21%
Korea 12%
China 7%
ROW 12%
Source: SEMI, March 2005
B4 Value Add by Geography – Network Equipment Suppliers There are five main network equipment suppliers to US wireless carriers – Ericsson, Lucent, Motorola, Nokia and Nortel. Using the same approach as for handset equipment suppliers, we estimate, in Figure B5, the distribution of the value add between the US and the rest of the world.
Figure B5 Value add in network equipment supply by geography
Supplier US Market
share (1)
S&M R&D Mfr Admin S&M R&D Mfr AdminNokia 16% 70% 10% 0% 20% 30% 90% 100% 80%Ericsson 18% 70% 10% 0% 20% 30% 90% 100% 80%Nortel 20% 95% 80% 20% 80% 5% 20% 80% 20%Motorola 20% 95% 80% 20% 80% 5% 20% 80% 20%Lucent 23% 95% 80% 20% 80% 5% 20% 80% 20%Siemen and others 3% 70% 10% 0% 20% 30% 90% 100% 80%
100%
Average of all suppliers 86% 54% 13% 58% 14% 46% 87% 42%% of value add by function 31% 38% 25% 6% 31% 38% 25% 6%% of value add by region 53.8% 46.2%
% US VA by Function % RoW VA by Function
Source: Mobile@Ovum; Goldman Sachs June 2003; analysis of supplier annual reports
40

© Ovum & Indepen, 2005
B5 Value Add by Geography – Network Equipment Component Suppliers Sixty-five percent of the network equipment supplier revenues are spent purchasing components and platforms. This includes base station equipment, transmission equipment, switches and Home Location Records. We ignored software supply, assuming that network equipment manufacturers generate the bulk of software value. To estimate the geographical origin of purchased components, we examine the geographical distribution of semi conductor supply as shown in Figure B4. Figure B6 presents our analysis.
Figure B6 Value add in network equipment component supply by geography
Component Weight SourceUS RoW
PCs 28% 60% 40% AG Edwards reportServers 7% 83% 18% AG Edwards reportComponents 65% 16% 84% SEMI, March 2005
100% 33% 67%
VA in
41

© Ovum & Indepen, 2005
B6 Value Add by Geography – Results Applying the geographic split of Figure B2 to the value chain of Figure 1.2 produces the distribution of value add by player type and geography shown in Figure B7. We summarise and comment on these estimates in Chapter 1.
Figure B7 Value add by player type and geography
PlayerUSA RoW Total
Resellers 1837 403 2240Dealers 9775 0 9775Wireless carriers 20273 2241 22514Wireline carriers 2859 0 2859Other capex suppliers 5339 0 5339Support services 40414 0 40414Terminal suppliers 2137 3365 5502Components for terminals 1988 9704 11692Network equipment suppliers 3244 2790 6034Hardware platforms etc 3699 7507 11207
91564 26012 117576
VA ($m)
42

© Ovum & Indepen, 2005
Annex C Case Studies on productivity gains
This annex provides nine case studies on how use of wireless data services has improved productivity for US businesses. The case studies emphasize two kinds of productivity gains – better decision-making capabilities and better resource (including human resources) management.
CASE STUDY 1. Cingular is working together with PatientKeeper to make critical patient information available to doctors in real-time anywhere. Rather than relying on traditional, more time consuming technologies such as pagers and faxes, Cingular and PatientKeeper are providing on the spot information. The solution provides doctors with the capability to see clinical results the moment they become available. This allows doctors to immediately respond to medical emergencies that were uncovered during laboratory work or to just check the medical records of the patient and comparing it to a drug reference guide regarding allergies, before writing a prescription and sending it directly to the pharmacy – all wirelessly and on the spot. No more ambiguities caused by the proverbially bad handwriting of some physicians and the prescription is filled before the patient picks it up at the pharmacy. Also, doctors can dictate notes onto their device giving up to date information about a patient rather than having to rely on memory when writing down vital information about a patient. All of this improves physician decision making by being able to access the right information about a patient right at the spot of treatment allowing the doctor administer the right treatment with the right drugs. It enhances productivity in the healthcare field, reduces prescription errors, improves and streamlines record keeping which are contain healthcare costs, and improves patient satisfaction with the service they are receiving.
CASE STUDY 2. UnumProvident, a Chattanooga, Tennessee based provider of group and individual disability income protection insurance in the US and UK with more than 25 million customers. UnumProvident’s high-level management needed to be “real time” to make better decisions and to increase efficiency. To facilitate real time flow of information and data between clients, sales force, and management, UnumProvident has provided its more than 350 sales people with wireless email on Verizon Wireless Treo 650 handhelds. After the success of the program was established, the CEO, his direct reports plus the larger leadership team of 100 key executives also received Treo 650s. Now, UnumProvident’s sales force and leadership team have fully synchronized mobile access to all of their Microsoft exchange tools, such as email, calendar, contacts, notes, and tasks. Both the sales force and the leadership team are more current on their emails and can respond more quickly to the changes in the business environment and therefore satisfy their clients more effectively.
CASE STUDY 3. Buck Martin, co-owner of McDonald’s franchise in Raleigh, North Carolina, with five restaurants was challenged to keep up with all his outlets. By using Nextel’s DirectConnect feature it allows the franchise owner to constantly keep in touch with the restaurants and coordinate responses to various issues. It has also become an integral part of the company’s Business Continuity plan. During an ice storm in January 2005, when the whole area was covered in more than an inch of ice, Martin was able to contact his store managers and let them
43

© Ovum & Indepen, 2005
know when to close each store to make sure that all employees were able to get home safely. Furthermore, wireless communications, including text messaging, lets the different restaurants coordinate their peak demand needs and shift supplies efficiently from one store to another. By using text messaging the information is transmitted without the need for a pad and pencil to write down what the other restaurant needs, which is a critical help in the fast paced restaurant business. Through the introduction of camera phones, store managers have been able to exactly document any problems that may arise. In the spirit of “a picture is worth a thousand words” the issue and location of a broken tile becomes a picture or two, rather than an elaborate description.
CASE STUDY 4. Verizon Wireless has worked together with a very large transportation and logistics company to provide its sales force with constant access to critical customer data, increase sales team productivity and reduce sales cycle time. The company provided its more than 4,000 sales executives with high-speed wireless modem cards for their laptops. In areas where Verizon has EV-DO service the laptops connect to the Internet and the companies network at speeds comparable to broadband connections, but they can always fall back on a wireless connection with the speed of traditional dial-up. This allowed the very large transportation and logistics firm to streamline communications through e-mail, saving 20% of the sales person’s time resulting in a savings of $403.13 each month per sales person. By using the wireless connection to access more information about upcoming meetings, the negotiations became more meaningful and ultimately more successful. The reduced downtime at airports and waiting for meetings saved another $107.50 each month. On top of it, using wireless technology reduced administrative work by 20%, saving another $43 per month. Sales cycle times were reduced by 2 days because the necessary information was communicated more quickly to and from all parties.
CASE STUDY 5. Schnuck Markets, based on St. Louis, Missouri, with 103 supermarkets and pharmacies is one of the largest privately owned private companies in the country. Schnuck’s was looking to improve its efficiency by automating the best routing for its delivery trucks and route changes. Before Schnuck’s went wireless, their system was a combination of manual GPS receivers, phone calls, combined with paper and pencil. Sprint together with its partner Agilis developed a customized fleet management solution for Schnuck. Instead of dealing with paper and pencil, drivers now download their drive route and stops onto their phone. Dispatchers can follow the progress on a web map and redirect drivers on the fly, if weather or traffic dictates. Through this new automated system drivers can be directed to rearrange their schedule, make new drops and thereby reduce idling time. Drivers have now a mobile phone with them anytime for emergency purposes, greatly enhancing their safety. To quote a Schnuck executive: “We used to schedule on a calendar, now we schedule on a stop watch.” In addition, the whole system has become now completely paperless, greatly enhancing productivity.
CASE STUDY 6. For more than 100 years, Turlock Irrigation District (TID) has provided water to 5,800 farms in the fertile Central Valley of California. The District is monitoring water changes in its more than 250 miles of canals constantly. In the past, farmers faxed daily water orders to remote offices to schedule water delivery, 24 hours a day, 7 days a week. Before the introduction of a wireless system, field employees had to travel the entire length of the canal measuring the water flow at specific locations and then manually recorded. With the new wireless system that TID has implemented with the help of Cingular lets them now automatically report flow levels every 30 seconds greatly improving the accuracy of the water amount delivered. Field employees
44

© Ovum & Indepen, 2005
can now respond to emergencies such as delayed or low water flow much more quickly and can pinpoint the location of the segment that needs service. Furthermore, water loss has also been reduced substantially and customer satisfaction has increased. When customers call in to check where their water is, TID employees can immediately pinpoint how far away the water is and if it is delayed they can institute corrective measures immediately.
CASE STUDY 7. SuperShuttle, a shared ride and taxi service that operates in almost all major U.S. airport to reduce the cost for providing effective dispatch and information exchange services, was looking for a lower cost solution to connect all its drivers with its dispatch centres. Initially, the company deployed a proprietary radio frequency system. To set up each market, it cost SuperShuttle between $400,000 and $500,000 including $3,000 per vehicle for the radio. After four markets SuperShuttle looked for a different solution. Because Nextel had been already providing wireless voice services to SuperShuttle for eight years, it was the first company SuperShuttle asked for help. Nextel, together with its partner company Vettro, was able to empower SuperShuttle’s Nextel handsets to do the same task as SuperShuttle’s proprietary system, plus provide driving directions for 5% of the cost of the old system. In addition, the Nextel system enabled credit card processing on- site. Furthermore, the Nextel Vettro system provides transparency of how calls are assigned, eliminating all suspicions of favouritism among the contract drivers. The system has improved driver satisfaction and retention as well as reduced cost through the lower start-up investment. Back-office calls for clarifications have been reduced from more than a thousand a day to between fifty and one hundred. SuperShuttle is in the process of rolling out the Nextel Vettro system nationwide.
CASE STUDY 8. IBM was looking to reduce cost, improve sales executive’s productivity, and responsiveness to customers by giving them on-demand access to key applications. IBM worked together with Verizon Wireless to connect the sales executives’ IBM Thinkpad computers via CDMA EV-DO modem cards to IBM’s back office. Not only was IBM able to show that its on-demand advertising also works in practice, but it gained three hours a week of client-facing time per week per sales executive and reduced cost by $10 a day. Furthermore, it reduced down time at airports and while waiting for meetings, as well as avoiding the hassles and embarrassment to having to use client’ private networks.
CASE STUDY 9. Cingular is helping ICEE to improve the efficiency of its field repair organization and reduce cost at the same time. With more than 400 field technicians servicing 30,000 machines across the United States relying on a traditional paper based system left a lot of room for improvement. One of the biggest problems were the many errors that occurred during data entry from the handwritten forms the service technicians filled out at the end of the job. Part numbers could be misread and with prices of parts varying greatly, the difference between a $5 part and a $500 part quickly adds substantial amounts of money. In addition with 400 field technicians being served by only 12 to 15 dispatchers, technicians were frequently on hold, wasting valuable time waiting for new jobs. The new Cingular system informs technicians in real time about new jobs and reduces down-time substantially.
45

Ovum is the leading European
headquartered authority on
telecoms, software and IT
services, with unique expertise
where these sectors converge.
We deliver essential advice on
market trends and drivers, and
unrivalled insight into companies,
markets and technologies.
Ovum offers a range of integrated
services that includes tailored
consultancy, advisory services that
give clients direct access to our
analysts, and specialist research.
Our expertise is based on more
than two decades of research
conducted globally.
Advising on the commercial impact of technology and market changes
in telecoms, software and IT services.
Ovum has a unique insight into
global markets through offices
in Europe, North America and
Asia-Pacific. We are resolutely
independent: we do not endorse or
accept sponsorship from anybody.
Our experts spot the short-term
issues that will have an immediate
impact on your business and
advise on the longer-term visionary
aspects that form the basis of
your strategic planning.
Ovum Consulting
Our consultants exploit Ovum’s
knowledge base and relationships
to deliver customised advice and
guidance that shapes a policy,
business decision, market
assessment or technology strategy.
Ovum Advisory
We deliver ongoing advice to our
clients through our advisory services.
These are subscription-based
combinations of research and advice,
featuring valuable contact and
enquiry time.
Your next move...To find out more about Ovum services contact us at your nearestoffice or visit our website www.ovum.com
Europe
Ovum
London, UK
T: +44 (0) 20 7551 9228
F: +44 (0) 20 7551 9090/1
Ovum
Cologne, Germany
T: +49 (0) 221 5540 5169
F: +49 (0) 221 5540 545
Ovum
Paris, France
T: +33 1 53 30 24 88
F: +33 1 47 42 32 14
Ovum
Seoul, Korea
T: +82 2 3210 3966
F: +82 2 3210 3969
Ovum
Hong Kong, China
T: +85 2 9269 8013
T: +85 2 2824 8000
Ovum-RHK
Tokyo, Japan
T: +81 3 3492 5699
T: +81 3 3492 0760
North America
Ovum
Boston, USA
T: +1 617 523 1294
F: +1 617 523 6993
Asia-Pacific
Ovum
Melbourne, Australia
T: +61 (0) 3 9667 1200
F: +61 (0) 3 9663 5800