impact of the north atlantic oscillation on …
TRANSCRIPT

IMPACT OF THE NORTH ATLANTIC OSCILLATION ONMIDDLE EASTERN CLIMATE AND STREAMFLOW
HEIDI M. CULLEN 1, ALEXEY KAPLAN 2, PHILLIP A. ARKIN 3 andPETER B. DEMENOCAL 2
1National Center for Atmospheric Research, P.O. Box 3000, Boulder, CO 80307-3000, U.S.A.E-mail: [email protected]
2Lamont-Doherty Earth Observatory of Columbia University, RT 9W, Palisades,NY 10964-8000, U.S.A.
3National Oceanic and Atmospheric Administration, 1100 Wayne Avenue, Suite 1215, Silver Spring,MD 20910, U.S.A.
Abstract. Interannual to decadal variations in Middle Eastern temperature, precipitation and stream-flow reflect the far-field influence of the North Atlantic Oscillation (NAO), a dominant mode ofAtlantic sector climate variability. Using a new sea surface temperature (SST) based index of theNAO and available streamflow data from five Middle Eastern rivers, we show that the first principalcomponent of December through March streamflow variability reflects changes in the NAO. How-ever, Middle East rivers have two primary flooding periods. The first is rainfall-driven runoff fromDecember through March, regulated on interannual to decadal timescales by the NAO as reflectedin local precipitation and temperature. The second period, from April through June, reflects springsnowmelt and contributes in excess of 50% of annual runoff. This period, known locally as thekhamsin, displays no significant NAO connections and a less direct relationship with local climaticfactors, suggesting that streamflow variability during this period reflects land-cover change, possiblyrelated to agriculture and hydropower generation, and snowmelt.
1. Introduction
Although Turkey has the good fortune of being home to the headwaters of the Tigrisand Euphrates rivers, with primary control on the limited freshwater available to theMiddle East and geopolitical advantage over Syria and Iraq, a widespread droughtthroughout the Middle East and Central Asia (Barlow et al., 2002) since 1998 hasdemonstrated that surface freshwater exhibits temporal as well as spatial variability.The map in Figure 1 depicts the accumulated precipitation deficits (at intervals of150 mm) for the period November through April, 1998–1999 to 2000–2001, usingthe CAMS-OPI dataset, a blend of satellite and station data (Janowiak and Xie,1999).
As energy demands climb in Turkey, Syria, and Iraq, and each country movesto increase withdrawals from Middle Eastern rivers (Figure 1), it is critical thatclimate variability, both natural and anthropogenically forced, be objectively in-corporated into water resource related decision making. Turkey has significanthydroelectric power resources (104 hydropower stations, installed capacity 10.2 gi-
Climatic Change 55: 315–338, 2002.© 2002 Kluwer Academic Publishers. Printed in the Netherlands.

316 HEIDI M. CULLEN ET AL.
Figure 1. Inset globe shows the domain (23◦–55◦ E; 29◦–45◦ N) (box) used in the statistical analysis.The enlarged map depicts accumulated precipitation deficits (at intervals of 150 mm) for the periodNovember through April, 1998–1999 to 2000–2001, using the CAMS-OPI dataset, a blend of satelliteand station data (Janowiak and Xie, 1999). The six streamflow stations used in the analysis aremarked with circles and the major rivers are labelled.
gawatts (GW)). Major Turkish dams include the Ataturk (2,400 megawatts (MW)),the Keban (1,330 MW) and the Karakaya Dam (1,800 MW) all on the EuphratesRiver. The Ilisu Dam (1,200 MW) is the largest hydropower project on the TigrisRiver. Electricity production in 1999 was 116.5 billion kWh with hydropower mak-ing up ∼30.5%. Syria’s total installed electric generating capacity as of 1999 was4.5 GW with ∼20% coming from hydropower. New hydopower facilities includethe 630 MW Tishreen hydropower station built on the Euphrates and completed in1997. Electricity production in 1998 was 17.5 billion kWh with hydropower mak-ing up ∼57%. Approximately 90% of Iraq’s national power grid was destroyed inthe Gulf War. In early 1992, Iraq claimed to have restarted 75% of the national grid,including the Saddam Dam (750 MW) on the Tigris River. Electricity productionin 1998 was 28.4 billion kWh with hydropower making up less than 5% (DOE,2001).
In addition to management factors and land-use change, interannual to decadalchanges in December through March precipitation and streamflow in the easternMediterranean are tied to the North Atlantic Oscillation (NAO), a dominant modeof Atlantic sector climate variability (Cullen and deMenocal, 2000a; Eshel andFarrell, 2000). Like the El Niño Southern Oscillation (ENSO) (Simpson et al.,1993a; Cane et al., 1994), the NAO has been shown to impact both marine andterrestrial ecosystems (Fromentin and Planque, 1996; Alheit and Hagen, 1997;Beniston, 1997). However, unlike ENSO, there is still considerable doubt as towhether the NAO is a coupled ocean-atmosphere process. Coupled, or two-wayinteractions between the ocean and atmosphere suggest the potential for a degree

IMPACT OF THE NORTH ATLANTIC OSCILLATION 317
of predictability. Predictability resides primarily within the long-term memory ofthe ocean and provides the opportunity for long-range climate forecasting (Masonet al., 1999). The only unquestioned example, of a coupled ocean-atmosphere in-teraction is ENSO (Philander, 1983, 1985; Cane and Zebiak, 1985). Some haveargued the case for coupled ocean-atmosphere interactions in the North Atlantic(Rodwell et al., 1999), however this remains to be seen.
This paper attempts to explore the seasonal relationship between streamflowand large-scale climate variations with the hope of generating an awareness thatnatural climate variability, coupled with global warming, management factors, andland-use change, could significantly alter interannual to decadal streamflow. InSection 2, we introduce the major rivers of the Middle East, and describe themotivation for a statistical reconstruction of streamflow in the region. As data isoften limited in this region we create a reconstruction of the streamflow time seriesusing a statistical technique which employs reduced space optimal interpolation tofill in missing records. In Section 3, we describe the NAO and provide a descriptionof the dynamics linking the NAO and the Middle East. In Section 4, we define anew sea surface temperature (SST) based index of the NAO and investigate its rela-tionship with Middle East temperature, precipitation and streamflow. We then lookat the first principal component of this optimally interpolated streamflow datasetand quantify its climatic connections to the NAO during both winter and spring.
2. Major Rivers of the Middle East
The Middle East has a Mediterranean macroclimate, characterized by cool, wetwinters and hot, dry summers (Figure 1). Most of the Middle East lacks access tosurface and groundwater resources due to the subtropical predominance of evapo-ration over precipitation. One important exception is Turkey, which has abundantprecipitation resulting from the orographic capture of winter rainfall from eastwardpropagating mid-latitude cyclones generated in the Atlantic Ocean and the easternMediterranean Sea. Among the major river systems of the Middle East are theTigris-Euphrates and the Jordan-Yarmouk Rivers. Both river systems cross interna-tional borders and transboundary water disputes over rightful entitlement have beenongoing. Not considered a major river, the Ceyhan is contained completely withinTurkey, flowing down from the Taurus Mountains with a combined discharge of14 billion cubic meters (BCM) per year.
2.1. THE TIGRIS AND EUPHRATES RIVERS
Originating in the Taurus Mountains and Anatolian Highlands of Turkey, the Tigrisand Euphrates Rivers, annually discharge ∼74 BCM and exhibit significant inter-annual variability. After leaving Turkey, the Tigris and Euphrates Rivers flow intoSyria and Iraq, ultimately converging to form the Shatt Al-Arab and draining into

318 HEIDI M. CULLEN ET AL.
the Persian Gulf (Soffer, 1999). The Tigris-Euphrates system, with a combineddrainage area of 4.1 105 km2, has two primary flooding periods: the first, Decemberthrough March, is due mostly to surface runoff from winter rainfall; the second rise,from April to June, reflects spring snowmelt (Hillel, 1994).
The Euphrates is the combination of two tributaries: the Karasu and the Muratwhich begin on the slopes of Mount Ararat north of Lake Van. The Keban Damis situated at a point where these two tributaries meet (Figure 1). After Keban, theEuphrates flows through the southeastern Taurus Mountains and crosses into Syriawhere the major tributaries are the Balikh and the Khabur. At 360 km downstreamfrom the Iraqi-Syrian border, the river reaches its alluvial delta in Iraq. Fartherdownstream, a portion of the river drains into Lake Hammar while the remainderjoins the Tigris. Mean annual Euphrates streamflow is approximately 35 BCM, ofwhich 30 BCM forms from surface runoff and spring melt within Turkey; withlarge interannual variations (Kolars, 1997). The Euphrates is 2,700 km long with41% of its flow in Turkey, 24% in Syria and 35% in Iraq.
The Tigris forms in the eastern part of Turkey near Lake Hazar, only 30 km fromthe headwaters of the Euphrates, and flows southeast, where it forms the borderbetween Turkey and Syria before entering Iraq. The major tributaries of the Tigrisare the Greater Zab, the Lesser Zab, the Adhaim, the Diyala, and the Karun. Thelongest tributary of the Tigris, the Karun, begins in Iran flowing westward intoIraq. Mean annual Tigris streamflow is approximately 50 BCM, of which 23 BCMoriginates in Turkey, with the rest added in Iraq. The Tigris is 1,900 km long with21% of its flow in Turkey, 77% in Iraq, and 2% in Syria.
2.2. THE JORDAN-YARMOUK RIVERS
Although small when compared to the Tigris-Euphrates, the Jordan-Yarmoukdrainage basin extends over Israel, Jordan, Syria, and Lebanon making it geopo-litically important. The Jordan originates at the foot of Mount Hermon, a regionwhich receives 1,300 mm of precipitation per year. The northern sources of theJordan are the Dan which delivers on average 245 million cubic meters (MCM)per year, the Banias which delivers average 120 MCM per year, and the Hasbaniwhich delivers on average 128 MCM per year. These three tributaries converge inIsrael and form the main stream of the Jordan which then flows southward intoLake Kinnerat, eventually draining into the Dead Sea (Shapland, 1997). Shortlyafter its exit from Lake Kinnerat, the Jordan is joined by its primary tributary,the Yarmouk. Farther south, the Jordan is joined by two additional tributaries, theHarod and the Yabis, then finally the Fariah, the Zarqa, and the Nusayrat. Beforeits waters were diverted for irrigation purposes the average annual discharge was1.2 BCM of which 660 MCM came from the upper Jordan, 475 MCM came fromthe Yarmouk. The Jordan is 330 km long with 54% in Jordan, 30% in Syria, 14%in Israel and 2% in Lebanon (Hillel, 1994; Soffer, 1999).

IMPACT OF THE NORTH ATLANTIC OSCILLATION 319
2.3. STREAMFLOW ANALYSIS
Despite significant steps taken to gather and maintain a global archive of stream-flow data during the International Hydrological Decade, coordinated by the UnitedNations Educational, Scientific, and Cultural Organization (UNESCO) in the1960s, there has been little effort to maintain this network in the Middle East andmost instrumental records cover relatively short, non-overlapping time intervalsending in the mid-70s or early 80s. This lack of data greatly complicates the use ofstandard statistical techniques like principal component analysis (PCA), canonicalcorrelation analysis (CCA), and singular value decomposition (SVD) (Brethertonet al., 1992). Evans et al. (2000b) developed a method to approach such problemsand applied it successfully to isolating modes of global variability in coral δ18O, animportant climate proxy. As a result, isolating the dominant climatic contributionsto variability in individual records of streamflow can be employed as a means ofreconstructing stations with sparse coverage. In fact, the strong connection betweenstreamflow and ENSO allowed seasonal to interannual streamflow prediction ofthe Australian rivers, Darling and Murray, (Simpson et al., 1993b) as well as theNile River (Elfatih and Eltahir, 1996). Here we apply, with some modification, thismethod to five streamflow records representing discharge in the Tigris-Euphrates,Jordan-Yarmouk, and Ceyhan Rivers, as a means of quantifying the control of theNAO on Middle Eastern water resources.
3. The North Atlantic Oscillation (NAO)
The NAO is the dominant source of Atlantic sector climate variability, account-ing for one-third of the total variance in sea-level pressure and 20–60% of theDecember through March (DJFM) temperature and rainfall variability in Scandi-navia, Greenland, Europe, and the Mediterranean over the past 150 years (Hurrell,1995). Because the signature of the NAO is strongly regional, a simple NAO indexhas been defined as the difference between the normalized mean DJFM sea-levelpressure (SLP) anomalies at locations representative of the relative strengths ofthe Azores High (AH) and Icelandic Low (IL). A lower-than-normal (higher-than-normal) IL and higher-than-normal (lower-than-normal) AH result in an enhanced(reduced) pressure gradient and a positive (negative) NAO index. During this+NAO (–NAO) phase, surface winds and wintertime storms moving from west toeast across the North Atlantic are stronger (weaker) than usual. As a result, wetterand warmer (drier and cooler) winter conditions occur in northern Europe, Scan-dinavia and the east coast of the U.S., while cooler and drier (warmer and wetter)winters occur in Greenland and the Mediterranean extending into the Middle East.
Investigation of the power spectrum of the instrumental NAO sea level pressure(NAOSLP) index for the past 130 winters reveals dominant periods of variability,centered on 6–10 years and 2–3 years (Hurrell and Van Loon, 1997). Also signifi-cant is the red portion of the NAO power spectrum, which may exhibit significant

320 HEIDI M. CULLEN ET AL.
modulation on interdecadal and century timescales (Delworth and Mann, 2000).Thus, the possibility exists that NAO-related interdecadal-centennial scale vari-ability may play a principle role in Middle Eastern Holocene climate variability(Mann, 2002).
Over the past several decades, the NAO index has steadily strengthened, risingfrom its low index state in the 1960s to a historic maximum in the 1990s. This trendaccounts for a significant portion of the DJFM temperature increase over Eurasia(Hurrell and Van Loon, 1997; Hurrell et al., 2001). Consequently, the NAO hasbeen introduced into the global warming debate with a search for mechanismsthat could resolve to what extent this trend is a combination of anthropogenicperturbation and natural variability (Hoerling et al., 2001).
3.1. PRECIPITATION VARIABILITY ASSOCIATED WITH THE NAO
Here we describe more fully the influence of the NAO on interannual to decadalprecipitation variability in the Middle East. We compute composite precipitationanomalies using the 21-year CMAP monthly data set (Xie and Arkin, 1996) overthe region (90◦ W–60◦ E; 20◦ N–70◦ N) extending from the east coast of the U.S.to the Middle East for months with positive and negative values of the NAO in-dex for the period January 1979 through December 1998 (Figure 2). High andlow index values were defined as the highest and lowest quartile in the 20-yearrecord for each month. Composite anomalies averaged over the months DJFM,conventionally the period when the NAO is most active and well defined, werethen computed. The accepted signature of the NAO, with enhanced precipitation inwestern Europe during high index periods, and in the eastern Mediterranean duringlow index periods, is evident (Cullen and deMenocal, 2000a; Eshel and Farrell,2000). However, this picture provides additional detail, much of it not visible inearlier studies based solely on station observations (Dai et al., 1997). An axisof enhanced monthly wintertime precipitation is seen during low index periodsextending from the southeastern U.S. across the Atlantic to the Iberian Peninsula,with negative anomalies approximately parallel to the north and south. During highindex periods, the pattern is nearly reversed, but departures from strict linearity canbe seen. The enhanced precipitation axis during low index months extends acrossthe northern Mediterranean nearly to the Caspian Sea with an enhanced secondarymaximum along the west coast of Spain and Portugal and over Turkey.
A relationship between the eastern Mediterranean and Atlantic sector is to beexpected because the NAO regulates Atlantic heat and moisture fluxes into theMediterranean region (Turkes, 1996a,b). Since these winter cyclones are the dom-inant source of Middle Eastern rainfall and river runoff, NAO-related changes inAtlantic westerly heat/moisture transport and Atlantic/Mediterranean SST’s can beexpected to influence Middle Eastern climate.

IMPACT OF THE NORTH ATLANTIC OSCILLATION 321
Figure 2. (a) Composite of the most negative quartile of NAOSLP index years (–NAO phase) and (b)the most positive quartile of NAOSLP index years (+NAO phase).
4. Data and Methodology
The NAO has a coherent signal in SST involving a tripole pattern of almost zonallyoriented anomalies with subtropical and high-latitude SST’s varying in-phase andmid-latitude SST’s varying out-of-phase (Seager et al., 2000). While the NAO re-flects changes in the strength and orientation of mid-Atlantic westerlies, whichdictate heat and moisture flux trajectories, the NAO is also expressed in termsof distinct North Atlantic SST, sub-surface temperature (Molinari et al., 1997;Reverdin et al., 1997) and sea-ice extent anomalies (Deser and Blackmon, 1993).During the positive phase of the NAO, SST’s in the eastern Labrador Sea, east-ern Mediterranean, and subtropical Atlantic are anomalously cold by 0.5–1 ◦C,whereas SST’s in the North Sea and Sargasso Sea are anomalously warm byapproximately the same amount (Deser and Blackmon, 1993).

322 HEIDI M. CULLEN ET AL.
Table I
The five ‘centers of action’ selected from the North At-lantic sector and their respective correlation with theNAOSLP index (Hurrell, 1995). All five centers are foundto be significantly correlated at the 99% confidence levelaccording to the two-tailed t-test
Region Lat. Lon. r-value
North Sea 50–55◦ N 0–5◦ E 0.61
Labrador Sea 55–60◦ N 45–40◦ W 0.57
Sargasso Sea 30–35◦ N 65–60◦ W 0.30
E. Mediterranean 30–35◦ N 30–35◦ N 0.55
S. Atlantic 10–15◦ N 45–40◦ E 0.40
4.1. AN SST-BASED NAO INDEX
Here we develop an SST anomaly index of the NAO to extract the NAO-relatedcomponent of Atlantic SST variability. We then use this NAOSST index to explorelinkages between changes in North Atlantic surface ocean conditions and MiddleEastern streamflow.
The technique we employ is similar in principle to that used for the NINO3index which tracks ENSO in the tropical Pacific Ocean (Rasmusson and Carpenter,1982). The NAOSLP index of Hurrell (1995) (Figure 3a) was spatially correlatedagainst global, gridded (5◦ × 5◦), and standardized SST anomalies between 1857–2000 (Kaplan et al., 1998). From the resulting spatial correlation field the fivehighest correlation (ri) ‘centers of action’ (CSST) were identified, each correspond-ing to one 5◦ × 5◦ grid SST time series (Table I). All five centers are found tobe significantly correlated at the 99% confidence level according to the two-tailedt-test. The five SST anomaly time series (CSST1–CSST5) were then combined usingthe following relation to develop the 1857–2000 NAOSST index, (I (t), in units of◦C):
I (t) =∑5
i=1[ri × (CSST)]5
. (1)
Criteria for selecting the centers was based upon similar level of correlationamong the five and a physically grounded connection linking each center to theNAO. The North Sea, Labrador Sea, and Sargasso Sea regions were identifiedby Kushnir (1994) as dominant ‘centers of action’ and explain 70% of the totalvariance. The eastern Mediterranean and equatorial region were selected based onsignificant correlation.

IMPACT OF THE NORTH ATLANTIC OSCILLATION 323
Figure 3. (a) The NAOSLP index (Hurrell, 1995) is shown as a dashed line and the NAOSST in ◦C isshown as a solid line. The correlation between the two indices is 0.67 and is significant at the 99.9%confidence level according to the two-tailed t-test. (b) The spectrum the NAOSLP index (dashed) andNAOSST (solid) indices.
4.2. INDEX INTER-COMPARISON
The resulting NAOSST index (Figure 3a) is highly correlated to the NAOSLP index(r = 0.67, significant at the 99.9% confidence level according to the two-tailedt-test). The North Sea, Labrador Sea, and eastern Mediterranean centers are thethree strongest variance contributors to the NAOSST index (Table I). The fourth andfifth correlation centers in the central tropical Atlantic and the Sargasso Sea con-tribute the remaining NAOSST index variance. In Figure 3b we compute the spectraldensity of both the NAOSLP and NAOSST index. The NAOSST index reflects NAO-related changes in Atlantic surface ocean temperature variability which, becauseof its high thermal inertia, is an efficient integrator of atmospheric fluctuations andshows less year to year variability.

324 HEIDI M. CULLEN ET AL.
4.3. SEASON-LAG DIAGRAMS
Middle East (ME) temperature, precipitation, and streamflow display strongseasonality. As a result it is useful to introduce season lag (SL) diagrams where:
f (s, l) = corr[x(s + l, t), y(s, t)]. (2)
Contour plots of these fields display the lagged correlation coefficient betweenclimatic timeseries x(s, t) and y(s, t) computed overall available years t and arepresented as a function of season s and seasonal lag l. The zero-lag line showssynchronous correlations computed separately for different seasons. The top halfof the diagram shows seasonal correlations for x lagging y, and bottom half showsthe same for x leading y. SL diagrams are convenient to suggest causalities; if x
in some season affects values of y in the same and later seasons, it will be seen asstructure of significant correlation values propagating from the zero-lag line to thebottom half of the diagram with slope –1.
We apply this type of analysis to compare the relationship between the NAOSLP
and NAOSST indices. Figure 4a suggests that the SLP dipole of the NAO in Janu-ary, February and March (JFM) influences SST in the five regions used to createthe NAOSST index until the onset of summer. The SL diagram can also be usedto study autocorrelations of the climatic values separately for different seasons:Figure 4b demonstrates a lack of significant month-to-month correlation in theNAOSLP index, while Figure 4c displays a 4–6 month decorrelation (dependingon the season) for the NAOSST index. All SL diagrams cover the period 1938–1984(n = 47), therefore a correlation of ∼0.23 is significant at the 90% confidence leveland a correlation of ∼0.27 is significant at the 95% confidence level according tothe two-tailed t-test.
4.4. MIDDLE EAST TEMPERATURE AND PRECIPITATION
As ME temperature and precipitation are the natural drivers of river runoff andsnowmelt, we begin with an investigation of these variables. First, we develop com-posite indices of ME winter precipitation and temperature anomalies to summarizethe interannual to decadal climate variability spanning the interval 1938–1984. Forthe ME winter precipitation anomaly index, DJFM total precipitation was averagedover the region (26.25◦ E to 48.75◦ E) and (37.50◦ N to 42.50◦ N) using the precip-itation dataset of Hulme (1994). This region captures the headwaters of the fiverivers used in this study: the Tigris, the Euphrates, the Yarmouk as well as the Cey-han and Karun. For the temperature anomaly index, DJFM temperature anomalieswere averaged over the region (25.0◦ E to 50.0◦ E) and (35.0◦ N to 45.0◦ N) usingthe temperature dataset of Jones (1994).
In order to interpret the influence of the NAO on streamflow we first determinethe influence of the NAO on ME precipitation and air temperature using the SLdiagrams introduced in Figure 4. Results, presented in Figure 5, suggest that the

IMPACT OF THE NORTH ATLANTIC OSCILLATION 325
Figure 4. (a) The seasonal lag (SL) correlation between NAOSLP and the NAOSST index, (b) theSL autocorrelation of NAOSLP index and (c) the SL autocorrelation of the NAOSST index. All SLdiagrams show correlations for the period 1938–1984 (n = 47), a correlation of ∼0.23 is significantat the 90% confidence level and a correlation of ∼0.27 is significant at the 95% confidence levelaccording to the two-tailed t-test.

326 HEIDI M. CULLEN ET AL.
Figure 5. The influence of the NAOSLP index on (a) monthly Middle East (ME) gridded precipitationand, (b) monthly ME gridded temperature. The influence of the NAOSST index on (c) monthly MEgridded precipitation and (d) monthly ME gridded temperature. Gridded precipitation data are fromHulme (1994) and are averaged over the region (26.25◦ E–48.75◦ E; 37.50◦ N–42.50◦ N) for theperiod 1938–1984. Gridded temperature data are from Jones (1994) and are averaged over the region(25.0◦ E–50.0◦ E; 35.0◦ N–45.0◦ N) for the period 1938–1984.
most robust influence of the NAO is its effect on December and January (DJ)precipitation and DJFM air temperature. This influence can be seen for both SLPand SST versions of the NAO index. However, since winter SLP influences theNAOSST index at a variety of positive lags and this new index is in general muchsmoother and more persistent than the NAOSLP index, the SL diagrams for theNAOSST index show higher and more positive lag correlations than those for theNAOSLP index. For example, while the NAOSLP index shows no influence on Junethrough October air temperature, the NAOSST index shows continuous synchronouscorrelation from May through December.

IMPACT OF THE NORTH ATLANTIC OSCILLATION 327
Table II
River gauges used in the present analysis are from the NCARdata catalog (http://dss.ucar.edu/datasets/ds552.0/), covering,incompletely, the period of 1938 through 1984, location, flow,and length (n), in years, of the monthly time series. (Flow valuesare from Soffer (1999). NA means not available)
River Location Flow (BCM) Length
Ceyhan Misis, Turkey NA 13
Euphrates Keban, Turkey 20.1 36
Karun Ahvaz, Iran 23.0 20
TigrisMosul Mosul, Iraq 21.0 9
TigrisBaghdad Baghdad, Iraq 39.1 9
Yarmouk Maqarin, Jordan 1.2 11
5. Optimal Interpolation of Streamflow Data
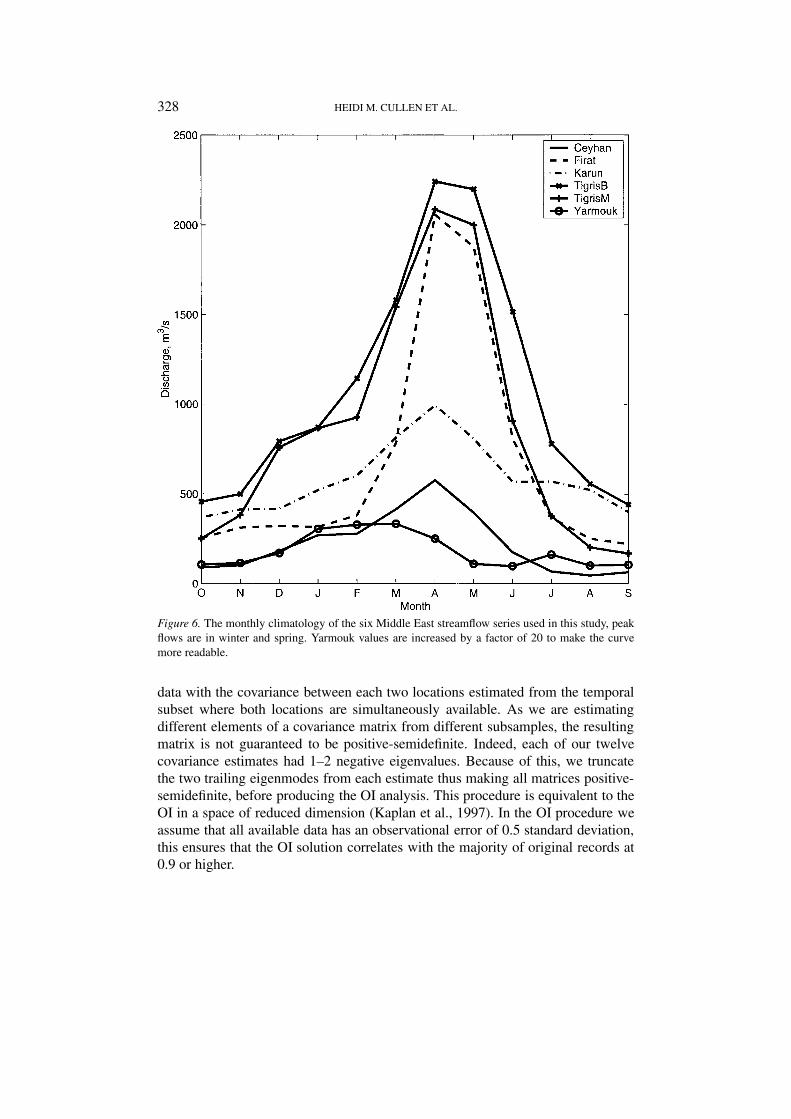
Although individual streamflow records are affected by both local climatic andbasin management factors, we expect regional Middle Eastern streamflow variabil-ity to be influenced by large-scale circulation features as well. We analyze monthlystreamflow for five ME rivers available from the NCAR data catalog, covering,incompletely, the period of 1938 through 1984. In Table II we show the location,flow (Soffer, 1999), and length (n), in years, of each streamflow record used inthe analysis. Included in the analysis are only those rivers displaying distinct sea-sonality, with a significant portion of the discharge occurring in the period fromDecember to July. Seasonal cycles of streamflow estimated for each of the sixgauges are presented in Figure 6 (Yarmouk values are increased by a factor of 20to make the curve more readable). The DJFM period displays an ∼1.5 time smallertotal water volume than April through July (AMJJ).
We then employ a statistical approach in order to establish connections ofstreamflow with local (precipitation and temperature) and large-scale (NAO)climatic indices. The scarcity of the streamflow data coupled with the strongseasonality of its climatic connections makes this task difficult. We begin by per-forming a reduced space optimal interpolation (OI) analysis (Kaplan et al., 1997;Evans et al., 2000) on the standardized monthly streamflow anomalies for each ofthe twelve months in the seasonal cycle. Standardization was performed by takingdifferences between the recorded values and the annual cycle of Figure 6 and di-viding them by their standard deviations. Seasonal separation involves computinglocation by location (6 × 6) covariance matrices separately for each month in ayear and prevents interseasonal mixing of dominant spatial patterns of streamflowcovariability. Covariance matrices are then computed from these incomplete sets of
328 HEIDI M. CULLEN ET AL.
Figure 6. The monthly climatology of the six Middle East streamflow series used in this study, peakflows are in winter and spring. Yarmouk values are increased by a factor of 20 to make the curvemore readable.
data with the covariance between each two locations estimated from the temporalsubset where both locations are simultaneously available. As we are estimatingdifferent elements of a covariance matrix from different subsamples, the resultingmatrix is not guaranteed to be positive-semidefinite. Indeed, each of our twelvecovariance estimates had 1–2 negative eigenvalues. Because of this, we truncatethe two trailing eigenmodes from each estimate thus making all matrices positive-semidefinite, before producing the OI analysis. This procedure is equivalent to theOI in a space of reduced dimension (Kaplan et al., 1997). In the OI procedure weassume that all available data has an observational error of 0.5 standard deviation,this ensures that the OI solution correlates with the majority of original records at0.9 or higher.

IMPACT OF THE NORTH ATLANTIC OSCILLATION 329
5.1. STATISTICAL ANALYSIS OF OPTIMALLY INTERPOLATED DATA
We perform empirical orthogonal function (EOF) analysis on twelve seasonal sub-samples of the interpolated record. It is well known that the choice of sign for anEOF pattern is arbitrary. In order to avoid month to month sign shifts and alloweasier interpretation of the results, we restrict the sign of the sum of EOF loadingsin each season to be positive, and change the sign of the corresponding principalcomponents (PC) accordingly. Figure 7 describes the seasonal march of the thefirst EOF loadings (Figure 7a), as well as the percentage of variance (Figure 7b),and the total variance of monthly anomalies (Figure 7c). Throughout the period ofsignificant streamflow (December through July) the 1st EOF loadings at all sitesare almost always positive (except for Ceyhan in April and Yarmouk in July). Thisidentifies a common signal in all records, represented by the corresponding PC, andaccounts for 70% of total variance during DJFM and 60% to 90% during AMJJ.Note that the DJFM period is characterized by a more stable EOF1 loading profilethan the AMJJ period.
We use these SL diagrams to substantiate connections between the first PC(PC1) of ME streamflow, local precipitation and temperature, and large-scale(NAO) climatic parameters (Figure 8). Seasonally inhomogeneous persistence instreamflow and local climate is illustrated by comparison of Figures 8a–c. Whiledecorrelation times of precipitation (less than one month) and air temperature (1–2months) are seasonally uniform, streamflow undergoes a transition in November,showing no correlation with earlier months. Also significant are two similar butmore moderate transitions in April and July, thereby providing additional justi-fication for separating streamflow into winter-spring (DJFM) and spring-summer(AMJJ) groups. We do not study streamflow in the remaining period (August toNovember) as total discharge in this period is negligible.
Figure 9 suggests that different processes may dominate variability in stream-flow during the DJFM and AMJJ periods, with large-scale NAO dynamics in-fluencing winter-spring (DJFM) and local processes influencing spring-summer(AMJJ). Figure 9a represents the influence of monthly precipitation on PC1 ofreconstructed ME streamflow over the period 1938–1984. The DJFM period ofPC1 shows synchronous and lagged positive correlations with DJ precipitation,as seen by the downward sloping region and 0 to –2 lag in months. This maybe suggestive of some type of storage mechanism linking February and Marchstreamflow to DJ precipitation. The AMJJ period of PC1 shows significant or near-significant positive correlation with precipitation during the previous half year fromDecember to May, strongest correlation (r = 0.4) is between June streamflow andMay precipitation (Figure 9a). This lagged relationship with temperature identifiessnowmelt as a major factor in regulating AMJJ streamflow. Figure 9b representsthe influence of monthly temperature on PC1. The DJFM period of PC1 displaysa zero-lag positive correlation with February and March (FM) temperature whichcan be interpreted as an increase in streamflow via snowmelt during years in which

330 HEIDI M. CULLEN ET AL.
Figure 7. (a) Monthly loadings of the 1st EOF of Middle Eastern streamflow, (b) percent varianceexplained by the 1st EOF and, (c) total monthly variance in the optimal interpolation (OI) analysisof normalized streamflow.
air temperature during the cold season is anomalously high. We suggest that DJFMstreamflow is most strongly influenced by the NAO, as streamflow over this periodshows a synchronous NAO connection (centered on January and February) for theNAOSLP index (Figure 9c). A similar phenomenon is seen for the NAOSST indexwhereby significant correlation extends over lagged periods from 2 months priorto 4 months later (Figure 9d). The AMJJ period of PC1 shows no significant NAOcorrelation further supporting a more local connection.
In order to more closely examine these interpretations in a temporal domain, wecompute total DJFM and AMJJ streamflow of ME rivers, and then repeat our OIanalysis and EOF calculation for each of these two seasons. Figure 10a comparesPC1 of DJFM streamflow (which accounts for 81% of total variance) with the dom-

IMPACT OF THE NORTH ATLANTIC OSCILLATION 331
Figure 8. (a) Seasonal lag (SL) correlation of PC1 of monthly Middle East (ME) streamflow, (b) SLcorrelation of monthly ME precipitation, (c) SL correlation of monthly ME temperature.

332 HEIDI M. CULLEN ET AL.
Figure 9. (a) The influence of Middle East (ME) precipitation on PC1 of reconstructed monthlystreamflow, (b) same as in (a) except the influence of ME temperature, (c) same as in (a) except theinfluence of the NAOSLP index, (d) same as in (a) except the influence of the NAOSST index.
inant climatic factors presented in Figure 9: DJ precipitation, FM air temperature,and the NAO. Table III presents the corresponding correlation coefficients as wellas the correlations for individual OI interpolated records. PC1 is well representedby all records and is significantly correlated with all four identified climatic factors,DJ precipitation being the strongest influence.
Figure 10b compares PC1 of AMJJ (which accounts for 59% of the totalAMJJ variance) with December through May precipitation and March throughMay air temperature. Table IV presents the corresponding correlation coefficientsand shows that the agreement in the records of the individual rivers in this period

IMPACT OF THE NORTH ATLANTIC OSCILLATION 333
Figure 10. (a) NAOSLP and NAOSST correlated with winter-spring (DJFM) PC1 of reconstructedMiddle East (ME) streamflow, ME precipitation (December to January; DJ), and air temperature(February to March; FM). (b) PC1 of spring-summer (AMJJ) reconstructed ME streamflow cor-related with ME precipitation (December through May; DJFMAM) and ME temperature (Marchthrough May; MAM). Correlation values are listed in Tables III and IV.

334 HEIDI M. CULLEN ET AL.
Table III
Correlations for DJFM period
River PC1 TJF PDJ NAOSLP NAOSST
Ceyhan 0.81 0.37 0.57 –0.36 –0.46
Euphrates 0.97 0.41 0.57 –0.47 –0.48
Karun 0.75 0.15 0.38 –0.44 –0.29
TigrisMosul 0.99 0.37 0.62 –0.49 –0.50
TigrisBaghdad 0.98 0.36 0.59 –0.49 –0.48
Yarmouk 0.73 0.03 0.46 –0.43 –0.32
PC1 1.00 0.36 0.61 –0.50 –0.49
Table IV
Correlations for AMJJ period
River PC1 TMAM PDJFMAM
Ceyhan –0.08 –0.02 0.26
Euphrates 0.96 –0.46 0.63
Karun 0.90 –0.47 0.61
TigrisMosul 0.91 –0.44 0.39
TigrisBaghdad 0.96 –0.51 0.54
Yarmouk 0.05 –0.12 0.13
PC1 1.00 –0.50 0.59
is not uniform. The Ceyhan and Yarmouk contribute very little towards PC1, whilethe Euphrates, the Tigris, and PC1 return a significant correlation for both climaticfactors.
6. Conclusions
Water allocation issues have been ongoing since the emergence of early Mesopo-tamian civilization along the alluvial lowlands of the Tigris and Euphrates Riversroughly 6,000 years ago (Weiss, 1997; Cullen and deMenocal, 2000b; Algaze,2001). Water scarcity remains a concern in the modern Middle East, where re-gional population is now increasing by 3.5% each year and water storage/irrigationpractices consume at least 80% of available water supply. In this paper, we furtherestablish the link between changes in Middle Eastern water supply associated withnatural variations in the climate system and SST variations in the Atlantic Ocean

IMPACT OF THE NORTH ATLANTIC OSCILLATION 335
and eastern Mediterranean Sea. We stress that if the NAO, influenced by increasedgreenhouse gases, continues its upward trend, then future amounts of Decemberthrough March precipitation and streamflow can be expected to be lower. It is quitepossible that, in addition to non-linearity and complexity of climate connectionsin this period, active river management influences river data during the spring andsummer. Both local and large-scale climate connections to streamflow establishedhere show a way for possible climatic modeling of ME streamflow for the period1985–present when data are difficult to obtain.
6.1. HOLOCENE CLIMATE VARIABILITY
In addition to their relevance for water resource management in the Middle East,these results may also be pertinent to understanding Holocene paleoclimate fluc-tuations and the paleoenvironments of early human civilizations in Mesopotamia(Weiss et al., 1993). Recent paleoclimate data from Greenland and the North At-lantic demonstrate that the past 11,700 years of the Holocene were punctuated bynumerous millennial-scale (1, 500 ± 500 years) cooling events (Bond et al., 1997).Although these Holocene cooling events were evidently much lower amplitude(perhaps 1–2 ◦C) than the well-known Dansgaard-Oeschger cycles of the previousglacial period, they seriously challenge the view that the Holocene was climaticallystable (Blunier et al., 1995; O’Brien et al., 1995; Keigwin, 1996). The linkage be-tween North Atlantic and Middle Eastern climate described here suggests that theseHolocene cooling events in the North Atlantic should have coeval climate changesignatures in the Middle East. As controls on Middle Eastern winter climate aretherefore dominated by North Atlantic sea surface temperature, and new evidencepoints to the likelihood of centennial scale variability in Atlantic sector SST’s,we propose that Middle East climate change during the Holocene, might also beviewed from within the framework of North Atlantic climate variability.
Acknowledgements
The authors would like to thank R. D’Arrigo, M. E. Mann, A. Oman, J. Simp-son for their helpful discussions. H. M. Cullen acknowledges support from theNOAA Postdoctoral Program in Climate and Global Change. Alexey Kaplan ac-knowledges support from the NOAA/NASA Enhanced Data Set Project grantNA06GP0567 and NSF/NOAA Earth System History grant NA86GP0437 This isLamont-Doherty Earth Observatory Contribution #6111. The authors would alsolike to thank the reviewers for their valuable comments and suggestions.
336 HEIDI M. CULLEN ET AL.
References
Algaze, C.: 2001, ‘Initial Social Complexity in Southwestern Asia – The Mesopotamian Advantage’,Current Anthropology 42, 199–233.
Alheit, J. and Hagen, E.: 1997, ‘Long-term Climate Forcing of European Herring and SardinePopulations’, Fish. Oceanogr. 6, 130–139.
Barlow, M., Cullen, H., and Lyon, B.: 2002, ‘Drought in Southwest and Central Asia: La Niña, theWarm Pool, and Indian Ocean Precipitation’, J. Climate, in press.
Beniston, M.: 1997, ‘Variations of Snow Depth and Duration in the Swiss Alps over the Last 50Years: Links to Changes in Large-Scale Climatic Forcings’, Clim. Change 36, 281–300.
Blunier, T., Chappellaz, J., Stauffer, B., and Raynaud, D.: 1995, ‘Variations in Atmospheric MethaneConcentration during the Holocene Epoch’, Nature 374, 46–49.
Bond, G., Showers, W., Cheseby, M., Lotti, R., Almasi, P., de Menocal, P., Priore, P., Cullen, H.,Hajdas, I., and Bonani, G.: 1997, ‘A Pervasive Millennial-scale Cycle in North Atlantic Holoceneand Glacial Climates’, Science 278, 1257–1266.
Bretherton, C. S., Smith, C., and Wallace, J. M.: 1992, ‘An Intercomparison of Methods for FindingCoupled Patterns in Climate Data’, J. Climate 5, 541–560.
Cane, M., Eshel, G., and Buckland, R.: 1994, ‘Forecasting Zimbabwean Maize Yield Using EasternEquatorial Pacific Sea Surface Temperature’, Nature 370, 204–207.
Cane, M. A. and Zebiak, S. E.: 1985, ‘A Theory for the El Niño and the Southern Oscillation’,Science 228, 1085–1087.
Cullen, H. M. and deMenocal, P.: 2000a, ‘North Atlantic Influence on Tigris-Euphrates Streamflow’,Int. J. Clim. 20, 853–863.
Cullen, H. M. and deMenocal, P.: 2000b, ‘The Possible Role of Climate in the Collapse of theAkkadian Empire: Evidence from the Deep Sea’, Geology 28, 379–382.
Dai, A., Fung, I., and DelGenio, A.: 1997, ‘Surface Observed Global Land Precipitation Variationsduring 1900–88’, J. Climate 10, 2943–2962.
Delworth, T. L. and Mann, M. E.: 2000, ‘Observed and Simulated Multidecadal Variability in theNorthern Hemisphere’, Clim. Dyn. 16, 661–676.
Deser, C. and Blackmon, M. L.: 1993, ‘Surface Climate Variations over the North Atlantic Oceanduring Winter: 1900–1989’, J. Climate 6, 1743–1753.
DOE: 2001, ‘Country Analysis Briefs’, in Energy Information Administration.Elfatih, A. and Eltahir, B.: 1996, ‘El Niño and the Natural Variability in the Flow of the Nile River’,
Water Resour. Res. 32, 131–137.Eshel, G., Farrell, C. M., and Farrell, B.: 2000, ‘Forecasting Eastern Mediterranean Droughts’, Mon.
Wea. Rev. 128, 3618–3630.Evans, M. N., Kaplan, A., and Cane, M. A.: 2000, ‘Intercomparison of Coral Oxygen Isotope
Data and Historical Sea Surface Temperature (SST): Potential for Coral-based SST FieldReconstructions’, Paleoceanography 15, 551–563.
Fromentin, J. M. and Planque, B.: ‘Calanus and Environment in the Eastern North Atlantic: Influenceof the North Atlantic Oscillation on C-finmarchicus and C-helolandicus’, Mar. Ecol. Prog. Ser.134, 111–118.
Hillel, D.: 1994, Rivers of Eden: The Struggle for Water and the Quest for Peace in the Middle East,Oxford University Press, 1st edn.
Hoerling, M., Whitaker, J., Kumar, A., and Wang, W.: 2001, ‘The Midlatitude Warming during 1998–2000’, Geophys. Res. Lett. 28, 755–758.
Hurrell, J., Kushnir, Y., and Visbeck, M.: 2001, ‘The North Atlantic Oscillation’, Science 291, 603–605.
Hurrell, J. and Van Loon, H.: 1997, ‘Decadal Variations in Climate Associated with the NorthAtlantic Oscillation’, Clim. Change 36, 301–326.

IMPACT OF THE NORTH ATLANTIC OSCILLATION 337
Hurrell, J. W.: 1995, ‘Decadal Trends in the North Atlantic Oscillation: Regional Temperatures andPrecipitation’, Science 269, 676–679.
Janowiak, J. and Xie, P.: 1999, ‘CAMS-OPI: A Global Satellite-raingauge Merged Product for Real-time Precipitation Monitoring Applications’, J. Climate 12, 3335–3342.
Kaplan, A., Cane, M., Kushnir, Y., Clement, A., Blumenthal, B., and Rajagopolan, B.: 1998,‘Analyses of Global Sea Surface Temperature 1856–1991’, J. Geophys. Res. Oceans 103,18567–18589.
Kaplan, A., Kushnir, Y., Cane, M., and Blumenthal, M.: 1997, ‘Reduced Space Optimal Analysisfor Historical Data Sets: 136 Years of Atlantic Sea Surface Temperatures’, J. Geophys. Res. 102,27835–27860.
Keigwin, L.: 1996, ‘The Little Ice Age and Medieval Warm Period in the Sargasso Sea’, Science 274,1504–1508.
Kolars, J.: 1997, ‘The Tigris-Euphrates Rivers’, Water Internat. 22, 49–53.Kushnir, Y.: 1994, ‘Interdecadal Variations in North Atlantic Sea Surface Temperature and Associ-
ated Atmospheric Conditions’, J. Climate 7, 141–157.Mann, M.: 2002, ‘Large-scale Climate Variability and Connections with the Middle East in Past
Centuries’, Clim. Change, this issue.Mason, S., Goddard, L., Graham, N., Yulaeva, E., Sun, L., and Arkin, P.: 1999, ‘The IRI Seasonal
Climate Prediction system and the 1997/1998 El Niño Event’, Bull. Amer. Meteorol. Soc. 80,1853–1873.
Molinari, R., Mayer, D., Festa, J., and Bezdek, H.: 1997, ‘Multiyear Variability in the Near-SurfaceTemperature Structure of the Midlatitude Western North Atlantic Ocean’, J. Geophys. Res. 102,3267–3278.
O’Brien, S., Mayewski, P., Meeker, L., Meese, D., Twickler, M., and Whitlow, S.: 1995, ‘Complexityof Holocene Climate as Reconstructed from a Greenland Ice Core’, Science 270, 1962–1964.
Philander, S.: 1983, ‘El Niño Southern Oscillation Phenomena’, Nature 302, 295–301.Philander, S.: 1985, ‘El Niño and La Niña’, J. Atmos. Sci. 42, 2652–2662.Rasmusson, E. M. and Carpenter, T. H.: 1982, ‘Variations in Tropical Sea Surface Temperature and
Surface Wind Fields Associated with the Southern Oscillation/El Niño’, Mon. Wea. Rev. 110,354–384.
Rverdin, G., Cayan, D., and Kushnir, Y.: 1997, ‘Decadal Variability of Hydrography in the UpperNorthern Atlantic in 1948–1990’, J. Geophys. Res. 102, 8505–8531.
Rodwell, M., Rowell, D. P., and Folland, C. K.: 1999, ‘Oceanic Forcing of the Wintertime NorthAtlantic Oscillation and European Climate’, Nature 398, 320–323.
Seager R., Kushnir, Y., Visbeck, M., Naik, N., Miller, J., Krahmann, G., and Cullen, H.: 2000,‘Causes of Atlantic Ocean Climate Variability between 1958 and 1998’, J. Clim. 13, 2845–2862.
Shapland, G.: 1997, Rivers of Discord: International Water Disputes of the Middle East, St. Martin’sPress, 1st edn.
Simpson, H., Cane, M., Herczeg, A., Zebiak, S., and Simpson, J.: 1993a, ‘Annual Dischargein Southeastern Australia Related to El Niño Southern Oscillation Forecasts of Sea SurfaceTemperatures’, Water Resour. Res. 29, 3671–3680.
Simpson, H., Cane, M., Lin, S., Zebiak, S., and Herczeg, A.: 1993b, ‘Forecasting Annual Dischargeof River Murray, Australia, from a Geophysical Model of ENSO’, J. Climate 6, 386–391.
Soffer, A.: 1999, Rivers of Fire: The Conflict over Water in the Middle East, Rowman and LittlefieldPublishers, 1st edn.
Turkes, M.: 1996a, ‘Meteorological Drought in Turkey: A Historical Perspective 1930–1993’,Drought Network News 8, 17–21.
Turkes, M.: 1996b, ‘Spatial and Temporal Analysis of Annual Rainfall Variations in Turkey’, Int. J.Clim. 16, 1057–1076.
Weiss, H.: 1997, ‘Archaeology in Syria’, Amer. J. Archaeology 101, 97–148.

338 HEIDI M. CULLEN ET AL.
Weiss, H., Courty, M., Wetterstrom, W., Guichard, F., Senior, L., Meadow, R., and Curnow, A.: 1993,‘The Genesis and Collapse of 3rd Millennium North Mesopotamian Civilization’, Science 261,994–1004.
Xie, P. and Arkin, P.: 1996, ‘Global Monthly Precipitation Using Gauge Observations, SatelliteEstimates, and Numerical Model Predictions’, J. Climate 9, 840–858.
(Received 7 October 1999; in revised form 4 March 2002)