impact of the intellectual property system on economic ... · there has been a lot of controversy...
TRANSCRIPT

WIPO-UNU Joint Research Project
Impact of the Intellectual Property System on Economic Growth
Fact-Finding Surveys and Analysis in the Asian Region
Country Report - India
S.K.Verma
Associate Professor
Birla Institute of Technology & Science, Pilani
N.V.Muralidhar Rao
Associate Professor
Birla Institute of Technology & Science, Pilani

1
Table of Contents
1. Introduction ---------------------------------- p. 2
1. 1 Outline of the Present IP System in India
1. 2 Outline of the Present Economic Situation in India 2. Survey on Reforms towards IP-based EconomicDevelopment ------- p. 3
2. 1 Brief History of Intellectual Property Laws and Policies in India
2. 2 Identification of Reforms towards IP-based Economic Development 3. Case Studies on Companies utilizing the IP System to develop
Business or increase Economic Activity ------------------------------------- p. 7
3. 1 Comparison of Company Data among majour Industrial Fields 3. 2 Results of Analysis 4. Analysis of reforms that exerted Influence on Economic Development
underpinned by the IP System using Economic Models ----------------- p. 10 4.1 Establishing the Economic Models 4.2 Results of Analysis 5. Discussion and Proposal -------------------------------------------------------- p. 16
<Reference>

2
1. Introduction There has been a lot of controversy on the role of intellectual property
protection (IPP) regime especially the patent system in fostering innovation, technology and industrial development of a country. IPP is expected to encourage innovation by rewarding the inventor. Strong IPP regime may also inhibit diffusion of knowledge and even technology development in the countries that are technology followers. Countries have fine-tuned their IPP regimes as per their developmental requirements. Against this backdrop, the on-going attempt to harmonize and strengthen the IPP regimes worldwide, as a part of the TRIPs Agreement, is widely seen to be adversely affecting the technological activity in developing countries by choking the knowledge spillovers besides implications for the access and affordability to lifesaving drugs by the poor. 1. 1 Outline of the present IP System in India
Uruguay round of GATT negotiations paved the way for WTO. Therefore India was put under the contractual obligation to amend its patents act in compliance with the provisions of TRIPS. Accordingly, the Government brought into force Patents Rules, 1972 w.e.f. 20.4.1972. These Rules were amended and replaced by the Patents Rules 2003 and further amended by the Patents (Amendment) Rules 2005, this includes provisions relating to time-lines with a view to introducing flexibility and reducing processing time gradually for patent applications, and simplifying and rationalizing procedure for grant of the patent. 8. There are four Schedules to the Patents (Amendment) Rules 2005; the First Schedule prescribes the fees to be paid; the Second Schedule specifies the list of forms and the texts of various forms required in connection with various activities under the Patents Act are set out in this schedule. These forms are to be used wherever required and if needed, they can be modified with the consent of the Controller. The Third Schedule prescribes form of Patent to be issued on Grant of the Patent. The Fourth Schedule prescribes costs to be awarded in various proceedings before the Controller under the Act. 1. 2 Outline of the present Economic Situation in India
India has indeed gradually moved on
to a higher GDP growth path – 7 percent-plus (Fig.1), and this has been made possible by many factors. The following two elements need to be specifically mentioned here. First, the evolving consumerism in the country due to rising disposal incomes of the middle class population is propelling the economy to grow robustly in spite of
Fig.1 GDP GROWTH RATES (%)
5.66.4
4.8
6.56.1
4.4
5.8
3.8
8.5
7.58.1
0
1
2
3
4
5
6
7
8
9
1981-1991
1992-1997
1997-98
1998-99
1999-00
2000-01
2001-02
2002-03
2003-04
2004-05
2005-06
GDP grow th (%)

3
external
uncertainties/ shocks, e.g. rising oil prices. Secondly, the country has been able to improve its saving and investment ratios in previous years, and these have now gone up to nearly 30 per cent of GDP and are showing upward direction. Both, the emerging consumerism and the continuation of the present boom in investment field could help to sustain 8-9 percent growth in the near to medium term, which would eventually result in even better business opportunities in future. 2. Survey on Reforms towards IP-based Economic Development
2. 1 Brief History of Intellectual Property Laws and Policies in India The Patents Act, 1970 is a landmark in the industrial development of India.
The basic philosophy of the Act is that patents are granted to encourage inventions and to secure that these inventions are worked on a commercial scale without undue delay; and patents are granted not merely to enable patentee to enjoy a monopoly for the importation of the patented article into the country. The said philosophy is being implemented through compulsory licensing, registration of only process patents for food, medicine or drug, pesticides and substances produced by chemical processes which, apart from chemical substances normally understood, also include items such as alloys, optical glass, semi-conductors, inter metallic compounds etc. It may, however, be noted that products vital for country’s economy such as agriculture & horticulture products, atomic energy 8 inventions and all living things are not patentable. Thus, the Patents Act 1970 was expected to provide a reasonable balance between adequate and effective protection of patents on the one hand and the technology development, public interest and specific needs of the country on the other hand. India amended its Patents Act again in 2002 to meet with the second set of obligations (Term of Patent etc.), which had to be effected from 1-1-2000. This amendment, which provides for 20 years term for the patent, Reversal of burden of proof etc. came into force on 20th May, 2003. The Third Amendment of the Patents Act 1970, by way of the Patents (Amendment) Ordinance 2004 came into force on 1st January, 2005 incorporating the provisions for granting product patent in all fields of Technology including chemicals, food, drugs & agrochemicals and this Ordinance is replaced by the Patents (Amendment) Act 2005 which is in force now having effect from 1-1-2005 . 2. 2 Identification of Reforms towards IP-based Economic Development
2.2.1 Patent Regime before TRIPS
The positive effect of patents was not observed on research and economic
4
development activities. Though the companies like Ciba-Geigy (Novartis), Hoechst (Avenis) and Boots has set up facilities in India the Indian Private sector did not pursue new drug R & D. The major research on drug development was started by Central Drug Research Institute; a public sector organizations by developing moderate infrastructure. • Supposed to provide incentives to Indian companies to undertake new drug R&D
Result in a shrinkage of market opportunities of the Indian companies because they will no longer be able to reverse engineer and produce the new drugs invented abroad and protected by patents
2.2.2 Patent Regime after TRIPS :
Abolition of Product Patent Protection in 1972 operated as a pull mechanism and provided the Indian companies the space of operations and the opportunity to develop and innovate.. Indian private sector has started investing in R & D for new drugs.
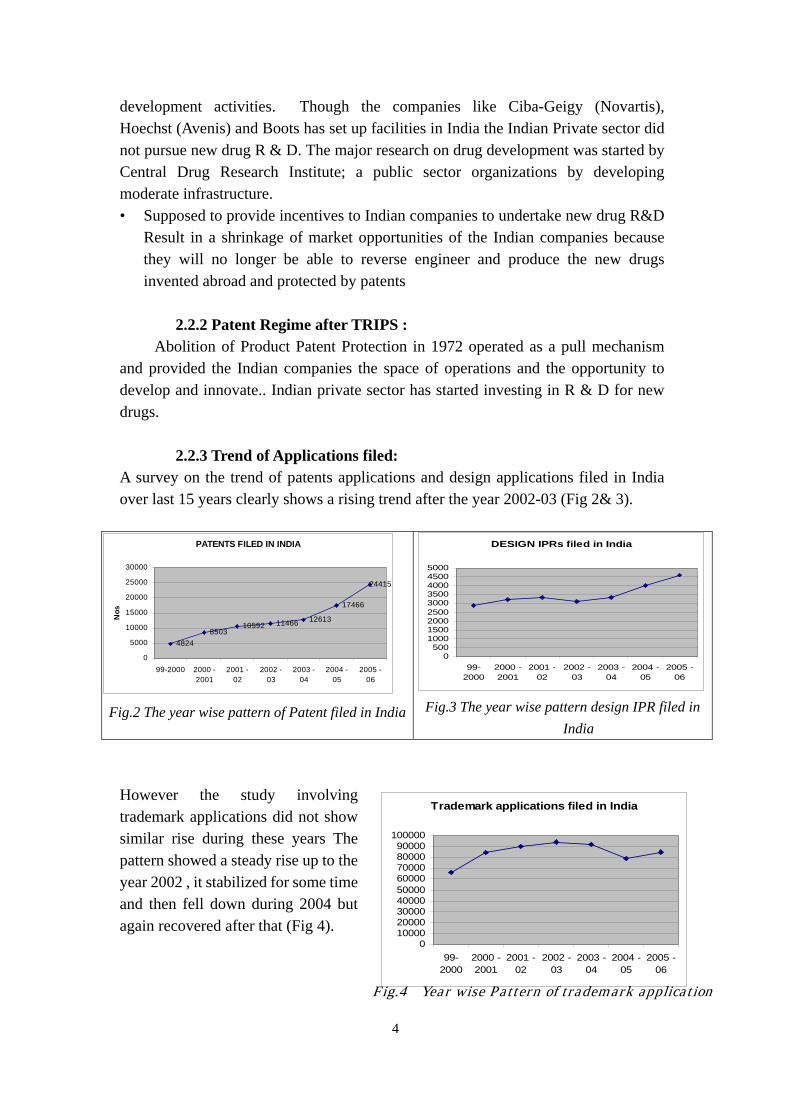
2.2.3 Trend of Applications filed: A survey on the trend of patents applications and design applications filed in India over last 15 years clearly shows a rising trend after the year 2002-03 (Fig 2& 3).
Fig.2 The year wise pattern of Patent filed in India
Fig.3 The year wise pattern design IPR filed in
India However the study involving trademark applications did not show similar rise during these years The pattern showed a steady rise up to the year 2002 , it stabilized for some time and then fell down during 2004 but again recovered after that (Fig 4).
Fig.4 Year wise Pattern of trademark application
PATENTS FILED IN INDIA
48248503
10592 11466 12613
17466
24415
0
5000
10000
15000
20000
25000
30000
99-2000 2000 -2001
2001 -02
2002 -03
2003 -04
2004 -05
2005 -06
Nos
DESIGN IPRs filed in India
0500
100015002000250030003500400045005000
99-2000
2000 -2001
2001 -02
2002 -03
2003 -04
2004 -05
2005 -06
Trademark applications filed in India
0100002000030000400005000060000700008000090000
100000
99-2000
2000 -2001
2001 -02
2002 -03
2003 -04
2004 -05
2005 -06

5
3. Case Studies on Companies utilizing the IP System to develop Business or Increase Economic Activity
3. 1 Comparison of Company’s Data among majour Industry Fields In order to analyze the effect of Intellectual Property system on economic
development, three industrial sectors i.e Pharmaceutical, Biotechnology and IT Sector were studied in the present report.
3.1.1 PHARMACEUTICAL SECTOR:
The Indian Pharmaceutical Industry today is in the front rank of India’s science-based industries with wide ranging capabilities in the complex field of drug manufacture and technology. A highly organized sector, the Indian Pharma Industry is estimated to be worth $ 4.5 billion, growing at about 8 to 9 percent annually.
3.1.1.1 RANBAXY:
Headquartered in India, is an integrated, research based, international pharmaceutical company, producing a wide range of quality, affordable generic medicines, trusted by healthcare professionals and patients across geographies. It is ranked amongst the top ten generic companies worldwide.
KEY INDICATORS: Founded in 1961 in Gurgaon. Total sales : $ 1.03 billion (2004), $ 1.2
billion (2005). Exports account for 58 percent of sales.
Largest markets include: U.S., Brazil, Russia, China.
28% of sales are in the U.S. market. Sales generic drugs in over 100 foreign
countries, manufacturing operations in 7 countries, and offices in 44.
R&D budget: $75 million (2004). Employment: 1,700
. 3.1.1.2 DR. REDDY’S LABORATORIES:
Dr. Reddy’s is India’s third largest integrated company offering a range of generic and branded drugs and active pharmaceutical ingredients. Most of Dr. Reddy’s sales are of branded drugs reversed engineered versions of drugs patented in the West. In 2005, branded drugs accounted for 41 percent of total revenues and APIs accounted for 34 percent.
KEY INDICATORS: • India’s 3rd largest drug producer. • Revenues: $502 million (July 2006). • 66% of revenues earned in foreign
markets. • 41% of earning derived from
formulations. • Investing 6.5% of sales in R&D. • Employees: 7,525.

6
3.1.2 BIOTECHNOLOGY SECTOR India being on the ‘threshold of biotech revolution’ has 280 biotech and 180 bio
suppliers contributing to the total biotech market worth US $100 billion. The country has a global market worth $91 billion and there is scope for cheap R&D through bio-partnering and co-developing technologies mainly with Chinese and American companies. Already the world pharma companies are seeking India to set their research and development centers here. Moreover, to facilitate foreign investment, capital and government policies are being revised.
3.1.2.1 BIOCON: Biocon is India's leading biotechnology enterprise. Over the past 28 years, it has evolved from an enzyme manufacturing company to a fully integrated biopharmaceutical enterprise, focused on healthcare. It applies its proprietary fermentation technologies to develop innovative and effective biomolecules in diabetology, oncology, cardiology and other therapeutic segments. The success of Biocon, has been because of its ability to develop innovative technologies and products and to rapidly leverage them to adjacent domains. This unique "integrated innovation" approach has yielded a host of patented products and technologies that have enabled multi-level relationships with our global clientele.
KEY INDICATORS • Income from research
services increased by 52% to Rs. 1,006 million in 2005-2006 from Rs. 662 million in 2004-2005
• Total Income increased by 9% to Rs. 7,932 million
• R&D spend increased 76% to Rs. 764 million
• Dividend recommended at 50% (Rs. 2.5 per share)
• Operating Margins sustained at a healthy 30% at Rs. 2,340 million
3.1.3 INFORMATION TECHNOLOGY SECTOR: The computer software and services industry of India has been recognized
globally in view of its substantial size in global market and the wide spectrum of technologies responded by it. Industry as well as the Government is making all efforts to retain this situation of leadership and operate in a manner conducive to respect the Intellectual Property Rights of others and make effort to create one's own Intellectual Properties. With US$50 billion export target by year 2008 and currently reaching size of US$ 16.7 billion production in year 2004-05.
India is a hub of patent filing ideas for the IT based U.S. companies. Indian units of Cisco Systems, Intel, IBM, Texas Instruments, GE have filed 1,000 patent applications with the US Patent Office and Texas Instruments has 225 US patents

7
awarded to its Indian operation. Opportunities for the Indian IT industry in the coming days are going to emerge primarily from the fields of embedded systems, chip design and incorporating software in non-Computing devices.
3.1.3.1 WIPRO Wipro is fourth largest company in the world in terms of market capitalization in IT services and has its presence in 35 countries along with 10 near shore development centers. The list of industries that Wipro has are as follows: Automotive, Avionics, Computer Peripherals, Computing Platform, Consumer Electronics, Distribution & Logistics, Energy & Utilities, Finance, Government, Health Science, High Technology, Insurance, Manufacturing, Media & Entertainment, Mobile Devices, Retail, Semiconductors, Software Products, Storage Technologies, Telecom and Travel & Transport. Wipro is the largest third party global R&D services provider and has over two decades of experience in software products engineering. It has partnership with a leading, US based semiconductor manufacturer for automotive System-on-Chips (SOC). In semiconductor segment, it provides services in SOC, ASIC, Board, FPGA, Embedded OS / RTOS Development and Porting, Dignostics and Firmware, and System Software for SOC.
KEY INDICATORS • Founded in 1945 • Headquarter:
Bangalore • Serviceline:
VLSI:ASIC & SoC designs, complete system designs, DSPs, multimedia codecs, product strategy & lifestyle management, product support, firmware development, application software development.
• 2005 revenue: $ 2.4 million
• 2005 net profit: $ 456 million
3. 2 Results of Analysis
3.2.1 Summary of Industrial data Company No. of Patents
filed during 1995-2005
Employee R & D Budget (US $ in
millions)
Total Global Sale
(US $ in
millions)
Revenue (US $ in millions)
Dr. Reddy’s
Laboratories
205 7525 50.40 534.5 24300
Ranbaxy Laboratories 259 1700 75 1,176 4500
BIOCON 800 3000 81.25 13.8 2100
WIPRO 13 (2007)
20000 -- 1700 1,353

8
3.2.2 R&D Expenditures in Major Sectors Indian Industry
Sectors
1999 2000 2001 2002 2003 2004
Chemicals: 184.4 187.6 222.4 278.8 306.1 447.9 Machinery 98.5 102.9 108.0 109.8 111.4 153.8
Textiles
7.8 5.8 8.1 7.6 8.0 6.9
3.2.3 Patents filed by Indians and Foreigners:
A comparison of patents filed by Indians and foreigners shows that the share of
Indians in patents have increased over the years surpassing the foreigners in the year 2004-2005 (Fig 5)
Fig.5 Patents granted to Indians and others (Sourse DST) 3.2.4. Ratio of R&D to Sales of Major Sectors of Indian Industry:
Sectors Dec-95 Dec-98 Dec-99 Dec-00 Dec-01 Dec-02 Dec-03 Dec-04
Chemicals 0.2 0.3 0.3 0.2 0.2 0.3 0.3 0.4
Drugs & 1.4 1.3 1.5 1.6 2.1 2.7 2.9 4.1
Pharmaceuticals
Food & beverages 0.1 0.1 0.1 0.1 0.1 0.1 0.1 0.1
Machinery 0.6 0.7 0.6 0.6 0.6 0.6 0.7 0.8
Textiles 0.1 0.1 0.1 0.1 0.1 0.1 0.1 0.1
0
1000
2000
3000
4000
5000
6000
7000
2000-01 2001-02 2002-03 2003-04 2004-05
IndiansOthersTotal

9
4. Analysis of reforms that exerted influence on economic development underpinned by the IP system using economic models
4.1 Impact of IP Creation: The patent production function or the knowledge function, relates the number of
patent applications filed by a firm in a given year to the investment in R&D (Fig. 4) as well as gross domestic product GDP and other firm characteristics. However, in a developing country like India, firms do not have a long history of R&D or patenting. The technological spillovers are included in the data as a determinant of patenting is that Indian R&D is mainly adaptive rather than innovative. Past innovations induce shifts in technological opportunities because new discoveries can lead to an exploration of new research areas and increase technological opportunity. Since the benefits of R&D are not entirely appropriable, R&D spillovers occur when the fruits of a firm’s research activity benefit other firms in the industry. The number of patents applications would increase with the ability of firms to assimilate R&D spillovers.
Fig.4. Relationship between Patents filed and R & D expenditure The number of patents obtained and applied is positively related to gross domestic product. Higher the GDP results in higher number of patents obtained and applied. The results also show that there is a positive relationship between the patents and R& D expenditure and I P index. The R& D expenditure will lead to the marginal increase in the patents obtained and Applied.. The results may improve after the introduction new patent policy 2005 and can be improved by studying the longer time period.

10
Table 4.1: Impact on IP Creation - Results
Specification Model
Dependent Variable : Patents Obtained / Applied
R & D Coefficient : 1.55 t-value : 11.88**
GDP Coefficient : 5.87 t-value : 4.97**
IP Index Coefficient : 8.82 t-value : -2.69*
Intercept Coefficient : -26.97 t-value : -2.53
Coefficient of Determination 0.78
* and ** indicates significance at 1% and 5% level.
4.2 Impact on Business Activities: Since the liberalization process began in 1991, India's real GDP has grown at an
average annual rate of approximately 6% and it is expected to rise to over 9% in fiscal year 2006/07 onwards. Growth has been led by services and manufacturing, the two largest sectors, with agriculture growing much more slowly. In the longer term, the Indian Government is aiming for growth of between 8% and 10% per annum. For any country total factor productivity (TFP) reflects the efficiency with which factors of production are used, and is thus a key determinant of an economy's performance, especially its international competitiveness. TFP should be distinguished from labour productivity (that is, the amount of output per employee), which is reflected in wage rates and thus living standards. Among the main sources of improvement in labour productivity are growth in investment, which increases the amount of capital that employees have to work with, and growth in TFP. In the absence of accompanying improvement in TFP, however, higher labour productivity can only be achieved at the expense of lower capital productivity. One of the most important sources of TFP growth in the long run is technological progress. Analysis of data shows that average annual output growth in India increased from 4.5% during the period preceding the reforms of 1991 to 6.5% during 1993-06. Of this 2 percentage point increase, 1.2 points were attributable to improved TFP, which more than doubled from an average annual of 1.1% during 1978-93 to 2.3% during the period 1993-06. The rest of the rise was largely due to increased investment. Improved TFP contributed to roughly half of the increase in labour productivity, which almost doubled between the two periods; the rest of the increase was due mainly to higher investment. Improved TFP was also largely responsible for the substantial increase in the rate of growth of capital productivity. Growth in both output and TFP has been much faster in the services sector than in industry. By contrast, growth in output and TFP in agriculture has slowed. It follows that the shifting of resources, especially

11
labour, from agriculture, where two thirds of the labour force is currently employed, to the more productive services and industry sectors would contribute to faster overall growth in output and TFP in the economy as a whole. Table: 4.2. GDP Variables 2000/01 2001/02 2002/03 2003/04 2004/05 2005/06
National accounts Real GDP (at 1999/00 factor
cost) 4.4 5.8 3.8 8.5 7.5 9.0
Real GDP at factor cost (Rs billion, 1999/00 prices)
18,647.7 19,729.1 20,477.3 22,225.9 23,896.6 26,045.3
Real GDP at market prices (Rs billion, 1999/00 prices)
20,308.7 21,366.3 22,162.6 24,022.5 26,022.3 28,424.8
Current GDP at factor cost (Rs billion)
19,254.2 21,001.9 22,653.0 25,494.2 28,559.3 32,509.3
Table 4.3. Total factor productivity in India, 1978-2006 (Annual %change)
Overall Agriculture Industry Services
1978-93
1993-06
1978-93
1993-06
1978-93
1993-06
1978-93
1993-06
Output 4.5 6.5 2.7 2.2 5.4 6.7 5.9 9.1
Employment 2.1 1.9 1.4 0.7 3.3 3.6 3.8 3.7
Capital 1.0 1.8 0.2 0.7 1.4 1.7 0.3 1.1
Land -0.1 0.0 -0.1 -0.1 n.a. n.a. n.a. n.a.
Education 0.3 0.4 0.2 0.3 0.4 0.3 0.4 0.4
TFP 1.1 2.3 1.0 0.5 0.3 1.1 1.4 3.9
Labour productivity
2.4 4.6 1.3 1.5 2.1 3.1 2.1 5.4
Capital productivity
1.8 2.4 1.7 0.5 1.4 2.2 3.5 5.5
To study the impact on business activities we have used in the model the growth rate of value added on the rates of growth of labour force employment, fixed assets as capital and IP Index and results are in below. Given that the underlying specification is in fact an accounting identity, nothing should be read into the goodness of fit of the regression. The results show that there is a significant positive relationship between the capital K and gross domestic product GDP. The similar kind of relation exists

12
between labour force employed and GDP. There is an insignificant relationship between IP index and GDP. Table 4.4 Impact on Business Activities: Results Specification Model Dependent Variable : Domestic
Production represented by GDP
Capital Coefficient : 0.288 t-value : 11.88**
labour Coefficient : 0.367 t-value : 15.91**
IP Index Coefficient : 1.003 t-value : 103.99
Intercept Coefficient : -0.001 t-value : 0.46
Coefficient of Determination 0.95 * and ** indicates significance at 1% and 5% level.
4.3 Impact on FDI: For a developing economy like India, foreign direct investment (FDI) implies
access to not only capital, but also advanced technology and know-how, managerial expertise, global marketing networks and best-practice systems of corporate governance. FDI inflows are non-debt creating and more ‘stable’ than portfolio flows that are guided by short-term risk-return payoffs and are prone to quick reversals in the event of adverse expectations. Research on FDI in India has mostly focused on the impact of FDI upon macroeconomic fundamentals. The limited literature on host-country determinants of FDI inflows into India points to such FDI being essentially domestic market-oriented (Banga 2003a, Guha and Ray, 2004). India also appears to enjoy the advantage of low wage costs (Guha and Ray, 2004). However, there is hardly any empirical analysis of whether some of India’s much talked about economic strengths – developed innovative capacity, phenomenal growth in information technology, intellectual property creation, possession of skilled labour and high yields from a vibrant capital market – have influenced inward FDI or not.
FDI inflows into India have improved noticeably since 2001-02 (Table ). One of the reasons behind the improvement is the broadening of the definition of FDI from 2000-01. Prior to 2000-01, data on FDI into India used to reflect only equity flows through the automatic approval route, various schemes earmarked for expatriate Indians, the government route and acquisition of shares by non-residents in Indian companies under the Foreign Exchange Management Act of 1999. Since 2000-01, equity capital of unincorporated bodies is also included as part of overall equity flows.

13
Furthermore, reinvested earnings and other capital are also considered as part of FDI (RBI, 2007). Thus, the underreporting in FDI statistics has now been taken care of and the data reporting is in line with international norms. However, such changes in data reporting also imply that aggregate data on FDI inflows from 2000-01 onward is strictly not comparable with the previous years (RBI, 2007). Table: 4.5 Foreign Direct Investments in India
Year Foreign Direct Investment Equity Reinvested
EarningsOther Capital Total
1991-92 129 129 1992-93 315 315 1993-94 586 586 1994-95 1314 1314 1995-96 2144 2144 1996-97 2821 2821 1997-98 3557 3557 1998-99 2462 2462
1999-2000 2155 2155 2000-01 2400 1350 279 4029 2001-02 4095 1645 390 6130 2002-03 2764 1833 438 5035 2003-04 2229 1460 633 4322 2004-05 3778 1904 369 6051 2005-06 5820 1676 226 7722 2006-07 9513 944 135 10592
Source: Reserve Bank of India Hand book of Statistics and Bulletin (March 2007) India has emerged as one of the leading FDI destinations in Asia in recent years. This is evident from the increase in FDI inflows since 2004-05, and particularly in 2006-07 when total FDI inflows into India crossed the US$10 billion mark for the first time. Analysis of industry-wise distribution of FDI inflows in India is presented in the Table 4.5 shows that more than half of incoming FDI has moved into software and electronics equipment, services, automobiles, telecommunication and transportation. Indeed, concentration of FDI in electronics, computer software, financial and non-financial services, telecommunication, and automobiles, underlines a distinct tendency on part of FDI to move into more technology and skill-intensive activities. There is also perhaps a tendency on the part of such flows to move more into services rather than manufacturing and automobiles appears to be the most preferred industry, followed by chemicals, food processing and drugs & pharmaceuticals. Data on FDI

14
inflows into India for the period 1991-92 to 2005-06 has been taken from the estimates prepared by the Reserve Bank of India (RBI). We use lagged growth rate in GDP at current market prices (GDP) for capturing domestic market size on the basis of national income estimates prepared by the Central Statistical Organization (CSO). The census data of population and IP index for India used and the variables are called POP and IP respectively. Table 4.6 Share in total foreign direct Investment
Sectors Share in total Foreign direct Investment (Percentage)
Electrical equipment including computer software and electronics
17.03
Services 16.96 Telecommunication 9.32 Transportation 8.44 Fuels (power and refinery) 6.67 Chemicals other than fertilizers 5.21 Drugs and Pharmaceuticals 2.83 Food Processing 2.77 Cement 2.35 Metallurgical Industries 1.97 Consultancy services 1.46 Textiles 1.25 Miscellaneous mechanical & engineering 1.22 Hotel & Tourism 1.20 Trading 1.05
Source: India FDI fact sheet ; http://dipp.nic.in/fdi_statistics/india_fdi_index.htm Table: 4.7. Impact on FDI Inflows - Results
Specification Model Dependent Variable : FDI GDP Coefficient : -601.23
t-value : -1.17** IP Index Coefficient : -49.08
t-value : -0.48 Population Coefficient : 7577.89
t-value : 4.12** Intercept Coefficient : -1122.09
t-value : -0.97 Coefficient of Determination 0.79
* and ** indicates significance at 1% and 5% level.
15
Some earlier research studies (Guha and Ray, 2002; Banga, 2003) have
indicated that FDI in India is more of the market-seeking variety, rather than the resource-seeking, export-oriented kind. The coefficients of GDP and IP index are found to be positively significant and insignificant respectively. This indicates that while the size of the domestic market positively influences FDI inflows into India. It is also observed that exports do not. IP index is found to be statistically insignificant in explaining FDI inflows into India. We find the coefficient of Population to be positive and statistically significant. The result indicates that FDI inflows into India are encouraged by human resources. Indeed, the sectoral pattern of FDI inflows into India (Table 4) appears to be consistent with these findings. The main sectors drawing FDI in India like software, electronics, telecommunications, automobiles, pharmaceuticals are not only technology and skill intensive, but are also segments that have witnessed efficient and widespread application of communication facilities. The latest data on FDI flows also indicates that India is on the threshold of breaking into the big league of FDI countries in Asia. R&D-driven innovation capacities which may lead to more intellectual property creation along with the prowess registered in using information technology based techniques in business operations, can signal a significant change in the nature of FDI inflows into India, from the market-seeking kind to the export-oriented variety. The surge in FDI inflows in the last couple of years might be indicative of this virtuous shift so it shows that India’s attractiveness as a FDI destination is reinforced by the quality of its human resources that is capable of handling complex, technology-intensive processes efficiently.

16
5. Discussion and Proposal
The results of the econometric exercise indicate that research capital and foreign
technological spillovers are important determinants of patenting activity. The study finds that a stricter patent regime does indeed stimulate patenting activity in research-intensive industries in a developing country like India. The harmonization of patent laws worldwide has opened a window of opportunity for Indian manufacturers adept at producing cheaper versions by doing “reverse engineering” for off-patent drugs. This result has significant policy implications for other developing countries that are at a stage of technological development comparable to India. For developing country like India the contribution of technological spillovers in filing patents underlines the importance of licensing policies conducive to transfer technology from developed to developing countries. The country’s all the sectors are in a state of transition and the effect of stronger patents on patenting activity for product patents still remains to be seen even after the product patents are enforced in 2005. The examination of India’s emergence as a key destination of FDI among developing nations and Intellectual Property index reveals that there is no significant relation between them. But the latest data on FDI flows indicates that the recipe for technology intensive export oriented FDI appears to be quality of its human resources that is capable of handling complex, technology intensive processes efficiently. Under the emerging era internal networking and coordination amongst different constituents of the innovation chain comprising academia, industry, public funded labs such as CSIR, ICMR, CDRI etc., has become imperative to substantially improve the efficacy of the system relating to the new innovations and its introduction in the market place. Protection of Intellectual Properties is a very critical element in the offshore business models which are operating at present in India. There have been many cases where organizations have lost their position in the market due to the loss of intellectual property. Understanding the country’s IP Rights and following the best practices can drastically reduce the risk of losing the organization’s intellectual property.
5.1 Patterns and Trends in Global Innovative Activity Many Indian companies have placed importance on the protection of IPRs and
taken initiatives to increase awareness and protection within the companies and promote IP as a policy. It is widely believed, that stronger IPRs in India will greatly benefit software companies across sectors, and will encourage greater product development in India. At present the Indian software industry employs over 500,000 software engineers, and software services in India have gained a worldwide reputation. Strong levels of protection for intellectual properties have encouraged foreign investment in India, with many companies choosing to either set up their own facilities in India or to outsource a large part of their business to India. The

17
global technology generation or innovative activity is highly concentrated in a handful of technologically advanced developed countries with just top ten countries accounting for as much as 84 per cent of global R&D activity, 94 per cent of US, and 91 per cent of global cross-border technological payments. Prominent among the emerging countries that are beginning to obtain US patents in increasing numbers are Taiwan and South Korea. Therefore these countries together with Japan make important cases for analyzing the role played by IPRs in their technology development.
5.2 IPR Regime and Economic Development: The Evidence IPR regime is likely to affect growth indirectly by encouraging the innovative
activity that in turn is the source of total factor productivity improvements. The IPR regime could also affect the inflows of FDI, technology transfers and trade that might impinge on growth. The relationship between IPR and development could be subject to the causality problem as developed countries are likely to have stronger IPRs regime than the poorer ones. Studies have found the relationship between IPR protection and level of development to be non-linear suggesting that patent protection tends to decline in strength as economies move beyond the poorest stage into a middle-income stage in which they have greater abilities to imitate new technologies. Quantitative studies have also shown that universally imposed minimum standards for patent protection are not likely to contribute to increased growth in countries below a certain threshold in terms of level of development.
5.3 IPRs as Determinants of Innovative Activity The existing empirical literature suggests that the effectiveness of patent protection varies from industry to industry and inventive activity is sensitive to protection only in a few industries such as chemical and pharmaceutical industries. A study of the impact of strengthening of pharmaceutical patent protection in Italy since 1978 showed little or no impact on R&D expenditures or on new inventions. Furthermore, R&D activity is found to be significantly determined by absorption of spillovers of others’ R&D activity particularly in the case of chemicals and electrical and electronics. The importance of foreign R&D spillovers as a determinant of R&D activity could be even more critical in developing countries where much of the R&D activity is of an adaptive nature. A number of studies have empirically demonstrated the ability of rather weaker IPRs in stimulating domestic innovative activity in developing countries. Therefore, the evidence on the role of IPRs as a determinant of innovative activity is quite weak. In fact stronger IPRs may actually affect the innovative activity adversely by chocking the absorption of knowledge spillovers that are important determinants of innovative activity.

18
References: 1. Annual Report of the Deptt. of Information Technology (DIT), Ministry of
Communications and IT (MoC & IT, Government of India 2004-05 (www.mit.gov.in) and IPR Manuals published by its IPR Division on (i) Copyrights, (ii) Patents, (iii) Designs and (iv) Report on Trademark andDomain Names.
2. Strategic Review 2004 and 2005, the IT Industry in India National Association of Software and Services Companies (NASSCOM), New Delhi, India (www.nasscom.org)
3. Interim Economic Report On India Situation In November 2006 - Embassy Of Switzerland Ref. No. 512.0-Dej-Nmo New Delhi, November 9, 2006
4. Banga, R. (2003b), “Impact of Government Policies and Investment Agreements on FDI Inflows,” Indian Council for Research on International Economic Relations (ICRIER), Working Paper (116), November.
5. Chakraborti, A. (2001), “The Determinants of Foreign Direct Investment: Sensitivity Analyses of Cross-Country Regressions,” Kyklos, 54 (1), pp. 89-113
6. Guha, A., and Ray, A.S. (2002), “Multinational versus Expatriate FDI: A Comparative Analysis of the Chinese and Indian Experience,” In T.N. Srinivasan, (ed.) Trade, Finance and Investment in South Asia, New Delhi, Social Science Press.
7. Guha, A., and Ray, A.S. (2004), “India and Asia in the World Economy: The Role of Human Capital and Technology,,International Studies, 41(3).
8. RBI (2007), Monthly Bulletin, March 12, Mumbai. 9. Lucas, R.E.B. (1993), “On the Determinants of Direct Foreign Investment:
Evidence from East and Southeast Asia,” World Development, 21 (3), pp.391-406.
10. Palit, A. (2006), ‘Role of Technological Capabilities in Enhancing FDI Flows in Developing Asia-Pacific Economies,’ UN-ESCAP, ARTNeT Policy Brief, 9, November; Bangkok.
11. UNCTAD (2005), World Investment Report, Statistical Annex, New York and Geneva.