impact of tariff reduction on exports: a … · quantitative assessment of indian exports to ......
TRANSCRIPT
WORKING PAPER NO. 120
IMPACT OF TARIFF REDUCTION ON EXPORTS: A QUANTITATIVE ASSESSMENT OF INDIAN EXPORTS TO THE US
ARADHNA AGGARWAL
January 2004
INDIAN COUNCIL FOR RESEARCH ON INTERNATIONAL ECONOMIC RELATIONS
Core-6A, 4th Floor, India Habitat Centre, Lodi Road, New Delhi-110 003

Contents
Foreword............................................................................................................................... i
I Introduction..............................................................................................................1
II Tariff structure of the US : An overview ...............................................................4
III India’s trade with the US.........................................................................................5 III.1 Growth ......................................................................................................................5 III.2 Sectoral composition ................................................................................................6
IV Theoretical framework ............................................................................................9 IV.1 Tariff reduction and export prices ..........................................................................10 IV.2 Sensitivity of trade patterns to changes in tariff rates.............................................11 IV.3 The Model...............................................................................................................13 IV.4 Data, Variables and Methodology ..........................................................................15
V Market Access Estimates.......................................................................................17 V.1 Sectorial Impact of Tariff Reduction......................................................................17 V.2 Disaggregation of Market and substitution effect : ................................................33
VI Conclusion...............................................................................................................36
References ...........................................................................................................................38
i
Foreword
This paper quantitatively assesses likely changes in market access opportunities for Indian exports owing to tariff reductions by the USA. The study identifies particular products for India at the ISIC 4-digit level of disaggregation, which could be considered tariff sensitive. Regression analysis of the relationship between MFN tariff rates and India’s exports to the US was used to assess in quantitative terms the likely impact of tariff reduction that may be agreed in the Doha Round. This analysis suggests that tariff cuts are not expected to benefit India’s exports to the US in a major way. With the full implementation of the Chairman’s formula for tariff cuts, increase in India’s exports to the US would amount to 1.2% or 0.6% depending on the value of the B coefficient in the Chairman’s formula. These findings are in all likelihood substantially due to the tariff diversion effect of NAFTA preferences in favour of suppliers in Mexico, which is a competing country in many traditional items. It is expected that reduction of MFN tariff would alleviate the trade diversion effect of the NAFTA.
The study has also attempted to decompose changes in India’s total exports due to
tariff reductions in the US into the competitive and market effects. The analysis suggests that the increase in India’s exports would be mainly due to the competitive effect. This leads the author to conclude that it is crucial for India to improve its competitiveness vis-a-vis its competitors in different markets.
This study by Aradhna Aggarwal, was part of the research project on ‘ Impact on
Indian industry and restructuring required to adjust to tariff proposals being considered by the Negotiating Group on Market Access (NGMA) at the WTO’. The study project was funded by the Department of Industrial Policy and Promotion, Ministry of Commerce and Industry, Government of India. It is hoped that the output of this study will provide better understanding of the strategic issues that will help the country to formulate its position on future tariff negotiations.
Arvind Virmani Director & Chief Executive
ICRIER January 2004
1
Impact of Tariff Reduction on Exports: A Quantitative Assessment of Indian Exports to the US *
I Introduction
Tariff reduction in industry was one of the most important outcomes of the
Uruguay round of multilateral trade negotiations. Although successive Rounds of
multilateral negotiations had succeeded in significantly reducing tariffs on non agricultural
products, the Uruguay Round alone achieved an overall reduction of 40% in average trade
weighted tariffs for developed economies and 30% for economies in transition. Therefore,
tariff rates agreed upon and implemented as a result of this round are significantly lower
relative to tariff rates prevailing in the previous GATT Rounds. Despite the success of the
Uruguay Round, substantial tariff barriers remain. While tariff rates have been
significantly reduced in average terms, tariff reductions do not spread out evenly across
both economies and sectors. High tariffs are commonly found in certain sectors and remain
a barrier to free trade. Besides, there are ‘tariff peaks’ which are relatively high tariffs
amidst generally low tariff levels. A 50 percent import tariff on cotton fabric while the
average tariff on textiles is 5 percent would be an example of a tariff peak. Finally, there is
an issue of tariff escalation in which higher duties are applied on semi-processed products
than on raw materials and higher still on finished products. No import tariff on raw cacao
beans, a 20 percent tariff on roasted ones, and a 60 percent tariff on chocolate bars would
be an instance of tariff escalation. Tariff escalation protects domestic processing industries
but discourages the development of processing activity in the countries where raw
materials originate.
With a view to addressing these asymmetries, the Fourth Ministerial Conference of
the WTO held at Doha has mandated negotiations that are aimed at high tariffs, tariff peaks
and tariff escalations as well as non tariff barriers. Paragraph 16 of the Doha Development
Agenda (“DDA”) sets out four general objectives for negotiations on market access for non-
agricultural products:
* I would like to thank Professors Arvind Virmani and B. N. Goldar for useful suggestions and comments.
My thanks are due to Bandita Pal for her valuable research assistance.

2
• to reduce or as appropriate eliminate tariffs (including the reduction or elimination
of tariff peaks, high tariffs, and tariff escalation) on a comprehensive group of
products (without a priori exclusions) and, in particular, on products of export
interest to developing countries;
• to reduce or as appropriate eliminate non-tariff barriers;
• to take fully into account the special needs and interests of developing and least
developed countries;
• to include in the modalities to be agreed appropriate studies and capacity-building
measures to assist least-developed countries to participate effectively in the
negotiations.
Although in many countries there is concern about loss of government revenue, the
potential weakening of their competitiveness, flooding of their markets by goods from
developed countries, it is generally believed that these negotiations would secure further
trade liberalisation and offer improved market access for all members, in general and
developing country members in particular. Developing countries face disproportionately
high trade barriers in manufactures and barriers to their manufactures exports account for
around 70 percent of the total barriers faced by their exports (Hertel and Martin 1999).
Though tariff rates on all industrial products imported by developing countries from all
sources were reduced by 40%, on average from 6.3% to 3.8%, the average reduction on
products imported from developing countries was 37%. This reflects mainly the lower-than
average reductions on the products exported mainly by these countries. These are for
instance, fish and fish products (26%), textiles and clothing (22%), leather, rubber and
footwear (18%) and transport equipment (23%). The inclusion of manufactures trade in the
tariff reduction negotiations therefore is particularly important for developing countries.
Nevertheless, reduction/ elimination of tariffs may not result in unambiguous gains
in market access due to insensitivity of foreign demand and or/ of domestic industry to
tariff changes. Besides, the products on which substantial tariff reduction is achieved may
not be of export interest to the country or they may not be in accordance with its domestic

3
priorities. While negotiating tariff cuts, therefore, the government is faced with certain
strategic issues. These include identifying priority markets for improved access and
domestic industry sensitivities to such opportunities. The study process that examines such
issues will help these countries to formulate their position on future tariff negotiations in a
better manner. Against that background, this study aims at identifying particular products
for India at the ISIC 4-digit level of disaggregation which could be considered tariff
sensitive. Market access opportunities in these products would expand for India after
further tariff reductions by its trading partners. The study quantitatively assesses the
potential increase in India’s exports resulting from the tariff reduction negotiations and
decomposes the total potential changes in exports into the market-induced and
competitiveness-induced effects. The study focuses on Indian exports to the US and
provides quantitative estimates of how Indian exports will change as a result of multilateral
tariff reductions by the US. Our choice of the US was mainly guided by the data
availability constraints. While we had detailed data on the US trade, such information was
not available for the EU countries. However, our choice can be justified by the fact that the
US is a major trade destination for Indian exports. In 1999-2000, it alone accounted for
24.4% of India’s exports (GOI, 2002). During the ten-year period (1990-91 to 2000-2001),
the US share in India’s exports increased from 15.6% to over 20%. It is expected that tariff
reductions by the US would benefit India’s market access as there are prominent tariff
peaks in the United States (above 15 percent) and despite the supposed decline in the
average tariff of imports from all sources, the share of imports for which tariff rates
imposed are above 5 percent is still close to 20 percent for the country.
The scheme of the paper is as follows. The following section provides a brief
overview of the US tariff structure. Section III describes briefly the patterns and growth of
India’s exports to the US. Section IV outlines the theoretical framework adopted in the
study to analyse the impact of GATT tariff negotiations on market access, data and
methodology. Section V discusses the estimates of the model and assesses quantitatively
the extent to which tariff reduction will provide market access in different sectors. It also
decomposes the total market access effect into the competitive and market effects and
analyses their importance. Finally, Section VI concludes the analysis.

4
II Tariff structure of the US : An overview
The WTO organises and reports the tariff data supplied by its member countries on
an annual basis in the Integrated Data Base (IDB). The objective is to disseminate
information on tariff structure of member countries in a comprehensive framework to
facilitate the analytical work that is required to advance the negotiations. The IDB contains
WTO Members' annual notifications of tariff and trade information, linked at the level of
tariff lines. It contains imports by country of origin, in value and quantity, by tariff line,
and MFN current bound duties and current applied duties. Product descriptions at the tariff
line level are also part of the database. We utilised this database to extract information on
the US tariff structure. Data on ad valorem duty and imports by tariff line was available for
7375 bound tariff lines1. Table 1 shows the distribution of these bound rates prevailing in
the US in the year 2001. There are two things worth noting here. First, over one third of
tariff lines are subject to 5% or more tariff in the United States. Second, despite the
supposed decline in the average tariff of imports from all sources, the share of imports for
which tariff rates imposed are above 5 percent is still close to 20 percent. Over 7% of total
US imports are still subject to tariff peaks (15% and above).
Table 1: The US tariff structure : 2001
AV duty # of TLS % of Imports out of Total % of TLs 0 2632 46.77 35.7 1 450 2.36 6.1 2 495 22.10 6.7 3 634 4.81 8.6 4 761 4.67 10.3 5 381 3.55 5.2 6 566 3.50 7.7 7 235 0.90 3.2 8 337 1.87 4.6 9 138 0.74 1.9
10 146 0.82 2.0 11 56 0.37 0.8
1 Unbound tariff lines in the US are subject to less than 5% tariff. Therefore we decided to exclude them
from the analysis.

5
12 81 0.15 1.1 13 52 0.07 0.7 14 55 0.15 0.7 15 137 0.31 1.9
15+ 219 6.82 3.0 7375 100 100
Source WTO- IDB
At the sector level, high tariff rates are prevailing mainly in footwear, textile,
clothing, rubber, travel goods and chemicals. According to one estimate, some 47 percent
of United States imports of leather and rubber footwear; 19 percent of its imports of
chemicals and photographic supplies and 23 percent of its imports of minerals, precious
stones and metals have tariffs of 5- 10 percent in a post-UR period (Alburo, 1999).
III India’s trade with the US
III.1 Growth
Currently, India is one of the top 20 countries exporting to the US . India’s exports
to the US grew rapidly during the 1990s. The average annual growth rate in merchandise
exports to the USA that was around 7% during 1985-90 went up to 16% during the late
1990s. The country registered 21 percent growth in 2001-2002 - highest ever in last one
decade- in merchandise exports to USA. If judged in terms of overall global exports to the
USA whereby out of the top 25 countries, 14 countries registered positive growth rate in
exports to USA, India's performance was encouraging one. India’s merchandise exports
outsmarted the growth in service exports by 1.4%. India ranked 19th in the list of global
merchandise exporters to the US in 2002 consolidating its position from 2001when it
ranked 22nd. Country's merchandise exports to USA at the end of 2002 stood at US$
11.82 billion signifying impressive growth over previous year's US$ 9.74 billion. India’s
share in total USA merchandise imports in 2002 marginally upped to 1.02% from 0.86% in
the previous year.
6
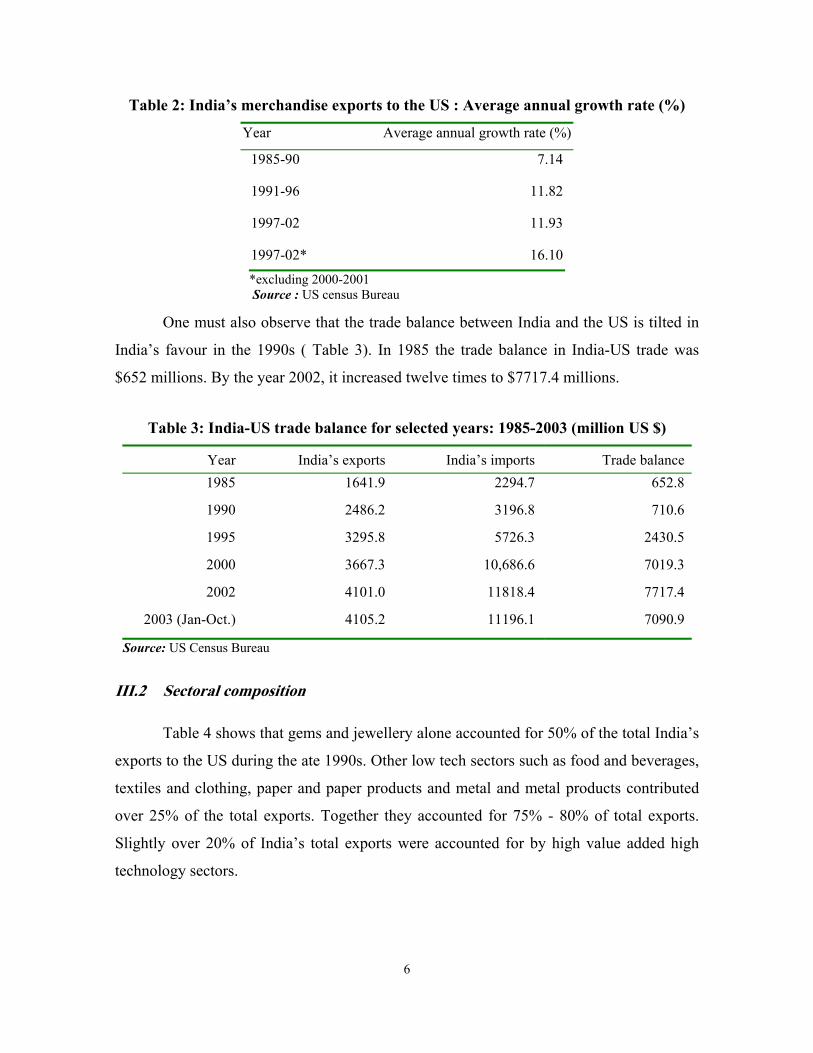
Table 2: India’s merchandise exports to the US : Average annual growth rate (%)
Year Average annual growth rate (%)
1985-90 7.14
1991-96 11.82
1997-02 11.93
1997-02* 16.10
*excluding 2000-2001 Source : US census Bureau
One must also observe that the trade balance between India and the US is tilted in
India’s favour in the 1990s ( Table 3). In 1985 the trade balance in India-US trade was
$652 millions. By the year 2002, it increased twelve times to $7717.4 millions.
Table 3: India-US trade balance for selected years: 1985-2003 (million US $)
Year India’s exports India’s imports Trade balance1985 1641.9 2294.7 652.8
1990 2486.2 3196.8 710.6
1995 3295.8 5726.3 2430.5
2000 3667.3 10,686.6 7019.3
2002 4101.0 11818.4 7717.4
2003 (Jan-Oct.) 4105.2 11196.1 7090.9
Source: US Census Bureau
III.2 Sectoral composition
Table 4 shows that gems and jewellery alone accounted for 50% of the total India’s
exports to the US during the ate 1990s. Other low tech sectors such as food and beverages,
textiles and clothing, paper and paper products and metal and metal products contributed
over 25% of the total exports. Together they accounted for 75% - 80% of total exports.
Slightly over 20% of India’s total exports were accounted for by high value added high
technology sectors.

7
Table 4: Sectoral composition of India’s exports to the US : average for 1997 to 1999
Share in total India's exports (%) Share of India in US imports (%) Food,beverages, Tobacco 4.32 0.63
Textiles and clothing 7.26 3.42
Paper and paper products 4.69 1.24
Leather, fur and leather products 0.15 0.02
Wood and wood products 0.27 0.06
Chemical and chemical products 6.82 0.55
Petroleum and petroleum products 2.54 0.44
Plastic and Rubber products 3.10 0.51
Non metallic products 1.60 0.59
Metal and Metal products 8.74 0.60
Machinery 7.90 0.12
Transport equipments 1.85 0.05
Other manufacturing products 1.00 0.09 Manufacture of jewellery and related articles
49.75 12.51
Source: Trade and Production database, 1989-99
For analysing India’s competitiveness across sectors however, it is important to
examine its share in total US imports. Table 4 provides figures for India’s share in US
imports across broadly classified sectors. One may observe that India has managed to
display an impressive show in only gems and jewellery, textiles and paper and paper
products. These sectors accounted for 12.5%, 3.4% and 1.2% of total US imports
respectively over the period 1997 to 1999. In all other sectors India’s share was much less
than even 1%.
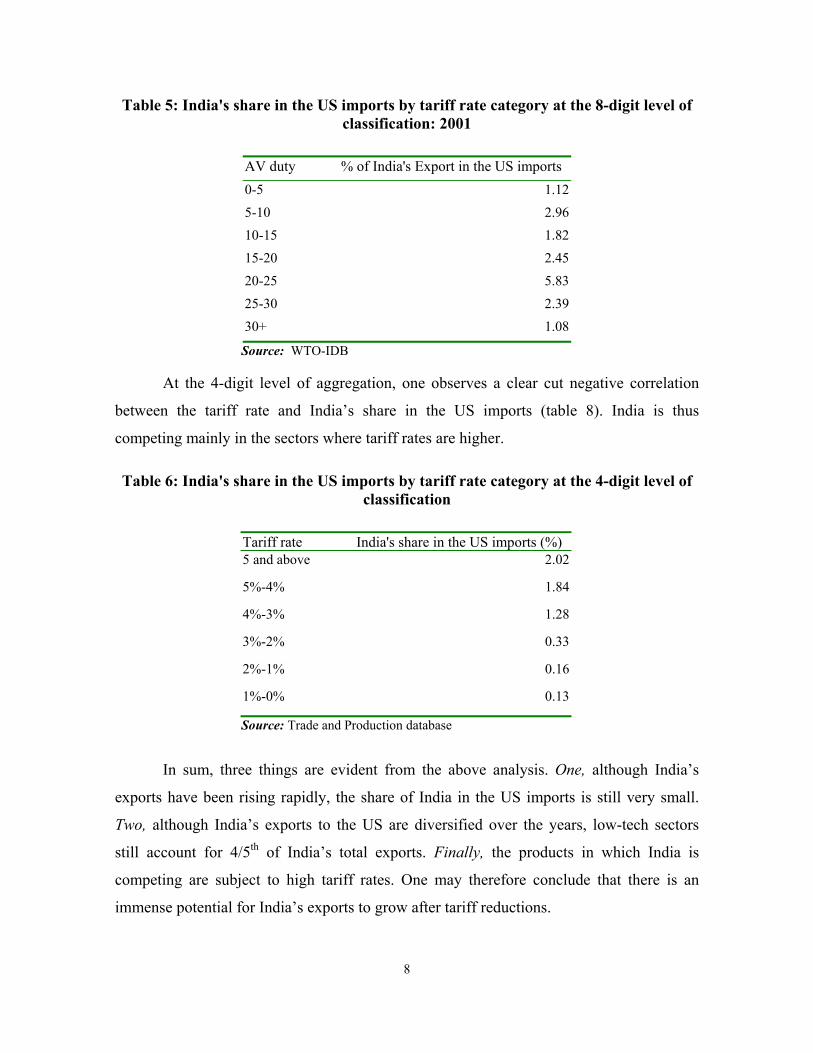
Table 5 presents India’s share in US imports by tariff rate. These figures are based
on the 8-digit level of disaggegation and pertain to the year 2001. It shows that, on
average, India’s share in the items that were subject to 0 to 5% tariff rates was as low as
1.12%. On the other hand, in the items which were subject to 20%-25% tariff rates, India’s
share was 6%. Apparently, India is competing in the items that are subject to high tariff
rates. India’s exports thus face high tariff barriers in the US markets.
8
Table 5: India's share in the US imports by tariff rate category at the 8-digit level of classification: 2001
AV duty % of India's Export in the US imports 0-5 1.125-10 2.9610-15 1.8215-20 2.4520-25 5.8325-30 2.3930+ 1.08
Source: WTO-IDB
At the 4-digit level of aggregation, one observes a clear cut negative correlation
between the tariff rate and India’s share in the US imports (table 8). India is thus
competing mainly in the sectors where tariff rates are higher. Table 6: India's share in the US imports by tariff rate category at the 4-digit level of
classification
Tariff rate India's share in the US imports (%) 5 and above 2.02
5%-4% 1.84
4%-3% 1.28
3%-2% 0.33
2%-1% 0.16
1%-0% 0.13
Source: Trade and Production database
In sum, three things are evident from the above analysis. One, although India’s
exports have been rising rapidly, the share of India in the US imports is still very small.
Two, although India’s exports to the US are diversified over the years, low-tech sectors
still account for 4/5th of India’s total exports. Finally, the products in which India is
competing are subject to high tariff rates. One may therefore conclude that there is an
immense potential for India’s exports to grow after tariff reductions.

9
In what follows, we shall outline the theoretical framework within which the
impact of negotiating tariff cuts in GATT on market access will be analysed.
IV Theoretical framework
Market access is interpreted in GATT to reflect the competitive relationship
between imported and domestic products. When a government agrees to reduce its import
tariff on a particular product, it alters the competitive relationship between imported and
domestic units of the product in favour of imported units, and it thereby provides greater
market access to foreign producers. Thus, by agreeing to lower its tariff, the government is
engineering an outward shift of its import demand curve—that is, all else equal, a greater
volume of imports will be demanded at any given price from foreign exporters. As a result,
foreign exporters can expect to enjoy an increase in sales into the domestic market.
GATT negotiations facilitate exchange of market access between countries. Each
government agrees to undertake tariff concessions which shift out its import demand curve
and thereby provide greater market access to foreign exporters, in exchange for the market
access benefits that its own exporters enjoy when foreign governments similarly undertake
obligations which shift out their respective import demand curves. While providing market
access to foreign exporters, therefore a government achieves greater access to foreign
markets for its exporters also. Tariff reductions may thus be viewed as the price that must
be paid in order to gain access to the foreign market.
However, negotiating a low tariff is not sufficient to establish high market access.
Price is often not necessary to enhance the ability to export in the foreign markets for two
reasons : first, tariff reduction may not result into lower export prices ( see for instance,
Bagwell and Staiger 2001) and second, trade patterns may not be very sensitive to changes
in tariff rates. Therefore, the impact of tariff reduction on market access is largely
determined by: one, relative prices changes and two, sensitivity of the trade patterns to
price changes.
10
IV.1 Tariff reduction and export prices
If after negotiating a commitment from a trading partner to reduce its tariff on a
particular product, that trading partner subsequently imposes internal taxes on the sale of
the product in a manner which favour domestic over imported products, tariff reduction
negotiations would not change the relative prices. Drafters of the GATT addressed this
problem by incorporating Article III of GATT. It provides protection against such
practices by requiring that member governments must abide by the rule of “national
treatment” when setting their domestic policies. National treatment requires that, once
foreign products enter the domestic market, they must be treated in the same way as
domestic products.
While rules like Article III can provide some assurance against certain kinds of
targeted domestic policy actions that would undermine the meaning of a tariff concession,
any of a host of domestic policies could be crafted to sever the effective link between
negotiated tariff concessions and market access and yet not be in direct violation of any of
GATT’s rules. Many labour and environmental standards fall into this category (Hudec,
1990). This problem in GATT was addressed by including the provision of ‘reciprocity’—
the balance of negotiated market access commitments. The prospect of non-violation
complaints is included that secures the cross-country balance of negotiated market access
commitments (although not necessarily their levels) against erosion as a result of future
changes in domestic policies. Under a successful nonviolation complaint, the complaining
country is entitled to a ‘re-balancing’ of market access commitments : either its trading
partner finds a way to offer compensation for its domestic policy change through other
policy changes that restore the original market access or it grants additional market access
on other products, or the complaining government is permitted to withdraw an equivalent
market access concession of its own. The nonviolation right provided in GATT is, thus, a
‘safety net’ linking the tariff concessions that a government voluntarily negotiates in
GATT to commitments over the market access it must subsequently offer to its trading
partners.

11
GATT rules like Article III and reciprocity are not adequate to ensure the effective
link between tariff reduction and the export price change. An increasing use of non tariff
measures (NTMs) and contingent protection measures could be made to effectively nullify
the effect of tariff reduction on market access. The pervasive impact of NTMs was first
recognised at international level in the 1960s after the Kennedy Round of negotiations.
These are so diverse and sometimes non transparent that their trade distorting effects are
difficult to assess ( Bhattacharya 1999). NTMs can be imposed on a case by case basis. As
a result NTMs application targets the specific items for trade diversion. While the Doha
Development Agenda (“DDA”) has set out the objective of reducing/ eliminating non tariff
barriers, the increasing use of contingent protection measures such as antidumping and
CVD which have emerged as the principal form of contingent protection is difficult to
reign in. WTO records show that around 63% of the cases initiated during 1995-200 were
directed against the developing countries. An analysis of the number of AD duties in force
as of 23 October 2003 in the US and as of June 4, 2003 in the EU against developed and
developing countries is revealing. More than 60 per cent of the AD duties in the US and
around 86% of the AD duties in the EU are against the developing countries (Aggarwal
2003). There are thus a number of barriers that impede the full exploitation of the market
access opportunities. In our analysis however we have assumed that tariff reductions
effectively provide market access opportunities to foreign exporters i.e. the price effect of
the tariff concessions will not be systematically offset by an increasing use of non tariff
barriers and contingent protection measures.
IV.2 Sensitivity of trade patterns to changes in tariff rates.
Although tariff concessions can be interpreted as accelerating the momentum for a
freer world trade, they may not have the desired impact on market access across all the
sectors. The effect of tariff concessions on market access of foreign importers depends on
the price elasticity of demand and the price elasticity of supply which interact to determine
the price elasticity of exports. It is expected that a tariff will have a greater effect the more
elastic the price responsiveness of exports.

12
The total market access effect can be decomposed into the competitive and market
effect. With fall in the import prices, import demand curve shifts upward increasing import
demand from the rest of the world (ROW). This effect termed ‘market effect’ describes the
effect of changes in relative prices on overall imports. If tariff rates are lowered, the market
effect will expand the markets. The ‘competitive effect’ however, suggests that even if
tariff reduction results into higher import demand, for an individual country, the effect of
such increase may not be significant due to low price elasticity for its products. A
country’s exports face competition not only from domestic producers in the importing
region, but also from “third country” exporters to that region. With fall in the import
prices, terms of trade changes for all the exporting countries. However some countries are
able to exploit the export potential due to greater price competitiveness, while others fail to
do so. Thus, normally the dominant relative price competition occurs among exporters.
This is captured by the competitive effect.
Since our focus is on India’s exports to the US, we explain the decomposition of
total market access effects into the market and competitive effect using a two country
model. We assume that there are two countries : Country 1, which is importing and
Country 2 which is exporting. Country 2’s exports to Country 1 in sector i may be
expressed as
X2i/ Y1 = (M1i/Y1) * (X2i/M1i)……………… (1)
where: X2i : Country 2’s exports in sector i.
Y1 : Country 1’s GDP;
M1i : Country 1’s imports in sector i.
The above relationship is purely statistical one and not based on any behavioural
assumptions. This implies that
Log (X2i/ Y1 ) = log(M1i/Y1) + log (X2i/M1i)………… (2)
By differentiating (2) by the relative export price, P. One gets

13
∆log (X2 i / Y1)/ ∆log P = ∆ log (M1 i /Y1)/log P+ ∆ log (X2 i /M1i)/logP …(3)
In other words, percentage change in the exports of Country 2 normalised by GDP
of Country 1 relative to percentage change in the export prices is a sum of the two
components : one, percentage change in the M1 i /Y1, which represents the market effect
and two, the percentage change in the market penetration ratio X2i /M1I, which shows the
competitive effect.
Thus, negotiations on tariff reduction are not expected to result in automatic market
access in all the sectors. Much depends on the p-competitiveness of a country’s exports
and the sensitivity of imports to price reduction.
IV.3 The Model
To quantitatively assess the impact of tariff reduction on India’s exports and
decompose the changes in India’s exports into the market and competitive effects, we
employed three economic models which explained : (i) India’s exports in the US markets ;
(ii) The US import demand; (iii) India’s market penetration in the US markets.
The export function is defined as :
Xit,ind = f (Yt,us, ADJPRICEit)
where
Xi,ind : India’s exports in sector i in year t ,
Yt,us : the US GDP in year t and
ADJPRICEit : adjusted relative prices in sector i in year t. It is calculated in
the following manner :
ADJPRICEit : ((Pit,us/Pit,ind) (excht))/(100+tt,us)
Where Pit,us refers to India’s price in sector i in year t, Pit,us is the US price in sector
i in year t, exch refers to the expchange rate in year t and tt,us is the US tariff rate in year t.
Normalising the above function by Yt,us we get,
14
Xit,ind / Yt,us = f (ADJPRICEit)
The above model is based on the conventional export function. The standard theory
argues that the foreign country’s income and the level of relative prices determine exports
of either a single commodity or of the commodities in aggregate. We extended the model
by incorporating the exchange rate and tariff rate variables, both of which influence the
relative price level between two countries. Indian exports are, thus, a function of the US
income and the adjusted relative prices. The relative-price term (ADJPRICE) that appears
in the above model is the ratio of the US price to the Indian prices adjusted for the
exchange rate and tariff rate. Theoretically, the sign of ADJPRICEi , as it is defined should
be positive. In other words as the price of US goods relative to Indian exports increase,
demand for India’s exports would also increase. If the tariff rates increase, other things
remaining the same, the relative prices would decline, reducing the demand for India’s
exports.
While modeling the US import demand function, the conventional specification that
real imports are determined by domestic income and the international purchasing power of
the local currency is assumed (Houthakker and Magee, 1969; Leamer and Stern, 1970;
Murray and Ginman, 1976; Goldstein and Khan, 1985; and Carone, 1996). We extended
the model by incorporating a tariff variable and employed the following functional form :
Mit,us = f(Yt,us, REERt,Tt) ...................(2)
Where Mit,us is the import demand in sector i in year t, Yt,us refers to the US GDP in
year t, REER refers to the real effective exchange rate (REER) and Tt refers to the tariff
rate. The REER is the single trade weighted index of the real exchange rate index (RERi)
where RER is the nominal exchange rate (index) adjusted for price changes in the domestic
economy relative to those of trading partners'. REER indicates the country's international
competitiveness. An appreciation of the REER will be a lower cost of imports, all other
factors held constant. This could lead to an increase in real imports demanded. Conversely

15
a fall or depreciation of the REER will be reflected in a higher cost for imports leading to a
decline in the volume demanded. The lowering of tariffs is expected to affect imports
negatively.
For analysing the market penetration effect, we adopted the following model :
Xit,ind = f (Mit,us, ADJPRICEit)
Which implies,
Xit,ind/Mit,us = f (, ADJPRICEit) ................ (3)
This is based on the standard export model (1). However, it includes Mit,us instead
of Yus as in model (1). This is because its objective is to examine India’s penetration into
the US import market.
All the three models were log transformed before these were put to an empirical
test. The log-transformed equation can be represented as below.
Log(Xit,ind / Yt,us ) = a1 + a2 log(ADJPRICEit) + u1 ................ (a)
Log( Mit,us/Yt,us ) = b1 + b2 log(REERt)+ b1log(Tt )+ u2.......... (b)
Log( Xit,ind /Mit,us ) = c1 + c 2 log (ADJPRICEit ) +u3.................(c)
While model (a) was used to estimate the total price effect, model (b) and (c)
determined the market and the competitive effect respectively. All these equations were
estimated using the OLS technique.
IV.4 Data, Variables and Methodology
The basic data source is the Trade and Production Database. The construction of
this database has been funded by the World bank’s Research Support Budget and the
Export Promotion Thematic group. It contains trade, production and tariff data for 67
16
developing and developed countries at the industry level over the period 1976-1999. The
sector disaggregation in the database follows the International Standard Industrial
Classification and is provided at the 3 digit level (28 industries for 67 countries and at the
four digit level (81 industries) for 24 of these countries. The database merges trade,
production and tariff data available from different sources. The United Nations Industrial
Development Organisation is the source for production related data. The source of the
trade data is United Nations Statistics Department’s Comtrade database. The World
Bank’s World Integrated trade Solution (WITS) is used to mirror trade using partners data.
Trade data is aggregated by region and income levels according to World Bank’s
definitions. A separate dataset is provided as well that includes partner-wise trade flows at
the industry level. The three sources of MFN average tariffs are, one, UNCTAD’s Train
database, two, WTO’s Trade Policy Review Series and three, the internet version of
Integrated Database. The various agencies utilise different classifications in the collection
of the data. This database has filtered the data into the ISIC classification after matching
different classifications.
The database contains trade, production and tariff data for the US at the 4 digit
industry level over the period 1989-1999. The sector disaggregation in the database
follows the International Standard Industrial Classification (ISIC). Ten annual observations
are afforded ranging from 1989 to 1999. This is again due to data constraint but one may
justify the choice by arguing that the reduction in tariff rate occurred only in the latter part
of the period covered.
Data on the ‘real effective exchange rate’ (REER) was collected from the relevant
issues of International Financial Statistics while the sectoral price data is based on the
information provided on the US government website : www.us.gov
17
V Market Access Estimates
V.1 Sectorial Impact of Tariff Reduction
Statistical analysis reveals a significant price responsiveness of India’s exports
directed to the US in 44 of 81 products ( at the 4-digit level of aggregation). Some studies,
as those by Bhagwati and Srinivasan (1975), Wadhwa (1998), Srinivasan (1998) provide
evidence of India’s exports being price responsive. Most econometric studies as those by
Virmani (1991), Joshi and Little (1994), Krishnamurthy and Pandit (1995) and Roy (2002)
also point to significant price responsiveness of India’s exports. Theoretically however,
one would expect the price responsiveness of exports to differ across commodities (as
discussed in Section IV). Lucas (1988) also finds varying price responsiveness across
commodities. Our results thus support the theoretical assertion as well as the empirical
evidence.
Table 7 lists the industries ( at the 4-digit level of industry disaggregation) in which
price responsiveness of exports was found to be insignificant. Contrary to the expectations
Indian exports directed to the US in

18
Table 7: Sectors where price responsiveness was insignificant for the period 1989-99 Broad Industry Group
Industry at the 4-digit level of disaggregation
Food, Beverages and tobacco
Slaughtering preparing and preserving meat Manufacture of dairy products Grain mill products Manufacture of bakery products Sugar factories and refineries Manufacture of cocoa chocolate and sugar confectionery Manufacture of food products not elsewhere classified Manufacture of prepared animal feeds Distilling rectifying and blending spirits Wine industries Malt liquors and malt Tobacco manufactures
Textiles Spinning weaving and finishing textiles Knitting mills Manufacture of carpets and rugs Cordage rope and twine industries Manufacture of textiles not elsewhere classified Manufacture of wearing apparel except footwear
Leather, paper, wood,
Tanneries and leather finishing Fur dressing and dyeing industries Manufacture of footwear except vulcanized or moulded rubber or plastic footwear Sawmills planing and other wood mills Manufacture of wooden and cane containers and small cane ware Manufacture of wood and cork products not elsewhere classified Manufacture of furniture and fixtures except primarily of metal
Chemicals Petroleum refineries Manufacture of miscellaneous products of petroleum and coal
Metals and non metals
Manufacture of cement lime and plaster Manufacture of non-metallic mineral products not elsewhere classified Non-ferrous metal basic industries Manufacture of structural metal products
Engineering Manufacture of engines and turbines Machinery and equipment except electrical not elsewhere classified Manufacture of electrical industrial machinery and apparatus Manufacture of motorcycles and bicycles Manufacture of aircraft Manufacture of musical instruments
Source: Author’s estimates based on the Trade and Production Database several resource and labour intensive industries were found to be insensitive to price
change. However, this result is in all likelihood substantially due to the trade diversion
effect of NAFTA preferences in favour of suppliers in Mexico, which is a competing
country. How serious the trade diversion effect of the NAFTA is can be gauged from the

19
growth of Mexico’s export to the USA in some of these sectors after the NAFTA was
established.
Table 8: Change in Exports from Mexico to the US in selected sectors: 1989-91 to
1997-99 (Number of times) Description Ratio of average exports
during 1997-99 to that over 1989-91
Spinning weaving and finishing textiles 4.9 Manufacture of made-up textile goods except wearing apparel 27.4 Knitting mills 155.7 Manufacture of carpets and rugs 1.6 Cordage rope and twine industries 2.9 Manufacture of textiles not elsewhere classified 20.3 Manufacture of wearing apparel except footwear 69.9 Manufacture of paints varnishes and lacquers 6.8 Manufacture of chemical products not elsewhere classified 7.2 Tanneries and leather finishing 4.1 Fur dressing and dyeing industries 14.4 Manufacture of products of leather and leather substitutes except footwear and
16.5
Manufacture of footwear except vulcanized or moulded rubber or plastic footwear
7.6
Source : Trade and Production data
Comparing the figures of Mexico’s exports to the USA during the triennium 1989-
91 with those in the triennium 1997-99 it is seen that there was a phenomenal increase in
certain product groups (Table 8). Exports of made-ups increased about 27 times, of apparel
about 70 times, leather manufactures by about 14 times and footwear by about 8 times.
Table 9 shows that during this period, India’s share of the US market went up from 1.6 to
2.8 per cent for made-ups while that of Mexico increased from 1.6 to 13.8 per cent. In
apparel India increased its share from 2.8 to 3.3 while Mexico’s went up from 0.3 to 12.6
percent. In leather manufactures India’s share increased from 1.5 to 2.3 while that of
Mexico from 0.7 to 5.6 per cent. In footwear India’s share declined from 0.9 to 0.8 per cent
while that of Mexico went up from 0.7 to 3.3 per cent. These are the product groups in
which India has export interest and at the same time the MFN rates are relatively high and
no concession is granted to developing countries under the Generalised System of
Preferences. To some extent the difference is also accounted for by the fact that textile and
20
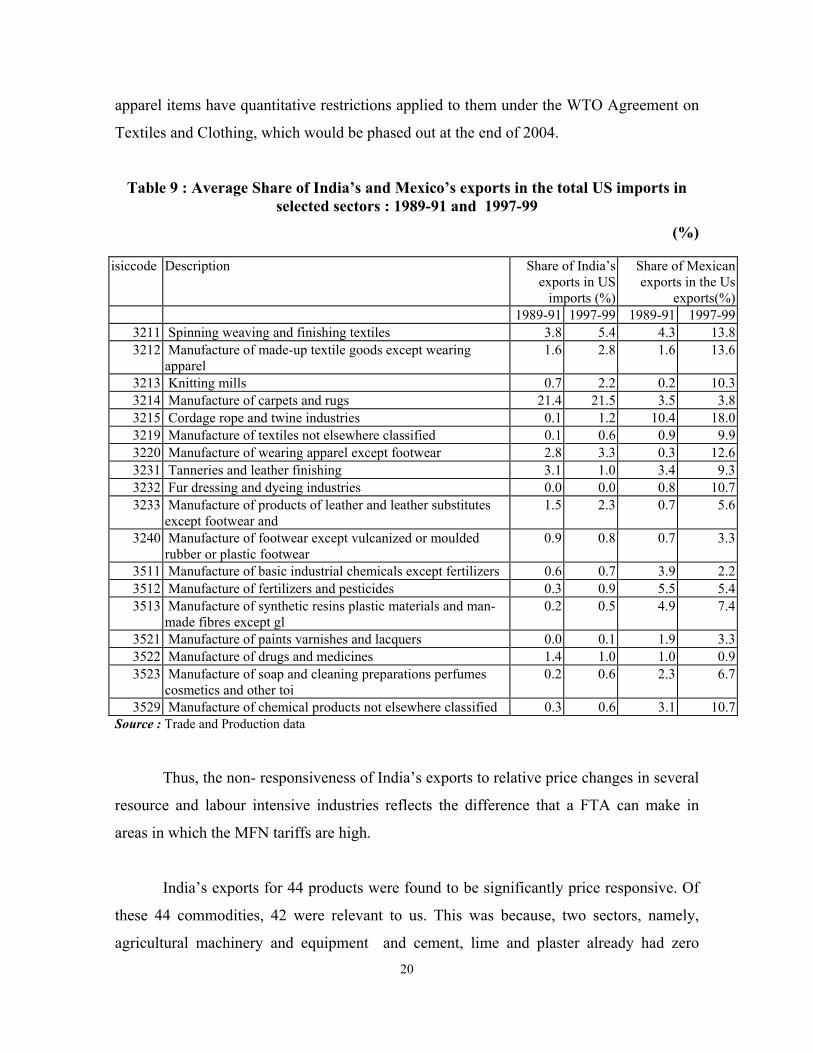
apparel items have quantitative restrictions applied to them under the WTO Agreement on
Textiles and Clothing, which would be phased out at the end of 2004.
Table 9 : Average Share of India’s and Mexico’s exports in the total US imports in selected sectors : 1989-91 and 1997-99
(%)
isiccode Description Share of India’s exports in US
imports (%)
Share of Mexican exports in the Us
exports(%) 1989-91 1997-99 1989-91 1997-99
3211 Spinning weaving and finishing textiles 3.8 5.4 4.3 13.83212 Manufacture of made-up textile goods except wearing
apparel 1.6 2.8 1.6 13.6
3213 Knitting mills 0.7 2.2 0.2 10.33214 Manufacture of carpets and rugs 21.4 21.5 3.5 3.83215 Cordage rope and twine industries 0.1 1.2 10.4 18.03219 Manufacture of textiles not elsewhere classified 0.1 0.6 0.9 9.93220 Manufacture of wearing apparel except footwear 2.8 3.3 0.3 12.63231 Tanneries and leather finishing 3.1 1.0 3.4 9.33232 Fur dressing and dyeing industries 0.0 0.0 0.8 10.73233 Manufacture of products of leather and leather substitutes
except footwear and 1.5 2.3 0.7 5.6
3240 Manufacture of footwear except vulcanized or moulded rubber or plastic footwear
0.9 0.8 0.7 3.3
3511 Manufacture of basic industrial chemicals except fertilizers 0.6 0.7 3.9 2.23512 Manufacture of fertilizers and pesticides 0.3 0.9 5.5 5.43513 Manufacture of synthetic resins plastic materials and man-
made fibres except gl 0.2 0.5 4.9 7.4
3521 Manufacture of paints varnishes and lacquers 0.0 0.1 1.9 3.33522 Manufacture of drugs and medicines 1.4 1.0 1.0 0.93523 Manufacture of soap and cleaning preparations perfumes
cosmetics and other toi 0.2 0.6 2.3 6.7
3529 Manufacture of chemical products not elsewhere classified 0.3 0.6 3.1 10.7Source : Trade and Production data
Thus, the non- responsiveness of India’s exports to relative price changes in several
resource and labour intensive industries reflects the difference that a FTA can make in
areas in which the MFN tariffs are high.
India’s exports for 44 products were found to be significantly price responsive. Of
these 44 commodities, 42 were relevant to us. This was because, two sectors, namely,
agricultural machinery and equipment and cement, lime and plaster already had zero
21
average tariff rates. Our analysis therefore is focused on 42 products. Since India’s exports
in these products are price responsive, they could be targeted as export items with high
growth potential.
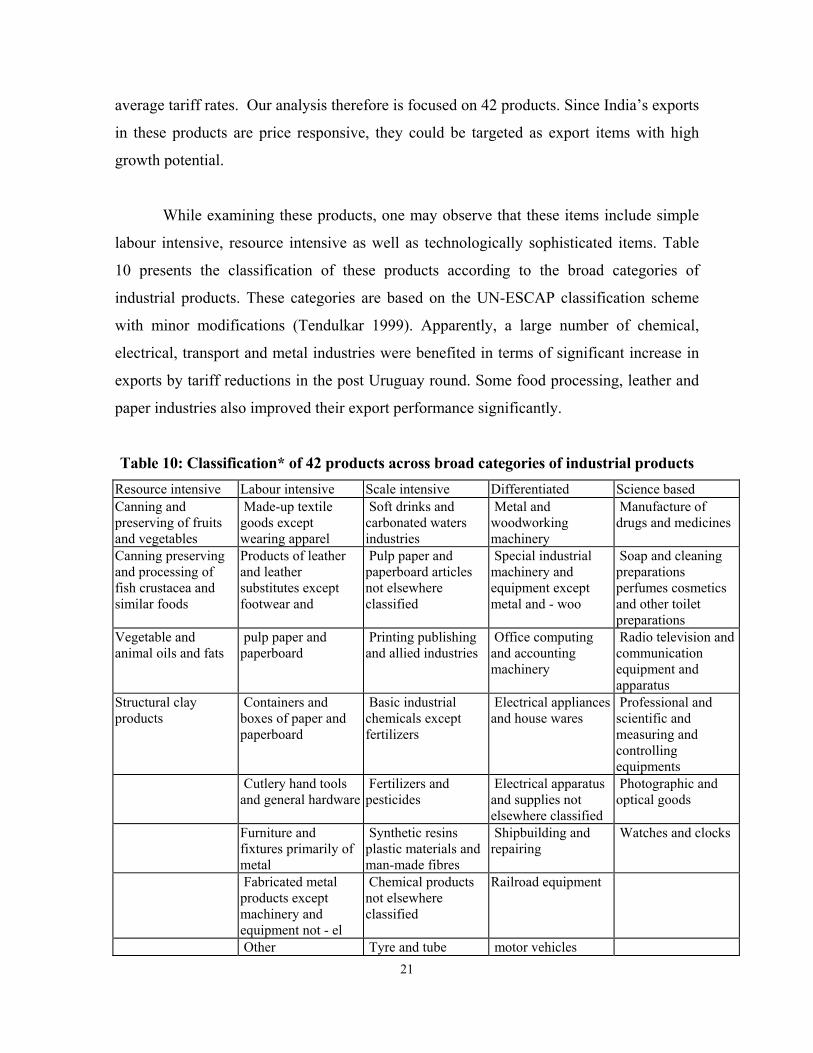
While examining these products, one may observe that these items include simple
labour intensive, resource intensive as well as technologically sophisticated items. Table
10 presents the classification of these products according to the broad categories of
industrial products. These categories are based on the UN-ESCAP classification scheme
with minor modifications (Tendulkar 1999). Apparently, a large number of chemical,
electrical, transport and metal industries were benefited in terms of significant increase in
exports by tariff reductions in the post Uruguay round. Some food processing, leather and
paper industries also improved their export performance significantly.
Table 10: Classification* of 42 products across broad categories of industrial products Resource intensive Labour intensive Scale intensive Differentiated Science based Canning and preserving of fruits and vegetables
Made-up textile goods except wearing apparel
Soft drinks and carbonated waters industries
Metal and woodworking machinery
Manufacture of drugs and medicines
Canning preserving and processing of fish crustacea and similar foods
Products of leather and leather substitutes except footwear and
Pulp paper and paperboard articles not elsewhere classified
Special industrial machinery and equipment except metal and - woo
Soap and cleaning preparations perfumes cosmetics and other toilet preparations
Vegetable and animal oils and fats
pulp paper and paperboard
Printing publishing and allied industries
Office computing and accounting machinery
Radio television and communication equipment and apparatus
Structural clay products
Containers and boxes of paper and paperboard
Basic industrial chemicals except fertilizers
Electrical appliances and house wares
Professional and scientific and measuring and controlling equipments
Cutlery hand tools and general hardware
Fertilizers and pesticides
Electrical apparatus and supplies not elsewhere classified
Photographic and optical goods
Furniture and fixtures primarily of metal
Synthetic resins plastic materials and man-made fibres
Shipbuilding and repairing
Watches and clocks
Fabricated metal products except machinery and equipment not - el
Chemical products not elsewhere classified
Railroad equipment
Other Tyre and tube motor vehicles

22
Manufacturing industries
industries
Rubber products not elsewhere classified
Transport equipment n.e.c
Plastic products not elsewhere classified
Pottery china and earthenware
Glass and glass products
Iron and steel basic industries
Jewellery and related articles
Sporting and athletic goods
*Based on the UN-ESCAP classification scheme adapted by Tendulkar (1999)
Table 11 presents the price elasticity coefficient of the 42 commodities that have
been of interest to us. The average price elasticity in these 42 selected sectors was roughly
3%. Since the elasticity coefficient for the transport equipment sector was exceptionally
high, we excluded it from our calculation of the average price elasticity. Using the average
price elasticity coefficient we categorized the products as higher-than-average elasticity
products and lower-than-average elasticity products. One may observe that the industries
exhibited higher-than-average elasticity were mainly scale intensive, differentiated or
science based products. On the other hand, the exports of resource and labour intensive
products recorded lower than average price elasticity. It can also be seen that some science
based products namely, drugs and pharmaceuticals, scientific and measuring and
controlling equipments and watches and clocks and, differentiated products namely,
special industrial machinery and scale intensive chemical products also exhibited lower
than average elasticity. It could be due to the niche markets that our exports may have
created in these commodities. For instance, in drugs and pharmaceuticals, India’s exports
focus on the bulk drugs’ markets. Since bulk drugs constitute the major raw materials in
the production of drugs, price elasticity of India’s exports in this market is very low (lower
than even 1).

23
Table 11: Classification of price responsive products by price elasticity Description P-elasticity Description P-elasticity
Higher than average elasticity Lower than average elasticity Manufacture of transport equipment not elsewhere classified
20.194 Manufacture of vegetable and animal oils and fats
2.761
Manufacture of fertilizers and pesticides
7.943 Canning and preserving of fruits and vegetables
2.653
Shipbuilding and repairing 6.655 Manufacture of glass and glass products 2.461 Manufacture of electrical appliances and housewares
6.416 Manufacture of synthetic resins plastic materials and man-made fibres except gl
2.446
Manufacture of pulp paper and paperboard
6.111 Manufacture of special industrial machinery and equipment except metal and – woo
2.268
Manufacture of pulp paper and paperboard articles not elsewhere classified
5.795 Manufacture of chemical products not elsewhere classified
2.119
Soft drinks and carbonated waters industries
5.433 Printing publishing and allied industries 2.085
Manufacture of furniture and fixtures primarily of metal
5.004 Manufacturing industries not elsewhere classified
2.045
Manufacture of containers and boxes of paper and paperboard
4.971 Manufacture of structural clay products 2.011
Manufacture of rubber products not elsewhere classified
4.519 Manufacture of pottery china and earthenware 1.923
Manufacture of office computing and accounting machinery
4.396 Manufacture of motor vehicles 1.922
Manufacture of railroad equipment
4.338 Manufacture of watches and clocks 1.666
Manufacture of plastic products not elsewhere classified
4.279 Manufacture of made-up textile goods except wearing apparel
1.592
Manufacture of soap and cleaning preparations perfumes cosmetics and other toi
4.055 Manufacture of basic industrial chemicals except fertilizers
1.41
Manufacture of electrical apparatus and supplies not elsewhere classified
4.01 Manufacture of photographic and optical goods
1.308
Manufacture of radio television and communication equipment and apparatus
3.663 Tyre and tube industries 1.272
Iron and steel basic industries 3.005 Manufacture of cutlery hand tools and general hardware
1.097
Canning preserving and processing of fish crustacea and similar foods
1.029
Manufacture of products of leather and leather substitutes except footwear and
0.984
Manufacture of sporting and athletic goods 0.979 Manufacture of metal and woodworking
machinery 0.918
Manufacture of professional and scientific and measuring and controlling equipm
0.793
24
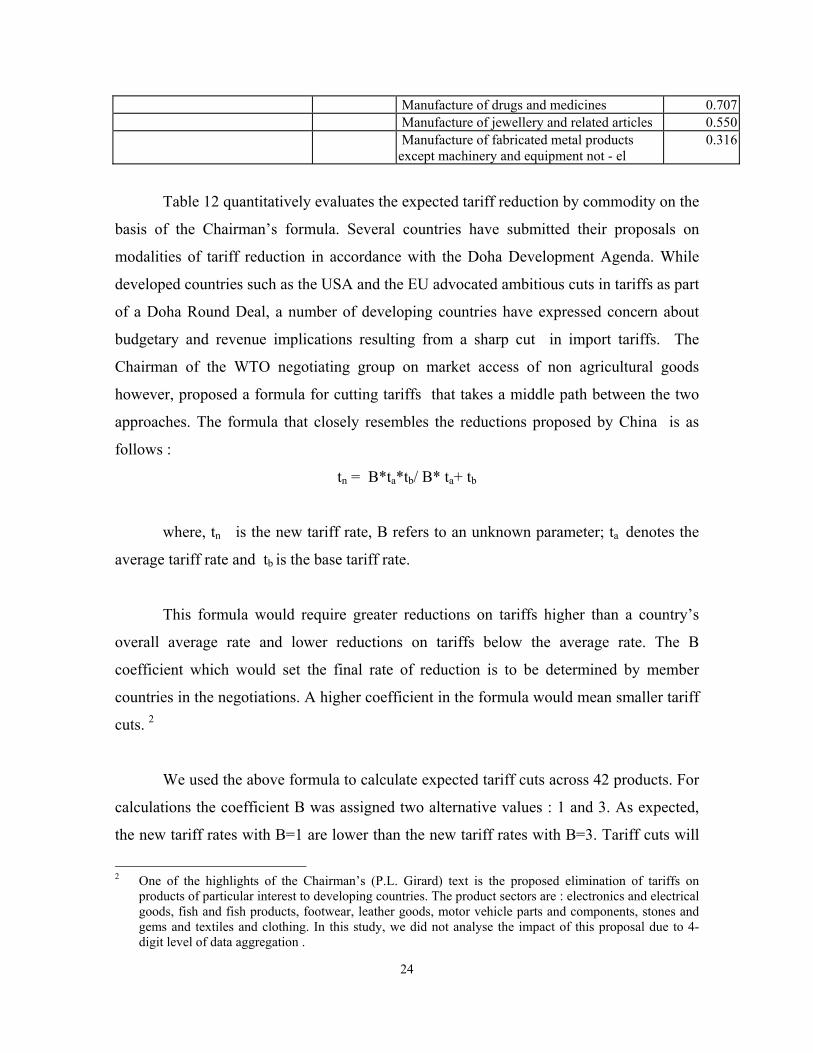
Manufacture of drugs and medicines 0.707 Manufacture of jewellery and related articles 0.550 Manufacture of fabricated metal products
except machinery and equipment not - el 0.316
Table 12 quantitatively evaluates the expected tariff reduction by commodity on the
basis of the Chairman’s formula. Several countries have submitted their proposals on
modalities of tariff reduction in accordance with the Doha Development Agenda. While
developed countries such as the USA and the EU advocated ambitious cuts in tariffs as part
of a Doha Round Deal, a number of developing countries have expressed concern about
budgetary and revenue implications resulting from a sharp cut in import tariffs. The
Chairman of the WTO negotiating group on market access of non agricultural goods
however, proposed a formula for cutting tariffs that takes a middle path between the two
approaches. The formula that closely resembles the reductions proposed by China is as
follows :
tn = B*ta*tb/ B* ta+ tb
where, tn is the new tariff rate, B refers to an unknown parameter; ta denotes the
average tariff rate and tb is the base tariff rate.
This formula would require greater reductions on tariffs higher than a country’s
overall average rate and lower reductions on tariffs below the average rate. The B
coefficient which would set the final rate of reduction is to be determined by member
countries in the negotiations. A higher coefficient in the formula would mean smaller tariff
cuts. 2
We used the above formula to calculate expected tariff cuts across 42 products. For
calculations the coefficient B was assigned two alternative values : 1 and 3. As expected,
the new tariff rates with B=1 are lower than the new tariff rates with B=3. Tariff cuts will
2 One of the highlights of the Chairman’s (P.L. Girard) text is the proposed elimination of tariffs on
products of particular interest to developing countries. The product sectors are : electronics and electrical goods, fish and fish products, footwear, leather goods, motor vehicle parts and components, stones and gems and textiles and clothing. In this study, we did not analyse the impact of this proposal due to 4-digit level of data aggregation .
25
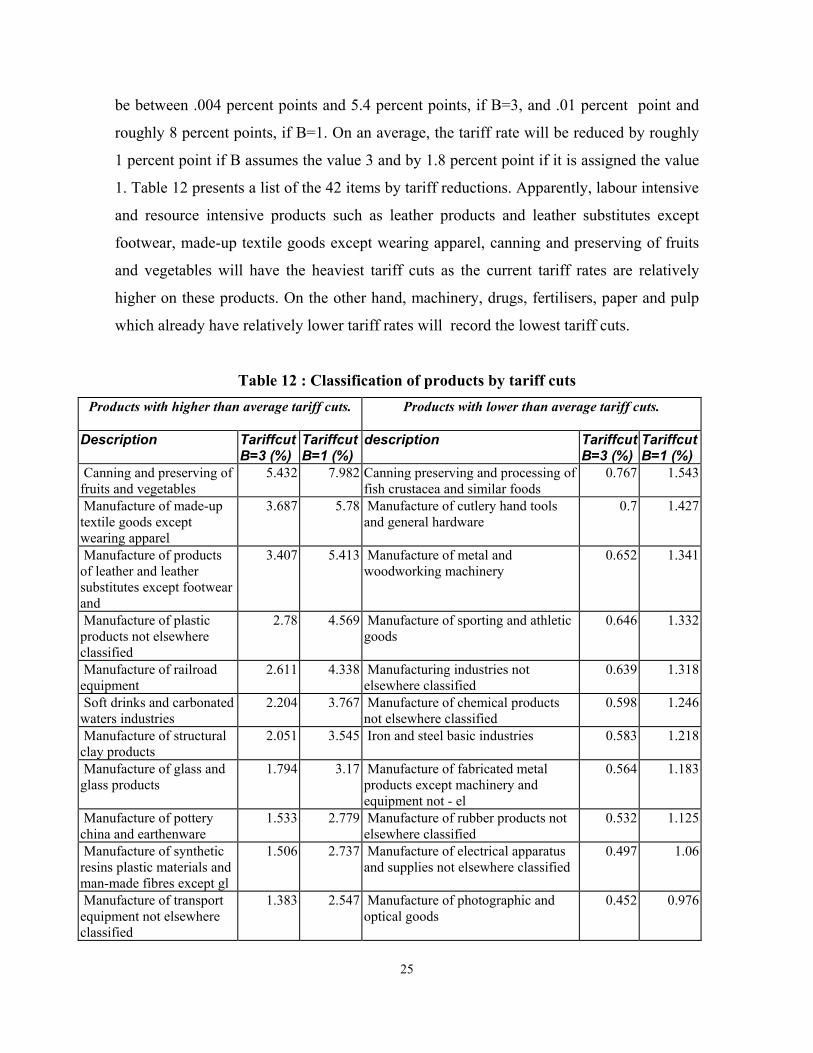
be between .004 percent points and 5.4 percent points, if B=3, and .01 percent point and
roughly 8 percent points, if B=1. On an average, the tariff rate will be reduced by roughly
1 percent point if B assumes the value 3 and by 1.8 percent point if it is assigned the value
1. Table 12 presents a list of the 42 items by tariff reductions. Apparently, labour intensive
and resource intensive products such as leather products and leather substitutes except
footwear, made-up textile goods except wearing apparel, canning and preserving of fruits
and vegetables will have the heaviest tariff cuts as the current tariff rates are relatively
higher on these products. On the other hand, machinery, drugs, fertilisers, paper and pulp
which already have relatively lower tariff rates will record the lowest tariff cuts.
Table 12 : Classification of products by tariff cuts Products with higher than average tariff cuts.
Products with lower than average tariff cuts.
Description Tariffcut B=3 (%)
TariffcutB=1 (%)
description TariffcutB=3 (%)
TariffcutB=1 (%)
Canning and preserving of fruits and vegetables
5.432 7.982 Canning preserving and processing of fish crustacea and similar foods
0.767 1.543
Manufacture of made-up textile goods except wearing apparel
3.687 5.78 Manufacture of cutlery hand tools and general hardware
0.7 1.427
Manufacture of products of leather and leather substitutes except footwear and
3.407 5.413 Manufacture of metal and woodworking machinery
0.652 1.341
Manufacture of plastic products not elsewhere classified
2.78 4.569 Manufacture of sporting and athletic goods
0.646 1.332
Manufacture of railroad equipment
2.611 4.338 Manufacturing industries not elsewhere classified
0.639 1.318
Soft drinks and carbonated waters industries
2.204 3.767 Manufacture of chemical products not elsewhere classified
0.598 1.246
Manufacture of structural clay products
2.051 3.545 Iron and steel basic industries 0.583 1.218
Manufacture of glass and glass products
1.794 3.17 Manufacture of fabricated metal products except machinery and equipment not - el
0.564 1.183
Manufacture of pottery china and earthenware
1.533 2.779 Manufacture of rubber products not elsewhere classified
0.532 1.125
Manufacture of synthetic resins plastic materials and man-made fibres except gl
1.506 2.737 Manufacture of electrical apparatus and supplies not elsewhere classified
0.497 1.06
Manufacture of transport equipment not elsewhere classified
1.383 2.547 Manufacture of photographic and optical goods
0.452 0.976
26
Manufacture of basic industrial chemicals except fertilizers
1.158 2.193 Manufacture of containers and boxes of paper and paperboard
0.402 0.88
Manufacture of motor vehicles
1.153 2.184 Manufacture of electrical appliances and housewares
0.401 0.878
Manufacture of watches and clocks
1.085 2.076 Manufacture of radio television and communication equipment and apparatus
0.242 0.562
Manufacture of jewellery and related articles
0.98 1.90 Manufacture of soap and cleaning preparations perfumes cosmetics and other toi
0.229 0.534
Manufacture of vegetable and animal oils and fats
0.945 1.845 Tyre and tube industries 0.186 0.444
Average for 42 sectors 0.99 1.79 Manufacture of pulp paper and paperboard articles not elsewhere classified
0.174 0.417
Manufacture of professional and scientific and measuring and controlling equipm
0.159 0.383
Manufacture of furniture and fixtures primarily of metal
0.155 0.376
Printing publishing and allied industries
0.077 0.196
Manufacture of office computing and accounting machinery
0.074 0.19
Manufacture of pulp paper and paperboard
0.057 0.148
Manufacture of fertilizers and pesticides
0.056 0.145
Manufacture of special industrial machinery and equipment except metal and - woo
0.052 0.136
Shipbuilding and repairing 0.021 0.057 Manufacture of drugs and medicines 0.004 0.011
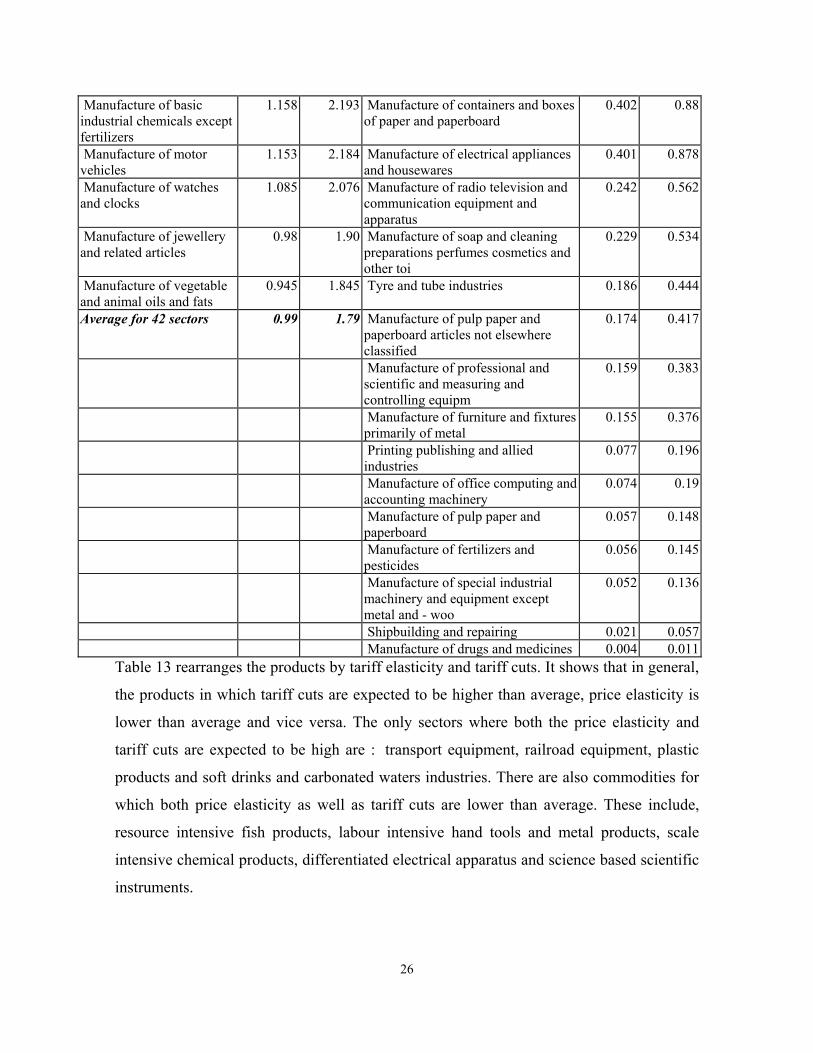
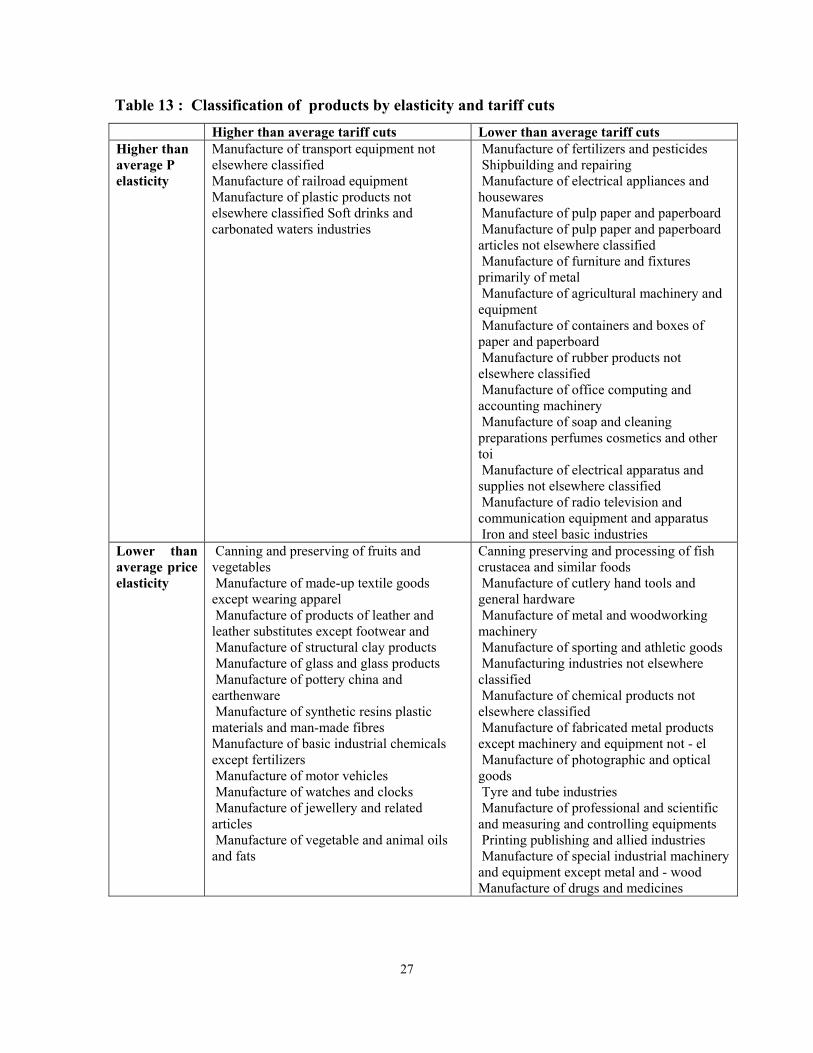
Table 13 rearranges the products by tariff elasticity and tariff cuts. It shows that in general,
the products in which tariff cuts are expected to be higher than average, price elasticity is
lower than average and vice versa. The only sectors where both the price elasticity and
tariff cuts are expected to be high are : transport equipment, railroad equipment, plastic
products and soft drinks and carbonated waters industries. There are also commodities for
which both price elasticity as well as tariff cuts are lower than average. These include,
resource intensive fish products, labour intensive hand tools and metal products, scale
intensive chemical products, differentiated electrical apparatus and science based scientific
instruments.
27
Table 13 : Classification of products by elasticity and tariff cuts
Higher than average tariff cuts Lower than average tariff cuts Higher than average P elasticity
Manufacture of transport equipment not elsewhere classified Manufacture of railroad equipment Manufacture of plastic products not elsewhere classified Soft drinks and carbonated waters industries
Manufacture of fertilizers and pesticides Shipbuilding and repairing Manufacture of electrical appliances and housewares Manufacture of pulp paper and paperboard Manufacture of pulp paper and paperboard articles not elsewhere classified Manufacture of furniture and fixtures primarily of metal Manufacture of agricultural machinery and equipment Manufacture of containers and boxes of paper and paperboard Manufacture of rubber products not elsewhere classified Manufacture of office computing and accounting machinery Manufacture of soap and cleaning preparations perfumes cosmetics and other toi Manufacture of electrical apparatus and supplies not elsewhere classified Manufacture of radio television and communication equipment and apparatus Iron and steel basic industries
Lower than average price elasticity
Canning and preserving of fruits and vegetables Manufacture of made-up textile goods except wearing apparel Manufacture of products of leather and leather substitutes except footwear and Manufacture of structural clay products Manufacture of glass and glass products Manufacture of pottery china and earthenware Manufacture of synthetic resins plastic materials and man-made fibres Manufacture of basic industrial chemicals except fertilizers Manufacture of motor vehicles Manufacture of watches and clocks Manufacture of jewellery and related articles Manufacture of vegetable and animal oils and fats
Canning preserving and processing of fish crustacea and similar foods Manufacture of cutlery hand tools and general hardware Manufacture of metal and woodworking machinery Manufacture of sporting and athletic goods Manufacturing industries not elsewhere classified Manufacture of chemical products not elsewhere classified Manufacture of fabricated metal products except machinery and equipment not - el Manufacture of photographic and optical goods Tyre and tube industries Manufacture of professional and scientific and measuring and controlling equipments Printing publishing and allied industries Manufacture of special industrial machinery and equipment except metal and - wood Manufacture of drugs and medicines
28
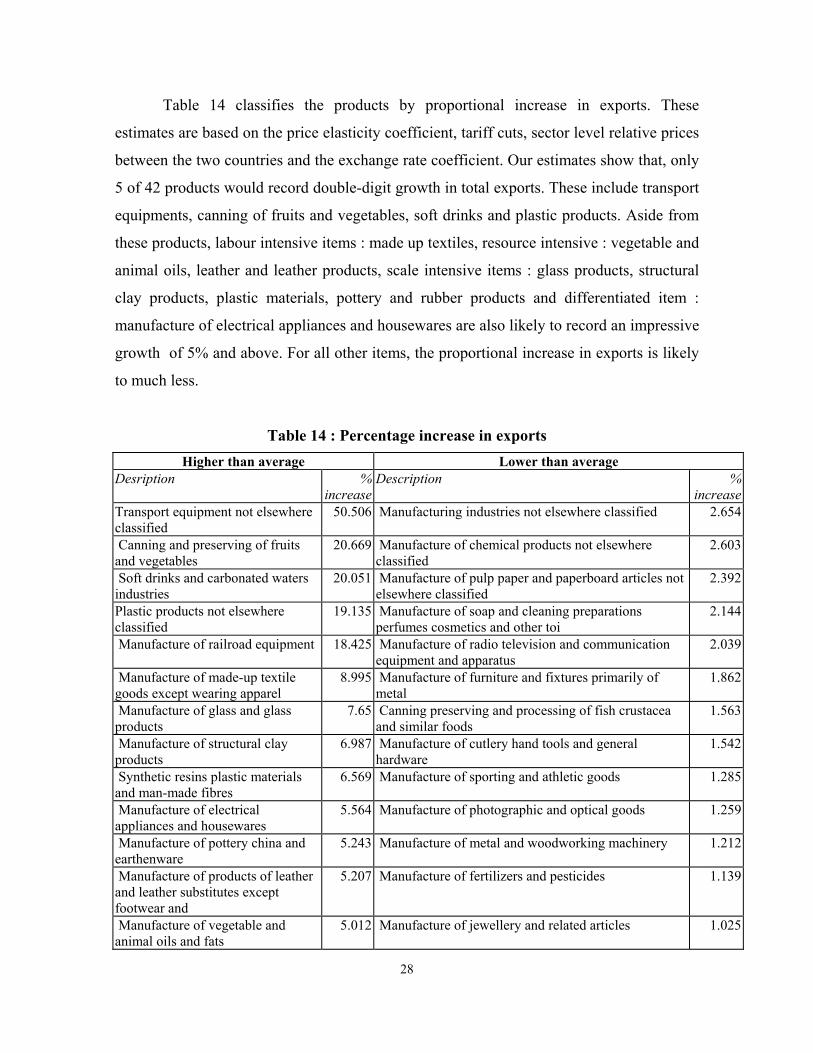
Table 14 classifies the products by proportional increase in exports. These
estimates are based on the price elasticity coefficient, tariff cuts, sector level relative prices
between the two countries and the exchange rate coefficient. Our estimates show that, only
5 of 42 products would record double-digit growth in total exports. These include transport
equipments, canning of fruits and vegetables, soft drinks and plastic products. Aside from
these products, labour intensive items : made up textiles, resource intensive : vegetable and
animal oils, leather and leather products, scale intensive items : glass products, structural
clay products, plastic materials, pottery and rubber products and differentiated item :
manufacture of electrical appliances and housewares are also likely to record an impressive
growth of 5% and above. For all other items, the proportional increase in exports is likely
to much less.
Table 14 : Percentage increase in exports Higher than average Lower than average
Desription % increase
Description % increase
Transport equipment not elsewhere classified
50.506 Manufacturing industries not elsewhere classified 2.654
Canning and preserving of fruits and vegetables
20.669 Manufacture of chemical products not elsewhere classified
2.603
Soft drinks and carbonated waters industries
20.051 Manufacture of pulp paper and paperboard articles not elsewhere classified
2.392
Plastic products not elsewhere classified
19.135 Manufacture of soap and cleaning preparations perfumes cosmetics and other toi
2.144
Manufacture of railroad equipment 18.425 Manufacture of radio television and communication equipment and apparatus
2.039
Manufacture of made-up textile goods except wearing apparel
8.995 Manufacture of furniture and fixtures primarily of metal
1.862
Manufacture of glass and glass products
7.65 Canning preserving and processing of fish crustacea and similar foods
1.563
Manufacture of structural clay products
6.987 Manufacture of cutlery hand tools and general hardware
1.542
Synthetic resins plastic materials and man-made fibres
6.569 Manufacture of sporting and athletic goods 1.285
Manufacture of electrical appliances and housewares
5.564 Manufacture of photographic and optical goods 1.259
Manufacture of pottery china and earthenware
5.243 Manufacture of metal and woodworking machinery 1.212
Manufacture of products of leather and leather substitutes except footwear and
5.207 Manufacture of fertilizers and pesticides 1.139
Manufacture of vegetable and animal oils and fats
5.012 Manufacture of jewellery and related articles 1.025

29
Manufacture of rubber products not elsewhere classified
5.011 Manufacture of pulp paper and paperboard 0.896
Manufacture of containers and boxes of paper and paperboard
4.319 Manufacture of office computing and accounting machinery
0.829
Electrical apparatus and supplies not elsewhere classified
4.195 Tyre and tube industries 0.559
Manufacture of motor vehicles 4.124 Printing publishing and allied industries 0.405 Iron and steel basic industries 3.608 Shipbuilding and repairing 0.374 Watches and clocks 3.398 Manufacture of fabricated metal products except
machinery and equipment not classified elsewhere 0.369
Manufacture of basic industrial chemicals except fertilizers
3.039 Manufacture of special industrial machinery and equipment except metal and - woo
0.306
Professional and scientific and measuring and controlling equipm
0.301
Manufacture of drugs and medicines 0.007
Tables 15 provides estimates of the expected absolute increase in total exports by
product. Figures for the absolute increase in exports presented in Table 12 are calculated
using average exports over the period 1997 to 1999. Our findings suggest that tariff cuts
are not expected to benefit India’s exports in a major way. With the full implementation of
the Chairman’s formula for tariff cuts, India’s exports directed to the US would increase by
roughly 41 million if B=1 and by 76.5 million if B=3. If these figures are applied to 1997-
99 average exports for the 42 products, this amounts to 1% increase in India’s exports to
the US if B=3 and 2% if B=1. As a proportion of total exports to the US, this works out to
be 0.6% and 1.2% respectively. Of the 42 items which would respond to tariff cuts, only
14 are likely to add $1 million or more to the export bill. Gems and jewellary emerges as
the topmost sector that would add around $23 million to the export bill. Since almost 50%
of the total exports destined to the US are accounted for by this item only, the results are
not surprising. India has long been a major processor of cut diamonds. In the early 2003
when the USA lifted its 5.7% duty on finished jewellery, Sajay Kothari, President of the
Gems and Jewellery export promotion council expressed the hope that India’s exports
could double by 2005. Tariff reduction in this sector should help Indian jewellers fend off
growing competition. Other big jewellery-exporting nations, including Thailand, already
enjoy tariff-free exports to the U.S. Many Indian jewellers feared that China would become
a factor inhibiting India’s export growth in this item. However, despite a tremendous

30
increase in Chinese jewellery exports during the late 1990s3, Indian exports managed an
impressive growth. Other important items would be made-up textile goods, Iron and steel,
basic industrial chemicals except fertilizers, plastic products, plastic materials, motor
vehicles, radio television and communication equipment and apparatus, food processing,
glass and rubber products and edible oils. In contrast, furniture and fixtures primarily of
metal, watches and clocks, printing publishing and allied industries, containers and boxes
of paper and paperboard, pulp paper and paperboard, soft drinks and carbonated waters,
shipbuilding and repairing, drugs and medicines and transport equipment are likely to
make insignificantly small additions to our export bills on account of tariff rate reduction.
Table 15 : Absolute increase in exports based on 1997-99 exports (B=1) Description Change export B =1 ( $ thousands) Manufacture of jewellery and related articles
22897.82 Canning preserving and processing of fish crustacea and similar foods
852.45
Manufacture of made-up textile goods except wearing apparel
9598.79 Manufacture of electrical apparatus and supplies not elsewhere classified
802.84
Iron and steel basic industries 7178.25 Manufacturing industries not elsewhere classified
599.32
Manufacture of basic industrial chemicals except fertilizers
6093.15 Manufacture of cutlery hand tools and general hardware
487.85
Products of leather and leather substitutes except footwear and
5410.6 Fabricated metal products except machinery and equipment
440.88
Plastic products not elsewhere classified
3537.6 Office computing and accounting machinery
424.56
Synthetic resins plastic materials and man-made fibres except gl
3430.58 Tyre and tube industries 359.27
Manufacture of motor vehicles 2811.25 Manufacture of metal and woodworking machinery
302.05
Radio television and communication equipment and apparatus
2598.45 Soap and cleaning preparations perfumes cosmetics and other toilet preparations
262.12
Canning and preserving of fruits and vegetables
2089.91 Manufacture of fertilizers and pesticides 238.8
Manufacture of vegetable and animal oils and fats
1727.24 Manufacture of electrical appliances and housewares
170.61
Chemical products (n.e.c) 1468.92 Pottery china and earthenware 97.49 Glass and glass products 1087.44 Structural clay products 93.89 Manufacture of rubber products not elsewhere classified
1004.23 Special industrial machinery and equipment except metal and – wood
81.06
Manufacture of railroad equipment 75.35Pulp paper and paperboard articles not 69.15
3 From 1997 to 2001, Chinese jexports to the U.S. doubled to $712 million, according to the U.S.
Commerce Dept.

31
elsewhere classified Photographic and optical goods 50.19 Sporting and athletic goods 39.25 Professional and scientific and measuring and controlling equipm
37.75
Furniture and fixtures of metal 30.68 Manufacture of watches and clocks 26.96
Printing publishing and allied industries 26.42 Containers and boxes of paper and paperboard
23.8
Pulp paper and paperboard 18.55 Soft drinks and carbonated waters industries
16.31
Shipbuilding and repairing 13.88 Drugs and medicines 8.24 Transport equipment not elsewhere classified
3.74
Table 16 shows that 25 of 42 items would have lower than average percentage
change and less than $1 million increase in exports in absolute term. Only 5 items namely,
food processing, made-up textiles, plastics materials , plastic products and glass products
are expected to manage higher than average percentage increase and greater than $1
million increase in exports. Vegetable and animal oils and fats , products of leather and
leather substitutes except footwear, basic industrial chemicals except fertilizers, Iron and
steel, basic chemical industries, radio television and communication equipment and
apparatus, jewellery and related articles and motor vehicles will record lower than average
(3%) increase in exports but are expected to add more than $1 million to the export bill.
On the other hand, transport equipment, soft drinks and carbonated waters industries,
railroad equipment, structural clay products and electrical appliances and housewares will
record higher than 3% growth in exports but their contribution to the value of exports will
be less than $1 million due to low levels of current exports.

32
Table 16 : Classification of products by proportional increase and absolute increase in exports
Higher than average proportional increase
Lower than average proportional increase
Greater than 1 million change in exports
Canning and preserving of fruits and vegetables, Manufacture of made-up textile goods except wearing apparel, Manufacture of synthetic resins plastic materials and man-made fibres except gl, Manufacture of plastic products not elsewhere classified, Manufacture of glass and glass products
Manufacture of vegetable and animal oils and fats , Manufacture of products of leather and leather substitutes except footwear, Manufacture of basic industrial chemicals except fertilizers, Iron and steel basic industries Manufacture of radio television and communication equipment and apparatus, Manufacture of jewellery and related articles, Manufacture of motor vehicles
Less than 1 million change in exports
Manufacture of transport equipment not elsewhere classified, Soft drinks and carbonated waters industries, Manufacture of railroad equipment, Manufacture of structural clay products, Manufacture of electrical appliances and housewares
fertilizers and pesticides Shipbuilding and repairing pulp paper and paperboard pulp paper and paperboard articles furniture and fixtures primarily of metal containers and boxes of paper and paperboard rubber products not elsewhere classified office computing and accounting machinery soap and cleaning preparations perfumes cosmetics and other toi electrical apparatus and supplies Iron and steel basic industries special industrial machinery chemical products Printing publishing and allied industries Manufacturing industries pottery china and earthenware motor vehicles watches and clocks Photographic and optical goods Tyre and tube industries cutlery hand tools and general hardware Canning preserving and processing of fish crustacea and similar foods Sporting and athletic goods Metal and woodworking machinery Professional and scientific and measuring and controlling equipments Drugs and medicines Fabricated metal products
33
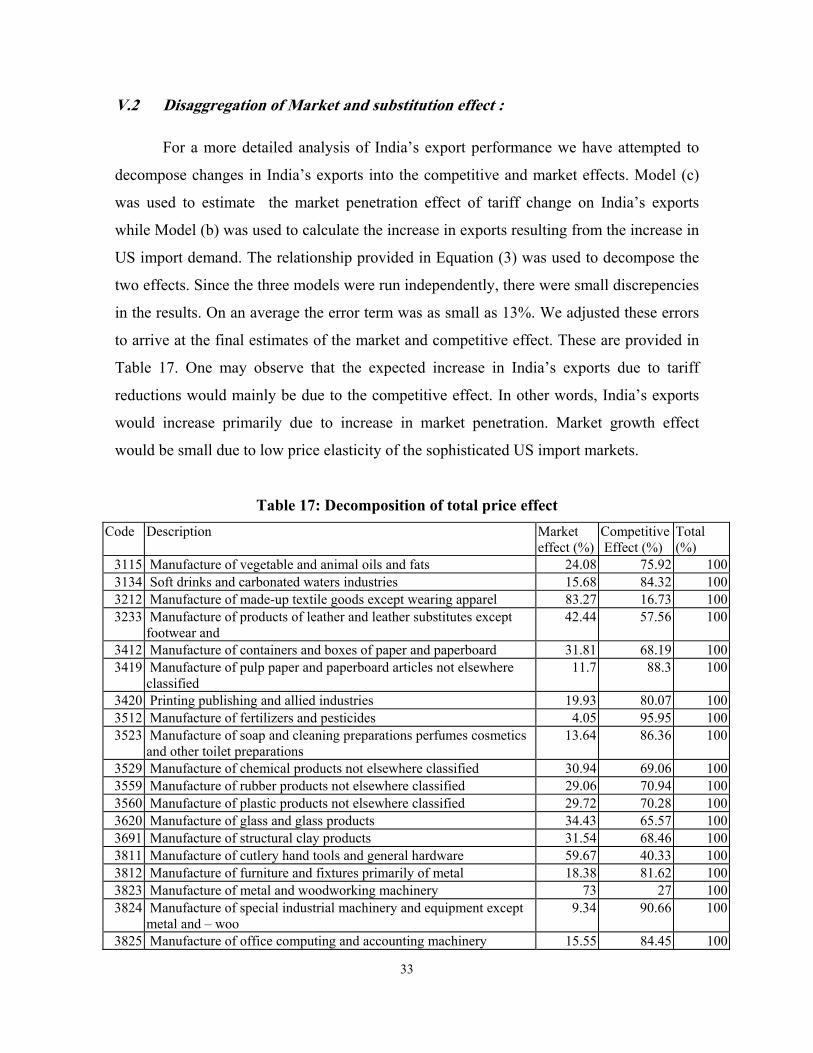
V.2 Disaggregation of Market and substitution effect :
For a more detailed analysis of India’s export performance we have attempted to
decompose changes in India’s exports into the competitive and market effects. Model (c)
was used to estimate the market penetration effect of tariff change on India’s exports
while Model (b) was used to calculate the increase in exports resulting from the increase in
US import demand. The relationship provided in Equation (3) was used to decompose the
two effects. Since the three models were run independently, there were small discrepencies
in the results. On an average the error term was as small as 13%. We adjusted these errors
to arrive at the final estimates of the market and competitive effect. These are provided in
Table 17. One may observe that the expected increase in India’s exports due to tariff
reductions would mainly be due to the competitive effect. In other words, India’s exports
would increase primarily due to increase in market penetration. Market growth effect
would be small due to low price elasticity of the sophisticated US import markets.
Table 17: Decomposition of total price effect Code Description Market
effect (%) Competitive Effect (%)
Total (%)
3115 Manufacture of vegetable and animal oils and fats 24.08 75.92 1003134 Soft drinks and carbonated waters industries 15.68 84.32 1003212 Manufacture of made-up textile goods except wearing apparel 83.27 16.73 1003233 Manufacture of products of leather and leather substitutes except
footwear and 42.44 57.56 100
3412 Manufacture of containers and boxes of paper and paperboard 31.81 68.19 1003419 Manufacture of pulp paper and paperboard articles not elsewhere
classified 11.7 88.3 100
3420 Printing publishing and allied industries 19.93 80.07 1003512 Manufacture of fertilizers and pesticides 4.05 95.95 1003523 Manufacture of soap and cleaning preparations perfumes cosmetics
and other toilet preparations 13.64 86.36 100
3529 Manufacture of chemical products not elsewhere classified 30.94 69.06 1003559 Manufacture of rubber products not elsewhere classified 29.06 70.94 1003560 Manufacture of plastic products not elsewhere classified 29.72 70.28 1003620 Manufacture of glass and glass products 34.43 65.57 1003691 Manufacture of structural clay products 31.54 68.46 1003811 Manufacture of cutlery hand tools and general hardware 59.67 40.33 1003812 Manufacture of furniture and fixtures primarily of metal 18.38 81.62 1003823 Manufacture of metal and woodworking machinery 73 27 1003824 Manufacture of special industrial machinery and equipment except
metal and – woo 9.34 90.66 100
3825 Manufacture of office computing and accounting machinery 15.55 84.45 100

34
3832 Manufacture of radio television and communication equipment and apparatus
14.85 85.15 100
3833 Manufacture of electrical appliances and housewares 6.45 93.55 1003839 Manufacture of electrical apparatus and supplies not elsewhere
classified 27.8 72.2 100
3841 Shipbuilding and repairing 9.48 90.52 1003852 Manufacture of photographic and optical goods 22.62 77.38 1003903 Manufacture of sporting and athletic goods 37.92 62.08 1003909 Manufacturing industries not elsewhere classified 15.44 84.56 1003710 Iron and steel basic industries 0.0 100.0 1003113 Canning and preserving of fruits and vegetables 0.0 100.0 1003843 Manufacture of motor vehicles 0.0 100.0 1003513 Manufacture of synthetic resins plastic materials and man-made
fibres 0.0 100.0 100
3114 Canning preserving and processing of fish crustacea and similar foods
0.0 100.0 100
3551 Tyre and tube industries 0.0 100.0 1003610 Manufacture of pottery china and earthenware 0.0 100.0 1003411 Manufacture of pulp paper and paperboard 0.0 100.0 1003849 Manufacture of transport equipment not elsewhere classified 0.0 100.0 1003901 Manufacture of jewellery and related articles 100 0.0 1003511 Manufacture of basic industrial chemicals except fertilizers 100 0.0 1003819 Manufacture of fabricated metal products except machinery and
equipment not – el 100 0.0 100
3842 Manufacture of railroad equipment 100 0.0 1003851 Manufacture of professional and scientific and measuring and
controlling equipments 100 0.0 100
3522 Manufacture of drugs and medicines 100 0.0 100
In at least 9 sectors, transport equipment, pulp paper and paperboard, tyre and
tubes, pottery, canning and preserving of fruits, vegetables, fish products, motor, plastic
and iron and steel only market penetration/ competitive effect will operate. Import markets
in these products have not been price elastic. There are a few items however where market
effect alone will be contributing to our export growth. These include scale intensive :
jewellery, basic chemicals, metal products, science based : drugs and pharmaceuticals and
scientific controlling equipments and differentiated railroad equipments. Made textiles,
hand tools and cutlery, and metal and woodworking machinery are the only other
exceptions where market expansion is expected to contribute to expansion in India’s
exports.
In an earlier study Gupta and Ray (1998) also observed that price factor is a
significant determinant of India’s market penetration in the US imports for a number of
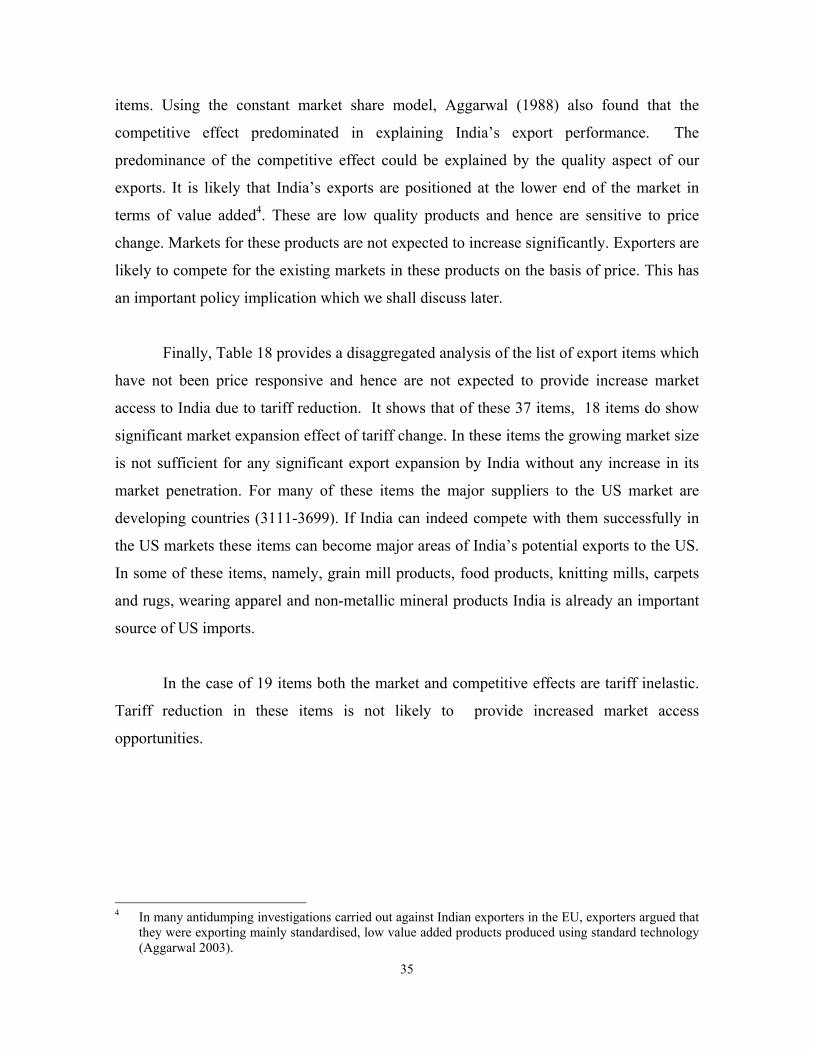
35
items. Using the constant market share model, Aggarwal (1988) also found that the
competitive effect predominated in explaining India’s export performance. The
predominance of the competitive effect could be explained by the quality aspect of our
exports. It is likely that India’s exports are positioned at the lower end of the market in
terms of value added4. These are low quality products and hence are sensitive to price
change. Markets for these products are not expected to increase significantly. Exporters are
likely to compete for the existing markets in these products on the basis of price. This has
an important policy implication which we shall discuss later.
Finally, Table 18 provides a disaggregated analysis of the list of export items which
have not been price responsive and hence are not expected to provide increase market
access to India due to tariff reduction. It shows that of these 37 items, 18 items do show
significant market expansion effect of tariff change. In these items the growing market size
is not sufficient for any significant export expansion by India without any increase in its
market penetration. For many of these items the major suppliers to the US market are
developing countries (3111-3699). If India can indeed compete with them successfully in
the US markets these items can become major areas of India’s potential exports to the US.
In some of these items, namely, grain mill products, food products, knitting mills, carpets
and rugs, wearing apparel and non-metallic mineral products India is already an important
source of US imports.
In the case of 19 items both the market and competitive effects are tariff inelastic.
Tariff reduction in these items is not likely to provide increased market access
opportunities.
4 In many antidumping investigations carried out against Indian exporters in the EU, exporters argued that
they were exporting mainly standardised, low value added products produced using standard technology (Aggarwal 2003).
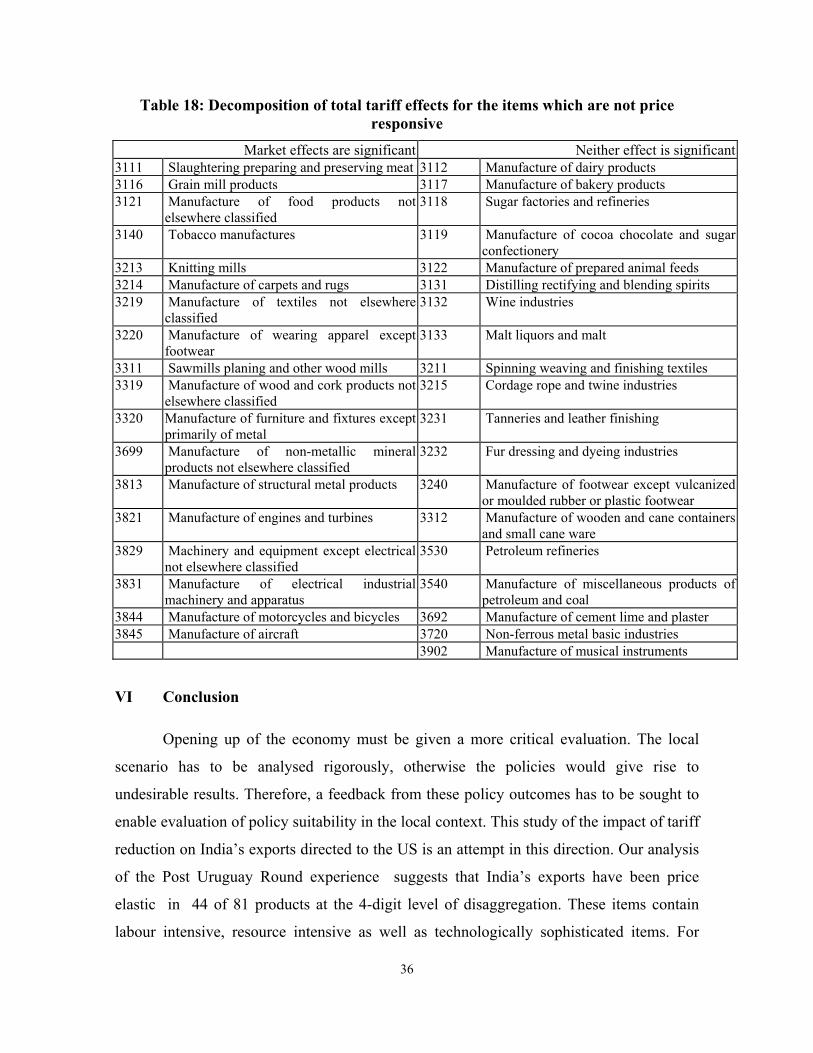
36
Table 18: Decomposition of total tariff effects for the items which are not price responsive
Market effects are significant Neither effect is significant3111 Slaughtering preparing and preserving meat 3112 Manufacture of dairy products 3116 Grain mill products 3117 Manufacture of bakery products 3121 Manufacture of food products not
elsewhere classified 3118 Sugar factories and refineries
3140 Tobacco manufactures 3119 Manufacture of cocoa chocolate and sugar confectionery
3213 Knitting mills 3122 Manufacture of prepared animal feeds 3214 Manufacture of carpets and rugs 3131 Distilling rectifying and blending spirits 3219 Manufacture of textiles not elsewhere
classified 3132 Wine industries
3220 Manufacture of wearing apparel except footwear
3133 Malt liquors and malt
3311 Sawmills planing and other wood mills 3211 Spinning weaving and finishing textiles 3319 Manufacture of wood and cork products not
elsewhere classified 3215 Cordage rope and twine industries
3320 Manufacture of furniture and fixtures except primarily of metal
3231 Tanneries and leather finishing
3699 Manufacture of non-metallic mineral products not elsewhere classified
3232 Fur dressing and dyeing industries
3813 Manufacture of structural metal products 3240 Manufacture of footwear except vulcanized or moulded rubber or plastic footwear
3821 Manufacture of engines and turbines 3312 Manufacture of wooden and cane containers and small cane ware
3829 Machinery and equipment except electrical not elsewhere classified
3530 Petroleum refineries
3831 Manufacture of electrical industrial machinery and apparatus
3540 Manufacture of miscellaneous products of petroleum and coal
3844 Manufacture of motorcycles and bicycles 3692 Manufacture of cement lime and plaster 3845 Manufacture of aircraft 3720 Non-ferrous metal basic industries 3902 Manufacture of musical instruments
VI Conclusion
Opening up of the economy must be given a more critical evaluation. The local
scenario has to be analysed rigorously, otherwise the policies would give rise to
undesirable results. Therefore, a feedback from these policy outcomes has to be sought to
enable evaluation of policy suitability in the local context. This study of the impact of tariff
reduction on India’s exports directed to the US is an attempt in this direction. Our analysis
of the Post Uruguay Round experience suggests that India’s exports have been price
elastic in 44 of 81 products at the 4-digit level of disaggregation. These items contain
labour intensive, resource intensive as well as technologically sophisticated items. For
37
these items there appears to be a scope for expanding India’s exports to the US markets
with further tariff reductions resulting from the Doha Round negotiations on non
agricultural products. This indicates that tariff reduction could be a major contributor to
India’s export performance. However, the quantitative assessment suggests that tariff cuts
are not expected to benefit India’s exports to the US in a major way. With the full
implementation of the Chairman’s formula for tariff cuts, increase in India’s exports to the
US would amount to 1.2% or 0.6% depending on the value of the B coefficient in the
Chairman’s formula. These findings are in all likelihood substantially due to the tariff
diversion effect of NAFTA preferences in favour of suppliers in Mexico, which is a
competing country in many traditional items. It is expected that reduction of MFN tariff
would alleviate the trade diversion effect of the NAFTA. As a result, India’s export growth
in the US market resulting from the Uruguay Round tariff cuts would be much higher in
some of the traditional items than that predicted by the study.
Item-wise performance also varies significantly. Although for some products there
exists substantial scope for an export increase due to tariff reductions, for most of the items
the increase is likely to be very small. Thus all those items which are price elastic need not
reflect substantial future potential. The items can be prioritised depending upon their
potential increase.
Finally, the evidence suggests that the increase in India’s exports would be mainly
due to the competitive factor. The market effect of tariff reduction is likely to be very small
for most items that display significant price elasticity in India’s case. There are a number
of products in which India’s exports are not price responsive despite the fact that the US
market responds to the tariff change. This is due to insignificant market penetration effect
of tariff reduction. Many of these items are traditional exports which are exported to the
US by developing countries including India. If India can compete with other countries
these items can also become high export growth items. It is therefore crucial to improve
India’s competitiveness vis—a-vis its competitors in different markets.

38
References
Aggarwal, A. (2003) ‘The WTO Antidumping Code : Issues for Review in Post Doha Negotiations, ICRIER Working Paper 99, 2003.
Aggarwal, M “A Comparative Analysis of India’s Export Performance, 1965-80”, Indian
Economic Review(1988) Vol.23,No.2, Pages-231-261 Bhagwati J. and T.N. Srinivasan (1975), Foreign Trade Regimes and Economic Development:
India, New York: Columbia University Press(for the NBER) Bhattacharya B (1999) ‘ Non Tariff Measures on India’s Exports : An Assessment; Study Prepared
for ESCAP Carone, G. (1996), “Modeling the U. S. Demand for Imports Through Cointegration and Error
Correction,” Journal of Policy Modeling, 18(1):1-48. Florian A. Alburo (1999) Libralising Manufacturing Trade’ World Bank 1999,
www.cid.harvard.edu Goldstein, M. and M. S. Khan (1985), “Income and Price Effects in Foreign Trade,” in R. W. Jones
and P. B. Kenen (eds.) Handbook of International Economics (Vol.II), New York: Elsevier Science Publications, 1041-1105.
Government of India (2001) www.nic.in.commin Gupta, B. And A.S. Ray ‘ Real Exchnage Rates and Manufactured Exports : A Study of India’s
Potential Exports to the US Journal of Asian Economics Vol 9, No.2 333-344. Hertel Thomas and Martin, Will (1999) ‘Developing Country interests in Liberalising
Manufacturers Trade, World Bank, Feb. 1999 www.cid.harvard.edu Houthakker, H. S. and S. P. Magee (1969), “Income and Price Elasticities in World Trade,” Review
of Economics and Statistics, 41:111-25. Hudec, R.E. (1990) The GATT Legal System and World Trade Diplomacy, 1990, Georgetown
University Law Center. Joshi V. and IMD. Little (1994), India: Macroeconomics and Political Economy,1964-
91,Delhi:Oxford University Press. Krishnamurthy,K.and V.Pandit (1995): India’s Trade Flows: Alternative Policy Scenerios :1995-
2000”,Working Paper No.:32,Delhi: Centre for Development Economics, Delhi School of Economics.
Kyle Bagwell and Robert W. Staiger (2001) The WTO as a Mechanism for Securing Market
Access Property Rights: Implications for Global Labour and Environmental Issues ‘Journal of Economic Perspectives’,Volume 15, Number 3 69–88
Leamer, E. E. and R. M. Stern (1970), Quantitative International Economics, Boston, MA: Allyn
and Bacon.

39
Lucas, R.E.B. (1988) ‘Demand for India’s Manufactured Exports’ Journal of Development
Economics, 29(1) : 63-75. Murray, T. and P. J. Ginman (1976), “An Examination of the Traditional Aggregate Import
Demand Model,” Review of Economics and Statistics, 58:75-80. Roy, S.S.(2002) Determinants of India’s Exports A Simultaneous Error Correction Approach,
Discussion Paper # 37/2002,Research and Information System ,New Delhi Srinavasan,T.N. (1998):”India’s Export Performance: A Comparative Analysis” in I. J.Ahluwalia
and I.M.D.Little(eds), India’s Economic Reforms and Development: Essays for Manmohan Singh, Delhi:Oxford University Press.
Tendulkar, S.D(1999) Exports in India’s Growth Process, Working Paper No.46,ICRIER,New
Delhi The Hindu (2001) : 14 July Saturday, Indo-US trade ties have plateaued; Need New Push. Virmani , A(1991),”Demand and Supply Factors in India’s Trade”,Economic and Political Weekly,
309-314,February Wadhwa, C.D. (1998): “Some Aspects of India’s Export Policy and Performance”.in R.Lucas and
G.Papanek(eds), The Indian Economy, New Delhi: Oxford University Press.