impact of solute flow during directional solidification of
TRANSCRIPT

HAL Id: hal-02804321https://hal.archives-ouvertes.fr/hal-02804321
Submitted on 12 Jun 2020
HAL is a multi-disciplinary open accessarchive for the deposit and dissemination of sci-entific research documents, whether they are pub-lished or not. The documents may come fromteaching and research institutions in France orabroad, or from public or private research centers.
L’archive ouverte pluridisciplinaire HAL, estdestinée au dépôt et à la diffusion de documentsscientifiques de niveau recherche, publiés ou non,émanant des établissements d’enseignement et derecherche français ou étrangers, des laboratoirespublics ou privés.
Impact of solute flow during directional solidification ofa Ni-based alloy: In-situ and real-time X-radiography
G. Reinhart, D. Grange, L. Abou-Khalil, N. Mangelinck-Noel, N. T. Niane, V.Maguin, G. Guillemot, Ch.-A. Gandin, H. Nguyen-Thi
To cite this version:G. Reinhart, D. Grange, L. Abou-Khalil, N. Mangelinck-Noel, N. T. Niane, et al.. Impact of soluteflow during directional solidification of a Ni-based alloy: In-situ and real-time X-radiography. ActaMaterialia, Elsevier, 2020, 194, pp.68-79. �10.1016/j.actamat.2020.04.003�. �hal-02804321�

1
Impact of solute flow during directional solidification of a Ni-based alloy: in-situ and real-
time X-radiography
G. Reinharta,*, D. Grangeb, L. Abou-Khalila, N. Mangelinck-Noëla, N. T. Nianeb, V. Maguinb,c,
G. Guillemotc, Ch.-A. Gandinc, H. Nguyen-Thia
a Aix Marseille Univ, Université de Toulon, CNRS, IM2NP, Marseille, France
b Safran Advanced Turbine Airfoils, a technology platform of Safran Tech, 171 Boulevard de
Valmy, 92700 Colombes, France.
c PSL Research University, MINES ParisTech, CEMEF UMR CNRS 7635, CS10207, F-06904
Sophia Antipolis, France
Abstract
Understanding the impact of thermo-solutal convection during alloy solidification is of
central importance in the casting industry. Convective flow generated from density variations
in the liquid is at the origin of many casting defects, such as chemical segregations and freckles,
to which Ni-based superalloys used in jet engines are known to be highly sensitive. In this
article, we present experimental results obtained during directional solidification of a CMSX-4
* Corresponding author at Aix-Marseille University and IM2NP Case 142, Campus St-Jerome, 13397 Marseille
cedex 20, France: Tel.: (+33) 4 91 28 28 94; Email address: [email protected]
2
single crystal superalloy observed in-situ by means of synchrotron X-radiography at the
European Synchrotron Radiation Facility (ESRF, Grenoble, France). The use of a high-
temperature directional solidification furnace, an intense monochromatic beam and a high-
speed X-ray sensitive camera allowed the direct observation of the development of solute flow
to be performed during dendritic growth of a Ni-based alloy. The transient stage leading to the
formation of a dendrite network and the interaction with the concomitantly developing
convective pattern are studied. The impact of solute flow on the dendrite growth velocity is
characterized for three cooling rates. Measurements of dendrite tip positions show that the
convective flow above the solidification front induces a periodic oscillation of the dendrite
growth velocity and that the oscillation amplitude decreases for higher cooling rates. The
development of residual liquid areas is observed on the sides of the sample. Fragmentation of
dendrite parts occurs during the solidification of the residual liquid areas and leads to the
formation of spurious grains. The experimental results are analyzed by using a Rayleigh
number-based model, highlighting the need for direct simulations in the future.
Keywords: Thermo-solutal convection; Superalloy; CMSX-4; Directional solidification;
Synchrotron X-radiography

3
1. Introduction
Nickel-based superalloys are nowadays the reference material to produce blades for
advanced turbine engines. Creep-resistant turbine blades and vanes are produced by lost-wax
casting and directional solidification, enabling an accurate control of the microstructure and the
manufacturing of single-crystal parts [1]. The need for higher turbine efficiency encourages the
use of materials that are resistant to higher temperatures and stresses. Nevertheless, selecting
materials with improved mechanical properties sometimes increases the challenges to process
them. For instance, the widely used CMSX-4 single crystal superalloy is known to be sensitive
to the occurrence of freckles, which are defects causing the affected parts to be rejected.
Freckles appear as channels with a diameter proportional to few primary dendrite arm spacings.
Their length can vary from millimeters to centimeters and they are filled with a chain of small
equiaxed crystals [2]. In the case of a binary alloy with a partition coefficient less than unity
and having a negative liquidus slope, freckles may be formed as follows. First, solute
partitioning occurs at the scale of dendrite arms and solute is rejected in the melt, which
intensifies the local composition gradients and results in an increase of the solutal buoyancy
force. Then, segregation chimneys and convective plumes are formed, leading to partial melting
of dendrites and eventually to the transport and accumulation of fragments and/or equiaxed
crystals in the chimneys.
The understanding of freckle formation is difficult because it requires an accurate
knowledge of local chemical segregation during solidification, as well as the prediction of liquid

4
density inversion and mushy zone permeability [3,4]. Because it is of prime importance to
control the occurrence of freckles, several attempts have been made from the late 1960s [5] to
the early 2000s [6] to understand and characterize it by deriving freckling criteria. These studies
are summarized in [7]. It is possible to decrease or even suppress the occurrence of freckles by
increasing the temperature gradient and/or the isotherm velocity during solidification [1,2], or
by modifying the shape of the casting cluster. Simple predictors have been developed and are
used in numerical simulation tools to evaluate the risk of defect occurrence. We can mention
thermal based criteria and Rayleigh criteria: the thermal-based criteria use a combination of the
temperature gradient 𝐺 and the velocity of the isotherms 𝑉, while Rayleigh criteria includes
the effect of alloy composition and mushy zone permeability [3,8]. However, too much
constraint is put on the process at the expense of productivity when such criteria are not accurate
enough. One of the limitations of those criteria is that the interaction between fluid flow due to
thermo-solutal convection and the mold shape is not accurately considered. For example, it is
well known that freckles can appear close to geometrical irregularities like section restrictions,
due to a local concentration of the flow [9], a tendency that thermal-based and Rayleigh criteria
fail to predict. Moreover, the internal surface of the mold (orientation, roughness…) do have
effects that are also not considered [10]. Therefore, there is a major interest in developing multi-
physical numerical simulations [11] that must be validated with accurate and relevant
experimental observations [12].
In-situ observation is a valuable tool to improve the understanding of the solidification

5
processes [13], especially in the case of dynamical phenomena such as thermo-solutal flow
occurring during alloy solidification. The pioneer studies using transparent alloys reported by
Hellawell et al. [14] significantly pushed forward models of channel formation in the mushy
zone. Over the last couple of decades, X-ray imaging has been established as the method of
choice to carry out direct observations during the solidification of metal alloys [15]. Buoyancy-
driven flow patterns have been studied in Ga-In alloys using X-ray radioscopy with a laboratory
source by Boden et al. [16]. Their results have been particularly useful to make comparisons
between experimental observations and numerical simulations of the formation of segregated
channels [12] and freckles [17] and to investigate the impact of forced convection [18]. The
study of alloys with a higher melting temperature such as aluminum-based alloy can also be
carried out using laboratory devices that provide sufficient spatial and temporal resolutions to
distinguish the growth microstructure [19–21]. To the best of the authors’ knowledge,
applications of these laboratory devices to the thorough investigation of flow patterns during
solidification have not hitherto been reported. On the other hand, there now exists a significant
body of works on the study of metallic alloy solidification using X-ray imaging at synchrotron
source facilities by taking advantage of the high photon flux [22]. Among the various in-situ
and time-resolved imaging techniques, such as synchrotron tomography [23–25] or Bragg
diffraction imaging (also referred as X-ray topography) [26,27], synchrotron X-radiography is
the simplest one to implement. Information on the composition variations in the liquid phase
during binary metal alloys solidification can be retrieved from images by using synchrotron X-

6
radiography with a monochromatic X-ray beam [28,29] and to some extent three-dimensional
spatial information [29,30]. The impact of thermo-solutal flow on the growth velocity of
dendritic microstructures has been studied in Al-Cu-Si alloys by Mirihanage et al. [31] and in
Sn-Pb alloys by Cao et al. [32]. Moreover, synchrotron imaging with high temperature furnaces
makes it possible to study high temperature materials of industrial interest. Yasuda et al. [33]
reported observations of the growth of -Fe dendrites by using synchrotron radiography.
Tandjaoui et al. [34] combined synchrotron radiography and diffraction topography to study
faceted silicon growth. First observations of dendrite growth and dendrite arm bending were
reported in a Ni-based CMSX-4 superalloy by Aveson et al. [35,36]. It is worth noting that the
dendritic pattern in Ni, Co and Fe-based alloys was recently observed by Azeem et al. by
synchrotron tomography [37].
In this article, we present experimental results obtained during the directional solidification
of a CMSX-4 single crystal superalloy observed in-situ and in real-time by means of
synchrotron X-radiography at the European Synchrotron Radiation Facility (ESRF, Grenoble,
France). The use of a high-temperature furnace, an intense monochromatic beam and a high-
speed X-ray sensitive camera allowed us to carry out the direct observation of the development
of solute flow during dendritic growth for a commercial CMSX-4 superalloy. The concomitant
development of the dendrite network and of the convective pattern during the initial transient
stage is described. The relative influence of solute flow on the dendrite development for three
different cooling rates is highlighted. Observations of the development of residual liquid on the

7
sides of the sample as well as the formation of fragments and their movement in the residual
liquid areas are described. Predictions of a Rayleigh number-based model adapted to each
experimental case of interest are compared to the results. The advantages and limitations of
such a model are discussed.
2. Experiments
2.1. Experimental procedure
Directional solidification experiments were carried out at the ID19 beamline of ESRF. The
alloy samples were solidified/melted vertically inside the GaTSBI (Growth at high Temperature
using a Synchrotron Beam for Imaging) experimental device schematized in Fig. 1a. This
device was originally designed to study silicon growth and a detailed description of the
equipment can be found elsewhere [38–40]. The sample was a single crystal of CMSX-4 alloy
with a sheet-like shape. The nominal composition of the alloy is reported in Table 1 [41].
According to the Thermo-Calc NI25 database [42], the primary solid phase forming from the
liquid state is disordered FCC with a liquidus temperature of 1384.2°C and a solidus
temperature of 1317.6°C. Values of 1378.4°C for the liquidus temperature and of 1330.8°C for
the solidus temperature were obtained using the Single Cristal database with the JMatPro®
software [43].
The dimensions of the sample before melting was 43 mm 7.8 mm 0.3 mm. Photographs
of the sample in its crucible before and after melting are shown in Fig. 1b. Shrinkage occurred

8
due to thickening of the sample after the first melting. The sample thickness was chosen to
obtain enough transmission of the X-ray beam and to avoid the superimposing of several
dendrite layers that would make the interpretation of the radiographs more difficult. The sample
width was chosen to obtain a network composed of several dendrites. The single crystal
orientation was chosen as shown by the reference frame displayed in Fig. 1b, i.e. with <100>
crystallographic directions perpendicular to the sample faces. The sample was housed in a
crucible made of dense alumina C799 (99.7 wt.% purity). It consisted of two plates maintained
together by molybdenum clips with a 0.3 mm deep slot in one of the plates to accommodate the
sample. The sample-crucible assembly was installed on a graphite holder connected to a
graphite rod with a motorized translation device. The directional solidification furnace is
composed of two heating zones made of graphite heaters that can reach up to 1800 °C in a
secondary dynamical vacuum environment at a pressure around 10-4 mbar. The temperatures of
the heating zones are regulated by two pyrometers with an accuracy of ± 0.1 °C. In the
experiments described here, the temperature of the top “hot” zone was set to 1475 °C and the
temperature of the bottom “cold” zone was set to 1255 °C, which corresponds to a temperature
difference ∆𝑇𝑝𝑦𝑟𝑜 = 220 °C. The vertical distance between the two pyrometers was ∆𝑧𝑝𝑦𝑟𝑜 =
5 cm. The average longitudinal temperature gradient applied by the furnace was 𝐺𝐹 =
∆𝑇𝑝𝑦𝑟𝑜/∆𝑧𝑝𝑦𝑟𝑜 = 44 °C∙cm-1.
Melting/solidification cycles were applied to the sample while keeping constant the
temperature gradient between the heaters. Upward directional solidification was triggered after

9
partial melting of the sample by decreasing the temperatures of the two heaters at the same
cooling rate. The temperatures of both heaters were recorded during every cooling, stabilization
and heating steps (Fig. 2). The temperature recordings were checked after the experiments and
no fluctuations above the accuracy of the pyrometers were noticed. The cooling rate values
considered in the present study are 𝑅1 = −2 °C∙min-1, 𝑅2 = −4 °C∙min-1 and
𝑅3 =−8.3 °C∙min-1.
Synchrotron X-radiography was used to visualize in-situ and in real-time the evolution of
the solidification front. The X-ray beam energy was set to 40 keV using a double Si(111)
monochromator. This energy value ensured enough transmission of the X-rays through the
sample, as well as a satisfactory contrast between the solid and liquid phases. Radiographs were
recorded on a sCMOS pco.edge 5.5 camera [44]. The optics were chosen to provide a pixel size
of 6.6 µm 6.6 µm and a field of view of 9.9 mm 9.9 mm (Fig. 1a). The time intervals
between two successive images were 0.1, 0.25 and 0.5 seconds for the cooling rates of −8.3, −4
and −2 °C∙min-1, respectively. It is worth noting that the distance between the sample and the
camera was approximately 8 meters. This large distance induced phase contrast in the images
[45], especially at the edges between the solid and the liquid regions. Phase contrast was used
to facilitate the visualization of the microstructure, since previous investigations have shown
that a low absorption contrast is expected for this alloy [35,36].

10
2.2. Image processing
The legibility of the raw images is made difficult by several spurious artefacts and required
the application of image processing procedures as illustrated in Fig. 3. Among the artefacts, one
can mention the variation of the X-ray beam intensity profile in time and space, and the surface
defects of the silicon crystals of the monochromator (Fig. 3a). A common image processing
used to remove these artefacts is to apply a flat-field correction using a reference image
recorded just before applying the cooling rate [28]. This procedure was not successful in
correcting the radiographs in a satisfactory manner because the graphite rod used to insert the
sample in the furnace was contracting during the temperature decrease. This contraction
induced a slight and gradual upward motion of the sample in the field of view that reached
approximately 60 µm during a whole solidification experiment. The resulting misalignment
between the images of the sample during cooling and the reference image used for the flat-field
correction lead to a detrimental decrease of the image legibility.
Two complementary procedures were devised with the image processing software ImageJ
[46]. In the first process, the images of the sample were aligned to compensate for the upward
motion. The best results were obtained using the TurboReg plugin for ImageJ, which is a sub-
pixel registration algorithm developed by Thévenaz et al. [47]. Then, a flat-field correction was
applied with a reference image recorded just before applying the cooling rate (Fig. 3b). The
resulting images clearly displayed the growth microstructure but also additional striated

11
contrasts (horizontal black and white lines) corresponding to monochromator defects that were
no longer properly corrected (Fig. 3c).
The aligned images were also used for the second process and a frame differencing
procedure was applied. Frame differencing is a well-known technique used in computer vision
where the computer enlightens the differences between two video frames, for example to
highlight movements. In the present case, it was possible to reveal changes in the solidification
microstructure by dividing (or subtracting) an image by a previous one [48] (Fig. 3d). The offset
between the two images was chosen so that the amount of solid that was formed during the time
interval was clearly distinguished in the top part of the mushy zone (black dendritic structures
Fig. 3e). An overlay of the current and previous microstructures is also visible in the bottom
part. With this second image processing, gray-level variations in the liquid phase became visible
as shown by the white arrows in Fig. 3e. These gray-level variations correspond to changes in
composition due to solute rejection. Hence, the visualization of solutal convective flow ahead
of the dendrite network was made possible. To summarize, the frame differencing procedure
implemented with the ImageJ software [46] consisted of the following steps:
• Aligning all raw images with the first image by using the TurboReg plugin [47].
• Differencing successive frames with a constant offset.
• Choosing the offset so that the features of interest do not superimpose on the resulting images.
Despite the difficulty in interpreting the images obtained by frame differencing, the
visualization of convective flow and the correction of the monochromator defects make it a

12
valuable procedure to study the solidification of materials having a low absorption contrast
between their constitutive elements.
3. Results
3.1. Onset of thermo-solutal flow
An initially still solid-liquid interface was positioned at the bottom of the field of view by
partially melting the sample from the top and then by stabilizing for approximately 2 hours
between each experiment (Fig. 2). We will first focus on the experiment performed with a
cooling rate 𝑅1 = −2 °C∙min-1 and for which the influence of convective flow on the growth
process was the most noticeable (Supplementary Movie 1). The initial solid-liquid interface is
shown on a raw image in Fig. 4a. The top part of the sample is fully liquid, and the bottom part
is fully solid due to the migration of the solute-rich liquid regions toward the top of the mushy
zone by Temperature Gradient Zone Melting (TGZM) as described by Nguyen-Thi et al. [48,49].
The solid phase appears darker than the liquid phase and the interface is slightly convex. The
curvature of the solid-liquid interface was observed for each experiment. It is caused by a
transversal temperature gradient 𝐺𝑦 from the center to the side of the sample, due to the
complex radiative heat transfer between the furnace and the crucible as well as the different
thermal properties of the liquid, the solid and the crucible. A rough estimation of 𝐺𝑦 can be
made by using the procedure proposed by Bogno et al. [50] in a study of a binary Al-Cu alloy
by X-radiography. The transversal temperature gradient was calculated using 𝐺𝑦 =

13
(ℎ/𝑑) 𝐺𝐹 with ℎ the distance between the highest and lowest levels of the curved front and
𝑑 the corresponding transversal distance. By this means, it was deduced that the transversal
temperature gradient was of the order of 3 °C∙cm-1 toward the left and 5 °C∙cm-1 toward the
right. These values are much lower than the applied longitudinal temperature gradient 𝐺𝐹 =
44 °C∙cm-1.
Solidification was visible shortly after application of the cooling rate. Growth was detected
by the development of a dark layer (Fig. 4b) corresponding to an initial phase of planar growth
without microstructure formation. The striations at larger distances are surface defects from the
silicon crystals of the monochromator that could not be totally corrected due to a technical
glitch that induced a sudden variation of the monochromator position. The light-gray layer
above the growth interface shown in Fig. 4b and measured in Fig. 4c corresponds to the
rejection of light solute elements during solidification. The rejection of light solute elements
reduces the liquid density and consequently the X-ray absorption. The build-up of the solutal
layer lasted for about 150 seconds and small cellular structures developed with a primary
spacing of approximately 50 µm. Then, the solutal layer destabilized to form 4 solute plumes
(Fig. 4d) with a maximum height ranging from 1 to 2 mm before vanishing. The low gray level
dynamic and important noise in the images prevented preliminary attempts to use optical flow
approaches as carried out by Boden et al. [16]. However, a rough estimation of the ascending
velocity was obtained by manually measuring the displacement of contour lines defined for a
given brightness between two positions of the plumes. Measurements gave velocity values of

14
the order of 25 to 35 µm∙s-1 with an error of 0.6 µm/s. It is worth noting that the solute plumes
were moving upward but also slightly toward the left. Growth was inhibited in the areas just
below the plumes due to the local accumulation of solute, as shown by the white arrows
numbered 1 to 4 in Fig. 4d.
Columnar dendritic microstructures were well developed after approximately 200 s (Fig. 5a)
and the solute plumes were not visible anymore. The solidification front exhibited no-dendrite
regions, as shown by the dashed white arrows in Fig. 5a, where the plumes were previously
observed (Fig.4d). Later, new plumes developed above the already well-developed dendrites
(plain arrows in Fig. 5b). The plumes overtook the dendrites because their ascending velocity
was higher than the dendrite growth velocity. The local accumulation of solute slowed the
growth of the well-developed dendrites and the previously lagging structures caught up with
the top of the solidification front.
The columnar dendrites kept on developing by successive deceleration and acceleration
periods correlated with the formation of plumes but also with the lateral drift of the plumes
from right to left (Fig. 5c). This drift velocity was measured manually and was of the order of
10 µm∙s-1 to 20 µm∙s-1 with an error of 0.6 µm/s. Concomitantly, a long solute plume
developed on the left side of the sample (vertical white arrow in Fig.5c and in Fig. 5d),
indicating that a large convective loop was formed in the sample.
When the solidification front reached the top of the field of view, the growth pattern was
composed of a columnar dendrite network with continuous formation of solute plumes drifting

15
toward the left side of the sample, where a vertical segregated channel was formed. It is worth
noting that a vertical channel was also formed on the right-hand side, but much thinner.
The same sequence was observed during the experiment with the cooling rate 𝑅2 =
−4 °C∙min-1 leading to a similar growth pattern as can be seen on Supplementary Movie 2,
except that the first plumes appeared when the interface was already destabilized, the plume
height was smaller (about 0.5 mm) with a slower drift velocity (about 5 to 10 µm∙s-1), and thin
vertical channels were formed on both sides of the sample. For the highest cooling rate 𝑅3 =
−8.3 °C∙min-1, no solute plumes were observed above the solidification front, and only thin
vertical channels developed on the sides of the sample as can be seen on Supplementary Movie
3.
3.2. Influence of cooling rate on dendrite growth
The growth microstructure when the solidification front reached approximately two thirds
of the field of view is shown in Fig. 6 for the three cooling rates. An average primary spacing
𝜆1 = 330 µm, 317 µm and 290 µm was measured for the cooling rates 𝑅1 = −2 °C∙min-1,
𝑅2 = −4 °C∙min-1 and 𝑅3 = −8.3 °C∙min-1, respectively. The dendrites on the left side and on
the right-hand side of the sample have different morphologies, which means that the sample is
made of two slightly misoriented sub-grains although a single crystal sample was originally
targeted. Measurement of the misorientation between the growth directions of the grains gave
a value of about 7°. A similar misorientation value was obtained by post-mortem EBSD
(Electron BackScatter Diffraction) analysis. The corresponding pole figures of both grains are

16
shown in Fig. 6c. The different growth orientation of the dendrites was therefore due to the
different crystallographic orientation of the sub-grains with respect to the temperature gradient
direction.
The position of a central dendrite tip (white arrows in Fig. 6) was measured as a function
of time for each experiment (Fig. 7, first row). The error on the position depends on the pixel
size and was 6.6 µm. The growth velocities were calculated from the tip positions (Fig.7,
second row) with a systematic error of 0.6 µm/s. Average gray values were also measured in
a 130 µm by 130 µm square box, centered 130 µm above the tip (Fig.7, third row). The
brightness could not be directly converted into concentration values by using an adapted Beer-
Lambert law [28,29] because a monochromatic beam was used to visualize a multi-component
alloy. However, gray-level variations in the liquid phase were representative of the change in
density and composition. A brightness increase corresponds to an enrichment of the liquid in
light solute elements, allowing a qualitative interpretation of the impact of solute concentration
variations on the dendrite growth kinetic.
It is visible in Fig. 7 that solute flow has a significant impact on dendrite growth for the
cooling rates 𝑅1 = −2 °C∙min-1 and 𝑅2 = −4 °C∙min-1. In both experiments, the dendrite tip
did not move regularly upward in the field of view, but successively moved upward and then
remained almost still. This trend was evidenced by periodic oscillations in the velocity plots.
The mean period was around 80 seconds for the velocity 𝑅1 , with growth velocity values
oscillating between 25 µm∙s-1 and 0.5 µm∙s-1 and an average growth velocity ⟨𝑉1⟩ = 7.6 µm∙s-

17
1. The oscillation in growth velocity was also observed for the cooling rate 𝑅2 = −4 °C∙min-1
(Fig. 7b). The growth velocity oscillated around an average value ⟨𝑉2⟩ = 15 µm∙s-1 but the
oscillations were progressively damped. Here, the solidification front left the field of view
before a permanent regime was reached. So, it was not possible to determine if the oscillating
regime would have continued or if the solidification front would have reached a constant growth
velocity after a transient stage. The oscillations of the growth velocity were directly correlated
with the gray level variations. The maxima of gray level coincided with the minima of growth
velocity and vice-versa. The gray level variations corresponded to composition variations above
the dendrite tip due to solute flow. So, an increase (resp. decrease) in solute concentration ahead
of the dendrite tip coincided with a decrease (resp. increase) of the growth velocity.
The growth velocity for the cooling rate 𝑅3 = −8.3 °C∙min-1 reached an average value
⟨𝑉3⟩ = 31 µm∙s-1 after a single period of acceleration and deceleration (Fig. 7c), typical of an
overdamped regime. The gray level above the tip rapidly decreased to reach a constant value,
indicating that the composition ahead of the tip remained constant after the transient stage.
Finally, the temperature gradients at the level of the dendrite tips was estimated by using
the relation ⟨𝐺𝑡𝑖𝑝⟩ = 𝑅/⟨𝑉𝑡𝑖𝑝⟩ with ⟨𝑉𝑡𝑖𝑝⟩ the average growth velocity of a dendrite tip.
Temperature gradient values ⟨𝐺1⟩= 44 °C∙cm-1, ⟨𝐺2⟩=44.5 °C∙cm-1and ⟨𝐺3⟩= 45 °C∙cm-1 were
obtained. These close values sustain the fair comparison of the experiments. It is worth noting
that they are also close to the average temperature gradient applied by the furnace 𝐺𝐹 =
44 °C∙cm-1. Further investigations using numerical models are in progress to improve the
18
understanding of the thermal behavior of the experimental device and will be the subject of
future publications.
3.3. Solidification of residual liquid areas
Solute flow developed above the solidification front for the two experiments with the
slowest cooling rates. However, vertical liquid channels were formed along the edges of the
sample even for the fastest cooling rate. A consequence of the liquid channel formation was the
development of residual liquid areas as indicated by the red circles in Fig. 8. The origin of the
residual liquid areas was the local accumulation of solute leading to the dissolution of the
microstructure. The enriched liquid had a lower solidification temperature, and consequently
the residual liquid areas solidified later during the cooling stage.
A sequence of images recorded during the solidification of the liquid area observed on the
left side of the sample during the cooling rate 𝑅1 = −2 °C∙min-1 is shown in Fig. 9. The liquid
area reached a maximum width and height of approximately 0.65 mm and 2.5 mm, respectively.
With time, the microstructure started to slowly protrude in the liquid, as shown in the image
obtained by frame differencing (Fig. 9b). A small equiaxed dendrite was observed during its
fall from the top of the liquid area (white arrow in Fig. 9b). It was not possible to determine
with the current temporal resolution whether the grain nucleated in the liquid phase or
originated from the fragmentation of a columnar dendrite. Then, horizontal dendritic
microstructures grew, and dendrite fragmentations were clearly detected. Unexpectedly, some

19
fragments moved upward (Fig. 9c) and others settled down (Fig 9d) within an interval of a few
seconds. The residual liquid area was eventually filled with small misoriented grains and a
segregated zone was formed next to it, extending diagonally from the middle of the sample
toward the top left of the field of view as can be seen on Supplementary Movie 4 and above the
white arrow in Fig. 9e.
4. Discussion
4.1. Solute plume formation and evolution
The use of synchrotron radiography allowed the visualization of solute plumes to be
performed during the directional solidification of a Ni-based alloy. The first solute plumes
developed because the solutal layer above the solid-liquid interface was inherently unstable.
Solute rejected during solidification formed a layer of light liquid located below a heavier bulk
liquid at nominal composition. The liquid layer destabilization occurred when the buoyancy
force due to the density inversion overcame the fluid inertia, which is limited by the viscosity
and the thermal conductivity of the liquid, as previously explained by Hellawell et al. [14] or
Nguyen-Thi et al. [51].
Another experimental observation is that the first solute plumes moved upward but also
slightly toward the left side of the sample. On first analysis, this plume drift could be due to
convective flow already present in the vicinity of the solid-liquid interface. The transversal
temperature gradient gives rise to a curvature of the solid-liquid interface (Fig.4a) , which can
induce a weak convective flow from the highest position of the interface toward the sides of the
20
sample although not detectable by gray-level variations in the liquid phase [50,52]. However,
such a flow would push the plumes in a direction opposite to the observation (i.e. from the
center to the side, while the plumes are moving from the side toward the center). The origin of
the plume lateral drift can thus be attributed to the fact that the first and largest plume formed
at the highest position of the solid-liquid interface, which was located slightly on the left side
of the sample. This symmetry breaking initiated the development of a convective loop moving
from the right to the left side, eventually leading to the formation of the liquid channel on the
left side of the mushy zone.
4.2. Effect of solute flow on dendrite growth
As reported in section 3.2, the measured primary spacing 𝜆1 decreased from 330 µm to
317 µm and 290 µm when increasing the cooling rate or, equivalently, when increasing the
growth velocity. The relation 1(µm) = 147 (𝐺 𝑉)−0.3384 has been proposed by Bouse and
Mihalisin [53] to predict the primary spacing in Ni-based superalloys and was found to be
applicable to a wide range of superalloys, temperature gradients and solidification velocities.
This relation was also used in numerical simulations investigating the conditions for the
formation of freckle defects [6,8,54]. The calculated values for growth velocities of 7.5, 15 and
31 m∙s-1 are 464 µm, 367 µm and 287 µm, respectively. Recently, Matache et al. [55] directly
measured the evolution of the primary spacing in CMSX-4 superalloy and deduced the relation
1(µ𝑚) = 1865 𝑉−0.25𝐺−0.5 that is appropriate for comparison with directional solidification
21
experiments. The calculated values with this relation and for growth velocities of 7.5, 15 and
31 m∙s-1 are 537 µm, 452 µm and 377 µm, respectively. A good agreement is obtained for the
fastest velocity and significantly higher values are predicted for the two other velocities.
The calculated values were determined from bulk sample analyses and the discrepancy
between the calculated and measured values occurs when the primary spacing is larger than the
sample thickness. This suggests that the microstructure confinement would decrease the
primary spacing. Recent numerical simulations carried out by Tourret et al. [56] using the
Dendrite Needle Network (DNN) model compared directional solidification of dendritic
networks in 2D and 3D configurations. The results showed that a higher primary spacing is in
fact expected for confined configurations in diffusive regime. So, another explanation is
necessary to explain the discrepancy between calculated and experimental values of primary
spacing. As the discrepancy is only observed for the two slowest growth rates, when solute
plumes above the solidification front were visible, it can be attributed to the impact of solute
flow ahead of the dendrite network. The same effect, namely smaller primary spacings
compared to diffusive theories at low growth velocity and with convective flow above the
solidification front, was also reported by Clarke et al. [57] and Yang et al. [58] and is linked to
modifications of the solute field in the solutal layer above the dendrite network by convective
flow.
Concerning the oscillations of the dendrite growth velocity due to solute plume
development as reported in section 3.2 (Fig. 7), the same behavior was reported by Boden et al.

22
in Ga-In alloys [16], Mirihanage et al. in Al-Cu-Si alloys [29], Cao et al. [32] in Sn-Pb alloys.
It was also recently analyzed numerically for superalloy directional solidification by Yang et al.
[58]. The increase in solute concentration above the dendrite tips was due to solute rejection
during solidification. Light solute elements flowed upward faster than the dendrites developed,
and the concentration gradient above the dendrite tips decreased. Consequently, the growth
velocity decreased because the concentration gradient above the dendrite tips is the driving
force for growth during directional solidification. In a similar way, the concentration gradient
increased after dissipation of the solute plume, increasing the growth velocity. After the early
stage of growth, the variations in solute concentration above the dendrite tips were linked to the
lateral drift of the plumes, with the solute concentration increases and the concentration gradient
decreases above the tips following the arrival of a plume.
The oscillation damping for the cooling rate 𝑅2 = −4 °C∙min-1 indicates that convective
flow had less impact on the dendrite growth. It is also worth noting that the initial variation in
growth velocity for the fastest cooling rate 𝑅3 = −8.3 °C∙min-1 is not related to the formation
of solute plumes since none were observed, but as a matter of fact corresponds to the initial
transient of solidification as described by Warren and Langer [59] for diffusive conditions. The
solidification front had to temporarily grow at a higher velocity to catch up the time necessary
to build-up a solutal layer from an initially still interface. This is also an indication that solute
flow did not have time to develop above the solidification front for this cooling rate.

23
4.3. Impact of fluid flow in the mushy zone
The main results of the present experiments are the observation of solute plumes, their
interaction with the columnar dendrites and the formation of residual liquid areas and liquid
channels. These observations suggest that one possible scenario for the formation of spurious
grains, and possibly freckles, is the formation of residual liquid areas on the sample edges and
their subsequent solidification. The latter involves growth of dendrite arms located at the
periphery of the residual liquid areas and their fragmentation due to thermo-solutal convection.
The fragments are transported and can grow, eventually leading to an equiaxed grain structure.
The formation of plumes and liquid channels is due to the interaction of buoyancy and
frictional forces in the liquid. Thus, in a first approach , the Rayleigh number 𝑅𝑎 that is defined
as the ratio of the driving buoyancy force to the retarding frictional force associated with the
permeability of the mush is the dimensionless parameter of choice to characterize these
phenomena [6]. The Rayleigh number in the mushy-zone was calculated based on the definition
proposed by Beckermann et al. [8]:
𝑅𝑎(ℎ) = [(𝑔 �̅�(ℎ) ℎ) (𝛼𝜈)⁄ ][(𝜌𝐿𝑙 − 𝜌𝑙(ℎ)) 𝜌𝐿
𝑙⁄ ] (1)
It is written for a given depth in the mushy zone ℎ. The constants 𝑔, 𝛼 and 𝜈 represents
the gravitational constant (equal to 9.81 m ⋅ s−2), the thermal diffusivity and the kinematic
viscosity, respectively. The 𝛼𝜈 value was 6 ⋅ 10−12 m4 ⋅ s−2 for the nominal composition

24
and the liquidus temperature obtained using the Single Cristal database of JMatPro® software
[43]. This value is close to the value found in reference [8] (i.e., 5 ⋅ 10−12 m4 ⋅ s−2).
Assuming that the longitudinal temperature gradient 𝐺𝑧 is constant in the mushy zone, the
local temperature 𝑇 is computed using the relation 𝑇 = 𝑇𝐿 − 𝐺𝑧 ℎ where 𝑇𝐿 is the liquidus
temperature of the alloy. The relative density of the liquid phase is computed with the ratio:
(𝜌𝐿𝑙 − 𝜌𝑙(ℎ)) 𝜌𝐿
𝑙⁄ (2)
where 𝜌𝐿𝑙 and 𝜌𝑙(ℎ) are the liquid densities at 𝑇𝐿 and at the local temperature 𝑇 ,
respectively. The mean permeability �̅�(ℎ) is computed with the relation:
�̅�(ℎ) = 𝛫0 (1 − 𝜀 �̅�(ℎ))3
𝜀 �̅�(ℎ)2⁄ (3)
where 𝛫0(𝑚²) = 6 ⋅ 10−4 𝜆12 is deduced by correlation with experimental observations in
several nickel base superalloys. Note that the primary spacing only plays a role in computing
the permeability in the present analyses. The experimental primary dendrite arm spacing values
𝜆1 are used and are reported section 3.2. The average volumetric solid fraction 𝜀 �̅�(ℎ) is
evaluated by:
𝜀 �̅�(ℎ) =1
ℎ∫ 𝜀𝑠(𝑦)𝑑𝑦
ℎ
0 (4)

25
where 𝜀𝑠(𝑦) is the solid fraction associated to a depth 𝑦 in the mushy zone. The
solidification path and the liquid density evolution need to be computed. This is done using the
thermodynamic database NI25 provided by ThermoCalc [42] and the Single Cristal database of
JMatPro® software [43], with the Lever-rule and Gulliver-Scheil hypotheses.
The influence of the thermodynamic databases on the Rayleigh number is presented in Fig.
10a for a cooling rate 𝑅1 = −2 °C∙min-1. The plain red and black curves are obtained using the
Lever-rule solidification path with the NI25 and the Single Cristal databases, respectively. The
dashed red and black curves are obtained using the Gulliver-Scheil solidification path with the
NI25 and the Single Cristal databases, respectively. The differences between the curves come
from the very different liquidus and solidus temperatures that are considered, as well as the
solidification path computed from the databases. The main feature to notice is the temperature
range below the liquidus temperature where positive values of the Ra number are obtained due
to liquid density inversion, i.e. positive ratio (𝜌𝐿𝑙 − 𝜌𝑙(ℎ)) 𝜌𝐿
𝑙⁄ . For every case, the Ra number
values increase very rapidly just below the liquidus temperature. This indicate that solute
rejection of light elements close to the solidification front is the driving force for the formation
of solute plumes and to sustain their development as experimentally observed.
The maximum of the Ra curves is higher with the Gulliver-Scheil model and more marked
for the Single Cristal database. For the same cooling conditions and with the Gulliver-Scheil
micro-segregation model, the Ra reaches a maximum value of 5.9∙10-3 for the NI25 database

26
and of 1.8∙10-2 for the Single Cristal database. Although, these values are much smaller than the
threshold value of 0.25 proposed in the literature for the occurrence of segregated channels [8],
the development of a diagonal segregated channel was nevertheless observed experimentally in
the mushy zone (Fig. 9 and Supplementary Movie 3).
The NI25 database predicts a positive Ra for a temperature range of 6 °C below the liquidus
temperature using the Lever-rule and 12 °C using Gulliver-Scheil, whereas the Single Cristal
database a temperature range of 22 °C using the Lever-rule and of 47 °C using Gulliver-Scheil.
In the experiments with a cooling rate 𝑅1 = −2 °C∙min-1, the diagonal segregated channel
formed approximately 20 minutes after the solidification front crossed the same position.
Assuming that the columnar dendrites are growing at a temperature close to the liquidus
temperature, it can be deduced that the segregated channel was formed 40 °C below the liquidus
temperature. Since a positive Ra number is necessary for fluid flow to occur, the calculation
using the Single Cristal database and the Gulliver-Scheil solidification path are therefore in
better agreement with the experimental observation.
Because the temperature gradient is constant for these experiments, the increase of the
cooling rate decreases the primary dendrite arm spacing and the associated mean permeability.
Consequently, the Rayleigh number also decreases when increasing the cooling rate (Fig. 10b).
The present in-situ observations also showed a lower macro-segregation activity for the highest
cooling rates, with the formation of much smaller liquid areas and no segregated channel.
The accurate location of the residual liquid areas and segregated channel is currently

27
difficult to predict without direct simulation of solute flow in the mushy zone. The deformation
of the sample sides, even small, could also impact the solute flow and lead to local segregation
areas. More advanced and direct simulations are therefore necessary to improve the
understanding of how the solid fraction increase in the mushy zone interrupted the solute
feeding of the residual liquid areas, leading to their solidification. Such a phenomenon is also
currently hard to characterize using the present radiography data.
Finally, the fact that dendrites appear darker than the surrounding liquid indicates that they
are denser, which agrees with the downward motion of fragments. However, the concomitant
upward motion of dendrite parts suggests that significant fluid flow developed in the residual
liquid area while solidifying, with enough intensity to transport the fragments. Again,
simulations of the present solidification process providing they consider the impact of fluid
flow may help to propose a more detailed analysis of the origin of such phenomena in the future.
5. Conclusion
The directional solidification of a CMSX-4 single crystal superalloy was studied in-situ by
synchrotron X-radiography using a high-temperature directional solidification furnace. The
development of solutal flow ahead of the solidification front was directly observed. The initial
stage of solidification was analyzed, and the onset of the convective pattern was described for
different cooling rates. Solute plumes formed above the solidification front at slow growth rates
and liquid channels formed on the sides of the sample for every investigated cooling rates. The

28
impact of solute flow was quantitatively characterized by measuring the position and velocity
of dendrites located at the center of the sample. A periodic oscillation of the growth velocity
was observed at slow growth rate, which did not occur for the fastest growth rate. This behavior
was correlated with the development of solute plumes for the various applied cooling rates. The
formation and solidification of residual liquid areas on the sides of the sample was reported.
Various motions of fragments were observed inside the residual liquid area indicating that solute
flow from the surrounding mushy region played a role in the formation of spurious grains and
possibly in channels of equiaxed grains forming the freckle defect.
It was also determined that, despite the inherent merits of a Rayleigh number criterion to
evaluate the formation of segregated channels, its calibration highly depends on the material
and on the thermodynamic properties. Effect of thermodynamic databases was shown, and the
maximum value computed for the Rayleigh number remains very low compared to the critical
value reported in the literature. Among other limitations, a criterion based on the Rayleigh
number can only hardly be extended to account for complicated geometries and non-directional
heat flow. Direct numerical simulations are to be targeted to get a better understanding of the
effect of the fluid flow on the structure and segregation patterns, to predict the location of
residual liquid area formation, segregation channels and, possibly, freckles. The challenge not
only lies in coupling three-dimensional thermo-hydraulic and thermo-solutal simulations with
microstructure formation, but also multicomponent solidification paths with thermodynamic
databases. Furthermore, coupling needs to be achieved while simulating the entire directional

29
solidification process as heat and mass transfers are highly dependent on time evolving
boundary conditions. Achieving complementary in-situ observations would certainly be
invaluable for the validation of such direct numerical simulations.
Acknowledgements
This study was funded by SAFRAN Tech (Gennevilliers, France). The financial support of
the French National Space Agency (CNES) and the technical support from the ESRF (Grenoble,
France) members E. Boller, V. Fernandez, A. Rack, and J. P. Valade is also acknowledged.
Appendix A. Supplementary data
Supplementary data related to this article can be found at (link to supplementary material)
References
[1] T.M. Pollock, S. Tin, Nickel-Based Superalloys for Advanced Turbine Engines: Chemistry,
Microstructure and Properties, J. Propuls. Power. 22 (2006) 361–374.
https://doi.org/10.2514/1.18239.
[2] S.M. Copley, A.F. Giamei, S.M. Johnson, M.F. Hornbecker, The origin of freckles in
unidirectionally solidified castings, Metall. Trans. 1 (1970) 2193–2204.
https://doi.org/10.1007/BF02643435.
[3] P. Auburtin, S.L. Cockcroft, A. Mitchell, Liquid Density Inversions During the
Solidification of Superalloys and Their Relationship to Freckle Formation in Castings, in:
Superalloys 1996 Eighth Int. Symp., TMS, 1996: pp. 443–450.
https://doi.org/10.7449/1996/Superalloys_1996_443_450.
[4] J.A. Dantzig, M. Rappaz, Solidification: Methods, Microstructure and Modelling, EPFL
Press, 2009.
[5] R. Mehrabian, M. Keane, M.C. Flemings, Interdendritic fluid flow and macrosegregation;
influence of gravity, Metall. Mater. Trans. B. 1 (1970) 1209–1220.
https://doi.org/10.1007/BF02900233.

30
[6] J.C. Ramirez, C. Beckermann, Evaluation of a rayleigh-number-based freckle criterion for
Pb-Sn alloys and Ni-base superalloys, Metall. Mater. Trans. A. 34 (2003) 1525–1536.
https://doi.org/10.1007/s11661-003-0264-0.
[7] P.B.L. Auburtin, Determination of the influence of growth front angle on freckle formation
in superalloys, University of British Columbia, 1998.
[8] C. Beckermann, J.P. Gu, W.J. Boettinger, Development of a freckle predictor via rayleigh
number method for single-crystal nickel-base superalloy castings, Metall. Mater. Trans. A.
31 (2000) 2545–2557. https://doi.org/10.1007/s11661-000-0199-7.
[9] D. Ma, A. Bührig-Polaczek, The Geometrical Effect on Freckle Formation in the
Directionally Solidified Superalloy CMSX-4, Metall. Mater. Trans. A. 45 (2014) 1435–
1444. https://doi.org/10.1007/s11661-013-2088-x.
[10] D. Ma, A. Bührig-Polaczek, The Influence of Surface Roughness on Freckle Formation in
Directionally Solidified Superalloy Samples, Metall. Mater. Trans. B. 43 (2012) 671–677.
https://doi.org/10.1007/s11663-012-9691-x.
[11] A. Saad, C.-A. Gandin, M. Bellet, Temperature-based energy solver coupled with tabulated
thermodynamic properties – Application to the prediction of macrosegregation in
multicomponent alloys, Comput. Mater. Sci. 99 (2015) 221–231.
https://doi.org/10.1016/j.commatsci.2014.12.009.
[12] A. Saad, C.-A. Gandin, M. Bellet, N. Shevchenko, S. Eckert, Simulation of Channel
Segregation During Directional Solidification of In—75 wt pct Ga. Qualitative
Comparison with In Situ Observations, Metall. Mater. Trans. A. 46 (2015) 4886–4897.
https://doi.org/10.1007/s11661-015-2963-8.
[13] S. Akamatsu, H. Nguyen-Thi, In situ observation of solidification patterns in diffusive
conditions, Acta Mater. 108 (2016) 325–346.
https://doi.org/10.1016/j.actamat.2016.01.024.
[14] A. Hellawell, J.R. Sarazin, R.S. Steube, Channel convection in partly solidified systems,
Philos. Trans. R. Soc. Lond. Ser. Phys. Eng. Sci. 345 (1993) 507–544.
https://doi.org/10.1098/rsta.1993.0143.
[15] H. Nguyen-Thi, L. Salvo, R.H. Mathiesen, L. Arnberg, B. Billia, M. Suery, G. Reinhart,
On the interest of synchrotron X-ray imaging for the study of solidification in metallic
alloys, Comptes Rendus Phys. 13 (2012) 237–245.
https://doi.org/10.1016/j.crhy.2011.11.010.
[16] S. Boden, S. Eckert, B. Willers, G. Gerbeth, X-Ray Radioscopic Visualization of the Solutal
Convection during Solidification of a Ga-30 Wt Pct In Alloy, Metall. Mater. Trans. A. 39
(2008) 613–623. https://doi.org/10.1007/s11661-007-9462-5.
[17] S. Karagadde, L. Yuan, N. Shevchenko, S. Eckert, P.D. Lee, 3-D microstructural model of
freckle formation validated using in situ experiments, Acta Mater. 79 (2014) 168–180.
https://doi.org/10.1016/j.actamat.2014.07.002.
[18] N. Shevchenko, O. Roshchupkina, O. Sokolova, S. Eckert, The effect of natural and forced
melt convection on dendritic solidification in Ga–In alloys, J. Cryst. Growth. 417 (2015)

31
1–8. https://doi.org/10.1016/j.jcrysgro.2014.11.043.
[19] H. Nguyen-Thi, G. Reinhart, G. Salloum Abou Jaoude, R.H. Mathiesen, G. Zimmermann,
Y. Houltz, D. Voss, A. Verga, D.J. Browne, A.G. Murphy, XRMON-GF: A novel facility for
solidification of metallic alloys with in situ and time-resolved X-ray radiographic
characterization in microgravity conditions, J. Cryst. Growth. 374 (2013) 23–30.
https://doi.org/10.1016/j.jcrysgro.2013.03.032.
[20] A.G. Murphy, R.H. Mathiesen, Y. Houltz, J. Li, C. Lockowandt, K. Henriksson, G.
Zimmermann, N. Melville, D.J. Browne, XRMON-SOL: Isothermal equiaxed
solidification of a grain refined Al–20 wt%Cu alloy, J. Cryst. Growth. 440 (2016) 38–46.
https://doi.org/10.1016/j.jcrysgro.2016.01.032.
[21] M. Becker, S. Klein, F. Kargl, In-situ solute measurements with a laboratory polychromatic
microfocus X-ray source during equiaxed solidification of an Al-Ge alloy, Scr. Mater. 124
(2016) 34–37. https://doi.org/10.1016/j.scriptamat.2016.06.032.
[22] A.J. Clarke, D. Tourret, S.D. Imhoff, P.J. Gibbs, K. Fezzaa, J.C. Cooley, W.-K. Lee, A.
Deriy, B.M. Patterson, P.A. Papin, K.D. Clarke, R.D. Field, J.L. Smith, X-ray Imaging and
Controlled Solidification of Al-Cu Alloys Toward Microstructures by Design, Adv. Eng.
Mater. 17 (2015) 454–459. https://doi.org/10.1002/adem.201400469.
[23] O. Ludwig, M. Dimichiel, L. Salvo, M. Suéry, P. Falus, In-situ three-dimensional
microstructural investigation of solidification of an Al-Cu alloy by ultrafast x-ray
microtomography, Metall. Mater. Trans. A. 36 (2005) 1515–1523.
https://doi.org/10.1007/s11661-005-0243-8.
[24] J.W. Gibbs, K.A. Mohan, E.B. Gulsoy, A.J. Shahani, X. Xiao, C.A. Bouman, M. De Graef,
P.W. Voorhees, The Three-Dimensional Morphology of Growing Dendrites, Sci. Rep. 5
(2015) 11824. https://doi.org/10.1038/srep11824.
[25] B. Cai, J. Wang, A. Kao, K. Pericleous, A.B. Phillion, R.C. Atwood, P.D. Lee, 4D
synchrotron X-ray tomographic quantification of the transition from cellular to dendrite
growth during directional solidification, Acta Mater. 117 (2016) 160–169.
https://doi.org/10.1016/j.actamat.2016.07.002.
[26] B. Billia, N. Bergeon, H. Nguyen Thi, H. Jamgotchian, J. Gastaldi, G. Grange, Cumulative
Mechanical Moments and Microstructure Deformation Induced by Growth Shape in
Columnar Solidification, Phys. Rev. Lett. 93 (2004) 126105.
https://doi.org/10.1103/PhysRevLett.93.126105.
[27] G. Reinhart, A. Buffet, H. Nguyen-Thi, B. Billia, H. Jung, N. Mangelinck-Noël, N.
Bergeon, T. Schenk, J. Härtwig, J. Baruchel, In-Situ and Real-Time Analysis of the
Formation of Strains and Microstructure Defects during Solidification of Al-3.5 Wt Pct Ni
Alloys, Metall. Mater. Trans. A. 39 (2008) 865–874. https://doi.org/10.1007/s11661-007-
9449-2.
[28] A. Buffet, H. Nguyen-Thi, A. Bogno, T. Schenk, N. Mangelinck-Noël, G. Reinhart, N.
Bergeon, B. Billia, J. Baruchel, Measurement of Solute Profiles by Means of Synchrotron
X-Ray Radiography during Directional Solidification of Al-4 wt% Cu Alloys, Mater. Sci.
Forum. 649 (2010) 331–336. https://doi.org/10.4028/www.scientific.net/MSF.649.331.

32
[29]W.U. Mirihanage, K.V. Falch, I. Snigireva, A. Snigirev, Y.J. Li, L. Arnberg, R.H. Mathiesen,
Retrieval of three-dimensional spatial information from fast in situ two-dimensional
synchrotron radiography of solidification microstructure evolution, Acta Mater. 81 (2014)
241–247. https://doi.org/10.1016/j.actamat.2014.08.016.
[30] W.U. Mirihanage, K.V. Falch, D. Casari, S. McFadden, D.J. Browne, I. Snigireva, A.
Snigirev, Y.J. Li, R.H. Mathiesen, Non-steady 3D dendrite tip growth under diffusive and
weakly convective conditions, Materialia. 5 (2019) 100215.
https://doi.org/10.1016/j.mtla.2019.100215.
[31] W.U. Mirihanage, L. Arnberg, R.H. Mathiesen, In-situ observation of transient columnar
dendrite growth in the presence of thermo-solutal convection, IOP Conf. Ser. Mater. Sci.
Eng. 33 (2012) 012033. https://doi.org/10.1088/1757-899X/33/1/012033.
[32] F. Cao, F. Yang, H. Kang, C. Zou, T. Xiao, W. Huang, T. Wang, Effect of traveling magnetic
field on solute distribution and dendritic growth in unidirectionally solidifying Sn–
50wt%Pb alloy: An in situ observation, J. Cryst. Growth. 450 (2016) 91–95.
https://doi.org/10.1016/j.jcrysgro.2016.06.034.
[33] H. Yasuda, Y. Yamamoto, N. Nakatsuka, M. Yoshiya, T. Nagira, A. Sugiyama, I. Ohnaka,
K. Uesugi, K. Umetani, In situ observation of solidification phenomena in Al–Cu and Fe–
Si–Al alloys, Int. J. Cast Met. Res. 22 (2009) 15–21.
https://doi.org/10.1179/136404609X368118.
[34] A. Tandjaoui, N. Mangelinck-Noel, G. Reinhart, B. Billia, T. Lafford, J. Baruchel,
Investigation of grain boundary grooves at the solid–liquid interface during directional
solidification of multi-crystalline silicon: in situ characterization by X-ray imaging, J. Cryst.
Growth. 377 (2013) 203–211. https://doi.org/10.1016/j.jcrysgro.2013.05.023.
[35] J.W. Aveson, G. Reinhart, H. Nguyen-Thi, N. Mangelinck-Noël, A. Tandjaoui, B. Billia, K.
Goodwin, T.A. Lafford, J. Baruchel, H.J. Stone, N. D’Souza, Dendrite Bending during
Directional Solidification, in: E.S. Huron, R.C. Reed, rk C. Hardy, M.J. Mills, R.E.
Montero, P.D. Portella, J. Telesman (Eds.), Superalloys 2012, John Wiley & Sons, Inc.,
2012: pp. 615–624.
http://onlinelibrary.wiley.com/doi/10.1002/9781118516430.ch69/summary (accessed
March 31, 2014).
[36] J.W. Aveson, G. Reinhart, C.J.L. Goddard, H. Nguyen-Thi, N. Mangelinck-Noël, A.
Tandjaoui, J.R. Davenport, N. Warnken, F. di Gioacchino, T.A. Lafford, N. D’Souza, B.
Billia, H.J. Stone, On the Deformation of Dendrites During Directional Solidification of a
Nickel-Based Superalloy, Metall. Mater. Trans. A. 50 (2019) 5234–5241.
https://doi.org/10.1007/s11661-019-05429-0.
[37] M.A. Azeem, P.D. Lee, A.B. Phillion, S. Karagadde, P. Rockett, R.C. Atwood, L. Courtois,
K.M. Rahman, D. Dye, Revealing dendritic pattern formation in Ni, Fe and Co alloys using
synchrotron tomography, Acta Mater. 128 (2017) 241–248.
https://doi.org/10.1016/j.actamat.2017.02.022.
[38] A. Tandjaoui, N. Mangelinck-Noël, G. Reinhart, J.-J. Furter, B. Billia, T. Lafford, J.

33
Baruchel, X. Guichard, Real Time Observation of the Directional Solidification of
Multicrystalline Silicon: X-ray Imaging Characterization, Energy Procedia. 27 (2012) 82–
87. https://doi.org/10.1016/j.egypro.2012.07.033.
[39] T. Riberi-Béridot, N. Mangelinck-Noël, A. Tandjaoui, G. Reinhart, B. Billia, T. Lafford, J.
Baruchel, L. Barrallier, On the impact of twinning on the formation of the grain structure
of multi-crystalline silicon for photovoltaic applications during directional solidification, J.
Cryst. Growth. 418 (2015) 38–44. https://doi.org/10.1016/j.jcrysgro.2015.02.024.
[40] M.G. Tsoutsouva, T. Riberi – Béridot, G. Regula, G. Reinhart, J. Baruchel, F. Guittonneau,
L. Barrallier, N. Mangelinck-Noël, In situ investigation of the structural defect generation
and evolution during the directional solidification of 〈110〉 seeded growth Si, Acta Mater.
115 (2016) 210–223. https://doi.org/10.1016/j.actamat.2016.06.004.
[41] K. Harris, J.B. Wahl, Improved Single Crystal Superalloys, CMSX-4 (SLS)[La+Y] and
CMSX-486, in: Superalloys 2004 Tenth Int. Symp., TMS, 2004: pp. 45–52.
https://doi.org/10.7449/2004/Superalloys_2004_45_52.
[42] Thermo-Calc Software AB, NI25: Ni-based alloys and superalloy solutions database,
(2007).
[43] Sente Software Ltd, JMatPro®, Www.Sentesoftware.Co.Uk. (n.d.).
[44] https://www.pco.de/scmos-cameras/pcoedge-55/, (2019).
[45] P. Cloetens, R. Barrett, J. Baruchel, J.-P. Guigay, M. Schlenker, Phase objects in
synchrotron radiation hard x-ray imaging, J. Phys. Appl. Phys. 29 (1996) 133.
https://doi.org/10.1088/0022-3727/29/1/023.
[46] M.D. Abramoff, P.J. Magalhães, S.J. Ram, Image processing with ImageJ, Biophotonics
Int. 11 (2004) 36–42.
[47] P. Thévenaz, U.E. Ruttimann, M. Unser, A pyramid approach to subpixel registration based
on intensity, IEEE Trans. Image Process. Publ. IEEE Signal Process. Soc. 7 (1998) 27–41.
https://doi.org/10.1109/83.650848.
[48] H. Nguyen Thi, G. Reinhart, A. Buffet, T. Schenk, N. Mangelinck-Noël, H. Jung, N.
Bergeon, B. Billia, J. Härtwig, J. Baruchel, In situ and real-time analysis of TGZM
phenomena by synchrotron X-ray radiography, J. Cryst. Growth. 310 (2008) 2906–2914.
https://doi.org/10.1016/j.jcrysgro.2008.01.041.
[49] H. Nguyen Thi, B. Drevet, J.M. Debierre, D. Camel, Y. Dabo, B. Billia, Preparation of the
initial solid–liquid interface and melt in directional solidification, J. Cryst. Growth. 253
(2003) 539–548. https://doi.org/10.1016/S0022-0248(03)01041-8.
[50] A. Bogno, H. Nguyen-Thi, A. Buffet, G. Reinhart, B. Billia, N. Mangelinck-Noël, N.
Bergeon, J. Baruchel, T. Schenk, Analysis by synchrotron X-ray radiography of convection
effects on the dynamic evolution of the solid–liquid interface and on solute distribution
during the initial transient of solidification, Acta Mater. 59 (2011) 4356–4365.
https://doi.org/10.1016/j.actamat.2011.03.059.
[51] H.N. Thi, B. Billia, H. Jamgotchian, Influence of thermosolutal convection on the
solidification front during upwards solidification, J. Fluid Mech. 204 (1989) 581–597.
https://doi.org/10.1017/S0022112089001904.

34
[52] M.H. Burden, D.J. Hebditch, J.D. Hunt, Macroscopic stability of a planar, cellular or
dendritic interface during directional freezing, J. Cryst. Growth. 20 (1973) 121–124.
https://doi.org/10.1016/0022-0248(73)90125-5.
[53] G.K. Bouse, J.R. Mihalisin, 4 - Metallurgy of Investment Cast Superalloy Components, in:
J.K. Tien, T. Caulfield (Eds.), Superalloys Supercompos. Superceram., Academic Press,
1989: pp. 99–148. https://doi.org/10.1016/B978-0-12-690845-9.50010-5.
[54] M.C. Schneider, J.P. Gu, C. Beckermann, W.J. Boettinger, U.R. Kattner, Modeling of
micro- and macrosegregation and freckle formation in single-crystal nickel-base superalloy
directional solidification, Metall. Mater. Trans. A. 28 (1997) 1517–1531.
https://doi.org/10.1007/s11661-997-0214-3.
[55] G. Matache, D.M. Stefanescu, C. Puscasu, E. Alexandrescu, Dendritic segregation and arm
spacing in directionally solidified CMSX-4 superalloy, Int. J. Cast Met. Res. 29 (2016)
303–316. https://doi.org/10.1080/13640461.2016.1166726.
[56] D. Tourret, A. Karma, A.J. Clarke, P.J. Gibbs, S.D. Imhoff, Three-dimensional Dendritic
Needle Network model with application to Al-Cu directional solidification experiments,
IOP Conf. Ser. Mater. Sci. Eng. 84 (2015) 012082. https://doi.org/10.1088/1757-
899X/84/1/012082.
[57] A.J. Clarke, D. Tourret, Y. Song, S.D. Imhoff, P.J. Gibbs, J.W. Gibbs, K. Fezzaa, A. Karma,
Microstructure selection in thin-sample directional solidification of an Al-Cu alloy: In situ
X-ray imaging and phase-field simulations, Acta Mater. 129 (2017) 203–216.
https://doi.org/10.1016/j.actamat.2017.02.047.
[58] C. Yang, Q. Xu, B. Liu, Study of dendrite growth with natural convection in superalloy
directional solidification via a multiphase-field-lattice Boltzmann model, Comput. Mater.
Sci. 158 (2019) 130–139. https://doi.org/10.1016/j.commatsci.2018.11.024.
[59] J.A. Warren, J.S. Langer, Prediction of dendritic spacings in a directional-solidification
experiment, Phys. Rev. E. 47 (1993) 2702–2712.
https://doi.org/10.1103/PhysRevE.47.2702.
35
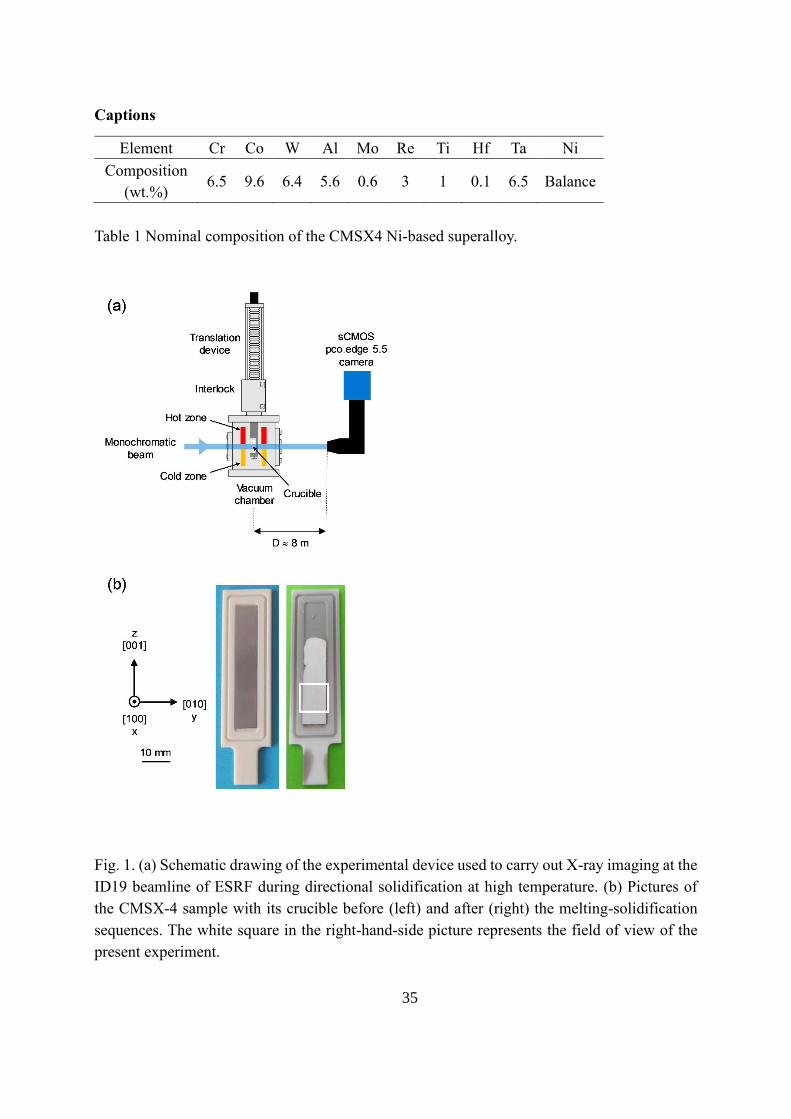
Captions
Element Cr Co W Al Mo Re Ti Hf Ta Ni
Composition
(wt.%) 6.5 9.6 6.4 5.6 0.6 3 1 0.1 6.5 Balance
Table 1 Nominal composition of the CMSX4 Ni-based superalloy.
Fig. 1. (a) Schematic drawing of the experimental device used to carry out X-ray imaging at the
ID19 beamline of ESRF during directional solidification at high temperature. (b) Pictures of
the CMSX-4 sample with its crucible before (left) and after (right) the melting-solidification
sequences. The white square in the right-hand-side picture represents the field of view of the
present experiment.

36
Fig. 2. Experimental temperature profiles recorded during the experiments and showing the
successive cooling, stabilization and heating steps.
Fig. 3. Illustration of the two image processing procedures used to improve the legibility of the
images. (a) Raw image, (b) reference image recorded before applying the cooling rate, (c) result
of the flat-field correction revealing more clearly the growth microstructure, (d) reference
image recorded at a previous time and (e) result of the frame differencing procedure showing
gray-level variations in the liquid phase due to solute rejection. (R = −2 °C∙min-1, GF =
44 °C∙cm-1)

37
Fig. 4. Time sequence of the initial transient showing the solid-liquid interface destabilization.
(a) Raw image with the initial solid-liquid interface in the field of view highlighted by a dashed
line. (b) Image recorded before destabilization and obtained by flat-field correction : the solid
that was formed appears in dark gray and the solutal layer above the solidification front is
visible as a light gray layer and is better revealed by (c) the gray-level profile measured in the
region corresponding to the red arrow in (b). (d) Formation of solute plumes indicated by four
white arrows after destabilization of the solutal layer. (R = −2 °C∙min-1, GF = 44 °C∙cm-1).

38
Fig. 5. Time sequence showing (a) the development of columnar dendritic structures after
destabilization of the solid-liquid interface and (b) the formation of solute plumes above
growing dendrites. The dashed arrows indicate the position of the previous solute plumes visible
in Fig. 3d. Upon solidification of the network of columnar dendrites (c) and (d) the solutal
convective flow propagates in the directions given by the white arrows. (R = −2 °C∙min-1, GF =
44 °C∙cm-1, frame differencing).

39
Fig. 6. Images of the growing dendritic microstructure for the three studied cooling rates (frame
differencing). The white arrows indicate the dendrites whose positions and growth velocities
are measured in Fig. 6.

40
Fig. 7. Time evolution of the tip position in the field of view (top row), the growth velocity
(middle row) and the average gray level (bottom row) in a 130130 µm2 box with its center
located 130 µm above the dendrite tips shown in Fig. 5. The error bars of the position ( 6.6
µm) and velocity ( 0.6 µm/s) values are smaller than the line thickness. The black horizontal
lines in the growth velocity plots correspond to the average velocities and are (a) 7.6 µm/s,
(b) 15 µm/s and (c) 31 µm/s for the cooling rates of (a) −2 °C/min, (b) −4 °C/min and
(c) −8.3 °C/min.

41
Fig. 8. Images showing regions where residual liquid areas were formed after the solidification
front left the field of view (red ellipses). The black areas in the microstructure correspond to
dendrite parts that are in Bragg position for the monochromatic beam energy: these areas locally
diffract the direct X-ray beam and thus no intensity is recorded on the radiographs.

42
Fig. 9. Sequence of close-ups showing the solidification of a residual liquid area on the side of
the sample starting from (a) the time when it reached its largest size. The white arrows in (b)
and (d) indicate the trajectory of dendrite fragments that settled down in the residual liquid area
(frame differencing) while the white arrow in (c) indicates the trajectory of a dendrite fragment
that was transported upward in the residual liquid area (frame differencing). An image recorded
when the sample was fully solidified is shown in (e). The top-left to bottom-right light gray area
corresponds to a region where the microstructure was dissolved, possibly due to convective
flow that developed in the mushy zone and transporting solute rich liquid, leading to local
segregation. (R = −2 °C∙min-1, GF = 44 °C∙cm-1)

43
Fig. 10. Variations of Rayleigh number (a) as a function of the temperature for different
databases and micro-segregation models (R = −2 °C∙min-1). (b) Variations of Rayleigh number
for different cooling rates using the Single Cristal database (SCDb) and Gulliver-Scheil model.