impact of salinity on infant and neonatal mortality in
TRANSCRIPT

Policy Research Working Paper 9058
Impact of Salinity on Infant and Neonatal Mortality in Bangladesh
George JosephQiao Wang
Gnanaraj ChellarajMohammed Shamsudduha
Abu Mohammed Naser
Water Global PracticeNovember 2019

Produced by the Research Support Team
Abstract
The Policy Research Working Paper Series disseminates the findings of work in progress to encourage the exchange of ideas about development issues. An objective of the series is to get the findings out quickly, even if the presentations are less than fully polished. The papers carry the names of the authors and should be cited accordingly. The findings, interpretations, and conclusions expressed in this paper are entirely those of the authors. They do not necessarily represent the views of the International Bank for Reconstruction and Development/World Bank and its affiliated organizations, or those of the Executive Directors of the World Bank or the governments they represent.
Policy Research Working Paper 9058
In this paper, the impact of salinity on maternal and child health in Bangladesh is analyzed using data from the Bangla-desh Demographic Health Surveys. A U-shaped association between drinking water salinity and infant and neonatal mortality is found, suggesting higher mortality when salinity is very low or high. With fresh drinking water, the marginal effect of salinity measured by groundwater elec-tricity conductivity on infant death is always negative. With brackish drinking water and slightly saline water, the nega-tive effect is small. As drinking water becomes moderately
saline, the predicted probability of infant death starts to increase, and the marginal effect becomes and remains positive. The relationship between drinking water salinity and neonatal death shows a similar pattern. Finally, fresh-water with very low concentration of healthy minerals and severely saline water with very high detrimental sodium can be harmful for infant and neonatal health during pregnancy. Severe salinity needs to be addressed if the recent gains in infant and neonatal mortality are to be sustained, especially in the coastal areas of Bangladesh.
This paper is a product of the Water Global Practice. It is part of a larger effort by the World Bank to provide open access to its research and make a contribution to development policy discussions around the world. Policy Research Working Papers are also posted on the Web at http://www.worldbank.org/prwp. The authors may be contacted at [email protected].

Impact of Salinity on Infant and Neonatal Mortality in Bangladesh
George Joseph1, Qiao Wang1, Gnanaraj Chellaraj1, Mohammed Shamsudduha2, Abu Mohammed Naser3
JEL Classification: I15, Q25, Q53
Key words: Bangladesh, Water, Health, Salinity, Mortality
1 World Bank, Washington DC, USA 2 Institute for Risk and Disaster Reduction, University College London, UK 3 Emory Global Diabetes Research Center, Hubert Department of Global Health, Rollins School of Public Health, Emory University, Atlanta, Georgia, USA
2
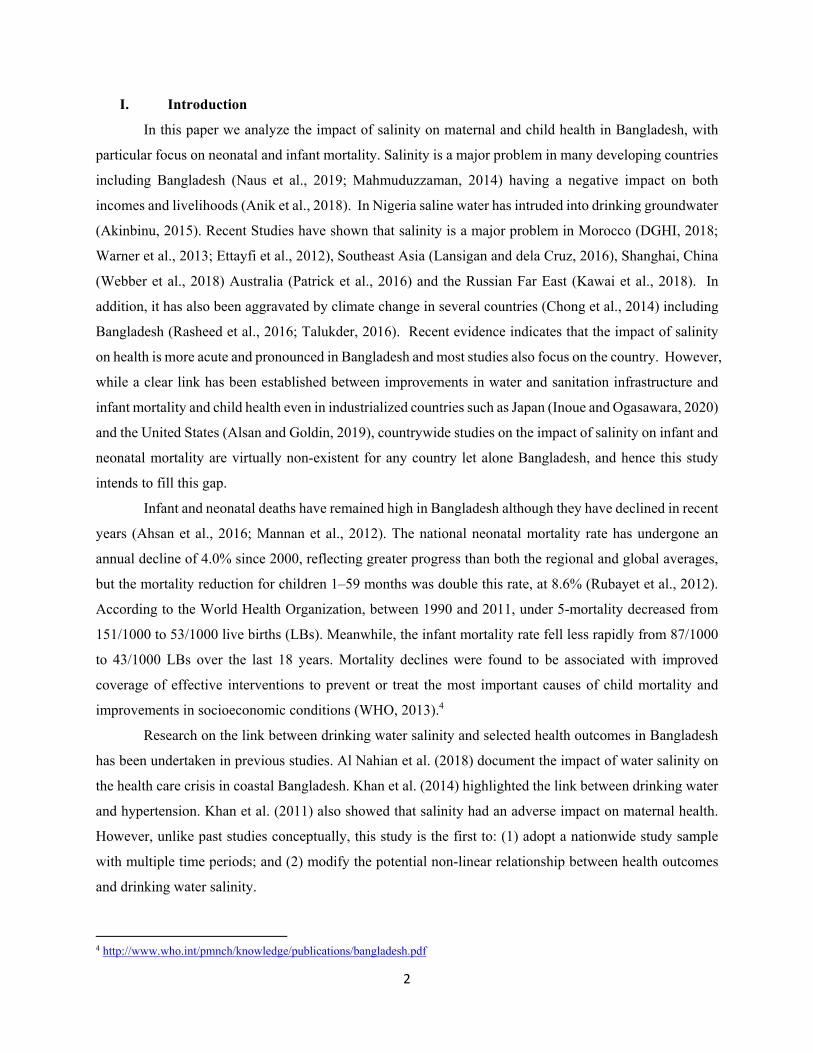
I. Introduction
In this paper we analyze the impact of salinity on maternal and child health in Bangladesh, with
particular focus on neonatal and infant mortality. Salinity is a major problem in many developing countries
including Bangladesh (Naus et al., 2019; Mahmuduzzaman, 2014) having a negative impact on both
incomes and livelihoods (Anik et al., 2018). In Nigeria saline water has intruded into drinking groundwater
(Akinbinu, 2015). Recent Studies have shown that salinity is a major problem in Morocco (DGHI, 2018;
Warner et al., 2013; Ettayfi et al., 2012), Southeast Asia (Lansigan and dela Cruz, 2016), Shanghai, China
(Webber et al., 2018) Australia (Patrick et al., 2016) and the Russian Far East (Kawai et al., 2018). In
addition, it has also been aggravated by climate change in several countries (Chong et al., 2014) including
Bangladesh (Rasheed et al., 2016; Talukder, 2016). Recent evidence indicates that the impact of salinity
on health is more acute and pronounced in Bangladesh and most studies also focus on the country. However,
while a clear link has been established between improvements in water and sanitation infrastructure and
infant mortality and child health even in industrialized countries such as Japan (Inoue and Ogasawara, 2020)
and the United States (Alsan and Goldin, 2019), countrywide studies on the impact of salinity on infant and
neonatal mortality are virtually non-existent for any country let alone Bangladesh, and hence this study
intends to fill this gap.
Infant and neonatal deaths have remained high in Bangladesh although they have declined in recent
years (Ahsan et al., 2016; Mannan et al., 2012). The national neonatal mortality rate has undergone an
annual decline of 4.0% since 2000, reflecting greater progress than both the regional and global averages,
but the mortality reduction for children 1–59 months was double this rate, at 8.6% (Rubayet et al., 2012).
According to the World Health Organization, between 1990 and 2011, under 5-mortality decreased from
151/1000 to 53/1000 live births (LBs). Meanwhile, the infant mortality rate fell less rapidly from 87/1000
to 43/1000 LBs over the last 18 years. Mortality declines were found to be associated with improved
coverage of effective interventions to prevent or treat the most important causes of child mortality and
improvements in socioeconomic conditions (WHO, 2013).4
Research on the link between drinking water salinity and selected health outcomes in Bangladesh
has been undertaken in previous studies. Al Nahian et al. (2018) document the impact of water salinity on
the health care crisis in coastal Bangladesh. Khan et al. (2014) highlighted the link between drinking water
and hypertension. Khan et al. (2011) also showed that salinity had an adverse impact on maternal health.
However, unlike past studies conceptually, this study is the first to: (1) adopt a nationwide study sample
with multiple time periods; and (2) modify the potential non-linear relationship between health outcomes
and drinking water salinity.
4 http://www.who.int/pmnch/knowledge/publications/bangladesh.pdf

3
Salinity is an ambiguous term which is commonly referred to as a high concentration of dissolved
salts in a liquid media (e.g. groundwater). Salinity contamination of groundwater is generally defined by
high concentrations of chemical ions in water that is measured by electrical conductivity (EC).5 The EC is
a measure of salt in the water, usually expressed in micro-Siemens per centimeter (µS/cm) or deci-Siemens
per meter (dS/m).6 Salts or other chemicals that dissolve in water can be broken down into positively and
negatively charged ions. These free ions in the water conduct electric current. The concentration of
dissolved ions may affect the taste of water and is measured by EC. The major cations influencing water
salinity are sodium, potassium, calcium, and magnesium (Hem, 1985) – all are essential macro-minerals
for humans needed in bulk daily amounts (Cook, 2013). According to the Environmental Protection Agency
(EPA) some dissolved mineral matter is desirable. High drinking water salinity (i.e., elevated EC) contains
higher concentrations of these minerals in drinking water (Hoque and Butler, 2015; Alfarrah and
Walraevens, 2018; Mahlknecht et. al. 2017; Park et. al. 2012).
Typically, sea-water has an average EC value of ~50,000 µS/cm. EC for fresh groundwater varies
from very low values (<50 µS/cm) to high values (2,000 µS/cm). These values are generally considered
unsuitable for drinking and irrigation. Salinity level in coastal Bangladesh groundwater varies greatly with
an average EC value of 5,500 µS/cm. The level of salinity measured by electricity is classified as follows
(Zahid et al., 2013): fresh, 0-1,000 µS/cm; brackish, 1,000-2,000 µS/cm; slightly saline, 2,000-6,000 µS/cm;
moderately saline, 6,000-20,000 µS/cm; and extremely saline, 20,000-50,000 µS/cm.
Infants and children need a relatively higher volume of water and a high concentration of minerals
considering body weight (Sievers, 2005). About fifty percent of very low birth weight infants who weigh 1
kg at birth and who live for over 28 days will develop bronchopulmonary dysplasia (Caddell, 1996; Seelig,
1980). According to the World Health Organization (WHO), they are especially vulnerable and hence
drinking-water mineral contents need to be stabilized by adding calcium and magnesium, and other minerals
based on regional dietary composition (WHO, 2005). Use of freshwater or low mineral water for drinking,
cooking infant food, and preparing formula-milk can compromise the nutrient intake in infants (Sievers,
2005; WHO, 2005).
This study attempts to fill the research gap by exploiting and combining data that cover a large
sample population from the entire nation with a long temporal span and spatially-matched features. These
5 EC is a measurement of dissolved material in a fluid media (e.g., groundwater) that relates to the ability of the material to conduct electrical current through that media. EC is measured in units called Siemens (S) per unit area (e.g. micro-Siemens per centimeter or µS/cm in short form). Water’s capacity to conduct electricity is directly related to the concentration of ions in the water. The conductive ions come from dissolved salts and many inorganic chemical materials (e.g. chlorides, sulfides and carbonate compounds). Compounds that dissolve into ions are also known as electrolytes. Higher the ions present, higher the conductivity of water. Likewise, the presence of fewer ions makes the water less conductive. 6 1 deci-siemens per meter = 1,000 micro-siemens per centimeter, 1 ds/m = 1,000 µS/cm.

4
data sources include the Bangladesh Demographic and Health Surveys (DHS) conducted from 2000 to 2014.
Households were sampled within primary sampling units (also called clusters) which are geocoded. The
GPS information from the Bangladesh DHS allows us to construct the salinity level in drinking water for
the households located within the clusters.
Our results indicate that there is a strong U-shaped relationship between salinity and infant
mortality. With fresh drinking water, the marginal effect of salinity measured by groundwater electricity
conductivity (GWEC) on infant death is always negative. With brackish drinking water and slightly saline
water, the negative effect is small. As drinking water becomes moderately saline, the predicted probability
of infant death starts to increase, and the marginal effect becomes positive. The marginal impact of salinity
is always positive when above 6ds/m. The relationship between drinking water salinity and neonatal death
shows a similar pattern.
This paper proceeds as follows. In the next section we review the literature that motivates the study.
In Section III we discuss the data used in this study while Section IV discusses methodology. In Section V
we discuss the results and Section VI concludes.
II. Literature Review
Copious literature exists on the determinants of Maternal and Child Health (MCH) as well as infant
and neonatal mortality in Bangladesh. Rubayet et al. (2012) found that declines in neonatal mortality
between 2000 and 2010 could be attributed to increases in coverage of key interventions, such as skilled
attendance at birth and post-natal care, reductions in total fertility and changes in gross national income.
However, other factors such as socio-economic and geographic inequality as well as frequent changes in
government remain major challenges to future progress. It was also found that for participatory women's
groups to have a significant effect on neonatal mortality in rural Bangladesh, detailed attention to program
design and contextual factors, enhanced population coverage, and increased enrollment of newly pregnant
women might be needed (Azad et al., 2010). Implementation of a sector-wide approach improved delivery
of health services which in turn improved infant and neonatal mortality (Ahsan et al., 2016). Another study
(Baqui et al., 2008) found that a home-care strategy to promote a package of preventive and curative
newborn care is effective in reducing neonatal mortality in communities with a weak health system, low
health care use, and high neonatal mortality. Regarding causes of neonatal death, birth asphyxia (52.8%)
was the single largest cause in the early period, while meningitis/sepsis (48.3%) was the single largest
category in the later period (Chowdhury et al., 2010). Similar results were found by Chowdhury et al.
(2009; 2005). Finally, Dancer et al. (2018) showed that male children have a lower chance of survival
relative to female children in Bangladesh during the first year of life. However, none of these studies
focused on the impact of high levels of water salinity on either infant or neonatal mortality.

5
Saline contamination of drinking water has been documented and the risk is increasing with climate
change in Bangladesh (Talukder, 2016; Rasheed et al., 2016; Khan et al., 2008; Vineis et al., 2011) and it
also contributes to internal migration risks (Rakib et al., 2019). Arsenic (Nickson et al., 1998), salinity
(Khan et al. 2011; 2008), and fecal pathogens (Naser et al., 2019a) are major groundwater contaminants in
Bangladesh. Essential macro-minerals influence many biological and enzymatic mechanisms in fetuses and
infants that can in turn influence neonatal and infant mortality (Abrams, 2007). Groundwater in Bangladesh
is predominantly CaHCO3 type but in the coastal region where water is mostly saline, groundwater is
primarily Na-Ca-Mg-HCO3-Cl type (Brammer, 1996). Sediments from different rivers have different
chemical compositions. For example, the River Ganges derived sediments have higher calcium-magnesium
carbonate contents than the sediments of the Rivers Brahmaputra and Meghna (Brammer, 1996). The
concentration of many of these macro-minerals in drinking water is determined by the chemical properties
of rocks and sediments through which groundwater percolates and interacts (Hudson, 2010). Small-scale
variations exist in groundwater chemicals within a short geographical distance in Bangladesh due to high
variability in surface geology and sediment types (Naser et al., 2018). Studies suggest that bioavailability
of essential minerals from drinking water is very high (WHO, 2009), and some population in coastal
Bangladesh can get up to 50% of their daily calcium and magnesium requirement by drinking 2 L of
groundwater (Hoque and Butler, 2015). Groundwater is the primary source of drinking water in rural
Bangladesh, and minerals and chemicals in groundwater have important public health implications (Dhar
et al., 2008; Smith et al., 2000).
The general diet in Bangladesh is low in calcium content (Bromage et al., 2016), and globally,
magnesium concentration in the general diet is declining (Kumssa et al., 2016). Hence, drinking water may
contribute an appreciable proportion of daily calcium and magnesium intake among the Bangladeshi
population, and drinking fresh or low mineral water can contribute to a deficiency of these essential
minerals which can have detrimental health effects. Ur Rahman et al. (2017) found that regarding salinity
the average values of total dissolved solids (TDS), electrical conductivity (EC) and Chloride concentration
(Cl−) were found to be 4044.12 mg/L, 7186.7 μS/cm, and 3143.6 mg/L respectively in Shyamnagar and
2313.60 mg/L, 4390.3 μS/cm, and 1402.1 mg/L respectively in Tala. The result of community perception
reveals that the local population is aware of the safe water scarcity. There is a perception that salinity is the
main reason. Similar results were found regarding community perceptions by Abedin et al. (2014).
Meanwhile, salt in diet is also a major issue in the country (Sakomoto, 2017).
Health consequences of salinity were also documented for coastal Bangladesh ranging from
hypertension to poor maternal health. Salinity increased the risk of gestational hypertension particularly in
the coastal areas (Shammi et al., 2019; Talukder et al., 2016; Scheelbeek et al., 2016; Khan et al., 2014).
In general, salinity adversely affected maternal health in Bangladesh (Khan et al., 2011) and is particularly

6
significant in the last months of pregnancy (Dasgupta et al. 2016). Meanwhile, a randomized trial study in
Southwest coastal Bangladesh showed that water salinity led to poor functioning of kidneys (Naser et al.,
2017) while another study found that it led to higher blood pressure (Naser et al., 2018b). Overall, salinity
also adversely affected incomes and community livelihoods (Anik et al., forthcoming) and also increased
health care costs (Das et al., 2019). A study in coastal Bangladesh found that drinking mild-saline water
was associated with higher urinary concentrations of calcium, magnesium, and sodium compared to
freshwater drinkers (Naser et al., 2017). During the intrauterine and first six months of life, fetuses and
infants depend on their mother for these essential macro-minerals. Babies born to mothers who drink
mildly-saline water during pregnancy have lower neonatal or infant mortality rates (Naser et al., 2019b).
This may be due to the fact that calcium and magnesium peak around 1 mS/cm EC, but their concentrations
do not change after that level is reached with increasing level of EC. Furthermore, studies suggest that
calcium intake of the mother influences the bone, musculoskeletal and cardiovascular system development
(Abrams, 2007; Hacker et al., 2012; Kovacs and Kronenberg, 1997). Low calcium intake is associated with
gestational hypertension (Hofmeyr, 2014), which is an important cause of perinatal mortality. Magnesium
is a co-enzyme and relevant to lung function of the neonates and infants (Caddell, 1996). Magnesium
deficiency can cause bronchial constriction and can be associated with prenatal asphyxia (Seelig, 1980),
one of the leading causes of neonatal death. Studies also suggest that low magnesium intake is associated
with sudden infant death syndrome (Siren, 2017). Therefore, it is biologically plausible that high or low
maternal intake of essential minerals through drinking water can influence neonatal and infant mortality.
Another study (Jabed et al., forthcoming) found that due to the use of saline water, villagers suffered from
several diseases including skin rashes, hair loss, diarrhea, gastric and high blood pressure. Finally, several
studies suggest that mineral and chemical contents of tubewell water affects cardiovascular diseases (Chen
et al., 2009), anemia (Merrill et al., 2012), gestational hypertension (Khan et al., 2014), skin (Ahsan et al.,
2000) and other organ cancers among the Bangladeshi population (Mostafa, 2008).
Outside Bangladesh, salinity is also a problem in several developing countries such as Morocco
(DGHI, 2018; Warner et al., 2013; Etayfi et al., 2012), Nigeria (Akinbinu, 2015), the Bering Strait in the
Russian Far East (Kawai et al., 2018), and China (Webber et al., 2018; Jia et al., 2017), and adoption of
technology such as desalination of water (Williams and Swyngedouw, 2018; Heck et al., 2017) and
harvesting rainwater (Samadar et al., 2014) has been emphasized. Although rainwater harvesting for
drinking purposes has been emphasized (Meza and Scott, 2016), it lacks these minerals until it passes
through the ground (WHO, 2009). Meanwhile, studies on the impact of salinity on health outside
Bangladesh are virtually non-existent except in industrialized countries such as the United States. Salinity
is a major problem associated with chronic diseases in the native communities of Alaska (Thomas et al.,
2016). In Arizona it was associated with high blood pressure and hypertension (Welty et al., 1986). Among

7
the Jewish infants in New York City it was shown that diluting milk formula with tap water containing a
high concentration of sodium will result in the infant being fed a high-salt diet and a spike in blood pressure
(Pomeranz et al., 2002). A meta-analysis of several studies linked salt in drinking water to hypertension
(Talukder et al, 2017). Overall globally, climate change is likely to increase salinity in drinking water and
adversely affect the health of the population in developing countries. It is also likely to negate all the gains
made in recent years (Chong et al., 2014). As mentioned earlier, studies on the impact of salinity on infant
and neonatal mortality in Bangladesh are virtually non-existent and this study intends to fill this gap.
III. Data Sources
(i) Maternal and child health outcomes
Data on maternal and child health outcome indicators were obtained from the 2000, 2004, 2007,
2011 and 2014 Demographic and Health Surveys (DHS) of Bangladesh, which are nationally representative
covering a wide range of indicators on health and nutrition. In this study, we focused on two primary
maternal and child health outcomes: infant mortality and neonatal mortality. Clusters represented the
primary sampling unit for each BDHS year from which representative households were selected for
interviews. Women between 12 and 49 years old from the selected households were interviewed for live
birth and infant and neonatal mortality. The study units for this paper were children who were born within
the three-year window prior to the interview year. Infant death is defined as a baby who died within 12
months after birth, and neonatal death is defined as a baby who died within two months after birth.
(ii) Relevant covariates
Women were also interviewed for the household socioeconomic characteristics of infant and
neonates who died, birth order and maternal age during the time of delivery. Some sociodemographic
variables based on a priori causal knowledge were included as covariates in this study, such as educational
status of both parents, rural or urban residence of households and asset wealth indices calculated by
principle component analysis. Other relevant information collected from each BDHS household survey
were primary source of drinking water, sanitation, geographical division and river basins for the BDHS
clusters.
(iii) Salinity and drinking water
Groundwater EC point data were collected from two sources. First, we collated groundwater EC
data from a monitoring network of 461 boreholes under a regional-scale hydrogeology study conducted in
19 coastal areas by the Bangladesh Water Development Board (BWBD) (Zahid et al., 2013; Zahid et al.,
2016). Secondly, we digitized and georeferenced the contoured map of groundwater EC (Rahman and
Ravenscroft, 2003) for shallow aquifers (<150 m bgl) and extracted EC point data at 102 locations
predominantly in the northern part of Bangladesh. We then interpolated the point EC data (n=563) for the
entire country using the Inverse Distance Weighting (IDW) algorithm in the ArcGIS environment, after

8
which interpolated EC values for each cluster location to get groundwater salinity data for each of the
BDHS clusters were extracted. Groundwater arsenic concentration and groundwater depth point data values
were obtained through the same source and processed by the same interpolation technique.
The geographical distribution of all BDHS clusters from 2000 to 2014 and its categorical salinity
level are shown in Figure 1. There are no official guidelines for drinking water in Bangladesh or worldwide
considering the human health perspective. Hence the water salinity categories defined by FAO were used.
The level of drinking water salinity is color marked at each clusters’ geo-location according to the
classification by the Food and Agriculture Organization (FAO) of the United Nations for irrigation water:
freshwater (EC<0.7 mS/cm), mild-salinity (EC>=0.7 and <2 mS/cm), moderate-salinity (EC>=2 and <10
mS/cm), and severe-salinity (EC>=10 mS/cm). Salinity is clearly higher in the coastal regions than inland.
Barisal division has the highest number of household clusters exposed to severe-salinity (above 10 mS/cm)
while Khulna has the second highest number of household clusters exposed to moderate salinity (above 2
mS/cm). Clusters with high level exposure to salinity in Chittagong and Dhaka are mostly located along
the coast. For the inland divisions, Rangpur, Sylhet, and Rajshahi, household clusters have drinking water
salinity level under 0.7 mS/cm.
IV. Methodology and Statistical Analysis
The BDHS data sets were pooled, and revised sample weights were calculated following de-
normalization of the standard weights. Next, the survey-weighted proportions of neonatal and infant
mortality were computed for each survey year and presented in Table 1 for the period 2000-2014. A general
decline in infant and maternal mortality is noted even as the number of live births increased indicating
overall declines in both infant and maternal mortality rates. Since our key objective is to evaluate the
association between groundwater salinity and neonatal or infant deaths, we restricted the sample to the sub-
population of children from households which reported tubewell as their primary source of drinking water
in every BDHS survey. The distribution of groundwater EC is skewed right (Figure 2). Since the EC data
contained outliers, we winsorized the data at 95th percentile distribution when modeling EC as continuous
exposure.
Non-Parametric Regression (NPR) was utilized to diagnose the functional form for the relationship
between health outcomes and salinity using Stata 15. NPRs have the advantage of estimating mean
outcomes for a given set of covariates without assuming a functional form, thus avoiding errors due to
misspecification. Figures 3 and 4 present mean functions with 95% confidence interval (CI) predicted by
NPR using EC as covariate variable over 1 mS/cm interval with 100 times simulation of bootstrap standard
errors. The mean function of probability of infant and neonatal death show similar non-linearity patterns
over different salinity levels. Groundwater salinity is modeled as a continuous variable, categorical variable
and restricted cubic splines. In continuous exposure models, Ordinary Least Square (OLS) model using EC

9
as a continuous variable was estimated to summarize the average effect of salinity on health outcomes
taking complex survey design into consideration. The continuous independent variable was divided into
categories to summarize the average effects of freshwater, moderate- and severe-saline water drinkers using
a categorical model specification taking complex survey design into consideration. However, the functional
form between the health outcomes and salinity categories is not continuous. It is a step function within
each segment. Rather than transforming the continuous explanatory variables into categories, a third
approach, Restricted Cubic Splines (RCS) model was adopted to provide a flexible and continuous
functional form to capture non-linearity. The number of “cut-off” points (defined as “knots”), is the end of
one segment and the start of the next. If the k number of knots are placed at𝑡 𝑡 ⋯ 𝑡 , then for a
continuous variable x, a set of (k – 1) new variables are created by:
𝑥 𝑥 𝑥 (1)
𝑥 𝑥 𝑥 𝑡 𝑥 𝑡 𝑥 𝑡 (2)
for 𝑖 2, … , 𝑘 1 and where 𝑢 𝑢 𝑖𝑓 𝑢 0; 𝑢 0 𝑖𝑓 𝑢 0
The original continuous explanatory variable was augmented by introducing a set of new variables which
were used linearly in the regression models and inferences can be drawn as usual. The number of knots
and the position of the knots in this analysis were determined by FAO classifications which are 0.7 mS/cm,
2 mS/cm, and 10 mS/cm. Two new variables that were calculated using only the continuous variables EC
and the values of the knots were used in the OLS specification for comparison with other approaches used,
while controlling the same set of covariate variables.
For all models described above, we sequentially reported results for the unadjusted models (model
1), and models partially adjusted for maternal age, birth order and sex of the child (model 2). In addition,
the model was adjusted for maternal marital status, both parents’ years of education, rural or urban residence,
household wealth indices, improved sanitation, depth of tubewells, arsenic concentration in tubewell water,
and geographical division and river basin for the BDHS cluster. Child’s birth year fixed effects were also
included which captured the unobserved characteristics specific to the years when the child was born, to
study the determinants of infant and neonatal mortality.
V. Results
(i) Descriptive statistics
The summary statistics with and without considering complex sample design are shown in Table 2
along with a detailed description of the variables. Among the 22,158 children who were born three years
prior to the year of interview and from households with tubewell as primary source of drinking water, 5.3%
of the children died under 12 months of age and 4.5% of the children died within 2 months after birth. 51%
of the children were male and delivered by mothers with an average age of 23 years. Both parents had less

10
than 5 years of education on average and 98.6% of mothers are currently married or living in a union. Only
16.0% of the children were from households located in urban areas and 29.3% from households with access
to improved sanitation.
(ii) Continuous exposure
Table 3 reports the OLS estimates for infant and neonatal death as outcome variables using groundwater
electrical conductivity as a continuous explanatory variable (columns of (1) – (3) and (4) – (6) respectively).
Holding all other variables constant, with a 1 mS/cm increase in drinking water EC, the probability of infant
and neonatal mortality declines by 0.12% (significant at 10% level) and 0.17% (significant at 1% level)
respectively for model 1 unadjusted with covariates. Gradually controlling for mode covariates, the
coefficient magnitude of EC decreases and becomes insignificant (models 2 and 3). In models 2 and 3,
increase in mother’s age when giving birth and years of education are associated with a significant decline
in the probability of infant and neonatal deaths.
(iii) Categorical exposure
For the categorical model, mild-salinity with EC belonging to [0.7, 2] mS/cm is omitted as
reference group (Table 4). Infants with exposure to freshwater with 0 – 0.7 mS/cm EC had 1.63% more
likelihood of mortality and for neonates the corresponding figure was 1.24 %, compared to those who were
exposed to mild-salinity with 0.7 – 2 mS/cm EC. Infants and neonates who were exposed to severe salinity
with 10 mS/cm above EC had the highest risk of mortality in all cases. Compared to those who were exposed
to mild-salinity, the probability of infant and neonatal death for children who were drinking severely saline
water were 3.12% and 2.20% higher. There was no significant difference between exposure to moderate
salinity 2 – 10 mS/cm and mild salinity. The impact of mother’s education and age was similar to that of
the continuous exposure model.
(iv) Restricted cubic splines (RCS) model
Finally, for the restricted cubic splines model (Table 5), two restricted cubic terms were created
among three knots at 0.7, 2, 10 mS/cm, similar to the categorical exposure model. Both restricted cubic
terms are significant with negative signs for rgwec1 and positive for rgwec2 across unadjusted and fully
adjusted models. This indicates a downward shaping relationship below a certain threshold and an upward
shaping relationship afterwards. The positive summation value of the two restricted terms suggests an
overall positive association between infant or neonatal death and salinity. The p-values reported at the
bottom of the table from Wald test were less than 0.001 in model 1 and 2, and less than 0.05 in model 3.
Thus, the null hypothesis of joint significance of restricted cubic terms is rejected at 1% and 5% levels for
model 3, which indicates strong non-linearity. Again, the relationship between maternal age as well as
mother’s years of education and mortality outcomes was same with the continuous and categorical
specifications.

11
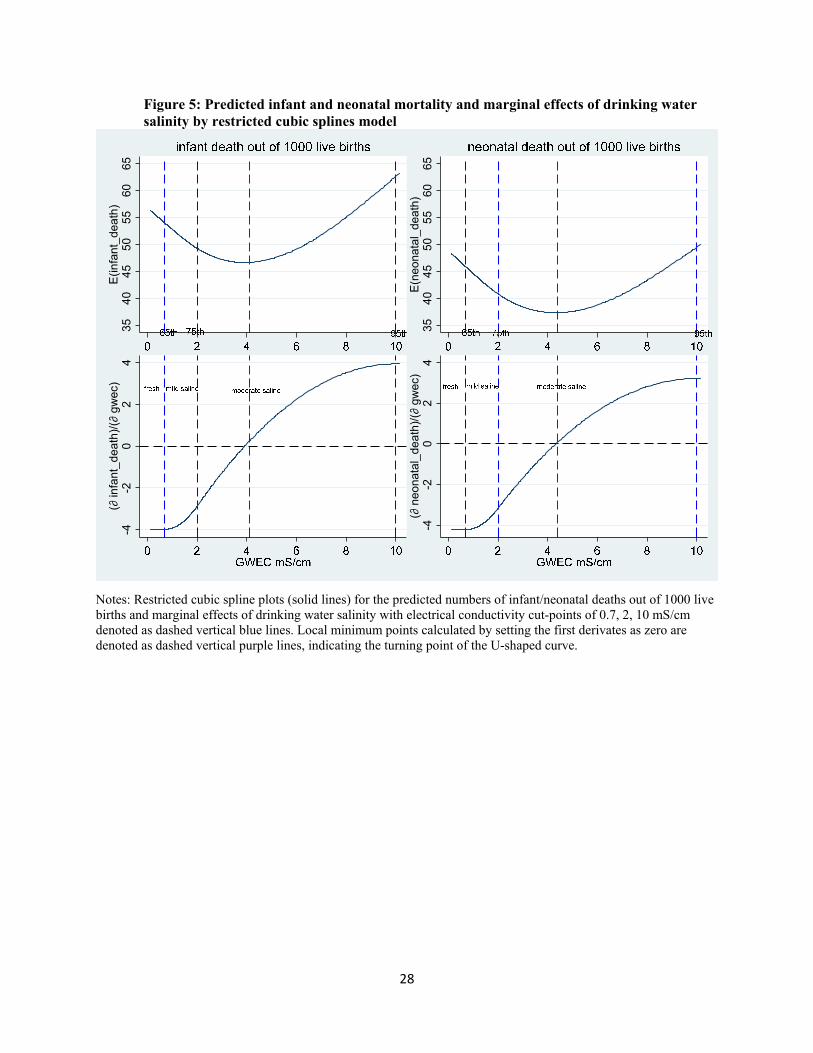
Figure 5 depicts the predicted number of infant and neonatal deaths out of 1,000 live births and
marginal effects of drinking water salinity based on the RCS model with fully adjusted covariates (model
3). The predicted values show a U-shaped curve over the entire range of salinity and the marginal effect of
salinity on infant death is concave, suggesting that infant and neonatal deaths decreased initially and then
increased again with increasing levels of drinking water salinity. As shown in the bottom left figure, with
fresh drinking water (<0.7 mS/cm), the marginal effect of salinity on infant death is always negative, which
can be calculated by the first derivate of outcome with respect to GWEC shown in the Appendix. Drinking
slightly saline water can help to reduce infant mortality because slightly saline water has mostly healthy
mineral concentration and limited sodium concentration relative to freshwater with low concentrations of
salubrious calcium and magnesium (Naser et al., 2019b) As drinking water becomes mildly saline (0.7 – 2
mS/cm) and moderately saline but below 4.11 mS/cm (calculated in Appendix), the negative marginal
effect is decreasing, suggesting that the protective role of drinking saline water is attenuating. As drinking
water becomes moderately saline (above 4.11 mS/cm), the marginal effect becomes positive and increasing,
with associated high infant mortality and high-level EC contributed by high concentration of sodium but
limited concentrations of salubrious calcium and magnesium. Similarly, for neonatal death the bottom right
figure presents a diminishing protective role of drinking water salinity as EC increases below 4.38 mS/cm
but harmful role as EC increases above 4.38 mS/cm. The restricted cubic spline plots illustrate a U-shaped
non-linear association between drinking water EC and infant and neonatal deaths. This is consistent with
the results of categorical exposure version which showed harmful effects for infants and neonates exposed
to freshwater and severely saline water as well as the protecting effects of mild salinity exposure. Calcium
and magnesium peak around 1 mS/cm EC, but their concentrations do not change afterward with increasing
level of EC, which explains why there was lower neonatal or infant mortality among the mild-salinity water
drinkers (Naser et al., 2019b). In contrast, the relationship between groundwater sodium and EC followed
an almost linear upward trend, suggesting severe-saline water drinkers have very high sodium intake. The
concentration of these macro-minerals in drinking water is determined by the chemical properties of rocks
and sediments through which groundwater percolates and interacts (Hudson, 2018).
The number of infant and neonatal deaths based on the RCS model with fully adjusted covariates
(model 3) was predicted with covariates at BDHS cluster means. The first derivative of outcome with
respect to drinking water salinity indicated by EC level predicts the probability of infant or neonatal death
induced by salinity at each cluster for BDHS 2011 and 2014. To estimate population totals based on BDHS
data, the standard weights were de-normalized. The number of live births and predicted infant/neonatal
deaths were calculated as summation of de-normalized cluster values at subdivision levels.
Table 6 lists the number of live births, infant, neonatal deaths and their predicted values induced
by high salinity exposure in coastal subdivisions in BDHS 2011. During the three years prior to the BDHS

12
2011 interview, eight subdivisions in the coastal area had positive predicted number of infant deaths.
Among the 0.13 million infant deaths and 0.11 million neonatal deaths in these high salinity exposure
subdivisions, 3.30% and 3.20% of them were caused by salinity on average respectively. Khulna and
Patuakhali districts has the higherst with 11.93% and 8.36% infant deaths and 9.42% and 10.41% neonatal
deaths respectively caused by high salinity level. During the three years prior to the interview year of
BDHS 2014, six coastal subdivisions were on the list of positive predicted number of infant deaths with
Barisal and Patuakhali districts having 19.76% and 11.71% of infant deaths and 15.38% and 16.33% of
neonatal deaths respectively caused by high salinity exposure. The reason for the dramatic increase in some
subdivisions between the 2011 and 2014 BDHS surveys needs further analysis. Overall, high salinity
exposure induced mortality declined slightly from 1.59% to 1.24% for infants and 1.41% to 1.12% for
neonates.
VI. Conclusions
This study used non-parametric regression without assuming any functional forms to explore the
relationship between drinking water salinity and infant and neonatal deaths. This was followed by three
OLS approaches using salinity as continuous exposure, categorical exposure, and Restricted Cubic Splines
specification. The RCS model specification explained the relationship with a concave shaped curve of
marginal effects and a U-shaped curve of predicted values.
Overall, our findings indicate that both freshwater and severe-saline water are associated with
higher infant and neonatal mortality. There is also a strong U-shaped relationship between salinity and
infant and neonatal mortality, suggesting the harmful effects of freshwater and severe saline exposure, and
protective role of mild salinity on infant and neonatal health across unadjusted and fully adjusted covariate
models. Although overall effects were attenuated in full-multivariable adjustments, the coefficients of
salinity from categorical and RCS models were slightly smaller for neonatal death relative to infant death,
which suggests that larger harmful or protective salinity exposure was channeled through the intake of salty
water by mothers during pregnancy. This may be because mothers had a lower intake of essential minerals
(e.g. calcium and magnesium) through drinking freshwater whereas mothers had excessive concentrations
of sodium through drinking severe-saline water. Both drinking water calcium and magnesium were
associated with lower risks for infant and neonatal mortality. It is plausible that women drinking water with
high EC had higher intake of salubrious essential minerals that have been transferred to the fetus before
birth, or through breast milk during the nursing period. However, drinking water with high levels of salinity
was associated with higher infant and neonatal mortality. The relationship between groundwater sodium
and EC followed an almost linear upward trend, suggesting that severe-saline water drinkers have very high
sodium intake.

13
The results have several policy implications. Severe salinity needs to be addressed if the recent
gains in infant and neonatal mortality are to be sustained. Policies need to be developed to prevent intrusion
of saline water into drinking groundwater, particularly in the coastal areas of Bangladesh. Adoption of
technology such as desalination could be considered. However, rainwater does not contain salubrious
minerals. Hence consumption of groundwater over rainwater should be encouraged. Over the long run, the
causes of increasing salinity such as climate change need to be addressed. Finally, our analysis has several
limitations. We used the FAO salinity definitions for irrigation, as there are no corresponding definitions
of salinity in WHO regulations. There is a need to develop such regulations for drinking water. We also do
not have the information on the exact drinking water salinity for the household survey under BDHS, as this
parameter was not collected as part of the survey. Further, due to lack of data as a proxy variable for drinking
water salinity, we used groundwater EC values from an interpolated map at the national scale which
included groundwater EC data from coastal districts that were installed and sampled by the Bangladesh
Water Development Board. As is evident from the literature, the EC of groundwater may have seasonal
variations and concentrations of other chemicals which result in seasonal and temporal variations in the
host groundwater. The interpolated EC from point data is smooth in spatial distribution because of the
geospatial interpolation method (IDW) applied for mapping. The interpolated EC values may be more or
less than the actual EC values of the tubewell water used by the participants in the BDHS clusters.
Households in rural Bangladesh usually have separate tubewells for drinking water supply, suggesting that
well water chemical concentrations are likely different across the households recorded in BDHS clusters.
Finally, this study relies on self-reported outcomes and covariates that can introduce recall bias in the
analyses. Hence, we were unable to control for important factors determining early neonatal death such as
low birth weight, premature births, birth asphyxia, meningitis, and sepsis. Further research addressing these
issues is needed in the future.
14
Bibliography
Abedin, M.A., Habiba, U. and Shaw, R. 2014. “Community Perception and Adaptation to Safe Drinking Water Scarcity: Salinity, Arsenic, and Drought Risks in Coastal Bangladesh.” International Journal of Disaster Risk Science, 5:110-124.
Abrams S.A. 2007. “In Utero Physiology: Role in Nutrient Delivery and Fetal Development for Calcium, Phosphorus, and Vitamin D–.” The American Journal of Clinical Nutrition, 85:604S-607S.
Ahsan, H., Perrin, M., Rahman, A., Parvez, F., Stute, M., Zheng, Y., et al. 2000. “Associations Between Drinking Water and Urinary Arsenic Levels and Skin Lesions in Bangladesh.” Journal of Occupational and Environmental Medicine, 42:1195-201.
Ahsan, K.A., Streatfield, P.K., E-ljdi, R., Escudero, G.M., Khan, A.W. and Reza, M.M. 2016. “Fifteen Years of Sector-Wide Approach (SWAp) in Bangladesh Health.” Health Policy and Planning, 31: 612-623.
Akinbinu, V.A. 2015. “Delineation of Saline Water Intrusion to Safe-Guide Inland Groundwater Resources.” Ocean and Coastal Management, 116: 162-168.
Al Nahian, M., Ahmed, A., Lazar, A.N., Hutton, C.W., Salehin M., Streatfield, P.K. 2018. “Drinking Water Salinity Associated Health Crisis in Coastal Bangladesh.” https://www.elementascience.org/articles/10.1525/elementa.143/
Alfarrah, N. and Walraevens, K. 2018. “Groundwater Overexploitation and Seawater Intrusion in Coastal Areas of Arid and Semi-Arid Regions.” Water, 10:143.
Alsan, M. and Goldin, C. 2019. “Watersheds in Child Mortality: The Role of Effective Water and Sewerage Infrastructure, 1880 to 1920.” Journal of Political Economy, 127:586-638.
Anik, A.R., Ranjan, R. and Ranganathan, T. 2018. “Estimating the Impact of Salinity Stress on Livelihood Choices and Incomes in Rural Bangladesh.” Journal of International Development, 30:1414-1438.
Azad, K., Barnett, S., Banerjee, B., Shaha, S., Khan, K., Rego, A.R., Barua, S., et al. 2010. “Effect of Scaling up Women's Groups on Birth Outcomes in Three Rural Districts in Bangladesh: A Cluster-Randomized Controlled Trial.” Lancet, 375:1193-1202.
Baqui, A.H., El-Arifeen, S., Darmstadt, G.L., Ahmed, S., Williams, E.K., Seraji, H.R., et al. 2008. “Effect of Community-Based Newborn-Care Intervention Package Implemented Through Two Service-Delivery Strategies in Sylhet District, Bangladesh: A Cluster-Randomized Controlled Trial.” Lancet, 371: 1936-1944.
Brammer, H. 1996. Geography of the Soils of Bangladesh. University Press.
Bromage, S., Ahmed T. and Fawzi W.W. 2016. “Calcium Deficiency in Bangladesh: Burden and Proposed Solutions for the First 1000 days.” Food and Nutrition Bulletin, 37:475-93.
Caddell, J. 1996. “Evidence for Magnesium Deficiency in the Pathogenesis of Bronchopulmonary Dysplasia (BPD).” Magnesium Research, 9:205-16.
Chen, Y, Parvez, F, Gamble, M, Islam, T, Ahmed, A, Argos, M, et al. 2009. “Arsenic Exposure at Low-to Moderate Levels and Skin Lesions, Arsenic Metabolism, Neurological Functions, and Biomarkers for Respiratory and Cardiovascular Diseases: Review of Recent Findings from the Health Effects of Arsenic Longitudinal Study (HEALS) in Bangladesh.” Toxicology and Applied Pharmacology, 239:184-92.
Chong, Y.J., Khan, A., Scheelbeek, P., Butler, A., Bowers, D. and Vineis, P. 2014. “Climate Change and Salinity in Drinking Water as a Global Problem: Using Remote-Sensing Methods to Monitor Surface Water Salinity.” International Journal of Remote Sensing, 35:1585-1599.

15
Chowdhury, H.R., Thompson, S., Ali, M., Yunus, N.A. and Streatfield, P.K. 2010. “Causes of Neonatal Deaths in a Rural Subdistrict of Bangladesh: Implications for Intervention.” Journal of Health, Population and Nutrition 28:375–82.
Chowdhury, M., Ahmed, A., Kalim, N. and Koblinsky, M. 2009. “Causes of Maternal Mortality Decline in Matlab, Bangladesh.” Journal of Health, Population and Nutrition, 27:108–23.
Chowdhury, M.E., Akhter, H.H., Chongsuvivatwong, V. and Geater, A.F. 2005. “Neonatal Mortality in Rural Bangladesh: An Exploratory Study.” Journal of Health, Population and Nutrition 23:16–24.
Cook A. 2013. “Public Health and Geological Processes: An Overview of a Fundamental Relationship.” in Essentials of Medical Geology, O. Selinus (ed.), Springer 15-32,
Dancer, D., Rammohan, A. and Smith, M.D. 2018. “Infant Mortality and Child Nutrition in Bangladesh.” Health Economics, 17:1015-1035.
Das, D.K., Islam, M.S., Hadiujjaman, S., Dutta, C.B. and Morshed, M.M. 2019. “Health Cost of Salinity Contamination in Drinking Water: Evidence from Bangladesh.” Environmental Economics and Policy Studies, 21:371-397.
Dasgupta, S., Huq, M. and Wheeler, D. 2016. “Drinking Water Salinity and Infant Mortality in Coastal Bangladesh.” Water Economics and Policy, 2:1650003.
Dhar, R., Zheng, Y., Stute, M., Van Geen, A., Cheng, Z., Shanewaz, M., et al. 2008. “Temporal Variability of Groundwater Chemistry in Shallow and Deep Aquifers of Araihazar, 2008.” Bangladesh. Journal of Contaminant Hydrology, 99:97-111.
Duke Global Health Institute (DGHI). 2018. “Investigating Salinity and Radioactivity in Water Resources in Morocco.” https://globalhealth.duke.edu/projects/investigating-salinity-and-radioactivity-water-resources-morocco
Ettayfi, N., Bouchaou, L., Michelot, J.L., Tagama, T., Warner, N., Boutaleb, S., Massault, M., et al., 2012. “Geochemical and Isotopic (Oxygen, Hydrogen, Carbon, Strontium) Constraints for the Origin, Salinity, and Residence Time of Groundwater from a Carbonate Aquifer in the Western Anti-Atlas Mountains, Morocco.” Journal of Hydrology, 438:97-111.
Hacker, A.N., Fung, E.B., King, J.C. 2012. “Role of Calcium During Pregnancy: Maternal and Fetal Needs.” Nutrition Reviews, 70:397-409.
Heck, N., Paytan, A., Potts, D.C., Haddad, B. and Petersen, K.L. 2017. “Management Priorities of Seawater Desalination Plants in a Marine Protected Area: A Multi-Criteria Analysis.” Marine Policy, 86: 64-71.
Hem JD. 1985. Study and Interpretation of the Chemical Characteristics of Natural Water. Department of the Interior, US Geological Survey.
Hofmeyr, G.J., Lawrie, T.A., Atallah, A.N., Duley, L. and Torloni, M.R. 2014. “Calcium Supplementation During Pregnancy for Preventing Hypertensive Disorders and Related Problems.” Cochrane Database of Systematic Reviews, June 24:6.
Hoque, M.A. and Butler, A.P. 2015. “Medical Hydrogeology of Asian Deltas: Status of Groundwater Toxicants and Nutrients, and Implications for Human Health.” International Journal of Environmental Research and Public Health, 13:81.
Hudson, T. 2010. Living with Earth: An Introduction to Environmental Geology. Routledge.
Inoue, T. and Ogasawara, K. 2020. “Chain Effects of Clean Water: The Mills-Reincke Phenomenon in Early 20th-Century Japan.” Economics and Human Biology, 36: 100822.

16
Jabed, M.A., Paul, A. and Nath, T.K. Forthcoming. “Peoples’ Perception of the Water Salinity Impacts on Human Health: A Case Study in South-Eastern Coastal Region of Bangladesh.” Exposure and Health.
Jia, Y., Guo, H., Xi, B., Jiang, Y., Zhang, Z., Yuan, R., Yi, W. and Xue, X. 2017. “Sources of Groundwater Salinity and Potential Impact on Arsenic in the Western Hetao Basin, Inner Mongolia.” Science of the Total Environment, 601-602:691-702
Kawai, Y., Osafune, S., Masuda, S. and Komuro, Y. 2018. “Relations Between Salinity in the Northwestern Bering Sea, the Bering Strait Throughflow and Sea Surface Height in the Arctic Ocean.” Journal of Oceanography, 74:239-261.
Khan, A.E., Scheelbeek, P.F.D., Shilpi, A.B., Chan, Q., Mojumder, S.K., Rahman, A., Hainess, A. and Vineis, P. 2014. “Salinity in Drinking Water and the Risk of (Pre)eclampsia and Gestational Hypertension in Coastal Bangladesh: A Case-Control Study.” PLoS ONE 9:1–9.
Khan, A.E., Ireson, A., Kovats, S., Mojumder, S.K., Khurusu, A., Rahman, A. and Vineis, P. 2011. “Drinking Water Salinity and Maternal Health in Coastal Bangladesh: Implications of Climate Change.” Environmental Health Perspectives, 119:328-1332.
Khan, A.E., Mojumder, S.K., Kovats, S., and Vineis, P. 2008. “Saline Contamination of Drinking Water in Bangladesh.” The Lancet, 371:385.
Kovacs, C.S. and Kronenberg, H.M. 1997. “Maternal-Fetal Calcium and 460 Bone Metabolism During Pregnancy, Puerperium, and Lactation.” Endocrine Reviews,18:832-72.
Kumssa, D.B., Joy, E.J., Ander, E.L., Watts, M.J., Young, S.D., Rosanoff, A, et al. 2016. “Global Magnesium Supply in the Food Chain.” Crop and Pasture Science, 66:1278-89.
Lansigan, F.P. and dela Cruz, A.C. 2016. “Water Security in Southeast Asia Region,” in Pahl-Wostl, C., Bhaduri, A. and Gupta, J. (Eds) Handbook on Water Security, Edward Elgar Publishing, pp. 317-331.
Mahlknecht, J., Merchán, D., Rosner, M., Meixner, A. and Ledesma-Ruiz, R. 2017. “Assessing Seawater Intrusion in An Arid Coastal Aquifer Under High Anthropogenic Influence Using Major Constituents, Sr and B Isotopes in Groundwater.” Science of the Total Environment, 587:282-295.
Mahmuduzzaman, M. 2014. “Causes of Salinity Intrusion in Coastal Belt of Bangladesh.” International Journal of Plant Research, 4:8-13.
Mannan, I., Matin, Z., Wall, S.N., Pfizer, A., Mannan, I. and Syed, U. 2012. “Newborn Survival in Bangladesh: A Decade of Change and Future Implications.” Health Policy and Planning, 27:iii40-iii56 (Supp).
Merrill R.D., Shamim, A.A., Ali, H., Labrique, A.B., Schulze, K., Christian, P., et al. 2012. “High Prevalence of Anemia with Lack of Iron Deficiency Among Women in Rural Bangladesh: A Role for Thalassemia and Iron in Groundwater.” Asia Pacific Journal of Clinical Nutrition, 21:416.
Meza, F. and Scott, C.A. 2016. “Secure Water Supply in Water-Scarce Regions,” in Pahl-Wostl, C., Bhaduri, A. and Gupta, J. (Eds) Handbook on Water Security, Edward Elgar Publishing, pp. 239-254.
Mostafa, M.G., McDonald, J.C. and Cherry, N.M. 2008. “Lung Cancer and Arsenic Exposure in Rural Bangladesh.” Occupational and Environmental Medicine, 65:765-768.
Naser AM, Doza S, Rahman M, Ahmed KMU, Gazi MS, Alam GR, et al. 2019a. “Sand Barriers Around Latrine Pits Reduce Fecal Bacterial Leaching into Shallow Groundwater: A Randomized Controlled Trial in Coastal Bangladesh.” Environmental Science & Technology, 53: 2105-2113.

17
Naser, A.M., Wang, Q., Chellaraj, G., Shamsudduha, M. and Joseph, G. 2019b. “Modeling Groundwater Salinity and Neonatal and Infant Mortality from the Bangladesh Demographic Health Survey 2000-2014.” Rollins School of Public Health, Atlanta, Georgia, USA.
Naser, A.M., Higgins, E.M., Arman, S., Ercumen, A., Ashraf, S., Das, K.K., et al. 2018a. “Effect of Groundwater Iron on Residual Chlorine in Water Treated with Sodium Dichloroisocyanurate Tablets in Rural Bangladesh.” American Journal of Tropical Medicine and Hygiene, 98:977-983.
Naser A.M., Rahman M, Unicomb L, Doza S, Uddin MN, Robin RA, et al., (Eds). 2018b. Drinking Water Salinity Categories and Lower Blood Pressure: Evidence from Coastal Bangladesh. ISEE Conference Abstracts.
Naser, A. M., Rahman, M., Unicomb, L., Doza, S., Ahmed, K.M., Uddin, M.N., et al. 2017. “Drinking Water Salinity and Kidney Health in Southwest Coastal Bangladesh: Baseline Findings of a Community-Based Stepped-Wedge Randomized Trial.” Lancet, 389:S15.
Naus, F.L., Schot, P., Groen, K., Ahmed, K.M. and Griffioen, J. 2019. “Groundwater Salinity Variation in Upazila Assasuni (Southwestern Bangladesh), as Steered by Surface Clay Layer Thickness, Relative Elevation and Present-Day Land Use.” Hydrology and Earth System Sciences, 23:1431-1451.
Nickson, R., McArthur, J., Burgess, W., Ahmed, K. M., Ravenscroft, P. and Rahmann, M. 1998. “Arsenic Poisoning of Bangladesh Groundwater.” Nature, 395:338.
Park, Y., Lee, J-Y., Kim, J-H. and Song, S-H. 2012. “National Scale Evaluation of Groundwater Chemistry in Korea Coastal Aquifers: Evidences of Seawater Intrusion.” Environmental Earth Sciences, 66:707-18.
Patrick, M.J., Elsawah, S., Burgher, I. and Jakeman, A.J. 2016. “Australian Water Security: A Water-Food-Environment-Energy Nexus Perspective,” in Pahl-Wostl, C., Bhaduri, A. and Gupta, J. (Eds) Handbook on Water Security, Edward Elgar Publishing, pp. 332-357.
Pomeranz, A., Dolfin, T., Korzets, Z., Eliakim, A. and Wolach, B. 2002. “Increased Sodium Concentrations in Drinking Water Increase Blood Pressure in Neonates.” Journal of Hypertension, 20:203–207.
Rahman, A.A. and Ravenscroft, P. 2003. Groundwater Resources and Development in Bangladesh. University Press.
Rakib, M.A., Sasaki, J., Matsuda, H. and Fukunaga, M. 2019. “Severe Salinity Contamination in Drinking Water and Associated Human Health Hazards Increase Migration Risk in the Southwestern Coastal Part of Bangladesh.” Journal of Environmental Management, 240:238-248.
Rasheed, S., Siddique, A.K., Sharmin, T., Hasan, A.M.R., Hanifi, S.M.A., Iqbal, M. and Bhulya, A. 2016. “Salt Intake and Health Risk in Climate Change Vulnerable Coastal Bangladesh: What Role do Beliefs and Practices Play?” http://journals.plos.org/plosone/article?id=10.1371/journal.pone.0152783
Rubayet, S., Shahidullah, M., Hossain, A., Corbett, E., Moran, A.C., Matin Z., et al. 2012. “Newborn Survival in Bangladesh: A Decade of Change and Future Implications.” Health Policy and Planning, 27: iii40-iii56.
Sakamoto, M. 2017. “Saline Drinking Water and Salt in Diet: An Approximate Picture of the Situation in a Coastal Area of Southeastern Bangladesh.” International Journal of Disaster Risk Science, 8: 109-120.

18
Samadar, S., Murase, M. and Okada, N. 2014. “Information for Disaster Preparedness: A Social Network Approach to Rainwater Harvesting Technology Dissemination.” International Journal of Disaster Risk Science, 5:95-109.
Scheelbeek, P.F.D., Khan, A.E., Mojumder, S., Elliott, P. and Vineis, P. 2016. “Drinking Water Sodium and Elevated Blood Pressure of Healthy Pregnant Women in Salinity-Affected Coastal Areas.” Hypertension, 68:464-470.
Seelig MS. 1980. Magnesium Deficiency in the Pathogenesis of Disease: Early Roots of Cardiovascular, Skeletal, and Renal Abnormalities. Springer Science & Business Media.
Shammi, M., Rahman, M.M., Bondad, S.E. and Bodrud-Doza, M. 2019. “Impacts of Salinity Intrusion in Community Health: A Review of Experiences on Drinking Water Sodium from Coastal Areas of Bangladesh.” Healthcare (Basel), 7:50.
Sievers E. 2005. “Nutrient Minerals in Drinking Water: Implications For the Nutrition of Infants and Young Children.” Chapter 13 in Nutrients in drinking water, World Health Organization, Geneva, Switzerland.
Siren P. 2017. “SIDS–CDF Hypothesis Revisited: Cause vs. Contributing Factors.” Frontiers in Neurology, 7:244.
Smith, A.H., Lingas, E.O. and Rahman, M. 2000. “Contamination of Drinking-Water by Arsenic in Bangladesh: A Public Health Emergency.” Bulletin of the World Health Organization. 78:1093-1103.
Talukder, M.R.R., Rutherford, S., Huang, C., Phung, D., Islam, M.Z. and Chu, C. 2017. “Drinking Water Salinity and Risk of Hypertension: A Systematic Review and Meta-Analysis.” Archives of Environmental & Occupational Health, 72:126–138.
Talukder, M.R.R., Rutherford, S., Phuong, D., Islam, M.Z. and Chu, C. 2016. “The Effect of Drinking Water Salinity on Blood Pressure in Young Adults of Coastal Bangladesh.” Environmental Pollution, 214:248-254.
Talukder, M.R.R. 2016. “Health Risks of Increasing Water Salinity and Water Consumption in Coastal Bangladesh Associated with Climate Change.” Center for Environment and Population Health, Griffith University.
Thomas, T.K., Hickel, K. and Heavener, M. 2016. “Extreme Water Conservation in Alaska: Limitations in Access to Water and Consequences to Health.” Public Health, 137:59-61.
Ur Rahman, T., Rasheduzzaman, M. Habib, M.A., Habib, M.A., Ahmed, A., Tareq, S.M. and Muniruzzaman, S.M. 2017. “Assessment of Fresh Water Security in Coastal Bangladesh: An Insight from Salinity, Community Perception and Adaptation.” Ocean and Coastal Management, 137:68-81.
Vineis, P., Chan, Q. and Khan, A. 2011. “Climate Change Impacts on Water Salinity and Health.” Journal of Epidemiology and Global Health, 1:5-10.
Warner, N.R., Lgourna, Z, Bouchaou, L, Boutaleb, S, Tagma, T, Hsaissoune, M. and Vengosh, A. 2013. “Integration of Geochemical and Isotopic Tracers for Elucidating Water Sources and Salinization of Shallow Aquifers in the Sub-Saharan Drâa Basin, Morocco.” Applied Geochemistry, 34:140-151.
Webber, M., Barnett, J., Finlayson, B. and Wang, M. 2018. “The Risks of Salt Intrusion.” in Water Supply in a Mega-City: A Political Ecology Analysis of Shanghai edited by Webber, M., Barnett, J., Finlayson, B. and Wang, M. (eds), Edward Elgar Publications.

19
Welty TK, Freni-Titulaer L, Zack MM, Weber P, Sippel J, Huete N, Justice J, Dever D and, Murphy MA. 1986. “Effects of Exposure to Salty Drinking Water in an Arizona Community: Cardiovascular Mortality, Hypertension Prevalence, and Relationships Between Blood Pressure and Sodium Intake.” JAMA. 255:622–626.
Williams, J. and Swyngedouw, E. 2018. Tapping the Oceans: Seawater Desalination and the Political Ecology of Water. Edward Elgar Publishing.
World Health Organization (WHO). 2009. Calcium and Magnesium in Drinking-Water: Public Health Significance. Geneva, Switzerland.
World Health Organization (WHO). 2005. Nutrients in Drinking Water. Geneva, Switzerland.
Williams, J. and Swyngedouw, E. 2018. Seawater Desalination and the Political Ecology of Water. Edward Elgar Publishing, Cheltenham, UK.
Zahid A, Rahman A, Hassan M.R. and Ali, M.H. 2016. “Determining 413 Sources of Groundwater Salinity in the Multi-Layered Aquifer System of the Bengal Delta, Bangladesh.” BRAC University Journal, 9:37-51.
Zahid, A., et al., 2013. “Distribution of Groundwater Salinity and its Seasonal Variability in the Coastal Aquifers of Bengal Delta,” in Zahid, A., Hassan, M.Q., Islam, R., Samad, Q.A., Khan, M.S., Haque, R. (Eds.), Impact of Climate Change on Socio-economic Conditions of Bangladesh. Alumni Association of German Universities in Bangladesh, German Academic Exchange Service (DAAD), Dhaka, pp. 170-193.

20
Figure 1: Five years BDHS survey clusters with drinking water salinity (electrical conductivity) levels

21
Table 1: Number of neonatal and infant death analyzed from different Bangladesh Demographic Health Survey
DHS year
2000 2004 2007 2011 2014 Combined
Total number of live birth 5 years prior to interview year 31925 33475 30527 45844 43695 185466
Total number of deaths 5 years prior to interview year Neonatal (died within 2 months after birth) 2549 2421 2005 2688 2390 12053
Infant (died within 1 year after birth) 3529 3288 2664 3481 3053 16015
Number of live birth 3 years prior to interview year 4114 4233 3751 5191 4899 22188 Number of death 3 years prior to interview year Neonatal 215 211 168 213 188 995
Infant 253 267 203 247 213 1183
Number of child deaths 3 years prior to interview year from the households with tuebwell as the primary source of drinking water Neonatal 190 170 153 190 159 862
Infant 224 214 182 222 180 1022

22
Figure 2: Histogram and density plots for groundwater electrical conductivity
Notes: Red vertical lines denote the distributions of electrical conductivity data at 50%ile (median), 75%ile, 90%ile and 95%ile.

23
Figure 3: Non-parametric regression mean function of probability of infant death (GWEC winsorized at 95th percentile)
Figure 4: Non-parametric regression mean function of probability of neonatal death (GWEC winsorized at 95th percentile)
0.0
2.0
4.0
6.0
8M
ean
Fun
ctio
n (p
rob.
infa
nt d
eath
)

24
Table 2: Description of dependent & independent variables Variable Name Description of Variable n=22,158
unweighted weighted
mean std.err. mean std.err. infant death Children died within 12 months after birth 0.053 0.225 0.053 0.002 neonatal death Children died within 2 months after birth 0.045 0.207 0.045 0.002
gwec Groundwater electricity connectivity in mS/cm 1.916 2.747 1.568 0.048 male Child is male 0.510 0.500 0.510 0.004 birth order The birth order of the children 2.493 1.717 2.514 0.021 maternal age at delivery Age of mother when the children was delivered 23.623 5.880 23.444 0.055
mother's years of education Mother's education converted by education level achieved and grade completed into number of years 4.960 4.061 4.637 0.054
partner's years of education Mother's partner's education converted by education level achieved and grade completed into number of years 4.963 4.688 4.499 0.056
mother currently married or living in union Mother currently married or living with a partner 0.985 0.120 0.986 0.001 urban residence Household resides in urban area 0.305 0.460 0.160 0.005
standardized asset indices Asset index computed by Principle Component Analysis using household asset ownership information and standardized at [0, 1] interval 0.267 0.232 0.240 0.003
arsenic Groundwater arsenic concentration in ug/L 62.273 93.576 66.276 2.394 gwd Depth to ground water level in meters 7.282 5.796 7.095 0.093
improved household sanitation Household having access to improved sanitation including septic tank/toilet, water sealed/slab latrine 0.333 0.471 0.293 0.006
Brahmaputra-Jamuna basin Household clusters located within Brahmaputra-Jamuna basin 0.460 0.498 0.449 0.012
Ganges-Padma basin Household clusters located within Ganges-Padma basin 0.486 0.500 0.489 0.010
Meghna basin Household clusters located within Meghna basin 0.055 0.228 0.062 0.007

25
Table 3: Infant and neonatal mortality and drinking water salinity, Continuous (1) (2) (3) (4) (5) (6) Infant Neonatal model 1 model 2 model 3 model 1 model 2 model 3
gwec -0.00122* 0.000521 0.000460 -0.00165*** -0.00000312 -0.0000210 [0.000684] [0.000887] [0.000913] [0.000638] [0.000814] [0.000831]
child male 0.00468 0.00471 0.00539 0.00537 [0.00395] [0.00394] [0.00362] [0.00361]
child birth order 0.00219 -0.000782 0.0000774 -0.00202 [0.00185] [0.00197] [0.00167] [0.00178]
maternal age -0.00147*** -0.00104* -0.00122** -0.000928* [0.000545] [0.000553] [0.000508] [0.000518]
mother's years of education -0.00133** -0.00121* [0.000673] [0.000624]
partner's years of education -0.000779 -0.000315 [0.000542] [0.000515]
mother currently married or living in union
-0.00828 -0.0123 [0.0151] [0.0148]
urban residence -0.00155 -0.00315 [0.00444] [0.00405]
standardized asset index -0.0136 -0.0101 [0.0130] [0.0122]
arsenic -0.0000303 -0.0000193 [0.0000238] [0.0000225]
groundwater depth -0.0000719 0.000322 [0.000655] [0.000633]
improved household sanitation -0.00121 -0.00112 [0.00448] [0.00426]
basin: Ganges-Padma -0.00631 -0.00197 [0.00908] [0.00843]
basin: Meghna -0.0152* -0.0151** [0.00781] [0.00683]
Constant 0.0548*** 0.0945*** 0.121*** 0.0474*** 0.0853*** 0.108*** [0.00237] [0.0148] [0.0235] [0.00223] [0.0138] [0.0223] Birth Year Dummies No Yes Yes No Yes Yes Division Fixed Effects No Yes Yes No Yes Yes R-squared 0.000166 0.00937 0.0111 0.000355 0.00922 0.0105 Obs. 22158 22158 22158 22158 22158 22158
Notes: omitted group of basins is basin: Brahmaputra-Jamuna; model 1: unadjusted (no controls); model 2: adjusted for maternal age, birth order and sex of the child; model 3: additionally adjusted for both parents years of education, rural or urban residence, household wealth score , improved sanitation, maternal marital status, groundwater arsenic level, depth of tubewell, riven basin children's birth year and geographical division fixed effects

26
Table 4: Infant and neonatal mortality and drinking water salinity, Categorical (1) (2) (3) (4) (5) (6) Infant Neonatal model 1 model 2 model 3 model 1 model 2 model 3
freshwater: gwec (0 mS/cm, 0.7 ms/cm]
0.0219*** 0.0176*** 0.0163*** 0.0176*** 0.0132** 0.0124** [0.00470] [0.00601] [0.00606] [0.00456] [0.00571] [0.00569]
moderate salinity: gwec (2 mS/cm, 10 mS/cm]
0.00324 0.00749 0.00625 -0.00196 0.00285 0.00217 [0.00531] [0.00580] [0.00586] [0.00507] [0.00534] [0.00538]
severe salinity: gwec (10 mS/cm, above]
0.0295*** 0.0346*** 0.0312*** 0.0188** 0.0239*** 0.0220** [0.00942] [0.00957] [0.00973] [0.00909] [0.00916] [0.00922]
child male 0.00477 0.00477 0.00545 0.00540 [0.00396] [0.00395] [0.00363] [0.00362]
child birth order 0.00195 -0.000835 -0.000113 -0.00207 [0.00186] [0.00197] [0.00168] [0.00178]
maternal age -0.00145*** -0.00105* -0.00120** -0.000935* [0.000546] [0.000553] [0.000509] [0.000518]
mother's years of education -0.00131* -0.00120* [0.000672] [0.000624]
partner's years of education -0.000787 -0.000320 [0.000543] [0.000515]
mother currently married or living in union
-0.00956 -0.0133 [0.0151] [0.0147]
urban residence -0.00142 -0.00293 [0.00446] [0.00406]
standardized asset index -0.0115 -0.00858 [0.0128] [0.0120]
arsenic -0.00000576 1.44e-08 [0.0000248] [0.0000236]
groundwater depth -0.000142 0.000261 [0.000654] [0.000634]
improved household sanitation -0.000749 -0.000736 [0.00449] [0.00427]
basin: Ganges-Padma -0.00428 -0.000471 [0.00922] [0.00853]
basin: Meghna -0.0127 -0.0133* [0.00781] [0.00682]
Constant 0.0384*** 0.0824*** 0.107*** 0.0341*** 0.0759*** 0.0961*** [0.00386] [0.0144] [0.0233] [0.00382] [0.0134] [0.0221] Birth Year Dummies No Yes Yes No Yes Yes Division Fixed Effects No Yes Yes No Yes Yes R-squared 0.00210 0.0104 0.0119 0.00189 0.00994 0.0110 Obs. 22158 22158 22158 22158 22158 22158
Notes: omitted group of basins is basin: Brahmaputra-Jamuna; model 1: unadjusted (no controls); model 2: adjusted for maternal age, birth order and sex of the child; model 3: additionally adjusted for both parents years of education, rural or urban residence, household wealth score , improved sanitation, maternal marital status, groundwater arsenic level, depth of tubewell, riven basin children's birth year and geographical division fixed effects

27
Table 5: Infant and neonatal death and drinking water salinity, Restricted Splines Model at GWEC = 0.7, 2, 10 mS/cm
(1) (2) (3) (4) (5) (6) Infant Neonatal
model 1 model 2 model 3 model 1 model 2 model 3 rcgwec1 -0.0109*** -0.00694** -0.00611** -0.0104*** -0.00625** -0.00582**
[0.00225] [0.00292] [0.00310] [0.00205] [0.00265] [0.00280] rcgwec2 0.0448*** 0.0317*** 0.0273** 0.0404*** 0.0265*** 0.0241**
[0.00949] [0.0110] [0.0116] [0.00872] [0.0101] [0.0106] child male 0.00462 0.00464 0.00534 0.00530
[0.00395] [0.00394] [0.00362] [0.00361] child birth order 0.00207 -0.000792 -0.0000268 -0.00203
[0.00186] [0.00197] [0.00167] [0.00178] maternal age -0.00144*** -0.00103* -0.00119** -0.000921*
[0.000545] [0.000552] [0.000509] [0.000518] mother's years of education -0.00132** -0.00121*
[0.000673] [0.000623] partner's years of education -0.000770 -0.000306
[0.000542] [0.000515] mother currently married or living in union
-0.00881 -0.0128
[0.0151] [0.0148] urban residence -0.000587 -0.00230
[0.00444] [0.00404] standardized asset index -0.0135 -0.0101
[0.0130] [0.0121] arsenic -0.0000147 -0.00000553
[0.0000245] [0.0000232] groundwater depth -0.000138 0.000263
[0.000655] [0.000634] improved household sanitation -0.00102 -0.000956
[0.00448] [0.00426] basin: Ganges-Padma -0.00505 -0.000849
[0.00907] [0.00843] basin: Meghna -0.0145* -0.0145**
[0.00782] [0.00681] Constant 0.0620*** 0.103*** 0.127*** 0.0539*** 0.0922*** 0.112*** [0.00306] [0.0153] [0.0236] [0.00285] [0.0141] [0.0224] Birth Year Dummies No Yes Yes No Yes Yes Division Fixed Effects No Yes Yes No Yes Yes Wald-test P-value 0.00000246 0.00391 0.0187 0.00000388 0.00843 0.0224 R-squared 0.00133 0.00982 0.0114 0.00146 0.00959 0.0107
Obs. 22158 22158 22158 22158 22158 22158 Notes: omitted group of basins is basin: Brahmaputra-Jamuna; model 1: unadjusted (no controls); model 2: adjusted for maternal age, birth order and sex of the child; model 3: additionally adjusted for both parents years of education, rural or urban residence, household wealth score , improved sanitation, maternal marital status, groundwater arsenic level, depth of tubewell, riven basin children's birth year and geographical division fixed effects
28
Figure 5: Predicted infant and neonatal mortality and marginal effects of drinking water salinity by restricted cubic splines model
Notes: Restricted cubic spline plots (solid lines) for the predicted numbers of infant/neonatal deaths out of 1000 live births and marginal effects of drinking water salinity with electrical conductivity cut-points of 0.7, 2, 10 mS/cm denoted as dashed vertical blue lines. Local minimum points calculated by setting the first derivates as zero are denoted as dashed vertical purple lines, indicating the turning point of the U-shaped curve.
3540
4550
5560
65E
(infa
nt_d
eath
)
3540
4550
5560
65E
(neo
nata
l_de
ath)
-4-2
02
4(∂
infa
nt_d
eath
)/(∂
gw
ec)
-4-2
02
4(∂
neo
nata
l_de
ath)
/(∂
gwec
)

29
Table 6: Coastal subdivisions in BDHS 2011 and 2014 with the infant and neonatal death caused by salinity BD
HS 2011
rank subdivision number of live
births number of
infant deaths
number of infant deaths due to salinity
% infant deaths due to
salinity number of
neonatal deaths
number of neonatal deaths due to salinity
% neonatal deaths due to
salinity 1 Khulna 332,191 5,866.4 700.0 11.93% 5,866.4 552.7 9.42% 2 Patuakhali 83,005 4,111.5 343.8 8.36% 2,594.7 270.2 10.41% 3 Barisal 383,495 23,894.3 1,280.3 5.36% 21,308.5 995.6 4.67% 4 Noakhali 531,940 21,841.8 1,018.6 4.66% 14,699.1 795.1 5.41% 5 Bogra 53,546 5,989.8 233.2 3.89% 4,908.3 187.4 3.82% 6 Chittagong 693,222 23,238.6 572.3 2.46% 17,375.1 448.8 2.58% 7 Faridpur 394,901 24,611.4 195.6 0.79% 24,611.4 145.7 0.59% 8 Comilla 859,255 22,338.4 12.2 0.05% 15,091.6 0.0 0.00%
subtotal 3,331,556 131,892.0 4,356.0 3.30% 106,455.0 3,395.4 3.19%
others* 3,126,269 142,833.5 0.0 0.00% 133,583.0 0.0 0.00% Total 6,457,825 274,725.5 4,356.0 1.59% 240,038.0 3,395.4 1.41%
BDHS 2014
rank subdivision number of live
births number of
infant deaths
number of infant deaths due to salinity
% infant deaths due to
salinity number of
neonatal deaths
number of neonatal deaths due to salinity
% neonatal deaths due to
salinity 1 Barisal 404,238 6,852.7 1,354.0 19.76% 6,852.7 1,053.8 15.38% 2 Patuakhali 157,576 6,318.7 740.2 11.71% 3,617.4 590.7 16.33% 3 Noakhali 482,958 20,594.7 770.5 3.74% 18,434.3 592.6 3.21% 4 Khulna 293,990 19,046.6 449.8 2.36% 17,735.4 347.8 1.96% 5 Faridpur 713,118 36,234.3 311.0 0.86% 36,234.3 233.0 0.64% 6 Chittagong 763,435 43,159.0 301.9 0.70% 27,483.7 233.3 0.85%
subtotal 2,815,316 132,206.0 3,927.5 2.97% 110,357.8 3,051.2 2.76%
others* 4,142,029 183,832.5 0.0 0.00% 162,701.9 0.0 0.00% Total 6,957,345 316,038.5 3,927.5 1.24% 273,059.7 3,051.2 1.12%
Note: * coastal subdivisions that had no salinity induced infant or neonatal mortality

30
Appendix: Restricted Splines Model
Restricted cubic splines are a transformation of an explanatory variable and can be used to not only in
ordinary least square regression, but also logistic regression, Possion regression, general least square etc.
The range of the explanatory variable is divided by segments with knots defining the end of one segment
and the start of the next. If the k number of knots are placed at 𝑡 𝑡 ⋯ 𝑡 , then for a continuous
explanatory variable 𝑥, a set of (k – 1) new variables are created by:
𝑥 𝑥 𝑥 (1)
𝑥 𝑥 𝑥 𝑡 𝑥 𝑡 𝑥 𝑡 (2)
for 𝑖 2, … , 𝑘 1 and where 𝑢 𝑢 𝑖𝑓 𝑢 0; 𝑢 0 𝑖𝑓 𝑢 0. The number of knots and the position
of the knots in this analysis were determined by FAO classifications which are 0.7 mS/cm, 2 mS/cm, and
10 mS/cm. For 𝑘 3, two restricted cubic splines for the continuous GWEC variable will be defined as:
𝑥 𝑥 𝑥 (3)
𝑥 𝑥 𝑥 𝑡 𝑥 𝑡 𝑥 𝑡 (4)
which can be generated by Stata 15 “mkspline2” command. The first derivates of health outcome with
respect to GWEC can be estimated by using the coefficients on the two restricted cubic splines from the
OLS model.
𝑌 𝛽 𝛽 𝑥 𝛽 𝑥 𝑋𝛾 𝛼 𝛿 𝜀 (5)
Where 𝑋 are other important covariate variables including child gender, maternal and HH characteristics,
𝛼 is division fixed effects, 𝛿 is birth year fixed effects and 𝜀 is error term.
(6)
where 𝛽 , 1, 𝛽 ,
and 3 𝑥 𝑡 3 𝑥 𝑡 3 𝑥 𝑡 , with 𝑡 0.7 , 𝑡 2 , and 𝑡
10. Using the estimations from Table 5 Column (3) and setting 0 can get 𝑥 4.109945 mS/cm ≅
4.11mS/cm. Similarly using the estimations from Table 5 Column (6) and setting 0 can get 𝑥
4.382592 mS/cm ≅ 4.38 mS/cm.