impact of residential combustion and transport emissions...
TRANSCRIPT

Contents lists available at ScienceDirect
Atmospheric Environment
journal homepage: www.elsevier.com/locate/atmosenv
Impact of residential combustion and transport emissions on air pollution inSantiago during winter
Andrea Mazzeoa, Nicolás Huneeusa,b,∗, César Ordoñeza, Andrea Orfanoz-Cheuquelafa,Laurent Menutc, Sylvan Maillerc, Myrto Valaric, Hugo Denier van der Gond, Laura Gallardoa,b,Ricardo Muñozb, Rodrigo Donosoe, Maurico Galleguillosa, Mauricio Ossesa,f, Sebastian Tolvettg
a Center for Climate and Resilience Research (CR)2, FONDAP 1511009, Departamento de Geofísica, U. de Chile Blanco Encalada, 2002, Santiago, ChilebDepartamento de Geofísica, Faculdad de Ciencias Físicas y Matemáticas, Universidad de Chile, Santiago, Chilec Laboratoire de Météorologie Dynamique, Ecole Polytechnique, IPSL Research University, Ecole Normale Supérieure, Université, Paris-Saclay, Sorbonne Universités, UPMCUniv Paris 06, Paris, Franced Department of Climate, Air and Sustainability, TNO Utrecht, the NetherlandseUniversidad de Santiago de Chile (USACH), Santiago, ChilefUniversidad Técnica Federico Santa Maria, Santiago, Chileg Escuela de Mecánica, Universidad Tecnológica Metropolitana (UTEM), Santiago, Chile
A R T I C L E I N F O
Keywords:Air qualityPM2.5
NOX
Residential emissionsOn-road emissionsMitigation policies
A B S T R A C T
Santiago (33.5°S, 70.5°W), the capital of Chile, is frequently affected by extreme air pollution events duringwintertime deteriorating air quality (AQ) and thus affecting the health of its population. Intense residentialheating and on-road transport emissions combined with poor circulation and vertical mixing are the main factorsresponsible for these events. A modelling system composed of a chemistry-transport model (CHIMERE) and ameteorological model (WRF) was implemented to assess the AQ impacts of residential and transportation sourcesin the Santiago basin. A two-week period of July 2015 with various days with poor AQ was simulated focusingon the impact on AQ with respect to fully inhalable particles (PM2.5) and nitrogen oxides (NOX). Three emissionscenarios, within the range of targeted reductions of the decontamination plan of Santiago, were tested; namely50% reduction of residential emission, 50% reduction of transport emissions and the combination of both. Anadditional scenario decreasing transport emissions in 10% was carried out to examine whether a linear de-pendence of surface concentrations on changes in emissions exists.
The system was validated against surface and vertically resolved meteorological measurements. The modelreproduces the daily surface concentration variability from the AQ monitoring network of Santiago. However,the model not fully captures the emissions variations inferred from the observations which may be due tomissing sources such as resuspension of dust.
Results show that, during the period studied, although both residential and transportation sources contributeto observed AQ levels in Santiago, reducing transport emissions is more effective in terms of reducing thenumber of days with pollution events than decreasing residential combustion. This difference in impact is largelydue to the spatial distribution of the emission sources. While most of the residential combustion is emitted in theoutskirts of the city, most of the transport emissions occur within the city, where most of the stations from AQmonitoring network of Santiago are located. As can be expected, the largest improvement of AQ in Santiago isachieved by the combined reduction of emissions in both sectors. Sensitivity analysis with 10% reduction intransport emissions reveals a linear behavior between emissions and concentrations for NOX and approximatelinear behavior for PM2.5. The absence of secondary aerosols formation and dust resuspension in the currentsimulation could explain this deviation from linearity for fine particles. Nevertheless, it suggests that the resultscan be used for mitigation policies with emissions reductions below the 50% used in this study.
https://doi.org/10.1016/j.atmosenv.2018.06.043Received 16 December 2017; Received in revised form 20 June 2018; Accepted 28 June 2018
∗ Corresponding author. Center for Climate and Resilience Research (CR)2, FONDAP 1511009, Departamento de Geofísica, U. de Chile, Blanco Encalada, 2002,Santiago, Chile.
E-mail address: [email protected] (N. Huneeus).
Atmospheric Environment 190 (2018) 195–208
1352-2310/ © 2018 Elsevier Ltd. All rights reserved.
T
1. Introduction
During fall and winter period, extreme events of air pollution fre-quently affect the city of Santiago, capital of Chile (33.5°S, 70.5°W,600m a.s.l.), with strong impact on public health (Franck et al., 2014;Mullins and Bharadwaj, 2015). Although the number of these extremeevents and average concentration levels decreased over the last decades(Barraza et al., 2017; Saide et al., 2016; Gallardo et al., 2018), suchevents still occur and they are a matter of public concern. These eventsconsist of high levels of particulate matter (PM10 and PM2.5) reachinghourly concentrations of 400–500 μg/m3 of PM10 and 200–300 μg/m3
of PM2.5.The composition of particulate matter in Santiago has been ana-
lyzed by Carbone et al. (2013) showing the predominance of organics(59%), while nitrate (14%) and ammonium (12%) dominate the non-organic compounds. Barraza et al. (2017) have quantified the con-tribution of emission sectors through a source attribution techniquesuggesting that in 2014, on an annual base, particle composition can betraced back to motor vehicles (37%), industrial sources (19%), coppersmelters (14%), wood burning (12%), coastal sources (10%), and urbandust (3%). During the winter period, PM2.5 contribution from re-sidential combustion increases up to an average of 30% of the totalamount of PM2.5.
A large contribution to PM emissions is represented by residentialheating and road transportation, estimated to emit respectively up to1800 and 2700 tons/year of PM2.5 in the year 2012 (USACH, 2014).These emissions are not evenly distributed throughout the year, espe-cially the residential combustion emissions occur mostly during thewinter season from May to September (Mena-Carrasco et al., 2012).
Air pollution in Santiago is strongly influenced by the complex to-pography surrounding it. The southern Andes (4500m a.s.l.) in the east,the coastal range (1500m a.s.l.) in the west and transversal mountainchains in the north and in the south surround the basin contributing tothe occurrence of poor ventilation conditions. These topographic con-ditions are further strengthened by the influence of the Pacific sub-tropical high pressure system leading to poor ventilation and limitedvertical mixing (Muñoz and Alcafuz, 2012). Moreover, thermal inver-sions are often intensified by recurrent sub-synoptic weather patternsknown as coastal lows and described by Rutllant and Garreaud (1995)and Garreaud et al. (2002). These conditions prevent the dispersion ofpollutants (Garreaud and Rutllant, 2003) leading to accumulation ofgases (CO, NOX and VOCs) and aerosols (PM10 and PM2.5) (Villaloboset al., 2015; Gramsch et al., 2006, 2014; Gallardo et al., 2002; Saideet al., 2011).
Since 2000, several numerical models have been applied with dif-ferent approaches in Chile to study air quality. The first studies werefocused on the relationship between emissions of CO, NOX, SOX andPM10 and their impact on Santiago's air quality (Jorquera, 2002a; b;Gallardo et al., 2002; Olivares et al., 2002; Schmitz, 2005). More recentworks have focused on forecasting PM2.5 concentrations in Santiagousing CO as a tracer (Saide et al., 2011, 2016) while others have madepredictions of hourly average concentrations of PM2.5 in downtownSantiago based on statistical approaches (Perez et al., 2000; Pérez andGramsch, 2016).
A natural next step is to use numerical models simulating simulta-neously both particulate matter and gaseous pollutants in order to havea complete description of their formation and dispersion patterns in theSantiago basin.
The aim of this work is to set-up a chemistry and transport model(CTM) for the Santiago region and to assess the impact of potentialreduction of residential combustion and/or transport emissions of PM2.5
and NOX on Santiago's air quality. These emissions scenarios, explainedin Section 2.4, are within the range of the emissions reduction targetedin the current decontamination plan for Santiago from the Ministry ofthe Environment (MMAplan, 2014). In particular, the plan provides forsignificant emission reductions in the transport and residential sector.
For the former, this will be achieved by progressive passage of publicand private vehicles to more modern “EURO” engine versions whereasfor the latter, a ban on the use of wood for combustion in the entiremetropolitan region and the progressive transition to other types offuels (e.g. electricity, natural gas) is envisaged as well as the replace-ment of current stoves by more efficient and cleaner ones.
The paper is organized as follows: Section 2 describes the mainfeatures of the modelling system, the different observations used toevaluate its performance and gives a short description of the air qualityconditions observed during the simulated period. In Section 3 we pre-sent the validation of the modelling system, the dispersions patternswithin the Santiago basin and the assessment of the impact of reducingresidential combustion and/or road transport emissions. Finally, themain conclusions are presented in Section 4.
2. Methodology
In this work we use the Weather Research and Forecasts Model(WRF), version 3.7.1 (Skamarock et al., 2008), with the CTM CHIMERE,version 2014b (Menut et al., 2013), to simulate the winter period from15th to 28th of July 2015. The period has been chosen on one handbecause of the high concentrations of PM2.5 observed during these daysand, on the other hand, because of vertical atmospheric measurementsavailable for those days due to a campaign conducted in Santiago. A listof the configurations adopted for each model is provided in Table 1.The evaluation of the modeling system is done by assessing first themeteorological model (Section 2.2) and then the CTM (Section 2.3).Both models are evaluated against available surface and profile ob-servations. Model performance is assessed through standard statistics:mean bias, root mean square error (RMSE) and Pearson correlationcoefficient (R). Normalized versions of the mean bias and RMSE (MNBand NRMSE, respectively) are used to evaluate WRF's performance toreproduce surface and profile observations (Monteiro et al., 2007;Vautard et al., 2007; Borrego et al., 2008). Finally, different emissionsscenarios for Santiago are tested with the modelling system (Section2.4).
2.1. Observations
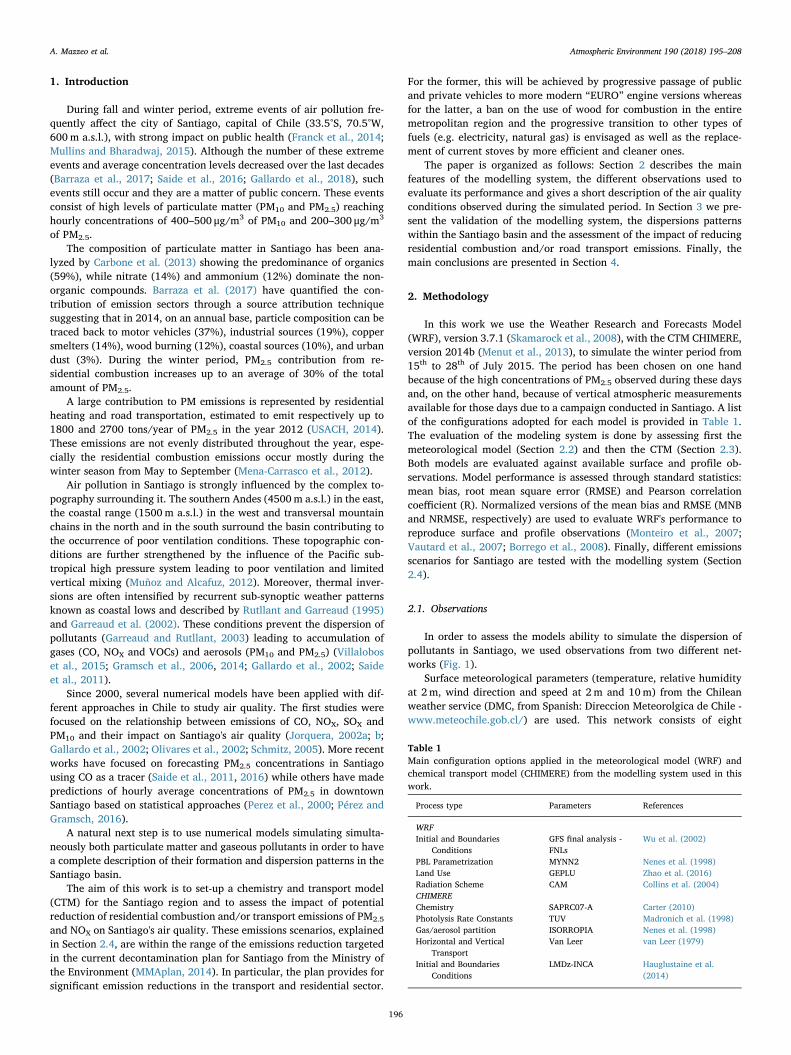
In order to assess the models ability to simulate the dispersion ofpollutants in Santiago, we used observations from two different net-works (Fig. 1).
Surface meteorological parameters (temperature, relative humidityat 2m, wind direction and speed at 2m and 10m) from the Chileanweather service (DMC, from Spanish: Direccion Meteorolgica de Chile -www.meteochile.gob.cl/) are used. This network consists of eight
Table 1Main configuration options applied in the meteorological model (WRF) andchemical transport model (CHIMERE) from the modelling system used in thiswork.
Process type Parameters References
WRFInitial and Boundaries
ConditionsGFS final analysis -FNLs
Wu et al. (2002)
PBL Parametrization MYNN2 Nenes et al. (1998)Land Use GEPLU Zhao et al. (2016)Radiation Scheme CAM Collins et al. (2004)CHIMEREChemistry SAPRC07-A Carter (2010)Photolysis Rate Constants TUV Madronich et al. (1998)Gas/aerosol partition ISORROPIA Nenes et al. (1998)Horizontal and Vertical
TransportVan Leer van Leer (1979)
Initial and BoundariesConditions
LMDz-INCA Hauglustaine et al.(2014)
A. Mazzeo et al. Atmospheric Environment 190 (2018) 195–208
196

stations in Santiago as well as the surrounding areas of the city. Five ofthem, the closest to the city, have been used in the present work.
The Ministry of Environment (MMA, from Spanish: Ministerio delMedio Ambiente) operates and maintains an air quality network ofeleven stations in Santiago measuring continuously the surface con-centrations of various air pollutants as well as standard meteorologicalparameters (http://sinca.mma.gob.cl). This network provides hourlyconcentrations of sulfur dioxide (SO2), nitrogen oxides (NO, NO2 andNOX), carbon monoxide (CO), ozone (O3), and particulate matter PM10
and PM2.5 (Gramsch et al., 2006). Surface meteorological data are alsoused in this study with 2m temperature and relative humidity, 10mwind speed and direction.
In addition to measurements from both networks, vertical mea-surements of temperature, relative humidity and wind speed at down-town Santiago from a monitoring campaign from the 18th to the 26th ofJuly are also used in the present study (Huneeus, 2017). During thiscampaign a tethered balloon was launched up to an altitude of 1000ma.g.l every 3 h and a radiosonde was also launched daily at 5:00 p.m.(local time) at the DMC site (Fig. 1).
Finally, ceilometer (Vaisala CL31) data providing the vertical dis-tribution of aerosols are also used in this study. This instrument hasbeen operating continuously since March 2007 on the roof of theDepartment of Geophysics of the University of Chile (site DGF - Fig. 1)and provides mean profiles of range-corrected attenuated backscatterevery 4–8 s with vertical resolution of 20m (Muñoz and Undurraga,2010).
2.2. Meteorological model WRF
WRF is a numerical weather prediction system designed for atmo-spheric simulations (Skamarock et al., 2008). It is used for research andfor multiple operational applications simulating across scales from tensof meters to thousands of kilometers. The model has been developedwith the collaboration of the National Oceanic and Atmospheric Ad-ministration of U.S. (NOAA - http://www.noaa.gov/) that currently
uses it for regional forecasts analysis 5 days ahead and by weatheragencies all over the world with thousands of users (Powers et al.,2017).
The general set-up of WRF follows the choices described in Saideet al. (2016) for the Planetary Boundary Layer (PBL) scheme and initialand boundary conditions summarized in Table 1. The MYNN2(Nakanishi and Niino, 2004) PBL scheme has been applied with 24levels below 1000m and 22 up to the highest level at 50 hPa. Initial andboundary conditions adopted in this work are from GFS final analysis(Wu et al., 2002). Also, in order to obtain a more realistic snow coverfor the Santiago basin in winter, a spin-up simulation of 30 days hasbeen performed.
A high-resolution (30m) land use map has been developed by theGeomatics and landscape ecology Laboratory (GEP) of the University ofChile based on Landsat Imagery from 2014 (Zhao et al., 2016) (hereafterGEPLU). This map has been aggregated to the model resolution andadapted to the MODIS classification of 20 levels of land use categories andused in all the simulations performed by WRF. Sensitivity tests wereconducted assessing the performance for different PBL schemes, surfacemodel and longwave radiation scheme (not shown). Based on the results,the Rapid Radiative Transfer Model (RRTM) scheme (Mlawer et al., 1997)used in Saide et al. (2016) was replaced with the CAM (Collins et al.,2004) longwave radiation scheme. A summary of the parameters adoptedfor WRF configuration is found in Table 1.
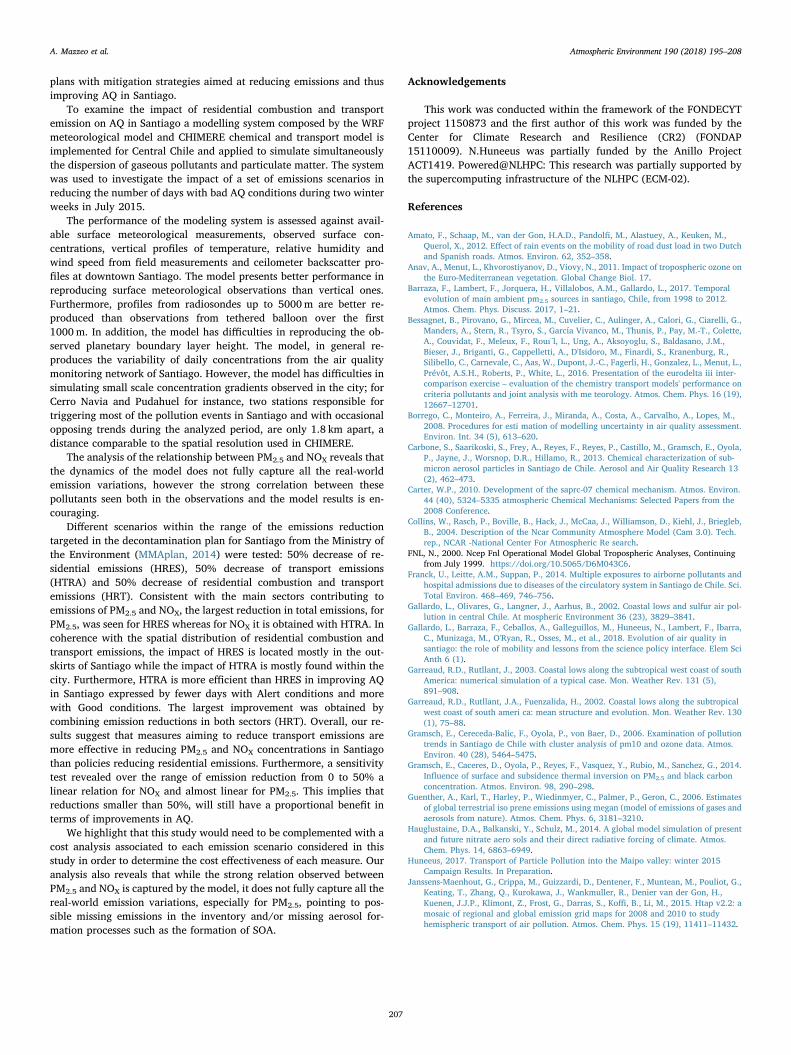
A system of three nested-domains was implemented in WRF with aresolution of 18 km (hereafter STGO1), 6 km (hereafter STGO2) and2 km (hereafter STGO3) with the inner domain centered on the city ofSantiago (Fig. 2). The size of STGO1 has been chosen to resolve theregional meteorology while STGO2 and STGO3 have been chosen inorder to represent central Chile and the Metropolitan Region of San-tiago (MR), respectively. The inner domain (STGO3) includes thecomplex topography of the basin including the Andean Cordillera to theeast and the Coastal Range to the west, as well as neighboring cities ofValparaiso on the coast (33.0°S, 71.6°W) and Rancagua to the south(34.2°S, 70.7°W).
Fig. 1. Location of the eleven stations from the airquality monitoring network of Santiago (red dots):Cerrillos (CRR), Cerro Navia (CRN), El Bosque (ELB),Independencia (IDP), La Florida (LFD), Las Condes(LCD), Pudahuel (PDH), Puente Alto (PTO),O'Higgins (OHG), Quilicura (QLC) and Talagante(TLG). In addition the location of the five stationsfrom the Chilean weather service (blue dots) is alsoincluded: Lo Pinto (LPT), Lo Prado (PRD), San Pablo(SPB), El Paico (EPC), San Jos (SJS). Finally, locationof the Ceilometer at the DGF (yellow dot) and teth-ered balloon and radiosonde at DMC site (green dot)are also indicated. (For interpretation of the refer-ences to colour in this figure legend, the reader isreferred to the Web version of this article.)
A. Mazzeo et al. Atmospheric Environment 190 (2018) 195–208
197

Finally, the NCEP-FNL Operational Model Global TroposphericAnalysis data (FNL, 2000) have been used for lateral boundary condi-tions for the coarse domain STGO1 while a two-way-nesting approach
has been adopted for the inner domains (STGO3 and STGO2). Thisapproach permits to provide boundary conditions for the inner domainsas calculated by their respective parent domain (STGO3 two-way-nested with STGO2 and STGO2 with STGO1) at every time step.
2.3. Atmospheric chemistry model CHIMERE
CHIMERE, version 2014b, is an eulerian off-line three-dimensionalCTM able to reproduce the gas-phase chemistry, aerosols formation,transport and deposition (Menut et al., 2013). The model has been usedin several research applications and inter-comparison studies on ozoneand inhalable particles (PM10) from the continental scale (Zyryanovet al., 2012; Bessagnet et al., 2016), to the urban scale (Vautard et al.,2007; Van Loon et al., 2007). Furthermore, it is used for pollution eventanalysis, scenario studies (Markakis et al., 2015), operational forecastsas well as for impact studies of pollution on health (Valari and Menut,2010) and vegetation (Anav et al., 2011).
The configuration adopted in this work for CHIMERE uses initialand boundary conditions from a global three-dimensional chemistry-climate model (LMDz-INCA, Hauglustaine et al.(2014)), both for gas-eous and for aerosols species (Table 1). No relevant sources are up-windand outside of the larger domain (Saide et al., 2011) and therefore nomajor impact is expected on the model performance to simulate con-centration from the choice of the boundary conditions. The completechemical mechanism applied in all simulations is SAPRC07-A (Carter,2010). The mechanism permits the description of more than 275 re-actions of 85 different species. For the particle/gases partitioning ofsemi-volatile inorganic species, the thermodynamic equilibrium modelISORROPIA (Nenes et al., 1998) is used. Finally, horizontal and verticaldiffusion schemes are calculated using the Van Leer scheme (van Leer,1979).
A three day spin-up period has been applied in order to favour thestabilization of the model to the initial and boundary conditions. Thedomains chosen for CHIMERE are the intermediate domains used forWRF: STGO2 nested with STGO3.We underline that the size of thelargest domain, STGO2, was defined to include the possible recircula-tion processes at regional and local level. A vertical resolution of 20pressure levels is applied with a top pressure layer at 300 hPa (ap-proximately 9000m) and 11 vertical levels in the first 2000 m. Thethickness of the layers increases exponentially from the first level at30m up to 200m after which a constant thickness is considered.
2.4. Emissions
The anthropogenic emission inventory used in this work is a com-bination of a local inventory for the Metropolitan Region (hereafterUSACH; de Santiago USACH (2014)) and the global inventoryHTAPv2.2 (Janssens-Maenhout et al., 2015) elsewhere.
HTAPv2.2 is a global inventory with a resolution of 0.1× 0.1°providing yearly and monthly fluxes of gases (CO, NO, NOX,SOX, NH3,NMVOCs) and aerosols (BC, OC, PM2.5 and PM10) for the years 2008and 2010. In this work we use the estimated emissions for the year 2010(Janssens-Maenhout et al., 2015).
USACH is a high resolution (1× 1 km) emission inventory, pro-viding yearly total emissions for gases (CO, NO, NO2, SO2, CO2, NH3,NMVOCs) and aerosols (PM2.5 and PM10) for the year 2012. We notethat PM10 emissions for the transport sector are calculated as 20%higher than PM2.5 emissions while resuspension of dust is not includedin the estimate (USACH, 2014). This inventory was used to design anddefine the current decontamination plan of PM2.5 for the MetropolitanRegion. Its use as emission baseline within Santiago allows to explorethe impact of different mitigation measures proposed in the deconta-mination plan. The absence of an official and publicly available emis-sion inventory outside the Metropolitan region justifies the use ofHTAPv2.2 for outside this region.
HTAPv2.2 allocates almost twice as much PM2.5 emissions to the
Fig. 2. Domains used for WRF and CHIMERE simulations with resolutions of18×18 km referred to as STGO1 in the text (above), 6× 6km reffered to asSTGO2 (middle) and STGO3 corresponding to 2× 2 km (below). The redsquared area (lower figure) shows the city domain of Santiago used for sce-narios analysis described in Section 3.3. (For interpretation of the references tocolour in this figure legend, the reader is referred to the Web version of thisarticle.)
A. Mazzeo et al. Atmospheric Environment 190 (2018) 195–208
198

metropolitan area than USACH whereas for NOX, USACH estimateslarger emissions than HTAPv2.2 (Fig. 3). Large emissions in theHTAPv2.2 inventory are present outside of the metropolitan areamostly due to the presence of two cities (Valparaiso and Rancagua)with associated port and industrial activities, both outside of theUSACH domain.
Both inventories have been aggregated onto the same spatial gridsof 6×6 and 2× 2 km before being merged.The final product used inthis study (hereafter HTAP-USACH) combines the original and moredetailed emissions for the Metropolitan Region of Santiago from USACHwith the HTAPv2.2 emissions for the neighbouring urban and naturalareas outside of the USACH domain.
Biogenic emissions used in this work are provided directly inCHIMERE by the global Model of Emissions of Gases and Aerosols fromNature (MEGAN) (Guenther et al., 2006). No fires occurred during thesimulated period and therefore no emissions from biomass burning aretaken into account.
In this study we focus on the impact of residential and transportemissions of NOX and PM2.5 (Fig. 4) on air quality in Santiago. To do so,different emission scenarios are tested to assess the impact of givenmitigation options. The selected scenarios are within the range of tar-geted reductions in emissions of the current decontamination plan ofSantiago (MMAplan, 2014). Three scenarios are examined: reduction of50% of the residential emissions (hereafter HRES), reduction of 50% ofroad transport emissions (hereafter HTRA) and reduction of bothemission sectors by 50% (hereafter HRT). Moreover, to test the sensi-tivity of the model we also run a scenario with a reduction of 10% ofroad transport emissions (hereafter 10PCTRA).
The reduction of 50% of residential combustion emissions results inan average decrease of 19% in PM2.5 total emissions while reducingtransport activity by half, results in a decrease of 14% (Table 2). Re-duction of residential emissions has limited impact on reduction of totalNOX (3%) in contrast to transport emissions reductions that generates39% decrease of NOX. Finally, by combining both scenarios, HRT re-duces NOX and PM2.5 emissions in 42% and 33%, respectively.
2.5. Description of the simulated period
The selected period between the 15th and 28th of July is char-acterized by poor air quality with hourly concentrations of PM2.5
measured by the monitoring network ranging between 180 and 260 μg/m3. Most affected areas were Cerro Navia (260 μg/m3) and Pudahuel in
the north-west (230 μg/m3), El Bosque in the south-west (240 μg/m3),Puente Alto in the south-east (200 μg/m3) and outside Santiago,Talagante in the south-west (180 μg/m3) (Fig. 5).
Highest daily levels were present in the north and northwest side ofthe city (Pudahuel, Cerrillos, Quilicura and Cerro Navia) with dailymean concentrations between 100 and 120 μg/m3 while in the south (ElBosque and Puente Alto) and in the city center (OHiggins) daily meanconcentrations between 90 and 100 μg/m3 were observed.
At present, during autumn and winter a forecast for the me-tropolitan region is delivered every day at around 20 h (local time) onthe air quality with respect to PM2.5 and PM10 of the following day.Following the national threshold limits, five different episode levels canbe declared by the authorities, namely Good, Regular, Alert, Pre-Emergency and Emergency (Table 3).
Fig. 3. Total NOX (left) and PM2.5 (right) emissions for July 2015 for all sectorsbased on USACH (blue) and HTAP (red) inventories. The latter is calculated onthe same area corresponding to USACH inventory. Emissions outside ofSantiago (including cities of Valparaiso and Rancagua) provided by HTAP in-ventory are also included (HTAP-Regional, yellow). (For interpretation of thereferences to colour in this figure legend, the reader is referred to the Webversion of this article.)
Fig. 4. Spatial distribution of residential PM2.5 emissions (top) and transportNOX emissions (bottom) for July 2015 from USACH inventory for domain with2× 2 km resolution (STGO3).
Table 2PM2.5 and NOX total emissions for July 2015 from the combined HTAP andUSACH inventory (HTAP-USACH) (first column) and for different emissionsscenarios considered in this study; namely 50% emission reduction in re-sidential combustion (HRES, third column), 50% reduction in transport emis-sions (HTRA, fourth column) and 50% emission reductions in both sectors(HRT, fifth column). Monthly totals are calculated on the city domain areoutlined by the red square in Fig. 2.
(tons/mon) HTAP-USACH HRES HTRA HRT
PM2.5 1106 901 957 752NOX 4196 4070 2578 2453
A. Mazzeo et al. Atmospheric Environment 190 (2018) 195–208
199

Several restrictions to transport and residential wood combustionare applied whenever one of the following episode levels is declared;Alert, Pre-Emergency or Emergency. More restrictive prohibitions topublic and private transport circulation in Santiago are applied pro-gressively in the subsequent three episodes levels while residentialcombustion of biomass is prohibited during pre-emergency and emer-gency days and permitted only for certificated emission sources duringalert states (MMA, 2015). We clarify that this work explores the impactof the mitigation measures in the decontamination plan of Santiagoseeking to reduce concentration levels on the long-term and thereforethe emission baseline used does not include the above mentionedemission reductions implemented in days of deteriorated air quality.
During the selected period, three days of Regular conditions, eightdays of Alert and three Pre-Emergencies were declared based on theforecast. Afterwards, a comparison can be made between observed le-vels of PM2.5 and the corresponding forecast: two days of Good con-ditions, six days of Regular conditions, four Alerts episodes and twoPre-Emergencies occurred (Table 4).
3. Results
3.1. Validation of WRF simulations
In order to analyze the variability of surface meteorological para-meters we focus on two DMC stations representative of urban and not-urban environments, San Pablo (SPB) and El Paico (EPC) respectively(Fig. 1). In general, the model reproduces the hourly variability of theRH, temperature and winds speed at both stations (Fig. 6). Moreover,rapid changes of temperature, relative humidity and wind speeds as-sociated to coastal lows are also captured by the model. In terms of RH,observations outside of the urban limits at EPC are closer to the ob-servations than those from the urban station SPB, especially betweenJuly 20th and 24th when RH is mainly underestimated (15–30%). Fur-thermore, the model mostly underestimates the temperature at thebeginning and end of the period of interest at both stations while fromthe 20th to the 24th of July it underestimates the maximum tempera-tures and (only for SPB) overestimates the minimum temperature. Thegeneral variability of wind speed is reproduced by WRF, mostly over-estimating the observations throughout the entire period.
Saide et al. (2016) highlights the difficulties of WRF to resolvegeneral conditions of low wind speed typical during winter in centralChile (average of 2.5m/s) over the complex topography of Santiago insimulations with high resolution due to the lack of a parameterizationfor topographic effects.
The models ability to capture vertical variations of the meteor-ological parameters are examined for the 25th and 26th of July (Fig. 7).We choose these two days because they coincide with the largest dailyconcentrations of PM2.5 observed. The model reproduces, in general,the vertical variations of temperature, RH and wind speed throughoutthe column. However, the model presents difficulties in reproducing thevertical structure of RH and wind speed above 2000 m, in particular forthe 25th of July.
The simulated planetary boundary layer height (PBLH) is compared
Fig. 5. Observed hourly PM2.5 concentrations from the 15th to 28th of July 2015 at each station from the monitoring network from the MMA (Fig. 1).
Table 3Daily average concentration thresholds of PM2.5
defining Good, Regular, Alert, Pre-Emergency andEmergency episodes according to Chilean environ-mental regulation.
Episodes: [μg/m3 ]
Good 0–50Regular 50–80Alert 80–110Pre-Emergency 110–170Emergency > 170
Table 4Daily air quality episodes according to Chilean environmental regulations: G-Good, R-Regular, A-Alert, PE-Pre-Emergency and E-Emergency (Table 3); from the 15th
to 28th of July according to observations, the operational forecast system in place in Santiago at that time, simulated by the model with the HTAP-USACH inventoryand each one of the emission scenarios (i.e. HRES, HTRA and HRT).
Air pollution episodes for PM2.5 observed, forecasted and modelled during the simulated period 15–28 of July 2015
Date 15/07 16/07 17/07 18/07 19/07 20/07 21/07 22/07 23/07 24/07 25/07 26/07 27/07 28/07Observations R A R R G R PE A A A PE R G RForecast R A A A A R A PE A PE A PE A RReference R A A R G R A A PE A R R G GHRES R A A G G R A A A R R R G GHTRA R R R G G G R A A R G G G GHRT G R R G G G G R R G G G G G
A. Mazzeo et al. Atmospheric Environment 190 (2018) 195–208
200

against calculated PBLH based on observations from tethered balloonand ceilometer backscatter data (Fig. 8). The PBLH based on ceilometerobservations is calculated following Muñoz and Undurraga (2010) andis only limited to daytime while PBLH based on tethered balloon arecalculated for both, day and nigth, based on potential temperatureprofiles considering a constant profile within the PBL and a positivegradient above it (Stull, 1988).
Both methods estimate the PBLH to reach heights between 400 and700m during the day. During nighttime, shallow PBL occurs withheights below 100m. The model mostly reproduces the observedvariability of the PBLH consistently underestimating it during nighttimethroughout most of the period, except for the 25th and 26th where themodel overestimates it. The model, on average, underestimates thePBLH between 30 and 40% during day and night while an over-estimation around 40% during the day is observed from 24th to 26th.
A quantitative analysis of the models ability to reproduce the ob-servations of both networks shows that the model has a comparableperformance in reproducing RH both from MMA and from DMC(Table 5). While for temperature and wind speed the model has smallerMNB and NRMSE (and comparable correlation) for observations from theDMC stations than from the MMA. We recall the reader that while most ofthe DMC stations are outside of the urban area, most of the MMA stations
are within the urban area. With respect to its performance to reproducethe vertical variations of meteorological parameters, the model showsdifferences between its ability to simulate tethered balloon observationsof the first 1000m and radiosondes observations taken up to 5000m. Allin all, the model presents better perfomance with parameters up to5000m, except for RH, for which, smaller NRMSE and larger correlationare obtained for observations form the first 1000m. In addition, MNBpresents opposite signs between tethered balloon and radiosonde ob-servations. While the former are underestimated, RH and temperaturefrom the latter are overestimated. We highlight that the model presentsmuch better correlation for wind speed observed from radiosonde thanfrom tethered balloon.
All in all, the configuration adopted for WRF is able to simulate thegeneral circulation features of the metropolitan area. Surface statisticsdemonstrate WRF's ability to reproduce with good agreement thevariability of meteorological parameters and in particular the strongand weak wind conditions. Rapid temperature and humidity changesassociated with coastal lows are also well reproduced. A similaragreement can also be observed in vertical statistics. The correct re-production of these parameters is fundamental to reproduce the episodeof bad air quality conditions during wintertime (Rutllant and Garreaud,2004).
Fig. 6. Observed (blue dots) and simulated (black lines) hourly averages of relative humidity (top) and temperature (centre) at 2m.a.g.l and wind speed (bottom) at10m.a.g.l at El Paico (left) and San Pablo (right) stations (Fig. 1). (For interpretation of the references to colour in this figure legend, the reader is referred to the Webversion of this article.)
A. Mazzeo et al. Atmospheric Environment 190 (2018) 195–208
201

3.2. Validation of CHIMERE simulations
The validation of CHIMERE focuses on NOX and PM2.5 surfaceconcentration in this analysis.
The model is able to capture large concentrations during weekdaysas well as low concentrations during the week-end (18–19 and 25–26 ofJuly) for both pollutants. Larger differences in hourly concentrationswith respect to NOX than for PM2.5 are observed (Fig. 9). Observedconcentrations of PM2.5 are reproduced by the model throughout mostof the period with exception of the 25th of July when the model un-derestimates by more than a factor of two the observed concentrations.In addition, observed hourly NOX concentrations are mostly
underestimated by the model throughout the entire period. The modelis able to reproduce the minimum levels of NOX but, in particular at thebeginning and at the end of the simulation period, the model under-estimates the concentrations between 10 and 15% at Pudahuel.
Simulated vertical distribution of PM2.5 concentrations are com-pared against backscatter data from the ceilometer at DGF (Fig. 10).Only a qualitative comparison is conducted considering that the ceil-ometer provides backscatter attenuations and the model provides con-centrations. The observations show the presence of particulate mattermostly in the first 300m with maximum values in late afternoon.Cloudy conditions on the 19th generate the maximum backscatteringattenuations extending up to 600m above ground. Consistent with
Fig. 7. Observed (blue dots) and simulated (black lines) radiosonde vertical profiles of relative humidity (left), temperature (centre) and wind speed (right) at 17:00 h(local time) on the 25th (top) and 26th (bottom) of July at the DMC site. (For interpretation of the references to colour in this figure legend, the reader is referred tothe Web version of this article.)
A. Mazzeo et al. Atmospheric Environment 190 (2018) 195–208
202

PBLH shown in Fig. 8, the model underestimates the depth of themixing layer extending it mostly up to 100m. Furthermore, the modelis not able to reproduce the observed aerosol layer on the 18th, 19th,26th and 27th.
The statistical evaluation of CHIMERE considers six MMA stations,representative of different emission environments: industrial areas(Pudahuel and Quilicura), the city center (OHiggins), residential areas(Puente Alto and El Bosque) and semiurban areas outside of the city(Talagante). Statistical parameters for all six stations show that, ingeneral, the model performance to reproduce both NOX and PM2.5 arecomparable in terms of mean bias and correlation. However, in terms ofRMSE, smaller error is observed for PM2.5 than for NOX (Table 6).Single station statistics reveal for PM2.5 lower bias inside the urban areathan outside, with minimum values in the city center (OHiggins) andlarger bias outside the urban area (Talagante). The RMSE shows a si-milar overestimation in almost all stations; lowest values are observedin Puente Alto, while largest values are observed at OHiggins. Largestcorrelation coefficients are found in the northern area of the city, inparticular for the stations Pudahuel and Quilicura while lower corre-lations are found in the city center (OHiggins), the south side (PuenteAlto) and in the semi urban areas outside of Santiago (Talagante). Asimilar analysis for NOX reveals concentrations are underestimated inall stations except at El Bosque and OHiggins. The RMSE shows betteragreement for the north side (Quilicura), in the south-east side (PuenteAlto) and outside the city (Talagante) while a lower agreement is ob-served in the city center (OHiggins). Finally, higher correlation coeffi-cients are observed in the north-west (Pudahuel), and outside the urbanlimits (Talagante) while lower values are observed in the south (PuenteAlto) and north (Quilicura) side of the city.
In terms of simulating the air quality conditions we highlight thatthe model reproduces observed AQ threshold limit classes in 9 out of 14considered days while the current forecast system in place only re-produces it for 5 out of the 14 days (Table 4).The model in this studywas forced with observed winds and the performance is therefore notdirectly comparable with the forecast system used at the time. Ithowever illustrates an acceptable performance to reproduce AQ con-ditions in Santiago. However, exactly modelling concentrations justbelow or above a limit value is difficult and the model just over orunderestimates the AQ episode classification for certain days. It un-derestimates the observed Pre-Emergency on the 21st and 25th as well asthe Regular conditions on the 28th by reproducing AQ conditions cor-responding to Alert, Regular and Good episodes respectively. Further-more, the model overestimates daily levels of PM2.5 during a Regular(17th) and an Alert (23rd) episode reproduced as Alert and Pre-Emer-gency, respectively.
3.3. Emission scenarios
Reduction of 50% of residential emissions (HRES) results in anaverage decrease of 17% in PM2.5 concentrations, while reducingtransport activity by half (HTRA) results in a decrease of 23% in PM2.5
concentrations (Fig. 11). As could be expected, the emissions reductionof both sectors by 50% has the largest impact, reducing the
Fig. 8. Simulated (black line) and estimated boundary layer height (BLH) basedon tethered baloon (blue dots) and ceilometer (green dots) observations. Wehighlight that while tethered baloon data are from the DMC site, the ceilometerdata are from the DGF (Fig. 1). Simulated BLH corresponds to the DGF. Esti-mated boundary layer height (BLH) based on tethered baloon are calculatedfollowing Stull (1988) and are for both day and night time whereas BLH esti-mated from ceilometer are estimated following Muñoz and Undurraga (2010)and calculated only for daytime. (For interpretation of the references to colourin this figure legend, the reader is referred to the Web version of this article.)
Table 5Normalized mean bias (MNB), normalized root mean square error (NRMSE) andPearson correlation coefficient (R) quantifying the performance of WRF to re-produce surface observations (top) of temperature (TEMP), relative humidity(RH) and winds speed (WSPEED) considering stations from the air-qualitymonitoring network of Ministery of Environment (MMA, left) and the chileanweather service (DMC, right). Same statistics are also computed consideringvertical profiles (bottom) from tethered ballon measurements up to 1000m.(left) and from radiosondes up to 5000m. (right).
Surface Statistics
Networks: MMA DMC
MNB NRMSE R MNB NRMSE R
TEMP −0.3 2.9 0.84 −0.2 1.1 0.85RH −0.1 0.3 0.76 −0.1 0.4 0.73WSPEED 0.9 7.2 0.35 0.3 4.8 0.40
Vertical StatisticsObservations: Tethered Balloon (1000m) Radiosonde (5000m)
TEMP −0.1 0.6 0.93 0.01 0.6 0.99RH −0.3 0.5 0.87 0.2 8.5 0.70WSPEED −0.1 4.8 0.12 −0.01 0.9 0.87
Fig. 9. Simulated (black line) and observed hourly surface concentration of PM2.5 (left) and NOX (right) at Pudahuel station from the 15th to 28th of July 2015.
A. Mazzeo et al. Atmospheric Environment 190 (2018) 195–208
203

concentrations of PM2.5 by 41%. Contrary to PM2.5, for NOX little im-pact is seen with HRES while large, and comparable, reductions areseen in both scenarios reducing transport activity (HTRA and HRT),consistent with the fact that NOX emissions in the urban area are mainlydue to transport activity.
The reduction on PM2.5 concentration from HRES is mostly in theoutskirts of the city whereas most of the decrease in PM2.5 concentra-tions from HTRA and HRT is within the city (Fig. 12). However, andcontrary to PM2.5, concentrations of NOX are reduced more homo-genously both within and outside the city for scenarios reducingtransport emissions (HTRA and HRT).
The impact of the emission reduction scenarios on the number ofAlerts and Pre-Emergencies produced by the model is now further ex-amined. According to the observations a total of 2 Pre-Emergencies, 4Alerts, 6 Regular and 2 Good conditions occurred during the studyperiod while the model (Reference) simulates 1 Pre-Emergency, 5Alerts, 5 Regular and 3 Good conditions (Table 4). The HTRA scenariois more effective in improving the AQ conditions in Santiago comparedto HRES. Although both are effective in reducing Pre-Emergency con-ditions, HTRA is also successful in reducing the number of days withAlert conditions to two and a corresponding increase of days with Goodconditions to seven. The HRES scenario however maintains the numberof days with Alert and Regular AQ conditions. The reduction of both,residential combustion and transport emissions (HRT) notably im-proves AQ conditions in Santiago; no Alert conditions days occur, dayswith Regular AQ conditions are decreased by one and the number ofGood episodes increases from 3 to 10.
The daily concentrations observed at Pudahuel and Cerro Naviastations (Fig. 13) are usually responsible for triggering episodes of badAQ during winter. They have the highest concentrations throughoutmost of the analyzed period (Fig. 5). At Pudahuel, the model re-produces, in general, magnitude and evolution of the daily
Fig. 10. Observed attenuated backscatter from ceilometer at DGF (left) and simulated vertical profiles of PM2.5 concentration in μg/m3 (right). Cloud base altitude(white dots) and boundary layer height (BLH, red dots) are also illustrated (left). BLH is estimated following Muñoz and Undurraga (2010). (For interpretation of thereferences to colour in this figure legend, the reader is referred to the Web version of this article.)
Table 6Bias, root mean square error (RMSE) and Pearson correlation coefficient (R) quantifying the performance of CHIMERE to reproduce surface concentrations of PM2.5
and NOX considering all stations of the air quality monitoring network (first row) and at six individual stations (center and bottom) from this network.
MMA Statistics for chemistry
NOX All Stations BIAS RMSE R PM2.5All Stations BIAS RMSE R−10.6 105.6 0.55 −9.7 33.0 0.52
Pudahuel Puente Alto Quilicura
BIAS RMSE R BIAS RMSE R BIAS RMSE RNOX −59.1 108.8 0.69 −8.6 70.1 0.47 −44.4 92.9 0.41PM2.5 −15.8 32.2 0.70 −14.6 31.8 0.32 −15.8 32.2 0.70
O´Higgins Talagante El Bosque
BIAS RMSE R BIAS RMSE R BIAS RMSE RNOX 90.9 167.8 0.50 −56.4 77.1 0.61 20.6 121.7 0.54PM2.5 7.8 38.5 0.43 −21.5 35.0 0.44 −13.2 37.8 0.49
Fig. 11. Decrease in NOX (left) and PM2.5 (right) surface concentrations (in %)for the city domain (red square in Fig. 2) for HRES (blue), HTRA (red) and HRT(yellow) emission scenarios. Reduction in surface concentrations are computedwith respect to the original HTAP-USACH emission inventory (section 2.4). (Forinterpretation of the references to colour in this figure legend, the reader isreferred to the Web version of this article.)
A. Mazzeo et al. Atmospheric Environment 190 (2018) 195–208
204

concentrations but underestimates the observations on the 21st andfrom the 24th to 26th of July (Fig. 13). At Cerro Navia, a similarvariability as at Pudahuel is observed but with higher concentrations.These two stations present the most deteriorated AQ conditions fromthe 21st to the 25th of July. For these days the model is successful inreproducing the AQ level for the 22nd and the 24th of July. Furthermore,the model overestimates the concentrations on the 23rd reproducingconditions of Pre-Emergency (Table 4) and is not able to reproduce thePre-Emergency levels observed on the 21st and 25th. We highlight thatCerro Navia and Pudahuel are two nearby stations only 1.8 km apartfrom each other and therefore the model has difficulties in reproducingthe concentration gradient between these stations and their opposing
trends between the 21st and 24th of July. Furthermore, observed con-centrations at Cerro Navia on these two days are close to the thresholdlimits for Alert episodes and thus the difficulties of the model to re-produce these conditions can be explained by the negative bias of themodel (Table 6).
Our scenarios consisted of 50% reduction of emissions. To testwhether the impact of measures would be linear between the 0 and50% reduction we also performed a simulation with 10% transportemissions reduction (10PCTRA). For policy makers it would be im-portant to know if the implementation of a measure already is pro-portionally effective or only achieves results when it is fully im-plemented. Especially for PM this is an important question because part
Fig. 12. Decrease of PM2.5 (top) and NOX (bottom) surface concentration (in %) for scenarios HRES (left), HTRA (centre) and HRT (right). Location of stations fromthe air quality monitoring network are included: Cerrillos (1), Cerro Navia (2), El Bosque (3), Independencia (4), La Florida (5), Las Condes (6), O'Higgins Park (7),Pudahuel (8), Puente Alto (9), Quilicura (10) and Talagante (11).
Fig. 13. Observed (blue line) and simulated PM2.5 daily surface concentration (in μg/m3) at Cerro Navia (left) and Pudahuel (right) for REFERENCE (red), HRES(black), HTRA (yellow) and HRT (green) emission scenarios. Additionaly, threshold values for Alert (80–110 μg/m3) and Pre-Emergency (110–170 μg/m3) episodesare reported (dashed red lines). (For interpretation of the references to colour in this figure legend, the reader is referred to the Web version of this article.)
A. Mazzeo et al. Atmospheric Environment 190 (2018) 195–208
205

of the PM2.5 concentration consists of secondary PM, particles formedfrom precursor gases in the atmosphere. However, also for NOX anonlinear reaction over the 0–50% reduction could be possible becauseNOX is involved in ozone chemistry and depending if the regime isVOCs or NOX limited the impact of NOX emission reduction on NO2
concentrations may differ. If the model predicts proportional impactsover the 0–50% reduction range, the impact of a 10% reduction wouldbe 20% of the impact of a HTRA scenario. When we look at the impacton NOX and PM2.5 concentrations of the 10PCTRA scenario we find thatin fact the impact of the 10PCTRA is 20.0% for NOX and thus linearwhereas for PM2.5 it is slightly higher, namely 21.4%. For PM2.5 itsuggests that the first steps in the reduction might be slightly moreefficient than the later steps e.g. going from 40 to 50% emission re-duction but the difference is not dramatic.
To further understand the relation between emissions and con-centrations we plot for Pudahuel and OHiggins the observed andmodelled PM2.5 as a function of observed and modelled NOX, respec-tively (Fig. 14). The results show that in both cases (observations andmodel) PM2.5 and NOX concentrations are strongly related. Given thatthe dominant source of NOX emissions in an urban environment istransport these results illustrate the strong relation between PM2.5 andtransport activity. However, differences exist in the bandwidth betweenobserved to-observed and model-to-model results with the formerhaving a larger bandwidth than the latter, especially for OHiggins.Different sources like traffic or residential combustions have differentratios on NOX to PM2.5 emissions. A larger bandwidth then suggests thatthe relative importance of the sectors fluctuates over time, or within the
day, with the consequent change in ratio of observed NOX to PM2.5.Ideally the model-to-model comparison should also reflect this. Themodel captures to some extent this fluctuation in Pudahuel but not inO'Higgins where concentrations and emissions seem to be more domi-nated by a single source or a fixed combination of sources in the model.A potential source explaining the difference could be the resuspensionprocesses by transportation or urban dust, none of them included in theinventory used in this study. This is obviously strongly associated withtransport activity (and therefore with exhaust emissions from transport)but may also fluctuate independently from transport activities becauseresuspension is strongly influenced by climatic conditions (lower duringrain events or over wet surface areas, (Amato et al., 2012)). An addi-tional source potentially explaining the difference in bandwith betweenobservations and model is the formation of secondary organic aerosols(SOA) which is not included in the model but has an impact on PM2.5
concentrations and could even exceed the contribution of primary or-ganic aerosols (Robinson et al., 2007).
4. Conclusions
Although air quality has improved over the years (Barraza et al.,2017; Gallardo et al., 2018), poor air quality remains a worrying issuefor Santiago in the winter, particularly in terms of particulate matter.The occurrence of days with elevated concentrations of pollutants isthought to be due to a combination of high emissions from residentialheating and road transport in combination with limited ventilation andmixing. The government has implemented various decontamination
Fig. 14. Observed (left) and simulated (right) PM2.5 to NOX hourly concentrations (in μg/m3) at O'Higgins Park (top) and Pudahuel (bottom) stations. Linearregression equations are also shown for each plot.
A. Mazzeo et al. Atmospheric Environment 190 (2018) 195–208
206
plans with mitigation strategies aimed at reducing emissions and thusimproving AQ in Santiago.
To examine the impact of residential combustion and transportemission on AQ in Santiago a modelling system composed by the WRFmeteorological model and CHIMERE chemical and transport model isimplemented for Central Chile and applied to simulate simultaneouslythe dispersion of gaseous pollutants and particulate matter. The systemwas used to investigate the impact of a set of emissions scenarios inreducing the number of days with bad AQ conditions during two winterweeks in July 2015.
The performance of the modeling system is assessed against avail-able surface meteorological measurements, observed surface con-centrations, vertical profiles of temperature, relative humidity andwind speed from field measurements and ceilometer backscatter pro-files at downtown Santiago. The model presents better performance inreproducing surface meteorological observations than vertical ones.Furthermore, profiles from radiosondes up to 5000m are better re-produced than observations from tethered balloon over the first1000m. In addition, the model has difficulties in reproducing the ob-served planetary boundary layer height. The model, in general re-produces the variability of daily concentrations from the air qualitymonitoring network of Santiago. However, the model has difficulties insimulating small scale concentration gradients observed in the city; forCerro Navia and Pudahuel for instance, two stations responsible fortriggering most of the pollution events in Santiago and with occasionalopposing trends during the analyzed period, are only 1.8 km apart, adistance comparable to the spatial resolution used in CHIMERE.
The analysis of the relationship between PM2.5 and NOX reveals thatthe dynamics of the model does not fully capture all the real-worldemission variations, however the strong correlation between thesepollutants seen both in the observations and the model results is en-couraging.
Different scenarios within the range of the emissions reductiontargeted in the decontamination plan for Santiago from the Ministry ofthe Environment (MMAplan, 2014) were tested: 50% decrease of re-sidential emissions (HRES), 50% decrease of transport emissions(HTRA) and 50% decrease of residential combustion and transportemissions (HRT). Consistent with the main sectors contributing toemissions of PM2.5 and NOX, the largest reduction in total emissions, forPM2.5, was seen for HRES whereas for NOX it is obtained with HTRA. Incoherence with the spatial distribution of residential combustion andtransport emissions, the impact of HRES is located mostly in the out-skirts of Santiago while the impact of HTRA is mostly found within thecity. Furthermore, HTRA is more efficient than HRES in improving AQin Santiago expressed by fewer days with Alert conditions and morewith Good conditions. The largest improvement was obtained bycombining emission reductions in both sectors (HRT). Overall, our re-sults suggest that measures aiming to reduce transport emissions aremore effective in reducing PM2.5 and NOX concentrations in Santiagothan policies reducing residential emissions. Furthermore, a sensitivitytest revealed over the range of emission reduction from 0 to 50% alinear relation for NOX and almost linear for PM2.5. This implies thatreductions smaller than 50%, will still have a proportional benefit interms of improvements in AQ.
We highlight that this study would need to be complemented with acost analysis associated to each emission scenario considered in thisstudy in order to determine the cost effectiveness of each measure. Ouranalysis also reveals that while the strong relation observed betweenPM2.5 and NOX is captured by the model, it does not fully capture all thereal-world emission variations, especially for PM2.5, pointing to pos-sible missing emissions in the inventory and/or missing aerosol for-mation processes such as the formation of SOA.
Acknowledgements
This work was conducted within the framework of the FONDECYTproject 1150873 and the first author of this work was funded by theCenter for Climate Research and Resilience (CR2) (FONDAP15110009). N.Huneeus was partially funded by the Anillo ProjectACT1419. Powered@NLHPC: This research was partially supported bythe supercomputing infrastructure of the NLHPC (ECM-02).
References
Amato, F., Schaap, M., van der Gon, H.A.D., Pandolfi, M., Alastuey, A., Keuken, M.,Querol, X., 2012. Effect of rain events on the mobility of road dust load in two Dutchand Spanish roads. Atmos. Environ. 62, 352–358.
Anav, A., Menut, L., Khvorostiyanov, D., Viovy, N., 2011. Impact of tropospheric ozone onthe Euro-Mediterranean vegetation. Global Change Biol. 17.
Barraza, F., Lambert, F., Jorquera, H., Villalobos, A.M., Gallardo, L., 2017. Temporalevolution of main ambient pm2.5 sources in santiago, Chile, from 1998 to 2012.Atmos. Chem. Phys. Discuss. 2017, 1–21.
Bessagnet, B., Pirovano, G., Mircea, M., Cuvelier, C., Aulinger, A., Calori, G., Ciarelli, G.,Manders, A., Stern, R., Tsyro, S., Garcıa Vivanco, M., Thunis, P., Pay, M.-T., Colette,A., Couvidat, F., Meleux, F., Rouı¨l, L., Ung, A., Aksoyoglu, S., Baldasano, J.M.,Bieser, J., Briganti, G., Cappelletti, A., D'Isidoro, M., Finardi, S., Kranenburg, R.,Silibello, C., Carnevale, C., Aas, W., Dupont, J.-C., Fagerli, H., Gonzalez, L., Menut, L.,Prévôt, A.S.H., Roberts, P., White, L., 2016. Presentation of the eurodelta iii inter-comparison exercise – evaluation of the chemistry transport models' performance oncriteria pollutants and joint analysis with me teorology. Atmos. Chem. Phys. 16 (19),12667–12701.
Borrego, C., Monteiro, A., Ferreira, J., Miranda, A., Costa, A., Carvalho, A., Lopes, M.,2008. Procedures for esti mation of modelling uncertainty in air quality assessment.Environ. Int. 34 (5), 613–620.
Carbone, S., Saarikoski, S., Frey, A., Reyes, F., Reyes, P., Castillo, M., Gramsch, E., Oyola,P., Jayne, J., Worsnop, D.R., Hillamo, R., 2013. Chemical characterization of sub-micron aerosol particles in Santiago de Chile. Aerosol and Air Quality Research 13(2), 462–473.
Carter, W.P., 2010. Development of the saprc-07 chemical mechanism. Atmos. Environ.44 (40), 5324–5335 atmospheric Chemical Mechanisms: Selected Papers from the2008 Conference.
Collins, W., Rasch, P., Boville, B., Hack, J., McCaa, J., Williamson, D., Kiehl, J., Briegleb,B., 2004. Description of the Ncar Community Atmosphere Model (Cam 3.0). Tech.rep., NCAR -National Center For Atmospheric Re search.
FNL, N., 2000. Ncep Fnl Operational Model Global Tropospheric Analyses, Continuingfrom July 1999. https://doi.org/10.5065/D6M043C6.
Franck, U., Leitte, A.M., Suppan, P., 2014. Multiple exposures to airborne pollutants andhospital admissions due to diseases of the circulatory system in Santiago de Chile. Sci.Total Environ. 468–469, 746–756.
Gallardo, L., Olivares, G., Langner, J., Aarhus, B., 2002. Coastal lows and sulfur air pol-lution in central Chile. At mospheric Environment 36 (23), 3829–3841.
Gallardo, L., Barraza, F., Ceballos, A., Galleguillos, M., Huneeus, N., Lambert, F., Ibarra,C., Munizaga, M., O'Ryan, R., Osses, M., et al., 2018. Evolution of air quality insantiago: the role of mobility and lessons from the science policy interface. Elem SciAnth 6 (1).
Garreaud, R.D., Rutllant, J., 2003. Coastal lows along the subtropical west coast of southAmerica: numerical simulation of a typical case. Mon. Weather Rev. 131 (5),891–908.
Garreaud, R.D., Rutllant, J.A., Fuenzalida, H., 2002. Coastal lows along the subtropicalwest coast of south ameri ca: mean structure and evolution. Mon. Weather Rev. 130(1), 75–88.
Gramsch, E., Cereceda-Balic, F., Oyola, P., von Baer, D., 2006. Examination of pollutiontrends in Santiago de Chile with cluster analysis of pm10 and ozone data. Atmos.Environ. 40 (28), 5464–5475.
Gramsch, E., Caceres, D., Oyola, P., Reyes, F., Vasquez, Y., Rubio, M., Sanchez, G., 2014.Influence of surface and subsidence thermal inversion on PM2.5 and black carbonconcentration. Atmos. Environ. 98, 290–298.
Guenther, A., Karl, T., Harley, P., Wiedinmyer, C., Palmer, P., Geron, C., 2006. Estimatesof global terrestrial iso prene emissions using megan (model of emissions of gases andaerosols from nature). Atmos. Chem. Phys. 6, 3181–3210.
Hauglustaine, D.A., Balkanski, Y., Schulz, M., 2014. A global model simulation of presentand future nitrate aero sols and their direct radiative forcing of climate. Atmos.Chem. Phys. 14, 6863–6949.
Huneeus, 2017. Transport of Particle Pollution into the Maipo valley: winter 2015Campaign Results. In Preparation.
Janssens-Maenhout, G., Crippa, M., Guizzardi, D., Dentener, F., Muntean, M., Pouliot, G.,Keating, T., Zhang, Q., Kurokawa, J., Wankmuller, R., Denier van der Gon, H.,Kuenen, J.J.P., Klimont, Z., Frost, G., Darras, S., Koffi, B., Li, M., 2015. Htap v2.2: amosaic of regional and global emission grid maps for 2008 and 2010 to studyhemispheric transport of air pollution. Atmos. Chem. Phys. 15 (19), 11411–11432.
A. Mazzeo et al. Atmospheric Environment 190 (2018) 195–208
207

Jorquera, H., 2002a. Air quality at santiago, Chile: a box modeling approach i. carbonmonoxide, nitrogen oxides and sulfur dioxide. Atmos. Environ. 36 (2), 315–330.
Jorquera, H., 2002b. Air quality at santiago, Chile: a box modeling approach ii. PM2.5,coarse and PM10 particulate matter fractions. Atmos. Environ. 36 (2), 331–344.
Madronich, S., McKenzie, R.L., Björn, L.O., Caldwell, M.M., 1998. Changes in biologicallyactive ultraviolet radiation reaching the earth's surface. J. Photochem. Photobiol. BBiol. 46 (1), 5–19.
Markakis, K., Valari, M., Perrussel, O., Sanchez, O., Honore, C., 2015. Climate-forced air-quality modeling at the urban scale: sensitivity to model resolution, emissions andmeteorology. Atmos. Chem. Phys. 15 (13), 7703–7723.
Mena-Carrasco, M., Oliva, E., Saide, P., Spak, S.N., de la Maza, C., 2012. Estimating thehealth benefits from nat ural gas use in transport and heating in santiago, Chile. Sci.Total Environ. 429, 257–265.
Menut, L., Bessagnet, B., Khvorostyanov, D., Beekmann, M., Blond, N., Colette, A., Coll, I.,Curci, G., Foret, F., Hodzic, A., Mailler, S., Meleux, F., Monge, J., Pison, I., Siour, G.,Turquety, S., Valari, M., Vautard, R., Vi vanco, M., 2013. CHIMERE 2013: a model forregional atmospheric composition modelling. Geosci. Model Dev. (GMD) 6,981–1028.
Mlawer, E.J., Taubman, S.J., Brown, P.D., Iacono, M.J., Clough, S.A., 1997. Radiativetransfer for inhomoge neous atmospheres: Rrtm, a validated correlated-k model forthe longwave. J. Geophys. Res.: Atmosphere 102 (D14), 16663–16682.
MMA, 2015. Final Report to Manage Critics Pollution Episodes of Respirable ParticulateMatter (PM10). Final report. Ministerial Secretariat of the Environment Minister forthe Metropolitan region, Santiago.
MMAplan, 2014. Prevention and Decontamination Plan for the Metropolitan Region ofSantiago - Decontamination Plan Strategy 2014-2018. Informe final. MinisterialSecretariat of the Environment Minister for the Metro politan region, Santiago.http://portal.mma.gob.cl/planes-de-descontaminacion-atmosferica-estrategia-2014-2018/.
Monteiro, A., Miranda, A., Borrego, C., Vautard, R., Ferreira, J., Perez, A., 2007. Long-term assessment of particu late matter using chimere model. Atmos. Environ. 41 (36),7726–7738.
Mullins, J., Bharadwaj, P., 2015. Effects of short-term measures to curb air pollution:evidence from santiago Chile. Am. J. Agric. Econ. 97 (4), 1107–1134.
Muñoz, R., Alcafuz, R.I., 2012. Variability of urban aerosols over santiago, Chile: com-parison of surface pm10 concentrations and remote sensing with ceilometer andlidar. Aerosol and air quality research 12, 8–19.
Muñoz, R.C., Undurraga, A.A., 2010. Daytime mixed layer over the santiago basin: de-scription of two years of observations with a lidar ceilometer. Arch Meteorol.Climatol. 49 (8), 1728–1741.
Nakanishi, M., Niino, H., 2004. An improved mellor–yamada level-3 model with con-densation physics: its design and verification. Boundary-Layer Meteorol. 112 (1),1–31.
Nenes, A., Pilinis, C., Pandis, S., 1998. Isorropia: a new thermodynamic model for in-organic multicomponent atmospheric aerosols. Aquat. Geochem. 4, 123–152.
Olivares, G., Gallardo, L., Langner, J., Aarhus, B., 2002. Regional dispersion of oxidizedsulfur in central Chile. Atmos. Environ. 36 (23), 3819–3828.
Pérez, P., Gramsch, E., 2016. Forecasting hourly PM2.5 in Santiago de Chile with emphasison night episodes. Atmos. Environ. 124, 22–27.
Pérez, P., Trier, A., Reyes, J., 2000. Prediction of PM2.5 concentrations several hours inadvance using neural net works in santiago, Chile. Atmos. Environ. 34 (8),1189–1196.
Powers, J.G., Klemp, J.B., Skamarock, W.C., Davis, C.A., Dudhia, J., Gill, D.O., Coen, J.L.,Gochis, D.J., Ah madov, R., Peckham, S.E., Grell, G.A., Michalakes, J., Trahan, S.,Benjamin, S.G., Alexander, C.R., Di mego, G.J., Wang, W., Schwartz, C.S., Romine,
G.S., Liu, Z., Snyder, C., Chen, F., Barlage, M.J., Yu, W., Duda, M.G., 2017. Theweather research and forecasting model: overview, system efforts, and future direc-tions. Bull. Am. Meteorol. Soc. 98 (8), 1717–1737.
Robinson, A.L., Donahue, N.M., Shrivastava, M.K., Weitkamp, E.A., Sage, A.M., Grieshop,A.P., Lane, T.E., Pierce, J.R., Pandis, S.N., 2007. Rethinking organic aerosols: semi-volatile emissions and photochemical aging. Science 315 (5816), 1259–1262.
Rutllant, J., Garreaud, R., 1995. Meteorological air pollution potential for santiago, Chile:towards an objective episode forecasting. Environ. Monit. Assess. 34 (3), 223–244.
Rutllant, J., Garreaud, R., 2004. Episodes of strong flow down the western slope of thesubtropical andes. Mon. Weather Rev. 132 (2), 611–622.
Saide, P.E., Carmichael, G.R., Spak, S.N., Gallardo, L., Osses, A.E., Mena-Carrasco, M.A.,Pagowski, M., 2011. Forecasting urban PM10 and PM2.5 pollution episodes in verystable nocturnal conditions and complex ter rain using wrf–chem co tracer model.Atmos. Environ. 45 (16), 2769–2780.
Saide, P.E., Mena-Carrasco, M., Tolvett, S., Hernandez, P., Carmichael, G.R., 2016. Airquality forecasting for win ter-time PM2.5 episodes occurring in multiple cities incentral and southern Chile. J. Geophys. Res.: Atmosphere 121 (1), 558–575.
Schmitz, R., 2005. Modelling of air pollution dispersion in Santiago de Chile. Atmos.Environ. 39 (11), 2035–2047.
Skamarock, W., Klemp, J., Dudhia, J., Gill, D., Barker, D., Duda, M., Huang, X., Wang, W.,Powers, J., 2008. A description of the advanced research WRF version 3. NCARTechnical Note 123.
Stull, R.B., 1988. Measurement and Simulation Techniques. Springer, pp. 405–440.USACH, U., 2014. Informe final: Actualizacion y sistematizacion del inventario de emi-
siones de contaminantes at mosfericos en la region metropolitana. Informe final.Universidad de Santiago de Chile.
Valari, M., Menut, L., 2010. Transferring the heterogeneity of surface emissions tovariability in pollutant concentrations over urban areas through a chemistry trans-port model. Atmos. Environ. 44, 3229–3238.
van Leer, B., 1979. Towards the ultimate conservative difference scheme. v. a second-order sequel to godunov's method. J. Comput. Phys. 32 (1), 101–136.
Van Loon, M., Vautard, R., Schaap, M., Bergström, R., Bessagnet, B., Brandt, J., Builtjes,P., Christensen, J., Cuve lier, C., Graff, A., et al., 2007. Evaluation of long-term ozonesimulations from seven regional air quality models and their ensemble. Atmos.Environ. 41 (10), 2083–2097.
Vautard, R., Builtjes, P., Thunis, P., Cuvelier, C., Bedogni, M., Bessagnet, B., Honore, C.,Moussiopoulos, N., Pirovano, G., Schaap, M., et al., 2007. Evaluation and inter-comparison of ozone and PM10 simulations by sev eral chemistry transport modelsover four european cities within the citydelta project. Atmospheric Envir onment 41(1), 173–188.
Villalobos, A., Barraza, F., Jorquera, H., Schauer, J., 2015. Chemical speciation andsource apportionment of fine particulate matter in santiago, Chile, 2013. Sci. TotalEnviron. 512–513, 133–142.
Wu, W.-S., Purser, R.J., Parrish, D.F., 2002. Three-dimensional variational analysis withspatially inhomogeneous covariances. Mon. Weather Rev. 130 (12), 2905–2916.
Zhao, Y., Feng, D., Yu, L., Wang, X., Chen, Y., Bai, Y., Hernandez, H.J., Galleguillos, M.,Estades, C., Biging, G.S., Radke, J.D., Gong, P., 2016. Detailed dynamic land covermapping of Chile: accuracy improvement by integrating multi-temporal data. Rem.Sens. Environ. 183, 170–185.
Zyryanov, D., Foret, G., Eremenko, M., Beekmann, M., Cammas, J., D'Isidoro, M., Elbern,H., Flemming, J., Friese, E., Kioutsioutkis, I., Maurizi, A., Melas, D., Meleux, F.,Menut, L., Moinat, P., Peuch, V., Poupkou, A., Ra zinger, M., Schultz, M., Stein, O.,Suttie, e. a., 2012. 3-d evaluation of tropospheric ozone simulations by an ensembleof regional chemistry transport model. Atmos. Chem. Phys. 12 (7), 3219–3240.
A. Mazzeo et al. Atmospheric Environment 190 (2018) 195–208
208