impact of relative permeability hysteresis on the
TRANSCRIPT

www.elsevier.com/locate/petrol
Journal of Petroleum Science and E
Impact of relative permeability hysteresis on the numerical
simulation of WAG injection
Elizabeth J. Spiteri, Ruben Juanes *
Department of Petroleum Engineering, Stanford University, 65 Green Earth Sciences Bldg., Stanford, CA 94305, USA
Received 28 July 2004; received in revised form 24 September 2005; accepted 26 September 2005
Abstract
Pore-scale physics, laboratory investigations, and field experience, dictate that three-phase relative permeabilities exhibit strong
dependence on the saturation path and the saturation history. Such dependence is especially relevant in immiscible water-
alternating-gas (WAG) processes, which are characterized by a sequence of three-phase drainage and imbibition cycles. In this
paper, we study the influence of relative permeability hysteresis on the field-scale predictions of WAG injection.
Because their measurement is difficult and time-consuming, three-phase relative permeabilities are usually interpolated from
two-phase data. The errors associated with this procedure have been investigated by Oak (SPE 20183), who reported that
interpolated values might differ significantly from experimental ones. The effect of using different interpolation models in
field-scale simulations has been illustrated by a number of authors, who found that recovery predictions could be significantly
different depending on the three-phase relative permeability model.
Here, we study the impact of using history-dependent saturation functions in reservoir simulations. First, we investigate the
degree of accuracy with which different hysteretic models reproduce Oak’s three-phase relative permeability data. In doing so, we
assess the validity of existing models, and we identify the model parameters subject to most uncertainty. Our analysis suggests that
current models account for some of the hysteretic behavior observed experimentally, but do not reproduce experimental
measurements adequately during cyclic water/gas injection. Second, we illustrate how the use of a hysteretic relative permeability
model affects reservoir simulations. We use a synthetic model of a quarter five-spot pattern in a homogenous reservoir, and a more
realistic heterogeneous reservoir modified from the PUNQ-S3 model. We find that there is striking disparity in the simulation
results depending on whether a hysteretic or a nonhysteretic model is employed. Therefore, we conclude that (1) it is essential to
incorporate hysteresis in the relative permeabilities in order to obtain accurate predictions of realistic immiscible WAG processes;
and (2) enhancements are needed to improve the predictive capabilities of current relative permeability hysteresis models.
D 2005 Elsevier B.V. All rights reserved.
Keywords: Three-phase flow; Relative permeability; Hysteresis; Water-alternating-gas; Land trapping coefficient
1. Introduction
Quantitative predictions of multiphase flow in po-
rous media are necessary for the evaluation and man-
0920-4105/$ - see front matter D 2005 Elsevier B.V. All rights reserved.
doi:10.1016/j.petrol.2005.09.004
* Corresponding author. Tel.: +1 650 725 3312; fax: +1 650 725
2099.
E-mail address: [email protected] (R. Juanes).
agement of oil and gas reservoirs. In particular, the
simultaneous flow of three separate phases (water, oil
and gas) is essential in the characterization and model-
ing of a number of oil recovery processes, such as
waterflooding in the presence of free gas, steam injec-
tion, and CO2 flooding (Lake, 1989). Three-phase
flow conditions become especially relevant for recov-
ery processes based on immiscible water-alternating-
ngineering 50 (2006) 115–139

E.J. Spiteri, R. Juanes / Journal of Petroleum Science and Engineering 50 (2006) 115–139116
gas (WAG) injection (Christensen et al., 2001). Three-
phase flows occur also in environmental applications
such as geological CO2 sequestration (Koide et al.,
1992) and groundwater contamination by nonaque-
ous-phase liquids (Abriola and Pinder, 1985).
These predictions are now performed routinely using
numerical simulations tools. Even though reservoir
models continue to increase in size and geometrical
complexity, they still rely on a straightforward multi-
phase flow extension of Darcy’s law (Muskat, 1949).
The cornerstone of multiphase flow models is the rela-
tive permeability, which accounts for the reduction in
flow due to the mutual interaction of the different flow-
ing phases. Although traditionally understood as unique
functions of saturation, there is conclusive theoretical
and experimental evidence that relative permeabilities
depend on many other rock and fluid descriptors, in-
cluding rock wettability, fluid viscosity, interfacial ten-
sion, flow rate and, of special interest to us, saturation
history (Avraam and Payatakes, 1995). However, be-
cause direct measurement of three-phase relative perme-
abilities is costly and very time consuming, it is standard
practice to rely on two-phase relative permeability ex-
perimental data, and use an interpolation model to eval-
uate the relative permeabilities under three-phase flow
conditions.
A large number of relative permeability models have
been proposed (see, e.g. Juanes, 2003, for a historical
overview). The most commonly used interpolation mod-
els in reservoir simulators are Stone I (Stone, 1970),
Stone II (Stone, 1973), and saturation-weighted interpo-
lation (Baker, 1988). However, it has been shown that
the ability of most empirical or semi-empirical interpo-
lation models to reproduce direct experimental measure-
ments of three-phase relative permeabilities is quite
limited (Baker, 1988; Delshad and Pope, 1989; Oak et
al., 1990; Oak, 1990; Hicks and Grader, 1996; Oliveira
and Demond, 2003). The most severe limitation of
simple interpolation models is their inability to repro-
duce hysteresis effects, that is, dependence on the satu-
ration path and saturation history. Such dependence is
the result of process-dependence in the microscopic
contact angle, and trapping of the nonwetting phase. A
few relative permeability models have been developed
that incorporate hysteresis effects (Killough, 1976; Carl-
son, 1981; Lenhard and Parker, 1987; Lenhard and
Oostrom, 1998; Jerauld, 1997; Blunt, 2000; Kjosavik
et al., 2002). Most of them have not yet been implemen-
ted in commercial reservoir simulators.
Several authors (e.g. Sato and Aziz, 1987; Guzman
et al., 1994) have investigated the impact of using
different interpolation models in numerical simulations,
concluding that recovery predictions could be very
different depending on the relative permeability model
used. In this paper, we extend previous investigations
by performing a quantitative analysis of three-phase
relative permeability models that account for hysteresis
effects. The objective of this paper is twofold: (1) assess
the validity of hysteretic relative permeability models to
reproduce experimental data; and (2) evaluate the im-
pact of using different models in the simulation of oil
recovery process, with emphasis on immiscible WAG
injection. We should mention that an assessment of
three-phase hysteretic relative permeability models by
means of comparison with experimental data has re-
cently been performed independently (Element et al.,
2003).
The work presented here is confined to water-wet
systems. It is well known that the wettability character-
istics of the porous medium have a definitive impact on
oil recovery (Jadhunandan and Morrow, 1995). In re-
cent years, many of the observed trends in recovery,
trapping and relative permeability hysteresis have been
explained by means of pore-scale modeling (Dixit et al.,
1999; Øren and Bakke, 2003; Al-Futaisi and Patzek,
2003; Valvatne and Blunt, 2004; Piri and Blunt,
2005a,b). Although the influence of wettability is not
addressed here, it is the subject of recent investigation.
Given the success of pore-network modeling to repro-
duce experimental data, Spiteri et al. (2005) developed
a new model of trapping and hysteresis for two-phase
flow, and validated their model against pore-network
simulations that cover the entire range of wettability
conditions.
An outline of the paper is as follows. In Section 2,
we give a brief review of the relative permeability
models typically implemented in reservoir simulators.
We emphasize the importance of choosing appropriate
two-phase relative permeability data, and revisit three-
phase interpolation models and hysteresis models. In
Section 3, we assess the performance of different rela-
tive permeability models by comparison with direct
measurements of three-phase relative permeability for
displacement scenarios representative of immiscible
WAG injection. We use the experimental data from
Oak (1990), which is one of the most comprehensive
and reliable three-phase relative permeability data sets
available. In Section 4, we illustrate the effect of the
choice of the three-phase interpolation model and the
hysteresis model on the reservoir simulation predic-
tions. We report simulations on a very simple synthetic
black-oil reservoir model, to isolate the impact of the
relative permeability model. In Section 5, we extend the
numerical investigation and perform simulations on a

E.J. Spiteri, R. Juanes / Journal of Petroleum Science and Engineering 50 (2006) 115–139 117
realistic three-dimensional heterogeneous reservoir,
modified from the well-known PUNQ-S3 case study
(Floris et al., 2001; http://www.nitg.tno.nl/punq/cases/
index.shtml). In the final section, we summarize the
main conclusions of this investigation.
2. Review of relative permeability models
The Darcy flow formalism has theoretical justifica-
tion for single-phase flow, but is simply an empirical
approximation (sometimes rather crude) for multiphase
flow. The relative permeabilities are the key parameters
of Darcy-type models of multiphase flow, and they are
left with the task of incorporating the complex physics
of multiphase flow. They should be regarded as func-
tionals of various fluid and rock descriptors, rather than
unique functions of the fluid saturations (Juanes and
Patzek, 2004). However, measuring three-phase relative
permeabilities for all displacement processes of interest
is extremely costly and time consuming. As a result,
many of the dependencies of relative permeabilities
have been largely ignored in reservoir simulation,
where it is common practice to understand three-
phase relative permeabilities as unique functions of
saturations, obtained from interpolation of two-phase
data.
In this section, we review the most commonly used
relative permeability models–specifically, oil interpola-
tion models and gas hysteresis models–and assess the
validity of these models by how accurately they repro-
duce experimental data.
Fig. 1. Typical saturation path in a WAG displacement process, and co
2.1. Two-phase relative permeability data
The most common models estimate relative perme-
ability of oil, water, and gas under three-phase condi-
tions by interpolation of two-phase data. Independently
of how this interpolation is carried out, it is essential
that the two-phase experiments reproduce a similar
initial state and saturation history to that of the three-
phase scenario to be estimated. For example, if the
reservoir undergoes primary production by internal
gas drive followed by waterflooding, the appropriate
two-phase experiments are: (1) a water–oil flow exper-
iment, with increasing water saturation, and (2) a gas–
oil flow experiment at connate water saturation, with
increasing gas saturation. Both of these experiments
should have an initial state that corresponds to that of
the reservoir, achieved by primary oil invasion into a
water-filled medium. In a WAG process, three distinct
displacements take place (Fig. 1): (1) natural or man-
made waterflood, (2) gas flood into water and residual
oil, and (3) waterflood into gas and residual oil. It is
apparent that relative permeabilities along saturation
path (3)–and subsequent gas and water injection–are
less likely to be well represented by the two-phase
experimental curves. In Section 3 we show that this is
indeed the case. Throughout the paper, we adopt the
terminology of drainage and imbibition processes in the
context of water-wet media. Therefore, drainage corre-
sponds to gas flooding (or oil invasion in a water–oil
system), and imbibition corresponds to waterflooding
(or oil invasion in a gas–oil system).
mmon two-phase relative permeability input data for simulation.

Fig. 2. Water relative permeability from an oil–water primary drainage
experiment.
Fig. 4. Oil relative permeabilities from an oil–water primary drainage
and waterflood experiment.
E.J. Spiteri, R. Juanes / Journal of Petroleum Science and Engineering 50 (2006) 115–139118
From the two-phase input data, relative permeabil-
ities are commonly estimated assuming: (1) water rel-
ative permeability is a function of water saturation only,
(2) gas relative permeability is also a function of gas
saturation only, and (3) oil relative permeability is a
function of all three saturations (Leverett and Lewis,
1941; Oak, 1990; Corey et al., 1956). In fact, this
assumption is justified only if the rock is strongly
water-wet, a condition that is rarely met in practice.
The water relative permeability is typically obtained
from an oil–water primary drainage or waterflood ex-
periment. For strongly water-wet rocks, the choice is
not critical because the water relative permeabilities are
almost the same. For simulation purposes, however, it is
important that the water relative permeability be tabu-
lated for the full range of water saturations from the
connate water saturation Swc to the maximum water
saturation that can be achieved in the reservoir. In
enhanced oil recovery processes, the maximum water
Fig. 3. Gas relative permeability from an oil–gas–connate water
experiment.
saturation may be higher than that of the oil–water
waterflood experiment, 1�Sor(w), where Sor(w) is the
oil-to-water residual saturation. The water relative per-
meability from one of Oak’s experiments is shown in
Fig. 2.
The gas relative permeability would be measured in
an oil–gas experiment at connate water saturation. As
opposed to water, gas relative permeability is a strong
function of saturation history. For the simulation of
WAG systems, it is therefore necessary to consider a
saturation path of decreasing gas saturation also. In Fig.
3 we plot the gas relative permeability as a function of
gas saturation for two such experiments.
Because oil relative permeability is regarded as
dependent upon all saturations, one must enter two
experimental curves: the waterflood water–oil experi-
ment, kiro(w) (Fig. 4), and a gas flood gas–oil experiment
at connate water, kdro(g) (Fig. 5). Both experiments
evolve in the direction of decreasing oil saturation.
Fig. 5. Oil relative permeabilities from and oil–gas–connate water gas
flood experiment.

Fig. 6. Oil isoperms predicted by the Stone I model.
E.J. Spiteri, R. Juanes / Journal of Petroleum Science and Engineering 50 (2006) 115–139 119
2.2. Three-phase interpolation models
The water, gas, and oil relative permeabilities from
the two-phase experiments described above are then
used to determine oil relative permeabilities in three-
phase systems. Because oil relative permeability is a
function of all three fluid saturations, an interpolation
model is used to predict the relative permeability in the
three-phase region between the oil–water and gas–oil–
connate water saturation paths. The most common in-
terpolation models used in reservoir simulation are
Stone I and Stone II. Another classic method is the
saturation-weighted interpolation originally proposed
by Baker.
The Stone I model is usually implemented in com-
mercial simulators in the normalized version of Aziz
and Settari (1979). The oil relative permeability
obtained from the Stone I model is given by:
kro ¼So4k
iroðwÞk
droðgÞ
kroðwcÞ 1� Sw4ð Þ 1� Sg4� � ð1Þ
where
So4 ¼ So � Sor
1� Swc � Sorð2Þ
Sw4 ¼ Sw � Swc
1� Swc � Sorð3Þ
Sg4 ¼ Sg
1� Swc � Sorð4Þ
are the normalized phase saturations. In Eq. (1), kro(wc)is the oil relative permeability at connate water and
critical gas saturations. We have assumed that the crit-
ical gas saturation is zero. It is important to note that
kiro(w) is evaluated at So=1�Swc, and kdro(g) is evaluated
at So=1�Sg�Swc, that is, at different oil saturations
than the three-phase case being predicted. The residual
oil saturation Sor is not a constant. It will take a
different value depending on the amount of gas present,
and should be considered as a (possibly nonlinear)
function of gas saturation. If the residual oil saturation
is known, it may be input as a function of gas or water
saturation. When this information is not available, one
can resort to one of the residual oil saturation models
that have been proposed (Fayers and Matthews, 1984).
One possibility is to use a linear interpolation between
the limiting values Sor(w) and Sor(g):
Sor ¼ aSorðwÞ þ 1� að ÞSorðgÞ ð5Þ
where
a ¼ 1� Sg
1� Swc � SorðgÞ: ð6Þ
Often, the residual oil saturation is taken as the mini-
mum of the residual oil of the same displacement
processes:
Sor ¼ min SorðwÞ; SorðgÞ� �
: ð7Þ

Fig. 7. Oil isoperms predicted by the Stone II model.
E.J. Spiteri, R. Juanes / Journal of Petroleum Science and Engineering 50 (2006) 115–139120
In Fig. 6 we plot the oil isoperms obtained using the
Stone I interpolation model with the two-phase rela-
tive permeability data shown in Figs. 2–5. The iso-
perms are convex, especially in the region of low oil
saturations.
The Stone II model does not require a separate
interpolation of the residual oil saturation, and the
model actually predicts this curve. In normalized
form, the model is written as:
kro ¼ kroðcwÞk iroðwÞkroðcwÞ
þ kdrwðoÞ
!kdroðgÞ
kroðcwÞþ kdrgðoÞ
!" #:
ð8Þ
The two-phase relative permeabilities are evaluated at
the same saturation values as in the Stone I model. In
Fig. 7 we plot the oil isoperms obtained with the Stone
II model, when applied to the same two-phase relative
permeability data. The relative permeability contours
are convex near the OWedge, but become concave near
connate water. The predicted values in the region of low
oil saturation are much lower than those obtained with
the Stone I method.
The saturation-weighted interpolation model (or
Baker model) computes the oil relative permeability
as:
kro ¼Sw � Swcð Þk i
roðwÞ þ Sg� �
kdroðgÞ
Sw � Swcð Þ þ Sgð9Þ
where the two-phase relative permeabilities are evalu-
ated at the same oil saturation of the three-phase case,
that is:
k iroðwÞ ¼ k iroðwÞ 1� Soð Þ ¼ k iroðwÞ Sw þ Sg� �
kdroðgÞ ¼ kdroðgÞ 1� Swc � Soð Þ ¼ kdroðgÞ Sg þ Sw � Swc� �
:
ð10Þ
The oil isoperms predicted by Baker are given in Fig.
8. Other more sophisticated saturation-weighted inter-
polation models exist (Jerauld, 1997; Blunt, 2000), but
are not so widely used in reservoir simulation as the
three discussed above.
2.3. Relative permeability hysteresis
Hysteresis refers to irreversibility, or path depen-
dence. In multiphase flow, it manifests itself through
the dependence of the relative permeabilities and cap-
illary pressures on the saturation path and the saturation
history. From the point of view of pore-scale processes,
hysteresis has at least two sources: (1) contact angle
hysteresis: the advancing contact angle (of wetting
phase displacing a nonwetting phase) is much larger
than the receding contact angle (of wetting phase
retreating by nonwetting phase invasion); and (2) trap-
ping of the nonwetting phase: during an imbibition

Fig. 8. Oil isoperms predicted by the Baker model.
E.J. Spiteri, R. Juanes / Journal of Petroleum Science and Engineering 50 (2006) 115–139 121
process, a fraction of the nonwetting phase gets discon-
nected in the form of blobs or ganglia, becoming ef-
fectively immobile (trapped). Hysteresis effects are
larger in processes with strong flow reversals. This is
the case of WAG injection, in which the gas phase is
trapped during waterflooding after a gas flood.
Trapping and hysteresis have been successfully
explained in terms of the displacement mechanisms
that take place at the pore scale (Lenormand et al.,
1983), and successfully modeled using pore-network
simulation tools. Consider a medium that is initially
filled with water. The solid grains are made of minerals
that are naturally wetting to water and, therefore, the
medium is initially water-wet. During oil migration into
the reservoir, the nonwetting oil phase invades the pore
space. This is a drainage process in which the only
mechanism for displacement of water by oil is piston-
type displacement—the oil invades the porous medium
in the form of a continuous, connected cluster. Water,
however, remains present not only in small pores that
have not been filled with oil but also in the corners and
crevices of the pores that have been invaded. The rock
will have its wettability altered where the solid surface is
in direct contact with the oil, leading to a mixed-wet
scenario in which each pore has water-wet and oil-wet
fractions (Kovscek et al., 1993). Consider now the
displacement of the oil by waterflooding. During this
process, there are several physical mechanisms by
which the water can displace the oil (Lenormand et
al., 1983). In addition to piston-type displacement, co-
operative pore-body filling and snap-off may occur.
Which displacement mechanism dominates depends
on the degree of wettability alteration. For mild wetta-
bility alteration (weakly water-wet rocks) snap-off is the
dominant mechanism. The important point is that snap-
off and cooperative filling may lead to disconnection
and bypassing of oil, whose macroscopic consequences
are trapping and relative permeability hysteresis. The
conceptual picture of fluid displacements and trapping
holds for three-phase systems as well, but the character-
ization of wettability, fluid configurations within the
pore space and disconnection–reconnection of clusters
is far more complicated (Piri and Blunt, 2005a,b).
A number of hysteresis empirical models have been
developed to characterize the relative permeabilities
and trapped saturation of the nonwetting phase after a
flow reversal. In accordance with the pore-scale expla-
nation given above, experimental data strongly suggest
that the nonwetting phase experiences much more pro-
nounced hysteresis than the wetting phase. Therefore,
in water-wet systems, the gas phase shows the largest
hysteretic effects, and oil displays hysteresis in water–
oil systems, but much less so in oil–gas displacements
at connate water.
2.3.1. Two-phase hysteresis models
The most important quantity determining the signif-
icance of hysteresis effects is the trapped nonwetting-

Fig. 9. Critical end point saturations to evaluate Land trapping coef-
ficient.
ig. 10. Relative permeability curves in drainage–imbibition cycles,
calculated from the two-phase Carlson hysteresis model.
E.J. Spiteri, R. Juanes / Journal of Petroleum Science and Engineering 50 (2006) 115–139122
phase saturation after a flow reversal (for trapped gas,
we denote this saturation as Sgt). Most relative perme-
ability models that incorporate hysteresis (Killough,
1976; Lenhard and Parker, 1987; Lenhard and Oos-
trom, 1998; Jerauld, 1997; Blunt, 2000) are based on
the trapping model proposed by Land (1968). In this
model, the trapped nonwetting phase saturation is com-
puted as:
Sgt ¼ Sgc þSg;hy � Sgc
1þ C Sg;hy � Sgc� � ð11Þ
where Sgc is the critical gas saturation, Sg,hy is the gas
saturation at the flow reversal, and C is the Land
trapping parameter. The Land coefficient is computed
from the bounding drainage and imbibition curves as
follows:
C ¼ 1
Sgt;max � Sgc� 1
Sg;max � Sgcð12Þ
where Sg,max is the maximum gas saturation, and Sgt,max
is the maximum trapped gas saturation, associated with
the imbibition bounding curve. All these quantities are
illustrated in Fig. 9. The value of the Land trapping
parameter is dependent on the type of rock and fluids.
Here, we describe two common models that incor-
porate hysteresis in two-phase systems: the model pro-
posed by Killough (1976) and the one proposed by
Carlson (1981).
In Killough’s method, the nonwetting phase relative
permeability along a scanning curve–such as the one
depicted in Fig. 9–is computed as:
k irg Sg� �
¼k irgðoÞ Sg;norm� �
kdrgðoÞ Sg;hy� �
kdrgðoÞ Sg;max
� � ð13Þ
where
Sg;norm ¼ Sgt;max þSg � Sgt� �
Sg;max � Sgt;max
� �Sg;hy � Sgt
: ð14Þ
In Eq. (13), kirg(o) and kdrg(o) represent the relative per-
meability values on the bounding imbibition and drain-
age curves, respectively.
In Carlson’s model, the scanning curve is assumed
to be parallel to the imbibition curve. It is obtained by
shifting the bounding imbibition curve horizontally
until it intersects the saturation at the flow reversal.
A common feature of both models (and most other
btwo-phaseQ relative permeability hysteresis models) is
that the scanning imbibition curve is assumed to be
representative of any subsequent drainage process.
This breversibilityQ of the relative permeability curves
is exemplified in Fig. 10 with an actual simulation using
the Carlson model. As we demonstrate in the next sec-
tion, this behavior is not supported by experimental data.
2.3.2. Three-phase hysteresis models
The assumption of reversibility of the drainage and
imbibition scanning curves is inappropriate. Gas rela-
tive permeability is higher when displacing oil only
than when displacing a water–oil mixture after a wa-
terflood. As a result, relative permeabilities do not
follow the secondary drainage path predicted by the
two-phase models. In addition, it is often observed that
water permeability is reduced after gas injection (al-
though we have found that this is a second order effect).
A number of so-called bthree-phaseQ hysteresis models
have been developed to account for irreversibility in the
relative permeability scanning curves (Lenhard and
Parker, 1987; Lenhard and Oostrom, 1998; Larsen
and Skauge, 1998; Egermann et al., 2000).
F

E.J. Spiteri, R. Juanes / Journal of Petroleum Science and Engineering 50 (2006) 115–139 123
The gas relative permeabilities on the scanning
curves are modeled by (Larsen and Skauge, 1998):
k irg Sg� �
¼ kdrgðoÞ Sgf� �
ð15Þ
where Sgf is a flowing gas saturation,
Sgf ¼ Sgc þ1
2
(Sg � Sgt� �
þffiffiffiffiffiffiffiffiffiffiffiffiffiffiffiffiffiffiffiffiffiffiffiffiffiffiffiffiffiffiffiffiffiffiffiffiffiffiffiffiffiffiffiffiffiffiffiffiffiffiffiffiSg � Sgt� �2 þ 4
CSg � Sgt� �r ) ð16Þ
and the drainage relative permeability curve is given
by:
kdrg Sg; Sstartw ; Sstartg
� �¼ kirg Sstartg
� �þ kdrg oð Þ Sg
� ��kdrg oð Þ S
startg
� �� � Swc
Sstartw
�a
:
ð17Þ
Therefore, the required data is the drainage bounding
relative permeability curve kdrg(o)(Sg), the Land trapping
coefficient C, and a secondary drainage reduction co-
efficient a. A representative evolution of the gas rela-
tive permeability after a sequence of water and gas
floods is shown in Fig. 11. The model accounts for
cyclic irreversibility, and the differences with respect to
Fig. 10 are apparent.
3. Comparison with relative permeability data
We investigate the accuracy of relative permeability
models by comparing the model predictions with ex-
perimental data. We used the experimental data of Oak
(1990), which is one of the most extensive and reliable
Fig. 11. Gas relative permeability scanning curves calculated with a
three-phase hysteresis model.
data sets available. It comprises over 2000 two-phase
and three-phase relative permeability measurements,
following a wide range of saturation paths. We selected
the experiments corresponding to the saturation paths
shown in Fig. 12. The individual experiments can be
organized into three experiments (Experiments 1–3),
each of which consists in a sequence of four different
saturation paths. Path 1 corresponds to a water–oil
primary drainage experiment where oil is injected
until connate water saturation is reached. Path 2 is a
waterflood experiment, which continues until residual
oil. Path 3 simulates a gas injection process, in which
oil is expelled from the system, reaching a lower resid-
ual value. Path 4 is representative of waterflooding
after a gas flood; water is injected, displacing gas and
some additional oil which had previously been remo-
bilized during the gas injection phase.
Several measurements of relative permeability were
taken along each displacement path. For each saturation
state, we compare relative permeabilities calculated
from different models with the actual relative perme-
abilities measured in the experiment. We illustrate
graphically the accuracy of the model by constructing
a scatter plot of calculated vs. measured relative per-
meability. We investigate separately the validity of the
water permeability model, the oil interpolation model,
and the gas hysteresis model.
3.1. Water relative permeabilities
Our objective here is to evaluate the common as-
sumption that water relative permeability is a function
of water saturation alone, and independent of the satu-
ration history. We compare the water relative perme-
ability measured along each of the displacement paths
1–4 against the bmodeledQ water relative permeabili-
ty—which is nothing else than the curve in Fig. 2,
corresponding to the primary drainage oil–water dis-
placement. We construct the scatter plots in Fig. 13 by
gathering the water saturations from each experiment,
interpolating their water relative permeabilities from the
drainage curve in Fig. 2, and plotting them against the
experimental values. The predicted relative permeabil-
ities for the first displacement path are accurate for all
three experiments. In the following waterflood (path 2),
the predicted relative permeabilities slightly underesti-
mate the measured values at low saturations. During the
gas injection process (path 3), the water relative perme-
abilities marginally overestimate the experimental
values. The largest errors in the predictions occur for
path 4, that is, a waterflood after a gas flood. The
predicted relative permeabilities overestimate the exper-

Fig. 12. Saturation paths of selected experiments from Oak’s relative permeability data.
E.J. Spiteri, R. Juanes / Journal of Petroleum Science and Engineering 50 (2006) 115–139124
imental values. This is consistent with the observation
that water mobility is reduced after a gas flood. We
conclude, however, that for most displacement process-
Fig. 13. Correlation between modeled and experimental wa
es in water-wet media, water relative permeabilities
obtained from the primary drainage oil–water experi-
ment are sufficiently accurate.
ter relative permeabilities for each displacement path.

Fig. 14. Correlation between modeled and experimental oil relative permeability for two-phase displacement (paths 1 and 2).
E.J. Spiteri, R. Juanes / Journal of Petroleum Science and Engineering 50 (2006) 115–139 125
3.2. Three-phase interpolation models for oil relative
permeability
We investigate the accuracy of Stone I, Stone II, and
Baker models for interpolating oil relative permeability
from two-phase data. As a preliminary step, we analyze
the variability of measured oil relative permeabilities
along the two-phase paths (paths 1 and 2). The scatter
plots in Fig. 14 were obtained by comparing the inter-
polated data from Fig. 4 with the measured oil relative
permeability from each experiment. The variability is
small for the primary drainage experiment. For the
waterflood experiment, however, the predicted relative
permeabilities are accurate for high oil saturations but
show more variability for low oil saturations.
We now assess the validity of interpolation models
for oil relative permeability in three-phase flow scenar-
ios (paths 3 and 4). Interpolated values are plotted
against measured relative permeabilities to generate
scatter plots.
The correlation between experimental and predicted
oil relative permeability using the Stone I method is
shown in Fig. 15. Eq. (7) was used to model the
Fig. 15. Correlation between Stone I interpolation and experimental re
residual oil saturation. Other residual oil models pro-
duced a less satisfactory correlation. In a gas injection
process (path 3), the Stone I model predicts the oil
relative permeability well for high oil saturations, but
overestimates oil relative permeabilities as saturations
decrease. For a waterflood after gas injection (path 4),
Stone I yields a fair prediction in this case.
The oil relative permeability correlation obtained
with the Baker model is shown in Fig. 16. For path 3,
the correlation is good in the region of low oil relative
permeability, but the model significantly underesti-
mates the relative permeability for oil relative perme-
ability greater than 0.01. For path 4, the Baker model
underestimates the oil relative permeability for the en-
tire saturation span.
The Stone II model underestimates the relative per-
meabilities for paths 3 and 4 so severely, that the scatter
plot does not give any information. This result was ex-
pected, given that the saturation paths are in the region
where Stone II predicts zero permeability (Fig. 17).
In conclusion, when compared to experimental data,
the Stone I model performed the best relative to Stone II
and Baker for both processes of interest (gas injection
lative permeabilities, with a residual oil model given by Eq. (7).
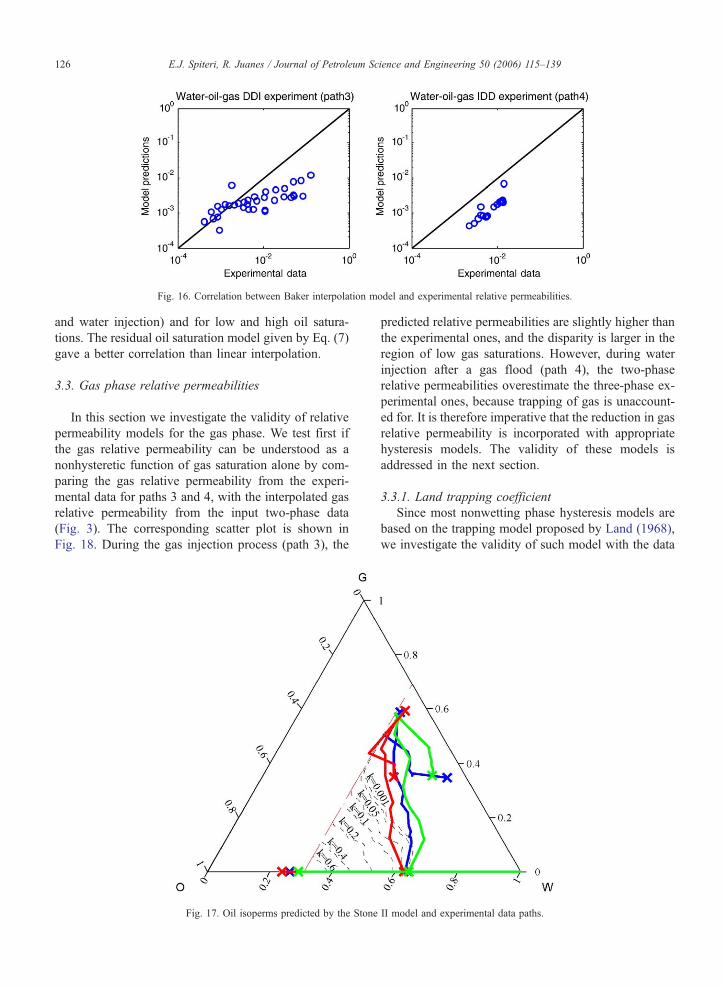
Fig. 16. Correlation between Baker interpolation model and experimental relative permeabilities.
E.J. Spiteri, R. Juanes / Journal of Petroleum Science and Engineering 50 (2006) 115–139126
and water injection) and for low and high oil satura-
tions. The residual oil saturation model given by Eq. (7)
gave a better correlation than linear interpolation.
3.3. Gas phase relative permeabilities
In this section we investigate the validity of relative
permeability models for the gas phase. We test first if
the gas relative permeability can be understood as a
nonhysteretic function of gas saturation alone by com-
paring the gas relative permeability from the experi-
mental data for paths 3 and 4, with the interpolated gas
relative permeability from the input two-phase data
(Fig. 3). The corresponding scatter plot is shown in
Fig. 18. During the gas injection process (path 3), the
Fig. 17. Oil isoperms predicted by the Stone
predicted relative permeabilities are slightly higher than
the experimental ones, and the disparity is larger in the
region of low gas saturations. However, during water
injection after a gas flood (path 4), the two-phase
relative permeabilities overestimate the three-phase ex-
perimental ones, because trapping of gas is unaccount-
ed for. It is therefore imperative that the reduction in gas
relative permeability is incorporated with appropriate
hysteresis models. The validity of these models is
addressed in the next section.
3.3.1. Land trapping coefficient
Since most nonwetting phase hysteresis models are
based on the trapping model proposed by Land (1968),
we investigate the validity of such model with the data
II model and experimental data paths.

Fig. 18. Comparison of gas relative permeability for different three-phase displacements (paths 3 and 4) with the two-phase gas relative permeability
from an oil–gas gas flood experiment.
E.J. Spiteri, R. Juanes / Journal of Petroleum Science and Engineering 50 (2006) 115–139 127
available. A rigorous analysis of its validity would
require a series of scanning curves with different gas
saturations Sg,hy at flow reversal. One would then com-
pare the predicted trapped gas saturation Sgt obtained
from Eq. (11) with the experimental one. We did not
have access to this type of experimental data, and we
limited our analysis to computing the Land trapping
coefficient from the bounding drainage and imbibition
curves of Oak’s two-phase experiments. Values of the
Land trapping coefficient for different experiments are
plotted (in increasing order) in Fig. 19. The experiments
are grouped by the pair of fluids (water–gas, oil–gas, or
water–oil), and the rock sample (200 md, 800 md, or
1000 md Berea sandstone). It is apparent that the Land
parameter is far from being constant. We recall that,
according to Eq. (11), large values of C indicate less
nonwetting phase trapping. The value of the Land
Fig. 19. Land trapping coefficient calculated from two-phase data, with diffe
(200, 800, 1000 md).
trapping parameter depends crucially on the pair of
fluids used, and the permeability of the medium. For
the same rock sample (say, the 1000 md core), the
amount of trapping in a gas–oil system is larger than
in a gas–water system, which in turn is larger than in an
oil–water system. This behavior can be attributed to
differences in the advancing contact angle among the
three systems. Since the medium is weakly water-wet
(small contact angles), trapping is controlled by snap-
off (Al-Futaisi and Patzek, 2003; Valvatne and Blunt,
2004). In reproducing the experimental data, Piri and
Blunt (2005b) employed contact angles that, on aver-
age, satisfied the following ordering: hgobhgwbhow. Asmaller contact angle implies more snap-off events and,
macroscopically, more trapping. In the case of Oak’s
experiments, the Land coefficient varies between 0.7
and 2.2. Such variation illustrates the need for a judi-
rent pairs of fluids (water (W), oil (O), gas (G)) and rock permeability

Fig. 20. Oil relative permeability in an oil–water experiment, showing
irreversibility of the waterflood scanning curve.
E.J. Spiteri, R. Juanes / Journal of Petroleum Science and Engineering 50 (2006) 115–139128
cious choice of the Land trapping parameter in numer-
ical simulations. In addition, a recent study (Element et
al., 2003) has shown that, for an intermediate-wet rock,
the Land trapping coefficient will also vary between
hysteresis cycles. They found that the Land parameter
increases for each subsequent waterflood, indicating
that the trapped gas saturation decreases.
3.3.2. Two-phase hysteresis models
We now test the applicability of two-phase hysteresis
models of gas relative permeability to a three-phase
Fig. 21. Scatter plot for Killough’s two-phase hystere
imbibition process. The use of these models implies
the assumption of reversibility of the imbibition scan-
ning curves during a subsequent drainage process (Fig.
10). This behavior is not supported by experimental
data. In Fig. 20 we plot the oil relative permeability
measured in an oil–water experiment–where oil is the
nonwetting phase–which shows clearly that the imbibi-
tion scanning curve is not reversible.
In Fig. 21 we show the comparison between the
gas relative permeability predicted by Killough’s two-
phase hysteresis method and experimental data
corresponding to water injection after a gas flood
(path 4). As anticipated from Fig. 20, the model over-
estimates gas relative permeability significantly. The
gas relative permeability correlation for path 4 using
Carlson’s method is shown in Fig. 22. Because this
method uses the entire bounding imbibition curve
(instead of the Land trapping parameter alone), the
agreement between model and experiments is better.
However, the gas relative permeabilities are consis-
tently overestimated as well.
3.3.3. Three-phase hysteresis models
These models relax the assumption of reversibility
of scanning curves, and allow for reduction of the gas
relative permeability during gas injection following a
waterflood. The method by Larsen and Skauge (1998)
uses the Land trapping coefficient C and the perme-
ability reduction parameter a to define the scanning
sis model for a three-phase waterflood (path 4).

Fig. 22. Scatter plot for Carlson’s two-phase hysteresis model for a three-phase waterflood (path 4).
E.J. Spiteri, R. Juanes / Journal of Petroleum Science and Engineering 50 (2006) 115–139 129
curves. The correlation between predicted and experi-
mental gas relative permeabilities along path 4 is shown
in Fig. 23. Predictions improve–albeit slightly–with
respect to Killough’s model on which the three-phase
model is based. It is possible, however, that the agree-
ment could improve with an optimal choice of the
reduction coefficient a.
Fig. 23. Scatter plot of gas relative permeability predicted by the WAG t
3.4. Summary and discussion
We summarize the main findings from our analysis
of Oak’s experimental data in the following four points:
(1) In water-wet rocks, the water relative permeabil-
ity does not show significant dependence on the
hree-phase hysteresis model for a three-phase waterflood (path 4).

Fig. 24. Three-dimensional view of the synthetic model.
E.J. Spiteri, R. Juanes / Journal of Petroleum Science and Engineering 50 (2006) 115–139130
saturation path or saturation history. Experimental
data show, however, a slight reduction in water
mobility after a gas flood.
(2) Commonly used interpolation models of oil rela-
tive permeability yield very different results, es-
pecially in the region of low oil saturation. The
residual oil saturation model to be used in com-
bination with Stone I interpolation should be
carefully chosen (in our case, the model given
in Eq. (7) performed better than linear interpola-
tion). The Stone II method may severely under-
estimate the oil relative permeability.
(3) The Land trapping coefficient is a crucial pa-
rameter in many hysteretic relative permeability
models. Experimental data suggest that this co-
efficient may vary significantly depending on
the advancing contact angle.
(4) Hysteretic relative permeability models currently
available in commercial reservoir simulators (Kill-
ough, 1976; Carlson, 1981; Larsen and Skauge,
Table 1
Dry gas PVT properties
Pressure (psia) Gas FVF (rb/stb) Viscosity (cP)
14.7 192.5 0.0107
145.0 18.99 0.0109
290.1 9.242 0.0111
435.1 5.997 0.0114
580.2 4.374 0.0117
725.2 3.404 0.0121
870.2 2.759 0.0126
1015.3 2.301 0.0131
1305.3 1.699 0.0144
1740.5 1.199 0.0171
2175.6 0.928 0.0205
1998) tend to overestimate the gas relative perme-
ability during cyclic water/gas injection.
The limited ability of commonly used relative per-
meability models to reproduce water-alternating-gas
three-phase scenarios translates into a source of un-
certainty in the numerical simulations. In the follow-
ing two sections, we illustrate the impact that the
choice of the relative permeability model has on
field-scale predictions, which can impact the selection
of recovery strategies and other reservoir management
decisions.
4. Representative numerical simulations
In this section we report the results of numerical
simulations for a synthetic, homogeneous, two-dimen-
ig. 25. Recovery efficiency for the synthetic case, using different oil
Frelative permeability interpolation models.

Fig. 26. Oil isoperms calculated by the Stone I model, and saturation path in grid block (12,12,1) of the synthetic reservoir.
E.J. Spiteri, R. Juanes / Journal of Petroleum Science and Engineering 50 (2006) 115–139 131
sional reservoir. The complexity of the reservoir model
was kept to a minimum, in order to isolate the effects of
(1) the oil relative permeability interpolation model,
and (2) the hysteresis model. We used the commercial
black-oil simulator Eclipse 100 (Schlumberger Geo-
Quest, 2003).
Fig. 27. Oil isoperms calculated by the Stone II model, and satur
4.1. Description of the model
We consider a quarter of a five-spot pattern in a
homogeneous, horizontal reservoir (Fig. 24). The po-
rosity is 0.2 and the horizontal permeability is 200 md,
which coincides with the absolute permeability of the
ation path in grid block (12,12,1) of the synthetic reservoir.

Fig. 28. Oil isoperms calculated by the Baker model, and saturation path in grid block (12,12,1) of the synthetic reservoir.
E.J. Spiteri, R. Juanes / Journal of Petroleum Science and Engineering 50 (2006) 115–139132
core from which the relative permeability values were
measured. The domain is discretized into 25�25�1
grid blocks, each of dimension 40�40�100 ft. The
total pore volume is 2�107 ft3.
We used relative permeability data from the Oak
experiments, reported in Figs. 2–5. Capillary pressure
was ignored in this study.We employed very simple PVT
data, representative of immiscible fluids (dead oil and
dry gas). For simplicity, we took the water density and
viscosity as 62.4 lb/ft3 and 1 cP, respectively. The oil
Table 2
Summary of simulation results for the synthetic reservoir test case
Case Recovery scheme Hysteresis model Interpo
model
1 Waterflood (base case 1) None None
2 WAG (base case 2) None Baker
3 WAG (base case 2) None Stone
4 WAG (base case 2) None Stone
5 WAG Carlson Baker
6 WAG Carlson Stone
7 WAG Carlson Stone
8 WAG Killough Baker
9 WAG Killough Stone
10 WAG Killough Stone
11 WAG 3-Phase WAG Baker
12 WAG 3-Phase WAG Stone
13 WAG 3-Phase WAG Stone
14 WAG 3-Phase WAG Stone
15 WAG 3-Phase WAG Stone
16 WAG 3-Phase WAG Stone
density and viscosity are 43.7 lb/ft3 and 2 cP, respective-
ly. The formation volume factor of water and oil is taken
as exactly 1 rb/stb. The PVT properties of gas are given
in Table 1 as functions of pressure. The gas density at a
reference pressure of 14.7 psia is 0.063 lb/ft3. At average
reservoir conditions (about 2000 psia), the gas formation
volume factor is approximately equal to 1 rb/stb, and the
gas viscosity is approximately equal to 0.02 cP.
The reservoir is initially saturated with oil and con-
nate water, and the initial reservoir pressure is 2000
lation Land
parameter (C)
% Recovery % Difference
from base case
N/A 49.0% 0.0%
N/A 50.8% 0.0%
I N/A 57.9% 0.0%
II N/A 55.9% 0.0%
0.78 53.2% 4.7%
I 0.78 63.4% 9.5%
II 0.78 60.1% 7.5%
0.78 53.3% 4.9%
I 0.78 62.8% 8.5%
II 0.78 60.0% 7.3%
0.78 53.5% 5.3%
I 0.78 66.8% 15.4%
II 0.78 59.2% 5.9%
I 0.5 67.0% 15.7%
I 1 65.4% 13.0%
I 2 63.1% 9.0%

Fig. 29. Recovery efficiency predicted by each hysteresis model using
the Stone I interpolation model.
Fig. 30. Recovery efficiency for the WAG three-phase model and
the Stone I interpolation model, using different Land trapping
coefficients.
E.J. Spiteri, R. Juanes / Journal of Petroleum Science and Engineering 50 (2006) 115–139 133
psia. During the first 5 yr, one pore volume of water is
injected. After water injection, most of the reservoir
contains oil at residual saturation to water. Since the
residual oil saturation to gas is significantly lower than
the residual oil saturation to water (SorgbSorw), gas is
then injected to produce more oil. A WAG injection
scheme is then adopted, by injecting and producing one
pore volume of fluid every 5 yr, with a 1:1 WAG ratio.
The injectors are controlled by voidage replacement, so
the volume of fluid injected is the same as the volume
produced. The producer is set to a target oil rate of 1000
rb/day, with a limit in the bottom hole pressure (BHP)
of 1900 psi.
The effect of the interpolation model and the hys-
teresis model was studied by comparing recovery effi-
ciencies, saturation paths, gas–oil ratios (GOR), and
watercut (WCT).
4.2. Effect of the three-phase interpolation model
Recovery efficiency–the ratio of cumulative oil pro-
duction to original oil in place–predicted by different
interpolation models is shown in Fig. 25. The recovery
efficiency after 30 yr of production varies between
50.8% and 57.9% (a 14.0% difference) depending on
the interpolation model used. The Stone I model predicts
the highest recovery and the saturation-weighted model
(Baker) predicts the lowest. This result can be easily
explained in terms of the oil isoperms calculated by each
model. In Figs. 26–28 we plot the oil isoperms predicted
by Stone I, Stone II and Baker, respectively, as well as
the path describing the evolution of the fluid saturations
in a grid block at the center of the reservoir model. The
initial saturation state is marked with a square (5), and
corresponds to a porous medium saturated with oil and
connate water. During the first waterflood, the oil satu-
ration decreases and the water saturation increases.
Since the reservoir is under two-phase conditions, the
saturation path corresponding to the initial waterflood is
identical for all three interpolation models. Differences
arise, however, during gas injection. Because of the
convexity of the oil isoperms in the Stone I model, the
oil relative permeability increases significantly, from a
value of 0.001 at the end of the water flood to 0.05 at the
end of gas injection. An analogous increase occurs for
the Stone II model. For the Baker model, on the other
hand, the oil isoperm is essentially parallel to the satu-
ration path, and the oil relative permeability is less than
0.01 throughout the gas injection process. This marked
difference in the shape of the oil isoperms explains the
much lower recovery predicted by the Baker model. We
recall that the Stone I model is the one that agrees with
experimental data best.
4.3. Effect of the hysteresis model
We study the impact of relative permeability hyster-
esis on WAG simulation. We included in our analysis
the hysteretic models of Killough and Carlson, as well
as the three-phase extension due to Larsen and Skauge.
We used the same two-phase relative permeability data
as described before. Whenever necessary, we employed
the Land trapping coefficient C =0.78–obtained from
the two-phase relative permeabilities–and a reduction
coefficient a =0.01.We analyzed all possible combinations of hysteresis
models for the gas phase–Killough, Carlson and WAG–
and interpolation models for the oil phase—Stone I,
Stone II and Baker. A summary of the results for all the
test cases is given in Table 2. As an illustrative exam-

Fig. 31. WAG saturation path at grid block (2,2,1) for different hysteresis models, using Stone I interpolation model.
E.J. Spiteri, R. Juanes / Journal of Petroleum Science and Engineering 50 (2006) 115–139134
ple, we plot in Fig. 29 the recovery efficiency predicted
for different hysteresis models, when the Stone I inter-
polation model is used. The base case corresponds to
the simulation with no hysteresis which, as described
earlier, attains a recovery efficiency of 57.9% after 35
yr of production. During the initial WAG cycle–the first
10 yr–all models give the same results because the
system has not experienced a flow reversal yet. Differ-
ences arise between the hysteretic and nonhysteretic
models at the beginning of the second WAG cycle,
because gas is trapped during water injection. The
Fig. 32. Gas–oil ratio using the three-phase WAG hysteresis model for
different interpolation models.
two-phase and three-phase models, however, give es-
sentially the same predictions. This is no longer the
case after the second gas injection phase, because the
three-phase model accounts for the reduction in the gas
relative permeability, whereas the two-phase models do
not. Reduced gas mobility results in a better sweep
efficiency, therefore explaining the improved recovery
predicted by the three-phase model.
4.4. Effect of the Land trapping coefficient
Most hysteresis models need a Land trapping coef-
ficient as input, which is used to characterize the
amount of trapped gas saturation at the flow reversal.
The Land parameter depends on fluid and rock proper-
ties, and the displacement process. From the analysis of
Oak’s experimental data, we saw that Land trapping
coefficient takes values between 0.5 and 2.0. Here, we
analyze the sensitivity of WAG simulations to the Land
trapping coefficient. We run simulations using the
Stone I interpolation model and the three-phase WAG
hysteresis model, with different values of C. In Fig. 30
we plot the recovery efficiency obtained for different
values of the Land trapping coefficient. The simulated
recovery increases as the trapping coefficient decreases.
A smaller trapping coefficient indicates higher trapped
gas saturation during an imbibition process and, as a
result, better sweep efficiency and higher simulated
recovery. The improvement in recovery efficiency

Fig. 33. Horizontal permeability distribution (md) of the PUNQ-S3 model.
E.J. Spiteri, R. Juanes / Journal of Petroleum Science and Engineering 50 (2006) 115–139 135
from the base case–no hysteresis–is 9% and 16%, for a
Land trapping coefficient of 2.0 and 0.5, respectively.
4.5. Summary and discussion
Hysteresis effects are in fact responsible for the
efficacy of water-alternating-gas injection. Water injec-
tion after a gas flood traps some of the free gas present
in the reservoir. This is shown in Fig. 31, where we plot
the evolution of saturations at a location of the reservoir
during a WAG process, as predicted by hysteretic and
nonhysteretic relative permeability models. Hysteretic
models account for the fact that not all gas is displaced
Fig. 34. Initial fluid distribution and location of injectio
after water injection. Trapping of the gas phase is
indeed beneficial, as it reduces the overall gas mobility,
which results in better sweep efficiency and fluid pro-
duction with lower gas–oil ratio (GOR), as shown in
Fig. 32.
The results of the simulations presented here indicate
that WAG simulation is quite sensitive to the treatment
of relative permeability hysteresis. Depending on the
hysteretic model used, predictions of oil recovery may
be as much as 15% higher than without hysteresis
(Table 2). Among the different models typically avail-
able in reservoir simulators, the largest improvements
in recovery predictions are obtained with the three-
n and production wells in the PUNQ-S3 model.

Fig. 35. Recovery efficiency in the PUNQ-S3 reservoir model for
different interpolation models, without hysteresis.
ig. 36. Recovery efficiency in the PUNQ-S3 reservoir model for
ifferent hysteresis models, and the Stone I interpolation model.
E.J. Spiteri, R. Juanes / Journal of Petroleum Science and Engineering 50 (2006) 115–139136
phase WAG hysteresis model in combination with the
Stone I interpolation method. This choice is precisely
the one that agrees with experimental data best.
5. WAG injection in a realistic reservoir
We now extend our study of the impact of relative
permeability hysteresis on WAG injection to a realistic
reservoir. The objective is to determine whether hyster-
esis continues to play an important role for geometri-
cally complex, heterogeneous reservoir models with
multiple injection and production wells. For this pur-
pose we selected the PUNQ-S3 model, which is a well-
known reservoir model originally developed as a test
case for production forecasting under uncertainty. All
the simulations were conducted with the Eclipse 100
black-oil reservoir simulator.
5.1. Description of the model
The original PUNQ-S3 model is described in detail
elsewhere (Floris et al., 2001), and the model data is
publicly available for download (http://www.nitg.
tno.nl/punq/cases/index.shtml). We modified the origi-
nal model slightly to study hysteresis effects by imple-
menting a WAG injection scenario.
The geometry of the model is characterized by a
dome with a small gas cap in the center. It is bounded
by sealing faults on all sides and contains five layers of
fluvial sand and shale. The top of the reservoir is at a
depth of 7677 ft. The average reservoir thickness is 92
ft. The reservoir is discretized into 19�28�5 grid
blocks, of which 1761 blocks are active. The x and y
dimension of each block is 590 ft. The average porosity
is 0.2, and the average horizontal permeability is 100
md. The anisotropy ratio is about 3. A map of the
absolute permeability is shown in Fig. 33. The reservoir
pore volume is almost 200 million barrels with an initial
oil saturation of about 60% and an initial reservoir
pressure of 3670 psia. The fluid distribution map is
shown in Fig. 34.
We modified the original PUNQ-S3 model by
changing the injection and production scheme, and
the fluid composition. We used the same PVT and
relative permeability data as in the synthetic model of
the previous section. Well locations are also slightly
different from the original model. Our model has four
injection wells and four production wells, open to the
third, fourth, and fifth layers of the reservoir. The
production wells operate at a fixed bottom hole pressure
of 2000 psia. The injection wells are rate controlled,
and inject 6290 rb/day each (25,160 rb/day total). The
WAG ratio is 1:1 with a slug size of 0.1 pore volumes,
which was found to be an optimum operation scheme
(Cakici, 2003). We simulated three WAG cycles of
2500 days each for a total simulation time over 7500
days (21 yr).
Here we test the sensitivity of the interpolation
model and the hysteresis models against a base case
model without hysteresis.
5.2. Effect of the interpolation model
The oil recovery efficiency for different interpolation
models (Stone I, Stone II and Baker) is plotted in Fig.
35. As for the synthetic case, the Stone I model predicts
the highest recovery. In this case, the Stone II and
Baker models give very similar results. The models
deviate from one another during the gas injection
F
d

Table 3
Summary of simulation results for the PUNQ-S3 test case
Case Recovery scheme Hysteresis model Interpolation
model
Land parameter
(C)
% Recovery % Difference
from base case
1 WAG-PUNQS3 (base case) None Baker N/A 53.9% 0.0%
2 WAG-PUNQS3 (base case) None Stone I N/A 57.7% 0.0%
3 WAG-PUNQS3 (base case) None Stone II N/A 53.0% 0.0%
4 WAG-PUNQS3 Carlson Stone I N/A 59.3% 2.8%
5 WAG-PUNQS3 3P WAG model Stone I 0.78 62.9% 9.0%
E.J. Spiteri, R. Juanes / Journal of Petroleum Science and Engineering 50 (2006) 115–139 137
phases, which is when a large fraction of the reservoir is
in three-phase flow conditions. The difference in pre-
dicted recovery between the Stone I and Baker models
after 25 yr of production is about 7.9%, which is less
than the differences observed in the synthetic case.
Here, the impact of the interpolation model is slightly
less significant because of the effects of gravity and
heterogeneity.
5.3. Effect of the hysteresis model
The impact of using a hysteretic relative permeabil-
ity model for oil recovery prediction is shown in Fig.
36. Recovery efficiency obtained by using Killough’s
two-phase hysteresis model and the WAG three-phase
hysteresis model is compared with the recovery effi-
ciency predicted with a nonhysteretic model. Differ-
ences of up to 9.4% in ultimate recovery are
obtained. Although not as dramatic as for the synthetic
case, the impact of relative permeability hysteresis is
still very significant. For this system, the choice of
incorporating hysteresis effects is more important than
the interpolation model used for the oil relative perme-
ability. A summary of the results from the simulations
of the PUNQ-S3 model is given in Table 3.
6. Conclusions
The results of this investigation support the view that
WAG injection cannot be modeled correctly without
accounting for hysteresis effects. Our analysis has two
key components: (1) evaluating the ability of several
widely used three-phase relative permeability models to
reproduce experimental data under WAG conditions,
and (2) assessing the impact of the choice of the
interpolation model and the hysteresis model on the
simulation of WAG processes.
We used the three-phase relative permeability data
of Oak (1990) for the validation of relative permeabil-
ity models. We found that the most common relative
permeability interpolation models (Stone, 1970, 1973;
Baker, 1988) yield very different results, especially in
the region of low oil saturation. This is precisely the
region of interest in WAG applications. Common
btwo-phaseQ hysteretic models (Killough, 1976; Carl-
son, 1981) account for trapping of the nonwetting
phase, but fail to reproduce the irreversibility of rela-
tive permeability scanning curves. When implemented
in reservoir simulators, these models overestimate the
gas relative permeability during gas injection following
a waterflood. Of the models currently available, the
one proposed by Larsen and Skauge (1998) is pre-
ferred in view of its enhanced representation of hys-
teresis (nonreversibility of scanning curves) and better
agreement with experimental data. However, the ability
of the model to reproduce experimental measurements
is limited, especially during water and gas cyclic in-
jection. Therefore, more work is needed to improve
current relative permeability models and enhance the
ability of reservoir simulators to model immiscible
WAG processes.
We then investigated the impact of the relative
permeability model on the numerical prediction of
field-scale WAG processes. We first analyzed a simple
two-dimensional, homogeneous reservoir, to isolate
the effects of the oil interpolation model and the gas
hysteresis model. We found that bthree-phaseQ hyster-esis models lead to much larger recovery predictions
than nonhysteretic models, because they account for
the reduced mobility due to trapping of the gas phase
during water injection. Depending on the interpolation
model used, the difference in recovery efficiency
could be as large as 15%. These findings were then
confirmed by the simulation of WAG injection in the
PUNQ-S3 model: a realistic, three-dimensional, het-
erogeneous reservoir, with multiple injection and pro-
duction wells.
Nomenclature
krw water relative permeability in a three-phase
displacement
krw(o) water relative permeability in a water–oil
displacement

E.J. Spiteri, R. Juanes / Journal of Petroleum Science and Engineering 50 (2006) 115–139138
kro oil relative permeability in a three-phase
displacement
kro(w) oil relative permeability in a water–oil
displacement
kro(g) oil relative permeability in an oil–gas
displacement
kro(wc) oil relative permeability at connate water
displacement
krg gas relative permeability in a three-phase
displacement
krg(o) gas relative permeability in an oil–gas
displacement
Sw water saturation
So oil saturation
Sg gas saturation
Sg(o) gas saturation in an oil–gas displacement
Swc connate water saturation
Sor(w) residual oil saturation to water
Sor(g) residual oil saturation to gas
Sor residual oil saturation in a three-phase
displacement
Sgc critical gas saturation
Sgt trapped gas saturation
Sgf flowing gas saturation
a secondary drainage reduction exponent
C Land trapping coefficient
Sgt,max maximum trapped gas saturation
Sg,hy gas saturation at the flow reversal
SI metric conversion factors
bbl�1.589873 e�01=m3
cP�1.0* e�03=Pa s
ft�3.048* e�01=m
ft3�2.831685 e�02=m3
lbm/ ft3�1.601850 e�02=g/cm3
md�9.869233 e�04=mm2
psi�6.894757 e+00=kPa
8F (8F�32) /1.8 =8C
*Conversion is exact.
Acknowledgements
We gratefully acknowledge financial support from
the industrial affiliates of the Stanford University Petro-
leum Research Institute for Gas Injection (SUPRI-C).
References
Abriola, L.M., Pinder, G.F., 1985. A multiphase approach to the
modeling of porous media contamination by organic compounds:
1. Equation development. Water Resour. Res. 21 (1), 11–18.
Al-Futaisi, A., Patzek, T.W., 2003. Impact of wettability on two-phase
flow characteristics of sedimentary rock: a quasi-static descrip-
tion. Water Resour. Res. 39, 1042. doi:10.1029/2002WR001366.
Avraam, D.G., Payatakes, A.C., 1995. Flow regimes and relative
permeabilities during steady-state 2-phase flow in porous media.
J. Fluid Mech. 293, 207–236.
Aziz, K., Settari, A., 1979. Petroleum Reservoir Simulation. Elsevier,
London.
Baker, L.E., 1988. Three-Phase Relative Permeability Correlations,
Paper SPE/DOE 17369 presented at the SPE/DOE Enhanced Oil
Recovery Symposium, Tulsa, Oklahoma, April 17–20.
Blunt, M.J., 2000. An empirical model for three-phase relative per-
meability. SPEJ 5, 435–445 (December).
Cakici, M.D., 2003. Cooptimization of oil recovery and carbon
dioxide storage, MS Thesis, Stanford U.
Carlson, F.M., 1981. Simulation of Relative Permeability Hysteresis
to the Nonwetting Phase, Paper SPE 10157 presented at the SPE
Annual Technical Conference and Exhibition, San Antonio,
Texas, October 5–7.
Christensen, J.R., Stenby, E.H., Skauge, A., 2001. Review of WAG
field experience. SPEREE 4, 97–106 (April).
Corey, A., Rathjens, C., Henderson, J., Wyllie, M., 1956. Three-phase
relative permeability. Trans. AIME 207, 349–351.
Delshad, M., Pope, G.A., 1989. Comparison of three-phase oil rela-
tive permeability models. Transp. Porous Media 4, 59–83.
Dixit, A.B., McDougall, S.R., Sorbie, K.S., Buckley, J.S., 1999. Pore-
scale modeling of wettability effects and their influence on oil
recovery. SPEREE 2, 25–36 (February).
Egermann, P., Vizika, O., Kallet, L., Requin, C., Sonier, F., 2000.
Hysteresis in Three-Phase Flow: Experiments, Modelling and
Reservoir Simulations, Paper presented at the IEA Workshop
and Symposium on Enhanced Oil Recovery, Edinburgh,
Scotland, September 20–22.
Element, D.J., Masters, J.H.K., Sargent, N.C., Jayasekera, A.J., 2003.
Assessment of Three-Phase Relative Permeability Models Using
Laboratory Hysteresis Data, Paper SPE 84903 presented at the
SPE International Improved Oil Recovery Conference, Kuala
Lumpur, Malaysia, October 20–21.
Fayers, F.J., Matthews, J.D., 1984. Evaluation of normalized Stone’s
methods for estimating three-phase relative permeabilities. SPEJ,
Trans., AIME 277, 224–232 (April).
Floris, F.J.T., Bush, M.D., Cuypers, M., Roggero, F., Syversveen,
A.R., 2001. Methods for quantifying the uncertainty of produc-
tion forecasts: a comparative study. Pet. Geosci. 7, S87–S96
(Sp.Iss).
Guzman, R.E., Giordano, D., Fayers, F.J., Aziz, K., Godi, A., 1994.
Three-Phase Flow in Field-Scale Simulation of Gas and WAG
Injections, Paper SPE 28897 presented at the European Petroleum
Conference, London, UK, October 25–27.
Hicks Jr., P.J., Grader, A.S., 1996. Simulation of three-phase displace-
ment experiments. Transp. Porous Media 24, 221–245.
Jadhunandan, P.P., Morrow, N.R., 1995. Effect of wettability on
waterflood recovery for crude-oil/brine/rock systems. SPERE
10, 40–46. (February).
Jerauld, G.R., 1997. General three-phase relative permeability model
for Prudhoe Bay. SPERE 12, 255–263 (November).
Juanes, R., 2003. Displacement theory and multiscale numerical
modeling of three-phase flow in porous media, PhD Dissertation,
U. of California at Berkeley.
Juanes, R., Patzek, T.W., 2004. Three-phase displacement theory: an
improved description of relative permeabilities. SPEJ 9, 302–313
(September).

E.J. Spiteri, R. Juanes / Journal of Petroleum Science and Engineering 50 (2006) 115–139 139
Killough, J.E., 1976. Reservoir simulation with history-dependent
saturation functions. SPEJ, Trans., AIME 261, 37–48 (February).
Kjosavik, A., Ringen, J.K., Skjaeveland, S.M., 2002. Relative perme-
ability correlation for mixed-wet reservoirs. SPEJ 7, 49–58
(March).
Koide, H., Tazaki, Y., Noguchi, Y., Nakayama, S., Iijima, M., Ito, K.,
Shindo, Y., 1992. Subterranean containment and long-term stor-
age of carbon dioxide in unused aquifers and in depleted natural
gas reservoirs. Energy Convers. Manag. 33 (5–8), 619–626.
Kovscek, A.R., Wong, H., Radke, C.J., 1993. A pore-level scenario
for the development of mixed wettability in oil reservoirs. AIChE
J. 39, 1072–1085.
Lake, L.W., 1989. Enhanced Oil Recovery. Prentice Hall, Upper
Saddle River, NJ.
Land, C.S., 1968. Calculation of imbibition relative permeability for
two- and three-phase flow from rock properties. SPEJ, Trans.,
AIME 243, 149–156 (June).
Larsen, J.A., Skauge, A., 1998. Methodology for numerical simu-
lation with cycle-dependent relative permeabilities. SPEJ 3,
163–173. (June).
Lenhard, R.J., Oostrom, M., 1998. A parametric model for predicting
relative permeability–saturation–capillary pressure relationships
of oil–water systems in porous media with mixed wettability.
Transp. Porous Media 31, 109–131.
Lenhard, R.J., Parker, J.C., 1987. A model for hysteretic constitutive
relations governing multiphase flow: 2. Permeability–saturation
relations. Water Resour. Res. 23 (12), 2197–2206.
Lenormand, R., Zarcone, C., Sarr, A., 1983. Mechanisms of the
displacement of one fluid by another in a network of capillary
ducts. J. Fluid Mech. 135, 123–132.
Leverett, M.C., Lewis, W.B., 1941. Steady flow of gas–oil–water
mixtures through unconsolidated sands. Trans. AIME 142,
107–116.
Muskat, M., 1949. Physical Principles of Oil Production. McGraw-
Hill, New York.
Oak, M.J., 1990. Three-Phase Relative Permeability of Water-
Wet Berea, Paper SPE/DOE 20183 presented at the SPE/DOE
Symposium on Enhance Oil Recovery, Tulsa, Oklahoma, April
22–25.
Oak, M.J., Baker, L.E., Thomas, D.C., 1990. Three-phase relative
permeability of Berea sandstone. JPT, Trans., AIME 289,
1054–1061 (August).
Oliveira, L.I., Demond, A.H., 2003. Estimation of primary drainage
three-phase relative permeability for organic liquid transport in the
vadose zone. J. Contam. Hydrol. 66, 261–285.
Øren, P.E., Bakke, S., 2003. Reconstruction of Berea sandstone and
pore-scale modelling of wettability effects. J. Pet. Sci. Eng. 39,
231–246.
Piri, M., Blunt, M.J., 2005. Three-dimensional mixed-wet random
pore-scale network modeling of two- and three-phase flow in
porous media: I. Model description. Phys. Rev., E 71, 026301.
doi:10.1103/PhysRevE.71.026301.
Piri, M., Blunt, M.J., 2005. Three-dimensional mixed-wet random
pore-scale network modeling of two- and three-phase flow in
porous media: II. Results. Phys. Rev., E 71, 026302. doi:10.
1103/PhysRevE.71.026302.
Sato, K., Aziz, K., 1987. Sensitivity of Steam Displacement Predic-
tions to Three-Phase Relative Permeability Models, Paper SPE
16733 presented at the SPE Annual Technical Conference and
Exhibition, Dallas, Texas, September 27–30.
Schlumberger GeoQuest 2003, ECLIPSE 100 Technical Description.
Spiteri, E.J., Juanes, R., Blunt, M.J., Orr Jr., F.M., 2005. Relative
Permeability Hysteresis: Trapping Models and Application to
Geological CO2 Sequestration, Paper SPE 96448 presented at
the SPE Annual Technical Conference and Exhibition, Dallas,
Texas, October 9–12.
Stone, H.L., 1970. Probability model for estimating three-phase rel-
ative permeability. JPT, Trans., AIME 249, 214–218 (February).
Stone, H.L., 1973. Estimation of three-phase relative permeability and
residual oil data. J. Can. Pet. Technol. 12 (4), 53–61.
Valvatne, P.H., Blunt, M.J., 2004. Predictive pore-scale modeling of
two-phase flow in mixed wet media. Water Resour. Res. 40,
W07406. doi:10.1029/2003WR002627.