impact of overhang construction on girder design
TRANSCRIPT

Technical Report Documentation Page
1. Report No.
FHWA/TX-10/0-5706-1
2. Government Accession No.
3. Recipient’s Catalog No.
4. Title and Subtitle
Impact of Overhang Construction on Girder Design
5. Report Date
November 2009; Revised May 2010
6. Performing Organization Code 7. Author(s)
Seongyeong Yang, Todd Helwig, Rich Klingner, Michael Engelhardt, and Jeremiah Fasl
8. Performing Organization Report No.
0-5706
9. Performing Organization Name and Address
Center for Transportation Research The University of Texas at Austin 1616 Guadalupe, Suite 4.202 Austin, Texas 78701-1255
10. Work Unit No. (TRAIS) 11. Contract or Grant No.
0-5706-1
12. Sponsoring Agency Name and Address
Texas Department of Transportation Research and Technology Implementation Office P.O. Box 5080 Austin, TX 78763-5080
13. Type of Report and Period Covered
Technical Report
September 2006–August 2009
14. Sponsoring Agency Code
15. Supplementary Notes Project performed in cooperation with the Texas Department of Transportation and the Federal Highway Administration.
16. Abstract Economical constraints on the design of bridges usually necessitate the use of as few girders as possible across the
bridge width. The girders are typically uniformly spaced transversely with the deck extending past the fascia girders, thereby resulting in an overhang. While designers commonly employ rules of thumb with regard to the geometry of the overhang, these rules of thumb generally address only the deck in-service strength and deflection requirements, and the effect due to construction load is not considered. In particular, the impact of the overhang on fascia girder behavior during construction is not well understood. Overhang construction often leads to a torsional load on the girder system that can lead to problems in steel and concrete girder bridges during construction. The main issue with concrete girder bridges is excessive lateral rotation in the fascia girder, which can cause potential problems of construction safety and maintenance. Field problems on concrete bridges have been reported in the state of Texas where the fascia girders experienced excessive rotation during construction. For steel girder bridges, the unbalanced overhang loading can lead to both local and global instability. Locally, the overhang brackets often exert a large force on the web plate that can distort the web and increase the magnitude of the plate imperfection. Global stability problems have occurred primarily on bridge widening projects where a few girders are added to an existing bridge system. The girders in the widening are usually isolated from the existing bridge and the unbalanced load from the overhang can cause excessive twist that intensifies the global stability of the girder system.
The objective of this study was to improve the understanding of the bridge behavior due to the unbalanced loading from the overhangs and to identify critical factors affecting the girder behavior. The study was also aimed at developing simple design methodologies and design recommendations for overhang construction. The research included field monitoring, laboratory tests, and parametric finite element analyses. The data from the field monitoring and laboratory tests were used to validate finite element models for both concrete and steel girder bridges. Based on the validated models, detailed parametric studies were conducted to investigate the effects of the unbalanced loading. Results from the parametric studies were used to identify the geometries of girder systems that are prone to problems with the overhangs as well as to provide design suggestions. In addition, a closed-form solution for lateral rotation in the fascia girder in a concrete girder bridge was derived using a rigid-body model, and was used to develop design methodology and design recommendations for overhang construction. 17. Key Words
I-girder, Curved Bridge, Lifting, Erection, Construction
18. Distribution Statement
No restrictions. This document is available to the public through the National Technical Information Service, Springfield, Virginia 22161; www.ntis.gov.
19. Security Classif. (of report) Unclassified
20. Security Classif. (of this page) Unclassified
21. No. of pages 206
22. Price
Form DOT F 1700.7 (8-72) Reproduction of completed page authorized


Impact of Overhang Construction on Girder Design Seongyeong Yang Todd Helwig Richard Klingner Michael Engelhardt Jeremiah Fasl CTR Technical Report: 0-5706-1 Report Date: November 2009; Revised May 2010 Project: 0-5706 Project Title: Impact of Overhang Construction on Girder Design Sponsoring Agency: Texas Department of Transportation Performing Agency: Center for Transportation Research at The University of Texas at Austin Project performed in cooperation with the Texas Department of Transportation and the Federal Highway Administration.

Center for Transportation Research The University of Texas at Austin 1616 Guadalupe, Suite 4.202 Austin, Texas 78701-1255 www.utexas.edu/research/ctr Copyright (c) 2009 Center for Transportation Research The University of Texas at Austin All rights reserved Printed in the United States of America

v
Disclaimers Author's Disclaimer: The contents of this report reflect the views of the authors, who
are responsible for the facts and the accuracy of the data presented herein. The contents do not necessarily reflect the official view or policies of the Federal Highway Administration or the Texas Department of Transportation (TxDOT). This report does not constitute a standard, specification, or regulation.
Patent Disclaimer: There was no invention or discovery conceived or first actually reduced to practice in the course of or under this contract, including any art, method, process, machine manufacture, design or composition of matter, or any new useful improvement thereof, or any variety of plant, which is or may be patentable under the patent laws of the United States of America or any foreign country.
Engineering Disclaimer NOT INTENDED FOR CONSTRUCTION, BIDDING, OR PERMIT PURPOSES.
Project Engineer: Todd Helwig
Professional Engineer License State and Number: Texas PE # 94280 P. E. Designation: Research Supervisor

vi
Acknowledgments The authors would like to thank the TxDOT Project Director, Lewis Gamboa, and the
other members of the project monitoring committee for their assistance and direction including John Holt, Yuan Zhao, and Wade Odell. The advice on commonly-used details and construction practices was very useful throughout the life of the project.

vii
Table of Contents
Chapter 1. Introduction.................................................................................................................1 1.1 Overview ................................................................................................................................1 1.2 Scope ......................................................................................................................................2 1.3 Organization ...........................................................................................................................3
Chapter 2. Background .................................................................................................................5 2.1 Overhang Construction ..........................................................................................................5
2.1.1 Definition of Overhang ...................................................................................................5 2.1.2 Overhang Bracket ...........................................................................................................5 2.1.3 Construction Loads .........................................................................................................6 2.1.4 Balanced and Unbalanced Loads ....................................................................................7
2.2 Bracing for Concrete Girder Systems ....................................................................................8 2.3 Fundamentals of Overturning for Concrete Girder ..............................................................10
2.3.1 Body on Rigid Support under Pure Torque ..................................................................11 2.3.2 Body on Rigid Support under Eccentric Load ..............................................................11
2.4 Global Buckling of Steel Twin-Girder System ....................................................................13 2.5 Literature Review ................................................................................................................15
2.5.1 Overhang-Related Laboratory Studies ..........................................................................15 2.5.2 Bearing Pad Studies ......................................................................................................15 2.5.3 Overhang Design Guidelines ........................................................................................16 2.5.4 Computer Design Tool ..................................................................................................18 2.5.5 FEA modeling ...............................................................................................................18
2.6 Case Studies .........................................................................................................................19
Chapter 3. Experimental Program .............................................................................................23 3.1 Overview ..............................................................................................................................23 3.2 R-bar Testing .......................................................................................................................23
3.2.1 Introduction ...................................................................................................................23 3.2.2 Test Setup ......................................................................................................................24 3.2.3 Instrumentation .............................................................................................................26 3.2.4 Test Results ...................................................................................................................26
3.3 Beam Overturning Test ........................................................................................................28 3.3.1 Introduction ...................................................................................................................28 3.3.2 Specimen .......................................................................................................................28 3.3.3 Test Setup ......................................................................................................................30 3.3.4 Instrumentation .............................................................................................................32 3.3.5 Overturning Test Results ..............................................................................................32
3.4 Test on Girder and Deck Panel System ...............................................................................34 3.4.1 Introduction ...................................................................................................................34 3.4.2 Specimen .......................................................................................................................36 3.4.3 Test Setup ......................................................................................................................37 3.4.4 Instrumentation .............................................................................................................37 3.4.5 Test Results ...................................................................................................................40
3.5 Summary of Laboratory Testing ..........................................................................................41
viii
Chapter 4. Finite Element Model ...............................................................................................43 4.1 Introduction ..........................................................................................................................43 4.2 Elements for FEA models ....................................................................................................43 4.3 Key modeling techniques .....................................................................................................45
4.3.1 Moment Connections ....................................................................................................45 4.3.2 Bearing Pad ...................................................................................................................45 4.3.3 Simulation of Overhang Load .......................................................................................49
4.4 FEA model for Airport concrete bridge ...............................................................................50 4.4.1 Description of FEA model ............................................................................................50 4.4.2 Validation of FEA model for Airport Bridge ...............................................................54
4.5 FEA model for Hutto Concrete bridge ................................................................................56 4.5.1 Description of FEA Model for Hutto Concrete Bridge ................................................56 4.5.2 Discussion of Analysis Results .....................................................................................57
4.6 FEA Model for Lubbock Steel Bridge .................................................................................60 4.6.1 Description of FEA model ............................................................................................60 4.6.2 Validation of FEA model ..............................................................................................62
4.7 Closing Remarks ..................................................................................................................65
Chapter 5. Parametric Study on Concrete Girder Systems .....................................................67 5.1 Introduction ..........................................................................................................................67 5.2 Scope of Parametric Study ...................................................................................................67
5.2.1 Parameters and Their Ranges ........................................................................................67 5.2.2 Other Conditions ...........................................................................................................74
5.3 FE Modeling ........................................................................................................................75 5.4 Relationship of Beam Rotation & Overhang Width ............................................................77 5.5 Effects of Top Bracing Distribution ....................................................................................81 5.6 Effects of Beam Spacing ......................................................................................................83 5.7 Effects of Beam Type ..........................................................................................................84 5.8 Closing Remarks ..................................................................................................................86
Chapter 6. Rigid Body Model for Concrete Girder Systems and Design Methodology........87 6.1 Introduction ..........................................................................................................................87 6.2 Identification of Overturning and Restoring Forces on Girder Systems .............................87 6.3 First-Order Analysis of Stand-alone Beam on Elastomeric Bearing Pads ..........................89 6.4 Second-Order Analysis of Stand-alone Beam on Elastomeric Bearing Pads ......................95 6.5 Comparison of Closed-Form Solutions for Stand-alone Beam with Overturning
Test Results .........................................................................................................................99 6.6 Development of Rigid-body Model for Concrete Girder Systems ....................................100 6.7 Validation of Rigid-body Model with Finite Element Analysis Results ...........................109 6.8 Overhang Design Equation and Recommended Design Procedure ...................................110
6.8.1 Summary of Overhang Design Equations ...................................................................110 6.8.2 Recommended Design Procedure ...............................................................................111
6.9 Closing Remarks ................................................................................................................114
Chapter 7. System Buckling of Steel Girder Systems .............................................................117 7.1 Introduction ........................................................................................................................117 7.2 FEA Modeling ...................................................................................................................120 7.3 Derivation of Self-Equilibrating Overhang Width ............................................................123

ix
7.4 FEA Results of system Buckling .......................................................................................125 7.4.1 Global Lateral Buckling Moment of Twin Girder Systems ........................................125 7.4.2 Large-Displacement Analyses ....................................................................................128
7.5 Closing Remarks ................................................................................................................132
Chapter 8. Effect of Local Plate Bending on Stability of Webs of Steel Girders .................135 8.1 Introduction ........................................................................................................................135 8.2 Background ........................................................................................................................136 8.3 FEA Modeling ...................................................................................................................138 8.4 FEA Results and Discussions ............................................................................................141
8.4.1 Effects of Web Slenderness ........................................................................................142 8.4.2 Effects of Overhang Bracket Reaction Height ............................................................143 8.4.3 Effects of Stiffener Spacing ........................................................................................146 8.4.4 Effects of Overhang Width .........................................................................................146 8.4.5 Effects of Top Flange Width .......................................................................................147 8.4.6 P-Delta Effect ..............................................................................................................148 8.4.7 Effects of Web Imperfections .....................................................................................149
8.5 Closing Remarks ................................................................................................................150
Chapter 9. Summary and Conclusions ....................................................................................153 9.1 Summary ............................................................................................................................153 9.2 Conclusions ........................................................................................................................154
9.2.1 Prestressed Concrete Girder Systems .........................................................................154 9.2.2 System Buckling of Steel Girder Systems ..................................................................155 9.2.3 Local Stability of Web of Steel Girders ......................................................................156
9.3 Design Recommendations .................................................................................................156 9.3.1 Prestressed Concrete Girder Systems .........................................................................156 9.3.2 System Buckling of Steel Girder Systems ..................................................................158 9.3.3 Effects of Overhang Brackets on Local Deformations in Web Plates ........................158
Appendix A: System Buckling of Twin-Girder System .........................................................159
Appendix B: Bearing Pad Stiffness ..........................................................................................167
Appendix C: Comparison of FEA Results for Flexible and Stiff Connections ....................171
Appendix D: Design Examples .................................................................................................177
Appendix E: Stability of Webs..................................................................................................183
References ...................................................................................................................................187

x

xi
List of Figures Figure 1.1: Overhang in Typical Concrete Girder Bridge .............................................................. 1 Figure 2.1: Bridge Deck Overhang ................................................................................................. 5 Figure 2.2: Overhang Brackets ....................................................................................................... 6 Figure 2.3: Overhang Formwork and Overhang Bracket ............................................................... 6 Figure 2.4: Bridge Deck Finishing Screed in Operation ................................................................. 7 Figure 2.5: Steel Twin I-Girder System Subject to Unbalanced Loads .......................................... 8 Figure 2.6: Bracing for Concrete Girder System ............................................................................ 9 Figure 2.7: Advancement in Bracing for Concrete Girder System ............................................... 10 Figure 2.8: Effect of Twist on Timber Blocking .......................................................................... 10 Figure 2.9: Body on Rigid Support Subjected to Pure Torque ..................................................... 11 Figure 2.10: Body on Rigid Support Subjected to Eccentric Load ............................................... 12 Figure 2.11: Effects of Eccentricity on Overturning Capacity ..................................................... 13 Figure 2.12: Cross-Sectional View of Twin-Girder System in System Buckling Mode .............. 14 Figure 2.13: Twin-Girder Widening with Excessive Girder Rotation .......................................... 20 Figure 2.14: Rotation Measurement at Hutto Bridges .................................................................. 21 Figure 2.15: Lift-off of Fascia Girder from Bearing Pad .............................................................. 21 Figure 3.1: Dimensions of Tx46 and R-bar .................................................................................. 24 Figure 3.2: Test Setup for R-bar Testing ...................................................................................... 25 Figure 3.3: Load Cell and Linear Motion Transducer in Place .................................................... 26 Figure 3.4: Lateral Force and Lateral Deformation of R-bar ........................................................ 27 Figure 3.5: Permanent Deformation of R-bar after Removal of Load .......................................... 27 Figure 3.6: Dimensions of Beam Tested....................................................................................... 29 Figure 3.7: Dimensions of Elastomeric Bearing Pads Tested....................................................... 29 Figure 3.8: Measurement of Hardness of Bearing Pad ................................................................. 30 Figure 3.9: Elevation View of Beam Tested ................................................................................. 30 Figure 3.10: Moment Connection at Midspan (Section A-A) ...................................................... 31 Figure 3.11: Safety Measures to Prevent Beam from Tipping Over ............................................ 31 Figure 3.12: Locations of Load Cell and String Potentiometers .................................................. 32 Figure 3.13: Overturning Load and Rigid Body Rotation of Beam ............................................. 33 Figure 3.14: Rectangular and Circular Bearing Pad ..................................................................... 33 Figure 3.15: TxDOT Standard Drawing for Girder Bracing ........................................................ 34 Figure 3.16: Top Bracing Connection Details in Practice ............................................................ 35 Figure 3.17: Connection Configurations for Top Bracing ............................................................ 36 Figure 3.18: Top Bracing Bar, Concrete Deck Panel and Styrofoam in Place ............................. 37 Figure 3.19: Schematic of Test Setup ........................................................................................... 38 Figure 3.20: Test Setup for Girder and Deck Panel System ......................................................... 39

xii
Figure 3.21: Instrumentation for Girder and Deck Panel System ................................................. 39 Figure 3.22: Force in Top Bars and Beam Rotation ..................................................................... 40 Figure 3.23: Failures of Top Bracing ............................................................................................ 41 Figure 4.1: Moment Connection ................................................................................................... 45 Figure 4.2: Modeling of Bearing Pad ........................................................................................... 46 Figure 4.3: FEA Beam Model with Bearing Pad Model .............................................................. 48 Figure 4.4: Comparison of FEA Results and Test Data for Rectangular Bearing Pads ............... 48 Figure 4.5: Mesh Fineness Verification for Bearing Pad Models ................................................ 49 Figure 4.6: Overhang Brackets in Place ....................................................................................... 50 Figure 4.7: Simulation of Overhang Load .................................................................................... 50 Figure 4.8: Field Measurement Span of the Airport Concrete Bridge .......................................... 51 Figure 4.9: Top Bracing Connection ............................................................................................ 52 Figure 4.10: FEA model for the Airport Concrete Bridge ............................................................ 53 Figure 4.11: Formworks for Thickened Ends and Drainage ......................................................... 54 Figure 4.12: Measurement Locations on West Side of the Airport Concrete Bridge ................... 55 Figure 4.13: Hutto Concrete Bridge.............................................................................................. 56 Figure 4.14: FEA Model of Hutto Concrete Bridge ..................................................................... 57 Figure 4.15: Lateral Rotation of Fascia Girders with Construction Load .................................... 58 Figure 4.16: Force Distribution in Top Bracing across Hutto Concrete Bridge ........................... 59 Figure 4.17: Lubbock Steel Plate Girder Bridge under Construction ........................................... 60 Figure 4.18: FEA Model of Lubbock Steel Bridge....................................................................... 61 Figure 4.19: Fabreeka Bearing Pad in Place ................................................................................. 62 Figure 4.20: Measurement Locations for Deflections in Girders ................................................. 63 Figure 4.21: Measurement Locations for Rotation of Girders ...................................................... 64 Figure 4.22: Measurement Locations for Stresses in Girders ....................................................... 65 Figure 5.1: Cross Sections of Conventional I-Beams ................................................................... 69 Figure 5.2: Cross Sections of Texas I-Girders .............................................................................. 70 Figure 5.3: Schematic for Flexible Connection and Stiff Connection .......................................... 72 Figure 5.4: Thickened Ends in Concrete Deck at Bent Before Deck Pouring .............................. 73 Figure 5.5: Plan View of Girder Systems with Distributed and End Bracings............................. 73 Figure 5.6: Finite Element Model for Parametric Analyses ......................................................... 76 Figure 5.7: Rotational Response of Conventional I-Beams with Flexible Connection ................ 78 Figure 5.8: Rotational Response of Texas I-Girders with Flexible Connection ........................... 78 Figure 5.9: Rotational Response of Conventional I-Beams with Stiff Connection ...................... 79 Figure 5.10: Rotational Response of Texas I-Girders with Stiff Connection ............................... 80 Figure 5.11: Comparison for Flexible and Stiff Connections for Beam VI .................................. 80 Figure 5.12: Comparison for Flexible and Stiff Connections for Tx 70 ....................................... 81 Figure 5.13: Effects of Bracing Distribution for Conventional I-Beams ...................................... 82

xiii
Figure 5.14: Effects of Bracing Distribution for Texas I-Girders ................................................ 82 Figure 5.15: Effects of Girder Spacing for Conventional I-Beams .............................................. 83 Figure 5.16: Effects of Girder Spacing for Texas I-Girders ......................................................... 84 Figure 5.17: Effects of Beam Type of Small Beams .................................................................... 85 Figure 5.18: Effects of Beam Type of Large Beams .................................................................... 85 Figure 6.1: Overturning and Restoring Forces and their Eccentricities ........................................ 88 Figure 6.2: Lift-off of Fascia Beam at Hutto Concrete Bridge ..................................................... 90 Figure 6.3: Rigid-body Model for Stand-alone Beam on Elastomeric Bearing Pads ................... 91 Figure 6.4: Free-body diagram of Stand-alone Beam during Full Contact .................................. 92 Figure 6.5: Free-body diagram of Stand-alone Beam during Partial Loss of Contact ................. 94 Figure 6.6: Free-body diagram of Stand-alone Beam during Full Contact .................................. 96 Figure 6.7: Free-Body Diagram of Rigid Body during Partial Loss of Contact ........................... 98 Figure 6.8: Test Results versus Rigid-Body Solutions ................................................................. 99 Figure 6.9: Rigid Body with Bracing on Compression-Only Elastic Foundation ...................... 100 Figure 6.10: Translations and Rotation of Rigid Body ............................................................... 101 Figure 6.11: Free-body diagram of Rigid Body with Bracing before Lift-off............................ 103 Figure 6.12: Free-body diagram of Rigid Body with Bracing after Lift-off .............................. 106 Figure 6.13: Applied Moment and Beam Rotation ..................................................................... 108 Figure 6.14: Beam Rotation and Overhang Width for Flexible Connection .............................. 109 Figure 6.15: Beam Rotation and Overhang Width for Stiff Connection .................................... 110 Figure 7.1: System Buckling Mode ............................................................................................ 118 Figure 7.2: Twin I-Girder System under Overhang Loads ......................................................... 119 Figure 7.3: Cross Sections Studied ............................................................................................. 121 Figure 7.4: Finite Element Model of Girder System .................................................................. 122 Figure 7.5: Imperfections Considered ......................................................................................... 123 Figure 7.6: Cross-Section of Twin-Girder System under Overhang Loads ................................ 124 Figure 7.7: Relationship of Interior and Exterior Overhang Widths for Zero Torque ............... 125 Figure 7.8: Global Lateral Buckling Moment of Girder Systems with Respect to Section
Type and Span Length .................................................................................................... 127 Figure 7.9: Effects of Girder Spacing on Global Lateral Buckling Moment .............................. 128 Figure 7.10: Behavior of Girder System under Torsion ............................................................. 129 Figure 7.11: Effects of Girder Spacing on Torsional Behavior of Girder Systems .................... 129 Figure 7.12: Effects of Overhang Width on Torsional Behavior of Girder System ................... 130 Figure 7.13: Effects of Imperfections on Torsional Behavior of Girder System ........................ 131 Figure 7.14: Effects of Proportioning of Overhang Widths ....................................................... 132 Figure 8.1: Overhang Brackets Reacting at the Mid-Depth of Steel Girder Web ...................... 135 Figure 8.2: Eccentric Load from Fresh Concrete on Overhang .................................................. 136 Figure 8.3: Bracket Reaction Force ............................................................................................ 137

xiv
Figure 8.4: Cross-Sections Studied ............................................................................................. 138 Figure 8.5: Finite Element Model for Steel Fascia Girder .......................................................... 139 Figure 8.6: Web Plate Imperfection for Girder Model (Rescaled) ............................................. 141 Figure 8.7: Effects of Web Slenderness for Stiffener Spacing of 10 ft ...................................... 142 Figure 8.8: Effects of Web Slenderness for Stiffener Spacing of 30 ft ...................................... 143 Figure 8.9: Effects of Overhang Bracket Reaction Height for Girder Type D75 ....................... 144 Figure 8.10: Effects of Overhang Bracket Reaction Height for Girder Type D38 ..................... 144 Figure 8.11: Effects of Loading Point for Girder Type D75 ...................................................... 145 Figure 8.12: Effects of Stiffener Spacing for Girder Type D75 ................................................. 146 Figure 8.13: Effects of Overhang Width for Girder Type D38 .................................................. 147 Figure 8.14: Effects of Overhang Width for Girder Type D75 .................................................. 147 Figure 8.15: Effects of Top Flange Width for Girder Type D38 ................................................ 148 Figure 8.16: P-Delat Effect for Girder Type D75 ....................................................................... 149 Figure 8.17: Effect of Web Imperfections .................................................................................. 150 Figure 9.1: Connection Configurations for Top Bracing ............................................................ 155
Figure A.1 Simply Supported Beam Subjected to Pure Bending ............................................... 159 Figure A.2 Deformed Configurations in Lateral Torsional Buckling Mode .............................. 160 Figure A.3 Cross-Section View of Twin-Girder System in System Buckling Mode ................. 163 Figure B.1 Dimensions for Elastomeric Bearing Pad ................................................................. 167 Figure B.2 Compressive Stress-Strain Curves for 70 Durometer Flat and Tapered 3-
Shims Bearings (from Muscarella and Yura (1995)) ...................................................... 168 Figure C.1 Comparison for Flexible and Stiff Connection for Beam Type A ............................ 171 Figure C.2 Comparison for Flexible and Stiff Connection for Beam Type B ............................ 172 Figure C.3 Comparison for Flexible and Stiff Connection for Beam Type C ............................ 172 Figure C.4 Comparison for Flexible and Stiff Connection for Beam Type IV .......................... 173 Figure C.5 Comparison for Flexible and Stiff Connection for Tx28 .......................................... 173 Figure C.6 Comparison for Flexible and Stiff Connection for Tx34 .......................................... 174 Figure C.7 Comparison for Flexible and Stiff Connection for Tx40 .......................................... 174 Figure C.8 Comparison for Flexible and Stiff Connection for Tx46 .......................................... 175 Figure C.9 Comparison for Flexible and Stiff Connection for Tx54 .......................................... 175 Figure C.10 Comparison for Flexible and Stiff Connection for Tx62 ........................................ 176 Figure C.11 Comparison for Flexible and Stiff Connection for Tx70 ........................................ 176 Figure E.1 Effect of Stiffener Spacing for Type D56 with Overhang Width of 3 ft. ................. 183 Figure E.2 Effect of Stiffener Spacing for Type D38 with Overhang Width of 3 ft. ................. 184 Figure E.3 Effect of Stiffener Spacing for Type D75 with Overhang Width of 4 ft. ................. 184 Figure E.4 Effect of Stiffener Spacing for Type D56 with Overhang Width of 4 ft. ................. 185 Figure E.5 Effect of Stiffener Spacing for Type D ..................................................................... 185

xv
List of Tables Table 2.1: Slab Overhang Limits .................................................................................................. 16 Table 2.2: Slab Overhang Dimensions of TxDOT Prestressed Concrete I-Girders ..................... 17 Table 4.1: ANSYS Element Types for FEA modeling ................................................................. 43 Table 4.2: Comparison of FEA Results and Field Data of Deflections of Girders in the
Airport Concrete Bridge ................................................................................................... 55 Table 4.3: Comparison of FEA Results and Field Data of Rotations of Girders in the
Airport Concrete Bridge ................................................................................................... 55 Table 4.4: Comparison of FEA Results and Field Data of Deflections of Girders in the
Lubbock Steel Bridge ....................................................................................................... 63 Table 4.5: Comparison of FEA Results and Field Data of Rotations of Girders in the
Lubbock Steel Bridge ....................................................................................................... 64 Table 4.6: Comparison of FEA Results and Field Data for Stresses in Girders in the
Lubbock Steel Bridge ....................................................................................................... 65 Table 5.1: Parameters and Their Ranges ...................................................................................... 68 Table 5.2: Dimensions of Conventional I-Beams ......................................................................... 69 Table 5.3: Dimensions of Texas I-Girders .................................................................................... 70 Table 5.4: Overhang Width Limits by TxDOT Bridge Design Manual ....................................... 71 Table 5.5: Minimum Bracing Spacing for Exterior Bays ............................................................. 74 Table 6.1: Definition of System Parameters ................................................................................. 89 Table 6.2: Displacements of Points of Interest ........................................................................... 102 Table 6.3: Standard Design Parameters ...................................................................................... 111 Table 6.4: Girder System Parameters ......................................................................................... 112 Table 7.1: Parameters and Their Ranges .................................................................................... 123 Table 7.2: Comparisons of FEA results and Closed-Form Solutions ......................................... 126 Table 8.1: Dimensional Properties of Cross Sections Studies .................................................... 140 Table 8.2: Parameters and Their Ranges .................................................................................... 140 Table 9.1: Design Values for Structural Components in Girder Systems .................................. 157
Table B.1 Compressive Stress for Each Layer ........................................................................... 169 Table B.2 Stiffness Values per Single Elastomeric Bearing Pad ................................................ 170

xvi

1
Chapter 1. Introduction
1.1 Overview
Economic constraints on the design of bridges usually necessitate the use of as few girders as possible across the bridge width. The girders are typically uniformly spaced transversely with the deck extending past the fascia girders, thereby resulting in an overhang. Almost every concrete or steel girder bridge incorporates overhangs. A typical overhang on a prestressed concrete girder is shown in Figure 1.1. The width of overhangs is usually proportioned such that the same girder sections can be used for the interior and fascia girders. Although many transportation departments throughout the United States provide guidelines on overhang geometry, those guidelines are generally based upon rules of thumb and lack justification based upon research.
Figure 1.1: Overhang in Typical Concrete Girder Bridge
Overhang construction often produces torsional loads on the girder system that are not usually considered in the design of the bridge. Very limited bracing is provided for prestressed concrete girder systems during construction, and these bracing systems are based upon typical details that do not consider the specific loading for a given application. In many situations, the bracing detail that is actually used does not match the standard bracing detail on the plans, which results in a relatively flexible system.
Although steel girder systems do provide significant bracing to prevent lateral torsional buckling, they are not typically designed for the torque load as a result of overhang construction. The major overhang loads during construction include the concrete on the overhang and the bridge deck finishing screed. The concrete in the overhang has a relatively large eccentricity with respect to the fascia girder compared to the construction load coming from the interior portion of the girder, thereby leading to a net torque on the fascia girder. The bridge deck finishing screed
Overhang
Fascia Girder

2
wheels are typically positioned near the edge of the overhang, which produces another significant eccentric load.
The torsional loading from the overhang has led to problems in both concrete and steel girder bridges during construction. The main issue with concrete girder bridges is that the overhang load can generate excessive torsional rotation in the fascia girder. This excessive rotation can cause potential problems of construction safety and maintenance. Specifically, overturning failures of the fascia girder in a concrete bridge can occur during construction. The potential maintenance issues can also occur if the girder rotations lead to shifts in the deck steel reinforcement that might compromise the concrete cover. The reduced concrete cover can lead to long-term corrosion in the deck steel as well as premature deck cracking. For steel girder bridges, the torque from the overhang can lead to both global and local stability issues. Most global stability issues with the overhangs occur in bridge widening projects. The widening is often isolated from the original construction to permit vertical deflections during deck casting. However, the widening often consists of a two- or three-girder system with a large length-to-width ratio. From a lateral-torsional buckling perspective, the girders are susceptible to a system buckling mode that is relatively insensitive to the spacing between intermediate cross-frames. The low resistance to lateral torsional buckling, coupled with the torque from the overhang brackets, has led to systems that may have been dangerously close to failure. In addition to the global stability issues, a number of potential problems are related to the local stability of the girder webs. In many instances the overhang brackets exert large concentrated forces on the webs of the steel girders. The forces from the overhang bracket can distort the web, thereby leading to local instabilities or large web imperfections that get locked into the girders once the deck cures.
The Texas Department of Transportation (TxDOT) funded a research investigation entitled “Impact of Overhang Construction on Girder Design” (TxDOT Project 0-5706) to improve the understanding of the impact of overhang construction on the behavior of concrete and steel girder bridges. In this report, the overhang geometry that creates critical conditions is identified, and design methodologies and recommendations for overhang construction are formulated.
The remainder of this chapter provides a discussion of scope of the research as well as providing a brief outline of the remainder of this report.
1.2 Scope
The results presented in this report were part of TxDOT Research Study 0-5706, “Impact of Overhang Construction on Girder Design.” The research project included field monitoring, laboratory testing, and parametric finite element analyses. Three bridges were monitored as part of the field testing during construction. The bridges include a concrete I-beam bridge, a straight steel I-girder bridge with skew supports, and a curved steel I-girder bridge. Results from the field tests are presented and discussed by Fasl (2008). The field test data is used in this report for validation of finite element analytical (FEA) models. In addition to the field tests, laboratory tests on key elements of the concrete girder systems were necessary for validation of the FEA models. The validated FEA models were used to conduct parametric investigations to improve the understanding of the general behavior of concrete and steel girder systems. Although the computational models provide accurate means of evaluating the behavior and safety of overhang construction in bridges, extensive three-dimensional FEA modeling is not practical for general bridge design. As a result, simple design solutions that can be used to evaluate girder safety are

3
necessary. Therefore, closed-form solutions for lateral rotation of the concrete girder under unbalanced overhang loads are derived and used to develop a design methodology for overhang construction. Hand solutions for proportioning the geometry for steel girder systems are also formulated.
1.3 Organization
This report consists of nine chapters. Following this introductory chapter, Chapter 2 provides background information on the impact of overhang construction on girder design. The fundamentals of overturning for a concrete girder and the theory of global buckling of a steel twin-girder system are introduced. The chapter also provides a summary of a review of the literature on overhang tests, FEA modeling, and overhang design guidelines along with case studies of bridges that experienced problems during construction. In Chapter 3, laboratory tests on the structural behavior of key elements of prestressed concrete girders are described, and results are provided and discussed. In Chapter 4, the finite element models for the concrete and steel bridges that were monitored in the field are discussed. Results from the field data are used to validate the models. Results from the parametric finite analyses are presented in Chapter 5. The FEA results are used to identify critical overhang geometry for a wide range of concrete girder system parameters, and also to investigate the effects of the girder system parameters on the rotational response of the fascia girder. A rigid-body model for concrete girder systems, suitable for design, is developed in Chapter 6. The accuracy of the model is validated with FEA solutions. In addition, a design methodology is developed for determining the required bracing for a concrete girder system, and design examples are provided. Chapter 7 provides a summary of an FEA investigation on the global lateral torsional behavior of a twin-girder system under torsion due to eccentric loads, such as the unbalanced loading that may result from overhang construction. Results from both eigenvalue buckling analyses and large-displacement analyses are used to develop a design methodology to proportion the girder geometry to minimize torsional effects on steel girder systems used in bridge widenings. A summary of the study on the effects of overhang construction on the local stability of girder webs is provided in Chapter 8. Finally, a summary of the important findings and recommendations from the study is provided in Chapter 9.

4

5
Chapter 2. Background
2.1 Overhang Construction
2.1.1 Definition of Overhang
Although the definition for an overhang may be slightly different for designers, an overhang in this research project is defined as the portion of the concrete deck that extends from the centerline of the fascia girder to the edge of the deck. This definition applies to both concrete girder systems and steel girder systems. In accordance with TxDOT LRFD Bridge Design Manual (2008), the maximum width of the overhang in Texas bridges measured from the edge of the slab to the face of the beam top flange (or steel beam flange quarter point) is the lesser of 3.92 ft. (3 ft. 11 in.) or 1.3 times the depth of the girder. The typical overhang width in Texas bridges is approximately 3 ft. (Figure 2.1).
Figure 2.1: Bridge Deck Overhang
2.1.2 Overhang Bracket
A formwork system such as the one shown in Figure 2.2 is used for supporting and shaping the fresh concrete on the overhang. A variety of shapes and sizes of overhang brackets are available for use on both steel and concrete beams in various sizes by overhang bracket manufactures. The height of overhang brackets can be adjusted for mounting the brackets to steel beams, precast concrete beams and concrete box beams with the appropriate hanger devices. For example, Dayton Superior Overhang Brackets accommodate a vertical leg adjustment range of 40 to 70 in. Although regular overhang brackets permit overhang widths of up to 4 ft, Meadow Burke’s heavy-duty overhang brackets can be custom made for an overhang width of up to 14 ft.
Embedded hangers are inserted in the top flange of the concrete girder as shown in Figure 2.3(a). Figure 2.3(b) shows the overhang brackets that support plywood formwork in the overhang of the girder system. The overhang brackets are attached to the fascia girder through the embedded hanger by using a ½-in. coil rod threaded through the hanger and the overhang bracket. The overhang formwork system consists of plywood sheathing and timber joists supported on bridge overhang brackets as shown in Figure 2.3(b).

6
Figure 2.2: Overhang Brackets
The overhang formwork system also provides space for rails for the bridge deck finishing screed as well as a safety railing and a work platform for construction workers. The finishing screed that spans the width of the bridge is a truss system that has a paving carriage. The finishing screed moves along the screed rail, striking off the surface of the fresh concrete at the specified grade. The work platform is a pathway where construction workers can move around during deck placement.
Figure 2.3: Overhang Formwork and Overhang Bracket
2.1.3 Construction Loads
Several types of construction loads are applied to the fascia girder through overhang brackets. Figure 2.4 shows a bridge during concrete deck placement. Typical construction loads include fresh concrete, the bridge deck finishing screed, and overhang formwork, as well as the construction personnel. These loads produce torsional moment on the fascia girder. The center of gravity of the fresh concrete on the overhang has an eccentricity with respect to the center of the fascia girder, thereby resulting in torsional moment on the edge girder. Because the screed rail is usually located at the edge of the deck, the finishing screed becomes another source of the torsional moment. An additional source of torsional load is construction personnel that walk on the edge of the overhang to avoid freshly placed concrete. Although the load from the overhang formwork is often small compared to weight of precast panels that span between adjacent girders, the overhang formwork can also produce torsional moment on the fascia girder.

7
Figure 2.4: Bridge Deck Finishing Screed in Operation
2.1.4 Balanced and Unbalanced Loads
Eccentric construction loads can be torsionally balanced or unbalanced. A torsionally balanced condition can be understood in the context of the single-girder level and the girder-system level.
In the single-girder level, if the sum of the torsional moments about the center of gravity of a particular girder is zero, the loads are torsionally balanced with respect to the girder and the girder is free from torsional moment. In the girder-system level, if the sum of the torsional moments about the shear center of the entire girder system is zero, the loads are torsionally balanced with respect to the girder system and the girder system is free from torsional moment.
Because most bridges have overhangs on both exterior girders, the overhang construction loads on the bridge cross section are often symmetric, which makes the loads torsionally balanced at the girder system level. However, for a bridge widening, the overhang is not symmetric, and the girder system is usually torsionally unbalanced, producing torsion on the girder system. Figure 2.5 shows how a typical steel twin I-girder system, often used for bridge widening, may be subjected to unbalanced loads. The unbalanced load results because some of the fresh concrete load on the interior overhang is transferred to the existing structure, while on the exterior overhang the entire fresh concrete load is applied to the twin-girder system. Therefore, the loads are torsionally unbalanced for the twin-girder system.

8
Figure 2.5: Steel Twin I-Girder System Subject to Unbalanced Loads
2.2 Bracing for Concrete Girder Systems The bracing conditions for prestressed concrete girder systems have changed significantly
over the past three decades. In the past, twist was restrained using either concrete or steel diaphragms spaced along the girder length as shown in Figures 2.6(a) and 2.6(b). Such bridges were most likely constructed in the 1970s, using removable forms for both the overhang and the interior bridge deck. A cast-in-place concrete diaphragm was used at the middle of the simply supported girders, while a smaller concrete diaphragm was used at the support above the abutment. In addition to restraining girder twist, the concrete diaphragms also provided lateral bracing against wind loads during construction.
exterior overhang interior overhang
exterior girder interior girder
overhang bracket
wet concrete
existing structure
interior overhang load exterior overhang load
(a) System Cross-Section
(b) Unblanced Loads
Shear center

9
(a) Concrete Diaphragm
(c) Top Bracing Bar
(b) Steel Diaphragm (d) Timber Blocking
Figure 2.6: Bracing for Concrete Girder System
Cast-in-place diaphragms were expensive and took a large amount of time to form and cast. As a result, simpler types of diaphragms were commonly used. While precast concrete diaphragms were sometimes used, many applications utilized steel channel diaphragms such as those shown in Figure 2.6(b). The diaphragms were bolted to an angle that was bolted to the webs of the concrete girders.
In recent years, permanent diaphragms are rarely used on prestressed concrete bridges. As shown in Figure 2.6(c) and (d), temporary lateral bracing is usually provided during construction with the use of 4-in. square timbers combined with top bracing bars placed on top of the concrete panel. This change in construction practices can be seen in Figure 2.7, which shows a bridge widening at the Parmer Lane overpass at Texas Loop 1 in Austin, Texas in 2009. The bridge was widened by adding four girders to the existing structure. This construction illustrates the historical advancement in bracing for concrete girder systems that occurred over time within the same bridge. While plywood forms historically were used to form bridge decks, conventional forming techniques consist of stay-in-place (SIP) forms that remain on the finished bridge. The bridge widening in Figure 2.7 utilized two types of SIP forms including precast panels between the four added girders and metal deck forms connecting the widening to the existing bridge. The existing bridge, probably constructed more than 20 years earlier, has steel diaphragms permanently placed between beams while the widened portion of the bridge has timber bracing that is temporally placed during construction.
Steel Bar
Timber

10
Figure 2.7: Advancement in Bracing for Concrete Girder System
The timbers used to brace the prestressed concrete girders can transmit lateral wind loads between adjacent girders, because the timbers serve as compression members. However, they are limited in their ability to restrain girder twist during construction as they are not positively connected to the concrete girders. As a result, many of the timbers may become dislodged during deck construction, and become ineffective as shown in Figure 2.8. This loss of effectiveness is also investigated in this research project.
Figure 2.8: Effect of Twist on Timber Blocking
2.3 Fundamentals of Overturning for Concrete Girder The fundamentals of overturning of a two-dimensional rigid body with self-weight will
be discussed to provide an understanding of the relationship between overturning moment and restoring moment. The discussion of a body with pure torque will be followed by the description of a body with eccentric load.
Dislodged Timber Diagonals

11
2.3.1 Body on Rigid Support under Pure Torque
Figure 2.9 shows a body with a self-weight, , that rests on a pin support at A and a roller support at B. The body is subjected to pure torque and self-weight of the body acting at the center of gravity of the body (CG). At the moment of overturning, the rotational equilibrium of the applied torque and the self-weight about Point gives the overturning moment capacity of the body.
Figure 2.9: Body on Rigid Support Subjected to Pure Torque
Equation (2.1) indicates that the overturning moment capacity is a function of the self-weight and the moment arm of the self-weight, /2. Equation (2.1) also shows that the restoring moment increases with either larger self-weight or increased beam width.
= 2 (2.1)
2.3.2 Body on Rigid Support under Eccentric Load
Figure 2.10 shows a body with a self-weight that rests on a pin support at A and a roller support at B. The body is subjected to an eccentric load , and to the self-weight acting at the center of gravity of the body (CG).
h
b
Wbm
CGT
A B

12
Figure 2.10: Body on Rigid Support Subjected to Eccentric Load
At the moment of overturning, rotational equilibrium of the eccentric load and the self-weight about Point gives the overturning capacity of the body as shown in Equation (2.2). The overturning capacity of the body is a function of the eccentricity of the applied load as well as the self-weight and the width of the body, .
= (2 − ) (2.2)
As with the body with pure torque, the self-weight of the body is the only source for
restoring moment, and more self-weight or larger moment arm of the self-weight results in more restoring moment.
A graph of Equation (2.2) is represented in nondimensional fashion in Figure 2.11. Several interesting facts can be observed from the graph. For a body with eccentric loads, increases in eccentricity of the applied load lead to dramatic decreases in the value of the load required to produce overturning. This means that even a relatively small load with a large eccentricity is capable of overturning the body. Another fact is that when the eccentricity of the applied load approaches /2, the overturning load becomes theoretically infinite, indicating that the body subjected to a load with an small eccentricity is not susceptible to instability. The last fact is obvious from intuition as there is no overturning if the eccentricity of the load is less than or equal to /2.
h
b
Wbm
CG
A
F
e
B

13
Figure 2.11: Effects of Eccentricity on Overturning Capacity
2.4 Global Buckling of Steel Twin-Girder System Global buckling behavior has recently been studied (Yura et al. 2008). The terms “global
bucking” and “system buckling” are used interchangeably. Systems composed of only a few girders are particularly susceptible to this type of buckling. Yura et al. (2008) developed the closed form solution for elastic global buckling of twin girder systems interconnected with cross frames. Details are provided in the Appendix A. Figure 2.12 shows the original configuration of the cross-section of a twin-girder system as well as the deformed configuration of the system during system buckling.
0
2
4
6
8
10
12
14
16
18
20
0 0.5 1 1.5 2 2.5 3 3.5 4
Ecce
ntric
Load
(F/W
bm)
Eccentricity (e/(b/2))

14
Figure 2.12: Cross-Sectional View of Twin-Girder System in System Buckling Mode
The girder system consists of doubly symmetric I-girders with a spacing of S. The constant moments M and M are applied to the twin girders, respectively. For the deformed configuration of the cross-section in the figure, only the internal shear forces associated with the rotation of the entire cross-section about the shear center are depicted for clarity. The simplifying assumption that the two girders are continuously braced by internal cross-frames with infinite stiffness leads to the assumption that the cross-section of the girder system remains rigid during system buckling. Although the stiff internal cross-frames can restrain the relative displacement or rotation between the two girders, they cannot prevent the displacement and rotation of the entire cross-section of the girder system. During the system buckling, the entire cross-section experiences vertical and lateral displacements, and rotation about its shear center. The system buckling capacity of a twin-girder system with doubly symmetric I-sections can be expressed as
(M + M ) = 2πL EI GJ + π E I I d + I S4L (2.3)
where, = span length, = modulus of elasticity, = shear modulus, = moment of inertia about strong axis, = moment of inertia about weak axis, = torsional constant, = distance between flange centroids, and = girder spacing. The summation of the two external moments applied on
V′ V′
v′ v′
S
SC
SC
= SC (shear center)
φ
M M
v
u
φ
y
x

15
each girder of a twin-girder system is limited by the system buckling capacity of Equation (2.3) in order to prevent system-mode instability of the girder system. It should be also noted that Equation (2.3) is the upper limit on the system buckling capacity of a twin-girder system because the solution relies on an unconservative assumption that the two girders are continuously braced by rigid cross-frames.
2.5 Literature Review A review of literature on overhang research in concrete and steel bridges as well as FEA
modeling was conducted. A summary of research on bearing pads in regard to the support conditions of bridge girders is also included. This section presents a summary of the literature.
2.5.1 Overhang-Related Laboratory Studies
Most work on overhang construction has focused on concrete girder systems. The overhang brackets are installed on the fascia girder by the hangers connected to the top of the girder and embedded in the concrete deck. Tests on bracket hangers were conducted at North Carolina State University (Ariyasajjakorn, 2006) and the hanger types included standard falsework hangers manufactured by Dayton/Richmond and Meadow/Burke. The two hanger types that were tested did not reach the ultimate strength provided by the manufacturer.
Tests on overhang forming systems were conducted at The University of Texas at Austin (Clifton, 2008). The Texas Department of Transportation (TxDOT) introduced a new series of prestressed girders called the Texas I-girders (Tx girders) that have relatively wide and thin top flanges, and the performance and behavior of the commercially available overhang forming system for the Tx girders were investigated. Based upon the test results, a new concept was developed to use a precast overhang as an alternate solution to create the finished bridge deck overhang.
Another TxDOT-sponsored study on precast overhangs in concrete girders was conducted by Trejo et al. (2008). In that study, the precast overhang replaced the conventional overhang constructed by using an overhang forming system.
2.5.2 Bearing Pad Studies
The support condition of the girders has a significant impact on the torsional response of steel and concrete girder systems. As a result, previous investigations on bridge bearings played an important part in both experimental and computational studies on the torsional behavior of bridge girders. DuPont (1984) provided updated engineering data on neoprene bearings and specifically reported data on compressive stress-strain behavior in compression for loads up to 2000 psi on bearings of shape factors up to 20, shear modulus vs. compressive load, and properties of steel- and fabric-reinforced bearings. The shape factor for bearing pads is defined
by = ×( ), where , and ℎ are the length and width of the bearing pad and the
thickness of the elastomer layer, respectively. Arditzoglou, Yura, and Haines (1995) tested various sizes of bonded natural rubber pads
in compression, tension, shear, and combined compression and shear. They obtained load-deformation relationships and calculated mechanical properties of the compressive modulus, tensile modulus, and shear modulus of various rubber pads.
The role of several factors on the elastomeric bearing performance was considered by Muscarella and Yura (1995). They analyzed the effect of elastomer hardness, shape factor,

16
reinforcing shim orientation, degree of taper and compressive stress level on the bearing performance and developed a simple design procedure. Their research included experiments on shear, compressive, and rotational stiffness; shear and compression fatigue loading; and tests to determine compressive stress limits.
A simple and cost-effective test method for evaluating the shear modulus of full-size elastomeric bridge bearings was developed by Topkaya (1999), and was found to give good estimates of shear modulus for laminated bearings.
Roeder (2000) developed a report on cotton-duck pads (CDP) consisting of thin layers of elastomer interlayed with layers of cotton-duck fabric. The main goal of that work was to evaluate the validity of existing tests that claim to represent the true behavior expected in bridge bearings. The report contained the compressive stress-strain curves of steel-reinforced elastomeric bearing pads with numerous shape factors.
Under NCHRP Project 10-51, Yura et al. (2001) investigated the effectiveness of existing testing requirements for bridge bearings of AASHTO and state DOTs, and recommended specifications for the acceptance testing of elastomeric bearings. Full-scale bearings were tested in shear as part of the laboratory investigation, and the results from the tests illustrated the shear behavior of the bearing pad.
Stanton et al. (2006) studied on steel-reinforced elastomeric bearings. The ability of the bearings to accommodate the loads and rotations without excessive damage was evaluated by testing and analysis of the bearings. Their recommendations for the AASHTO LRFD Bridge Design Specifications (2004) included the removal of the absolute limit on compressive stress, and the elimination of the “no-uplift” provisions, which were causing difficulties for designers.
2.5.3 Overhang Design Guidelines
2.5.3.1 Departments of Transportation (DOT)
Many State Departments of Transportation (DOTs) in the United States provide guidelines for the design of overhangs in concrete and steel bridges. These guidelines are generally based upon rules of thumb, rather than in-depth research on the behavior of girders subjected to overhang loads.
Many DOTs specify separate overhang limits for concrete and steel bridges. For example, the South Carolina DOT requires that the overhang width limits for both prestressed concrete girders and steel girders are a function of the girder depth as shown in Table 2.1.
Table 2.1: Slab Overhang Limits
Beam Type Beam Depth (D) Maximum Overhang Limit
Concrete Beam D < 54 in. 42 in. 54 in. ≤ D ≤ 63 in. 48 in. 63 in. < D 54 in.
Steel Beam D < 36 in. D (Beam Depth) in. 36 in. ≤ D ≤ 48 in. 42 in. 48 in. < D 45 in.

17
The guidelines vary widely from state to state. The LRFD Bridge Design Manual (2008) from the Texas Department of Transportation (TxDOT) provides specific overhang width limits based on the depth and spacing of the girder in the following way.
• Typical Overhang is 3.0 ft. measured from the center line of the beam to the edge of the slab.
• Maximum overhang measured from edge of slab to face of beam top flange (or steel beam flange quarter point) is the lesser of 3.917 ft. or 1.3 times the depth of beam, which prevents excessive torsion on fascia beams during slab placement. At span ends, reduce the limit from 3.917 ft. to 3.083 ft. to account for reduced wheel load distribution.
• Minimum overhang is 0.5 ft. measured from edge of slab to face of beam top flange to allow sufficient room for the slab drip bead.
TxDOT is currently in the process of phasing out the conventional prestressed concrete I-
Beams, and replacing with new types of wide-flanged prestressed concrete I-Girders. Table 2.2 shows the typical slab overhang dimensions of these new concrete I-Girders, which are measured from the girder centerline to the edge of slab.
Table 2.2: Slab Overhang Dimensions of TxDOT Prestressed Concrete I-Girders
Slab Overhang Dimensions, Slab Edge to CL Exterior Girder
Girder Type Typical
Overhang Width Minimum
Overhang Width
Maximum Overhang Width
At Span Ends
At Midspan
Tx28 3 ft 2 ft 4 ft 4 ft Tx34 3 ft 2 ft 4 ft 4.67 ft Tx40, Tx46 and Tx54 3 ft 2 ft 4 ft 4.75 ft Tx62 an dTx70 3 ft 2.25 ft 4.25 ft 5 ft
2.5.3.2 Other Guidelines
The Steel Design Handbook (2006) from the National Steel Bridge Alliance (NSBA) states that the forces in the exterior and interior girders will be reasonably balanced when the deck overhang is around 30% to 32% of the girder spacing. The handbook warns that too large or small overhang widths will lead to large unbalanced torsional moment in the exterior girder.
The American Institute of Steel Construction (AISC) developed a report to discuss the influence of the construction overhang loads on the fascia girders in steel bridges (Grubb, 1990). The report provided a method to determine the stresses in the top and bottom flanges of the steel I-girder due to the construction overhang load. The torque from the overhang load is modeled as a horizontal couple acting on the fascia girder and calculated from statics. The top and bottom flanges between two adjacent cross-frames in the same girder are isolated from the girder and are considered as a fixed-end single-span beam subjected to one component of the horizontal couple. The internal stresses and deflections in the flange are calculated from Euler beam theory.

18
The AASHTO LRFD Bridge Specification (2007) addresses construction overhang loads on the fascia girders in steel bridges. The specification states (C6.10.3.4):
The applied torsional moments bend the exterior girder top flanges outward. The resulting flange lateral bending stresses tend to be largest at the brace points at one or both ends of the unbraced length. The lateral bending stress in the top flange is tensile at the brace points on the side of the flange opposite from the brackets. These lateral bending stresses should be considered in the design of the flanges.
The horizontal components of the reactions on the cantilever-forming brackets are often transmitted directly onto the exterior girder web. The girder web may exhibit significant plate bending deformations due to these loads. The effect of these deformations on the vertical deflections at the outside edge of the deck should be considered. The effect of the reactions from the brackets on the cross-frame forces should also be considered.
Excessive deformation of the web or top flange may lead to excessive deflection of the bracket supports causing the deck finish to be problematic.
2.5.4 Computer Design Tool
A cooperative research program (K-TRAN) was established among the Kansas DOT, the University of Kansas (KU), and Kansas State University to study steel bridge behavior. That research group created a computer design tool, Torsional Analysis for Exterior Girder (TAEG), to aid in evaluating and designing a contractor’s falsework system. TAEG evaluates stresses and deflections of the girder flanges; forces in the brackets, diaphragms, and cross frames; and the effects of tension tie rods and timber compression struts on temporary supports. A key assumption in TAEG is the use of rigid lateral torsional supports at the ends of the bridge. The program also assumes that the geometry of the brackets will be as specified by the engineer. In addition, the program does not consider global or local stability of the girder with regards to the overhang.
2.5.5 FEA modeling
2.5.5.1 Bearing Pads
FEA studies on bearing pads using commercial software have used solid elements and line elements approaches. Solid element models, which define the bearing pads using solid elements, are general and consider the bearing as a non-homogeneous continuum. The steel laminates are modeled as an elastoplastic material and the rubber layers as a nonlinear elastic incompressible material. The term incompressible material indicates that the material deforms without changing in volume. The line element approach represents the bearing pads by a series of line elements. This approach models the bearing as a combination of horizontal (parallel to width of the supported beam) and vertical (parallel to depth of the supported beam) springs to simulate the lateral restraining effect and the vertical deflection. Even though both models can represent the structural behavior of the bearing pads successfully to a certain degree, the line-element model is preferable as it is more practical for the modeling of the entire bridge.
Two other reports, one by Yura et al. (2001) and the other by Yazdani et al. (2000), proved important to understanding bearing pad behavior. Yura et al. (2001) conducted experimental research in four main areas: shear modulus, aging, creep, and effects of low

19
temperature. They also undertook theoretical studies on the effect of misaligned steel laminates on the stresses and deformation within the elastomeric bearing by using the solid-element modeling approach.
Yazdani et al. (2000) used the solid-element model approach to validate the AASHTO bearing stiffness specifications and incorporated the line-element approach to represent a computational model with line-elements for elastomeric bearing pads into the FEA model for a bridge. They modeled bearing pads using Link10 truss elements in ANSYS, which address “compression-only” and “tension-only” behavior and represent the “lift-off” phenomenon of girders from bearing pads effectively and easily.
2.5.5.2 Concrete Beams
Another focus of the FEA literature review was the modeling of structural members. Both Abendroth et al. (1991) and Johnson (2006) found that prestressed beams can be represented by solid elements. Johnson used the ANSYS 3D reinforced concrete element SOLID65 to model a concrete beam.
2.5.5.3 Plate Girders, Stiffening Elements, and End Diaphragms
Plate girders, stiffening elements, and end diaphragms are frequently modeled using shell elements. Shell elements can undergo both out-of-plane bending and in-plane membrane deformations. Each node has six degrees of freedom: three translations and three rotations. Stress results are available at the four corner nodes while displacements are given for all eight nodes. The shell element allows for offsettting of the locations of nodes within the element, which facilitates the representation of thickness changes for flanges and webs. Although end diaphragms can be modeled by shell elements, they can also be represented by line elements (truss elements and beam elements). Wang (2002) used truss elements to model cross frames and lateral struts spanning between adjacent girders. Truss elements have two nodes with three translational degrees of freedom per node. Truss elements cannot model bending or torsional deformations.
2.6 Case Studies Some Texas bridges have recently experienced problems as a result of overhang
construction. These bridges were part of the motivation for this TxDOT-sponsored research investigation, which included a steel twin-girder bridge and two concrete girder bridges. The steel twin-girder bridge was a widening project in Houston, Texas that had a problem with the system-mode deformations during construction. The two concrete girder bridges were constructed in Hutto, Texas and had excessive rotations in the fascia girders during construction.
Global stability can be a major concern in bridge widening projects in which a few girders are added to an existing bridge. The widening may sometimes be isolated from the existing bridge so that the added girder system is free to displace vertically during casting of the concrete slab. Isolating the widening from the existing bridge avoids large brace forces that are likely to develop if intermediate cross frames were used between the existing bridge and the widening. The geometry of the addition often has a relatively large span-to-width ratio. Although intermediate cross-frames are employed along the girder length, systems with a large span-to-width ratio are susceptible to the “system-buckling mode” discussed in Section 2.4, which is relatively insensitive to the spacing or size of the intermediate cross-frames (Yura et al. 2008).

20
Figure 2.13 shows the steel twin-girder system used in the bridge-widening project that experienced problems with system buckling during construction of the concrete bridge deck. In this case, the system buckling mode was also affected by the combined unbalanced overhang load. The twin girders had a 166-ft simple span with a 5.1 ft. spacing between the two girders. Two end diaphragms and eleven intermediate cross-frames were used between the two girders. The cross-frames consisted of L4×4×3/8 angles with an area of 2.86 in2. An 8-in. reinforced concrete deck with a 2-in. concrete haunch was cast on top of the girders. The concrete deck of the twin-girder bridge, which was not connected to the existing bridge deck was 11.13 ft wide. Because the overhang brackets were utilized only for the exterior girder of the twin-girder bridge, the fresh concrete deck load resulted in an unbalanced load that created a torque for the girder system and amplified the system buckling mode. Although eleven intermediate cross-frames were used, the girder system suffered a significant twist (clockwise along the girder length in Figure 2.13(a)). The twist of the girders is indicated in Figure 2.13(b) by the 10-in. offset of the bottom flange measured from a plumb line from the top flange.
Figure 2.13: Twin-Girder Widening with Excessive Girder Rotation
The two concrete bridges with excessive rotations in the fascia girders were located at the west side of the intersection of State Highways 79 and 130. The bridges used prestressed concrete girders spaced 6.9 ft on-center with a span of approximately 65 ft. The girders AASHTO Type B beams that are 34 in. deep with top and bottom flange widths of 12 and 18 in., respectively. The overhang width from the center of the fascia girder to the edge of the deck was 3 ft. The bearing pad for Type B beams was 8 by 16 in. with a thickness of 2.5 in. Beam bracing was installed in accordance with the TxDOT MEBR (C) Standards, Minimum Erection & Bracing Requirements.
According to the field investigation of the bridges in November 2006 as shown in Figure 2.14, both bridges experienced significant rotations in the fascia girders that were locked into the bridge. The rotations in the fascia girders were about the same along the girder length, and ranged from approximately 2 to 3 degrees. Figure 2.15 shows the typical example of the lift-off of the fascia girder from the elastomeric bearing pad from the bridges due to that rotation.

21
Figure 2.14: Rotation Measurement at Hutto Bridges
Figure 2.15: Lift-off of Fascia Girder from Bearing Pad

22

23
Chapter 3. Experimental Program
3.1 Overview As outlined in Chapter 1, this research investigation included field monitoring,
computational studies, and experimental testing. While the field studies from concrete bridges provided valuable data for the FEA models for the concrete bridges, uncertainties in the modeling of key elements in concrete girder systems necessitated laboratory tests. Three different types of laboratory tests were conducted at the Phil M. Ferguson Structural Engineering Laboratory at The University of Texas at Austin: R-bar tests, beam overturning tests, and a test of girder and deck panel system. In this chapter, the experimental programs and test results are discussed in detail.
3.2 R-bar Testing
3.2.1 Introduction
An R-bar is embedded into a prestressed concrete girder to connect the concrete deck and a prestressed concrete girder, thereby allowing the deck and the girder to act compositely after the concrete cures. During construction, the R-bar connects the top bracing bar and a prestressed concrete girder. However, the strength and lateral stiffness of typical R-bar connection were not known, nor was the structural behavior of an R-bar completely understood. The structural behavior of an R-bar was investigated by conducting load tests on R-bars. The test focused on the structural behavior of an R-bar subjected to lateral load from the bracing bar. The test provided measurements of both the lateral stiffness and capacity of the connection between the R-bar and bracing bar.
Figure 3.1 shows the dimensions of the cross section of the Tx I-Girder 46 and the configuration of the R-bar used in the test. The specified yield strength of the #4 R-bar is typically 60 ksi. As shown in Figure 3.1, the R-bar is embedded into the beam, and the top portion of the R-bar extends from the top surface of the beam. The average distance from the top surface of the girder to the top of the R-bars used in the test was 5.5 in.

24
Figure 3.1: Dimensions of Tx46 and R-bar
3.2.2 Test Setup
The test setup for the R-bar experiments was fabricated and installed on the Texas I-Girder 46, which is 46 in. deep as shown in Figure 3.2. The test setup consisted of a steel frame composed of steel plates. Bolts on the side of the frame were tensioned to clamp the frame to the top flange of the concrete girder. A piece of #5 reinforcing bar was used to simulate the bracing bar and was welded at the top of the #4 R-bar to match the typical connection configuration used in practice.
D+
4 1/
4˝
3 1/4˝
46˝(=D)
23.5˝
30.5˝
36˝
3 1/2˝
4˝
22˝
7 3/4˝
8 3/4˝
32˝
Tx46
R-bar
R-bar (#4)

25
Figure 3.2: Test Setup for R-bar Testing
Load was applied with a hydraulic center-hole actuator that was anchored with a chuck for a reinforcing bar.
Concrete Girder
Anchor
Load Cell
Ram Top Bar Wire String Potentiometer
Steel Frame
Bolt
R-bar

26
3.2.3 Instrumentation
Figure 3.3 shows a load cell and a linear transducer (string potentiometer) used in the test. The Interface load cell had a capacity of 25 kips, and was used to measure the force that developed in the top bracing bar that was attached to the R-bar. The load cell was placed between the hydraulic center-hole actuator and the chuck as shown in Figure 3.3. The string potentiometer from AMETEK was used to measure the lateral deformation of the R-bar. The string potentiometer was fixed to a wood support that was attached to the girder using clamps. A clamp was also used to connect the steel wire from the string potentiometer to the top of the R-bar. Based upon the measurement of the applied force and the lateral deformation, the stiffness characteristics of the R-bar were evaluated.
Figure 3.3: Load Cell and Linear Motion Transducer in Place
3.2.4 Test Results
Identical tests were conducted on two R-bars. Figure 3.4 shows the relationship of the applied load and lateral deformation of the two R-bars. The R-bars exhibited linear-elastic behavior until the elastic limit of the material was reached. After that, the material behavior became nonlinear and the yield plateau was observed. Both R-bars exhibited good ductility with maximum lateral deformations ranging from 1.4 to 1.5 inches. From the graph, the average lateral stiffness and capacity of the R-bars for the two tests were 15.5 kips/in. and 2.2 kips, respectively. If Young’s modulus of 29,000 ksi and the design yield stress of 60 ksi are used for a typical top bracing bar of a length of 7.3 ft that is attached to a R-bar, the axial stiffness and capacity of a top #5 bracing bar are 102.2 kips/in. and 18.6 kips, respectively. Because the top bracing bar and the R-bar are connected in a series, it can be concluded that the stiffness and capacity of the top bracing are generally governed by the R-bar. Figure 3.5 shows the deformations that occurred during the testing of the R-bars. No visible crack in the concrete or

27
pullout of a R-bar was observed in either of the two R-bars tested. Therefore, in treating the R-bar as a flexural element extending from the concrete girder, it is reasonable to assume a fixed condition at the concrete interface for the R-bar at the bracing load levels that are typically encountered in practice.
Figure 3.4: Lateral Force and Lateral Deformation of R-bar
Figure 3.5: Permanent Deformation of R-bar after Removal of Load
0
0.5
1
1.5
2
2.5
0 0.2 0.4 0.6 0.8 1 1.2 1.4 1.6
Late
ral
Forc
e (k
ips)
Lateral Deformation (in.)
test #1
test #2

28
3.3 Beam Overturning Test
3.3.1 Introduction
The field investigation on the Hutto concrete bridge showed that most of the beam rotation about the longitudinal axis was due to rigid-body rotation on the elastomeric bearing pads. Many previous studies on elastomeric bearing pads have focused on the shear and sliding performance of the bearings. Data on the rotational performance of the bearings were not available. There are several factors with nonlinear performance in the rotational behavior of the beams on the elastomeric pads. The nonlinearities include material nonlinearity in the bearing pads, contact nonlinearity between a beam and a bearing pad, and geometric nonlinearities in the torsional load. In order to clarify complexity from these nonlinearities, it was essential to conduct an experimental investigation on a beam that is subjected to overturning force. The beam overturning test was aimed at improving the understanding of the overturning mechanism of a beam that rotates about its longitudinal axis while resting on bearing pads. The data from the beam overturning test provided valuable validation data for the analytic model and FEA models for elastomeric bearing pads.
To conduct the beam overturning test, a prestressed concrete beam was supported on elastomeric bearing pads at each end and an eccentric overturning force applied at midspan was used to simulate load from the overhang. Two shapes of bearing pads were considered in the tests because the TxDOT bearing standards currently include rectangular shapes and circular shapes.
3.3.2 Specimen
ATxDOT Type C beam was used in the tests as depicted in Figure 3.6. The span length of the beam was 55.5 ft. and the design beam weight was 29.2 kips. Figure 3.7 shows the dimensions of the rectangular and circular elastomeric bearing pads that were tested. The rectangular bearing pad of C1 type was 7 in. long, 16 in. wide, and 2.86 in. thick.

29
Figure 3.6: Dimensions of Beam Tested
Figure 3.7: Dimensions of Elastomeric Bearing Pads Tested
The diameter and thickness of the circular bearing pad were 15 in. and 2.86 in., respectively. Both types of bearing pads were reinforced with seven steel shims that were 0.105 in. thick. For design purposes, the shear modulus of elastomeric bearing pads is generally the most important property for the bearing pad. The common method to estimate the shear modulus of elastomeric bearing pads is to measure the hardness of the bearing pad, because the hardness of the bearing pad is loosely related to its shear modulus and it is easy and quick to measure
16˝(Length) 15˝(Diameter)
2.86˝
Length or Diameter
7˝
(a) Plan View of Circular Bearing (b) Plan View of Rectangular Bearing
(c) Elevation View of Bearing
Exterior layer: 0.25˝ Interior layer: 0.27˝
Thickness of Shim: 0.105˝

30
using a durometer. Figure 3.8 shows the measurement of the hardness of the bearing pads, and the hardness of the pads was slightly below 50. The shear modulus for the hardnesses from 45 to 55 ranges from approximately 0.077 to 0.11 ksi (Muscarella and Yura, 1995). The shear modulus of bearing pads can affect the rotational stiffness of the bearing pad and also the ultimate overturning load that a beam can sustain.
Figure 3.8: Measurement of Hardness of Bearing Pad
3.3.3 Test Setup
The steel frame shown in Figure 3.9 was used to apply an eccentric force to overturn the beam. The steel frame was constructed by using back-to-back channels with a 4.25-in. gap between them. Figure 3.10 shows the steel frame installed on the beam.
Figure 3.9: Elevation View of Beam Tested
55.5 ft
Elastomeric Bearing Pad A
A
Torsion from Eccentric Load at Midspan Concrete Beam
Concrete Block

31
Figure 3.10: Moment Connection at Midspan (Section A-A)
The steel rods were pretensioned to ensure that the steel frame transferred the eccentric overturning force to the beam. A hydraulic actuator was used to apply a vertical force to the top of the steel frame at a distance of 36.25 in. from the centroid. The center-hole actuator was anchored to the reaction floor through the steel rod.
Figure 3.11 shows the safety measures taken in order to prevent the tested beam from completely tipping over to the rigid floor during the test. Safety chains were connected between the column and the top of the beam at each support. Concrete blocks were also placed close to the bottom flange of the beam at support.
Figure 3.11: Safety Measures to Prevent Beam from Tipping Over
Safety Chain
Concrete Block
Safety Chain
Concrete Block
36.25˝
Concrete Beam
Back-to-Back Channel Load Cell
Steel Rod Steel Rod
Rigid Floor
RAM
11˝

32
3.3.4 Instrumentation
Figure 3.12 shows locations of a load cell and string potentiometers in place. A 50-kip load cell (Strainsense Enterprises, Inc.) measured the vertical force applied to the steel frame. The load cell was placed between the hydraulic actuator and the steel plate. A 1" x 1" piece of lumber with a length of 66 in. was used at each support to amplify the torsional deformations for data monitoring purposes. The AMETEK string potentiometers were used to monitor the readings of vertical movement of both ends of the 1" x 1" piece of lumber. Girder twist was calculated based upon the differences in the vertical displacements of the string potentiometers and their horizontal spacing.
Figure 3.12: Locations of Load Cell and String Potentiometers
3.3.5 Overturning Test Results
Figure 3.13 shows the overturning test results for the rectangular and circular elastomeric bearing pads. The applied vertical load is graphed versus the rigid body twist that was measured at the supports. The curve for the rectangular bearing pad was relatively linear for small load levels. For further increase in load, the reduction in stiffness can be seen as the slope of the curve decreased. The maximum overturning force was 4.93 kips corresponding to a beam rotation of 2.2 degrees, which represents the tipping load for the beam. The beam did not actually tip over at this point because its displacement was controlled by the stroke of the hydraulic actuator. If the applied force had been gravity load, the beam would have tipped over at the maximum measured resistance of 4.93 kips. The beam rotation of 2.2 degrees at the tipping load is similar to the beam rotation measured at the Hutto concrete bridge. While similar trends in behavior were observed for the test results for the circular elastomeric bearing pad, there were slight differences. Although the initial stiffness of the circular bearing was slightly larger than that of the rectangular bearing, the stiffness of the circular bearing dropped more quickly with increasing rotation. The tipping force of 4.02 kips at a rotation of 1.22 degrees was also smaller
(a) Instruments in Place (b) Load Cell
Load CellString Pot
String Pot
Load Cell

33
for the circular bearing. The theoretical overturning force for a beam on a rigid support of the same width (16 in.) as the rectangular bearing pad is calculated as 8.27 kips. Therefore, the overturning capacity of the beam on rectangular bearing pads was 60% of that on a rigid support. The 40% reduction in the overturning force is caused by the compressibility of the bearing that results in a smaller moment arm for the restoring force provided by the self-weight of the beam. Figure 3.14 shows the rectangular and circular bearing pads.
Figure 3.13: Overturning Load and Rigid Body Rotation of Beam
Figure 3.14: Rectangular and Circular Bearing Pad
0
1
2
3
4
5
6
0 0.5 1 1.5 2 2.5 3 3.5 4
Ecce
ntric
Load
(kip
s)
Rigid Body Rotation (deg.)
Circular Bearing
Rectangular Bearing

34
3.4 Test on Girder and Deck Panel System
3.4.1 Introduction
The TxDOT standard drawing shows that a top bracing bar should be connected to an R-bar at a distance of 1.5 in. up from the top surface of a concrete beam as shown in Figure 3.15. However, because 4 in. thick prestressed concrete panel are typically used with concrete girders, actual field applications do not match the TxDOT standard detail. Instead the bracing bars are usually placed over the top of the prestressed panels and then bent down and connected to the R-bar as shown in Figure 3.16. The pictures shown in Figure 3.16 were the ones of the bridge that was monitored in the field studies on SH 130 as discussed in Fasl (2008). Instead of connecting to the R-bar at 1.5 in. from the bottom, in practice the bracing bars are often welded near the top of the R-bar. There are a number of uncertainties in the behavior of the actual geometry that is frequently used in practice. This necessitated laboratory testing on the full system. To study this behavior, tests on the full deck system were conducted using three different bracing bar details as shown in Figure 3.17. The detail shown in Figure 3.17(a) matches the TxDOT standard drawing with the (unbent) bracing bar connection to the R-bar at 1.5 in. from the bottom.
Figure 3.15: TxDOT Standard Drawing for Girder Bracing
Top Bracing Bar 1.5" R-bar
4" × 4" Timber

35
Figure 3.16: Top Bracing Connection Details in Practice
The detail shown in Figure 3.17(b) is consistent with the actual geometries witnessed in practice, in which the bracing bar passes over the top of the concrete panel and is bent to connect to the top of the R-bar. In addition, the detail shown in Figure 3.17(c) was also tested to determine if the stiffness was improved by extending the bracing bar, thereby allowing two connection points to the R-bar. In addition to welding the bracing bar near the top of the R-bar in Figure 3.17(c), extending the bar also allows it to be connected to the R-bar approximately 1.5 inches from the top of the beam. Another difference between the two details shown in Figure 3.17(b) and Figure 3.17(c) is the “kink” of the bracing bar with the larger angle required in Figure 3.17(c). The average kink angle that was measured in the Airport concrete bridge was approximately 14 degrees. The respective kink angles of the bracing bars shown in Figure 3.17(b) and Figure 3.17(c) are approximately 30 degrees and 50 degrees.
In addition to investigating the effect of the bracing bar detail, another major reason for the tests was to improve the understanding of interaction between the various components of the girder and deck panel system. The deck panels used for the forming system are supported on a flexible bearing strip as shown in Figure 3.18. The various components of the system can have significant effects on the interaction between the deck panel, the bracing bar, the R-bar, and the compressible insulation. This lack of understanding of this interaction leads to uncertainty about top bracing behavior.
The goal of the test on the girder and deck panel system is to investigate the effects of different connection configurations on the structural behavior of top bracing. The three different connection configurations used in the test were shown in Figure 3.17(a), (b), and (c) and are referred to as Horizontal (Standard), Inclined Top, and Inclined Bottom, respectively. As noted above, the connection shown in Figure 3.17(a) matches the TxDOT standard. The connection configuration of the Inclined Top is a realistic representation of the actual connection configurations that are widely found in practice. The connection configuration of the Inclined Bottom is a variation of the Inclined Top and was expected to be stiffer and stronger than the Inclined Top.
Top Bracing Bar
R-bar
Top Bracing Bar
R-bar
(a) Connection on Interior Girder (b) Connection on Fascia Girder

36
(a) Horizontal (Standard)
(b) Inclined Top
(c) Inclined Bottom
Figure 3.17: Connection Configurations for Top Bracing
3.4.2 Specimen
The girder and deck panel system consisted of a concrete beam, a styrofoam support strip (insulation), a concrete panel, and a top bracing bar attached to an R-bar as shown in Figure 3.18. The beam was an AASHTO Type C beam with #4 R-bars. The styrofoam support strip was 1.5-in. wide, 2-in. thick, and 48-in. long. A #5 piece of reinforcing steel was used for the top bracing bar. For the connection configurations of the Inclined Top and the Inclined Bottom, the
Top Bracing Bar 50˚
R-bar
Top Bracing Bar 30˚
R-bar
Top Bracing Bar
R-bar

37
styrofoam was placed between top of the beam and the concrete panel. A top bracing bar was placed on top of the concrete panel, bent around the edge of the panel, and welded to the top of the R-bar. For the Standard connection configuration, a straight top bracing bar was horizontally connected to an R-bar at a distance of 1.5 in. from the top surface of the beam without a styrofoam and a concrete panel as shown in Figure 3.17(a).
Figure 3.18: Top Bracing Bar, Concrete Deck Panel and Styrofoam in Place
3.4.3 Test Setup
Figure 3.19 shows a schematic of the test setup used to study the behavior of the girder and deck panel system. A picture of the actual test setup is shown in Figure 3.20. An hydraulic actuator reacted laterally near the top of the beam to simulate the torsional load that would result from the overhang load. The hydraulic actuator was attached to a steel buttress that was fixed to the rigid floor, and a hemispherical head was mounted on the front of the actuator. The hemispherical head transferred lateral force to the beam and accommodated rotation of the beam during the test. The beam was forced to tip about its lower edge by using a pin support consisting of a steel angle on the bottom edge of the concrete beam that reacted against the steel plates anchored in the rigid floor as shown in Figure 3.20. The steel angle in this setting behaved as a pin for the beam. The beam was restrained from twisting by the combination of the deck panel and the bracing bar. The bracing bar was connected to the R-bar, and was anchored on the other end by a buttress connected to the rigid floor.
3.4.4 Instrumentation
A StrainSert load cell with a 50-kip capacity was used to measure the lateral force that was applied to the beam. The load cell was placed between the hydraulic actuator and the hemispherical head as shown in Figure 3.21(a). A 24-kip capacity Interface load cell was used to
Styrofoam
Concrete Deck Panel
Top Bracing Bar
R-bar

38
monitor the force in the bracing bar as indicated in Figure 3.21(b). The load cell was positioned at the buttress that anchored the bracing bar. As shown in Figure 3.21(c), strain gauges were installed in the inclined portion of the top bracing bar, and the small steel bracket was attached to the top of the R-bar to measure the lateral deformation of the R-bar. Twist in the beam was monitored using an inclinometer from Rieker Instrument as shown in as shown in Figure 3.21(d). String potentiometers from AMETEK were also used to measure the lateral movement of the beam. The readings of lateral movement of the beam were utilized to calculate rotation of the beam and these rotation values were compared to the rotation readings from the inclinometer for verification purposes.
Figure 3.19: Schematic of Test Setup

39
Figure 3.20: Test Setup for Girder and Deck Panel System
(a) Load Cell for Ram (b) Load Cell for Top Bar
(c) Strain Gauges (d) String Potentiometers and Inclinometer
Figure 3.21: Instrumentation for Girder and Deck Panel System
Pin Support

40
3.4.5 Test Results
A graph of force in the top bracing bar versus girder twist is shown in Figure 3.22 for the three different bracing bar details that were tested. For the connection configurations of the Inclined Top and the Inclined Bottom, the curves decreased in stiffness with rotation of the beam and exhibited a plateau after a beam rotation of approximately 1 degree. For larger rotations there was an increase in the slope of the curves that represents stiffening in the connections. The connection to the top of the R-bar in the Inclined Bottom detail ruptured at a rotation of approximately 2.25 degrees, as indicated by the sharp drop in the curve. Both details failed by rupture of the R-bar. The Inclined Bottom bar had a higher yield plateau and a higher ultimate strength than the Inclined Top detail. It was observed that these two connection configurations possess good ductility as shown in Figure 3.22. In comparison, for the Standard detail, the curve was significantly stiffer than the Inclined details. The Standard detail also failed by rupture of the R-bar. Pictures of the ruptured R-bars are shown in Figure 3.23. The Standard detail did not possess much ductility when compared to the Inclined details. However, the large deformations in the R-bars would most likely not provide significant warning of the impending failure as the construction workers on the bridge would likely be unaware of the deformations while placing concrete.
Figure 3.22: Force in Top Bars and Beam Rotation
The behavior of the R-bars with lateral loading was discussed in Section 3.2 and graphed in Figure 3.4. According to the results of the R-bar testing from Figure 3.4, the maximum force the R-bar developed with a straight top bar connected to top of it was about 2 kips. This maximum force was smaller than the values measured in the overall system graphed in Figure 3.22 due to the added stiffening the deck panels provide to the overall system. However, while this indicates that interaction between the components in the girder and deck system does exist, beneficial effects of such interaction may be conservatively ignored as the beneficial effects may not be realized because the stiffness of the system may prove to control the behavior.
0
1
2
3
4
5
6
7
0 1 2 3 4
Forc
e in
Top
Bar (
kips
)
Beam Rotation (deg.)
Inclined Top
Inclined Bottom
Standard

41
(a) Horizontal (Standard)
(b) Inclined Top
(a) Inclined Bottom
Figure 3.23: Failures of Top Bracing
3.5 Summary of Laboratory Testing In this chapter, details of the experimental program as well as a summary of the
experimental results were presented. The experimental programs included R-bar testing, the beam overturning test, and the test on the girder and panel deck system. In Section 3.2, the
Top Bracing Bar
50˚
R-bar
Top Bracing Bar 30˚
R-bar
Top Bracing Bar
R-bar

42
structural behavior of an R-bar subjected to lateral force was investigated. The lateral stiffness and capacity of an R-bar were found to be small compared to those of a top bracing bar. This indicates that the lateral stiffness and capacity of top bracing were governed by an R-bar. In Section 3.3, the beam overturning test provided a better understanding of the overturning mechanism. The maximum rotation a Type C beam could sustain was less than 2.5 degrees. In Section 3.4, the effects of three different connection configurations on the structural behavior of top bracing were studied and uncertainty about interaction between all the components in a girder and deck system was clarified. While the Standard connection configuration possessed more stiffness and capacity for small rotation, the other two connection configurations behaved flexibly and possessed good ductility. The results from the laboratory testing provided valuable validation data for the finite element model that is discussed in the next chapter.

43
Chapter 4. Finite Element Model
4.1 Introduction Field data or the testing of selective specimens provided valuable data that was used to
validate the accuracy of finite element analytical (FEA) models so that extensive parametric testing could be conducted to improve the understanding of the basic behavior. Although physical testing was used to improve the understanding of structural behavior, computational models also played an important role in understanding general behavior. These models allowed extensive studies of the structural system that would otherwise need to be gained by much more detailed testing programs, which is not generally feasible.
The three-dimensional program ANSYS (2009) was used for the finite element analysis. This chapter provides an overview of the finite element models along with comparisons of the FEA results with data from the field and laboratory tests.
Data from the laboratory tests as well as field data from Airport concrete bridge and the Lubbock steel bridge were used to validate the FEA models. In addition, measurements from the Hutto concrete bridge that had excessive rotation in the fascia girder were also used to investigate the cause of the excessive rotation in the fascia girder as well as provide a better understanding of the behavior of the girder system with slab placement bracing during construction.
This chapter is divided into seven sections. Following this introductory section, the following two sections provide an overview of the finite element models as well as the modeling techniques for key elements in the bridge system. The subsequent three sections provide comparisons between the FEA models and results from the field studies that were used to validate the model. The final section of the chapter provides a summary of the chapter.
4.2 Elements for FEA models As summarized in Table 4.1, several different types of elements were used to model the
concrete and steel girders in the study. In this section, a brief overview of those elements is provided. Modeling techniques are discussed later.
Table 4.1: ANSYS Element Types for FEA modeling
Element Type Structural Component Note Solid65 Prestressed Concrete Beam 3-D reinforced concrete solid Solid45 Connection Plate for Bearing Pad 3-D structural solid
Link8 Top Bracing Bar Strut Cross Frame
3-D truss element
Link10 Timber Blocking Vertical Reaction of Bearing Pad
Tension or compression only line element
Beam189 R-bar 3-D quadratic finite strain beam Combin14 Shear Force of Bearing Pad 3-D line element
Shell63 Connection Plate for R-bar Stiffeners for Girder
Elastic shell
Shell99 Plates for Girder Elastic shell

44
The Solid65 element was used to model the prestressed concrete beams. The element is defined by eight nodes, each with three translational degrees of freedom. The element can be used for 3-D modeling of solids with reinforcing bars. The reinforcing bar is created in the element simply by defining the volume ratio of reinforcing bars to total element. Up to three different volume ratios can be defined in any of the three element axes to accommodate concrete reinforcing bars placed perpendicularly to each other inside the concrete. The reinforcing-bar capability was utilized to represent the prestressing strands that run along the girder length. The modulus of elasticity, Poisson’s ratio, and unit density that were used for the concrete were 5500 ksi, 0.2, and 0.15 kcf, respectively.
The Link8 element was used in both the concrete and steel girder models. The Link8 is a truss element that is defined by two nodes, each with three translational degrees of freedom. In the concrete girder systems, the Link8 element was used to model the top bracing bar that is connected to the R-bar of adjacent girders. In the steel girder systems, the truss element was used to model the struts and cross-frame bracing members. The modulus of elasticity that was used for steel was 29,000 ksi.
Another truss element type that was used was the Link10 element, which is also a 3-D line element defined by two nodes, each with three translational degrees of freedom. The element has the unique feature of a bilinear stiffness matrix, and can be used for applications with uniaxial tension-only or compression-only behavior. This feature is very useful as a contact element for axially loaded structural members. The Link10 element was used to model timber blocking used as temporary bracing for prestressed concrete girders during construction. Several Link10 elements were also used as a system to model the vertical reactions from the elastomeric bearing pad, where the contact element capabilities were able to predict lift of the bearing. The horizontal component of the reactions at the elastomeric bearing pads were modeled using the Combin14 spring element, which has longitudinal or torsional capability in 1-D, 2-D, or 3-D applications. The longitudinal spring option is a uniaxial tension-compression element with up to three translational degrees of freedom at each node.
The portion of the R-bars that extends from the top of concrete beams was modeled using the three-dimensional beam element, Beam189. The beam element is defined by three nodes and has six or seven degrees of freedom at each node. The degrees of freedom include three translations in the x, y and z directions and rotations about the x, y and z directions. The seventh degree of freedom can be activated to capture warping stiffness. The element is suitable for analyzing slender to moderately stubby/thick beam structures and is based on Timoshenko beam theory.
The mesh density that was used for the concrete beams and the bearing pads differed because the bearing pad required a much more dense mesh. The mesh density transition was provided using the Solid45 element. The element is defined by eight nodes and each node has three translational degrees of freedom.
A transitioning element was also necessary at the interface between the R-bar and the concrete beam in the model. The Beam89 element has the rotational degree of freedom that is necessary to transfer the moment from the R-bar into the beam; however, the Solid65 element that was used to model the concrete does not have the rotational degree of freedom. Therefore, the Shell63 was used to provide the moment connection between the element type of Solid65 for the concrete beam and the element type of Beam189 for the R-bar. The element Shell63 has six degrees of freedom at each node that includes three translations in the nodal x, y and z directions and three rotations about the nodal x, y and z-axes.

45
Finally, the three-dimensional shell element, Shell99, was used to model the plate element in the steel girder models. The shell element of Shell99 has a feature of offsetting the nodes along the layer depth of the element. This node offsetting feature is useful for aligning the top and bottom flanges in the girder whose thickness changes along the length of the girder.
While this subsection provided a brief overview of the basic elements that were used in the various models, the following section explains some of the modeling techniques that were used in the concrete and steel girder systems.
4.3 Key modeling techniques
4.3.1 Moment Connections
As discussed briefly in the previous section, the beam element (Beam189) that was used to model the R-bar required a rotational DOF at the interface between the R-bar and the concrete beam. Although the Beam189 element has this rotational DOF, the Solid65 element does not possess the rotational DOF. Therefore, the Shell63 element was used as an interface between Beam189 for the R-bar and the Solid65 for the concrete beam. The Beam189 elements for the R-bar are embedded into the solid elements for the concrete beam and shares nodes with the solid element as shown in Figure 4.1(a). The Shell63 elements were created by using the same nodes that the Beam189 and the solid elements share inside the concrete beam. In Figure 4.1(b), the rectangular area in light gray represents the elements of the Shell63 that ensure moment transfer from the Beam189 to the solid element.
Figure 4.1: Moment Connection
4.3.2 Bearing Pad
4.3.2.1 Bearing Pad Model
Elastomeric bearing pads are difficult to model due to the variable stiffness in the vertical and lateral directions as well as the variable nature of the interface with the beams that rest on the
(a) Beam189 elements for R-bar imbedded in solid elements for concrete beam (b) Shell63 elements for moment connection
Beam189 elements
Shell63 elements

46
pads. The pads do not have a positive connection with the beams that they support but instead are dependent on the direct contact between the beams and the pads from gravity load. Depending on the compression in the pad from the gravity load and the in-plane or out-of-plane rotation of the beam, the beam can lift off of the pad. Therefore, the model of the bearing pad must include the ability to have variable stiffness in the different translational directions and also capture the potential lift-off of the beam from contact with the pad. The resulting system consisted of a series of spring elements to represent a bearing pad. The model included a combination of horizontal (parallel to the bottom surface of the concrete beam) and vertical (perpendicular to the bottom surface of the concrete beam) springs to simulate the lateral restraining effect and the vertical deflection of the pad. The Link10 element for the vertical springs becomes active in compression and inactive in tension. Upon the lift-off of the beam, the bearing pad loses some of the contact with the beam, and the portion of the bearing pad that lost contact with the beam is free from compression force. While active elements represent the portion in compression of the bearing, inactive elements represent the portion of the bearing pad that lost contact. The front view and side view of the vertical line elements for the bearing pad are depicted in Figure 4.2(a) and (b), respectively.
Figure 4.2: Modeling of Bearing Pad
For the horizontal line elements for the bearing pad, one end of the line element was horizontally attached to the bottom center of the concrete beam and the other end was fixed. Although this discrete model for the bearing pad considers the material properties of the bearing pad as linear, the model can simulate the behavior of the pad successfully because construction loads are small compared to service loads, and the bearing pads behave linearly for small loads based on the bearing pad test results. The linear discrete model for the bearing pad conservatively ignores the strain-stiffening effects of the bearing pads for higher load levels.
(a) Front View (b) Side View
Spring Elements for Bearing
Solid65 Element for Mesh Transition

47
4.3.2.2 Validation of Bearing Pad Model
The validation of the bearing pad model is discussed in this sub-section. The validation is performed by comparing the data from the beam overturning test and the results from a FEA beam model with the bearing pad model.
The beam overturning test, discussed in detail in Chapter 3, enabled a better understanding of the nonlinear behavior of a beam on elastomeric bearing pads, and also provided the validation data for the analytic model and FEA models for elastomeric bearing pads.
Figure 4.3 shows a FEA beam model that was developed for the AASHTO type C beam with a span length of 55.5 ft and a design beam weight of 29.2 kips. Its modulus of elasticity, Poisson’s ratio, and unit weight were 5500 ksi, 0.2, and 0.15 kcf, respectively. A load with an eccentricity of 36.25 in. was applied at midspan of the beam. The self-weight of the beam was applied in the form of gravity load and the eccentric load was applied gradually at a horizontal distance of 36.25 in. from the centroidal axis of the girder, using truss elements. The beam was supported at each end on rectangular bearing pads measuring 7-in. long, 16-in. wide, and 2.86-in. thick. The vertical stiffness and lateral stiffness for the bearing pads were 513.8 k/in and 4.06 k/in., respectively. The procedure to determine both vertical stiffness and lateral stiffness for a bearing pad is given in Appendix B. The bearing model described in the last section was incorporated into the FEA beam model. For the boundary conditions for the bearing model, the degree of freedom in the vertical direction of the bottom node of the Link10 element was fixed, and the other two degrees of freedom were coupled with the corresponding degrees of freedom of the top node of the same element. These boundary conditions allow the Link10 element to maintain the initial vertical direction throughout rotation of the beam, thereby preventing the Link10 element from applying the horizontal reactions to the beam. The horizontal component of the reactions at the elastomeric bearing pads was provided by the horizontal spring elements for the bearing pad. For the horizontal spring elements, one end of the element was horizontally attached to the bottom center of the concrete beam and the other end was fixed. The horizontal spring elements were placed both parallel and perpendicular to the beam length. A geometrically nonlinear analysis was conducted for the beam model using the Newton-Raphson method in the finite element analysis.
Figure 4.4 shows a comparison of the FEA results and the test data for rectangular bearing pads. As shown in the figure, the FEA model captured well the nonlinear behavior in rotational stiffness of the bearing pad that was observed from the testing data. In addition, the curve for the FEA results approached zero rotational-stiffness with rotation of the beam, which is consistent with the testing data. Although the maximum overturning force that the FEA model predicted was slightly larger than that from the testing data, relatively good agreement between the FEA results and the test data was achieved.

48
Figure 4.3: FEA Beam Model with Bearing Pad Model
Figure 4.4: Comparison of FEA Results and Test Data for Rectangular Bearing Pads
4.3.2.3 Verification of Mesh Fineness
Before finite element models for full bridge girder systems were developed, the mesh fineness was verified. Preliminary studies of the characteristics of rotational behavior of bearing pads showed that the width of the bearing pad plays an important role in the rotational behavior of the bearing pad. Thus, a set of bearing pad models was arranged with the Link10 element
0
1
2
3
4
5
6
0 0.5 1 1.5 2
Ecce
ntric
Load
(kip
s)
Rigid-Body Rotation (degrees)
Test DataFEA Results
Truss System
Eccentric Load
Bearing Pad Model

49
spacing in the bearing width-direction equal to 0.5, 1, 2, and 4 in., and the element spacing in the bearing length-direction fixed to 1 in.
Nonlinear large-displacement analyses were performed on all four models, and the results for different element spacings were compared to identify the relation between mesh fineness and solution.
Figure 4.5 shows the results for the 4 different element spacings. While the curves with element spacings of 2 and 4 inches exhibited relatively poor agreement, the curves with element spacings of 0.5 and 1 in. showed good agreement with each other. Although the results indicated that the element spacings up to 1 inch were capable of achieving good accuracy, to be conservative the element spacings in both the width and length directions were chosen as 0.5 inch for the bearing pad models.
Figure 4.5: Mesh Fineness Verification for Bearing Pad Models
4.3.3 Simulation of Overhang Load
Figure 4.6 shows the overhang brackets in place. To simplify FE models, construction overhang load was applied using the statically equivalent configuration of the load as depicted in Figure 4.7. The equivalent overhang load system consists of a vertical load and a horizontal-force couple. The vertical load of the equivalent overhang load system is the same in magnitude as the original construction overhang load, and is positioned at the edge of the fascia girder. The horizontal-force couple is determined by multiplying the original construction overhang load with the distance of the load resultant from the edge of the top flange of the girder. Each component of the horizontal-force couple was calculated by dividing the force couple by the dimension of as shown in Figure 4.7.
0
1
2
3
4
5
6
0 0.5 1 1.5 2
Ecce
ntric
Load
(kip
s)
Rigid Body Rotation (degrees)
Element Spacing (1")
Element Spacing (0.5")
Element Spacing (2")
Element Spacing (4")

50
Figure 4.6: Overhang Brackets in Place
Figure 4.7: Simulation of Overhang Load
4.4 FEA model for Airport concrete bridge
4.4.1 Description of FEA model
As a field investigation, a prestressed concrete girder bridge that was constructed at the interchange between State Highways 71 and 130 was chosen for instrumentation and was monitored during construction. As shown in Figure 4.8, the concrete bridge with a span length of 120 ft and a width of 50 ft consisted of seven prestressed concrete girders spaced 7.25 feet on-
(a/b)×Foh
(a/b)×Foh
b
a Foh
(a) Overhang Load
Foh
(b) Equivalent Overhang Load System

51
center. The girders were American Association of State Highway and Transportation Officials (AASHTO) Type IV beams that are 54 in. deep with respective top and bottom flange widths of 20 and 26 in. The overhang width from the center of the fascia girder to the edge of the deck was 3 ft, which is within the range of typical overhang widths for concrete girder bridges.
For interior portions of the concrete slab in the bridge, the 8-inch concrete deck consisted of 4-inch thick precast concrete deck panels and a 4-inch thick cast-in-place portion of the deck that was supported by the concrete panel. This construction method is widely used throughout the state of Texas. The weight of both precast concrete deck panel and fresh concrete between the girders reacts on the edge of the top flange of the girder.
Figure 4.8: Field Measurement Span of the Airport Concrete Bridge
The overhangs are typically supported by plywood formwork as shown in Figure 4.6. The overhang bracket is usually connected to the top flange of the fascia girder with a tension tie that was welded to an insert at the top of the girder, and the bottom of the bracket reacts on the bottom flange of the girder. The construction load that acts on the plywood formwork in the overhang is transferred to the fascia girder through the overhang brackets, and creates the overturning moment for the fascia girder.
To counterbalance the overturning moment for the fascia girder, the top bracing bar was used together with timber blocking placed between the girders. The size of the top bracing bar is often a #5 bar that is welded to the top of the R-bar (usually a #4). The young’s modulus and the specified yield strength of the bars were assumed to be 29,000 ksi and 60 ksi, respectively. Figure 4.9 shows the connections between the top bracing bar and the R-bar. The precast concrete panel raises the elevation of the top bracing bar higher than the top of the R-bar, which therefore requires the bar to be bent at the edge of the panel which leads to a kink angle in the top bar. The measurements of the kink angle in the Airport concrete bridge ranged from 0 to 31.8 degrees with an average of 13.5 degrees. This kink angle was conservatively ignored in the FEA modeling.

52
(a) Connection in Interior Girder (b) Connection in Exterior Girder
Figure 4.9: Top Bracing Connection
Temporary bracing in the form of 4-by-4 in. timbers was used on the bridge during construction. Two diagonals were connected at the middle to form an “X.” Five Xs were used in the exterior bays while three Xs were used on the interior bays. Young’s modulus and the area of the timber blocking were considered as 700 ksi and 12.25 in.2, respectively. Although Young’s modulus for the timbers varies depending on the type of wood, the 700 ksi value used was a conservative value taken from National Design Specification for Wood Construction (American Wood Council, 2005).
The elastomeric bearing pads that were used with the AASHTO Type IV girders were 9 by 22 inch with a thickness of 2.5 inch. The pad contained five steel shims of 0.105 inch thick with six elastomeric layers. The thicknesses of the elastomeric layers were 0.25 for the interior spaces and 0.375 inches for the exterior layers. As described in the previous section, the pad was modeled by using a series of linear springs.
Figure 4.10 shows the three-dimensional finite element model for the Airport Concrete Bridge. The FEA model was developed by using the ANSYS elements described in the previous section. Although the TxDOT Bridge Design Manual (2008) requires a minimum of five top bracing bars for the AASHTO Type IV girder with a span of 120 ft., the actual number of top bracing bars used in the Airport concrete bridge was nine as shown in Figure 4.10.

53
(c) Isometric View of FEA Model
(a) Top View of FEA Model
(b) Cross-Section View of FEA Model
Figure 4.10: FEA model for the Airport Concrete Bridge
In addition to the required bracing of the top bracing bars and the timber blocking, additional sources of restraint that were found in
the Airport concrete bridge included the plywood forming systems both at the thickened ends of the bridge and at a few interior locations of the fascia girder as shown in Figure 4.11. The forming system at the ends of the beams likely provided additional restraint to the girder

54
system. In particular, this forming system at the thickened ends of the bridge probably provided some restraint to the rigid-body rotation of the fascia girder at support. However, because these sources of restraint are not generally reliable or designed for bracing, the additional restraint was conservatively neglected in the FEA modeling.
Although the rotation of the fascia girder was expected to be small, a geometrically nonlinear analysis was conducted for the Airport concrete bridge by using the Newton-Raphson method in the finite element analysis. A linear analysis was also conducted and confirmed that the analysis results from both analysis options were similar to each other.
(a) Formwork for Thickened Ends (b) Formwork for Drainage
Figure 4.11: Formworks for Thickened Ends and Drainage
4.4.2 Validation of FEA model for Airport Bridge
The FEA modeling techniques that were used for modeling of the Airport Concrete Girder Bridge were validated by comparing FEA results and field data. Fasl (2008) included the vertical deflections of the girders, the rotations about the longitudinal axis of the girder and the axial forces in the top bracing bars. In particular, the field data used for comparisons with the FEA results were the deformations that occurred during placement of the concrete deck. Vertical deformations were taken using a laser distance meter with a precision of ± 0.0625 in. The girder deformation was obtained by comparing the measured distance from the ground to the bottom of the girder before and after the concrete placement, at the location shown in Figure 4.12. Rotations were recorded with a Crossbow Technology tilt sensor that has a resolution of 0.03 degrees. FEA results and the field measurements summarized in Tables 4.2 and 4.3. Reasonable agreement was achieved between the FEA model and the field measurements.
Table 4.3 shows that, as expected, the rotations in the fascia girder were larger than those in the first interior girder, as the fascia girder has overturning moment applied from the overhang. Field measurements of rotation in the fascia girder and the first interior girder were small, and rotations in the first interior girders were actually in the range of the resolution of the tilt sensors that were used for measuring the rotations in the girders. This is consistent with the FEA results. The FEA results also showed that the rotations in the first interior girder were very close to zero.
In addition to girder deformations, strain gages were used to monitor the strains in the top bracing bars at a number of locations along the length of the bridge. The resulting forces that were calculated from these stresses were less than 1 kip, which was consistent with the prediction the FEA model.
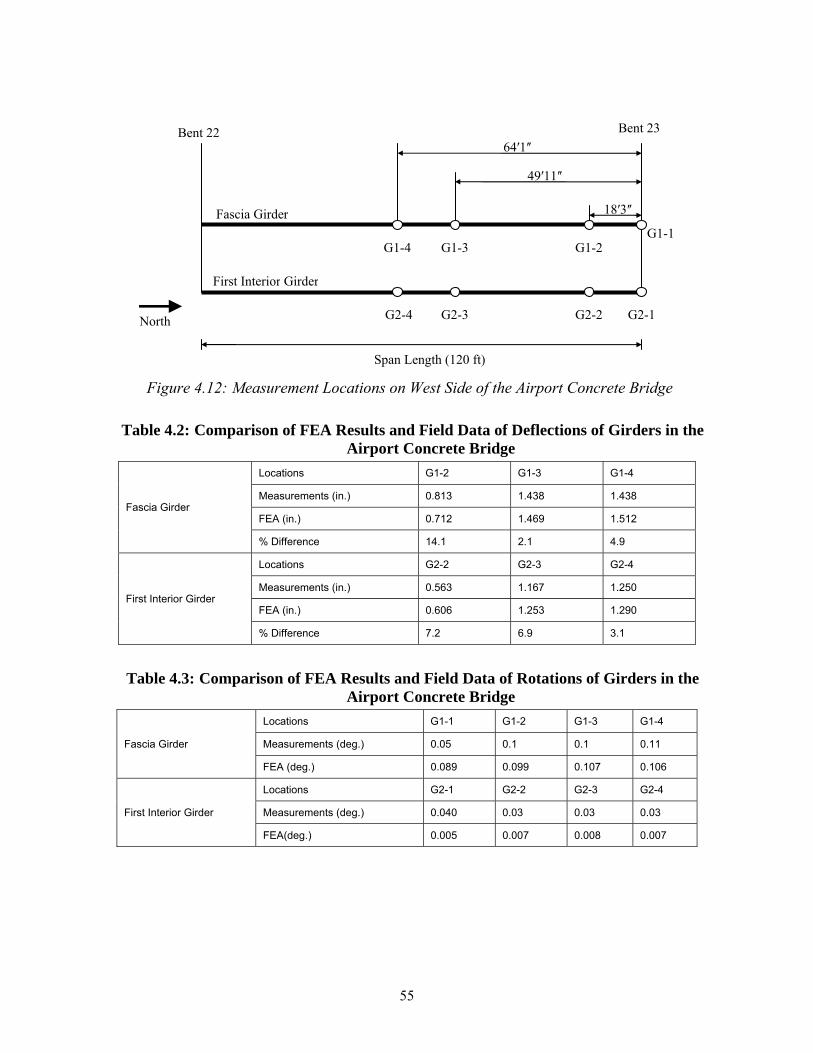
55
Figure 4.12: Measurement Locations on West Side of the Airport Concrete Bridge
Table 4.2: Comparison of FEA Results and Field Data of Deflections of Girders in the Airport Concrete Bridge
Fascia Girder
Locations G1-2 G1-3 G1-4
Measurements (in.) 0.813 1.438 1.438
FEA (in.) 0.712 1.469 1.512
% Difference 14.1 2.1 4.9
First Interior Girder
Locations G2-2 G2-3 G2-4
Measurements (in.) 0.563 1.167 1.250
FEA (in.) 0.606 1.253 1.290
% Difference 7.2 6.9 3.1
Table 4.3: Comparison of FEA Results and Field Data of Rotations of Girders in the Airport Concrete Bridge
Fascia Girder
Locations G1-1 G1-2 G1-3 G1-4
Measurements (deg.) 0.05 0.1 0.1 0.11
FEA (deg.) 0.089 0.099 0.107 0.106
First Interior Girder
Locations G2-1 G2-2 G2-3 G2-4
Measurements (deg.) 0.040 0.03 0.03 0.03
FEA(deg.) 0.005 0.007 0.008 0.007
Fascia Girder
First Interior Girder
Span Length (120 ft)
North
G1-1
64ʹ1ʺ
49ʹ11ʺ
18ʹ3ʺ
Bent 23Bent 22
G1-2 G1-3G1-4
G2-1G2-2 G2-3G2-4

56
4.5 FEA model for Hutto Concrete bridge
4.5.1 Description of FEA Model for Hutto Concrete Bridge
While the Airport Concrete Bridge addressed in the previous section had small rotations, the Hutto Bridge exemplified a bridge that had large rotations. Confidence in the FEA model would result if good agreement could be achieved between the FEA model and measured girder deformations from the bridge.
The finite element model of the bridge was developed using plans from the bridge plus additional information provided by TxDOT engineers familiar with the bridge construction.
The concrete bridge, located on the west side of the intersection of State Highways 79 and 130, has a span of 64.6 ft and a width of 60.5 ft. It consisted of 9 AASHTO Type B girders 34-in. deep with a top and bottom flange widths of 16 and 18 in., respectively. The overhang width from the center of the fascia girder to the edge of the deck was 3 ft. The bearing pads for the Type B beams were 8 by 16 in. with a thickness of 2.5 inch.
TxDOT reported that the Hutto Concrete Bridge experienced excessive rotation in the fascia girder during construction. Field investigation by the research team found that the completed bridge had a locked-in rotation of the fascia girder ranging from 2.3 to 2.8 degrees.
Figure 4.13: Hutto Concrete Bridge
In the course of FEA modeling, one difficulty associated with the Hutto concrete bridge was that the actual bracing conditions for the bridge were unknown, and knowledge of the exact construction loading information was also insufficient. However, the researchers were able to obtain additional information from TxDOT engineers. In accordance with their recommendations, the minimum required amount of bracing for deck concrete placement as specified by the TxDOT standard drawing was used in the FEA modeling and the worst load scenario was assumed for the construction loading. The total construction load included fresh concrete load, construction equipment weight of 6.417 kips per fascia girder, concrete forming system weight of 0.045 k/f per fascia girder. Although the construction equipment was not on the finished bridge, because the concrete can begin to set up and gain stiffness within a few hours, part of this load can contribute to the deformations that would be locked into the bridge. Figure 4.14 shows the FEA model of the Hutto concrete bridge with minimum required bracing. According to TxDOT personnel, the standard bracing drawing MEBR (C)-1 (the old version of the current standard bracing drawing) was probably used for the Hutto concrete bridge. The

57
minimum bracing required for Type B beams with a span length of 64.6 ft consisted of 3 top bracing bars and 3 pairs of diagonal timber blockings as shown in the Figure 4.14.
(a) Top View of FEA Model
(b) Cross-Section View of FEA Model
Figure 4.14: FEA Model of Hutto Concrete Bridge
4.5.2 Discussion of Analysis Results
The Hutto Bridge provided valuable information about potential problems in the current bracing requirement and construction protocol due to the problems that happened during construction. The comparison of the FEA solution and the field measurements provides the opportunity to validate the modeling techniques. Comparisons of the FEA solution and the field measurements are made in this sub-section and probable reasons for excessive rotation of the fascia girder are provided.
4.5.2.1 Rotation of Fascia Girder of Hutto Concrete Bridge
Figure 4.15 shows a graph of the rotation of the fascia girder at the support and also at midspan obtained from the FEA solution during the application of the full construction load. The predicted rotations of the girder from the FEA solution at the full construction load were 2.12 and 2.34 degrees at the end and mid-span of the girder, respectively. These values are in reasonable agreement with the corresponding measured values of 2.3 degrees and 2.80 degrees. Girder twist was dominated by rigid-body rotation, similar to what was observed in the field. In looking at the curve of the twist as the construction load was applied to the FEA model, the fascia girder behaves approximately linearly for up to about 30% of the construction load, and starts losing rotational stiffness with further increase in construction load. The sources of

58
stability from overturning include the girder self-weight, the construction load on the interior side of the girder, and the bracing bar connected to the R-bar. As the construction load approaches its full magnitude, the overturning moment approaches the maximum possible restoring moment in magnitude, which is very close to instability. In the case of the Hutto Bridge, the problem was further complicated because the girder lifted off the bearing, shifting the point about which the girder twists and increases the eccentricity of the overturning forces while decreasing the eccentricity of the restoring forces. This leads to a reduction in the rotational stiffness of the girder system. Because the girders were dominated by rigid-body rotation, the field measurements and the FEA solutions also verified that treating the girders as torsionally rigid is a reasonable assumption. This assumption will be used in Chapter 6 when an analytical model is developed to provide a hand solution to predict girder twist.
Figure 4.15: Lateral Rotation of Fascia Girders with Construction Load
4.5.2.2 Forces in Top Bracing Bars
Figure 4.16 shows the distribution of the forces in top bracing bars across the girder system for the full construction load level from the FEA solution. The bay number is represented along the x-axis while the force in the top bar is graphed on the y-axis. The top bracing bar used to restrain the lateral rotation of the girder was a #5 bar with an area of 0.31 in2, a specified yield strength of 60 ksi, and an axial capacity of 18.6 kips.
The axial capacity of the bar is the maximum design value that the #5 bar can provide with proper connection at ends of the bar. However, the predicted forces in the top bracing bars at the full construction load level were smaller than 1.5 kips, which is less than 10% of the axial capacity of the top bracing bar. The small force in the bar relative to the capacity is likely due to the flexible R-bar connection that dominates the stiffness of the bracing bar and R-bar system. In addition, according to the FEA results, the diagonal timber blocking had zero compression force
0
0.1
0.2
0.3
0.4
0.5
0.6
0.7
0.8
0.9
1
0 0.5 1 1.5 2 2.5 3
Cons
truc
tion
Load
(×10
0%)
Fascia Girder Rotation (degrees)
Mid-Span Rotation
Beam End Rotation

59
at the full construction load level. This indicates that the diagonal timber blockings were probably dislodged during lateral rotation of the girder, there becoming ineffective.
Figure 4.16: Force Distribution in Top Bracing across Hutto Concrete Bridge
0
0.5
1
1.5
2
1 2 3 4 5 6 7 8
Forc
e in
Top
Bra
cing
(kip
)
Bay Number
A-A & C-C
B-B (Mid-Span)
C
B B
A A
Bay #8 Bay #1
C
Plan View of Girder System

60
4.6 FEA Model for Lubbock Steel Bridge
4.6.1 Description of FEA model
The steel plate girder bridge monitored during construction supports an overpass of 19th Street over US 82 Highway in Lubbock, Texas. Figure 4.17 shows the steel bridge under construction. The steel bridge is two-span continuous with an overall span length of 289.5 ft, a first span length of 150.5 ft, and an overall width of 41 feet. The bridge consists of six steel plate girders and has a skew of about 60 degrees. The doubly symmetric steel plate girders were 54-inches deep with 18-inch wide flanges. The girders were spaced 8.2 ft. on center. The overhang width from the center of the fascia girder to the edge of the deck was 3 ft, which is within the typical range of overhang widths for steel plate girder bridges.
Figure 4.18 shows the 3-D finite element model for the Lubbock steel bridge. Element types Shell99 and Shell63 were used to model the steel plates and stiffeners in the girder, respectively. The Shell99 element permits offsetting the nodes at the top surface, mid-surface and bottom surface of the element. This feature is useful for aligning the top and bottom flanges in the girder whose thickness changes along the length of the girder. Cross-frames, struts, and end diaphragms were modeled by using Link8 truss elements.
At the overhangs, plywood forms were supported on overhang brackets. The overhang load applied to the plywood form was simulated using the equivalent overhang load system explained in the previous section. Between girders, the permanent metal deck form (PMDF) provided formwork for an 8.5-inch thick concrete deck. Although this permanent metal deck form contributes to restraining the lateral movements of the girders, it was ignored in the FEA model.
Figure 4.17: Lubbock Steel Plate Girder Bridge under Construction

61
Figure 4.18: FEA Model of Lubbock Steel Bridge
The steel bridges with concrete deck on top of girder systems were monitored during casting of the concrete bridge deck. The data recorded included girder deflections, girder rotations, strains in the girders and cross frames, and plate deformations on the fascia girder from the overhang brackets reacting on the web plates (Fasl, 2008).
The girders were supported at the ends with Fabreeka bearing pads (Figure 4.19), which are relatively rigid and allow expansion and contraction by sliding. The rigid nature of the pads can be seen in the picture by the gap that resulted from a slightly uneven surface on the concrete abutment. For simplification, the bearing pads were represented by simple supports. Specifically, the girder was fixed at one end, and allowed to displace in the axial direction at the other end. The nodes at the flange-to-web intersection at supports were constrained with a pin or a roller.

62
Figure 4.19: Fabreeka Bearing Pad in Place
Only concrete deck load during construction was applied at the top flanges of the girders, because the field measurements used in the comparisons with the FEA results were the ones that occurred during placement of the concrete deck. Girder self-weight was not included in the finite element analysis. A second-order analysis was conducted, including geometric nonlinearities using the Newton-Raphson method.
4.6.2 Validation of FEA model
Figure 4.20 shows the measurement locations for the vertical deflections in the girders in the Lubbock Bridge, and Table 4.4 summarizes the comparison of FEA results and field data of the vertical deflections in the girders. The vertical deflection in the girder is a difference in the vertical distance from the bottom of the girder to the ground before and after the deck pouring measured using a laser distance meter with a precision of ±0.0625 in. The percentage differences in deflection in Table 4.4 were less than 13% except for the location G1-4. The deflection difference at the location of G1-4 was 0.1 inch, which is small compared to the precision of the laser distance meter. Therefore, the accuracy of the laser distance meter most likely led to the relatively large error for the relatively small girder deflection. In general, the FEA results had good agreement with the field measurements.

63
Figure 4.20: Measurement Locations for Deflections in Girders
Table 4.4: Comparison of FEA Results and Field Data of Deflections of Girders in the Lubbock Steel Bridge
Location G6-1 G6-2 G6-3 G6-4 G5-4 G4-4 G3-4 G2-4 G1-4 Measurements (in.) 1.5 2.56 3.06 2.93 2.56 2.19 1.81 1.16 0.38 FEA (in.) 1.41 2.57 3.18 3.09 2.83 2.5 2.05 1.28 0.28
% Difference -6.2 0.3 3.6 5.3 9.4 12.5 11.8 9.4 -35.7
In addition to vertical deformations, girder twists were measured using Crossbow
rotational transducers with a resolution of 0.03 degrees. The measurement locations are shown in Figure 4.21. Table 4.5 summarizes the comparison of FEA results and field data of the rotations.
The rotation measurements of the girder were for the fresh concrete load only. The percentage differences between the measurements and the FEA solutions ranged from 0% to 84.3%; the very large percentage difference was at a point with extremely small rotations where the resolution of the sensor significantly affected accuracy. Many of the percentage differences were less than 20%, and in many of these readings the sensor resolution also most likely had a significant impact on the accuracy.
G5-4
G4-4
G3-4
G2-4
G1-4
G6-4 G6-3 G6-2 G6-1
18ʹ9 ʺ 21ʹ8 ʺ 18ʹ9 ʺ 18ʹ9 ʺ 17ʹ4ʺ
G6
G5
G4
G3
G2
North
G1

64
Figure 4.21: Measurement Locations for Rotation of Girders
Table 4.5: Comparison of FEA Results and Field Data of Rotations of Girders in the Lubbock Steel Bridge
Locations TS-G6-1 TS-G6-2 TS-G6-3 TS-G6-4 TS-G5-1 TS-G5-2 TS-G5-3 TS-G5-4
Measurements (deg.) 0.409 0.423 -0.156 -0.159 0.439 0.448 -0.088 -0.261
FEA (deg.) 0.506 0.423 -0.134 -0.182 0.511 0.438 -0.119 -0.185
% Difference 19.2 0 -16.3 12.6 14.2 -2.3 26.2 -40.9
Locations TS-G4-1 TS-G4-2 TS-G4-3 TS-G4-4 TS-G3-1 TS-G3-2 TS-G3-3 TS-G3-4
Measurements (deg.) 0.445 0.287 -0.074 -0.143 0.616 0.487 -0.014 -0.142
FEA (deg.) 0.519 0.411 -0.114 -0.187 0.575 0.526 -0.088 -0.16
% Difference 14.3 30.1 35.1 23.5 -7.1 7.5 84.3 11.5
The locations where the girder stresses were measured are shown in Figure 4.22, and
comparisons of the measurements and the FEA solutions during placement of the concrete bridge deck are given in Table 4.6. The stress measurements in the girder were for the fresh concrete load only. The average percentage difference was 9.5% with a maximum percentage difference of 26.2%.
In summary, good agreement was achieved between the FEA results and the field data in terms of deflection, rotation, and stress.
12ʹ
3ʹ
TS-G3-4
TS-G4-4
TS-G5-4
TS-G6-4 TS-G6-3
TS-G5-3
TS-G4-3
TS-G3-3
TS-G6-2
TS-G5-2
TS-G4-2
TS-G3-2 TS-G3-1
TS-G4-1
TS-G5-1
TS-G6-1 7ʹ 54ʹ7 ʺ 45ʹ10ʺ
G6
G5
G4
G3
G2
North
G1

65
Figure 4.22: Measurement Locations for Stresses in Girders
Table 4.6: Comparison of FEA Results and Field Data for Stresses in Girders in the Lubbock Steel Bridge
Locations G6-1-W1 G6-1-W2 G6-1-W3 G6-1-L G6-1-R G6-2-W1 G6-2-W2
Measurements (ksi) -7.1 -2.2 2.7 7.7 10.5 -4.8 -1.8
FEA (ksi) -7.3 -2.1 3 8.4 8.5 -5.1 -1.5
% Difference 2.4 -5.4 10.6 8.8 -23.5 5 -23.7
Locations G6-2-W3 G6-2-L G6-2-R G5-L G5-R G4-L G4-R
Measurements (ksi) 1.5 4.8 5.1 6.5 6.2 6.4 6.2
FEA (ksi) 2 6 5.6 7.3 6.8 7.2 6.7
% Difference 26.2 19.6 9.6 10.9 8.1 10.2 6.7
4.7 Closing Remarks Details of the elements and the key modeling techniques that were used in the finite
element models were discussed in this chapter. Finite element models were developed for both concrete and steel bridges and the FEA results were compared to field data from three bridges. The field data provided valuable data for validating the accuracy of the FEA modeling techniques. The comparisons with the field data provided confidence in the modeling techniques for concrete and steel bridge systems so that parametric investigations could be carried out.
27ʺ
40.5ʺ
13.5ʺ
W3
W2
W1
L
32ʹ
G5
G4
G6-2 G6-1
52ʹ10ʺ
G6
G5
G4
G3
G2
North
G1
Section A-A
Section A-A R

66

67
Chapter 5. Parametric Study on Concrete Girder Systems
5.1 Introduction Although the state of Texas has typically used conventional AASHTO I-beams for
prestressed concrete systems, a new suite of girders has been recently introduced, referred to as Tx I-girders. For a given depth, the Tx I-girders are generally heavier than many of the conventional prestressed girders. The TxDOT bridge manual uses the term “beam” for conventional I-beams, and the term “girder” for the Tx I-girders. To avoid confusion about the terms of a beam and a girder in this report, both terms used in this study have the same meaning of a flexural member in a concrete bridge, and the terms are used interchangeably.
Although the laboratory tests and field monitoring provided valuable data for improving the understanding of the behavior of concrete girder systems, the finite element models that were generated provided a uniquely valuable tool for studying the basic performance of a wider array of problems. Therefore, parametric finite element analyses were conducted to identify critical overhang geometries for a wide range of concrete girder systems and to investigate effects of the girder system parameters on the rotational response of the fascia girder. The girder system parameters used in the parametric study included beam type, overhang width, top bracing connection type, span length, and top bracing distribution pattern. The parametric FEA models for the concrete girder systems subjected to overhang load were based upon the FEA models that were developed based upon comparisons with the laboratory test results and the field data. The input files were developed using the ANSYS Parametric Design Language (APDL) to facilitate modifications to the problem geometry.
This chapter provides a discussion of the results of parametric FEA studies that were conducted over a wide range of girder system parameters. The next section of the chapter outlines the scope of the parametric study, followed by a section that highlights the main considerations for FEA modeling. The remaining sections provide a discussion of the results of parametric investigations, and lastly a summary of the findings is provided.
5.2 Scope of Parametric Study
5.2.1 Parameters and Their Ranges
The basic parameters that were considered and their ranges for the bridge girder systems are summarized in Table 5.1. While a total of six independent parameters required significant computational effort, all the parameters were worthy of investigation. Although TxDOT has plans to stop producing the conventional I-beams and replace them with Tx I-girders, the types of beams considered included all of the five conventional I-beams and the seven Texas I-girders. Cross-sectional dimensions and properties for conventional I-beams and Tx I-girders are provided in Table 5.2 and Figure 5.1, and in Table 5.3 and Figure 5.2, respectively. Comparison of the shape of the conventional girders with the new cross-sections shows that both the top flange and bottom flange of conventional I-beams are significantly narrower than those of Tx I-girders. While for conventional I-beams, the width of the bottom flange of the beam becomes large with depth of the beam, for Tx I-girders, the width of the bottom flange of the girder remains constant for all the girder depths. As expected, a beam of larger depth has a larger weight per unit length for both conventional I-beams and Tx I-girders. For each girder depth, the

68
weight per unit length of the conventional I-beams (with the exception of the Beam VI) is smaller than that of their Tx I-girder counterparts.
Although the span lengths in Table 5.1 range from 30 ft to 120 ft, small beams such as Beam Types A and B, and Tx28 and Tx34 are practically suitable for short spans; large beams such as Beam Type VI and Tx70 are practically suitable for long spans. Three different span lengths were applied to each of the beam/girder types. The three different span lengths included 60 ft, and lower and upper values. The lower and upper values for the span length were determined based on the girder type. For example, for Beam Type C considered as a shallow beam, the span lengths of 30 ft, 60 ft, and 90 ft were applied, while for Beam Type VI, the span lengths of 40 ft, 60 ft, and 120 ft were used. The parameter of girder spacing was considered to see the effects on the rotational response of the fascia girder, and the values for girder spacing in the table are representative of values used in practice. The overhang width was a key variable in the parametric study and ranged from 1 ft to 5 ft, which spreads across the practical range. Table 5.4 summarizes the overhang width limits. The overhang width limits for I-beams were calculated in accordance with the rules for the overhang width limits in the TxDOT Bridge Design Manual (2008).
Table 5.1: Parameters and Their Ranges
Parameter Range
Beam Type 5 conventional I-beams, 7 Texas I-Girders
Span Length 30, 40, 60, 70, 80, 90, 100, 120 ft
Girder Spacing 6.7, 7.7 and 8.7 ft
Overhang Width 1 to 5 ft by increment of 0.1 ft
Connection Type flexible connection, stiff connection
Top Bracing Distribution distributed along beam length, concentrated at support locations

69
Table 5.2: Dimensions of Conventional I-Beams
Figure 5.1: Cross Sections of Conventional I-Beams
Beam Type A B C D E F G H J K W Yt Yb Area I Weight
Unit in. in. in. in. in. in. in. in. in. in. in. in. in. in.2 in.4 plf
A 12 16 5 28 5 11 3 4 3 5 6 15.39 12.61 275.4 22,658 287
B 12 18 6 34 5 3/4 14 2 3/4 5 ½ 2 3/4 5 3/4 6 1/2 19.07 14.93 360.3 43,177 375
C 14 22 7 40 7 2/1 16 3 1/2 6 3 1/2 7 1/2 7 22.91 17.09 494.9 82,602 516
IV 20 26 8 54 9 23 6 8 6 9 8 29.25 24.75 788.4 260,403 821
VI See Figure 5.1 for beam dimensions 35.06 36.4 1,084.40 732,586 1,130
42˝
G
D (72˝)
Yb
Yt
5˝
7˝
42˝
10˝
8˝
28˝B
Yb
Yt
D
A
H
F
E
C
Type VI BeamTypes A, B, C & IV Beams
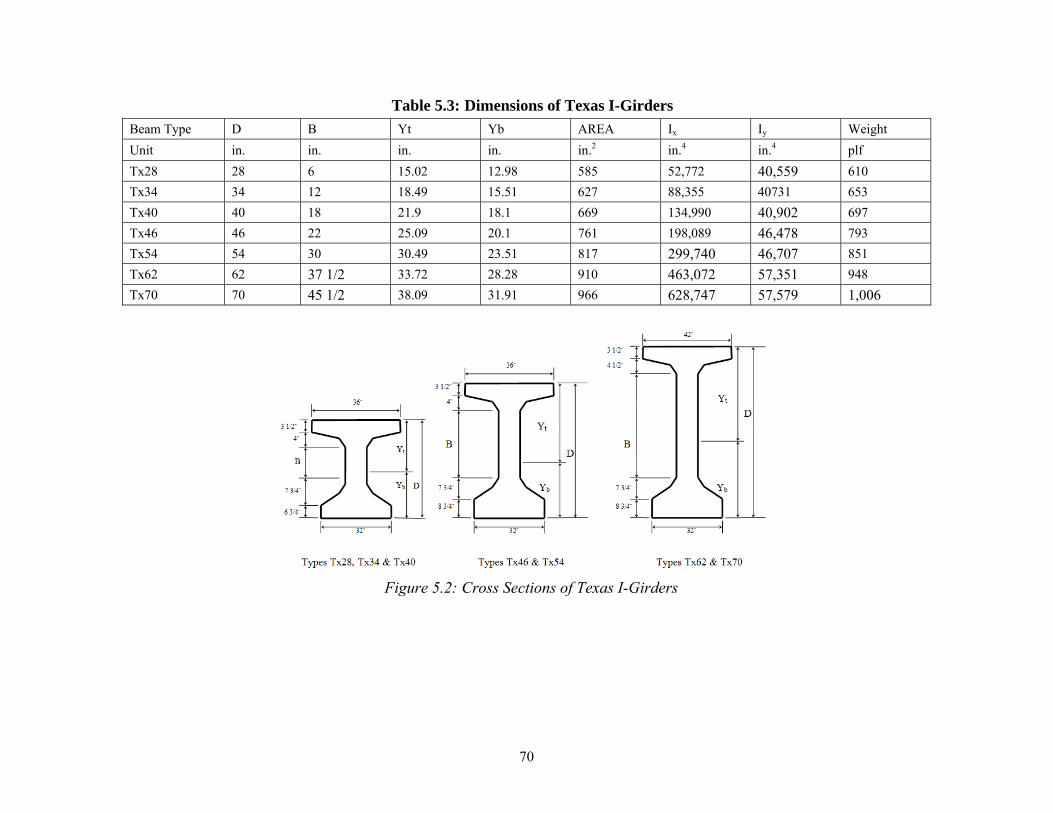
70
Table 5.3: Dimensions of Texas I-Girders
Beam Type D B Yt Yb AREA Ix Iy Weight
Unit in. in. in. in. in.2 in.4 in.4 plf
Tx28 28 6 15.02 12.98 585 52,772 40,559 610
Tx34 34 12 18.49 15.51 627 88,355 40731 653
Tx40 40 18 21.9 18.1 669 134,990 40,902 697
Tx46 46 22 25.09 20.1 761 198,089 46,478 793
Tx54 54 30 30.49 23.51 817 299,740 46,707 851
Tx62 62 37 1/2 33.72 28.28 910 463,072 57,351 948
Tx70 70 45 1/2 38.09 31.91 966 628,747 57,579 1,006
Figure 5.2: Cross Sections of Texas I-Girders

71
Table 5.4: Overhang Width Limits by TxDOT Bridge Design Manual
Beam/girder type Overhang width limits (ft)
I-beams
A 1-3.53 B 1-4.42 C 1.08-4.5 IV 1.33-4.75 VI 2.25-5.67
I-girders
Tx28 2-4 Tx34 2-4.67 Tx40 2-4.75 Tx46 2-4.75 Tx54 2-4.75 Tx62 2.25-5 Tx70 2.25-5
Overhang width limits for I-girders were as specified in the I-Girder Standard Drawings
(TxDOT, 2007). The lower limits of the overhang width for the Tx I-girders are larger than those for the
conventional I-beams. In addition, the upper limits of the overhang width for the Tx I-girders are usually larger than those for the conventional I-beams. This indicates that Tx I-girders are allowed to accommodate larger overhang width compared to conventional I-beams. The connection type for the top bracing bars included two types of connections that are referred to as the flexible connection and the stiff connection. The flexible connection is representative of the actual connection configuration typically used in practice for top bracing bar while the stiff connection is the connection configuration specified by the TxDOT Standard drawings. The flexible connection is used because the widespread use of precast concrete panels makes it difficult to implement stiff connection. As shown in Figure 5.3, the top bracing bar is attached to top of the R-bar for the flexible connection, while the top bracing bar is attached to the R-bar at a distance of 1.5 in. from the top surface of the concrete beam for the stiff connection. In the FE models for the parametric study, horizontal timber blocking was placed at the top corner of the bottom flange of the beam. The horizontal timber blocking combined with the top bracing bars provides restoring moments to the fascia beam. Although diagonal timber blocking is specified in the exterior bays of a girder system by the TxDOT standard drawings, they were conservatively ignored in the parametric study on girder systems as the validation studies showed that the blocking is ineffective at reducing girder twist and often has members with little or no force. Figure 5.4 demonstrates the thickened ends in concrete deck at bent before deck pouring.

72
Figure 5.3: Schematic for Flexible Connection and Stiff Connection
The last parameter considered in Parameters and Their Ranges was the distribution of the top bracing bars. Although the TxDOT standard drawings specify top bracing to be distributed along the length of the girder (Figure 5.5 (a)), the effectiveness of the concept of end bracing where top bracing is concentrated at either end of the girder system (Figure 5.5 (b)) was investigated. Horizontal timber blocking was distributed at a uniform spacing along the length of the girder for both distributed top bracing and end top bracing. Figure 5.4 shows the formwork at the thickened ends of the concrete deck at the bent before deck pouring. At the thickened end typically 3 to 4 ft long, wooden formwork is used in place of concrete panels to support the fresh concrete in Figure 5.4. These thickened ends provide good conditions to implement the stiff connection if such a detail results in improved behavior for some conditions. In Figure 5.4, R-bars that can be used for top bracing connection in the thickened end are about 10. This large number of R-bars results in several possibilities for improving the behavior of the girder system. Providing stiffer connections at the ends of the sections also makes practical sense based upon the previous results that showed that significant rigid body rotation occurs in the beams. Restraining twist at the ends therefore is a logical solution to the problem.
(a) Flexible Connection (b) Stiff Connection
1.5˝
5.25˝

73
Figure 5.4: Thickened Ends in Concrete Deck at Bent Before Deck Pouring
Figure 5.5: Plan View of Girder Systems with Distributed and End Bracings
(a) Distributed Bracing (b) End Bracing

74
5.2.2 Other Conditions
Although the focus of a parametrical investigation is often on the variables, an important aspect of such an investigation is the constraints of the problems. This section therefore provides an overview of some of the system parameters that were held constant, including the amount of bracing and the construction load. These parameters were fixed because minimum bracing was used and the worst construction load scenario was considered.
The TxDOT standard drawings state that in exterior bays, the maximum bracing spacing for Beam Types A, B, and Tx28, Tx34 is 15 ft and the bracing spacing for all other prestressed girder systems is 30 ft. In addition, the first interior bracing must be located at a distance of 4 ft from the end of the beam. Table 5.5 summarizes the minimum bracing spacing in accordance to the TxDOT standard drawings, and was used in the parametric study. In the table, Beam Types A, B, and Tx28, Tx34 are classified as Bracing Group A, while all others are classified as Bracing Group B. The fact that more bracing is required for Bracing Group A, which includes small beams, looks reasonable because shallow beams generally possess smaller restoring moment capacity than large beams. The adequacy of the current minimum bracing requirements is a major focal point of this parametric investigation. Although the minimum bracing specified in the TxDOT standard drawings is allowed for bridge girder systems during construction, the actual bracing amount used in practice was observed to be more than the minimum requirements in the bridges the research team was involved with on this investigation. For example, the number of top bracing bars actually used in the Airport Concrete Bridge was nine, and almost twice the required minimum number. Similar practices were observed at other concrete bridge construction sites.
Table 5.5: Minimum Bracing Spacing for Exterior Bays Bracing Group Span (ft) 30 40 50 60 70 80 90 100 110 120
A Bracing Spacing (ft) 11 8 10.5 13 10.3 12 13.7 11.5 12.8 14
B Bracing Spacing (ft) 11 16 21 26 15.5 18 20.5 23 25.5 28
The total construction load considered in the parametric study included the self-weights
of the beams, the fresh concrete deck, the overhang formwork, construction equipment, and the weight of the construction personnel. While the beams, fresh concrete, and overhang formwork have reasonably well established unit weights, the weights of the construction equipment and the construction personnel are highly variable. The author visited websites of major construction equipment manufactures and collected data sheets about weights of construction equipment. The manufacturers included Bid-Well and Dayton Superior, the respective manufacturers of the finishing screed and the overhang brackets. Additional information about weights of construction equipment was collected from design handbooks. These design handbooks included the design handbook from MeadowBurke (2007) and the steel bridge design handbook from National Steel Bridge Alliance (2006). When the effective weight of a screed is calculated, there are a couple of considerations. Because the paving carriage in a screed that levels fresh concrete keeps moving back and forth in operation, the paving carriage applies unequal loads to the rails supporting the screed. An imbalance load factor of 1.5 was multiplied to the weight of the screed to account for the imbalance load, and then half of this effective screed weight was conservatively distributed

75
to each rail. From the survey, the half of the effective screed weight calculated this way ranged from 3.9 to 5.7 kips, and the maximum value of 5.7 kips was used in the parametric study. Also, a weight of the construction personnel of 1.2 kips per girder was used as a point load at the midspan of each fascia girder.
5.3 FE Modeling Figure 5.6 depicts a typical FE model of a concrete girder system that was used in the
parametric study. A top bracing bar was connected to the R-bar, and a timber blocking was placed between the girders. The diagonal timber blocking was conservatively ignored because field measurements and early computational studies showed that the diagonal timbers had very small forces and don’t play an important role in preventing rotation of the girder about the longitudinal axis of the girder. Bearing pads were modeled as a series of compression-only linear spring elements, and the linear spring elements were spread uniformly at the bottom of the girder over the same area as actually occupied by the bearing pad. As the term “compression-only” implies, the linear spring element for the bearing pad is active in compression and inactive in tension. The horizontal timber blocking members were also modeled with the same compression-only linear spring elements as for the bearing pad.

76
Figure 5.6: Finite Element Model for Parametric Analyses
Solid elements were used to model concrete girders and linear material properties were assumed for the concrete. R-bars were modeled using a beam element based on Timoshenko beam theory, and linear elastic-perfectly plastic material model. The top bracing bar that connects to the R-bars was modeled with a truss element.

77
Several key assumptions for the FEA modeling were used in the parametric study. First, as discussed in the Chapter 3, a top bracing bar, a concrete panel, the Styrofoam panel support, and a girder can interact with each other during rotation of the girder, leading to increases in the stiffness and capacity of the top bracing. Because the beneficial effects of this interaction are not well understood, the interaction among system components was conservatively ignored throughout the parametric study. A second key assumption for the FEA modeling was about the concrete formwork in the thickened ends at each end of the bridge as shown in Figure 5.4. The concrete formwork is attached to the girder at top through steel rods and is believed to provide some restraint to the girder in a certain degree. This potential bracing force was also conservatively ignored, because the concrete formwork is a non-bracing member for the girder system and the potential bracing force from the concrete formwork is not generally reliable. Third, while self-weights such as beam self-weight and concrete panel weight are sequentially followed by construction load during actual construction, the loads are applied simultaneously in the parametric analyses. Finally, large-displacement analysis that would produce more accurate results was not used throughout the parametric analyses, because the girder rotation of interest was relatively small.
5.4 Relationship of Beam Rotation & Overhang Width This section focuses on FEA results demonstrating the effect of the stiffness of the
connection between the bracing bar and the R-bar. Two connections were considered: 1) a flexible connection where the bracing bar frames in to the top of the R-bar, and 2) a stiff connection were the bracing bar connects 1.5 inches from the bottom of the R-bar. The girder systems consisted of four girders with a span length of 60 ft and a girder spacing of 7.7 ft. Although longer span lengths were considered in the parametric studies, the results for a span length of 60 ft are presented because the shorter span is generally more critical because the girder weight is less. The minimum top bracing specified by the TxDOT standard drawings was used, along with horizontal timber blocking. The bracing bars and blocking were evenly distributed along the length. The girder rotations at midspan are graphed as a function of the overhang width in Figure 5.7 and Figure 5.8 for beams with the flexible connection. Figure 5.7 shows the behavior for the conventional Beam Types while Figure 5.8 shows the behavior for the Tx Girders. Beam Type VI had relatively small girder rotations for overhang sizes up to 5 feet. Beam Type IV had reasonable performance for overhang widths less than 3 feet. The other conventional I-beams of Beam Types A, B, and C, however, experienced a problematic beam rotation even for a typical overhang width of 3 ft. Compared to Beam Types IV and VI, these beams are considered as relatively shallow, with a narrow top flange width and small matching bearing width. These factors are directly related to the rotational response of the girder systems and are worthy of further explanation. The self-weight of the beams plays an important role in the rotational response as the self-weight provides a restoring moment. Therefore, smaller beams will generally have smaller rotational response because they have a lower self weight. Additional restoring moments come from the deck weight on the interior side of the fascia girder where the deck panel reacts on the inside of the top flange. Therefore, a wider top flange will usually result in a larger moment arm for the restoring force from the interior deck. The width of the bottom flange also is important to the rotational restraint because the flange width is related to the size of the elastomeric bearing. The smaller girders have narrower flange widths and smaller weights. As a result, these girders often have significantly lower rotational resistance compared to larger girder sizes. Figure 5.8 shows rotational response of Tx I-girders with flexible connection. All

78
the Tx I-girders showed good rotational response for a typical overhang width of 3 ft. For Tx I-girders, smaller girders experienced more girder rotation, and this is consistent with results of the conventional I-beams.
Figure 5.7: Rotational Response of Conventional I-Beams with Flexible Connection
Figure 5.8: Rotational Response of Texas I-Girders with Flexible Connection
0
0.1
0.2
0.3
0.4
0.5
0 0.5 1 1.5 2 2.5 3 3.5 4 4.5 5
Mid
-Spa
n Ro
tatio
n (d
eg.)
Overhang Width (ft)
Beam ABeam BBeam CBeam IVBeam VI
Parameter Conditionsflexible connectiondistributed bracingspan (60 ft)beam spacing (7.7 ft)# of beams (4)
0
0.1
0.2
0.3
0.4
0.5
0 0.5 1 1.5 2 2.5 3 3.5 4 4.5 5
Mid
-Spa
n Ro
tatio
n (d
eg.)
Overhang Width (ft)
Tx28 Tx34Tx40 TX46Tx54 Tx62TX70
Parameter Conditionsflexible connectiondistributed bracingspan (60 ft)beam spacing (7.7 ft)# of girders (4)

79
The behavior of the girders with the flexible connection was often controlled by the connection stiffness. For girder systems with stiff connection, the connection strength becomes more important as rupture of the R-bar can occur with rotation of the fascia girder. Based on the test results from Chapter 3, the stiff connection failed at smaller rotations in the fascia girder. The failure in the R-bars from these tests occurred at a value of 4.82 kips. Figure 5.9 and Figure 5.10 demonstrate the rotational response of both conventional I-beams and Tx I-girders for stiff connection, respectively. The curves for the different girder systems were limited by a maximum bracing bar force of 3 kips, which corresponded to the design value for the maximum bar force of 4.82 kips observed from the laboratory test results. All the beam rotations for maximum overhang widths are less than 0.5 degree. As shown in Figure 5.9, only the Beam Types IV and VI were able to have overhang widths larger than 3.0 feet. Beam Types A, B and C all would experience strength problems with the R-bar connection for overhang widths less than 3 ft, which is a typical size. In comparison, in Figure 5.10, all the Tx I-girders showed good performance for a typical overhang width of 3 ft.
Comparisons of results for flexible and stiff connection were made for a beam system of Beam Type VI in Figure 5.11 and a girder system of Tx70 in Figure 5.12, respectively. Results for the other beam/girder types are compared in Appendix C. The results from Figure 5.11 and Figure 5.12 are representative of the other beam and girder types. These two sections were selected for comparison because they represent the largest of the respective conventional I-beams and the Tx I-girders. For the same amount of top bracing, flexible connection allows the girder system larger overhang width than stiff connection. This is because flexible connection with high ductility allows the beam larger ultimate rotation than stiff connection, and restoring moment from the bearing pad increases with rotation of the beam. Although the stiff connections were limited by the connection force in the top bracing, the beams with stiff connection did behave much better from the perspective of overall girder rotation compared to the beams with the flexible connections.
Figure 5.9: Rotational Response of Conventional I-Beams with Stiff Connection
0
0.1
0.2
0.3
0.4
0.5
0 0.5 1 1.5 2 2.5 3 3.5 4 4.5 5
Mid
-Spa
n Ro
tatio
n (d
eg.)
Overhang Width (feet)
Beam A
Beam B
Beam C
Beam IV
Beam VI
Parameter Conditionsstiff connectiondistributed bracingspan (60 ft)beam spacing (7.7 ft)# of beams (4)

80
Figure 5.10: Rotational Response of Texas I-Girders with Stiff Connection
Figure 5.11: Comparison for Flexible and Stiff Connections for Beam VI
0
0.1
0.2
0.3
0.4
0.5
0 0.5 1 1.5 2 2.5 3 3.5 4 4.5 5
Mid
-Spa
n Ro
tatio
n (d
eg.)
Overhang Width (ft)
Tx 28
Tx34
Tx40
TX 46
Tx54
Tx62
TX 70
Parameter Conditionsstiff connectiondistributed bracingspan (60 ft)beam spacing (7.7 ft)# of girders (4)
0
0.1
0.2
0.3
0.4
0.5
0 0.5 1 1.5 2 2.5 3 3.5 4 4.5 5
Mid
-Spa
n Ro
tatio
n (d
eg.)
Overhang Width (ft)
Beam VI (Stiff)
Beam VI (Flexible)
Parameter Conditionsdistributed bracingspan (60 ft)beam spacing (7.7 ft)# of beams (4)

81
Figure 5.12: Comparison for Flexible and Stiff Connections for Tx 70
5.5 Effects of Top Bracing Distribution Another parameter studied was the distribution of the bracing. Two bracing distributions
were considered: bracing distributed along the length and end bracing only. For the case of the distributed bracing, the top bracing bars were uniformly distributed along the girder length, while for the end bracing, the top bracing bars were concentrated at each end of the girder. Similar to the results presented in the last section, the girder systems consisted of four girders with a span length of 60 ft and a girder spacing of 7.7 ft. The beam sections were divided into Group A and Group B based upon the number of required braces per span. Group A includes the conventional I-beam types A and B, and the Texas I-girder types Tx28 and Tx34, while Group B includes the other conventional I-beam types and the Texas I-girder types. Group A and Group B have five and three braces, respectively, for a span length of 60 ft. In Figure 5.13 and Figure 5.14, the stiff connection was used for all of the bracing systems and the curves for rotation versus overhang width were limited by the design capacity of the stiff connection based on the specified yield strength of the reinforcing bar.
As shown in Figure 5.13 and Figure 5.14, while the girder systems with the concentrated top bracing experienced larger rotation of the fascia beam than the counterparts with distributed bracing, the difference in rotation of the fascia beam was generally small. In addition, the girder systems with concentrated top bracing generally had larger critical overhang widths than their counterparts with distributed bracing. This indicates that end bracing is a viable alternative to distributed bracing currently required by the TxDOT standard drawings. This alternative is attractive because the stiff connection can be used near the ends of the beams, where the deck panels cannot be used.
0
0.1
0.2
0.3
0.4
0.5
0 0.5 1 1.5 2 2.5 3 3.5 4 4.5 5
Mid
-Spa
n Ro
tatio
n (d
eg.)
Overhang Width (ft)
TX70 (Stiff)
Tx70 (Fexible)
Parameter Conditions distributed bracingspan (60 ft)beam spacing (7.7 ft)# of beams (4)

82
Figure 5.13: Effects of Bracing Distribution for Conventional I-Beams
Figure 5.14: Effects of Bracing Distribution for Texas I-Girders
0
0.1
0.2
0.3
0.4
0.5
0 0.5 1 1.5 2 2.5 3 3.5 4 4.5 5
Mid
-Spa
n Ro
tatio
n (d
eg.)
Overhang Width (ft)
Beam A (Distributed)Beam A (Concentrated)Beam VI (Distributed)Beam VI (Concentrated)
Parameter Conditionsstiff connectionspan (60 ft)beam spacing (7.7 ft)# of beams (4)
distributed bracing
distributed bracing
endbracing
endbracing
Beam A Beam VI
0
0.1
0.2
0.3
0.4
0.5
0 0.5 1 1.5 2 2.5 3 3.5 4 4.5 5
Mid
-Spa
n Ro
tatio
n (d
eg.)
Overhang Width (ft)
Tx28 (Distributed)Tx28 (Concentrated)Tx70 (Distributed)Tx70 (Concentrated)
Parameter Conditionsstiff connectionspan (60 ft)beam spacing (7.7 ft)# of beams (4)
distributed bracing
distributed bracing
endbracing
endbracing
Tx28
Tx70

83
5.6 Effects of Beam Spacing As mentioned in the previous section, the weight of the concrete deck on the interior
sides of the fascia beams provide a restoring moment against the overturning effects of the overhang. Specifically, the interior deck weight reacts on the edge of the top flange of the beam and has an eccentricity with respect to the centroid of the beam. The interior deck weight with an eccentricity provides restoring moment to the fascia girder. For a given deck thickness, the line weight density of the interior deck is a function of a girder spacing only, and is linearly proportional to a girder spacing. Therefore, larger girder spacing provides more restoring moment to the fascia girder.
Effects of the beam spacing of the girder systems were investigated on rotational response of the girder system, and FEA results from the study are presented in this section. Figure 5.15 and Figure 5.16 show the rotational response of girder systems of Beam VI and Tx70, respectively, and both figures represent the typical rotational response of girder systems of the other beams/girders. All the girder systems studied consisted of 4 girders (beams) with a span length of 60 ft and with a minimum top bracing that employed the flexible connection. The required minimum number of top braces for girder systems of Beam VI and Tx70 with a span length of 60 ft was three, and this top bracing along with horizontal timber blocking was uniformly distributed along the girder length. The rotational response curves in each graph compare the results for beam spacings of 6.7 ft and 8.7 ft.
The rotational response of girder systems of Beam VI and Tx70 in Figure 5.15 and Figure 5.16 demonstrate that the larger girder spacing can improve the rotational behavior of the girder systems. From Figure 5.15, for a given overhang width, the girder system with a beam spacing of 6.7 ft experienced larger beam rotation than the counterpart with a beam spacing of 8.7 ft. This trend was true for the entire range of overhang width considered. Similar behavior was observed for the girder systems of Tx70 in Figure 5.16.
Figure 5.15: Effects of Girder Spacing for Conventional I-Beams
0
0.1
0.2
0.3
0.4
0.5
0 0.5 1 1.5 2 2.5 3 3.5 4 4.5 5
Mid
-Spa
n Ro
tatio
n (d
eg.)
Overhang Width (ft)
Parameter Conditionsflexible connectiondistributed bracing span (60 ft)# of beams (4)
distributed bracing
Beam VI, Beam Spacing (6.7 ft)
Beam VI, Beam Spacing (8.7 ft)

84
Figure 5.16: Effects of Girder Spacing for Texas I-Girders
5.7 Effects of Beam Type Given TxDOT’s new line of prestressed girder shapes, an important parameter was the
new shapes versus the conventional ones. Although all of the different conventional beams and the new Tx girder shapes were considered, the behavior of only two conventional shapes and two new shapes will be discussed. The trends were generally the same for the other shapes. The girder systems considered had a span of 60 ft and a girder spacing of 7.7 ft. The minimum bracing along with horizontal timber blocking as specified by the TxDOT standard drawings was used with the flexible connection. The bracing was distributed along the length of the girders. Group 1 in the comparison consists of the smaller beams while Group 2 consists of the larger beams. Breaking the beams up into two groups is also logical because Group 1 includes Beam Types A and B, and Tx28 and Tx34, which have different minimum bracing requirements compared to the Group 2 beams. The required minimum bracing amount for the Group 1 beams is larger than that for the Group 2 beams. Therefore, in order for comparison to make sense, comparisons were conducted for the beams/girders that belong to the same bracing group category. Figure 5.17 and Figure 5.18 compare results for the beams/girders with Group 1 and Group 2, respectively.
Figure 5.17 shows that larger beams and girders have better structural performance. This is because larger beams/girders have a wider top flange, a wider bearing pad, and a larger beam self-weight, and these factors are directly related to the restoring moment capacity of the fascia girder of the girder system as explained before. Tx I-girders generally have a wider top flange, a wider bearing pad, and a larger beam self-weight than their conventional I-beam counterparts. Therefore, from a rotational stability perspective, Tx I-girders generally behave better than their conventional I-beam counterparts, as is verified in Figure 5.17 and Figure 5.18. The general exception to this is the Beam VI curve, which does show larger permissible overhang widths than the Tx 70 girder.
0
0.1
0.2
0.3
0.4
0.5
0 0.5 1 1.5 2 2.5 3 3.5 4 4.5 5
Mid
-Spa
n Ro
tatio
n (d
eg.)
Overhang Width (ft)
Parameter Conditionsflexible connectiondistributed bracing span (60 ft)# of girders (4)
distributed bracing
Tx70, Beam Spacing (6.7 ft)
Tx70, Beam Spacing (8.7 ft)

85
Figure 5.17: Effects of Beam Type of Small Beams
Figure 5.18: Effects of Beam Type of Large Beams
However, Beam VI has the widest top flange, the largest beam self-weight, and the widest matching bearing pad.
0
0.1
0.2
0.3
0.4
0.5
0 0.5 1 1.5 2 2.5 3 3.5 4 4.5 5
Mid
-Spa
n Ro
tatio
n (d
eg.)
Overhang Width (ft)
Beam ABeam BTx28Tx34
Parameter Conditionsflexible connectiondistributed bracingspan (60 ft)beam spacing (7.7 ft)# of beams (4)
distributed bracing
0
0.1
0.2
0.3
0.4
0.5
0 0.5 1 1.5 2 2.5 3 3.5 4 4.5 5
Mid
-Spa
n Ro
tatio
n (d
eg.)
Overhang Width (ft)
Beam CBeam IVTx40Beam VITx54TX70
Parameter Conditionsflexible connectiondistributed bracingspan (60 ft)beam spacing (7.7 ft)# of beams (4)
distributed bracing

86
5.8 Closing Remarks The results from the parametric FEA studies were presented in this chapter along with a
discussion of the general comparisons. Several important findings were obtained and are summarized here as follows.
While conventional beams of Beam Types IV and VI showed good rotational response for a typical overhang width of 3 ft, the other conventional beams of Beam Types A, B, and C experienced problematic beam rotations. In comparison, all of the Tx I-girders showed good rotational response for a typical overhang width of 3 ft.
Investigations were made with conventional bracing layouts where the top bracing bars are distributed along the length as well as the alternative bracing layouts where the bracing bars are concentrated at the ends of the beam. The advantage of focusing the bracing at the ends of the section is that stiffer connections are possible as the bracing bars can connect lower on the R-bars. Although the girder systems with concentrated top bracing experienced larger rotation of the fascia beam than the counterparts with distributed bracing, the difference in rotation of the fascia beam was generally small. Therefore, the method of end bracing can provide a good alternate for the distributed bracing that is currently required by TxDOT standard drawing.
For a given deck thickness, the line weight density of the interior deck is a function of a girder spacing only, and is linearly proportional to a girder spacing. Therefore, larger girder spacing provides more restoring moment to the fascia girder of the girder system. Lastly, larger beams/girders have better structural performance due to the wider top flange, the wider bearing pad and the larger beam self-weight.

87
Chapter 6. Rigid Body Model for Concrete Girder Systems and Design Methodology
6.1 Introduction Field data and the parametric FE analyses show that the girders in a concrete girder
system can be reasonably approximated as torsionally rigid for construction load levels. The assumption of torsional rigidity greatly simplifies the evaluation of behavior of the girder subjected to construction overhang loads. In this chapter, a rigid-body model is developed and a simple design equation for overhang construction is derived based on the rigid-body model. Key assumptions include modeling the girder as torsionally rigid and modeling the bearing pad as a compression-only elastic foundation.
The purpose of the rigid-body model is to develop a simple design equation for overhang construction, and to provide a bracing design methodology. Following the identification of overturning and restoring forces on girder systems, a rigid-body model for a stand-alone beam on elastomeric bearing pads is developed and verified using the laboratory data from the beam overturning test. The next section discusses a rigid-body model for a beam with lateral bracing followed by the validation of the rigid-body model with lateral bracing using results from the FE model. The remaining sections discuss an overhang design equation and a recommended design procedure. Last, a summary of the chapter is presented.
6.2 Identification of Overturning and Restoring Forces on Girder Systems Figure 6.1 shows overturning forces and restoring forces for a fascia beam during
construction. The forces quantities indicated on the figure are defined in Table 6.1. All forces shown acting on the left side of the fascia beam tend to overturn the beam while the beam self-weight, the slab haunch, and an interior deck provide a restoring moment to the beam. The overturning forces include weights of the concrete on the overhang, the finishing equipment, and construction personnel.

88
Figure 6.1: Overturning and Restoring Forces and their Eccentricities
In addition to defining the basic force quantities acting on the fascia girder, Figure 6.1 also summarizes all of the definitions of general system. The overturning forces can be replaced by their resultant force and effective eccentricity.
= + + + (6.1)
The effective eccentricity of the resultant force can be determined in the following way.
= + + ++ + + (6.2)
The resultant force of all of overturning forces and the effective eccentricity depend on
the overhang width as shown in Table 6.1. As expected, a larger overhang width leads to the larger overhang resultant force and a larger eccentricity.
Wbm
Wsh
Wid Lid Loh
Lfw
Lsd
Lwk
Woh
Foh
Ffw
Fsd
Fwk
CG (Center of Gravity of Beam)

89
Table 6.1: Definition of System Parameters
Type Parameter Definition Unit
General
unit weight of concrete / .
unit weight of overhang formwork / .
slab thickness (8 in. typical) . Beam spacing . number of beams of bridge unitless net width of bridge (=( − 1) ) .
span of beam . width of overhang .
Restoring-Force Related
Eccentricity of half of interior deck weight (= half of top flange of beam)
. Weight of beam weight of slab haunch (= 2 ( + 2) )
half of interior deck weight between fascia beam and first interior (= ( − 2 )/2)
Overturning-Force Related
Eccentricity of net overhang weight (= + ( − )/2)
.
Eccentricity of half of finishing equipment weight (= )
.
Eccentricity of weight of workers (= + 1 × 12)
. Eccentricity of weight of overhang formwork
(= + (2 × 12 + − )/2) .
Half of work bridge weight (=23.5 /1000 /12 * /2)
weight of net overhang (= ( − ) ) half of finishing equipment weight (= 5.7 + ) Weight of workers (= 1.25)
weight of overhang formwork (= (2 × 12 + − ) )
6.3 First-Order Analysis of Stand-alone Beam on Elastomeric Bearing Pads The presence of the elastomeric bearing adds complexity on many levels to the problem
of evaluating the torsional behavior of the fascia girder. Although the bearing compresses under gravity load, moment applied as a result of the overhang causes the axial compression of the bearing to vary over the width of the beam. Large eccentricity of applied load can actually cause the beam to lift off the bearing, creating a gap between the bearing and beam similar to that shown in Figure 6.2 from the Hutto Concrete Bridge. The variation in compressibility of the bearing complicates the problem as the bearing reactions affect the overturning calculations.

90
Figure 6.2: Lift-off of Fascia Beam at Hutto Concrete Bridge
Figure 6.3 depicts a simplified free body of a fascia beam with an overhang. The effects of the bracing bar and blocking are not included now, but are considered later. Developing a solution based upon only the girder and bearing pad is valuable because the solution can be compared with the test results from the laboratory tipping tests before the effects of the bracing bars and R-bars are incorporated into the model.
The elastomeric bearing is represented by the series of springs at the base of the beam over the bearing width, . The overhang forces have been summarized in a single resultant, F, acting at an effective eccentricity e. In this simplified free body, the beam weight is the only restoring force shown. The effects of the additional stabilizing forces are considered later in the chapter.
The rigid-body movement of the beam from gravity load and overturning effects is depicted in Figure 6.4(a). The free body of the beam system is sketched in Figure 6.4(b) assuming that the beam is in full contact with the bearing. A first-order analysis is considered in this section so that the forces are shown on the undeformed structure. Second-order effects are considered in the next section.

91
Figure 6.3: Rigid-body Model for Stand-alone Beam on Elastomeric Bearing Pads
h
dc
eF
BA O
Wbm
CG

92
Figure 6.4: Free-body diagram of Stand-alone Beam during Full Contact
The eccentrically applied load, and the beam self-weight, must be in equilibrium with the resistance from the elastomeric bearing pad in the vertical direction. For the bearing pad, is defined as the compressive stiffness of the bearing per width of the bearing, resulting
in a unit of .⁄. , and ∆ represents the downward movement of the Point O of the beam. The
vertical equilibrium results in the following expression:
+ = ∆ (6.3)
Moment equilibrium of all of the forces can be taken about the Point O. The eccentricity of the beam self-weight is zero because the first-order analysis is considered in this section and the beam self-weight passes through the Point O.
× = 6 2 (6.4)
Simplifying Equation (6.4) produces the following expression:
= 12 (6.5)
B
B θ
Δv
O
O A
A BO A
(a) Rigid Body Movement (b) Free Body Diagram
θ
Wbm
F e

93
This equation describes the relationship between the eccentrically applied load and the
rotation of the beam when the bearing is in full contact (beam does not lift off the bearing). As overturning effects increase, the beam may reach a particular state where it separates
from the elastomeric bearing pad. The eccentric load and the rotation of the beam at the initiation of separation of the beam from the elastomeric bearing pad are defined as the “lift-off load” and the “lift-off rotation,” respectively. Lift-off will occur first at Point B in the figure. At the instant of lift-off, the displacement of the Point B is zero. The bearing deformation at Point B will consist of the axial deformation of the bearing due to the full gravity load minus the relaxation due to the overturning effect of the beam rotating through the angle θ. Therefore, setting the condition of zero displacement at Point B yields the following expression:
( + ) − 6 = 0 (6.6)
where FL is the eccentric load at the moment of the initiation of the lift-off of the beam. Solving Equation (6.6) for FL, the lift-off load becomes
= (6 − ) (6.7)
Substituting Equation (6.7) into Equation (6.5), the lift-off rotation becomes
= 2 11 − 6 (6.8)
After the beam lifts off the bearing pad, the beam experiences separation from the
bearing pad and loses some of the resistance from the bearing pad. Figure 6.5(a) depicts the rigid-body movement of the beam after lift-off. Only the portion of the bearing in contact with the beam exerts force on the bottom of the beam, as shown in Figure 6.5(b).

94
Figure 6.5: Free-body diagram of Stand-alone Beam during Partial Loss of Contact
As during the full contact of the beam, the eccentrically applied load, and the beam self-weight, must be in equilibrium with the resistance from the elastomeric bearing pads in the vertical direction:
+ = 2 2 + ∆
(6.9)
The moment equilibrium of all the forces can be taken about the Point O.
× = ( + ) 3 − ∆3 (6.10)
Substituting Equation (6.10) into Equation (6.9) and solving for θ produces the following expression:
= 89 1 ( + )( (2 − ) − ) (6.11)
B O
A
B θ
Δv O
A
A BO
(a) Rigid Body Movement (b) Free Body Diagram
θ
F
( + ℎ )

95
Combining Equations (6.5) and (6.11), the rotation of the beam can be expressed as a function of the eccentric load applied to the beam.
= 12 , ≤ 89 1 ( + )( (2 − ) − ) , ≥ (6.12)
The derivations in this section were based upon a first-order analysis. The effect of a
change in geometry of load on the problem is considered in the next section.
6.4 Second-Order Analysis of Stand-alone Beam on Elastomeric Bearing Pads The key difference between the second-order analysis and the first-order analysis of the
rigid-body model is that the second-order analysis considers equilibrium in the deformed configuration. The second-order analysis requires taking equilibrium of all of forces in the deformed position of the body and accounts for effects of change in geometry of all of forces involved in equilibrium. With rotation of the beam, the eccentricity of the applied load increases and the beam self-weight creates eccentricity with respect to the center of gravity of the beam from the undeformed position. The increase in eccentricity of the forces reduces the overturning capacity of the beam and also decreases the rotational stiffness of the beam system. The problem solution begins with the assumption that the bearing is in full contact with the beam. Figure 6.5(a) depicts the beam in the deformed position. Because the second order effects are considered in this section, the free body of the beam in this case includes the effects of the changes in geometry as shown in Figure 6.5(b).

96
Figure 6.6: Free-body diagram of Stand-alone Beam during Full Contact
The eccentrically applied load, and the beam self-weight, must be in equilibrium with the resistance from the elastomeric bearing pads in the vertical direction. For the bearing pad, is defined as the compressive stiffness of the bearing per width of the bearing, resulting
in a unit of .⁄. , and ∆ represents the downward movement of the Point, O, of the beam.
Vertical equilibrium yields the same result from the first order analysis. + = ∆ (6.13)
Moment equilibrium of all of the forces can be taken about the Point O, which produces the following expression:
( + ℎ ) + = 6 2 (6.14)
Simplifying Equation (6.14) produces the following expression for the rigid-body rotation:
B
O A
B θ
Δv O A
A BO
(b) Rigid Body Movement (b) Free Body Diagram
θ
F
( + ℎ )

97
= 12 − ℎ − (6.15)
This equation describes the relationship between the eccentrically applied load and the
rotation of the beam while the beam is still in full contact with the bearing. As with the first-order analysis, the lift-off load and lift-off rotation can be obtained by
using the kinematic condition that when the beam separates from the bearing at Point B, the displacement of the bearing at B becomes zero.
+ − 12 − ℎ − 2 = 0
(6.16)
where is the eccentric load at the moment of the lift-off of the beam. Solving Equation (6.16) for , the lift-off load becomes
= 12ℎ − (ℎ + ) + 2 − 12+ (ℎ + ) + 2 − 12 + 4ℎ 12 −
(6.17)
Equation (6.17) can be substituted into Equation (6.15), and solving for the lift-off rotation produces the following expression:
= 12 − ℎ −
(6.18)
After the beam lifts off the bearing pads, it separates from the bearing pads and loses
some of the resistance from the bearing pads. The resulting deformations and free-body diagram are shown in Figure 6.7. As when the bearing is in full contact with the beam, the eccentrically applied load and the beam self-weight must be in vertical equilibrium with the resistance from the elastomeric bearing pads in the vertical direction, which produces the following expression:
+ = 2 2 + ∆
(6.19)
Rotational moment equilibrium of forces about the Point O produces the following condition:

98
( + ℎ ) + = ( + ) 3 − ∆3 (6.20)
Substituting Equation (6.20) into Equation (6.19), and solving for the relationship between F and θ, results in the following expression:
( + ) = 8 (6 + 6ℎ − 3 ) + 6 − 3 (6.21)
Combining Equations (6.15) and (6.21), the rotation of the beam can be expressed as a function of the eccentric load applied to the beam: = 12 − ℎ − , ≤
( + ) = 8 (6 + 6ℎ − 3 ) + 6 − 3 , ≥ (6.22)
Figure 6.7: Free-Body Diagram of Rigid Body during Partial Loss of Contact
B
O A
B θ
Δv O A
A BO
(a) Rigid Body Movement (b) Free Body Diagram
F
( + ℎ )
∆/ ( − ∆/ )
θ

99
6.5 Comparison of Closed-Form Solutions for Stand-alone Beam with Overturning Test Results
The support conditions for the overturning test of Chapter 3 match the stand-alone beams in the previous section for which expressions were developed for the tipping load and resulting twist. The span length and the eccentricity of the applied load were 55.5 ft and 36.25 in., respectively. The applied eccentric load versus the rigid-body rotation from the test results is graphed in Figure 6.8, along with the results from the first-order and second-order analytic solutions developed in the last two sections. The results of second-order analysis of the rigid-body model show good agreement with those of the overturning test over the entire range of rigid-body rotations. In addition, the second-order analytic solution of the rigid-body model captures the descending branch of the curve of the overturning test results well. This indicates that the second-order analysis of the rigid-body model clearly shows geometric effects of the loads on rotation of the beam. While the solution of first-order analysis of the rigid-body model does not capture the descending branch of the curve of the overturning test results, the results of first-order analysis of the rigid-body model show good agreement with those of the overturning test for small rotation that is in the typical design range. In design the main area of interest is when the beam becomes unstable and starts to tip. Therefore, the first order solution provides reasonable estimates of when the beam becomes unstable and is simpler than the second order solution. Therefore, Equation (6.12) from the first-order analysis of the rigid-body model is used in the next section to develop a rigid-body model with lateral bracing.
Figure 6.8: Test Results versus Rigid-Body Solutions
0
1
2
3
4
5
6
7
8
9
0 1 2 3 4
Ecce
ntric
Load
(kip
s)
Rigid Body Rotation (degrees)
1st-Order Analysis of Rigid Body Mdel
2nd-Order Analysis of Rigid Body Mdel
Testing

100
6.6 Development of Rigid-body Model for Concrete Girder Systems Figure 6.9 shows a depiction of the rigid body of a rectangular shape that represents the
concrete beam with the support conditions and bracing represented by the appropriate springs. The beam sits on compression-only elastomeric bearing pad while braced at top and at a distance
from the bottom of the rigid body. The shape of the beam is represented by a rectangle for simplicity. The force with an eccentricity of acts to overturn the beam while the beam self-weight, , the weight of the slab haunch on top of the beam, and the half weight of the interior concrete deck, provide the restoring moment to the beam.
Figure 6.9: Rigid Body with Bracing on Compression-Only Elastic Foundation
The vertical stiffness of the elastomeric bearing per unit width is represented by the springs of stiffness , while the lateral bearing stiffness is represented by the spring with stiffness . The lateral stiffness of the combined bracing bar and the R-bar is represented by the spring with stiffness , while the stiffness of the wood blocking is represented by the spring with stiffness . Vertically, the elastomeric bearing pad acts as a series of independent compression-only springs. The wood blocking at a height of from the bottom of the rigid body is also treated as a compression-only spring. The top bracing, consisting of a R-bar and a top bracing bar attached on top of that R-bar is idealized as a spring, which behaves linear-perfectly plastic or behaves linearly up to the rupture of the R-bar depending on the connection type. The flexible connection generally fails by yielding while the stiff connection generally fails by rupture of the R-bar. The flexible connection is chosen for the initial derivation for the rigid-
B
kb
kbl
Lide WidF
dD
kwd
kst
dbr h CG
Wbm
A O
dc
D
E
Wsh

101
body model; at the end of the section, however, the governing equation for a girder system with stiff connection is presented.
With rotation of the rigid body, several events can occur: yielding of the top bracing; lift-off of the rigid body at the edge of the bearing pad; or a rotational limit of the girder. In terms of girder rotation, there are multiple limit states that may control the behavior. A serviceability limit rotation of 0.5 degrees was selected. Although this limit was somewhat arbitrary, it is also less than the tipping rotation witnessed in the lab and also the 2~3 degree rigid-body rotation measured in the Hutto Bridge. Another limit that was imposed on the rotation is lift-off of the rigid body up to the first interior quarter point on the bearing pad.
Under load, the rigid body undergoes the downward and lateral movements, and rotation as shown in Figure 6.10. The center of rotation can be located anywhere, but is chosen as the bottom center of the rigid body, the Point for convenience. As shown in Table 6.2, the primary kinematic variables are ∆ , ∆ , and , whose signs are positive to the right, downward and counterclockwise, respectively. The displacements of the points of interest on the rigid body can be expressed in terms of ∆ , ∆ , and as indicated in Table 6.2.
Figure 6.10: Translations and Rotation of Rigid Body
ΔΔh
Δh
Δv
O
θ
CG
O˝
D˝
O
E
D
B
A
D˝
E˝
O˝ A˝
CG
A BO
D
E
CG
B˝
CG˝
A˝ B˝
E˝
(a) translation (b) rotation

102
Table 6.2: Displacements of Points of Interest
point displacement
O (∆ , ∆ )
D (∆ − d θ, ∆ − L θ)
E (∆ − hθ, ∆ )
B ∆ − d θ, ∆ − w2 θ
With the first-order analysis, it is useful to sum the beam self-weight and the weight of
the slab haunch because both weights pass through the Point and do not have eccentricity with respect to the Point O.
= + (6.23)
In Figure 6.11, the applied load F and the beam self-weight, the slab haunch weight and half of the interior deck weight must be in vertical equilibrium with the resistance from the elastomeric bearing pads.
+ + = ∆ (6.24)

103
Figure 6.11: Free-body diagram of Rigid Body with Bracing before Lift-off
The force in the top bracing, , the force in timber blocking, , and the shear force in the elastomeric bearing pad, , satisfy equilibrium in the horizontal direction:
− − + = 0 (6.25)
The lateral forces at Points D, E, and O can be obtained by substituting the displacement at each point into the constitutive relationship of each member:
= (∆ − ), positive in compression (6.26)
= (−∆ + h ), positive in tension (6.27)
= (∆ ) = 0 (6.28)
The lateral stiffness of the elastomeric bearing pad, , is assumed to be equal to zero, as it is very small compared to the stiffness of the wood blocking, , and the stiffness of the top bracing, . Therefore, the lateral force in the bearing is taken equal to zero ( = 0). Substituting Equations (6.26), (6.27), and (6.28) into (6.25), and solving for ∆ , the horizontal displacement, ∆ becomes
Wsh
e
dbr
Wi
FO
E
θ
FE
LD
dD
hCG
Wb
A BO
dcD
FD
LidF

104
∆ = h ++ (6.29)
Substituting Equation (6.29) into Equations (6.26), (6.27), and (6.28), the forces at Points D, E, and O can be determined.
= + (6.30)
= + (6.31)
= 0 (6.32) Rotation moment equilibrium of the forces acting on the rigid body about the Point O gives the following.
− − ℎ + − 6 2 = 0 (6.33)
Substituting Equations (6.25) through (6.28) and = ℎ − into Equation (6.33) and simplifying yield the following expression:
= + 12 + (∆ − ) (6.34)
Substituting Equation (6.29) into Equation (6.34) produces the governing equation for the rigid-body model that shows the relationship between the applied load and the rotation of the beam before the top bracing yields and the beam lifts off.
= + 12 + + (6.35)
With rotation of the beam, the first event that occurs to the girder system is the yielding of the R-bar. The governing equation for the girder system after the yielding of the top bracing can be derived as before the yielding of the top bracing. The mathematical expressions that are affected by yielding of the top bracing are the lateral forces in the top bracing and the timber blocking. Therefore, instead of going through the entire derivation, it is convenient to modify the equation of moment equilibrium to obtain the governing equation. For rotation between the yielding of the top bracing and lift-off of the beam, force in the top bracing is conservatively limited to its specified yield capacity.
= P (6.36) Substituting Equation (6.36) and = 0 ( = 0) into Equation (6.25), the force in the timber blocking, can be obtained as follows.

105
= = P (6.37)
Substituting Equations (6.36) and (6.37) into the equation of moment equilibrium of Equation (6.33), the governing equation for the girder system for rotation between the yielding of the top bracing and the lift-off of the beam can be obtained:
= + P + 12 (6.38)
Additionally, it is useful to know the angles of rotation of the beam at the first yielding of the top bracing and at lift-off. Substituting the ultimate capacity of the top bracing of Equation (6.36) into Equation (6.31), the angle of rotation at the moment of yielding of top bracing can be obtained and is defined as the bracing yield angle in the following way:
= + P (6.39)
Lift-off occurs when the vertical displacement of the right edge of the elastomeric bearing pad becomes zero.
∆ − 2 = 0 (6.40) Substituting Equation (6.24) and Equation (6.38) into Equation (6.40), and solving for the lift-off force produces the following expression:
= + ( + 6 ) + 6(6 − ) (6.41)
Substituting Equation (6.41) into Equation (6.38), the lift-off angle becomes
= 12 ( + ( + ) + P )(6 − ) (6.42)
After the beam lifts off, it experiences partial loss of contact with the elastomeric bearing pad. The corresponding free-body diagram is shown in Figure 6.12. Similar to the case during the full contact of the beam, the applied load, F, the beam self-weight and slab haunch weight, W0, and half of the interior deck weight, Wid must be in vertical equilibrium with the resistance from the elastomeric bearing pads in the vertical direction:
+ + = 2 2 + ∆ (6.43)

106
Figure 6.12: Free-body diagram of Rigid Body with Bracing after Lift-off
Moment equilibrium of forces about the Point O gives the following expression:
− − ℎ + − ( + + ) 3 − ∆3 = 0 (6.44)
Substituting Equations (6.36), (6.37), and = ℎ − into Equation (6.44), Equation (6.44) becomes:
= + P + ( + + ) 3 − ∆3 (6.45)
Substituting Equation (6.45) into Equation (6.43), the governing equation for the girder system rotation after the beam lifts off is obtained:
( 2 + ∆ )
LD
θ
dbr
Wid
FO
E FE
dD
hCG
Wbm
A BO
dcD
FD
F e Lid
Wsh
( 2 − ∆ )

107
= 89 ( + + )(−2 + ) + ( + ) + 2 + 2 P (6.46)
Combining Equations (6.35), (6.38) and (6.46), the complete governing equation for the girder system is obtained, describing the relationship between the applied force and the rotation of the beam.
= + 12 + + ≤
(6.47) = + P + 12 ≤ ≤
= 89 ( + + )(−2 + ) + ( + ) + 2 + 2 P ≤
Figure 6.13 shows the typical application of Equation (6.47) to an AASHTO Type VI
beam with a span length of 60 ft, a girder spacing of 7.7 ft, and a flexible bracing connection. The curve shows the progression of limit states as the load is gradually increased. Initially, the girder system behaves linearly until a top bracing bar yields. The girder system then loses some rotational stiffness. As the load continues to increase, the girder system starts lifting off at the edge of the bearing pad and continues to lose rotational stiffness due to the decrease in contact area between the bearing pad and the beam. With additional load, the girder system experiences lift-off at the first interior quarter point on the bearing pad and a rotation of 0.5 degree sequentially in this case. However, the order of these two events can be reversed.
From a design perspective, the event where the beam lifts off at the first interior quarter point on the bearing pad is of interest. The beam rotation and the corresponding applied force will be determined. Quarter-point lift-off rotation is defined as the rotation in which the vertical displacement of the first interior quarter point on the bearing pad becomes zero. At this rotation, the following kinematic conditions can be established:
∆ − 4 = 0 (6.48) Substituting Equation (6.48) into Equation (6.45) and solving for FQPL, the force required for the beam to lift off at the first interior quarter point on the bearing pad is obtained.
= 4 + 4P + ( + )4 − (6.49)
Substituting Equation (6.49) into Equation (6.46), the angle corresponding to , quarter point lift-off force can be obtained.

108
(6.50)
So far, the governing equation for the girder system with the flexible connection has been
derived. The main difference between the flexible connection and the stiff connection is that the flexible connection is linear elastic-perfectly plastic, while the stiff connection fails in rupture of the R-bar. Because the derivation of the governing equation for a girder system with the stiff connection is essentially the same as for that with flexible connection, the resulting governing equations are given as follows:
(6.51)
(6.52)
Equations (6.51) and (6.52) are the governing equations for a girder system with a stiff
connection and the rotation at the moment of rupture of the R-bar, respectively. For girders with a stiff connection, rupture of the R-bar typically governs the behavior.
Figure 6.13: Applied Moment and Beam Rotation
0
20
40
60
80
100
120
140
0.0 0.1 0.2 0.3 0.4 0.5
Appl
ied
Mom
ent (
=F×
e) (k
ips-
ft)
Beam Rotation (degrees)
yielding in top bracing bar
lift-off at edge of bearing
lift-off at first interior quarter point of bearing
beam rotation of 0.5 degree
Beam Type VISpan: 60 ftGirder Spacing: 7.7 ftFlexible Connection

109
6.7 Validation of Rigid-body Model with Finite Element Analysis Results The finite element model that was previously validated through comparisons with
laboratory tests and field measurements was used to examine the accuracy of the above rigid-body equations for girder systems with lateral bracing. The first-order numerical solutions for the rigid-body model for a girder system with lateral bracing (including flexible and stiff connections) were obtained by using the governing equations for rigid-body models (Equations (6.47) and (6.51)) that were developed in the previous section.
The first-order analyses of three-dimensional finite element models for girder systems with lateral bracing were conducted. The finite element model consisted of 4 beams across the width of the bridge, and had a span of 60 ft and a girder spacing of 7.7 ft. Girder systems for finite element analysis were subjected to the construction loads explained in the previous section, and had the minimum top bracing distributed uniformly along the beam length.
Figure 6.14 and Figure 6.15 depict graphs of beam rotation and overhang width for girder systems with flexible and stiff connections, respectively. For a girder system with a given overhang width, the beam rotation on the y axis represents the maximum rotation that the girder system could experience for the full construction load. In general, the results from the rigid-body model equations show good agreement with the FEA results. This indicates that the rigid-body model equations can be used to determine the necessary amount of bracing for a girder system with given overhang width, in order to prevent excessive rotation of the fascia beam.
Figure 6.14: Beam Rotation and Overhang Width for Flexible Connection
0.0
0.1
0.2
0.3
0.4
0.5
0 1 2 3 4 5
Beam
Rot
atio
n (d
egre
es)
Overhang Width (feet)
Tx70 (FEA)
Tx70 (RBM)
Beam VI (FEA)
Beam VI (RBM)

110
Figure 6.15: Beam Rotation and Overhang Width for Stiff Connection
6.8 Overhang Design Equation and Recommended Design Procedure
6.8.1 Summary of Overhang Design Equations
In the previous sections, the governing equations for a concrete girder system were derived and also compared with FEA solutions. The equations had good agreement with the FEA solutions, and can therefore be used for design. This section therefore provides recommendations on the use of the expressions for design.
For girder systems with flexible connection, two criteria must be checked. First is that the applied eccentric load must be less than or equal to the quarter-point lift-off force of Equation (6.53).
(6.53)
The second criterion is that the beam rotation for the applied load corresponding to a given overhang width must be less than or equal to a beam rotation of 0.5 degrees. Since it is not known whether the beam lifts off for the applied load corresponding to a given overhang width, two separate beam rotation equations must be checked. Equations (6.54) and (6.55) give beam rotations before and after lift-off of the beam, respectively.
(6.54)
(6.55)
0.0
0.1
0.2
0.3
0.4
0.5
0 1 2 3 4 5
Beam
Rot
atio
n (d
egre
es)
Overhang Width (feet)
Tx70 (FEA)Tx70 (RBM)
Beam VI (RBM)Beam VI (FEA)

111
For girder systems with a stiff connection, the governing behavior is rupture of R-bar. For
the range of the practical values of the system parameters, at the moment of rupture of the R-bar, the girder is typically in full contact with the bearing pad. Therefore, the beam rotation of Equation (6.56) for the applied load corresponding to a given overhang width must be less than or equal to a beam rotation for rupture of the R-bar, Equation (6.57).
= ( − )12 + + (180/ ) (6.56)
= + P (180/ ) (6.57)
6.8.2 Recommended Design Procedure
In this sub-section, overhang design procedures are developed. The design procedure for girder systems with flexible connection is followed by the design procedure for girder systems with stiff connection.
The standard design parameters and their values shall be given as in Table 6.3.
Table 6.3: Standard Design Parameters
Parameter Value Unit
Concrete Unit Weight 0.15 kip/ft
Overhang Formwork Unit Weight 0.01 kip/ft
Top Bracing Stiffness per Single, k 15.5 (flexible), 39 (stiff ) kip/in. Capacity of Top Bracing per Single,P 1.2 (flexible), 3 (stiff) kip
Axial Rigidity of Wood Blocking per Single 11,025 kip
Half of Screed Weight 5.7 kip
Work Bridge Weight per Length 0.02 kip/ft Weight of Workers 1.25 kip
The system parameters and their definitions for a bridge girder system are listed in Table
6.4. These values are calculated by using the information on a given bridge girder system.

112
Table 6.4: Girder System Parameters
Parameter Definition Unit
slab thickness (8 in. typical) in. Beam spacing in. number of beams of bridge unitless net width of bridge (=( − 1) ) in.
span of beam in. total compressive stiffness of two bearing pads per width
kip/in.in. width of overhang in.
Eccentricity of half of interior deck weight (= half of top flange of beam)
in. Weight of beam kip weight of slab haunch (= 2 ( + 2) ) kip
half of interior deck weight between fascia beam and first interior (= ( − 2 )/2)
kip
Eccentricity of net overhang weight (= + ( − )/2)
in. Eccentricity of half of finishing equipment weight (= ) in.
Eccentricity of weight of workers (= + 1 × 12)
in. Eccentricity of weight of overhang formwork
(= + (2 × 12 + − )/2) in.
Half of work bridge weight (=23.5 /1000 /12 * /2)
kip
weight of net overhang (= ( − ) ) kip half of finishing equipment weight (= 5.7 + ) kip
weight of overhang formwork (= (2 × 12 + − ) ) kip
Flexible Connection
Step 1: Calculate effective eccentric force and its eccentricity Step 1-A: Determine the following forces and dimensions.
, Half of Work Bridge Weight: = 23.5/1000/12* /2 , Weight of Net Overhang: = ( − ) , Half of Finishing Equipment Weight: = 5.7+ , Weight of workers: = 1.25 kips , Weight of Overhang Formwork: = (2 × 12 + − ) Eccentricity of net overhang weight: = + ( − )/2 Eccentricity of half of finishing equipment weight: = Eccentricity of weight of workers: = + 1 × 12 Eccentricity of weight of overhang formwork: = + (2 × 12 + − )/2
Step 1-B: Calculate effective eccentric force and its eccentricity.

113
= + + + = (26+6.22+1.25+5) =
Step 2: Calculate quarter-point lift-off force and check it against with the effective eccentric force. Step 2-A: Determine the following items.
, Weight of Beam , Weight of Slab Haunch , Half of Weight of Interior Deck
= + Total Capacity of Top Bracing Bars: = (# of Top Braces)* P
, Half of Top Flange Width , Bearing Width , Bracing Moment Arm
Step 2-B: Calculate the quarter-point lift-off force.
, Quarter-Point Lift-off Force = ( )
Step 2-C: Check if (effective eccentric force) ≤ (quarter-point lift-off force) If this is true, continue to the next step. Otherwise, increase the amount of bracing and repeat the step 2. Step 3: Check beam rotations Step 3-A: Determine the compressive stiffness of bearing pads. For a given bearing pad type, total compressive stiffness of two bearing pads for one fascia girder is determined from Table B.2 in Appendix B.
, total compressive stiffness / .. of two bearing pads per width
Step 3-B: Calculate . = 12 ( − − )(180⁄ )
Step 3-C: Calculate
= ( )( ) ( ) (180/ ) (degree)
Step 3-D: Check if ( and ) ≤ 0.5 degrees (serviceability limit angle). If this is true, continue to the next step. Otherwise, increase the amount of bracing and repeat the step 2. Step 4: Summarize Final Design.
Stiff Connection
Step 1: Calculate effective eccentric force and its eccentricity Step 1-A: Determine the following forces and dimensions.
, Half of Work Bridge Weight: = 23.5/1000/12* /2 , Weight of Net Overhang: = ( − ) , Half of Finishing Equipment Weight: = 5.7+ , Weight of workers: = 1.25 kips , Weight of overhang formwork: = (2 × 12 + − ) Eccentricity of net overhang weight: = + ( − )/2

114
Eccentricity of half of finishing equipment weight: = Eccentricity of weight of workers: = + 1 × 12 Eccentricity of weight of overhang formwork: = + (2 × 12 + − )/2
Step 1-B: Calculate effective eccentric force and its eccentricity. = + + + = (26+6.22+1.25+5) =
Step 2: Check for rupture of R-bar. Step 2-A: Determine the following items
, Half of Weight of Interior Deck , Half of Top Flange Width , Bearing Width
, total compressive stiffness / .. of two bearing pads per width (from Table B.2 in
Appendix B) k , Total Top Bracing Stiffness = (# of Top Bracing Bars)*(39 kip/in.) , Total Wood Blocking Stiffness kip/in.
= (# of wood blockings)*(11025 kip)/(beam spacing - width of bottom flange of beam) Total Capacity of Top Bracing Bars: = (# of Top Braces)* (3 kips)
, Bracing Moment Arm Step 2-B: Check if beam rotation at rupture of R-bar ≤ ream rotation for a given overhang width , Beam Rotation at Rupture of R-bar = P (180/ )
, Beam Rotation for Given Overhang Width: = ( ) (180/ )
Check if ≤ . If this is true, continue to the next step. Otherwise, increase the amount of bracing and repeat the step 2. Step 3: Summarize Final Design.
6.9 Closing Remarks A rigid-body model for a stand-alone beam on bearing pads was developed. The solutions
for both the first order analysis and the second order analysis of the rigid-body model were obtained and were verified with the data from the beam overturning test. The results of the second-order analysis of the rigid-body model showed good agreement with those of the overturning test over the entire range of rigid-body rotations. In addition, the second-order analytic solution of the rigid-body model captured the descending branch of the curve of the overturning test results well. Although the solution of first-order analysis of the rigid-body model did not capture the descending branch of the curve of the overturning test results, the results of first-order analysis of the rigid-body model showed good agreement with those of the overturning test for the small rotation that is in the typical design range. Because in design the main area of interest is when the beam becomes unstable and starts to tip, the first order solution provides reasonable estimates of when the beam becomes unstable and is simpler than the second order solution.
The solutions for the first-order analyses of the rigid-body model for a girder system with lateral bracing including flexible and stiff connections were obtained and were verified with the

115
results from the FEA model that was validated through comparisons with laboratory tests and field measurements. Based on the solutions for the rigid-body model for a girder system with lateral bracing, a simple design equation and a design methodology were developed to be used for overhang bracing design.

116

117
Chapter 7. System Buckling of Steel Girder Systems
7.1 Introduction While most steel girder bridges consist of four or more girders, only two or three girders
are needed in applications such as pedestrian bridges or bridge widenings. Increased traffic demands often require the addition of traffic lanes, which requires widening the bridge. In most situations, the widening is completed by adding a few girders to the bridge. The widened deck segment may not be connected to the original bridge in certain cases if the condition warrants such a need. The resulting bridge addition typically is a two- or three-girder system with a relatively large length-to-width ratio that makes these girders susceptible to a system mode of buckling that is critical during construction of the bridge deck (Yura et al., 2008). Figure 7.1 shows the system buckling mode of a steel twin-girder system. In a system buckling mode, the girder system behaves as a unit and the entire cross-section deflects vertically and laterally while rotating about its shear center. The system mode of buckling is relatively insensitive to the spacing between cross-frames, because the internal cross frames can restrain the relative displacement or rotation between the two girders but cannot prevent the rotation of the entire cross section of the system as shown in Figure 7.1.
The system buckling behavior is often made worse by the torsional load that results from the gravity load from the bridge overhang. Figure 7.2 shows the plan and cross section of a twin I-girder system subjected to an overhang load. Although the concrete deck overhangs on both the interior and exterior sides of the widening, one end of the formwork on the interior side is usually supported by the existing structure, which usually results in a significant reduction in the torque on that side of the girders. The weight of the concrete on the exterior overhang is usually supported by cantilever overhang brackets that react on the top flange and the girder web. The unbalanced eccentric overhang loads result in torsion on the girder system.

118
Figure 7.1: System Buckling Mode
SC
SC
φ
v
u
φ
y
x
= SC (shear center)
A
A
(a) Plan View
(b) Cross Section View A-A

119
Figure 7.2: Twin I-Girder System under Overhang Loads
The eccentric load forces the girder system to twist, which can decrease the stability of the girder system, possibly resulting in a dangerous situation during concrete placement.
Global lateral torsional buckling can also be an issue for steel box-girder bridges before composite action is fully developed. The failure of the Marcy Pedestrian Bridge in 2002 is attributed to overall lateral torsional buckling of the girder during placement of the concrete bridge deck (Popp 2004). Although the girder had closely spaced internal K-frames, a top lateral truss was not provided, which resulted in too low of a torsional stiffness and led to the collapse. In addition to the box girder collapse, global lateral torsional buckling (also called system buckling) has caused problems for I-girder systems. One such problem occurred during placement of the concrete bridge deck for a twin I-girder system that was used for a bridge widening in Texas. The twin I-girders had a 166 ft simple span with a spacing of 5.1 ft, resulting in a large span-to-width ratio (Zhou, 2006). During placement of the concrete bridge deck, the girders experienced a large torsional deformation, requiring the concrete deck to be removed so that a retrofit could be developed for the bridge. The unbalanced torsion from the overhang caused the bridge to twist towards the overhang.
Current design specifications for bridges (AASHTO, 2007) and buildings (AISC, 2005) consider only the lateral torsional buckling of individual beams between brace points. Global lateral buckling of a girder system is primarily a problem for systems with a relatively large length/width ratio. Therefore, this mode can be problematic in systems with either closely spaced girders or systems with only a few girders across the width. However, the torsional behavior of these systems is not well understood, especially for cases subjected to combined bending and torsion due to eccentric loads, such as in the case of unbalanced overhang construction.
The closed form solution for lateral torsional buckling of a simply supported girder subjected to uniform moment was derived by Timoshenko (Timoshenko and Gere, 1961). The
A
A
(a) Plan View
exterior overhang
(b) System Cross-Section under Overhang Loads
interior overhang
exterior girder interior
overhang bracket
fresh
existing structure

120
solution is widely used in bridge and building specifications as a design equation for lateral torsional buckling of individual beams and considers the beam behavior for buckling between brace points. Yura et al. (2008) derived Equation (7.1) for the global lateral buckling moment of a twin girder system that had good agreement with FEA solutions (ANSYS, 2008).
( )222
22
42 SIhI
L
IEGJEI
LM xoy
g
yy
gg ++=
ππ(7.1)
where, = span length, = modulus of elasticity, = shear modulus, = moment of inertia about strong axis, = moment of inertia about weak axis, = torsional constant, ℎ = distance between flange centroids, and = girder spacing. The closed form solution shown above is for doubly symmetric I-sections with uniform moment but can be modified for various loading conditions and for singly symmetric sections as outlined in Yura et al. (2008). However, the solution was derived for bending caused by symmetric gravity loading and did not consider the torsional loading that may result due to unbalanced overhang loads.
The purpose of the study on steel girder systems is to investigate the global lateral torsional behavior of systems under torsion due to eccentric loads such as the unbalanced loading that may result from overhang construction. Parametric investigations using FEA models (ANSYS, 2008) were conducted to improve the understanding of the behavior of twin girder systems in the global lateral-torsional buckling mode. The major parametric variables that were considered included section type, girder spacing, span length, overhang width, and the magnitude and shape of the girder imperfection. The analytic solution to nullify the torsion due to overhang loads in the girder system was derived and checked against imperfections on the girder system. The FEA results showed the effects of each parameter on the lateral torsional buckling behavior of the twin girder system to improve the understanding of the behavior. Based upon the results, rules for geometric proportioning were developed to minimize the unbalanced torsion on girder systems used for widening applications. The chapter has been divided into five sections. Following this introductory section, an overview of the finite element modeling techniques for the system buckling mode is discussed. A derivation of the necessary geometry to eliminate the unbalanced torsion is then provided. Finite element results are then presented to demonstrate the system buckling behavior and the effectiveness of offsetting the unbalanced load. Finally, the important findings are summarized.
7.2 FEA Modeling The structural behavior of a twin girder system subjected to torque from unbalanced
overhang loads was studied by conducting parametric finite element analyses. Both eigenvalue buckling analyses and large displacement analyses were carried out assuming linear elastic materials, which is appropriate as the critical stage for buckling is usually during construction when stresses are well below yield. The girder cross sections that were used in FEA models are depicted in Figure 7.3.
Sections D60 and D70 are doubly symmetric with depths of 60 in. and 70 in., respectively. Section S70 has a single plane of symmetry through the web and a depth of 70 inches. Compared to D70, the section of D60 has about 29% less moment of inertia about the strong axis and essentially the same weak axis moment of inertia.

121
Figure 7.3: Cross Sections Studied
For singly-symmetric sections, the effective moment of inertia about the weak axis can be calculated by the expression (Yura et al. 2008):
, = + (7.2)
where Iyc and Iyt are the respective moments of inertia of the compression and tension flanges about an axis through the web, and t and c are the respective extreme fiber distances from the neutral axis of the tension and compression flange. The section of S70 has about 16% more effective moment of inertia about the weak axis than the section D70. Angles of L5×5×3/4 were provided for the end cross-frames while angles of L4×4×3/4 were provided for intermediate cross frames. Transverse web stiffeners with a thickness of 0.5 in. and a width of 90% of half of the top flange width were also used at the supports and at the locations of intermediate cross frames.
The finite element model of a typical girder system is shown in Figure 7.4. The cross-sections of the girders and the transverse web stiffeners were modeled using eight-node shell elements with an aspect ratio as close to unity as possible. The shell elements for the transverse web stiffeners shared nodes with the web elements for the girders. The stiffeners did not offer any warping restraint to the flanges as they were not attached to the flange nodes away from the web intersection. The stiffness of the cross-frames was identical to tension-only systems because one of the diagonals was omitted so that only three truss members were used. The cross frame members framed into the girders at the node at the flange to web intersection. Two of the truss elements were horizontal, linking the flanges of adjacent girders, and the other member was a diagonal that linked the bottom web node of one girder to the top web node of the adjacent girder. The girders were simply supported, and the section was free to warp at the supports.
70” 70”
18”
1.25”
60”
0.625”
1.25”
1.25”
18”
18”
D60
18”
0.625”
1.25”
1.25”
D70
24.194”
14”
0.625”
1.25”
S70

122
Top View Plan ViewFigure 7.4: Finite Element Model of Girder System
The load of the fresh concrete was simulated by a uniformly distributed load applied along the girder length at the nodes joining the top flange to the web. The torsion due to the overhang load was simulated by applying lateral loads to the top and bottom flanges of the girder in the horizontal direction to form a force couple. The self-weight of the girder system was modeled as a vertical load applied at the centroid. In the large displacement analyses, the loads were sequentially applied in the order of girder self-weight and the fresh concrete load because the girder self-weight already exists before the fresh concrete load is applied to the girder. In some cases, the girder self-weight was conservatively included in the weight of the fresh concrete that was applied at the top flange, which is a critical condition for load height effects.
Table 7.1 lists the parameters and the ranges that were used in the parametric FEA studies. The range of the girder spacing was taken between 5 to 10 ft and the girder span ranged from 120 to 180 feet. Although practical values were chosen for the spans and girder spacing, these common values produce large span to width ratios, which make the system mode of buckling critical. The range of the overhang width was varied from 2 to 4 feet, which is consistent with common practice where the most common overhang width is usually around 3 ft. In many bridge widening projects, the widths of the overhang on the internal and external side are equal; however, unequal overhang widths were considered to improve the distribution of torsion on the bridge widening. In addition to torque due to the overhang load, the imperfection of the girder system can amplify the torque as the eccentricity of the applied load may be increased. A half-sine wave of three different kinds of imperfection shapes was utilized to study these effects. The shapes of the imperfections are shown in Figure 7.5. The Case A imperfection

123
consisted of the case of a lateral sweep of the top flange while the bottom flange remained straight. Case C consisted of a pure lateral sweep of both flanges, and Case B has both flanges with a lateral sweep; however, the top flange had a larger sweep. Wang and Helwig (2005) showed that the Case A imperfection was critical in terms of resulting in the largest brace forces.
Table 7.1: Parameters and Their Ranges
Parameter Range
Cross section two doubly symmetric sections and one singly symmetric section (see Figure 7.3)
Span 120, 150, 180 ft Girder Spacing 5, 7.5, 10 ft Overhang Width 2,3,4 ft
Overhang Width Ratio equal overhang widths, unequal overhang widths
Cross-Frame Spacing 10, 30 ft
Load self-weight, fresh concrete load
Imperfection three different cases
Figure 7.5: Imperfections Considered
7.3 Derivation of Self-Equilibrating Overhang Width In a widening, the added girders are often isolated from the existing bridge girders to
allow the new girders to deflect during construction. Although the girders are not generally tied back to the existing structure, the deck forms are often supported off the existing structure. Therefore, although there is an overhang on both sides of the widening, only half of the interior overhang load is supported by the widening with the formwork reaction applied at the tip of the flange of the interior girder. The exterior overhang load is supported on cantilever overhang brackets that apply torque on the exterior girder of the widening. Figure 7.6 depicts the overhang loads on both sides of the twin girder system. The fresh concrete load that is applied between girders is omitted from the figure for clarity because it does not contribute to the torque about the shear center of the twin girder system.
0.72˝
0.52˝
0.72˝
0.72˝
0.72˝
Case A Case B Case C

124
Figure 7.6: Cross-Section of Twin-Girder System under Overhang Loads
The self-weight of the twin girder system is also omitted for the same reason. The interior overhang load, , corresponds to the half of the load on the interior overhang between the existing bridge and the edge of top flange of the interior girder of the twin girder system. The exterior overhang load that is applied at the top flange of the girder, , is the total weight of the external overhang. Although some of the external overhang load is transmitted through friction between the web and the cantilever bracket, this component was conservatively neglected because most of the overhang bracket force is transmitted at the top of the girder. In addition to the vertical overhang load of , the torque of is applied to the exterior girder through the overhang brackets and is represented as Te in the figure.
Moment equilibrium of the overhang loads about the shear center of the twin girder system can be established to develop an expression in terms of the interior overhang width and the exterior overhang width to result in zero torque on the bridge widening system. Equation (7.3) shows the resulting expression in which the interior overhang width has been expressed as a function of the exterior overhang width, the top flange width, and the spacing of the twin girder system for the condition of zero torque on the girder system in the widening.
−++−
++=
2
22
1)
22)(
2(
4
2
fweW
fwgSfweW
fwgS
fwiW (7.3)
Figure 7.7 illustrates the relationship of the interior overhang width and the exterior
overhang width of the twin girder system of Section D70 to eliminate the torque about the shear center for the twin girder system. For most practical systems, the interior overhang width to produce zero torque is in the range of 2 to 3 times the exterior overhang width.
Te Shear Center
torque from exterior
overhang
Fi
load from interior overhang
Fe
load from exterior overhang
wf
width of exterior overhang width of interior overhang
Wi We Sg

125
Figure 7.7: Relationship of Interior and Exterior Overhang Widths for Zero Torque
7.4 FEA Results of system Buckling
7.4.1 Global Lateral Buckling Moment of Twin Girder Systems
Before the effects of combined bending and torsion were studied with the FEA models, results from the FEA analysis were compared with predictions from Equation (7.1) that was presented in Yura et al. (2008). The first comparisons were made with uniform moment loading as that is the loading the derivation was based upon. Parametric evaluations were conducted with variables consisting of section type, span, girder spacing, and cross-frame spacing specified as in Table 7.1. Table 7.2 lists comparisons of the FEA results and the predictions from Equation (7.1). In the table, the minus values indicates that the prediction from Equation (7.1) is larger than the value from the FEA results, and NA means that individual beam buckling governs rather than global lateral buckling for given parametric conditions. As shown in the table, the results from the FEA studies are in good agreement with the results from the solution by Yura et al. (2008). For example, for the cross-frame spacing of 10 ft, the maximum difference between the FEA results and the closed form solution for doubly symmetric sections of D60 and D70 was less than 2%, while the maximum difference for the singly symmetric section of S70 was less than 8%. For the cross-frame spacing of 30 ft, the maximum difference between the FEA results and the closed form solution for all the sections considered was within 8%. These differences result from the assumptions in the derivation of the closed form solution by Yura et al. (2008). Such assumptions were that the cross-section of the twin girder system is maintained as rigid along the entire length of the girder and the cross-section of each girder is doubly symmetric.
0
2
4
6
8
10
12
14
16
1 2 3 4 5
Inte
rior O
verh
ang
Wid
th (f
t), W
i
Exterior Overhang Width (ft), We
girder spacing (5 ft)
girder spacing (7.5 ft)
girder spacing (10 ft)

126
Table 7.2: Comparisons of FEA results and Closed-Form Solutions
Span Length
Section Type
Girder Spacing (ft)
FEA (kips-ft) Mg (kips-ft)
(Equation (7.1))
Percentage Difference
Cross-Frame Spacing (ft) Cross-Frame Spacing (ft)
10 ft. 30 ft. 10 ft. 30 ft.
120 ft
D60
5 ft. 5676 (k-ft) 5591 (k-ft) 5632 (k-ft) 0.8% -0.7%
7.5 ft. 8290 (k-ft) 8023 (k-ft) 8289 (k-ft) 0.0% -3.2%
10 ft. 10830 (k-ft) 10229 (k-ft) 10976 (k-ft) -1.3% -6.8%
D70
5 ft. 6673 (k-ft) 6564 (k-ft) 6647 (k-ft) 0.4% -1.2%
7.5 ft. 9772 (k-ft) 9435 (k-ft) 9816 (k-ft) -0.5% -3.9%
10 ft. 12766 (k-ft) 12021 (k-ft) 13016 (k-ft) -1.9% -7.6%
S70
5 ft. 7206 (k-ft) 7013 (k-ft) 7039 (k-ft) 2.4% -0.4%
7.5 ft. 10943 (k-ft) NA 10502 (k-ft) 4.2% NA
10 ft. 14543 (k-ft) NA 13976 (k-ft) 4.1% NA
150 ft
D60
5 ft. 3703 (k-ft) 3679 (k-ft) 3651 (k-ft) 1.4% 0.8%
7.5 ft. 5394 (k-ft) 5321 (k-ft) 5336 (k-ft) 1.1% -0.3%
10 ft. 7079 (k-ft) 6912 (k-ft) 7049 (k-ft) 0.4% -1.9%
D70
5 ft. 4347 (k-ft) 4317 (k-ft) 4295 (k-ft) 1.2% 0.5%
7.5 ft. 6363 (k-ft) 6270 (k-ft) 6310 (k-ft) 0.8% -0.6%
10 ft. 8359 (k-ft) 8151 (k-ft) 8351 (k-ft) 0.1% -2.4%
S70
5 ft. 4707 (k-ft) 4659 (k-ft) 4524 (k-ft) 4.0% 3.0%
7.5 ft. 7143 (k-ft) 6981 (k-ft) 6734 (k-ft) 6.1% 3.7%
10 ft. 9555 (k-ft) NA 8954 (k-ft) 6.7% NA
180 ft
D60
5 ft. 2618 (k-ft) 2609 (k-ft) 2575 (k-ft) 1.7% 1.3%
7.5 ft. 3791 (k-ft) 3766 (k-ft) 3733 (k-ft) 1.6% 0.9%
10 ft. 4974 (k-ft) 4917 (k-ft) 4915 (k-ft) 1.2% 0.0%
D70
5 ft. 3065 (k-ft) 3054 (k-ft) 3016 (k-ft) 1.6% 1.2%
7.5 ft. 4467 (k-ft) 4435 (k-ft) 4405 (k-ft) 1.4% 0.7%
10 ft. 5878 (k-ft) 5805 (k-ft) 5817 (k-ft) 1.0% -0.2%
S70
5 ft. 3326 (k-ft) 3310 (k-ft) 3158 (k-ft) 5.3% 4.8%
7.5 ft. 5023 (k-ft) 4970 (k-ft) 4687 (k-ft) 7.2% 6.0%
10 ft. 6725 (k-ft) 6601 (k-ft) 6226 (k-ft) 8.0% 6.0%
The effects of the cross frame spacing on the global lateral buckling moment was
investigated by using the parametric FE models subjected to uniform line load over the entire parametric set in Table 7.1. For the full range of parameters in Table 7.1, the global buckling moments were relatively insensitive to the cross frame spacing. For cross frame spacings of 10

127
ft. and 30 ft. the solutions were within 8% of each other with the smaller spacing giving the higher buckling capacity. This is consistent with the findings form Yura et al. (2008).
Figure 7.8 illustrates the global lateral buckling moment of the twin girder system versus the span and section type for the case of a girder spacing of 5 ft and a uniform line load applied at the top flange of the girder. As expected, the global lateral buckling capacity is smaller for longer girder spans. The global buckling moment of section S70 is always greater than the other two sections studied. The larger capacity of the S70 section relative to the doubly symmetric sections is because the effective moment of inertia of section S70 about the weak axis is 16.4% larger than those of sections D60 and D70. Figure 7.9 shows the global lateral buckling moment of the twin girder system versus the girder spacing for the case of a 150 ft span and a uniform line load at the top flange of the girder. The global lateral buckling moment of each section increases linearly with girder spacing.
Figure 7.8: Global Lateral Buckling Moment of Girder Systems with Respect to Section Type
and Span Length
0
1000
2000
3000
4000
5000
6000
7000
8000
120 150 180
Buck
ling
Mom
ent (
f-kip
s)
Span (ft)
D60
D70
S70

128
Figure 7.9: Effects of Girder Spacing on Global Lateral Buckling Moment
7.4.2 Large-Displacement Analyses
Large displacement analyses of twin girder systems subjected to gravity loads from girder self-weight and fresh concrete were conducted on systems with the full range of the parametric set in Table 7.1. For most of the graphs shown in this section, the overhang widths were 3 ft, which is a relatively typical size. The impact of variable overhang widths is demonstrated later in this section.
Figure 7.10 shows a graph of the fresh concrete load vs. mid-span twist of girder systems of spans of 150 ft and 180 ft with a girder spacing of 7.5 ft. As would typically be found in practice, the formwork for the overhang on the interior side is supported by both the existing construction and the girders in the widening. The torsion results from the differences in formwork support on the interior and exterior overhangs. The girder systems of span of 180 ft showed excessive twist at mid-span before they reached even half of the full fresh concrete load. Relatively large twist also occurred to the girder systems of span of 150 ft which would likely be problematic during construction.
Figure 7.11 demonstrates how the girder spacing affects the torsional behavior of the twin girder system. The girder systems had a span of 150 ft. The girder system with a spacing of 5 ft became unstable at approximately 88% of the full fresh concrete load. The girders with the larger spacing have higher system warping stiffness and therefore have smaller resulting twists.
In Figure 7.12, the twin girder systems consisted of section type D70 with a span of 150 ft, and girder spacing of 7.5 ft. The graphs show that that the torsional behavior of the girder system is very sensitive to small changes in overhang width. With larger overhang widths, the unbalanced torque increases and the girders experience larger twists.
To minimize the torsion due to the overhang loads, Equation (7.3) was developed for proportioning the interior and exterior overhang widths such that moment equilibrium of the externally applied loads about the shear center of the girder system is satisfied with zero net torque on the girder.
0
2000
4000
6000
8000
10000
12000
5 7.5 10
Buck
ling
Mom
ent (
f-kip
s)
Girder Spacing (ft)
D60
D70
S70

129
Figure 7.10: Behavior of Girder System under Torsion
Figure 7.11: Effects of Girder Spacing on Torsional Behavior of Girder Systems
0
0.1
0.2
0.3
0.4
0.5
0.6
0.7
0.8
0.9
1
0 1 2 3 4 5 6 7 8 9
Wet
Con
cret
e Lo
ad×
100
%
Mid-Span Twist (deg.)
D60
D70 S70
D60D70
S70
0
0.1
0.2
0.3
0.4
0.5
0.6
0.7
0.8
0.9
1
0 1 2 3 4 5 6 7 8 9
Wet
Con
cret
e Lo
ad×
100
%
Mid-Span Twist (deg.)
girder spacing (5 ft)
girder spacing (7.5 ft)
girder spacing (10 ft)
Sg(5 ft)
Sg(7.5 ft)
Sg(10 ft)
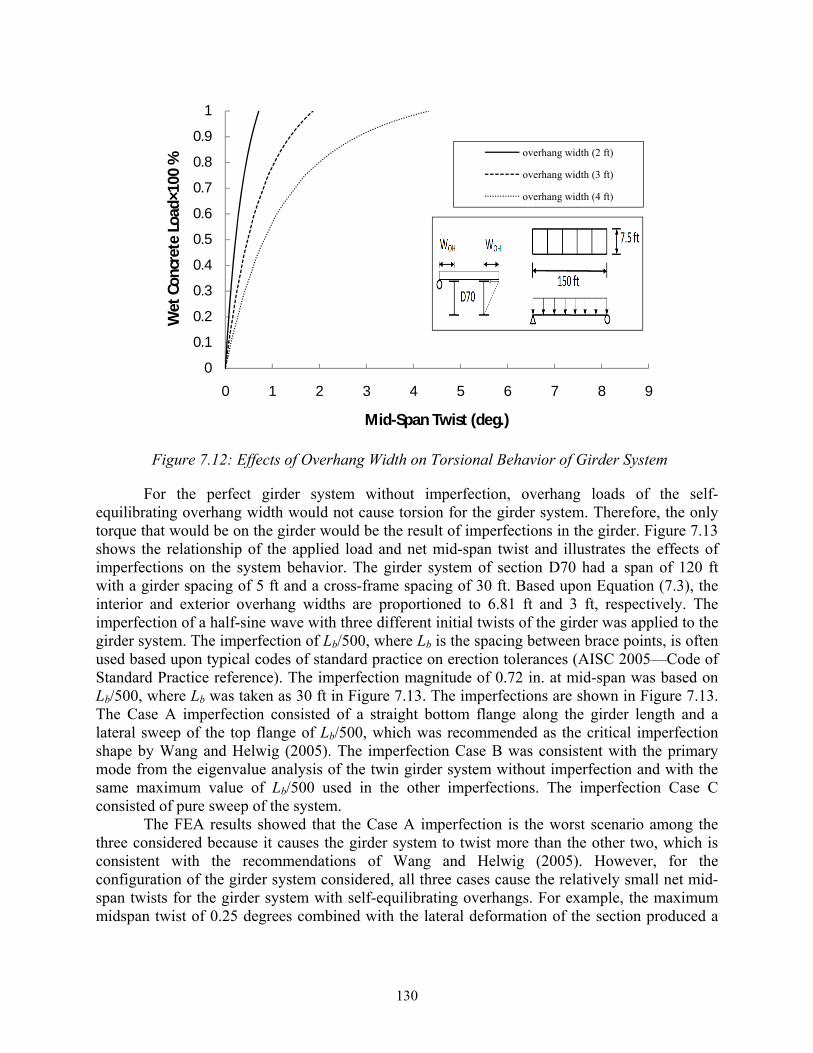
130
Figure 7.12: Effects of Overhang Width on Torsional Behavior of Girder System
For the perfect girder system without imperfection, overhang loads of the self-equilibrating overhang width would not cause torsion for the girder system. Therefore, the only torque that would be on the girder would be the result of imperfections in the girder. Figure 7.13 shows the relationship of the applied load and net mid-span twist and illustrates the effects of imperfections on the system behavior. The girder system of section D70 had a span of 120 ft with a girder spacing of 5 ft and a cross-frame spacing of 30 ft. Based upon Equation (7.3), the interior and exterior overhang widths are proportioned to 6.81 ft and 3 ft, respectively. The imperfection of a half-sine wave with three different initial twists of the girder was applied to the girder system. The imperfection of Lb/500, where Lb is the spacing between brace points, is often used based upon typical codes of standard practice on erection tolerances (AISC 2005—Code of Standard Practice reference). The imperfection magnitude of 0.72 in. at mid-span was based on Lb/500, where Lb was taken as 30 ft in Figure 7.13. The imperfections are shown in Figure 7.13. The Case A imperfection consisted of a straight bottom flange along the girder length and a lateral sweep of the top flange of Lb/500, which was recommended as the critical imperfection shape by Wang and Helwig (2005). The imperfection Case B was consistent with the primary mode from the eigenvalue analysis of the twin girder system without imperfection and with the same maximum value of Lb/500 used in the other imperfections. The imperfection Case C consisted of pure sweep of the system.
The FEA results showed that the Case A imperfection is the worst scenario among the three considered because it causes the girder system to twist more than the other two, which is consistent with the recommendations of Wang and Helwig (2005). However, for the configuration of the girder system considered, all three cases cause the relatively small net mid-span twists for the girder system with self-equilibrating overhangs. For example, the maximum midspan twist of 0.25 degrees combined with the lateral deformation of the section produced a
0
0.1
0.2
0.3
0.4
0.5
0.6
0.7
0.8
0.9
1
0 1 2 3 4 5 6 7 8 9
Wet
Con
cret
e Lo
ad×1
00 %
Mid-Span Twist (deg.)
overhang width (2 ft)
overhang width (3 ft)
overhang width (4 ft)

131
total lateral deformation of 1.67 inches at the maximum load. This deformation is approximately twice the initial imperfection.
In Figure 7.14, the girder system with self-equilibrating overhang widths (exterior and interior overhand widths of 3 ft and 6.81 ft, respectively) is compared with its counterpart with equal overhang widths (3 ft for each overhang width). The girder system with self-equilibrating overhang widths carried the higher fresh concrete load, because its interior overhang was wider than that of the girder system with equal overhang widths as mentioned above. Both girder systems consisted of section type D70 with a span of 120 ft, a girder spacing of 5 ft, a cross-frame spacing of 30 ft, and Case A imperfection. Figure 7.14 illustrates that the girder system with self-equilibrating widths underwent less twist that the girder system with equal-overhang widths. This indicates that the elimination of the torsion due to the overhang loads by proportioning the interior and exterior overhang widths leads to the better structural behavior of the girder system. This also suggests that the concept of self-equilibrating overhang width can be utilized for bridge widening projects to minimize the effects of the overhang load.
Figure 7.13: Effects of Imperfections on Torsional Behavior of Girder System
0
0.1
0.2
0.3
0.4
0.5
0.6
0.7
0.8
0.9
1
0 0.05 0.1 0.15 0.2 0.25
Load
×100
%
Net Twist at Mid-Span (deg.)

132
Figure 7.14: Effects of Proportioning of Overhang Widths
7.5 Closing Remarks The instability of the twin girder system with combined flexure and torsion due to
unbalanced overhang loads was investigated. The parametric FEA studies were carried out on a twin girder system to improve the understanding of the behavior. Both eigenvalue buckling analyses and large displacement analyses were conducted considering the impact of several variables. In addition, a closed form solution for self-equilibrating overhang width of the twin girder system was derived and compared with the computational solutions. Based upon the results, the following conclusions can be made:
• The unbalanced eccentric ovehang load leads to a significant amount of lateral displacment and twist of twin girder systems and should be taken into consideration for design of systems in bridge widening applications or other cases with unbalanced loading on girder systems.
• For girder systems failing in the global system buckling mode, the spacing of intermediate cross-frames does not have a significant impact on the buckling behavior of girder systems with practical geometries.
• The torsional resistance of the girders failing in the system mode of buckling can be improved by increasing either Ix or Iy,eff of the girders.
• The system mode of buckling becomes more critical for smaller girder spacings, larger span to width ratios of the girders, and larger overhang widths.
• Many of the twin girder systems considered in the study had insufficient capacities in the global buckling mode for the fresh concrete load of a typical slab thickness.
0
0.1
0.2
0.3
0.4
0.5
0.6
0.7
0.8
0.9
1
0 0.2 0.4 0.6 0.8 1
Load
×100
%
Net Twist at Mid-Span (deg.)

133
• Proportioning interior and exterior overhang widths to produce zero net torque on the girder system will minimize the effects of the eccentric load due to the overhang loads.

134

135
Chapter 8. Effect of Local Plate Bending on Stability of Webs of Steel Girders
8.1 Introduction As discussed in Chapter 2, slab overhangs are generally supported by overhang brackets
during construction. In steel girders, the overhang brackets connect to the top flange with a hanger welded to the flange and then react on the web of the girder. The vertical shear from the overhang is transmitted primarily through a vertical component of the hangar force; however, some of the reaction also is transmitted through friction between the bracket and the web. The overhang moment that is caused by the eccentric load is resisted by the force couple that develops between the lateral component of the hangar force on the top flange and the portion where the bracket reacts on the steel web. Ideally, these overhang brackets should be positioned to react close to the bottom flange of the girder where the web plate is the stiffest. However, in current practice, the layout of the overhang brackets as well as the determination of the bracket reaction height from the bottom flange of the girder are often not specified by a designer but instead are left up to a contractor. Although the brackets do permit some adjustment so that the reaction points can be moved, the research team has found many cases where the overhang brackets were not adjusted and instead installed with the same configuration used in previous jobs. In many instances, the brackets react near the mid-depth of the web or may react on the compression zone of the web. Figure 8.1 shows the overhang brackets installed on the fascia girders at a transition bent. The same bracket depth used on the prestressed concrete girder was also used on the steel girder, regardless of the fact that the steel girder has a much deeper section. As a result, the bottom of the overhang brackets reacted at about the mid-depth of the steel girder, which is a very flexible point of the web. As discussed in the earlier chapters, overhang construction often causes an eccentric load, and consequently a torque, on the fascia girders. Specifically, the bottom of the overhang bracket exerts a lateral load on the web of the fascia girder. This lateral load can intensify imperfections in the web. The impact of the lateral force in the web plate is not well understood with respect to the structural performance of the steel girder.
Figure 8.1: Overhang Brackets Reacting at the Mid-Depth of Steel Girder Web

136
The purpose of this portion of the study is to investigate the impact of the bracket reaction force on the structural performance of the web. Parametric finite element analyses were conducted to improve the understanding of the structural behavior of the web subjected to overhang loads. The major factors that dominate lateral deformations of the web are identified and the design recommendations are provided for the geometry of the overhang bracket. Based upon the FEA investigation the impact of the overhang bracket reaction on the structural behavior of the fascia girder is evaluated.
8.2 Background To determine the effect of the bracket reaction on the girder web, a clear understanding of
the overhang load transfer mechanism is necessary. During the concrete deck placement, the fascia girder is subjected to the overhang load as depicted in Figure 8.2.
Figure 8.2: Eccentric Load from Fresh Concrete on Overhang
The overhang load, which is eccentric with respect to the center of the fascia girder, is transferred to the fascia girder through the overhang bracket. The overhang load comes from several sources including the weight of the formwork, fresh concrete, and the finishing equipment that is supported on the screed rail near the edge of the overhang. Although sources such as the construction personnel and finishing equipment do apply load through the overhang bracket, this load does not generally lead to force in the majority of the brackets as the concrete sets up. As a result these forces do not lead to web deformation that might get locked into the composite girder. Therefore, the primary force that is considered as leading to lateral force on the web will be the fresh concrete load. The overhang bracket usually reacts on the web, thereby resulting in the lateral deformation in the web. The overhang load in the net overhang width, which is defined as the distance from the edge of the top flange to the edge of the concrete deck, can be expressed as
= − (8.1)
Fresh Concrete
Overhang Bracket

137
where is the fresh concrete density, is the overhang width from center of the fascia girder to the edge of concrete deck, is half of the top flange width, and is the deck thickness. Equation (2.1) indicates that the eccentric load is linearly proportional to the net overhang width.
The fresh concrete load in the net overhang, that is depicted in Figure 8.3(a) produces the torque, , that is obtained by multiplying with its moment arm with respect to the flange edge, − /2.
= − /2 (8.2)
Substitution of Equation (2.1) into Equation (8.2) gives the following expression:
= − /2 (8.3)
Figure 8.3: Bracket Reaction Force
The eccentric overhang load, , can be replaced with the equivalent overhang load system as shown in Figure 8.3(b). The equivalent overhang load system in Figure 8.3(b) consists of the vertical component, , and a force couple, ℎ . Equating a force couple, ℎ , with Equation (8.3) , the component of the force couple, , becomes
= −2ℎ (8.4)
For a given concrete weight density and a given deck thickness, the bracket reaction
force, , is quadratically proportional to the net overhang width and inversely proportional to the vertical dimension of the overhang bracket. Therefore, larger net overhang width will lead to
ℎ
(a) Eccentric Overhang Load (b) Equivalent Overhang Load System
ℎ
− /2

138
larger bracket reaction force. In addition, the bracket reaction force becomes theoretically infinite as the vertical dimension of the overhang bracket approaches the top flange. Therefore, as expected, larger vertical dimensions of overhang brackets are more effective for minimizing the bracket reaction force.
8.3 FEA Modeling The structural behavior of the web in the girder subjected to the torque from the overhang
was studied by using finite-element modeling techniques as described in Chapter 3 (ANSYS 2009). The large displacement analyses were conducted with an assumption of linear elastic materials, which is appropriate because the stresses in the web due to torque from the overhang are well below yield. The girder cross section that were used in FEA models are shown in Figure 8.4. All sections are doubly symmetric, and all dimensions of each section are identical with each other except for the depth of the web. The depths of the web of Sections D38, D56, and D75 are 37.5 in., 56.25 in., and 75 in., respectively. As shown in Table 8.1, the web slenderness ratios are within the practical range of the web slenderness commonly used in bridge construction and were proportioned to study the effects of the web slenderness on the web behavior. The slenderness ratios of Sections D56 and D75 are 1.5 times and 2 times as large as that of D38, respectively. The webs of Sections D38, D56, and D75 are classified as compact, non-compact and slender, respectively, in accordance with AASHTO/LRFD (2007). The flanges, which are the same for all the sections, have a flange slenderness of eight, and are classified as compact in accordance with AASHTO/LRFD (2007).
Figure 8.4: Cross-Sections Studied
56.25˝
75˝
37.5˝
1.25˝ 1.25˝ 1.25˝
1.25˝
1.25˝
1.25˝ 0.5˝
0.5˝
0.5˝
20˝ 20˝
20˝
20˝
20˝
20˝
D38 D56 D75

139
The three dimensional finite element model of a typical girder is shown in Figure 8.5. Transverse web stiffeners that are depicted in light blue in the figure were used both at the supports and along the length of the girder. The stiffeners have a thickness of 0.5 in. and a width equal to 90% of half of the flange width. Eight-node shell elements were used to model the cross sections of the girder and the transverse web stiffeners. The transverse web stiffeners did not provide any warping restraint to the top and bottom flanges of the girder because they were detached from the flange nodes. The lateral bracing was provided at both top and bottom flanges at every 5 feet to prevent the lateral-torsional buckling of the girder during the analysis. The FEA girder model was simply supported, and the section was free to warp at the supports.
Figure 8.5: Finite Element Model for Steel Fascia Girder
The girder self-weight was applied by using the gravitational acceleration, and the concrete deck load was applied to the top flange of the girder. The fresh concrete deck load included the loads in the overhang, in the slab haunch and in the interior deck for a girder spacing of 5 ft. The equivalent load system that was explained in the previous section was utilized to simulate the torque due to the overhang load, which forms a force couple in the horizontal direction parallel to the flange plane. The one component of the force couple was applied to the top flange of the girder and the other component of the force couple was applied to the web where the overhang bracket reacts.
Table 8.2 summarizes the parameters and their ranges that were used in the parametric FEA studies. AASHTO/Standard (2002) requires that the ratio of web depth to span length be less than 1/25. Thus, while the span length of D38 was 60 ft, the span length of D56 and D75 was 120 ft. The web slenderness ratios included 75, 113, and 150. For the overhang bracket reaction height, five different locations were chosen and were evenly spaced along the depth of the web. Overhang widths from the center of the girder to the edge of the slab were 3 ft. and 4 ft. The stiffener spacing varied from 10 ft to 30 ft.

140
In addition to the main parameters for the FEA studies summarized in Table 8.2, the effects of the flange width and web imperfections were also considered. Because the flange width of 20 in. listed in Table 8.1 may be practically large, particularly for the Section D38, smaller flange widths were also considered. AASHTO/LRFD (2007) requires that the ratio of flange width to web depth be larger than 1/6. Thus, the ratio of flange width to web depth was adjusted to be 1/5 for narrow flanges, which is slightly larger than the minimum value of 1/6. The narrow flanges for Section D38, D56, and D75 were 7.5 in., 11.25 in. and 15 in. wide, respectively.
Table 8.1: Dimensional Properties of Cross Sections Studies
Type Parameter Symbol Unit D38 D56 D75
Web
Web Thickness tw inch 0.5 0.5 0.5
Web Depth D(=dw) inch 37.5 56.25 75
Web Slenderness λw - 75 113 150
Web Area Aw in.2 18.75 28.13 37.5
Flange
Flange Thickness tf inch 1.25 1.25 1.25
Flange Width bf inch 20 20 20
Flange Slenderness λf - 8 8 8
Area Af in.2 25 25 25
Deformation Fabrication Imperfection Limit ∆ (= 150) inch 0.25 0.35 0.50
Table 8.2: Parameters and Their Ranges
Parameter Range Span Length 60 ft (D38), 120 ft (D56 and D75) Web Slenderness Ratio 76, 113 and 150 Bracket Reaction Height 5 different positions along depth of girder Overhang Width 3 and 4 ft Stiffener Spacing 10 ft and 30 ft Load girder self-weight and fresh concrete load

141
Figure 8.6: Web Plate Imperfection for Girder Model (Rescaled)
The initial imperfections were applied to the web to consider the effects of the initial web imperfections on the web behavior. The key factors concerning the application of web imperfections were the magnitude and shape of the imperfection in the web. The American Welding Society (AWS) D1.5 Specifications (2008) have a limit of D/150 (D: depth of web) plate tolerance that was adopted as a reference for the selection of the magnitudes of initial imperfections for the FEA models. The imperfections were applied to the web in the same direction as the overhang bracket reaction force because the bracket reaction force will tend to intensify the imperfections in the same direction as the bracket reaction force.
The determination of the web imperfection shape for the FEA models required the preliminary finite element analysis for the perfect FEA model that had no imperfection. The preliminary analysis for the perfect FEA model was conducted by fixing the edge nodes of each web segment between transverse stiffeners and applying the lateral displacement of a maximum imperfection at the center node of each web segment. The imperfection shape in the web was obtained by updating the geometry of the perfect FEA model on the deformations from the preliminary analysis results. As an example, the web plate imperfection shape for a plate girder model is depicted in Figure 8.6 with the magnitude of the imperfection greatly amplified. Although the impacts of imperfections on the web performance were investigated, most of the results that are presented in this chapter were for perfectly flat webs so that the effect of the various parameters could be investigated. At the end of the chapter, the effects of the web plate imperfections are demonstrated.
8.4 FEA Results and Discussions Large displacement analyses were conducted on girders with the full range of the
parametric set listed in Table 8.2. Unless specified otherwise, the FEA girder models that are discussed in this section had no imperfection in the web. The typical overhang width of 3 ft was used for all the graphs presented in this section except for the graphs that demonstrate the effects of the overhang width on the web behavior.
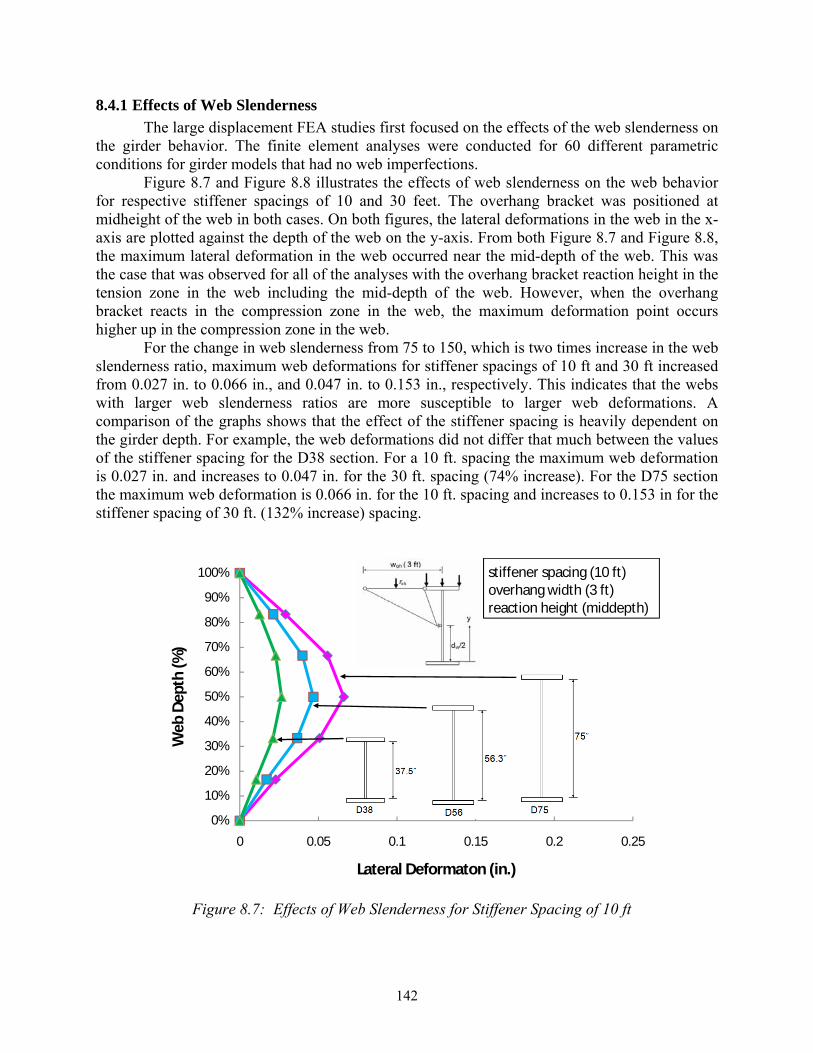
142
8.4.1 Effects of Web Slenderness
The large displacement FEA studies first focused on the effects of the web slenderness on the girder behavior. The finite element analyses were conducted for 60 different parametric conditions for girder models that had no web imperfections.
Figure 8.7 and Figure 8.8 illustrates the effects of web slenderness on the web behavior for respective stiffener spacings of 10 and 30 feet. The overhang bracket was positioned at midheight of the web in both cases. On both figures, the lateral deformations in the web in the x-axis are plotted against the depth of the web on the y-axis. From both Figure 8.7 and Figure 8.8, the maximum lateral deformation in the web occurred near the mid-depth of the web. This was the case that was observed for all of the analyses with the overhang bracket reaction height in the tension zone in the web including the mid-depth of the web. However, when the overhang bracket reacts in the compression zone in the web, the maximum deformation point occurs higher up in the compression zone in the web.
For the change in web slenderness from 75 to 150, which is two times increase in the web slenderness ratio, maximum web deformations for stiffener spacings of 10 ft and 30 ft increased from 0.027 in. to 0.066 in., and 0.047 in. to 0.153 in., respectively. This indicates that the webs with larger web slenderness ratios are more susceptible to larger web deformations. A comparison of the graphs shows that the effect of the stiffener spacing is heavily dependent on the girder depth. For example, the web deformations did not differ that much between the values of the stiffener spacing for the D38 section. For a 10 ft. spacing the maximum web deformation is 0.027 in. and increases to 0.047 in. for the 30 ft. spacing (74% increase). For the D75 section the maximum web deformation is 0.066 in. for the 10 ft. spacing and increases to 0.153 in for the stiffener spacing of 30 ft. (132% increase) spacing.
Figure 8.7: Effects of Web Slenderness for Stiffener Spacing of 10 ft
0%
10%
20%
30%
40%
50%
60%
70%
80%
90%
100%
0 0.05 0.1 0.15 0.2 0.25
Web
Dep
th (%
)
Lateral Deformaton (in.)
stiffener spacing (10 ft)overhang width (3 ft)reaction height (middepth)

143
Figure 8.8: Effects of Web Slenderness for Stiffener Spacing of 30 ft
8.4.2 Effects of Overhang Bracket Reaction Height
As mentioned earlier, although it is preferable for the overhang bracket to react near the bottom flange of the girder, in many situations, the brackets have been observed to react near midheight of the web. The FEA models that addressed the issues of bracket reaction heights allowed the five different reaction locations for overhang brackets that were evenly spaced along the depth of the web.
Figure 8.9 and Figure 8.10 demonstrates how the overhang bracket reaction height affects the web deformation in the girder subjected to overhang loads. Figure 8.9 and Figure 8.10 show the results for girder section of D38 and D75, respectively. The web deformation profiles in the graphs were nondimensionalized with respect to the corresponding imperfection tolerances listed in Table 8.1. Although the FEA girder models allowed the five different reaction locations for overhang brackets, both figures show the results for only three of the different reaction locations for clarity. The values that are shown are for reactions at one sixth, half, and the five sixths of the web depth.
0%
10%
20%
30%
40%
50%
60%
70%
80%
90%
100%
0 0.05 0.1 0.15 0.2 0.25
Web
Dep
th (%
)
Lateral Deformaton (in.)
stiffener spacing (30 ft)overhang width (3 ft)reaction height (middepth)

144
Figure 8.9: Effects of Overhang Bracket Reaction Height for Girder Type D75
Figure 8.10: Effects of Overhang Bracket Reaction Height for Girder Type D38
The web deformations for reactions at 1/3 and 2/3 of the web depth follow the general trend shown in the figures with the location of the maximum deformation shifting up as the reaction point shifted up.
Both graphs show that web deformations increase as the overhang bracket reacts closer to the top flange of the girder. There are two potential contributing factors for the larger deformation as the reaction point shifts upward. The most significant factor is most likely
0%
10%
20%
30%
40%
50%
60%
70%
80%
90%
100%
0% 20% 40% 60% 80% 100%
Web
Dep
th (%
)
(Lateral Deformaton )/(0.5 in.) (%)
girder type D75overhang width (3 ft)stiffener spacing (10 ft) Imperfection Limit (0.5 in.)
0%
10%
20%
30%
40%
50%
60%
70%
80%
90%
100%
0% 20% 40% 60% 80% 100%
Web
Dep
th (%
)
(Lateral Deformaton )/(0.25 in.) (%)
girder type D38overhang width (3 ft)stiffener spacing (10 ft)imperfection limit (0.25 in.)

145
because the magnitude of the lateral force required increases as the bracket reaction shifts upward as the moment arm between the force couple is reduced. The other contributing factor is because the compressive stress in the upper portion of the web makes the plate more flexible. In order to investigate which factor makes more contribution to the effects of the bracket reaction height, the approach of a unit line load was introduced into the finite element analyses. In this approach, the same unit line load, 1 kip/ft., was laterally distributed to the web at the five different bracket reaction heights as well as the edge of the top flange.
Essentially, this approach can tell which reaction point in the web for the same lateral load is the most susceptible to web deformation. Figure 8.11 shows the FEA results that demonstrate the effect of the loading point on the web deformation. The web deformation profiles for the loading points at the one sixth and the five sixths of the web depth are almost symmetric about the mid-depth of the web, with the maximum web deformation for the compression zone loading slightly larger than that for the tension zone loading. This indicates that the loading point in the compression zone in the web does not intensify the web deformation significantly. Therefore, it can be concluded that for construction load levels, the effects of the overhang bracket reaction height on the web deformation is mainly due to the magnitude of the overhang bracket reaction. The magnitude of the overhang bracket reaction force can be significantly reduced by adjusting the vertical dimension of the overhang bracket. As shown in Equation (8.4), longer vertical dimensions of overhang brackets generate smaller reaction forces for the web, thereby minimizing web deformations. Because the overhang framing into middepth of the web is the worst case, all of the FEA results presented in the remainder of this chapter are for the case of the overhang bracket framing into middepth of the web. Cases in which the overhang bracket frames into a different location on the web will result in a different deformation profile; however, the basic trends in the behavior will be the same.
Figure 8.11: Effects of Loading Point for Girder Type D75
0%
10%
20%
30%
40%
50%
60%
70%
80%
90%
100%
0 0.2 0.4 0.6 0.8 1
Web
Dep
th (%
)
Lateral Deformaton (in.)
girder type D75overhang width (3 ft)stiffener spacing (10 ft)

146
8.4.3 Effects of Stiffener Spacing
The nonlinear large displacement FEA analyses also investigated the effects of the stiffener spacing on the girder behavior. Figure 8.12 shows the FEA results for girder type D75 that illustrate the effects of the stiffener spacing on the web deformation, and the FEA results for other girder types are presented in Appendix D. As expected, the larger stiffener spacing caused more web deformation as shown in the figure. This indicates that transverse web stiffeners play a role in restraining the lateral deformation in the web. The change in the stiffener spacing from 10 feet to 30 feet more than doubled the amount of web deformation. This trend was similar for the other two girder types of D38 and D56. However, the increase in the stiffener spacing for D38 and D56 affects the increase in web deformation less than that for D75.
Figure 8.12: Effects of Stiffener Spacing for Girder Type D75
8.4.4 Effects of Overhang Width
Figures 8.13 and 8.14 use FEA results to illustrate the effects of the overhang width on the web deformation. Figures 8.13 and 8.14 describe FEA results for girder types of D36 and D75, respectively. As expected, the web deformation increased with the overhang width. The change in the overhang width from 3 ft. to 4 ft. resulted in approximately 2.3 times more web deformation. This shows that the web deformation is significantly influenced by the overhang width. For a given girder depth, the impact of the larger overhang can come in two areas. A wider overhang obviously has a larger gravity load due to the increase in the amount of concrete on the overhang. In addition, if the diagonal frames into midheight of the web panel for both overhang widths, the difference in geometry can also amplify the overhang force. The larger width will have a smaller angle for the diagonal of the overhang bracket, which therefore increases the diagonal force due to the different geometry.
0%
10%
20%
30%
40%
50%
60%
70%
80%
90%
100%
0% 20% 40% 60% 80% 100%
Web
Dep
th (%
)
(Lateral Deformaton )/(0.5 in.) (%)
stiffener spacing (30 ft)
stiffener spacing (10 ft)
girder type D75overhang width (3 ft)reaction height (middepth)Imperfection Limit (0.5 in.)

147
Figure 8.13: Effects of Overhang Width for Girder Type D38
Figure 8.14: Effects of Overhang Width for Girder Type D75
8.4.5 Effects of Top Flange Width
As discussed in the Section 8.2, smaller top flange widths result in larger overhang loads for a given overhang width. The increase in force is due to the larger distance from the edge of the top flange to the edge of the concrete deck, which is the net overhang width. Figure 8.15 shows FEA results for girder type D38 that demonstrate the effects of the top flange width on the
0%
10%
20%
30%
40%
50%
60%
70%
80%
90%
100%
0% 20% 40% 60% 80% 100%
Web
Dep
th (%
)
(Lateral Deformaton )/(0.5 in.) (%)
girder type D75stiffener spacing (10 ft)reaction height (middepth)
overhang width (4 ft)
overhang width (3 ft)
0%
10%
20%
30%
40%
50%
60%
70%
80%
90%
100%
0% 20% 40% 60% 80% 100%
Web
Dep
th (%
)
(Lateral Deformaton )/(0.25 in.) (%)
girder type D38stiffener spacing (10 ft)reaction height (middepth)
overhang width (4 ft)
overhang width (3 ft)

148
web behavior. The 7.5 in. wide flange is a 62.5% decrease in the top flange width compared to the 20 in. flange and the smaller flange had a 75% average increase in the web deformation. The increase in the web deformation is caused by the larger lateral load and also by the smaller torsional restraint provided to the web by the smaller flange.
Figure 8.15: Effects of Top Flange Width for Girder Type D38
8.4.6 P-Delta Effect
The web in the fascia girder with the overhang loads is subjected to a complicated state of stress from the combined bending and lateral load from the overhang. In-plane bending of the girder results in a linear stress distribution with compression in the upper portion of the web and tension in the lower portion. In addition, the lateral load from the overhang causes out-of-plane bending in the web plate. This loading condition creates P-delta effects for the web similar to the case for a column subjected to axial load combined with the bending moment that results in an increase in the moment and lateral deflection in the column. This P-delta effect is illustrated in Figure 8.16. The girder had an overhang width of 3 ft with the overhang bracket reacting at the mid-depth of the web. While the girder represented by the deformation profile in blue was subjected to both the vertical load and the lateral load, the girder represented by the deformation profile in pink was subjected to only the lateral load. Although the web with the combined loading experienced more lateral deformations, the P-delta effect was not too significant. The case shown is for the girder with the most slender web. The P-delta effects for the other two girder sections were smaller.
0%
10%
20%
30%
40%
50%
60%
70%
80%
90%
100%
0% 20% 40% 60% 80% 100%
Web
Dep
th (%
)
(Lateral Deformaton )/(0.25 in.) (%)
girder type D38overhang width (3 ft)stiffener spacing (10 ft)imperfection limit (0.25 in.)
flange width (20 in.)
flange width (7.5 in.)

149
Figure 8.16: P-Delat Effect for Girder Type D75
8.4.7 Effects of Web Imperfections
Plate girders with initial web imperfections in the web were investigated. The direction of the imperfections was considered to be the same as the overhang bracket reaction force. Nonlinear large-displacement finite element analyses (FEA) were performed on selected plate girder models. The imperfections in the web plates were obtained as outlined in Section 8.3. Comparisons of the FEA results between perfect girders and girders with initial web imperfections are shown in Figure 8.17 where the solid-line curves and the dotted-line curves represent a perfect girder and a girder with initial imperfections, respectively. The graph shows that although there was a slight change in the web deformation profiles, the effects of web imperfections were relatively small. The shifts in the curves are primarily caused by P-delta effects; however as was outlined in the last section, the P-delta effects were relatively small. Therefore, increasing the plate deformation by a value equal to the maximum permissible imperfection had a relatively small effect. The main area that is impacted is the upper portion of the web where the web is in compression. However, the impact is not very significant.
0%
10%
20%
30%
40%
50%
60%
70%
80%
90%
100%
0% 20% 40% 60% 80% 100%
Web
Dep
th (%
)
(Lateral Deformaton )/(0.5 in.) (%)
girder type D75overhang width (3 ft)stiffener spacing (10 ft)imperfection limit (0.5 in.)

150
Figure 8.17: Effect of Web Imperfections
8.5 Closing Remarks The investigation into the behavior of steel fascia girders subjected to overhang loads
during construction was conducted to improve the understanding on the impact of the overhang on the structural performance of the steel girders. Extensive parametric studies were conducted using the finite-element analyses with a wide range of variables. Based upon the study, the following conclusions were reached:
• Web deformations resulting from overhang brackets reacting on the web plate increase with increases in the web slenderness.
• Web deformations increased as the overhang bracket reacted closer to the top flange of the girder. For a given overhang width, the primary cause of the increase in web deformations was due to the fact that the bracket reaction increases as the bracket diagonal reacts higher on the web. The magnitude of the overhang bracket reaction force can be significantly reduced by adjusting the vertical leg for the overhang bracket, thereby resulting in smaller web deformations.
• The transverse web stiffener helps to restrict the web deformations caused from the overhang brackets reacting on the web plate. A smaller stiffener spacing produces smaller web deformation. The effects of the stiffener spacing are more pronounced for webs with larger values of the web slenderness.
• Web deformations increase with the overhang width. In addition, for a given overhang width, smaller top flange widths result in larger net overhang widths, thereby leading to more web deformation.
• Fascia girder webs with overhang loads are subjected to combined loading of vertical bending and lateral loads from the overhang bracket. Although the compression
0%
10%
20%
30%
40%
50%
60%
70%
80%
90%
100%
0 0.05 0.1 0.15 0.2 0.25
Web
Dep
th (%
)
Lateral Deformaton (in.)
stiffener spacing (10 ft)overhang width (3 ft)reaction height (middepth)
perfect sections
imperfect sections

151
portions of the web with the combined loading experienced more lateral deformation, the P-delta effect on the web deformation was not too significant.
• The imperfections on the webs in the girders produced a change in the web deformation profile for a girder without web imperfections. However, the effects of the web imperfection were relatively small.
• Finally, the overhang width, the overhang bracket reaction height, the web slenderness, and the stiffener spacing were the dominating factors for the lateral deformation in the web in the girder that is subjected to the overhang load. Although these dominating factors intensified web lateral deformation, the range of lateral deformations in the web for the cross sections studied was below the fabrication imperfection limit of D/150 specified in the Bridge Welding Code from the American Welding Society (2008). In finished bridges, a web with an imperfection in the same direction as the lateral deformation imposed by the overhang bracket is likely to have web deformations larger than the D/150 limit, although the effects are most likely relatively minor.

152

153
Chapter 9. Summary and Conclusions
9.1 Summary Overhang construction can pose several problems for both concrete and steel girder
systems. Current design methodologies in bridge design don’t often consider the overhang demands on bridge behavior, but instead utilize typical details. The construction loads in these overhangs are transferred to the fascia girder through overhang brackets. The specific layout of the overhang brackets are often left up to the contractor. Because of the relatively large eccentricity of the overhang load, the fascia girders on concrete and steel girder systems are often subjected to large torques that are often not considered by engineers during the design process. These torques can cause excessive rotations of the girder system that should be considered during the design process. Problematic deformations have occurred in both concrete and steel girder systems in Texas. The large torques have caused the fascia girder in a prestressed concrete girder bridge to lift off of the bearing pads during construction and also caused a twin steel girder system in a bridge widening to nearly fail by system lateral torsional buckling. In addition, there were concerns that the reaction forces from overhang brackets could distort the web, thereby leading to local instabilities or large web imperfections that get locked into the girders once the deck cures.
The research presented in this report was part of a research investigation sponsored by the Texas Department of Transportation (TxDOT) to investigate the effects of overhang construction on the behavior of concrete and steel girder systems.
The primary goals of the research project included improving the understanding of bridge behavior due to overhang loads, identifying critical overhang geometries as a function of the overhang loading, evaluating the global and local instabilities of steel girder systems, and developing simple design methodologies and design recommendations for overhang construction.
The research investigation included field monitoring, laboratory testing, and parametric finite element analyses. Three bridges were instrumented and monitored during the concrete deck pour to collect data that was used to validate finite element models that were used to study the effects of overhang construction on the bridge behavior. In addition to the field studies, laboratory tests were conducted on elements of concrete girder systems at the Phil M. Ferguson Structural Engineering Laboratory at The University of Texas at Austin. The tests consisted of lateral stiffness and strength tests on the bracing bar systems used to restrain prestressed concrete girders, overturning tests on a prestressed concrete beam with elastomeric bearing pads, and rotational tests of the girder and panel deck system. The laboratory testing provided valuable data for the FEA models for the concrete bridges that were used to clarify several uncertainties in the modeling of key elements in concrete girder systems.
Based on the validated models, detailed parametric studies were conducted to investigate the effects of the overhang loading on girder behavior. Results from the parametric studies were used to identify the geometries of girder systems that are prone to problems with the overhangs as well as to provide design suggestions. In addition, a closed-form solution for lateral rotation in the fascia girder in a concrete girder bridge was derived by using a rigid-body model and used to develop design methodologies and recommendations for overhang construction.

154
9.2 Conclusions The conclusions of the research study are summarized in this section. The study resulted
in substantial improvement in the understanding of the overhang construction on the structural behavior of the bridge girder systems. The identification of critical overhang geometries was achieved along with the development of design equations and recommendations for overhang construction. The conclusions are provided in three subsections. The summary and recommendations for prestressed concrete girder systems are provided first, followed by global buckling of steel girder systems, and the last subsection provides a summary of local effects of steel girder webs. Specific recommendations for design are made in Section 9.3.
9.2.1 Prestressed Concrete Girder Systems
Based upon the studies of overhang construction on concrete girder systems, the following conclusions can be made:
• The lateral stiffness of the R-bars was small compared to the axial stiffness of the top bracing bar. In addition, the strength of the R-bar and connection to the bracing bar were significantly smaller than the yield capacity of the bracing bar. This indicates that the lateral stiffness and capacity of top bracing are governed by the R-bar.
• The maximum rotation that the AASHTO Type C beam sustained in the laboratory tipping test was approximately 2.5 degrees. This would likely be a typical value for most prestressed concrete beams.
• Three different connection configurations were evaluated in the laboratory including the TxDOT standard connection in Figure 9.1. The other two connections are more representative of the connection that is commonly used in practice in which the bracing bar passes over the top of the precast deck panels and is bent to connect to the R-bar. The Standard connection configuration possessed a higher stiffness and was also stronger than the connections that are used in practice. The connections that are used in practice exhibited better ductility than the standard connection.
• Forces in the diagonal timber blocking were very small and often zero in the analysis. The diagonal timber blocking does not provide restraint to twisting of the girders due to a lack of positive connection between the girders and the timbers. The primary role of the timber blocking is to distribute lateral loads between the girders. With symmetric overhang loads and geometry, the horizontal bottom strut does distribute lateral compressive loads from opposing overhangs.
• While conventional Beam Types IV and VI showed good rotational response for a typical overhang width of 3 ft, conventional Beam Types A, B and C experienced excessive beam rotations. In comparison, all of the Tx I-girders showed good rotational response for a typical overhang width of 3 ft.
• Two different distributions of top bracing bars were considered in the investigation. The first case had the bracing distributed uniformly along the length (distributed bracing). The second case had the bracing concentrated at the ends of the beam (end bracing). End bracing can provide a good alternate for the distributed bracing that is

155
currently required by the TxDOT standard drawings. End bracing also allows the contractor to use the bracing detail of the Standard connection in Figure 9.1(a) that is found in the TxDOT standard drawings as a thickened deck can be used for this connection type.
• Larger girder spacing leads to more restoring moment to the fascia girder of the girder system.
• Larger beams showed better performance at resisting twist from the eccentric overhang due to the wider top flange, the wider bearing pad, and the larger beam self-weight.
• The rigid-body model that was developed for predicting the twist of the girder had reasonable agreement with the FEA analysis. The model can be used to evaluate the girder twist during construction. The model can also be used to determine the amount of bracing necessary to restrain the twist during construction. Values for the stiffness and strength of key elements of the prestressed girder system are provided in Section 9.3.1 for design recommendations.
Figure 9.1: Connection Configurations for Top Bracing
9.2.2 System Buckling of Steel Girder Systems
The instability of twin girder systems such as those used in bridge widening with combined flexure and torsion due to unbalanced overhang loads was investigated, and the parametric FEA studies were carried out on steel twin-girder systems to improve the understanding of the behavior. A closed-form solution for self-equilibrating overhang width of the twin girder system was derived and compared with the computational solutions. Conclusions from these studies are as follows:
• The unbalanced eccentric overhang load leads to a significant amount of lateral displacement and twist of twin girder systems and should be taken into consideration in the design of systems for bridge widening applications or other cases with unbalanced loading on girder systems.
• For girder systems failing in the global system buckling mode, the spacing of intermediate cross-frames did not have a significant impact on the buckling behavior of the girder systems that were considered.
Top Bracing Bar
R-bar
Top Bracing Bar 30˚
R-bar
Top Bracing Bar 50˚
R-bar
(a) Standard (b) Inclined Top (c) Inclined Bottom

156
• The system mode of buckling becomes more critical for smaller girder spacings, larger span to width ratios of the girders, and larger overhang widths.
• Proportioning interior and exterior overhang widths to produce zero net torque on the girder system will minimize the effects of the eccentric load due to the overhang loads.
9.2.3 Local Stability of Web of Steel Girders
The investigation into the steel fascia girder that is subjected to the construction overhang loads was conducted to improve the understanding of the structural behavior of the web in the girder. The extensive parametric studies by using the finite-element analyses were performed over the wide range of parameters, and produced the following conclusions.
• Girders with a larger web slenderness experienced larger web deformations from the overhang brackets reacting on the web.
• For a given overhang size and girder depth, web deformations increased as the overhang bracket reacted closer to the top flange of the girder. The larger deformations were caused by the increase in the bracket reaction that occurs as the spacing between the force couple from the overhang bracket decreased. The magnitude of the overhang bracket reaction force can be significantly reduced by adjusting the vertical dimension of the overhang bracket, thereby resulting in smaller web deformations.
• The overhang width, the overhang bracket vertical dimension, the web slenderness and the stiffener spacing were the dominating factors for the lateral deformation in the web in the girder subjected to the overhang load.
• The range of lateral deformations in the web for the cross sections studied was below the fabrication imperfection limit of D/150 specified in the Bridge Welding Code from the American Welding Society (2008).
9.3 Design Recommendations The study improved the understanding of the impact of overhang construction on the
structural behavior of the bridge girder systems. Based on the research results from field monitoring, laboratory testing, and analytical studies, design recommendations for overhang construction in concrete and steel bridges can be proposed and are summarized in the following subsections.
9.3.1 Prestressed Concrete Girder Systems
• The connection types for top bracing bars included two types of connections that are referred to as the flexible connection and the stiff connection. The flexible connection is representative of the actual connection configuration typically used in practice for the top bracing bar while the stiff connection is the connection configuration specified by the TxDOT standard drawings. The flexible connection is used because the widespread use of precast concrete panels makes it difficult to implement stiff connection. Both connection types are recommended to be used for bracing for concrete girder systems through the adequate amount of bracing

157
determined by the proposed overhang design equation. The stiff connection can generally be used in the end regions of the beams where the thickened end may be used without the deck panels.
• Two top bracing distributions were considered: bracing distributed along the length of the bridge and end bracing. For the case of the distributed bracing, the top bracing bars were uniformly distributed along the girder length, while for the end bracing, the top bracing bars were concentrated at each end of the girder. The method of end bracing can provide an alternative over distributed bracing that is currently required by TxDOT standard drawing. The end bracing method is recommended especially when the concrete deck panels are not used at the thickened ends and the stiff connection is to be implemented.
• The horizontal timber blocking in combination with the top bracing bars is much more effective at restraining rotation of the girder than the diagonal timber blocking. The horizontal timber blocking combined with top bracing provides restoring moment to the fascia girder. Therefore, horizontal timber blocking is recommended to be used for bracing of girder systems at the locations of the top bracing bars.
• The rigid-body model is recommended to be used for evaluating the safety of concrete girder systems subjected to overhang construction loads. Key values of the bearing stiffness, the stiffness of the timber blocking, and the R-bar/bracing bar stiffness are given in Table 9.1
Table 9.1: Design Values for Structural Components in Girder Systems Top Bracing
Connection Type Stiffness Strength Note
Stiff 39 (kip/in.) 3 (kips) R-bar (#4), Top Bracing Bar (#5)
Flexible 15.5 (kip/in.)
1.2 (kips)
Timber Blocking Young's Modulus
Cross Sectional Area
Timber Size (4 by 4 in.)
700 ksi 12.25 in.2
Bearing Pads
Beam Type Pad Size Compressive Stiffness per Width
Lateral Stiffness
Length Width
Conventional I-Beams
7 in. 12 in. 31.2 ((kip/in.)/in.) 3.2 (kip/in.)
7 in. 14 in. 34.7 ((kip/in.)/in.) 3.7 (kip/in.)
7 in. 16 in. 37.8 ((kip/in.)/in.) 4.3 (kip/in.)
7 in. 22 in. 44.9 ((kip/in.)/in.) 5.9 (kip/in.)
9 in. 24 in. 87.4 ((kip/in.)/in.) 8.3 (kip/in.)
Tx I-Girders 8 in. 21 in. 60.9 ((kip/in.)/in.) 6.4 (kip/in.)
9 in. 21 in. 81 ((kip/in.)/in.) 7.2 (kip/in.)
10 in. 21 in. 104 ((kip/in.)/in.) 8 (kip/in.)

158
9.3.2 System Buckling of Steel Girder Systems
• Steel girder systems with a relatively large length to width ratio combined with unbalanced load from the overhangs are susceptible to the system mode of buckling that is critical during construction of the bridge deck. Therefore, the unbalanced ovehang load should be taken into consideration for design of systems in bridge widening applications or other cases with unbalanced loading on girder systems
• For system buckling, proportioning the interior and exterior overhang widths to produce zero net torque on the girder system is suggested to minimize the effects of the eccentric overhang loads.
9.3.3 Effects of Overhang Brackets on Local Deformations in Web Plates
• For a given overhang width, the overhang bracket that reacts close to the top flange can produce substantial lateral reaction force on the web. Therefore, the use of the large ratio of overhang bracket vertical dimension to overhang width, which often results in overhang brackets reacting close to the bottom flange, is recommended to minimize the bracket reaction force.
• The overhang width, the overhang bracket reaction height, the web slenderness, and the stiffener spacing were the dominating factors for the lateral deformation in the web in the girder that is subjected to the overhang load. Although these dominating factors intensified web lateral deformation, the range of lateral deformations in the web for the cross sections studied was below the fabrication imperfection limit of D/150 specified in the Bridge Welding Code from the American Welding Society (2008). In finished bridges, a web with an imperfection in the same direction as the lateral deformation imposed by the overhang bracket is likely to have web deformations larger than the D/150 limit, although the effects are most likely relatively minor.

159
Appendix A: System Buckling of Twin-Girder System
A.1 Lateral Torsional Buckling of a Single Girder in Pure Bending
Prior to discussing the system buckling mode, the classical solution for the lateral torsional buckling of a single girder that is subjected to pure bending is reviewed (Timoshenko and Gere, 1961). Figure A.1 shows the doubly symmetric beam that is simply supported with constant moment. At both ends, the twist of the beam is prevented but the beam is free to warp. The basic assumptions include linear-elastic material, small deformation and no cross-section distortion. When the lateral torsional buckling occurs to the beam, the beam will experience three distinct deformations that are in-plane bending (vertical bending), out-of-bending (lateral bending), and the twist of the cross-section as shown in the Figure A.2.
Figure A.1 Simply Supported Beam Subjected to Pure Bending
y M M
y

160
Figure A.2 Deformed Configurations in Lateral Torsional Buckling Mode
The global coordinate system of x, y and z coordinates is introduced along with the local coordinate system of ξ, η and ζ coordinates. While the global coordinate system is fixed, the axes of the local coordinate system coincide with the centroidal axes of the deformed beam. The positions of the local axes of the beam are defined by the vertical displacement, v, in the y-direction, the lateral displacement, u, in the x-axis, and the rotation, φ, about the z-direction. The applied external moment, which is about the x-axis, can be related to the internal resisting moments with respect to ξ, η and ζ axes.
M
/
M M
y
/
M
MM
M
v
φ
y
x
centroid
(a) Elevation View
(b) Top View
(c) Cross Section View

161
M = Mφ (A.1)
M = −Mφ (A.2)
M = M dudz (A.3)
The application of the Euler beam theory gives the three governing differential equations of equilibrium.
M = −EI d vdz (A.4)
M = EI d udz (A.5)
M = GJ dφdz − EI d φdz (A.6)
Substitution of Equations (A.1) to (A.3) into Equations (A.4) to (A.6) gives
EI d vdz + M = 0 (A.7)
EI d udz + Mφ = 0 (A.8)
GJ dφdz − EI d φdz − M dudz = 0 (A.9)
Equation (A.7) represents the in-plane bending behavior of the beam. Since Equation (A.7) is a function of the vertical displacement, v only, the solution to the equation (A.7) can be obtained independently from the other two Equations (A.8) and (A.9). The second and third equations that describe the lateral bending and twisting behavior of the beam, respectively, are coupled with each other and must be solved simultaneously. Differentiation of Equation (A.9) and substitution of the result into Equation (A.8) gives the differential equation that is a function of the twist rotation, φ only.
EI d φdz − GJ d φdz − MEI φ = 0 (A.10)
Equation (A.10) that describes the lateral torsional buckling behavior of the beam is a fourth-order linear differential equation with constant coefficients. By denoting “a” and “b” as
a = GJ2EI , b = MEI EI (A.11)
Substitution of Equation (A.11) into Equation (A.10) gives
d φdz − 2a d φdz − bφ = 0 (A.12)

162
The general solution for Equation (A.12) can be assumed as
φ = A sin(mz) + Bcos(mz) + Csinh(nz) + Dcosh(nz) (A.13)
where m and n are positive, real quantities that are functions of a and b.
m = −a + a + b, n = a + a + b, (A.14)
The four arbitrary constants in Equation (A.13) can be determined by using the boundary conditions for a simply supported beam. The prevention of the twist of the beam at each end and the allowance of the warping deformation of the beam at each end provide the following conditions.
a) z = 0, φ = 0
(A.15) b) z = 0, φ" = 0 c) z = L, φ = 0 d) z = L, φ" = 0
By using the first two boundary conditions in Equation (A.15), the constants B and D are determined as
B = D = 0 (A.16)
Substitution of Equation (A.16) into Equation (A.13) and the application of the other two boundary conditions give the following equations.
A(m + n ) sin(mL) = 0
(A.17) C(m + n ) sinh(nL) = 0
Because m and n are both positive non-zero values and sinh(nL) is zero only if nL = 0, C must be zero. Thus, the non-trivial solution to Equation (A.17) becomes
sin(mL) = 0 (A.18)
The smallest value of m that satisfies Equation (A.18) is
m = πL (A.19)
Substitution of Equation (A.19) into Equation (A.14) gives
−a + (a + b) = πL (A.20)
Substitution of Equation (A.11) into Equation (A.20) leads to the closed-form solution for the buckling moment of a doubly-symmetric I-beam in pure bending.
(M) = πL EI GJ + π E I IL (A.21)

163
A.2 System Buckling of a Twin-Girder System in Pure Bending
Figure A.3 shows the original configuration of the cross-section of a twin-girder system as well as the deformed configuration of the system during system buckling. The girder system consists of doubly symmetric I-girders with a spacing of S.
Figure A.3 Cross-Section View of Twin-Girder System in System Buckling Mode
The constant moments, M and M are applied to the twin girders, respectively. For the deformed configuration of the cross-section in the figure, only the internal shear forces associated with the rotation of the entire cross-section about the shear center are depicted for clarity and will be explained in detail later. The simplifying assumption that the two girders are continuously braced by internal cross-frames with infinite stiffness leads to the assumption that the cross-section of the girder system remains rigid during system buckling. Although the stiff internal cross-frames can restrain the relative displacement or rotation between the two girders, they cannot prevent the displacement and rotation of the entire cross-section of the girder system. During the system buckling, the entire cross-section will experience the vertical and lateral displacements and the rotation about the shear center of the cross-section. The external moments M and M about the η and ζ axes, respectively can be related to the external moments M and M about the x axis.
V′ V′
v′ v′
S
SC
SC
= SC (shear center)
φ
M M
v
u
φ
z
y
x

164
M ≈ −(M + M )φ (A.22)
M ≈ (M + M ) dudz (A.23)
Attention should be paid to the fact that the total internal lateral bending resisting moment of the entire cross-section is the sum of the internal resisting moments of the two girders about the weak axis of the girder.
M ≈ 2EI d udz (A.24)
where I is the moment of inertia of the single girder about the weak axis. With respect to the vertical displacement, v, of the entire cross-section, each girder has a
vertical differential displacement, v′ due to the rotation of the entire-cross section about the shear center. The relationship between the vertical differential displacement,v′, and the rotation angle, φ, is given by
v = 12 φS (A.25)
The vertical differential displacement causes an additional internal moment and shear force on each girder. These internal moment and shear force can be determined by using the classical Euler beam bending theory.
M = −EI d v′dz = − 12 EI S d φdz (A.26)
V = dM′dz = − 12 EI S d φdz (A.27)
Since the vertical differential displacements of the two girders are equal and opposite, the internal moments and shear forces on the two girders are also equal in magnitude and opposite in sign. Therefore, for the entire cross-section, the sum of the additional moments or the additional shear forces cancels out each other. However, the additional shear forces forms a couple and, thus, increases the internal torsional resistance of the entire cross-section, which is given by
T = V S = − 12 EI S d φdz (A.28)
The total internal torsional resistance of the twin-girder system includes the St. Venant torsion, the warping torsion and the shear couple of Equation (A.28). Thus, the total internal torsional resistance becomes
M = 2GJ dφdz − 2EI d φdz − 12 EI S d φdz (A.29)
Equating Equations (A.22) and (A.24) , and Equations (A.23) and (A.29), respectively gives
EI d udz + (M + M )2 φ = 0 (A.30)
GJ dφdz − E I + 14 I S d φdz − (M + M )2 dudz = 0 (A.31)
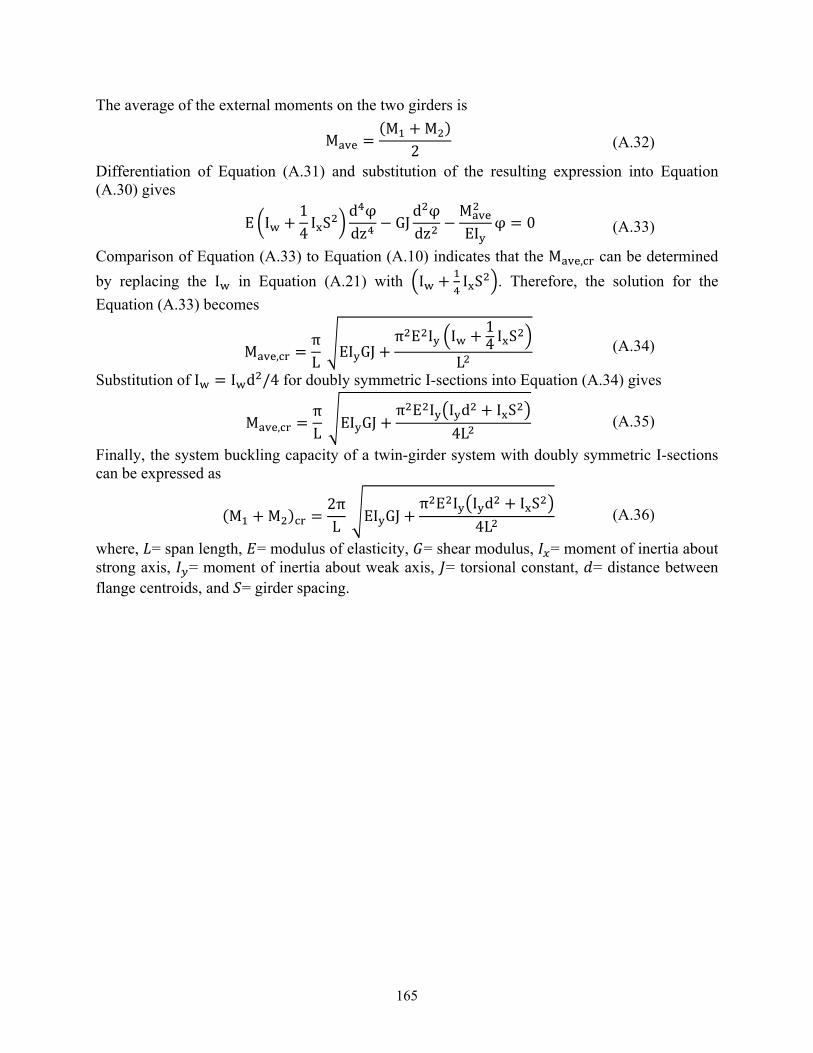
165
The average of the external moments on the two girders is
M = (M + M )2 (A.32)
Differentiation of Equation (A.31) and substitution of the resulting expression into Equation (A.30) gives
E I + 14 I S d φdz − GJ d φdz − MEI φ = 0 (A.33)
Comparison of Equation (A.33) to Equation (A.10) indicates that the M , can be determined
by replacing the I in Equation (A.21) with I + I S . Therefore, the solution for the
Equation (A.33) becomes
M , = πL EI GJ + π E I I + 14 I SL (A.34)
Substitution of I = I d /4 for doubly symmetric I-sections into Equation (A.34) gives
M , = πL EI GJ + π E I I d + I S4L (A.35)
Finally, the system buckling capacity of a twin-girder system with doubly symmetric I-sections can be expressed as
(M + M ) = 2πL EI GJ + π E I I d + I S4L (A.36)
where, = span length, = modulus of elasticity, = shear modulus, = moment of inertia about strong axis, = moment of inertia about weak axis, = torsional constant, = distance between flange centroids, and = girder spacing.

166

167
Appendix B: Bearing Pad Stiffness
This chapter discusses the method for determining the compressive and shear stiffnesses for elastomeric bearing pads. The values of the compressive stiffness and shear stiffness for elastomeric bearing pads that were calculated based on the method presented in this chapter were used throughout the study.
Figure shows the dimensional parameters for an elastomeric bearing pad. The parameters for dimensions for the elastomeric bearing pad are defined as follows.
= length of bearing pad parallel to the length of the beam = width of bearing pad perpendicular to the length of the beam
= Area of bearing pad (= ) ℎ = thickness of elastomer layer ℎ = total elastomer thickness (= ∑ ℎ ) ℎ = thickness of reinforcing steel shim
The shape factor of elastomer layer is defined as the ratio of plan area of layer to area of perimeter free to bulge.
= 2ℎ ( + ) (B.1)
Figure B.1 Dimensions for Elastomeric Bearing Pad
The most accepted method of determining compressive modulus for a reinforced
elastomeric bearing pad is given as (Muscarella and Yura, 1995).
= 3 (1 + 2 ) (B.2)
where = effective compressive modulus of elastomeric layer , = shear modulus of a bearing pad, k= constant dependent on elastomer hardness (0.75, 0.60, and 0.55 for 50, 60, and 70 durometer elastomeric material, respectively), = shape factor of layer . The compressive
ℎW (width)
Length
L (length)
(b) Elevation View (a) Plan View
Exterior Layer Interior Layer
ℎ (Steel Shim Thickness) ℎ (Layer Thickness)

168
stiffness for layer can be related to the effective compressive modulus, , for a given area ( ) and thickness (ℎ ) of the layer .
= ℎ (B.3)
For purposes of determining the compressive stiffness of the bearing pad that consists of multiple layers, the elastomer layers in the bearing pad can be considered as springs in series. Thus, the compressive stiffness of the bearing pad that has elastomer layers becomes
1 = 1
(B.4)
By applying the stiffness reduction factor of 3, the initial compressive stiffness of the bearing pad can be expressed as
= 13 (B.5)
The reason for using the stiffness reduction factor for the compressive stiffness of the bearing pad is as follows. Figure B.2 shows the graph of the typical compressive stress-strain relationships for a 3 shim flat bearing and a 3 shim 4% tapered bearing that was presented by Muscarella and Yura (1995). The graph shows that the bearings behave linearly for small stress levels, and exhibit strain hardening for further load. The Equation (2.1) for the compressive modulus for a reinforced elastomeric bearing pad is more agreeable with the curves between compressive stresses of 500 psi and 1500 psi, which is the most common working range for bearings (Muscarella and Yura, 1995).
Figure B.2 Compressive Stress-Strain Curves for 70 Durometer Flat and Tapered 3-Shims
Bearings (from Muscarella and Yura (1995))
The range of compressive stresses of 500 psi and 1500 psi corresponds to service load levels rather than construction load levels. In general, the construction load levels are well below the service load levels. Therefore, the use of the initial slope of the material curve was

169
considered suitable for girder systems under construction load levels, typically for girder systems with short span lengths. To convert the compressive modulus of Equation (2.1) to the initial compressive modulus, the stiffness reduction factor of 3 was used.
The shear stiffness of the bearing pad can be determined by using the plan area, total thickness, and shear modulus of the bearing pad, and can be expressed as
= ℎ (B.6)
The use of the procedure to determine the initial compressive stiffness ( ) and shear stiffness ( ) of the bearing pad that was discussed above is illustrated by using the rectangular bearing pad that was used in the beam overturning test. The parameters for dimensions for the rectangular bearing pad in the beam overturning test were as follows.
=8 elastomer layers = 7" = 16" = 112 . ℎ = ℎ = 0.25" ℎ = ℎ = ℎ = ℎ = ℎ = 0.27"
ℎ = 2.125" ℎ = 0.105" While the shear modulus, , for the elastomer hardness of 50 ranges from 0.077 ksi to
0.11 ksi, the lower limit of 0.077 ksi was used throughout the study, which is a conservative value from the design point of view. For the elastomer hardness of 50, the constant, , dependent on elastomer hardness was 0.75.
The use of Equation (B.1) through Equation (B.3) gives the shape factor, compressive modulus, and compressive stiffness for each layer, which are listed in Table B.1. The application of Equation (B.4) gives the compressive stiffness of the bearing pad.
Table B.1 Compressive Stress for Each Layer Layer Number 1 2 3 4 5 6 7 8 Thickness (in.) 0.25 0.27 0.27 0.27 0.27 0.27 0.27 0.25
9.74 8.99 8.99 8.99 8.99 8.99 8.99 9.74 (ksi) 33.1 28.2 28.2 28.2 28.2 28.2 28.2 33.1 (k/in.) 14827.3 11676.2 11676.2 11676.2 11676.2 11676.2 11676.2 14827.3
1 = 114827.3 + 111676.2 + 111676.2 + 111676.2 + 111676.2 + 111676.2 + 111676.2 + 114827.3
= 1541.4 k/in.

170
By applying Equation (B.5), the initial compressive stiffness of the bearing pad is calculated as
= . = 513.81 kips/in.
The use of Equation (B.6) gives the shear stiffness of the bearing pad. = . ×. = 4.06 kips/in.
TxDOT provides the standard drawings for elastomeric bearing pads that match the
conventional I-beams and the Texas I-girders. For reference, the initial compressive stiffness and shear stiffness for theses elastomeric bearing pads were calculated by using the method discussed above and listed in Table B.2.
Table B.2 Stiffness Values per Single Elastomeric Bearing Pad
Beam Type
Pad Size Initial Compressive Stiffness per Width / ..
Lateral Stiffness ( / . ) Length (in.) Width (in.)
I-Beams
7 12 31.2 3.2 7 14 34.7 3.7 7 16 37.8 4.3 7 22 44.9 5.9 9 24 87.4 8.3
I-Girders 8 21 60.9 6.4 9 21 81.0 7.2 10 21 104.0 8.0

171
Appendix C: Comparison of FEA Results for Flexible and Stiff Connections
This section contains the additional graphs that demonstrate comparisons of FEA results for flexible and stiff connections (Figures C.1–C.11.). The girder system consisted of four girders of a span length 60 ft and a girder spacing of 7.7 ft. the bracing was distributed uniformly along the length of the girder.
Figure C.1 Comparison for Flexible and Stiff Connection for Beam Type A
0
0.1
0.2
0.3
0.4
0.5
0 0.5 1 1.5 2 2.5 3 3.5 4 4.5 5
Mid
-Spa
n Ro
tatio
n (d
eg.)
Overhang Width (ft)
Parameter Conditionsbeam type Adistributed bracingspan (60 ft)beam spacing (7.7 ft)# of beams (4)
flexible connection
stiff connection

172
Figure C.2 Comparison for Flexible and Stiff Connection for Beam Type B
Figure C.3 Comparison for Flexible and Stiff Connection for Beam Type C
0
0.1
0.2
0.3
0.4
0.5
0 0.5 1 1.5 2 2.5 3 3.5 4 4.5 5
Mid
-Spa
n Ro
tatio
n (d
eg.)
Overhang Width (ft)
Parameter Conditionsbeam type Bdistributed bracingspan (60 ft)beam spacing (7.7 ft)# of beams (4)
flexible connection
stiff connection
0
0.1
0.2
0.3
0.4
0.5
0 0.5 1 1.5 2 2.5 3 3.5 4 4.5 5
Mid
-Spa
n Ro
tatio
n (d
eg.)
Overhang Width (ft)
Parameter Conditionsbeam type Cdistributed bracingspan (60 ft)beam spacing (7.7 ft)# of beams (4)
flexible connection
stiff connection

173
Figure C.4 Comparison for Flexible and Stiff Connection for Beam Type IV
Figure C.5 Comparison for Flexible and Stiff Connection for Tx28
0
0.1
0.2
0.3
0.4
0.5
0 0.5 1 1.5 2 2.5 3 3.5 4 4.5 5
Mid
-Spa
n Ro
tatio
n (d
eg.)
Overhang Width (ft)
Parameter Conditionsbeam type IVdistributed bracingspan (60 ft)beam spacing (7.7 ft)# of beams (4)
flexible connection
stiff connection
0
0.1
0.2
0.3
0.4
0.5
0 0.5 1 1.5 2 2.5 3 3.5 4 4.5 5
Mid
-Spa
n Ro
tatio
n (d
eg.)
Overhang Width (ft)
Parameter ConditionsTx28distributed bracingspan (60 ft)beam spacing (7.7 ft)# of beams (4)
flexible connection
stiff connection

174
Figure C.6 Comparison for Flexible and Stiff Connection for Tx34
Figure C.7 Comparison for Flexible and Stiff Connection for Tx40
0
0.1
0.2
0.3
0.4
0.5
0 0.5 1 1.5 2 2.5 3 3.5 4 4.5 5
Mid
-Spa
n Ro
tatio
n (d
eg.)
Overhang Width (ft)
Parameter ConditionsTx34distributed bracingspan (60 ft)beam spacing (7.7 ft)# of beams (4)
flexible connection
stiff connection
0
0.1
0.2
0.3
0.4
0.5
0 0.5 1 1.5 2 2.5 3 3.5 4 4.5 5
Mid
-Spa
n Ro
tatio
n (d
eg.)
Overhang Width (ft)
Parameter ConditionsTx40distributed bracingspan (60 ft)beam spacing (7.7 ft)# of beams (4)
flexible connection
stiff connection

175
Figure C.8 Comparison for Flexible and Stiff Connection for Tx46
Figure C.9 Comparison for Flexible and Stiff Connection for Tx54
0
0.1
0.2
0.3
0.4
0.5
0 0.5 1 1.5 2 2.5 3 3.5 4 4.5 5
Mid
-Spa
n Ro
tatio
n (d
eg.)
Overhang Width (ft)
Parameter ConditionsTx46distributed bracingspan (60 ft)beam spacing (7.7 ft)# of beams (4)
flexible connection
stiff connection
0
0.1
0.2
0.3
0.4
0.5
0 0.5 1 1.5 2 2.5 3 3.5 4 4.5 5
Mid
-Spa
n Ro
tatio
n (d
eg.)
Overhang Width (ft)
Parameter ConditionsTx54distributed bracingspan (60 ft)beam spacing (7.7 ft)# of beams (4)
flexible connection
stiff connection

176
Figure C.10 Comparison for Flexible and Stiff Connection for Tx62
Figure C.11 Comparison for Flexible and Stiff Connection for Tx70
0
0.1
0.2
0.3
0.4
0.5
0 0.5 1 1.5 2 2.5 3 3.5 4 4.5 5
Mid
-Spa
n Ro
tatio
n (d
eg.)
Overhang Width (ft)
Parameter ConditionsTx62distributed bracingspan (60 ft)beam spacing (7.7 ft)# of beams (4)
flexible connection
stiff connection
0
0.1
0.2
0.3
0.4
0.5
0 0.5 1 1.5 2 2.5 3 3.5 4 4.5 5
Mid
-Spa
n Ro
tatio
n (d
eg.)
Overhang Width (ft)
Parameter ConditionsTx70distributed bracingspan (60 ft)beam spacing (7.7 ft)# of beams (4)
flexible connection
stiff connection

177
Appendix D: Design Examples
The purpose of this appendix is to provide design examples based on the procedure proposed in the Chapter 6 of this report. The examples are intended to illustrate the overhang design method. Examples 1 and 2 demonstrate the overhang design for flexible connections, while Example 3 demonstrates the overhang design for stiff connection. Example 1 shows the overhang design for a concrete girder system of the AASHTO Type IV beam that is similar to the Airport Concrete Bridge and Example 2 shows the overhang design for a concrete girder system of AASHTO Type B Beam that is similar to Hutto Concrete Bridge.
Example 1: Find if the minimum required bracing is sufficient for a concrete girder system consisting of AASHTO Type IV beams of an overhang width of 3 ft. The connection between the bracing bars and the R-bars consist of the flexible connection.
Beam Type: Beam Type IV Line Unit Weight of Beam: 821 Width of Top Flange of Beam: 20 in.
, Span Length: 120 ft , Beam Spacing: 7.33 ft
# of Beams: 7 , Width of Bridge: (# of Beams – 1)* = 43.98 ft
Connection Type of Top Bracing: Flexible Connection , # of Top Braces: 5 (minimum required) from TxDOT standard drawing , # of Wood Blocking: 5 (minimum required) , Bracing Moment Arm: 46 in. , Overhang Width: 3 ft (from center of beam to edge of overhang)
, Thickness of Slab: 8 in. Thickness of Slab Haunch: 10 in. Bearing Width: 22 in.
Step 1: Calculate Effective Eccentric Force and Its Eccentricity
, Half of Work Bridge Weight: = 23.5/1000/12* /2 = 23.5/1000*43.98/2 = 0.517 kip
, Weight of Net Overhang: = ( − ) = 0.15*8/12*(36-10)/12*120 = 26 kips
, Half of Finishing Equipment Weight: = 5.7+ = 5.7+0.517 = 6.22 kips
, Weight of workers: = 1.25 kips , Weight of Overhang Formwork : = (2 × 12 + − )
= 0.01*(2*12+36-10)/12*120 = 5 kips Eccentricity of net overhang weight: = + ( − )/2
= 10+(36-10)/2 = 23 in. Eccentricity of half of finishing equipment weight: =
= 36 in. Eccentricity of weight of workers: = + 1 × 12
= 36+1*12 = 48 in.

178
Eccentricity of weight of overhang formwork: = + (2 × 12 + − )/2 = 10+(2*12+36-10)/2 = 35 in. = + + + = (26+6.22+1.25+5) = 38.5 kips = = (26*23+6.22*36+1.25*48+5*35)/ (26+6.22+1.25+5)
= 27.5 in.
Step 2: Calculate Quarter-Point Lift-off Force , Weight of Beam = (821 *L) = (821/1000)*(120) = 98.52 kips
, Weight of Slab Haunch = ( 2 ( + 2) = 0.15*(2*10/12)(10/12)*(120) = 25 kips
, Half of Weight of Interior Deck = ( − 2 )/2 = 0.15*(8/12)(120)(7.33-2*10/12)/2 = 33.98 kips
= + = 98.52+25 =123.52 kips Total Capacity of Top Bracing Bars: = (# of Top Braces)* P = 5*1.2 = 6 kips
, Half of Top Flange Width = 10 in. , Bearing Width = 22 in. , Bracing Moment Arm = 46 in.
, Quarter-Point Lift-off Force = ( )
= (4*33.98*10+4*6*46+22*(123.52+33.98)/(4*27.5-22) = 67.4 kips Check (=38.5 kips) ≤ (=67.4 kips), OK!
Step 3: Calculate Beam Rotations
, total vertical stiffness of bearing per width = 2*44.9 / .. = 89.8
/ .. = 12 ( − − )(180⁄ )
= 12/(89.8*223)*(38.5*27.5-33.98*10-6*46)*(180/π) = 0.32 degree ≤ 0.5, OK!
= ( )( ) ( ) (180/ ) (degree)
= 8/(9*89.8)*(38.5+123.52+33.98)3/((-2*27.5+22)*38.5+22*(123.52+33.98) +2*10*33.98+2*46*6)2*(180/π) = 0.36 degree ≤ 0.5, OK!
Step 4: Summarize Final Design Use 5 top bracing bars in flexible connection for overhang of 3 ft.
Example 2: Find if the minimum required bracing is sufficient for a concrete girder
system of AASHTO Type B beams of a overhang width of 3ft. The top bracing bars are fastened to the R-bars with flexible connections.
Beam Type: Beam Type B Line Unit Weight of Beam: 375 Width of Top Flange of Beam: 12 in.
, Span Length: 60 ft , Beam Spacing: 6.88 ft
# of Beams: 9

179
, Width of Bridge: (# of Beams – 1)* = 55.04 ft Connection Type of Top Bracing: Flexible Connection
, # of Top Braces: 5 (minimum required) from TxDOT standard drawing , # of Wood Blocking: 5 (minimum required) , Bracing Moment Arm: 28 in. , Overhang Width: 3 ft (from center of beam to edge of overhang)
, Thickness of Slab: 8 in. Thickness of Slab Haunch: 10 in. Bearing Width: 14 in.
Step 1: Calculate Effective Eccentric Force and Its Eccentricity
, Half of Work Bridge Weight: = 23.5/1000* /2 = 23.5/1000*55.04/2 = 0.647 kip
, Weight of Net Overhang: = ( − ) = 0.15*8/12*(36-6)/12*60 = 15 kips
, Half of Finishing Equipment Weight: = 5.7+ = 5.7+0.647 = 6.35 kips
, Weight of workers: = 1.25 kips , Weight of Overhang Formwork: = (2 × 12 + − )
= 0.01*(2*12+36-6)/12*60 = 2.7 kips Eccentricity of net overhang weight: = + ( − )/2
= 6+(36-6)/2 = 21 in. Eccentricity of half of finishing equipment weight: =
= 36 in. Eccentricity of weight of workers: = + 1 × 12
= 36+1*12 = 48 in. Eccentricity of weight of overhang formwork: = + (2 × 12 + − )/2
= 6+(2*12+36-6)/2 = 33 in. = + + + = (15+6.35+1.25+2.7) = 25.3 kips = ,
= (15*21+6.35*36+1.25*48+2.7*33)/ (15+6.35+1.25+2.7) = 27.38 in.
Step 2: Calculate Quarter-Point Lift-off Force , Weight of Beam = (375 *L) = (375/1000)*(60) = 22.5 kips
, Weight of Slab Haunch = ( 2 ( + 2) = 0.15*(2*6/12)(10/12)*(60) = 7.5 kips
, Half of Weight of Interior Deck = ( − 2 )/2 = 0.15*(8/12)(60)(6.88-2*6/12)/2 = 17.64 kips
= + = 22.5+7.5 = 30 kips Total Capacity of Top Bracing Bars: = (# of Top Braces)* P = 5*1.2 = 6 kips
, Half of Top Flange Width = 6 in. , Bearing Width = 14 in. , Bracing Moment Arm = 28 in.
, Quarter-Point Lift-off Force = ( )

180
= (4*17.64*6+4*6*28+14*(30+17.64))/(4*27.38-14) = 18.45 kips Check (=25.3 kips) ≥ (=18.45 kips), NG! Increase the number of top bracing bars by trial and error
Step 3: Recalculate Quarter-Point Lift-off Force Try 14 for the number of top bracing bars
Total Capacity of Top Bracing Bars: = (# of Top Braces)* P = 14*1.2 = 16.8 kips
, Quarter-Point Lift-off Force = ( )
= (4*17.64*6+4*16.8*28+14*(30+17.64))/(4*27.38-14) = 31.1 kips Check (=25.3 kips) ≤ (=31.1 kips), OK!
Step 4: Calculate Beam Rotations
, total vertical stiffness of bearing per width = 2*34.7 = 69.4 / ..
= ( ) ( )π/1803
×−− brmaxidid
b
dPLWk
12Fe
wb
= 12/(69.4*143)*(25.3*27.38-17.64*6-16.8*28)*(180/π) = 0.42 degree ≤ 0.5, OK!
= ( )( ) ( ) (180/ ) (degree)
= 8/(9*69.4)*(25.3+30+17.64)3/((-2*27.38+14)*25.3+14*(30+17.64) +2*6*17.64+2*28*16.8)2*(180/π) = 0.46 degree ≤ 0.5, OK!
Step 5: Summarize Final Design Use 14 top bracing bars in flexible connection for overhang of 3 ft. Keep 5 wood blockings.
Example 3: Find the minimum required bracing for a concrete girder system of
AASHTO Type B beams with a 3ft overhang width. The top bracing bars are fastened to the R-bars with the stiff connection.
Beam Type: Beam Type B Line Unit Weight of Beam: 375 Width of Top Flange of Beam: 12 in. Width of Bottom Flange of Beam: 18 in.
, Span Length: 60 ft , Beam Spacing: 6.88 ft
# of Beams: 9 , Width of Bridge: (# of Beams – 1)* = 55.04 ft
Connection Type of Top Bracing: Stiff Connection , # of Top Braces: 5 from TxDOT standard drawing , # of Wood Blocking: 5 from TxDOT standard drawing
Length of Wood Blocking: (Beam Spacing - Width of Bottom Flange of Beam) = ( 6.88-18/12) = 5.38 ft
, Bracing Moment Arm: 28 in. , Overhang Width,: 3 ft (from center of beam to edge of overhang)

181
, Thickness of Slab: 8 in. Thickness of Slab Haunch: 10 in. Bearing Width: 14 in.
Step 1: Calculate Effective Eccentric Force and Its Eccentricity
, Half of Work Bridge Weight: = 23.5/1000* /2 = 23.5/1000*55.04/2 = 0.647 kip
, Weight of Net Overhang: = ( − ) = 0.15*8/12*(36-6)/12*60 = 15 kips
, Half of Finishing Equipment Weight: = 5.7+ = 5.7+0.647 = 6.35 kips
, Weight of workers: = 1.25 kips , Weight of Overhang Formwork: = (2 × 12 + − )
= 0.01*(2*12+36-6)/12*60 = 2.7 kips Eccentricity of net overhang weight: = + ( − )/2
= 6+(36-6)/2 = 21 in. Eccentricity of half of finishing equipment weight: =
= 36 in. Eccentricity of weight of workers: = + 1 × 12
= 36+1*12 = 48 in. Eccentricity of weight of overhang formwork: = + (2 × 12 + − )/2
= 6+(2*12+36-6)/2 = 33 in. = + + + = (15+6.35+1.25+2.7) = 25.3 kips = ,
= (15*21+6.35*36+1.25*48+2.7*33)/ (15+6.35+1.25+2.7) = 27.38 in.
Step 2: Check for Rupture of R-bar , Half of Weight of Interior Deck = ( − 2 )/2
= 0.15*(8/12)(60)(6.88-2*6/12)/2 = 17.64 kips , Half of Top Flange Width = 6 in. , Bearing Width = 14 in.
, total vertical stiffness of bearing per width = 2*34.7 = 69.4 / .. k , Total Top Bracing Stiffness = (# of Top Bracing Bars)*(39 kip/in.) = 5*39
= 195 kip/in. , Total Wood Blocking Stiffness = (# of Wood Blockings)*(11025/(5.38*12) kip/in.)
= 5*(11025/(5.38*12)) = 853.86 kip/in. Total Capacity of Top Bracing Bars: = (# of Top Braces)* P = 5*3 = 15 kips
, Bracing Moment Arm = 28 in. , Beam Rotation at Rupture of R-bar = P (180/ )
= (195+853.86)/(195*853.86*28)*15*180/π = 0.193 degree
, Beam Rotation for Given Overhang Width: = ( ) (180/ )
= (25.3*27.38-17.64*6)/(69.4*143/12+195*853.86*282/(195+853.86))*(180/π)

182
= 0.239 degree Check 0.239 degree ≥ (=0.193) degree, NG! Increase the number of top bracing bars by trial and error
Step 3: Recheck for Rupture of R-bar by Increased Number of Top Bracing Bars Try 7 for the number of top bracing bars (increase 5 to 7).
k , Total Top Bracing Stiffness = (# of Top Bracing Bars)*(39 kip/in.) = 7*39 = 273 kip/in.
, Total Wood Blocking Stiffness = 853.86 kip/in. (same as in the previous step) Total Capacity of Top Bracing Bars: = (# of Top Braces)* P = 7*3 = 21 kips , Beam Rotation at Rupture of R-bar = P (180/ )
= (273+853.86)/(273*853.86*28)*21*180/π = 0.208 degree
, Beam Rotation for Given Overhang Width: = ( ) (180/ )
= (25.3*27.38-17.64*6)/(69.4*143/12+273*853.86*282/(273+853.86))*(180/π) = 0.189 degree Check 0.189 degree ≤ (=0.208) degree, OK!
Step 4: Summarize Final Design Use 7 top bracing bars in stiff connection for overhang of 3 ft. Keep 5 wood blockings.

183
Appendix E: Stability of Webs
This section contains the additions graphs of effects of the stiffener spacing on the structural behavior of the web of the girder subjected to the overhang loads (Figures E.1–E.5). The FEA girder models for the graphs in this section had no imperfection in the web. The overhang bracket was positioned at midheight of the web, and the stiffener spacing considered included 10 ft. and 30 ft.
Figure E.1 Effect of Stiffener Spacing for Type D56 with Overhang Width of 3 ft.
0%
10%
20%
30%
40%
50%
60%
70%
80%
90%
100%
0% 20% 40% 60% 80% 100%
Web
Dep
th (%
)
(Lateral Deformaton )/(0.35 in.) (%)
stiffener spacing (30 ft)
stiffener spacing (10 ft)
girder type D56overhang width (3 ft)reaction height (middepth)Imperfection Limit (0.35 in.)

184
Figure E.2 Effect of Stiffener Spacing for Type D38 with Overhang Width of 3 ft.
Figure E.3 Effect of Stiffener Spacing for Type D75 with Overhang Width of 4 ft.
0%
10%
20%
30%
40%
50%
60%
70%
80%
90%
100%
0% 20% 40% 60% 80% 100%
Web
Dep
th (%
)
(Lateral Deformaton )/(0.25 in.) (%)
stiffener spacing (30 ft)
stiffener spacing (10 ft)
girder type D38overhang width (3 ft)reaction height (middepth)Imperfection Limit (0.25 in.)
0%
10%
20%
30%
40%
50%
60%
70%
80%
90%
100%
0% 20% 40% 60% 80% 100%
Web
Dep
th (%
)
(Lateral Deformaton )/(0.5 in.) (%)
stiffener spacing (30 ft)
stiffener spacing (10 ft)
girder type D75overhang width (4 ft)reaction height (middepth)Imperfection Limit (0.5 in.)

185
Figure E.4 Effect of Stiffener Spacing for Type D56 with Overhang Width of 4 ft.
Figure E.5 Effect of Stiffener Spacing for Type D
0%
10%
20%
30%
40%
50%
60%
70%
80%
90%
100%
0% 20% 40% 60% 80% 100%
Web
Dep
th (%
)
(Lateral Deformaton )/(0.35 in.) (%)
stiffener spacing (30 ft)
stiffener spacing (10 ft)
girder type D56overhang width (4 ft)reaction height (middepth)Imperfection Limit (0.35 in.)
0%
10%
20%
30%
40%
50%
60%
70%
80%
90%
100%
0% 20% 40% 60% 80% 100%
Web
Dep
th (%
)
(Lateral Deformaton )/(0.25 in.) (%)
stiffener spacing (30 ft)
stiffener spacing (10 ft)
girder type D38overhang width (4 ft)reaction height (middepth)Imperfection Limit (0.25 in.)

186

187
References
AASHTO (2002), Standard Specifications for Highway Bridges, 17th Edition, American Association of State Highway and Transportation Officials, Third Edition, Washington, D.C. AASHTO (2004), LRFD Bridge Design Specifications, Third Edition, American Association of State Highway and Transportation Officials, Washington, D.C. AASHTO (2007), LRFD Bridge Design Specifications, Fourth Edition, American Association of State Highway and Transportation Officials, Washington, D.C. Abendroth, R. E., Klaiber, F. W. and Shafer, M. W. (1991), Lateral Load Resistance of Diaphragms in Prestressed Concrete Girder Bridges, Iowa Department of Transportation, Project HR-319, ISU-ERI-Ames-92076. AISC (2005), Steel Construction Manual, 13th Edition, American Institute of Steel Construction, Inc. Chicago, IL. American Wood Council (2005), National Design Specification for Wood Construction, Washington, D.C. American Welding Society (AWS) (2008), Bridge Welding Code, AASHTO/AWS D1.5:2008, American Welding Society and American Association of State Highway and Transportation Officials, Washington, D.C. ANSYS (2008), Finite Element Program Users Manual, Version 10.0, ANSYS, Inc., Canonsburg, PA. ANSYS (2009), Finite Element Program Users Manual, Version 11.0, ANSYS, Inc., Canonsburg, PA. Arditzoglou, Y. J., et al (1995), Test Methods for Elastomeric Bearings on Bridges, Research Report No. 1304-2, Center for Transportation Research, University of Texas at Austin. Ariyasajjakorn, D. (2006), Full Scale Testing of Overhang Falsework Hanger on NCDOT Modified Bulb Tee (MBT) Girders, Thesis, North Carolina State University. Clifton, S. (2008), Bridge Deck Overhang Construction, Thesis, University of Texas at Austin, USA. DuPont (1984), Engineering Properties of Neoprene Bridge Bearings, DuPont’s Catalogue. Fan, Z. (1999), Field and Computational Studies of Steel Trapezoidal Box Girder Bridges, Dissertation, the University of Houston.

188
Fasl, Jeremiah (2008), The Influence of Overhang Construction on Girder Design, Thesis, University of Texas at Austin. Grubb, M. (1990), Design for Concrete Deck Overhang Loads, Final Report, AISC Marketing Inc. Johnson, S. (2006), Analytical Modeling of Fiber Reinforced Post-Tensioned Concrete Anchorage Zones, Thesis, Florida State University. MeadowBurke (2007), Road and Bridge, Catalog, Http://www.MeadowBurke.com Muscarella, J. V. and Yura, J. A. (1995), An Experimental Study of Elastomeric Bridge Bearings with Design Recommendations, Research Report No. 1304-3, Center for Transportation Research, University of Texas at Austin. National Steel Bridge Alliance (NSBA) (2006), Steel Bridge Design Handbook, Chapter 8: Stringer Bridges. Popp, R. D. (2004), UTrap 2.0: Linearized Buckling Analysis of Steel Trapezoidal Girders, Thesis, University of Texas at Austin. Roddis, K., Kriesten, M., and Liu, Z. (1999), Torsional Analysis of Exterior Girders, Report for Kansa Department of Transportation, the University of Kansas. Roddis, K., Kriesten, M., and Liu, Z. (2006), TAEG 2.0, Report for Kansa Department of Transportation, the University of Kansas. Roeder, C. (2000), LRFD Design Criteria for Cotton Duck Pad Bridge Bearing, Contractor’s Final Report, NCHRP Web Document 24. Stanton, J., Roeder, C., Mackenzie-Helnwein, P., White, C., Kuester, C., and Craig, B. (2006), Rotation Limits for Elastomeric Bearings, Final Report for NCHRP, University of Washington. Timoshenko, S.P., and Gere, J.M. (1961), Theory of Elastic Stability, McGraw-Hill Book Company, New York, NY. TxDOT (2008), TxDOT LRFD Bridge Design Manual, Texas Department of Transportation, Texas, USA. TxDOT (2007), New Prestressed Concrete I-Girder Standard Drawings, ftp://ftp.dot.state.tx.us/pub/txdot-info/cmd/cserve/standard/bridge/memoi21e.pdf, Texas Department of Transportation, Texas, USA. Topkaya, C. (1999), A New Test Method for Determining the Shear Modulus of Elastomeric Bridge Bearings, Thesis, University of Texas at Austin.

189
Trejo, S., Hite, M., Mander, J., Mander, T., Henley, M., Scott, R., Ley T., and Patil S. (2008), Development of a Precast Bridge Deck Overhang System for the Rock Creek Bridge, Report for Texas Department of Transportation, Texas Transportation Institute, USA. Wang, L. (2002), Cross-frame and Diaphragm Behavior for Steel Bridges with Skewed Supports, Dissertation, the University of Houston. Wang, L. Q. and Helwig, T. A. (2005), Critical Imperfections for Beam Bracing Systems, Journal of Structural Engineering, Vol. 131, No. 6. Yazdani, N., Eddy, S., and Chun, C. (2000), Effect of Bearing Pads on Precast Prestressed Concrete Bridges, Journal of Bridge Engineering, Vol. 5, No. 3. Yura, J. A., Kumar A., Topkaya, C., Becker, E., and Collingwood, J. (2001), Elastomeric Bridge Bearings: Recommended Test Methods, NCHRP Report 449, Transportation Research Board, National Research Council Yura, J., Helwig, T., Herman, R., Zhou, C. (2008), Global Lateral Buckling of I-Shaped Girder Systems, Journal of Structural Engineering, Vol. 134, No. 9. Zhou, C. (2006), Utilizing Lean-on Cross-Frame Bracing for Steel Bridges, Dissertation, University of Houston.