impact of microcredit on agricultural development in sindh pakistan
TRANSCRIPT

Impact of Microcredit Gender Gap in Education
Effects of Foreign Investment Indian Human Capital Formation
VOLUME 15 ISSUE 5 VERSION 1.0
Online ISSN : 2249-460XPrint ISSN : 0975-587X

Global Journal of Human-Social Science: E Economics

Global Journal of Human-Social Science: E
Economics
Volume 15 Issue 5 (Ver. 1.0)
Open Association of Research Society

Global Journals Inc. (A Delaware USA Incorporation with “Good Standing”; Reg. Number: 0423089)Sponsors: Open Scientific Standards
Publisher’s Headquarters office
USA Toll Free: +001-888-839-7392 USA Toll Free Fax: +001-888-839-7392
Offset Typesetting
Packaging & Continental Dispatching
Find a correspondence nodal officer near you
To find nodal officer of your country, pleaseemail us at [email protected]
eContacts
Press Inquiries: [email protected] Inquiries: [email protected] Support: [email protected] & Releases: [email protected]
Pricing (Including by Air Parcel Charges):
For Authors: 22 USD (B/W) & 50 USD (Color) Yearly Subscription (Personal & Institutional): 200 USD (B/W) & 250 USD (Color)
Open Association of Research Society
Global Journals Headquarters301st Edgewater Place Suite, 100 Edgewater Dr.-Pl,
United States of America
Global Journals Incorporated2nd, Lansdowne, Lansdowne Rd., Croydon-Surrey, Pin: CR9 2ER, United Kingdom
Global JournalsE-3130 Sudama Nagar, Near Gopur Square, Indore, M.P., Pin:452009, India
Wakefield MASSACHUSETTS, Pin: 01880,
Incorporation No.: 0423089 License No.: 42125/022010/1186
Registration No.: 430374 Import-Export Code: 1109007027
Employer Identification Number (EIN): USA Tax ID: 98-0673427
us1463/
Social Sciences. 2015.
John A. Hamilton,"Drew" Jr., Ph.D., Professor, Management Computer Science and Software Engineering Director, Information Assurance Laboratory Auburn University
Dr. Wenying Feng Professor, Department of Computing & Information Systems Department of Mathematics Trent University, Peterborough, ON Canada K9J 7B8
Dr. Henry Hexmoor IEEE senior member since 2004 Ph.D. Computer Science, University at Buffalo Department of Computer Science Southern Illinois University at Carbondale
Dr. Thomas Wischgoll Computer Science and Engineering, Wright State University, Dayton, Ohio B.S., M.S., Ph.D. (University of Kaiserslautern)
Dr. Osman Balci, Professor
Department of Computer Science Virginia Tech, Virginia University Ph.D.and M.S.Syracuse University, Syracuse, New York M.S. and B.S. Bogazici University, Istanbul, Turkey
Dr. Abdurrahman Arslanyilmaz Computer Science & Information Systems Department Youngstown State University Ph.D., Texas A&M University University of Missouri, Columbia Gazi University, Turkey
Yogita Bajpai M.Sc. (Computer Science), FICCT U.S.A.Email: [email protected]
Dr. T. David A. Forbes Associate Professor and Range Nutritionist Ph.D. Edinburgh University - Animal Nutrition M.S. Aberdeen University - Animal Nutrition
B.A. University of Dublin- Zoology
Integrated Editorial Board(Computer Science, Engineering, Medical, Management, Natural
Science, Social Science)
Dr. Xiaohong He Professor of International Business University of Quinnipiac BS, Jilin Institute of Technology; MA, MS, PhD,. (University of Texas-Dallas)
Burcin Becerik-Gerber University of Southern California Ph.D. in Civil Engineering DDes from Harvard University M.S. from University of California, Berkeley & Istanbul University

Dr. Bart Lambrecht Director of Research in Accounting and FinanceProfessor of Finance Lancaster University Management School BA (Antwerp); MPhil, MA, PhD (Cambridge)
Dr. Söhnke M. Bartram Department of Accounting and FinanceLancaster University Management SchoolPh.D. (WHU Koblenz) MBA/BBA (University of Saarbrücken)
Dr. Carlos García Pont Associate Professor of Marketing IESE Business School, University of Navarra Doctor of Philosophy (Management), Massachusetts Institute of Technology (MIT) Master in Business Administration, IESE, University of Navarra Degree in Industrial Engineering, Universitat Politècnica de Catalunya
Dr. Miguel Angel Ariño Professor of Decision Sciences IESE Business School Barcelona, Spain (Universidad de Navarra) CEIBS (China Europe International Business School). Beijing, Shanghai and Shenzhen Ph.D. in Mathematics University of Barcelona BA in Mathematics (Licenciatura) University of Barcelona
Dr. Fotini Labropulu Mathematics - Luther College University of ReginaPh.D., M.Sc. in Mathematics B.A. (Honors) in Mathematics University of Windso
Philip G. Moscoso Technology and Operations Management IESE Business School, University of Navarra Ph.D in Industrial Engineering and Management, ETH Zurich M.Sc. in Chemical Engineering, ETH Zurich
Dr. Lynn Lim Reader in Business and Marketing Roehampton University, London BCom, PGDip, MBA (Distinction), PhD, FHEA
Dr. Sanjay Dixit, M.D. Director, EP Laboratories, Philadelphia VA Medical Center Cardiovascular Medicine - Cardiac Arrhythmia Univ of Penn School of Medicine
Dr. Mihaly Mezei ASSOCIATE PROFESSOR Department of Structural and Chemical Biology, Mount Sinai School of Medical Center Ph.D., Etvs Lornd University Postdoctoral Training, New York University
Dr. Han-Xiang Deng MD., Ph.D Associate Professor and Research Department Division of Neuromuscular Medicine Davee Department of Neurology and Clinical NeuroscienceNorthwestern University Feinberg School of Medicine

Dr. Pina C. Sanelli Associate Professor of Public Health Weill Cornell Medical College Associate Attending Radiologist NewYork-Presbyterian Hospital MRI, MRA, CT, and CTA Neuroradiology and Diagnostic Radiology M.D., State University of New York at Buffalo,School of Medicine and Biomedical Sciences
Dr. Roberto Sanchez
Associate Professor Department of Structural and Chemical Biology Mount Sinai School of Medicine Ph.D., The Rockefeller University
Dr. Wen-Yih Sun
Professor of Earth and Atmospheric SciencesPurdue University Director National Center for Typhoon and Flooding Research, Taiwan University Chair Professor Department of Atmospheric Sciences, National Central University, Chung-Li, TaiwanUniversity Chair Professor Institute of Environmental Engineering, National Chiao Tung University, Hsin-chu, Taiwan.Ph.D., MS The University of Chicago, Geophysical Sciences BS National Taiwan University, Atmospheric Sciences Associate Professor of Radiology
Dr. Michael R. Rudnick
M.D., FACP Associate Professor of Medicine Chief, Renal Electrolyte and Hypertension Division (PMC) Penn Medicine, University of Pennsylvania Presbyterian Medical Center, Philadelphia Nephrology and Internal Medicine Certified by the American Board of Internal Medicine
Dr. Bassey Benjamin Esu B.Sc. Marketing; MBA Marketing; Ph.D Marketing Lecturer, Department of Marketing, University of Calabar Tourism Consultant, Cross River State Tourism Development Department Co-ordinator , Sustainable Tourism Initiative, Calabar, Nigeria
Dr. Aziz M. Barbar, Ph.D. IEEE Senior Member Chairperson, Department of Computer Science AUST - American University of Science & Technology Alfred Naccash Avenue – Ashrafieh

Dr. George Perry, (Neuroscientist) Dean and Professor, College of Sciences
Denham Harman Research Award (American Aging Association)
ISI Highly Cited Researcher, Iberoamerican Molecular Biology Organization
AAAS Fellow, Correspondent Member of Spanish Royal Academy of Sciences
University of Texas at San Antonio
Postdoctoral Fellow (Department of Cell Biology)
Baylor College of Medicine
Houston, Texas, United States
Dr. R.K. Dixit M.Sc., Ph.D., FICCT Chief Author, India Email: [email protected]
Vivek Dubey(HON.) MS (Industrial Engineering),
MS (Mechanical Engineering)
University of Wisconsin, FICCT
Editor-in-Chief, USA
Er. Suyog Dixit (M. Tech), BE (HONS. in CSE), FICCT SAP Certified Consultant CEO at IOSRD, GAOR & OSS Technical Dean, Global Journals Inc. (US) Website: www.suyogdixit.com Email:[email protected]
Pritesh Rajvaidya (MS) Computer Science Department California State University BE (Computer Science), FICCT Technical Dean, USA Email: [email protected]
Sangita Dixit M.Sc., FICCT
Dean & Chancellor (Asia Pacific) [email protected]
Luis Galárraga J!Research Project Leader Saarbrücken, Germany
President Editor (HON.)
Chief Author (HON.)
Dean & Editor-in-Chief (HON.)
Suyash Dixit
(B.E., Computer Science Engineering), FICCTT President, Web Administration and
Development CEO at IOSRD COO at GAOR & OSS
,

Contents of the Issue
i. Copyright Notice ii. Editorial Board Members iii. Chief Author and Dean iv. Contents of the Issue
1. Gender Gap in Education - An Indian Human Capital Formation
Concern. 1-9 2. Malaysia Nap: More Shadows than Lights. 11-23 3. Impact of Microcredit on Agricultural Development in District Mastung
Balochistan: A Case Study of Balochistan Rural Support Programme (BRSP) Pakistan. 25-39
4. A Disaggregated Analysis on the Effects of Foreign Investment Inflows on Exchange Rate: Evidence from Nigeria. 41-48
5. The Impact of Globalization on the Business. 49-52 v. Fellows and Auxiliary Memberships vi. Process of Submission of Research Paper vii. Preferred Author Guidelines viii. Index

© 2015. Priyanka Dey. This is a research/review paper, distributed under the terms of the Creative Commons Attribution-Noncommercial 3.0 Unported License http://creativecommons.org/licenses/by-nc/3.0/), permitting all non-commercial use, distribution, and reproduction in any medium, provided the original work is properly cited.
Global Journal of HUMAN-SOCIAL SCIENCE: E Economics Volume 15 Issue 5 Version 1.0 Year 2015 Type: Double Blind Peer Reviewed International Research Journal Publisher: Global Journals Inc. (USA) Online ISSN: 2249-460x & Print ISSN: 0975-587X
Gender Gap in Education - An Indian Human Capital Formation Concern
By Priyanka Dey
Abstract-
The divergence
in gender counts amongst all countries has caused unrest in multinational platforms almost a decade ago. Gender equality and women empowerment is the third goal amongst eight most concerning causes as per united nation’s millennium development goals. After years of policy intervention socio-economic situations have diverged to an extent that new goals and impact studies are required for further improvements. India has shown one of the best results in addressing all eight goals. However, inequality within Indian states has increased remarkably. The backwardness of women from these states is due to gender gap in almost all aspect of socio economic study. The concept of gender equality has been gaining importance as the subordinate status of women in relation to men has been seen in almost every facets of life. This research work describes discrepancy in educational policies, employment initiatives and social norms which keep a larger portion of population deprived of rights. Policy recommendation of women empowerment and social restructuring is provided in the last segment.
GJHSS-E
Classification : FOR Code: 130199
Strictly as per the compliance and regulations of:
GenderGapinEducationAnIndianHumanCapitalFormationConcern

Gender Gap in Education - An Indian Human Capital Formation Concern
Priyanka Dey
Abstract- The divergence in gender counts amongst all countries has caused unrest in multinational platforms almost a decade ago. Gender equality and women empowerment is the third goal amongst eight most concerning causes as per united nation’s millennium development goals. After years of policy intervention socio-economic situations have diverged to an extent that new goals and impact studies are required for further improvements. India has shown one of the best results in addressing all eight goals. However, inequality within Indian states has increased remarkably. The backwardness of women from these states is due to gender gap in almost all aspect of socio economic study. The concept of gender equality has been gaining importance as the subordinate status of women in relation to men has been seen in almost every facets of life. This research work describes discrepancy in educational policies, employment initiatives and social norms which keep a larger portion of population deprived of rights. Policy recommendation of women empowerment and social restructuring is provided in the last segment.
I. Introduction
omen are the worshiped gender in India. But in real life women are least valued outside temple thrones. The double standards for women in
India has been the cause of social and economic deprivation of female. The Indian society has been traditionally exploitative towards female. Even after economic reforms these structural values have succeeded to pertain in contemporary times. The proportion of male children who are fully immunised is 4 per cent higher than female children. By the time girls are four years old, they are much more likely to be stunted or underweight than their brothers. In 2012, 58 per cent of all primary school children in the age group of 6-14 years were boys. (The Indian Express, 2015).
Many research have been conducted to study present status of women in Indian society but none have been effective to eradicate gender issues. Deprivation of women from education is one of the main cause behind lack of advancement in educational attainment. Gender gap in this research concerns difference between achievements of male and female in education sector. School enrolment in rural areas of India is significantly lower for girls than for boys in all age groups and disparity increases with age. Zimmermann (2011) suggests an inverse U-shaped pattern of school enrolment with age. Starting from six to nine year
Author: Research Scholar, Chanpurpally, P.O. Rajbari, Kolkata. e-mail: [email protected]
enrolment rate increases but declines after ten years of age. After attaining adolescence age children are engaged in house hold work or they are engaged in economic activities. The opportunity cost of study increases forcing to greater drop out rates.
Empirical research shows on average Indian household resource allocated for education of boys is higher than girls across geographical areas and income levels. School expenditures on girls tend to be lower than those for boys, especially in private schools (Flimer and Pritchett1999, Jejeebhoy 1993, Ramachandran 2002, Tilak 1996, Tilak 2002). Gender discrimination within a family shares low evidence, with only strong presence in 10-16 age group. Maccini and Yang 2009 and Qian 2008 found patterns of difference in resource allocation between son and daughters.
In deciding enrolment of their children parents often consider cost and benefit situation. The benefits from schooling includes increase in expected wages, potential marriage partners and more desirable socio economic status. Parents benefit in monetary terms as better educated children can take care of their parents in better ways. Elder children are considered substitutable for household works, farm work or temporary labour. The family forgoes all these benefits to education. Enrolment of girl child in school have higher ex post vulnerability to schools as parents allocate resources to boys first in scares situation (Zimmermann 2011).
Women’s education is considered as the key for reducing favouritism against girls. Reality of women’s life assures not only physical and emotional trauma, but severe economic hardship as well. Some studies show that educated mothers are far more “efficient” in decision making than uneducated mothers for their daughters. Child mortality rate shows positive relationship with maternal education attainments.
The wage gap is prominent in today’s labour market as well. It leads to debate that men are more deserving than female or are they exploited? If the former is true then what has led to backwardness of women is also and concern. Felinity of women is at stake if she rules the typical male world. Less are the occasions when female leaders are used as parameters for male leaders.
International concerns of gender gap have not been elapsed yet. Although eight countries-Bahamas, Belize, Brazil, France, Guyana, Latvia, Namibia, and the
W
V
olum
e XV
Issu
e V
Versio
n I
Globa
l Jo
urna
l of H
uman
Soc
ial Sc
ienc
e
© 2015 Global Journals Inc. (US)
-
1
Year
2015
( E)

Philippines-have fully closed the gap on both the health and education sub-indexes, no country has closed either the economic participation gap or the political empowerment gap as per World Economic Forum Report 2014.
Gary Becker’s theory of human capital helps in understanding this gender situation. It suggests that an individual is compensated for the work he or she performs and also the individual’s human capital.1 The theory describes discontinuity from labour market cause of depreciation in human capital. Van Dyke proposes two theories for gender income gap, in supply side explanation possibility of difference in taste, qualifications, education, formal training or other productivity related characteristics is defined as cause of gender gap. Rational being women are more likely to invest in human capital that has low market return rather than men. In demand side theory discrimination of employer, employee or customer may lead to gender gap. Married women participation increases after pregnancy where as men decreases their participation after attaining responsibilities. Incentive to invest in training is directly proportional to one’s intention to work in lifetime. Gender wage gap diminishes as male-female lifetime work expectations become similar. Work expectation is formed from training acquired in school and on job training. With a whole work life ahead investment in training pays off big time since returns reap for long time. The “present value”2
1 Human capital consists of accumulated investments in education, job training etc. The more individual have invested in knowledge gathers the more valuable labour becomes. Compensation increases with capital accumulation. 2 The
discounted value of increased wages shows present value of
human capital investment. The present value of any given investment diminishes as one gets older because number of years one expects to stay on job reaping returns from the investment is smaller for older individuals.
of training is smaller in later on life as there are lesser opportunities to earn returns. All those who wish to grow further takes training. As per division of labour human capital theory within family due to stringent gender work patterns lesser women participate in economic activities. Male tend to work longer and maintain continuity in professional engagements due to which gender wage gap persists. Women in most cases have a gap in their career due to family needs. Thus lag behind men in pay increments and career growth. Education is the deciding factor for wage and hence determines wage gap. Low educational attainment of women leads to low returns. In cyclic causation education and earnings effect each other and till an external policy intervention occurs it becomes impossible to improve gender gap situation.
World economic forum’s annual gender survey 2014 puts India at number 15 on the score card for
50
years).
In
overall
ranking
India slipped to 114 from
101 earlier in 2013. The main instruments behind this fall being decreasing female to male sex ratio at birth. The educational attainment gaps which have caused further discrepancy of economic participation and opportunity can be evaluated through wage gaps. However, for India wage data is unavailable in public domain. Hence proxies are utilized to provide overview of the situation. This slumps India to lowest ranked BRICK’s nations and one of the few countries which are facing shrinking female labour. World economic forum predicts 81 years of positive sustainable growth for achieving gender parity.
II.
Literature
Review
Due to contemporary relevance numbers of reviews or surveys of gender wage gaps and its development have been concluded. Stanley and Jarrell (1998) as well as Jarrell and Stanley (2004) were the first to complement this survey literature with meta-analyses of gender wage differentials in the US. In studies which uses data sets of particular subgroups (to never-married workers, new entrants in the labour market, or workers in narrow occupations provides the researcher with a better comparability of the productivity of workers and hence shows lower gender wage
gaps. The bulk of decline is gender wage gap is empirical attributed to better labour market endowments of females which came about by better education, training, and work attachment
(Weichselbaumer & Winter-Ebmer, 2005).
In literature of gender wage gap economies of
education theory have been used for explaining the diverse results. Initial contributions were by T.
W.
Schultz(1961a), Gary Becker (1964) and Mincer (1974) who treated education as investment rather than consumption. In these early theories long term growth perspective of education was established. The private value of education was discussed by Arrow (1973), Spence (1973) and Stiglitz (1975). Social value of education is lower than personal gain from education as discussed in these theories. Third phase of literature accepts education as a variable for endogenous growth and links with externalities. Contributed majorly by Lucas (1988) and Romer (1986, 1990). Education yields rate of return equal or above other investment for an individual. However, social effect of education can show ambiguous results. Social rate from education contains two major groups of returns, (a) cost and benefit of economy (tax and subsidy) (b) externalities (low corruption, crime etc). The social rate of education follows diminishing returns, i.e. higher level of education provides lower returns. This is particularly essential for policy makers as it implies the need for primary education over higher education. Higher education is
V
olum
e XV
Issu
e V
Versio
n I
2
Globa
l Jo
urna
l of H
uman
Soc
ial Sc
ienc
e
© 2015 Global Journals Inc. (US)
-
Year
2015
( E)
Gender Gap in Education - An Indian Human Capital Formation Concern
political empowerment. India also tops the list of countries on the years with women head of state (in past
usually specialized and skill training. Psacharopoulos (1989a) shows returns to education decline as human to

physical capital increases. It helps explain the large subsidy provided for primary education in countries which has poor conditions of higher education as well. The idea is of mass development and thus economy’s skill set declines in quality although increases in quantity.
Many literatures argue men and women
behave differently because of the difference in brain however no biological data is available to argue the same. It is assumed men are not good cook as cooking is a feminine work. But what defines a feminine work is an unstructured bunch of assumptions which have been imbibed in society. There is no logical or theoretical explanation which segregates activities. Most number of chefs
who prepare most exquisite
preparations is male gendered. Women in military defence or aggressive and strong jobs are termed as bad mothers by Indian society. However, no evidence could be collected to prove the same. There is much debate over ideal judgement of wage discrimination.
Women are commonly married young, quickly
become mothers, and are then burdened by stringent domestic and financial responsibilities. They are frequently malnourished since women typically are the last member of a household to eat and the last to receive medical attention. Additionally, only 54 percent of Indian women are literate as compared to 76 percent of men.
Reasons for parental under-investment in
female education are diverse and well-known (Aravind Subramanian, 2005). Social constrains are major hindrance for female participation in economic activities as well. This hence works in a cyclical causation pattern. Due to mental backwardness women are not exposed to education well enough. Lack of skills keeps women out of labour force. The low opportunity of employment works as motivation to keep women out of economic activities. Since no future benefit can be estimated families tend to dislike spending on female education. The valuation of education is in terms of consumption for female whereas investment in case of male. Low value of labour and market glitches for female creates obstacle for active participation by women.
III.
Analysis
of
Indian
Scenario
In Indian system both enrolments and drop outs from education are crucial to analyse. The number of enrolments have not seen significant increase in past years but the dropout rate is very high throughout. After 1980’s national government have shown serious interest in educational enrolments specifically for women participations. Policies like New National Policy of Education (1986) and Programme of Action (1992) were targeted for six to fourteen year olds. Later as an initiative to accomplish United Nation’s Millennium Development Goals Indian government took policies of
free textbooks and uniforms distribution, scholarships and mid-day meal in 2006. The mid-day meal programme was especially successful in raising enrolment rates in rural parts of India. But the same observation remains constant. In children of more than ten years school dropout rates were very high. As in these scenarios they are found more useful for household chores or economic activities. In rural India which still remains majorly an agricultural society seasonal employment occur for families children to solve the sudden need of extra labour. Alternative school timings have also shown positive results in increasing enrolments and give lesser reasons for drop out in mid schooling. Evidence suggests school expenditure for a child in rural India per year is rupees three hundred and forty ( includes uniform, stationary and tuition fees) which is equivalent to fifteen days earning approximately in any part of India (Dreze 2003, Kingdom 2005). Due to low quality of education rural households also prefer education from private institutions which imposes cost burden on the family. Some households are likely to be credit constrained because they find themselves unable to borrow against future income to provide better education for their children. As the cost burden increases households are subjected to choose cost cutting methods to support priority expense. In most number of such situations
male education is given more importance than female. Due to future expectations of shifting of responsibilities, parents consider sons to take care of them and take family forward. Whereas daughters are considered as “parayadhan” or someone else’s belonging as their major contribution being building others family. Thus education cost for female are consumption expenditure rather than investment cost.
V
olum
e XV
Issu
e V
Versio
n I
Globa
l Jo
urna
l of H
uman
Soc
ial Sc
ienc
e
© 2015 Global Journals Inc. (US)
-
3
Year
2015
( E)
Gender Gap in Education - An Indian Human Capital Formation Concern

Source: Indiastat
Figure 1 : State wise primary school enrolment rates of India as per gender 2004-2010
In literature it has been established at various stage
that in primary schooling age enrolment rates of
male and female participants are unrelated. In figure 1 we see clear empirical evidence of gender gap in early stage of education during 2004-2008. It is only after 2008 when several policies like sarva skhiksha abhiyan and mid-day meals were initiated gender gap diminishes in primary education enrolment rates. One year after convergence in participation evidence shows scope for further divergence. The reduction in gender gap in not a stable situation essentially. Lack of data in later year in public domain causes in lack of a clear picture. But in understanding Indian society’s development it will be realistic to assume no drastic convergence in gender gap presently.
Although this research shows comfortable scenario in primary education we cannot eliminate its inability to predict impact on gender wage gap. Primary education considers basic learning through formal channel which ensures fundamental understanding of words or letters. This human capital skills cannot explain direct returns from education and probability of ensuring employment.
Each state of India shows similar pattern of change in between 2007-2013. All the states have increased their primary education index. Almost all the states have achieved to improve their primary education status from 2007 to 2013.
a)
Primary Education Index
Based on composite evaluation of education situation we find a clear decline is standards of primary education in the country during 2007-2009. The situation seems to have
recovered in 2012-13, for states like
Daman& Diu, Delhi, Goa, Gujarat, Haryana, Kerala,
Maharashtra, Andhra Pradesh and Andaman & Nicober Island. In few cases we find the primary education index dropping further. States of Arunachal Pradesh, Assam, Bihar,
Uttar Pradesh and West Bengal etc shows
irrecoverable decline in primary education.
The educational policies have not been able to achieve the expected benefits. This lack of education further leads to social and economic issues. The huge employment gap is a remote respect of lack in educational attainments. In most of cases the social issue like theft, rape etc have grave connection to lack of education.
Most north eastern states, West Bengal, Bihar, Haryana shows lowest education index. Ranking of primary education is as per Ministry of Human resource development accounting. During 2007-13, many region shows volatile transition and in few states there is negligible changes of primary education ranking.
b)
Rank of Primary Education Attainment
The highest increase of primary education rank is in Goa followed by Gujarat, Haryana and Uttar Pradesh. Maharashtra and Manipur has worse situation in 2012-13. In many states there is lack of changes in rank like Odisha, Puducherry, Punjab, Rajasthan, Tamil Nadu, Tripura, Uttarakhand, Dadara and Nagar Haveli, Jharkhand, Lakshadweep, Madhya Pradesh, Chattisgarh shows constant increase of ranking. In case of Arunachal Pradesh, ranking increases during 2007-09 but decreases massively during 2012-2013. Similar situation for Assam, Chattisgarh, Karnataka, Mizoram same situation is observed.
In secondary and senior secondary levels of education dropout rates of girls are argued to be very high. This is also shown as prime reason of educational
V
olum
e XV
Issu
e V
Versio
n I
4
Globa
l Jo
urna
l of H
uman
Soc
ial Sc
ienc
e
© 2015 Global Journals Inc. (US)
-
Year
2015
( E)
Gender Gap in Education - An Indian Human Capital Formation Concern

gap amongst gender. Social laws and cultural values are the root cause of this dropout rates in most of the states. Although in few states poverty becomes even more concerning issue for dropout rates. By drop out measures states of Haryana, Rajasthan, and Bihar etc do not show much deterioration. This is due to the low enrolment rates at the first place. So few girls are enrolled in primary education (see Fig. 3) and also these girls either belong from higher socio economic class or there are exogenous factor helping them. On an approximate 6 per cent less girl enrol in secondary and senior secondary level education in India.
c) Gross Enrolment Ratio of Boys and Girls (in %) 2011 Minority segments are provided special
privileges for their backwardness in social development. Figure. Shows an almost same situation for general and scheduled class boys and girls. In case of scheduled tribe the gross enrolment rates of boys are approximately 10 per cent higher than girls. The tribes are located in less connected places and social development is rate is fragile. Tribal areas are also subjected to terrorist activities and political turmoil. All these social and political hindrances have restrained growth of the community. (See Fig. 4)
d) Gender parity Index 2013 This index helps in understanding how well
education proximity are for the genders in any state. Gender parity index shows in a scale of 10 how we; coordinated gender gap prevails. Daman and Diu
shows maximum gender parity index value of more than 2. After a huge margin Andaman and Nicober islands, Dadra and Nagar Haveli, Goa, Kerala, Meghalaya, Uttar Pradesh and Uttarakhand. Arunachal radish is closest to 0.5 scale and states of Nagaland, Punjab are in the lowest in gender parity. Figure 5 also helps in understanding differences in gender parity in between states. The overall scenario as described before fails to show real picture. The less developed north eastern states shares gender parity around 0.7 or 70 per cent. Higher economically developed states have greater gender parity in education, Similar to previous situation Goa scores high in education index.
Eastern states of West Bengal, Odisha, Jharkhand and Bihar shows closer results or less with in group disparity. Western states Punjab, Rajasthan and Gujarat also shows similar situations. Himachal Pradesh and Haryana shows big difference on gender parity index with Haryana scoring of the lowest gender parity in education. The high rates of female feticides, violence against women and insecurity is also related to average educational attainment of society. Financial capital of India, Mumbai scores highest in gender parity within Maharashtra but on over all values Maharashtra scores far below then neighbouring competitor Kerala. Karnataka although houses IT hub of India , but state’s performance in gender parity for education shows similar score of north eastern states who are far below than Karnataka in terms of revenue earnings.
Source: Indiastat
Figure 2 : State Wise Primary Education Index of India as Per Gender 2007-2013
V
olum
e XV
Issu
e V
Versio
n I
Globa
l Jo
urna
l of H
uman
Soc
ial Sc
ienc
e
© 2015 Global Journals Inc. (US)
-
5
Year
2015
( E)
Gender Gap in Education - An Indian Human Capital Formation Concern

Source: Indiastat
Figure 3
: State Wise Rank of Primary Education in India 2007-2013
Source: Ministry of Human Resource Department, Government of India
Figure 4
: Gross Enrolment Ratio of Boys and Girls (in %) 2011
V
olum
e XV
Issu
e V
Versio
n I
6
Globa
l Jo
urna
l of H
uman
Soc
ial Sc
ienc
e
© 2015 Global Journals Inc. (US)
-
Year
2015
( E)
Gender Gap in Education - An Indian Human Capital Formation Concern

Figure
5
:
Gender Parity Index 2013
Source: Government of India
IV.
Myths
and
Social Construct
The gender stereotyping starts when a girl is born. A few of them are as follows:
A girl is soft, a boy is tough, and hence a girl won’t be able to survive in the world without a man.
A girl is good in arts and literature, and boys are good at math and physics. In India in Class XII boards most of the toppers for science subjects are
girls. However, the bias continues in engineering colleges, where numbers of women are less.
V
olum
e XV
Issu
e V
Versio
n I
Globa
l Jo
urna
l of H
uman
Soc
ial Sc
ienc
e
© 2015 Global Journals Inc. (US)
-
7
Year
2015
( E)
Gender Gap in Education - An Indian Human Capital Formation Concern
0 0.5 1 1.5 2
Andaman and Nicobar Islands
Andhra Pradesh
Arunachal Pradesh
Assam
Bihar
Chandigarh
Chhatisgarh
Dadra and Nagar Haveli
Daman and Diu
Delhi
Goa
Gujarat
Haryana
Himachal Pradesh
Jammu and Kashmir
Jharkhand
Karnataka
Kerala
Lakshdweep
Madhya Pradesh
Maharashtra
Manipur
Meghalaya
Mizoram
Nagaland
Odisha
Puducherry
Punjab
Rajasthan
Sikkim
Tamil Nadu
Tripura
Uttar Pradesh
Uttrakhand
West Bengal
Gender Parity Index
Women are not competitive, lack killer instinct and are emotional in nature. Hence, cannot be successful in the business world. Globally the number of women at board level in corporate world is less than 10%.
Myth is ‘real’ women do not do math. Math is a male thing; girls are much less apt than equally talented

boys to go into math related careers. There is a sex linked math gene which makes male better in maths. Parents also have lower expectations for girls in maths and science. Female teachers increase teaching efficiency for girl students. Role models should be from same sex is also a myth which divides interest groups.
Things are assumed to be same for case of girls in all races. However, due to different social constructs should be considered in case of females as considered in male.
Girls are discriminated not only at the womb but later on in situations of opportunities as well. Access to education is also different for female and male. Education is one of the most important opportunities in nay society. Office positions, political powers and social recognition are attached with higher level of education. In rural India girls are seldom allowed to attend school. Even in those rare occasions, girls are dropped out of school so that her brother gets better facility and she in the meantime can help in household or economic activities. Girls are converted into labour for their male sibling’s future. Parents are willing to let their daughters drop out as son’s education is an investment. In many cases it is the only hope for the family to secure old age and eliminate poverty. On the contrary evidence shows people in old age home claims of always being cheated by their sons and not by their daughter. Marriage affects parent’s decision making. Indian religious and social educates requires the bride to be transferred to stay with in-laws’ family. In almost all occasions the bride bears duties of two families and seldom gets rights of any.
The conception or misconception that girls do not need education and/or school education is irrelevant to girls. Lack of women teachers, separate schools, adequate and clean toilets in schools, transport facilities to school, crime rates on road these all inhibits parents from getting girls enrolled. The early marriage and early pregnancy caused drop outs from educations.
The women are likely to work fewer hours than men, which would make a gap in weekly earnings between the two groups substantial even if the hourly wages are same. Many studies prove that educational attainment, work experience and occupational choice contribute to the
gender wage gap. Although the educational ‘up gradation’ have successfully helped in narrowing gaps but the additional issues like pregnancy, family responsibility and most important social norms do not let gender segregations to vanish. One study shows that due to weaker labour force attachments of women than men, women are assigned positions lower than men. Hence, it disagree with human capital theorists who propagates differences in efficiency only leads to difference in pay as well as productivity and all similarly productive humans are paid equivalently.
Men have not faced the negative impact of such twisted logic. However, women still face the challenges of typecasting. A woman breaks the conventional myths,
she is said to be masculine. Take the example of Indira Gandhi, Ex-Prime Minister of India. She served as a Prime Minister for 4 sessions to
talling to 15 years and is globally the longest serving female Prime Minster. She was called as the only man wearing trousers in her cabinet. Margaret Thatcher was dubbed as the “Iron Lady” by Russia. She gave an excellent rebuttal to it in her speech in Finchley in 1976. (Minow 2015)
As described in best-selling book Lean In: Women, Work and the Will to Lead, Sheryl Sandberg the problem of increasing women’s participation as “the ultimate chicken-and-egg situation”: “The chicken: Women will tear down the external barriers once we achieve leadership roles [….] the egg: We need to eliminate the external barriers to get women into those roles in the first place.” 3
V.
Alternatives
In Rajasthan, all of these problems are aggravated by high levels of seasonal migration. For many men in Rajasthan, migration is required since rural parts of Rajasthan often lack a sufficient economy to provide income for a family year-round. Women are commonly left behind to care and provide for the entire household (Fsdinternational.org).
US announced an ‘equal pay application’ challenge asking for help in building innovative tools to educate the public about the pay gap and promote equal pay for women. To help the challenge ‘salary.com’ is releasing a collection of salary data for 4,000 jobs. Knowledge of jobs pay
is an integral part of negotiation. Public data cannot be claimed by employers as false. So the application allows employees to find about salary information that can help in closeting the gap. Although it won’t address the whole issue several political interventions are required simultaneously.
In many cases ‘child care support’ system have been helpful as well. In many situations it is found that female worker’s careers are disrupted because of child care failure-
and these workers are usually women (Hofferth
& Collins 2000). The female workers when re-join are given less credentials and stay devoid of growth in career due to expected interruption of work.
Protection remains a concern in women all over world. Labour laws claims no women can be engaged in professional duties after 7 P.M. and if so can only be
allowed on written applications
by
the
individual
3 Sandberg, Sheryl (2013). Lean In: Women, Work and the Will to Lead. New York: Alfred A Knopf.
V
olum
e XV
Issu
e V
Versio
n I
8
Globa
l Jo
urna
l of H
uman
Soc
ial Sc
ienc
e
© 2015 Global Journals Inc. (US)
-
Year
2015
( E)
Gender Gap in Education - An Indian Human Capital Formation Concern
beforehand. In such scenario it is crucial to arrange efficient social protection programmes for safety of women. This will provide a less hostile working option for female. A safer opportunity will be appreciated by more women and less human capital will be loosed out due to social cause. Active politicians and social activities can help in reduction of social constraints.

Scholarship to women can also act as a motivation to induce higher degrees by women. Financial help leads to concentration of decision making power. If family do not have to invest money on education of girl child they have lesser interest in keeping female devoid of education. Scholarship is an achievement in competition and helps in creating confidence and ambition. The good work done by NGO’s and self-help groups should be acknowledged in front of common people. This will influence people with vision and interest to join
the change making. It is very important the need for change is understood by the effected people. If loss is understood by individuals seldom is the tendency to ignore elimination of cause.
References Références Referencias
1.
Becker, Gary S. The Economics of Discrimination. 2nd edition. Chicago: The University of
Chicago Press, 1971.
2.
Becker, Gary S. Human Capital. 3rd edition. Chicago: The University of Chicago Press,
1993.
3.
Burra, Neera, ‘Cultural Stereotypes and Household Behaviour: Girl Child Labour in India,’ Economic and Political Weekly 36(2001), 481-488.
4.
Caldwell, John C., P.H. Reddy, and Pat Caldwell, ‘Educational Transition in Rural South India,’ Population and Development Review 11(1985), 29-51.
5.
Dreze, Jean, ‘Patterns of Literacy and Their Social Context,’ (pp. 974-997), in Veena Das (Ed.), The Oxford India Companion of Sociology and Social Anthropology Vol II (New Delhi: Oxford University Press, 2003).
6.
Dreze, Jean and Geeta Gandhi Kingdon, ‘School Participation in Rural India,
’Review of Development
Economics 5(2001), 1-24.
7.
Filmer, Deon and Lant Pritchett, ‘Educational Enrolment and Attainment in India: Household, Wealth, Gender, Village and State Effects,’ Journal of Educational Planning and Administration 13(1999), 135-164.
8.
Fsdinternational.org. 'Gender Equity Issues In India'. N.p., 2015. Web. 28 Jan. 2015.
9.
Government of India, Department of Elementary Education and Literacy, Department of Secondary and Higher Education, Ministry of Human Resource Development, Annual Report 2005-06 (2006).
10.
Jejeebhoy, Shireen J., ‘Family Size, Outcomes for Children, and Gender Disparities,’ Economic and Political Weekly 28(1993), 1811-1821.
11.
Kingdon, Geeta Gandhi, ‘Where Has All the Bias Gone? Detecting Gender Bias in the Intra household Allocation of Educational Expenditure,’ Economic Development and Cultural Change 53(2005), 409-451.
12.
Lucas, Robert, ‘ON THE MECHANICS OF ECONOMIC DEVELOPMENT’ Journal of Monetary Economics 22 (1988) 3-42. North-Holland.
13.
Maccini, Sharon, and Dean Yang, ‘Under the Weather: Health, Schooling, and Economic Consequences of Early-Life Rainfall,’ American Economic Review 99(2009), 1006-1026.
14.
Minow, Martha L. 'Gender Stereotypes & Myths About Women'. Sonia Jaspal's Risk Board. N.p., 2011. Web. 30 Jan. 2015.
15.
Weichselbaumer, D., & Winter-Ebmer, R. (2005). A meta-analysis of the international gender wage gap. JOURNAL OF ECONOMIC SURVEYS , Vol. 19, No. 3.
16.
Kingdon, Geeta Gandhi, ‘The Progress of School Education in India,’ Oxford Review of Economic Policy 23(2007), 168-195.
17.
Qian, Nancy, ‘Missing Women and the Price of Tea in China: The Effect of Sex Specific Earnings on Sex Imbalance,’ Quarterly Journal of Economics 123(2008), 1251-1285.
18.
Ramachandran, Vimala, Gender and Social Equity in Primary Education: Hierarchies of Access (New Delhi: Sage Publications, 2004).
19.
Romer, Paul, ‘Increasing Returns and Long-Run Growth ‘The Journal of Political Economy, Vol. 94, No. 5. (Oct., 1986), pp. 1002-1037.
20.
Stanley, T.D., Jarell, Stephen, ‘Declining Bias and Gender Wage Discrimination? A Meta-Regression Analysis’ The Journal of Human Resources.
21.
Schultz, Theodore, ‘Education and Productivity’ National Commission on Productivity, Washington,
D.
C.
Spence, Michael, ‘Job Market Signalling’ The Quarterly Journal of Economics, Vol. 87, No. 3. (Aug., 1973), pp. 355-374.
22.
Stiglitz, Joseph, ‘The Theory of “Screening,” Education, and the Distribution of Income’ The American Economic Review, Vol. 65, No. 3(Jun., 1975), 283-300.
23.
Tilak, Jandhyala B.
J., ‘How Free is Free Primary Education in India?,’ Economic and Political Weekly 31(1996), 275-282.
24.
Tilak, Jandhyala B.
G., ‘Determinants of Household Expenditure on Education in Rural India,’ NCAER Working Paper no.88 (2002).
25.
Van Dyke, Jennifer. “Does it Pay to be a Man? A Study of Pay Differentials Between College
Graduates.” Research Honors Project, Illinois Wesleyan University. April 1999.
V
olum
e XV
Issu
e V
Versio
n I
Globa
l Jo
urna
l of H
uman
Soc
ial Sc
ienc
e
© 2015 Global Journals Inc. (US)
-
9
Year
2015
( E)
Gender Gap in Education - An Indian Human Capital Formation Concern
26. Zimmermann, Laura. ‘Remember When It Rained: The Elusiveness of Gender Discrimination in Indian School Enrolment’ University of Michigan 2011.

This page is intentionally left blank
V
olum
e XV
Issu
e V
Versio
n I
10
Globa
l Jo
urna
l of H
uman
Soc
ial Sc
ienc
e
© 2015 Global Journals Inc. (US)
-
Year
2015
( E)
Gender Gap in Education - An Indian Human Capital Formation Concern

© 2015. Carmelo Ferlito. This is a research/review paper, distributed under the terms of the Creative Commons Attribution-Noncommercial 3.0 Unported License http://creativecommons.org/licenses/by-nc/3.0/), permitting all non-commercial use, distribution, and reproduction in any medium, provided the original work is properly cited.
Global Journal of HUMAN-SOCIAL SCIENCE: E Economics Volume 15 Issue 5 Version 1.0 Year 2015 Type: Double Blind Peer Reviewed International Research Journal Publisher: Global Journals Inc. (USA) Online ISSN: 2249-460x & Print ISSN: 0975-587X
Malaysia Nap: More Shadows than Lights
By Carmelo Ferlito INTI International University and Colleges, Malaysia
Introduction- After World War II, and in particular during the 1960s and the 1970s, many developing countries began their industrial revolution path. In particular, most of them followed a path of government-led industrial development, with central planning at the heart of the industrial policy. Such a model is not new in economic history and it is typical of many ‘second-comers’ in the industrialization process. The most famous one is the case of Prussia/Germany: with the Zollverein (1833-34) and after the unification in 1870, it was the government which stimulated the development of a powerful heavy industrial system, following what was preached at the time by Friedrich List. In particular, the key point of List preaching was that second-comers countries need to protect their industrialization process (characterized by infant industries) from foreign competition. According to List, once the protected industries reach an adequate competitive level, protection should be removed and the national companies should face competition in the market, in order to stimulate further technological development. Many second-comers countries embraced this model; however, in most cases they failed to follow the second part of List’s recommendations: opening to the market in a second stage.
GJHSS-E
Classification : FOR Code: N15, N45, N65, P48
MalaysiaNapMoreShadowsthanLights
Strictly as per the compliance and regulations of:

Malaysia Nap: More Shadows than LightsCarmelo Ferlito
I. Introduction
fter World War II, and in particular during the 1960s and the 1970s, many developing countries began their industrial revolution path. In particular,
most of them followed a path of government-led industrial development, with central planning at the heart of the industrial policy. Such a model is not new in economic history and it is typical of many ‘second-comers’ in the industrialization process. The most famous one is the case of Prussia/Germany: with the Zollverein (1833-34) and after the unification in 1870, it was the government which stimulated the development of a powerful heavy industrial system, following what was preached at the time by Friedrich List1. In particular, the key point of List preaching was that second-comers countries need to protect their industrialization process (characterized by infant industries) from foreign competition. According to List, once the protected industries reach an adequate competitive level, protection should be removed and the national companies should face competition in the market, in order to stimulate further technological development. Many second-comers countries embraced this model2
Author: Faculty of Business - School of Accounting, Economics and Finance, INTI International University and Colleges - University of Wollongong Program, Subang Jaya, Malaysia. Institute for Democracy and Economic Affairs (IDEAS), Kuala Lumpur, Malaysia.
e-mail: [email protected]
; however, in most cases they failed to follow the second part of List’s recommendations: opening to the market in a second stage.
Malaysia is for sure among the countries which used a massive political protection in order to develop national industries, in particular the automotive industry. Malaysian case is quite unique: instead of limiting the action in attracting foreign producers, government, under the leadership of Dr Mahathir, established a national brand through specific automotive policies: NCP and NAP. However, as we shall see, the results of such policies are contradictory.
In section II. we will briefly draw a historical sketch about the evolution of the Malaysian automotive policy. In section III. the NAP 2014 will be presented. Section IV. is devoted in explaining, from a free market perspective, why tariffs and protection can be dangerous for a national economy. Finally, section V. will explain how NAP failure was predictable; if the modest
1
See List [1841] (1909).
2
See in particular Gerschrenkon (1962).
result of Proton development is widely recognized, many studies failed to point out the right reason behind such failure: government central planning. Therefore, the future role for government intervention in industrial development will be analysed. Section VI. will try to show a possible way out for the government role and the Malaysian car industry.
II. Ncp and Nap: A Brief Historical Sketch
Malaysia is one of the developing countries which, in the past decades, developed a defensive policy in order to give birth to a local automotive industry. It was in particular during the 1960s and the 1970s that many developing countries established automotive assembly industries in the realm of the so-called import-substituting industrialization (ISI) programmes3; with such programmes, they aimed to attract foreign direct investment and to protect the emergence of local industries4.Automotive was and is one of the favourite industries in which such protective schemes were implemented and the legacy of such protective policies still affects the industry5. In fact, before the mid-1960s Malaysian policy was characterized by a certain free market orientation and a regular plan of to support local industries was implemented only after pressures from the World Bank in 19636
Even if the political party known as UMNO (United Malays National Organization) has ruled Malaysia since independence in 1957, a key political moment in Malaysia history was represented by the race riots in 1969, risen after ethnic Chinese parties experienced an exploit
. As other countries, Malaysia developed such
policy through LCRs (local content regulations) and tariff protection. But, as noted in Natsuda and Thoburn (2014, p. 1353), the case for protectionist policies was not limited to economic motivations. On the contrary, «a key background was the policy designed to give ethnic Malaysia and other ‘indigenous’ people (collectively known as bumiputera) affirmative action preferences in relation to Malaysian ethnic Chinese and Indians and in relation to foreigners».
7
3 For a detailed description of Malaysian ISI policies see Rasiah (2011),
pp. 150-156. See also Danaraj (2011), p. 399. 4 Natsuda, Segawa and Thoburn (2013), p. 113.
5
Segawa, Natsuda and Thoburn (2014), p. 423.
6
Rasiah (2011), p. 152.
7
Natsuda and Thoburn (2014), p. 1355.
, winning more seats than
A
V
olum
e XV
Issu
e V
Versio
n I
Globa
l Jo
urna
l of H
uman
Soc
ial Sc
ienc
e
© 2015 Global Journals Inc. (US)
-
11
Year
2015
( E)

expected8. In particular, the political situation brought out the trade-off between the politically powerful Malays majority and the economic power in Chinese hands9. It is after these riots that the New Economic Policy started to be implemented, aiming to reduce economical inter-ethnical disparities and in particular with the sight to grow the economic position of bumiputra10. Main sight of the NEP was to achieve national unity eradicating poverty and increasing employment11
The New Economic Policy initiated in 1970 following the riots was designed explicitly to redress the economic balance in favour of bumiputra; in the 1980s it became the driving force of the country’s national car policy under its aggressively nationalist and longest-serving fourth Prime Minister, Dr Mahathir Mohamed (1981-2003)
, and government had immediately clear that to do so meant to support the Malay population.
12
Regarding the specific situation of the automotive industry, the New Economic Policy came after a series of protection schemes was already
introduced in order to develop a national car industry: the import licence scheme (1966) and the Manufacturing License (1967)
.
13. Thanks to such protection, from 1970 to the early 1980s, the total production of vehicles grew from 28,000 to 100,000 units14
The protection policy became more aggressive during the 1980s, when the regulation on the so-called local contents were introduced, together with a stronger intervention in order to
enhance bumiputra
participation in heavy industries
.
15. It is in the 1980s, in fact, that the Fourth Malaysia Plan (1981-1985) focused on the process of heavy industrialization16. The establishment of Proton was decided with the First Industrial Master Plan (1986-1995)17. With regard to car industry protection, foreign producers were required to manufacture specific components locally, rather than importing them; at the same time protection via tariff and investment incentives was raised in order to protect local component producers18.In 1982, in example, tariffs on CBU PVs were 90 to 200 per cent19
.
8
Lim (2011), p. 12.
9 Lim (2011), p. 12.
10
Natsuda, Segawa and Thoburn (2013), p. 114.
11
Lim (2011), p. 12.
12
Natsuda and Thoburn (2014), p. 1355.
13
Natsuda and Thoburn (2014), p. 1355.
14
Natsuda, Segawa and Thoburn (2013), p. 120.
15 Natsuda, Segawa and Thoburn (2013), p. 120.
16
Lim (2011), p. 19.
17
Danaraj (2011), p. 400.
18
Natsuda and Thoburn (2014), p. 1356.
19
Segawa, Natsuda and Thoburn (2014), p. 425.
V
olum
e XV
Issu
e V
Versio
n I
12
Globa
l Jo
urna
l of H
uman
Soc
ial Sc
ienc
e
© 2015 Global Journals Inc. (US)
-
Year
2015
( E)
Malaysia Nap: More Shadows than Lights
Table 1 : Tariffs on CBU PVs (%)
Before 1997, Oct
1997Oct
2004Jan
2005Jan
2005Oct
2006Mar
2010Jun
Non-Asean/ Less than 1,800cc 140 140 80 50 30 30 30Non-Asean / 1,800cc – 1,999cc 170 170 100 50 30 30 30Non-Asean / 2,000cc – 2,499cc 170 200 120 50 30 30 30Non-Asean / 2,500cc – 2,999cc 200 250 160 50 30 30 30
Non-Asean / Over 3,000cc 200 300 200 50 30 30 30Asean / Less than 1,800cc - - 70 20 15 5 0Asean / 1,800cc – 1,999cc - - 90 20 15 5 0Asean / 2,000cc – 2,499cc - - 110 20 15 5 0Asean / 2,500cc – 2,999cc - - 150 20 15 5 0
Asean / Over 3,000cc - - 190 20 15 5 0
Source: Segawa, Natsuda and Thoburn (2014), p. 426.
Through such policy, the local content in the automotive industry increased from 8% in 1979 to 18% in 1982 and 30% in 198620. Finally, in 1991 the Malaysian government introduced the local Material Content Policy, aiming to reach 60% of local content for PVs of less than 1850cc and 45% for PVs of 1851-2850cc by 199621.
20 Natsuda and Thoburn (2014), p. 1356.21 Natsuda and Thoburn (2014), p. 1356.
Project (NCP), introduced in 198222. Prime Minister ‘dream’ was to see Malaysian driving cars they had built themselves23; in a way, Mahathir was right in arguing that local manufacturing is a necessary step for a country which wishes to develop; being able to import foreign product or assembly them would be not enough24.
In late October 1982, Mahathir Mohamad, the fourth Prime Minister of Malaysia, announced that Proton would be established to produce the first national car, which would be named the Saga. This National Car
22 Natsuda, Segawa and Thoburn (2013), p. 120.23 Mahathir (2011), p. 510.24 Mahathir (2011), p. 512.
However, what distinguishes Malaysia among the developing countries is the attempt not simply to grow as manufacturing hub for foreign producers; rather, under Mahathir direction, during the 1980s, Malaysia implemented a big effort to develop a national
car manufacturer through the so-called National Car

industries. The project was also expected to strengthen the economic position of the bumiputeras
and secure their participation in supporting industries
25
Therefore, the sight of the project was twofold: creating a car producer and, at the same time, «enhancing bumiputera
participation in heavy industries»
.
26
25
Segawa, Natsuda and Thoburn (2014), p. 424.
26
Natsuda and Thoburn (2014), p. 1356.
. Proton was born in 1983 and Malaysian government invested RM 480 million to establish the first factory27; however, the company was not able to reach a profit until 198928.
Perodua, the second Malaysian car producer, launched its first manufacturing plant in 199429; while the first remains a national flagship, with capital majority in local hands, the policy for Perodua was less aggressive and nowadays the control is still in Japanese hands30
The creation of Proton via NCP became one of the strongest areas of government intervention in Malaysia. In fact, the national automotive industry was, and is, not only protected by tariffs and the system of local content, but also heavily subsidised: only between 1986 and 1994, the Ministry of International Trade and Industry of Malaysia spent RM 22 million to support the bumiputera
participation in companies producing high-technology components
. Thanks to such protection, Proton and Perodua dominate the Malaysian automotive market.
31.Bumiputera
protection was implemented in particular through the Vendor Development Program: under this scheme, Proton had to buy several components from small and medium enterprises32in which more than 70% of equity was held by bumiputera
and in which more than 55% of total employees were bumiputera33
-
difficult relationships with the technological partner, Mitsubishi, which ended in a divorce;
.
In the following years, Proton and the NCP suffered several problems due to:
-
the acquisition of Lotus with the consequent financial troubles;
-
the free-trade agreements signed in the WTO and South East Asia cooperation realms.
27
Natsuda, Segawa and Thoburn (2013), p. 120.
28
Natsuda, Segawa and Thoburn (2013), p. 120.
29
Mahathir (2011), p. 521.
30
Segawa, Natsuda and Thoburn (2014), p. 424.
31
Natsuda and Thoburn (2014), p. 1356 and Natsuda, Segawa and
Thoburn (2013), p. 120. 32
It means with shareholders’ funds below RM 2.5 million. Segawa,
Natsuda and Thoburn (2014), p. 429. 33
Segawa, Natsuda and Thoburn (2014), p. 429.
V
olum
e XV
Issu
e V
Versio
n I
Globa
l Jo
urna
l of H
uman
Soc
ial Sc
ienc
e
© 2015 Global Journals Inc. (US)
-
13
Year
2015
( E)
Malaysia Nap: More Shadows than Lights
Project aimed to accelerate Malaysia’s heavy industrialization and the development of supporting
In fact, starting in the 2000s, the automotive industry changed. The concentration process made the big players more important. Therefore many developing
countries focused in attracting such big players into their territory and in becoming regional hubs for their production and export34. But Malaysia preferred since the beginning the ambitious project to develop its own national brand35.The most evident sign of the troubles suffered by Proton is the fact that in 2005 it was overcome by Perodua in terms of number of cars sold36. Even the privatization attempted in the 1990s did not succeed and government had to purchase back 27.2% of the company from DRB-HICOM though Petronas in 200037
Regarding, instead the obligations imposed by the WTO, Malaysia tried to gain time, moving forward the terms for removing tariffs
.
38
Although all the tariffs on CBU and CKD vehicles were reduced, the government introduced a new excise duty system to compensate for the revenue losses from the reduction of tariffs in 2004. Furthermore, in March 2006, the Malaysian government introduced the National Automotive Policy (NAP), which linked refunds of the excise duty to the level of local content ratio, enabling the Malaysian government to protect local national car producers that, in general, used locally made components of lower cost and quality than imported ones
, and, above all, replacinga policy of direct intervention with new and more hidden means of protection.
39
The replacement of the NCP with the NAP became necessary with the aim to restructure a suffering industry. Government looked at the possibility to facilitate integration of Proton into the global automotive GVC (2006) and started to emphasize the possibility to develop an environment-friendly strategy (2009)
.
40. However, Malaysian government did not miss the occasion to introduce hidden forms of protectionthrough the Industrial Linkage Programme (ILP) and the Industrial Adjustment Fund (IAF)41, still linked with the LC system42.Favourable treatment was introduced for national car assembly, together with other non-tariff barriers like import quotas43
34 Natsuda, Segawa and Thoburn (2013), p. 113.35 Natsuda, Segawa and Thoburn (2013), p. 114.36 Natsuda, Segawa and Thoburn (2013), p. 114.37 K.S. and Tan (2011), p. 353.38 LC requirements and the mandatory deletion programme were abolished in January 2004. Natsuda, Segawa and Thoburn (2013), p. 124.39 Natsuda and Thoburn (2014), p. 1360.40 Natsuda, Segawa and Thoburn (2013), p. 125.41 Natsuda and Thoburn (2014), p. 1360.42 Natsuda, Segawa and Thoburn (2013), p. 126.
. In this way, Malaysia was able to avoid to violate WTO rules and in the same time to implement a system of advantages for the national automotive industry. Moreover, the AP system (1966)
Natsuda, Segawa and Thoburn (2013), p. 122 and 125.43
and the ML system (1967), which are not in line with WTO prescriptions, were never abolished44. At the same
44 Natsuda and Thoburn (2014), p. 1360.

time, NAP 2006 and NAP 2009 found new ways to support and promote local vendors, a policy that WTO is strongly asking to withdraw45
Politics has also been an important part of the affirmative action story. On the one hand, the bumiputera
policy
has aimed to achieve sustainable social stability by addressing Malay grievances. On the other hand, the continuation of the policy has been deeply involved in the maintenance of the ruling Barisan
Nasional’s political power in the country and the legitimacy of its leading party, the United Malays National Organisation (UMNO) as a Malay party. The cessation of the Malay preferential policies will not happen without strong political determination on the part of the government […]. It is difficult to imagine
that the BN government – returned to power in the May 2013 election – will abolish the bumiputera
policy in the foreseeable future […]. In this sense Proton has become an albatross around the necks of Dr Mahathir’s successors, who have had to deal with Proton’s weaknesses while at the same time retaining their legitimacy within UMNO. Furthermore, MITI insists that Malay special rights are guaranteed in the Constitution, and that the WTO and other organisations do not understand the backwardness of the Malays and their need for preferential policies
. Malaysian government, however, intends to continue its support to Proton and the bumiputerasupport policy remains a central and hot topic of the political agenda also regarding automotive and, in general, industrial development policies.
46
However, even with such a massive protection and with heavy government investments, we can say that the Malaysian car industry is not bringing out the expected result. If it is true that Proton and Perodua in 2010 were producing 57.2% of the Malaysian car output in 2010, in 2012 Malaysia was still a net importer of vehicles
.
47. Countries like Thailand, instead, focused in becoming a hub for international producer such as Toyota and results were satisfactory; Malaysian policy aiming to develop a national car brand didn’t produce the same good results: Thailand attracted, in the period 2005-2010, 20 times more FDI than Malaysia48
Bad performances reflected in general on the industry. Due to the protection of the LC requirements, local suppliers of parts, mainly serving Proton, still do not meet international standards
.
49.In particular, Malay preferential policies have in a way impeded further steps toward higher value-added activities50
45 Segawa, Natsuda and Thoburn (2014), p. 432.
46 Segawa, Natsuda and Thoburn (2014), pp. 436-437.
47 Natsuda and Thoburn (2014), p. 1362.
48 Natsuda and Thoburn (2014), p. 1364.
49 Natsuda and Thoburn (2014), p. 1364.
50 Segawa, Natsuda and Thoburn (2014), p. 425.
.
V
olum
e XV
Issu
e V
Versio
n I
14
Globa
l Jo
urna
l of H
uman
Soc
ial Sc
ienc
e
© 2015 Global Journals Inc. (US)
-
Year
2015
( E)
Malaysia Nap: More Shadows than Lights
In general, automotive protection failed to stimulate (or even blocked) technological development
and failed to meet market demand. As we shall see later, such as a result was to be expected.
III. Nap 2014: A Summary
NAP 2014 does not appear as a radical revolution compared with what was implemented under NAP 2006 and its 2009 review. The most important news appear to be the focus on «green initiatives, development of technology and human capital […] and enhancement of the automotive industry ecosystem»51. With NAP 2014 government focus is shifting from the development and defence of the local car manufacturing toward the possibility for Malaysia to become «regional hub in Energy Efficient Vehicle (EEV)»52
With NAP 2014, then, government plans to spend more in technological and environmental-oriented policies. However, it seems that the way to support such initiatives is not new: MLs for EEV category and customized incentives
.
53. Moreover, is the government in itself that assumes the burden to provide relevant infrastructure54
Moreover, government plans to spend RM 75 million to further support the growth of bumiputerapresence in the automotive industry
. All the future action is planned to be sustained with favourable loans and tax support.
The most interesting part, however, is the support for developing human capital, in order to enhance the local technological growth. Still, it will be the government taking care of the training programs necessary to enhance technicians quality.
55. What looks really impressive is the claim that the «NAP 2014 will include measures to create globally competitive Bumiputera entrepreneurs»56
The last sentence confirms us in the belief that nothing is radically changing with NAP 2014. We can see a shift in the focus from the manufacturing side to the environment and technological perspectives. However, everything strongly remains linked with the big and visible of government action. No opening to the market is appearing. Market expectations are supposed to be known by the central planner: government assumes, in example, that a Malaysian hub for EEV is what the Asian automotive market actually needs and asks for. Government is assuming that specialized technicians are what the labour market actually wants. The pretence of knowledge is high. Even, government is aiming to create competitive entrepreneurs. But is
.
51 MITI (2014), point 4.52 MITI (2014), point 5.ii. 53 MITI (2014), point 24.54 MITI (2014), point 27.iv. 55 MITI (2014), point 49.ii.56 MITI (2014), point 48.
government mission to create entrepreneurs? And can actually and practically a centrally planned action

sections will deal with the effects of a government-led development and the impossibility for it to bring out satisfactory results.
IV.
What did go Wrong? Economic Arguments against Government
Industrial Protection
The usual motivation behind the choice to protect the birth and development of a new industry in every
country is quite straightforward: the new industry is strategic for the country development; the new industry could bring out new employment; being not yet adequately developed, it would need protection against external competition. Protection is thus presented as the necessary step in order to protect an industry who could develop the country and create new jobs. And in such a context, setting up «a motor industry is often seen as a crucial stage in industrialisation»57
Let us have a deeper look into such
straightforward argument with a practical example. Suppose
.
58
that the average cost to import a foreign vehicle on the Malaysian market is 100. If an emergent industry requires tariffs, it means that, at the present status of the industry technology in that
country, it would not be possible to produce vehicles at a competitive price. In our example, if Malaysian automotive industry requires to be protected, it means that, given its technology and productivity, it is not able to produce cars spending less than 100. Therefore, in order to allow automotive industry to come into existence, Government will be forced to make imported vehicles more expensive. Suppose that production cost for Malaysian cars is 120. In order to make Malaysian cars attractive, Government should impose a duty able to: cover the Malaysian production cost, allow a profit for the producer and cut off the feeling that foreign cars are better and therefore it is worth to pay more money for them. A duty of 30 on foreign cars would not be enough in order to cover the three points. Most likely an adequate duty should be 8059
1.
In case of free market (free of duties):
. At the given technology and productivity of Malaysian automotive industry, situation can be summarized as follows:
a.
Malaysians could have foreign cars at 100.
57
Segawa, Natsuda and Thoburn (2014), p. 422.
58
The example is modelled on Hazlitt [1946] (2012), pp. 58-59.
59
The estimation in our example is not exaggerate. In fact, as reported
in in Natsuda, Segawa and Thoburn (2013, p. 121), the «effective rate of protection (that is, protection on value-added) for the Malaysian transport and equipment sector as a whole was 252% in 1987, a very high figure, which probably had been
reduced to about 140% for the
least protected vehicles by 2011».
V
olum
e XV
Issu
e V
Versio
n I
Globa
l Jo
urna
l of H
uman
Soc
ial Sc
ienc
e
© 2015 Global Journals Inc. (US)
-
15
Year
2015
( E)
Malaysia Nap: More Shadows than Lights
develop entrepreneurship in a country? The next two
b. Malaysian automotive industry would not arise unless a better technology and productivity would emerge.
c. Improvement of technology and productivity would be stimulated, in order to force the country to compete with foreign products.
2. In case of import duties:
The simple example easily demonstrates how tariffs create, at a first glance, two direct bad effects: 1. stop incentives for technological development and 2. increase price of products. Point 1. is easy to understand and does not need to be stressed. However, it would be interesting to reflect on the consequences of point 2. Even if, with tariffs, local cars would be cheaper than the imported ones, they are still more expensive than foreign vehicles in case of free market. What it is not always observed is that, de facto, introducing tariffs means to shift on people money the cost of industrial development. In fact, after tariffs, citizens would be forced to finance the cost of bringing the new industry into existence (40% in our example).
Bad consequences are then spread on other industries. In fact, people will have to pay now 140 for what was paid before just 100. Indeed, we can say that citizens are financing the emergent industry. But this means also that if before people could spend 100 for cars and 40 for other products, now they would have to spend 140 only for vehicles, being forced to cut theirexpenditures in other industries. Imposed tariffs therefore force people to cut their consumption: real incomes shrink not only because of the highest prices of cars, but also because the minor expenses devoted to other industries will force such industries to eventually cut their labour force.
Everybody seems to be happy in watching a new industry arise and new jobs created. This fact is pretty evident. But such evidence hides the bad consequences of tariffs: increased prices, less money available for different consumptions (diminished real wages), unemployment spreading in other industries because of the shift in relative prices.
Therefore, the relationship between industrial protection and employment is a fallacious one, as fallacious seemed, in the past, all the policies aiming to
60 See also Natsuda, Segawa and Thoburn (2013), p. 114.
support employment61. Stimulating emergent industries means to modify the structure of relative prices, and as
61 Ferlito (2013), chapter 3.
a. Malaysian could have foreign cars at 180.b. Malaysian could have local cars at 140
(production cost plus profit).c. Technology and productivity would have no
incentive to be improved, given the fact that local cars are more convenient in price. Indeed, as argued in Natsuda and Thoburn (2014, pp. 1358-1359), «Proton suffered from weak product development and marketing capacity»60.

strategies. This change in production strategies will result in a change in the composition of the demand for capital goods of those entrepreneurs, and will also reduce the aggregate amount of money devoted to buying lower-order goods in the market. Therefore many entrepreneurs will stop buying goods from their usual suppliers. As a result, these suppliers will lose part of their markets and many will be forced to lay off workers or event to cease business62
There are other aspects to be mentioned as negative for the national economy. First of all, the cost for industrial protection. With the aim of developing
.
This means that the change in the structure of
relative prices, set in motion by support for national industries, triggers a disinvestment process that, weakening the consumption goods sector, generates unemployment.
Moreover, it has to be argued that, introducing
to people products at a price higher than the market one, central national industrial protection enhance an inflationary dynamics.
Short term injections of money (industrial support) may well help maintain jobs at a higher level than would be possible otherwise; nonetheless, in the long term, the employment level resulting from these policies is destined to fall.
While it is true that an increase in monetary
incomes may increase employment, the basic mistake is to believe that implementing industrial government support may automatically generate employment. If spending is spread across the various sectors in a manner other than that in which employment is spread in the same sectors, then it cannot be assumed that an increase in spending has a positive effect on employment.
The main outcome of inflationary forces and
planning is to create a distortion in the system of resource allocation. A readjustment process is only possible where the free interaction of individuals allows the creation of information (discovery process) needed to catch mistakes and take a different path.
When government support comes
to an end, probably because inflation has reached an unsustainable level, demand will be forced to return in the direction expressed by the temporal preferences in existence prior to central intervention; inasmuch, employment created artificially in all probability will not be permanent. The new unemployment level may even be higher than the pre-stimulus situation, if monetary injections (subsidies and tariffs) have not only increased employment but have also stimulated the creation of new economic initiatives in the sectors so stimulated.
62
See Ferlito (2013), p. 99 and Sanz Bas (2011), p. 298.
V
olum
e XV
Issu
e V
Versio
n I
16
Globa
l Jo
urna
l of H
uman
Soc
ial Sc
ienc
e
© 2015 Global Journals Inc. (US)
-
Year
2015
( E)
Malaysia Nap: More Shadows than Lights
a result, many entrepreneurs will modify their production
‘national interest’ governments are able to make the people to digest the burden for the protectionist policies.
In fact, as we already have seen, the prospective of higher employment and national income (GDP) is the political argument to support every national industry, hiding the fact that the people will be burdened with higher prices products.
Discussions on matters of economic growth have become a favourite pastime of our age. Among newspaper readers and television viewers all over the world, even among some economists, the notion that in this great age of ours it has become possible to sum up in one single figure the result of the economic activity of groups of individuals in countries, regions, or industries, appears to be accepted as a self-evident truth. Such figures are then used as a measure for comparisons over time and, with gusto, between countries. In many circles a low rate of growth of the gross national product has come to be regarded as a symptom of a social malaise63
In the above passage, Lachmann anticipated the present day critics toward GDP as a reliable instrument for measuring economic performances in a country and among countries
.
64. However, the central point is «how it would have to be reached», while the «pattern of action required for the ‘path’ that leads towards it, is in general neglected»65
Such critics reveals a contradictory aspect ofgovernment plan for national industries defence: the micro foundations hidden behind the supposed macroeconomic development. Malaysian government heavily subsidised Proton, spending billions of RM. What people fail to realize is that the burden of those subsidies is directly shifted on rakyat shoulders. This happens in a double way: first through taxation. Money for subsidies has to come from somewhere and a higher taxation is the price that people pay (often praising at the same time the nationalistic economic policies because of their ideological appeal). Second, government can finance its development projects through further debt. This means a heavier fiscal burden for future generations
.What (1973, p. 39) says can be interpreted in this way: neglecting how employment and GDP are generated means to hide the social cost created by implemented policies. Which is their cost? Who will pay for that?
66. It is enough to mention that Malaysian government spent RM 700 million for supporting the automotive industry in 2013 and RM 5 billion in 2012. In the first ten months of 2013 the amount reached RM 3 billion67
63 Lachmann (1973), p. 36.64 Ferlito (2015), p. 18.65 Lachmann (1973), p. 39.66 Ferlito (2012b), pp. 111-113.67 MITI (2014), point 8.
. Who is paying for this? It seems people fails to see that the burden of such heavy investment is on their shoulder (if paid through taxes) or on the shoulder of future generations (if investments are financed by debt).

In such a situation68, the government, issuing additional debt, increases the demand for loanable funds, making the interest rate to rise. This fact brings out two consequences: on one hand, the supply of loanable funds rises; on the other hand, we see a reduction in the demand for investment from private sector. But less investment means more consumption.This means that «with a reduced rate of investment, the economy grows at a slower rate, impinging negatively on the consumable output available in the future. To this extent, the debt burden is shifted forward»69
A larger deficit means lower taxes today on all taxpayers,
shifting «some of the burden of current government spending onto future voters who are inadequately represented in today’s borrowing decisions». This means that, in such a way, a higher level of government spending becomes politically palatable
, to the future generations.
70. Furthermore, as we can learn from the European crisis, borrowing can become an endless business, in particular if the debt is bought by Central Bank, that, monetizing it, creates distortions71
-
higher interest rates (if the government borrows domestically);
. Commenting the enormous American deficit,
Garrison comes back on this topic, stressing that, at that level of borrowing, the
effect of deficit will be:
-
increased inflation (if the Federal Reserve monetizes the debt);
-
weakened export markets (if the government sells debt abroad);
-
tax hikes […]; or
-
all the above in some combination72
It doesn’t matter where the resources for financing deficit come from. The situation is always negative. First of all, the government can borrow domestically
.
73
The second possible situation is that the government borrows from the central bank. This is the classical example for money creation. The typical result is that the «increased borrowing and spending put upward pressure on prices and wages», generating an
. In this case, Garrison (2001, p. 113) argues that, if individuals lend money to the government, then their saving is not available for private investment. Thus, demand for loanale funds that comes from government wins the competition against the firms.
68See Garrison (2001, p. 85).
69
Garrison
(2001), p. 87.
70
White & Garrison (1999), p. 8.
71
White & Garrison (1999), p. 8.
72
Garrison (2003), pp. 3-4.
73
Garrison (2001), pp. 113-114.
V
olum
e XV
Issu
e V
Versio
n I
Globa
l Jo
urna
l of H
uman
Soc
ial Sc
ienc
e
© 2015 Global Journals Inc. (US)
-
17
Year
2015
( E)
Malaysia Nap: More Shadows than Lights
inflationary process; the following adjustment brings out «inequities, perversities, and inefficiencies»74.
74 Garrison (2001), p. 114.
The last possibility is that government borrows in world capital markets, from foreign savers and foreign central banks. This situation brings out a negative effect in real economy: deficit in international trade. In fact, ordinarily two countries exchange goods for goods. But, in this case foreign investors trade goods for Treasury bills, so the national industries are seriously damaged by such a politics75
V. Automotive Government Protection: A Failure to be Expected
. The final and most important result of a
protection policy is on the structure of production. In fact, through government intervention, the productive structure is not defined by economic actors preferences, tastes and expectations. On the contrary, it is defined by government priorities and, in the best case, by what government assumes to be the good for the country. However, good intentions not necessarily meet reality. How can government implement and industrial plan which could actually meet market/consumer expectations? How can do this in the global market realm? Government, of course, lacks the necessary information content for a successful action and this is why its industrial effort is often frustrated. This problem will be analysed in detail in the next paragraph.
As we have seen, government protection worked as a break for technological development76. Not only, government action also failed to supply what desired by consumers in the market77. As we shall argue soon, the result is not surprising and it had to be expected. Before starting such analysis, however, it is necessary to stress that NCP and NAP not simply failed to create a competitive Malaysian car brand, but they, together with the NEP in general, also missed their second target: to implement the bumiputeraentrepreneurial action in the realm of Malaysian industrial development. Such a failure is recognized, first and for all, by former Prime Minister Mahathir, who was a stronger supporter of the NEP. In recent interviews78
The Government provides them [the Malays] all kinds of support to help them acquire knowledge and
, Dr M admitted that he tried, for 22 years, to change Malays mentality, but the result was a failure. Mahathir’s conclusion is that Malays are lazy and the NEP furtherly increased such laziness. Dr M’s delusion regarding the failure of the NEP towards bumiputera is clearly stated in his latest book.
75 Garrison (2001), p. 115.76 Natsuda, Segawa and Thoburn (2013), p. 114 and 126.77 Natsuda and Thoburn (2014), p. 1359 and Natsuda, Segawa and Thoburn (2013), p. 126 and 128.78 See Rahim (2014) and Shi-Ian (2014).
skills. Unfortunately, they have developed a dependency on this support and demand that it be made permanent.

What is the good of becoming an independent nation if internally as individuals and as a community we are always dependent on others?
[…]
I have discussed the New Economic Policy at
length in these pages and how it has contributed much towards overcoming the gross economic disparities and social disadvantages between the races in Malaysia. But affirmative action cannot go on forever. I had hoped that much of the disparity would disappear through education, which is why we endured criticism of discrimination in the award of scholarships. But it is now nearly 40 years since the NEP was first implemented and we still have not achieved our target of making the Malays own 30 per cent of the country’s corporate wealth. The Government’s provision of enhanced access to university education to Malays has seen a similar wasting of opportunities. To ask the non-Bumiputera to stand aside and wait while so many of the Bumiputera are happy to play around and not study is unfair.
[…]
Perhaps many Malay men like things that way,
to be economically dependent upon and supported by their wives while they laze around in coffee shops or indulge in motorcycle stunts. […] then they should not deny the right of others. Their attitude makes me worry about the Malay future79
«Where, I wonder, have we gone wrong?».
80
is
the laconic conclusion of Dr M, who adds: «What more do they [the Malays] expect to be done for them?»81
Coming back to the economic perspective, we hinted that such a failure had to be expected. Why? In order to explain this it is necessary to explain why every kind of central planning is destined to be a failure
. We stressed this aspect in order to remark how the automotive protection can be judged as a failure not only on the economic perspective but also from the racial point of view.
82
The central question to be posed is whether rational economic calculation is possible in a centrally planned economic system (or in a specific industry).Such a question brings out another point: can the plan of a single man or institution (central planner) replace the free interaction of individuals in a complex
. We shall demonstrate that even without considering the a posteriori
negative effects that State intervention may introduce into the system, every degree of planning is theoretically untenable a priori.
79
Mahathir (2011), pp. 756-757.
80
Mahathir (2011), p. 756.
81
Mahathir (2011), p. 757.
82
On this see in particular Ferlito (2013), chapter 4, Huerta de Soto
[1992] (2010), Mises [1920] (1990) and Hayek (1935).
V
olum
e XV
Issu
e V
Versio
n I
18
Globa
l Jo
urna
l of H
uman
Soc
ial Sc
ienc
e
© 2015 Global Journals Inc. (US)
-
Year
2015
( E)
Malaysia Nap: More Shadows than Lights
society? We can start our analysis defining socialism as «any system of institutional aggression on the free
exercise of human action or entrepreneurship»83
During the given period of time, exposure to the decisions of others communicates some of the information these decision-makers originally lacked. If they find that their plans cannot be carried out, this teaches them that their anticipations concerning the decisions of others were overly optimistic. Or they may learn that their undue pessimism has caused them to pass up attractive market opportunities. This newly acquired information concerning the plans of others can be expected to generate, for the succeeding period of time, a revised set of decisions
. Human action is the core of economic analysis. In particular, human action deals with the ends-means framework chosen by individuals. Every economic agent is moved by expectations and preferences. Expectations and preferences generate desired ends. The content of information at disposal of each actor allows him to choose the supposed suitable means in order to reach the desired ends, consistently with expectations. The attempt to coordinate ends with means, in turn, generate action plans. Of course, plans are always consistent with the content of information at disposal of each individual at a certain moment in time. However, the setting in motion of plansput individuals in relationship with each other. Knowledge and information, therefore, change through the interaction happening in the market. Thanks to such information transmission, errors can be discovered, expectations and preferences change, plans need to be revised in the attempt to make them more mutually consistent. It is important, thus, to observe the existence of limitedinformation and to look at the market as the place in which such limited information can become less limited, moving the actors to a higher consistency between their relative plans.
Consumers, entrepreneur-producers and resource owners are the players in the market; the latter, in turn, is where their interacting decisions, during any period of time, take place. Every player has his own content of (limited) knowledge, tastes and expectations. Depending on their knowledge, tastes and expectations, the players set up their action decisions, or plans. Since, in order to carry out their plans, individuals need to interact, it is only through interaction and in time that content of information will be modified and eventually a revision of decisions can happen.
84
Market process is then built up by «this series of systematic changes in the interconnected network of market decisions». Therefore, and this is the central point, it is not possible to conceive a market process in the realm of perfect knowledge. The process arises
.
83 Huerta de Soto [1992] (2010), p. 3.84 Kirzner (1973), p. 10.
precisely because of the initial ignorance of market participants and the natural uncertainty of human action.

And the process can only happen during the flow of real time. With no market ignorance and no review
of plans, there is no process at all. Since from one period of market ignorance to the next one, ignorance has been somewhat reduced, market participants realize that not only should they implement more attractive opportunities but also that such attractiveness needs to be judged in comparison with the opportunities offered by competitors. When the incentive to offer more attractive opportunities stops, the competitive process stops, too85
85
See Ferlito (2014a).
. To conceive economic action in this way means
that all subjects, in
a way, perform entrepreneurial actions. Having defined the objectives, the means for achieving them must be chosen in a process that unfolds over time. The attainment of certain objectives naturally involves costs, arising from the subjective perception of renouncing the attainment of other goals. The expectation is that the subjective benefit obtained on attaining the objective is higher than cost/sacrifice. The concept of entrepreneurial profit lies in this difference. This does not mean that losses may not be incurred or entrepreneurial errors be made. That is, over time, entrepreneurs may realise that errors were made in the choice of means and purposes and that these entrepreneurial activities must therefore be reviewed. This is possible precisely because, through the free exercise of human action, discovering errors increases the heritage of information. The nature of economic calculation lies in this comparison between entrepreneurial gains and losses. In a market regime, such assessments are possible
because subjective assessments, in terms of income and sacrifice, are transformed into objective values through the price mechanism. It precisely mirrors the subjective meeting of subjective assessments that, in meeting, generate objectively weighted and quantifiable assessments.
Such definition of human action and
entrepreneurship is flanked by a corresponding idea of socialism, as we noticed before. If the socialist perspective would be technically possible, it would be possible, in its realm, to experience a rational calculation as the one happening for the individual planning; rational calculation means the possibility to compare costs and revenues expressed in objective prices.
This means that it would be possible for a central planner to gather all the data needed to produce a perfect rational economic calculation. In this way, the central authority, after collecting the necessary information from the minds of individuals, provides all the new information to the players, in terms of prices, the goods to produce, how many, etc...
V
olum
e XV
Issu
e V
Versio
n I
Globa
l Jo
urna
l of H
uman
Soc
ial Sc
ienc
e
© 2015 Global Journals Inc. (US)
-
19
Year
2015
( E)
Malaysia Nap: More Shadows than Lights
Two main objections can be raised. Firstly, the type of information that each subject possesses, of an
exclusive character, is by nature tacit and cannot be articulated. This means that it is «logically impossible for this information to be transmitted to the governing body»86
As a result, we realised how the nature of the problem does not consist in one or another system of equations to be solved but, rather, in understanding how human action and related knowledge actually take part in the market process. Even if a central planning body had a certain amount of information at disposal, judged good enough to determine a plan, the fundamental problem is that, once the plan is notified to the individuals, during its implementation the information resumes its dynamic process of change, thereby making the data used to define the plan already ‘old’. Yet this does not mean say that no plans exist in economic action. Quite the opposite. Plans are continually implemented by individuals in an effort to attain their objectives. And we must not conclude that the knowledge available to individuals is perfect, given and unchangeable. On the contrary, it is constantly changing. However, in the process of interaction between individuals, the dynamic process of acquiring information can take place over time and allow plans to change accordingly, in the ceaseless search for mutual coordination, thanks to the information transmission operated by prices. In a more or less planned system, however, it is assumed that data remain unchanged for a period of time that is long enough to allow the plan to be implemented; this assumption, by evidently distorting reality, contains the core for the failure of every planning experiment
. In fact, the problem is not merely quantitative; it does not simply involves an enormous amount of data but also the dispersion of such information among individuals, as well as of its being impossible to transmit it to any planning organ. This argument, which we could define as static, can be flanked by a dynamic argument, which can be summarised as follows: the information available to individuals is not given once and for all; rather, it is continuously modified, so that – in a dynamic process taking place in real time – expectations and plans change with it.
It is clear, then, that in a socialist system, the mediator role played by the price system is absent. Since there are no subjective evaluations, because everything is determined by the central authorities, prices cannot exist. As we noticed before, prices are the objective synthesis of subjective evaluations exchanged in the market. Without the market, such a synthesis function cannot happen and prices cannot arise. Calculation is impossible.
87
86 Huerta de Soto [1992] (2010), p. 54.87 On this see also Phaneuf and Ferlito (2014).
.Such argument, however, seems not to be
understood nor by politicians neither by economists.

The fact is witnessed by the massive government intervention developed in the East and in the West after World War II.
For more than half a century, the belief that
deliberate regulation of all social affairs must necessarily be more successful than the apparent haphazard interplay of independent individuals has continuously gained ground until to-day there is hardly a political group anywhere in the world which does not want central direction of most human activities in the service of one aim or another88
Economists are especially guilty for being not able to understand the objections to central planning, resting « on the impossibility within a socialist system of generating the practical information
in the form of market prices, that is necessary for the intellectual division of knowledge which a modern society requires and which only arises from the creative capacity of human action or entrepreneurship»
.
89
The main reason why we cannot hope to achieve efficiency, through centralised management, in the use of resources not even remotely comparable to what is made possible by the market is that the economic order of all large societies is based on the use of special circumstantial knowledge spread among
thousands or millions of individuals
.
90
After decades of socialist experiments, we can easily conclude that the most important theoretical knowledge gained from a basic analysis of the effects of price controls is this: the effect of intervention is the very opposite of what it was meant to achieve. If government is to avoid the undesirable consequences, it cannot stop with just market interference. Step by step it must continue until it finally seizes control over production from the entrepreneurs and capitalists
.
Central planning, therefore, by preventing the
exercise of entrepreneurial functions, even if only limited to the main capital assets and natural resources, does not allow the creation and transmission of the practical information needed to form of a price system, a necessary aspect for every rational economic calculation. It is clear that the problem cannot be circumvented by an arbitrary system of prices defined by a central authority based on premises more or less
extraneous to reality. Every socialist economic decision takes place in total and utter ignorance of economic processes and without the basis for rational economic calculation.
91
How is it possible for politicians and, in particular, for economists to have indulged for so long
.
88
Hayek (1935), p. 1. 89 Huerta de Soto [1992] (2010), pp. 104-105. 90 Hayek (1976), p. 6. 91 Mises [1929] (1996), p. 105.
V
olum
e XV
Issu
e V
Versio
n I
20
Globa
l Jo
urna
l of H
uman
Soc
ial Sc
ienc
e
© 2015 Global Journals Inc. (US)
-
Year
2015
( E)
Malaysia Nap: More Shadows than Lights
on such a big mistake? Hayek ([1974] 2008, p. 30) associates the persistent errors of economists with «their
propensity to imitate as closely as possible the procedures of the brilliantly successful physical sciences». Economists, with the pretext of being ‘scientists, imitate the methods of the natural sciences but in doing so apply an inappropriate method to the study of human sciences, giving birth to utterly unscientific theories, since the method is not imposed by the object studied in accordance with to the Aristotelian tradition but by the ideological preconceptions of the scholars themselves.
In complex phenomena, fundamental data are often not measurable. If our analysis were to refer only to measurable entities, we would be obliged to restrict the field of investigation to a great extent. It is consequently the case today in our science that those who believe they have a truly scientific approach because they do nothing other than correlate and correlate series and series of data in the search for functional relationships, actually produce theories which are extremely limited and most unlikely to say anything useful about reality.
Consequently, ignorance of true economic science and the presumption that science can only be based on measurable quantities has culminated in producing massive damage in the real world. The presumption of providing exact requirements in time and space, of being able to determine the level of employment exactly starting from planned fixing of aggregate demand, has created a «very extensive misallocation of resources which is likely to make later large-scale unemployment inevitable»92
Unluckily, economic theory is merely a pretext and used to determine even more social control, with the excuse of thinking higher interests or a notorious common good. Yet the welfare of a people, like the happiness of a man, depends on a great many things that can be provided in an infinite variety of combinations. It cannot be adequately expressed as a single end, but only as a hierarchy of ends, a comprehensive scale of values in which every need of every person is given its place. To direct all our activities according to a single plan presupposes that every one of our needs is given its rank in an order of values which must be complete enough to make it possible to decide between all the different courses between which the planner has to choose. It presupposes, in short, the existence of a complete ethical code in which all the different human values are allotted their due place
.
93
Yet the problem is that such a comprehensive code of ethics able to organise society in hierarchical terms in accordance with a precise scale of purposes and values, cannot exist and be defined. In particular, cannot be defined by way of imposition. The State as an
.
92 Hayek [1974] (2008), p. 44.93 Hayek [1944] (2006), p. 60.
organisation cannot allow itself to identify such a code of ethics.

As we have seen so far, serious analysis of
planning cannot but lead to the conclusion that, in order to be implemented, it has to be conducted through more or less accentuated forms of dictatorship.
The freedom that planners promise is nothing more than freedom from the responsibility of deciding for oneself, freedom from action and from decisions with all the weight of personal responsibility that it entails. The desire for presumed equality and an easy life can destroy the longing for liberty, because true freedom always implies responsibility.
A society can only grow, on the contrary,
through free individual action. Economists should be servants of that principle and not slaves of artificial systems of ideas, which often become the justification for erroneous policies, ‘scientists’ whose only goal is to restrict freedom by ever increasing degrees. The main point for a social scientist is to acknowledge that planning cannot be implemented, unless the intended goal is collective suffering.
The recognition of the insuperable limits to his
knowledge ought indeed to teach the student of society a lesson of humility which should guard him against becoming an accomplice in men’s fatal striving to control society – a striving which makes him not only a tyrant over his fellows, but which may well make him the destroyer of a civilization which no brain has designed but which has grown from the free efforts of millions of individuals94
VI.
Suggestions
and
Conclusions
.
So far we have seen how Malaysian government succeeded in creating a national car brand, thanks to heavy protectionist and supportive policy. However, results are below expectations. It is true that Proton and Perodua dominate the local market in terms of production, but Malaysia remains a net importer of vehicles. Moreover, the great financial effort to support the national automotive industry stopped the local technological development because of the lack of competition. In the same time, it increased the public debt and forced consumers in purchasing cars at a higher price than the market level. Finally, together with NEP, NCP and NAP missed the sight to create a strong group of bumiputera
entrepreneurs.
The core of our thesis is not only that industrial
protection policies damage the economic system, but also that such a failure is to be expected, because of the technical impossibility of rational economic calculation under every kind of central plan. Which direction should be taken, then? Someone argues that it would be good enough to link Proton (and eventually other national
94
Hayek [1974] (2008), pp. 55-56.
V
olum
e XV
Issu
e V
Versio
n I
Globa
l Jo
urna
l of H
uman
Soc
ial Sc
ienc
e
© 2015 Global Journals Inc. (US)
-
21
Year
2015
( E)
Malaysia Nap: More Shadows than Lights
companies) with a big and important international partner95. To reason in this way means to miss
completely the point. We agree with Dr Mahathir when he stresses that developing countries remain colonies if they need to import technology and they are not able to develop a national system of innovation96
Such a solution will not answer to our original question. But maybe it could help to shape the future in a different way
. And his attempt, under this perspective, is remarkable. However, the action focus should be shift from a direct intervention toward an educational one. How to enhance innovation processes development?
We believe we should look at the educational system. At the very first, it could seem that a strong scientific education, like the one developed in the Asian context, should be a good engine for an innovative mind set development. We do not agree with such perspective. Engineering, in the way in which it is often taught, does not stimulate creativity and innovation. On the contrary, it simply transfers technical notions to be applied to practical issue. This is the worst approach to creativity, because it teaches simply how to apply given technics to limited problems.
It is a humanistic approach, instead, which can shape a different mentality. Philosophy, literature, poetry, history: these are the disciplines who can help young eager minds to question about everything, not to simply accept given solutions. Everybody can potentially apply a given solution to a specific problem. Innovators, on the contrary, are not happy with given solutions. What is needed is developing curiosity and questioning attitude.
This could be a first step, for developing nations like Malaysia, to try to shift from ‘importing technology’ to ‘generate innovation’: curiosity and questioning attitude, forged by an educational system which stimulates debates and minds interaction. Such an educational system is centred on philosophy and history rather than engineering.
97
1. N. Danaraj (2011), Technology Policy: A Critical Appraisal, in Malaysia. Policies & Issues in Economic Development, Kuala Lumpur, Institute of Strategic and International Studies (ISIS) Malaysia, pp. 395-422.
.
References Références Referencias
2. C. Ferlito (2012a), Of Grads and Rewarding Jobs, «The Star», 8 April, http://www.thestar.com.my /Story/?sec=education&file=%2F2012%2F4%2F8%2Feducation%2F11041598.
3. C. Ferlito (2012b), Garrison’s Capital-Based Macroeconomics: The Role of Deficit, Credit Control
95 Segawa, Natsuda and Thoburn (2014), p. 436.
96 Ferlito (2014b).97 Ferlito (2014b). On the topic see also Ferlito (2012a).
and Taxation, in M.-A. Galindo Martin and C. Nardi Spiller (eds.), Public Finance: Lessons from the Past
and Effects on the Future, New York, Nova Publishers, pp. 105-122.
4.
C. Ferlito (2013), Phoenix Economics. From Crisis to Renascence, New York, Nova Publishers.
5.
C. Ferlito (2014a), Entrepreneurship: State of Grace or Basic Feature of Human Action? Schumpeter’s Leadership vs. Kirzner’s Alertness, «European Journal of Economic and Social Systems», forthcoming.
6.
C. Ferlito (2014b), Asia needs to generate, not import, innovation, «The Malaysian Insider», 16 November, http://www.themalaysianinsider.com
/sideviews/article/asia-needs-to-generate-not-import-innovation-carmelo-ferlito.
7.
C. Ferlito (2015), Ludwig M. Lachmann Against the Cambdridge School. Macroeconomics, Microfoundations, Expectations, Rate of Profit, Equilibrium and Innovations, paper presented at the conference Hayek et Keynes face à la crise. Analyses et Remèdes. Hayek, Keynes and the crisis. Analyses and Remedies, January 22, 2015 – January 24, 2015, AmphithéâtreVedel, Université Paris-Sud, Faculté Jean Monnet, Sceaux, France.
8.
R. W. Garrison (2001), Time and Money. The macroeconomics of capital structure, London and New York, Routledge.
9.
R. W. Garrison (2003), The Trouble
with Deficit Finance, «The Free Market», 21, 4, pp. 3-4.
10.
A. Gerschrenkon (1962), Economic backwardness in historical perspective, a book of essays, Cambridge,Belknap Press of Harvard University Press.
11.
F.
A. von Hayek, ed., (1935), Collectivist Economic Planning. Critical Studies on the Possibilities of Socialism, London, Routledge & Kegan Paul.
12.
F.
A. von Hayek [1944] (2006), The Road to Serfdom, New York, Routledge.
13.
F.
A. von Hayek [1974] (2008), The Pretence of Knowledge, in F.A. von Hayek, A Free-Market Monetary System, Auburn, Ludwig von Mises Institute, pp. 29-56.
14.
F.
A. von Hayek (1976), The New Confusion about Planning, «The Morgan Guaranty Survey», January, pp. 4-13.
15.
H. Hazlitt [1946] (2012), Economics in One Lesson. The shortest and surest way to understanding basic economics, Baltimore, Laissez Faire Books.
16.
J. Huerta de Soto [1992] (2010), Socialism, Economic Calculation and Entrepreneurship, Cheltenham and Northampton, Edward Elgar.
17.
J. K.
S. and J. Tan (2011), Lessons from Privatization, in Malaysia. Policies & Issues in Economic Development, Kuala Lumpur, Institute of Strategic and International Studies (ISIS) Malaysia, pp. 329-364.
V
olum
e XV
Issu
e V
Versio
n I
22
Globa
l Jo
urna
l of H
uman
Soc
ial Sc
ienc
e
© 2015 Global Journals Inc. (US)
-
Year
2015
( E)
Malaysia Nap: More Shadows than Lights
18. I. M. Kirzner (1973), Competition and Entrepreneurship, Chicago, University of Chicago Press.
19. L. M. Lachmann (1973), Macro-economic Thinking and the Market Economy. An essay on the neglect of the micro-foundations and its consequences, London, The Institute of Economic Affairs.
20. D. Lim (2011), Historical Survey, in Malaysia. Policies & Issues in Economic Development, Kuala Lumpur, Institute of Strategic and International Studies (ISIS) Malaysia, pp.1-40.
21. F. List [1841] (1909), The National System of Political Economy, London, New York, Bombay and Calcutta, Longmans, Green, and Co.
22. M. Mahathir (2011), A Doctor in the House. The Memoirs of Tun Dr Mahathir Mohamad, Petaling Jaya, MPH Publishing.
23. L. von Mises [1920] (1990), Economic Calculation in the Socialist Commonwealth, Auburn, Ludwig von Mises Institute.
24. L. von Mises [1929] (1996), Critique of Interventionism, Irvington-on-Hudson, The Foundation for Economic Education.
25. MITI (2014), National Automotive Policy (NAP) 2014, Kuala Lumpur, Ministry of International Trade and Industry.
26. K. Natsuda, N. Segawa and J. Thoburn (2013), Liberalization, Industrial Nationalism, and theMalaysian Automotive Industry, «Global Economic Review», 42 2, pp. 113-134.
27. K. Natsuda and J. Thoburn (2014), How much policy space still exists under the WTO? A comparative study of the automotive industry in Thailand and Malaysia, «Review of International Political Economy», 21, 6, pp. 1346-1377.
28. E. Phaneuf and C. Ferlito (2014), On Human Rationality and Government Control, «Procesos de Mercado: RevistaEuropea de EconomíaPolítica», XI, 2, pp. 137-181.
29. R. Rahim (2014), Dr M: I failed to change lazy Malays, «The Star», 11 September, http://www.thestar.com.my/News/Nation/2014/09/11/mahathir-mohamad-says-he-failed-to-change-lazy-malay-mindset/.
30. R. Rasiah (2011), Industrialization and Export-led Growth, in Malaysia. Policies & Issues in Economic Development, Kuala Lumpur, Institute of Strategic and International Studies (ISIS) Malaysia, pp. 147-180.
31. D. Sanz Bas (2011), Hayek’s Critique of The General Theory: A New View of the Debate between Hayek and Keynes, «The Quarterly Journal of Austrian Economics», 14, 3, pp. 288-310.
32. N. Segawa, K. Natsuda and J. Thoburn (2014), Affirmative Action and Economic Liberalization: The Dilemmas of the Malaysian Automotive Industry, «Asian Studies Review», 8,3,pp. 422-441.

33. L. Shi-Ian (2014), I have failed as Malays know no shame, says Dr M, «The Malaysian Insider», 11 September, http://www.themalaysianinsider.com/ malaysia/article/malays-have-lost-sense-of-shame-says-dr-m.
34. L. H. White and R.W. Garrison (1999), Do Deficits Matter?, «The Free Market», 17, 2, pp. 5-8.
V
olum
e XV
Issu
e V
Versio
n I
Globa
l Jo
urna
l of H
uman
Soc
ial Sc
ienc
e
© 2015 Global Journals Inc. (US)
-
23
Year
2015
( E)
Malaysia Nap: More Shadows than Lights

This page is intentionally left blank
Malaysia Nap: More Shadows than Lights
Volum
e XV
Issu
e V
Versio
n I
24
Globa
l Jo
urna
l of H
uman
Soc
ial Sc
ienc
e
© 2015 Global Journals Inc. (US)
-
Year
2015
( E)

© 2015. Ms. Irfana Noor Memon, Sanaullah Noonari, Syed Taimoor Shah, Moula Bux Peerzado, Ghulam Mustafa Panhwar, Asif Ahmed Sethar, Ghulam Yasin Kalwar, Mukhtiar Ali Bhatti & Abdul Shakoor Jamro. This is a research/review paper, distributed under the terms of the Creative Commons Attribution-Noncommercial 3.0 Unported License http://creativecommons.org/licenses/by-nc/3.0/), permitting all non-commercial use, distribution, and reproduction in any medium, provided the original work is properly cited.
Global Journal of HUMAN-SOCIAL SCIENCE: E Economics Volume 15 Issue 5 Version 1.0 Year 2015 Type: Double Blind Peer Reviewed International Research Journal Publisher: Global Journals Inc. (USA) Online ISSN: 2249-460x & Print ISSN: 0975-587X
Impact of Microcredit on Agricultural Development in District Mastung Balochistan: A Case Study of Balochistan Rural Support Programme (BRSP) Pakistan By Ms. Irfana Noor Memon, Sanaullah Noonari, Syed Taimoor Shah, Moula Bux Peerzado,
Ghulam Mustafa Panhwar, Asif Ahmed Sethar, Ghulam Yasin Kalwar, Mukhtiar Ali Bhatti & Abdul Shakoor Jamro
Sindh Agriculture University, Pakistan
Abstract- Balochistan Rural Support Programme (BRSP) is a non-governmental organization working in rural areas of Balochistan province since 1983. Its head office is situated in Quetta, Baluchistan, Pakistan, sub-office is located in Islamabad, and a number of district offices are located in various districts of Balochistan. It is clear that majority of the respondents 90 percent of the sample were male and 10 percent were females in district Mastung Balochistan. The respondents 86.66 percent had availed the loan facility only for once and that too for the first time. 11.66 percent had availed this facility twice and only 11.66 percent of them took loan three times. The respondents 40.00% were 25000, 16.66% were 40000.00, 20.00% were 50000.00, 13.33% were 60000.00 and 10.00% were above 80000.00 rupees amount loans. 30.00% were get for seed, 23.33% were Pesticide, 26.66% were Fertilizer and 16.66% were Others purposes.
Keywords: BRSP, impact of microcredit, agricultural development.
GJHSS-E Classification : FOR Code: 140201
ImpactofMicrocreditonAgriculturalDevelopmentinDistrictMastungBalochistanACaseStudyofBalochistanRuralSupportProgrammeBRSPPakistan Strictly as per the compliance and regulations of:
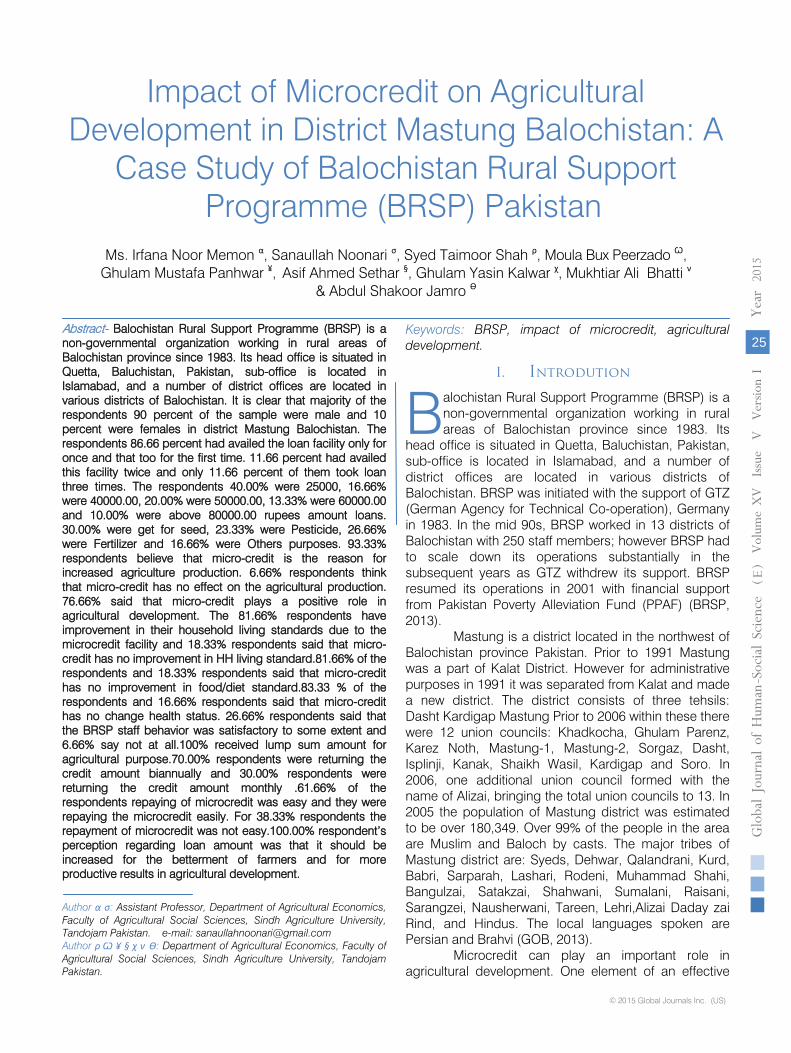
Impact of Microcredit on Agricultural Development in District Mastung Balochistan: A
Case Study of Balochistan Rural Support Programme (BRSP) Pakistan
Ms. Irfana Noor Memon α, Sanaullah Noonari σ, Syed Taimoor Shah ρ, Moula Bux Peerzado Ѡ, Ghulam Mustafa Panhwar ¥, Asif Ahmed Sethar §, Ghulam Yasin Kalwar χ, Mukhtiar Ali Bhatti ν
& Abdul Shakoor Jamro Ѳ
Abstract- Balochistan Rural Support Programme (BRSP) is a non-governmental organization working in rural areas of Balochistan province since 1983. Its head office is situated in Quetta, Baluchistan, Pakistan, sub-office is located in Islamabad, and a number of district offices are located in various districts of Balochistan. It is clear that majority of the respondents 90 percent of the sample were male and 10 percent were females in district Mastung Balochistan. The respondents 86.66 percent had availed the loan facility only for once and that too for the first time. 11.66 percent had availed this facility twice and only 11.66 percent of them took loan three times. The respondents 40.00% were 25000, 16.66% were 40000.00, 20.00% were 50000.00, 13.33% were 60000.00 and 10.00% were above 80000.00 rupees amount loans. 30.00% were get for seed, 23.33% were Pesticide, 26.66% were Fertilizer and 16.66% were Others purposes. 93.33% respondents believe that micro-credit is the reason for increased agriculture production. 6.66% respondents think that micro-credit has no effect on the agricultural production. 76.66% said that micro-credit plays a positive role in agricultural development. The 81.66% respondents have improvement in their household living standards due to the microcredit facility and 18.33% respondents said that micro-credit has no improvement in HH living standard.81.66% of the respondents and 18.33% respondents said that micro-credit has no improvement in food/diet standard.83.33 % of the respondents and 16.66% respondents said that micro-credit has no change health status. 26.66% respondents said that the BRSP staff behavior was satisfactory to some extent and 6.66% say not at all.100% received lump sum amount for agricultural purpose.70.00% respondents were returning the credit amount biannually and 30.00% respondents were returning the credit amount monthly .61.66% of the respondents repaying of microcredit was easy and they were repaying the microcredit easily. For 38.33% respondents the repayment of microcredit was not easy.100.00% respondent’s perception regarding loan amount was that it should be increased for the betterment of farmers and for more productive results in agricultural development.
Author α σ: Assistant Professor, Department of Agricultural Economics, Faculty of Agricultural Social Sciences, Sindh Agriculture University, Tandojam Pakistan. e-mail: [email protected] Author ρ Ѡ ¥ § χ ν Ѳ: Department of Agricultural Economics, Faculty of Agricultural Social Sciences, Sindh Agriculture University, Tandojam Pakistan.
Keywords: BRSP, impact of microcredit, agricultural development.
I. Introdution
alochistan Rural Support Programme (BRSP) is a non-governmental organization working in rural areas of Balochistan province since 1983. Its
head office is situated in Quetta, Baluchistan, Pakistan, sub-office is located in Islamabad, and a number of district offices are located in various districts of Balochistan. BRSP was initiated with the support of GTZ (German Agency for Technical Co-operation), Germany in 1983. In the mid 90s, BRSP worked in 13 districts of Balochistan with 250 staff members; however BRSP had to scale down its operations substantially in the subsequent years as GTZ withdrew its support. BRSP resumed its operations in 2001 with financial support from Pakistan Poverty Alleviation Fund (PPAF) (BRSP, 2013).
Mastung is a district located in the northwest of Balochistan province Pakistan. Prior to 1991 Mastung was a part of Kalat District. However for administrative purposes in 1991 it was separated from Kalat and made a new district. The district consists of three tehsils: Dasht Kardigap Mastung Prior to 2006 within these there were 12 union councils: Khadkocha, Ghulam Parenz, Karez Noth, Mastung-1, Mastung-2, Sorgaz, Dasht, Isplinji, Kanak, Shaikh Wasil, Kardigap and Soro. In 2006, one additional union council formed with the name of Alizai, bringing the total union councils to 13. In 2005 the population of Mastung district was estimated to be over 180,349. Over 99% of the people in the area are Muslim and Baloch by casts. The major tribes of Mastung district are: Syeds, Dehwar, Qalandrani, Kurd, Babri, Sarparah, Lashari, Rodeni, Muhammad Shahi, Bangulzai, Satakzai, Shahwani, Sumalani, Raisani, Sarangzei, Nausherwani, Tareen, Lehri,Alizai Daday zai Rind, and Hindus. The local languages spoken are Persian and Brahvi (GOB, 2013).
Microcredit can play an important role in agricultural development. One element of an effective
B
V
olum
e XV
Issu
e V
Versio
n I
Globa
l Jo
urna
l of H
uman
Soc
ial Sc
ienc
e
© 2015 Global Journals Inc. (US)
-
25
Year
2015
( E)

strategy for poverty reduction is to promote the productive use of farm inputs. This can be done by creating opportunities for raising agricultural productivity among small and marginalized farmers. Microcredit is particularly relevant to increasing productivity of rural economy, especially agricultural productivity in such an environment where economic growth is occurring, microcredit also has the capacity to transmit the benefits of growth more rapidly and more equitably through the informal sector. It is well documented that for many small scale farmers, lack of access to financial services is a critical constraint for the establishment or expansion of viable agricultural enterprises. Microcredit may enable small and marginalized farmers to purchase the inputs they need to increase their productivity, as well as financing a range of activities adding value to agricultural output. However, much remains to be done, to integrate microcredit institutions fully into the mainstream of rural financial systems and for commercial banks to recognize their full potential (Nosiru et al. 2010).
Rural financial market facilities the economic growth and rural poverty reduction through smooth financial intermediation. Financial intermediary’s help to mobilize funds, channel them from surplus units to the deficit units create money and smoother the payment system. The efficient provision of loans, deposits, payments, and insurance service encourages rural entrepreneurship and help to rural economy to grow. Presence of financial services helps to rural economy to grow and reduce the poverty. Access to working capital can substantially accelerate the adaptation of modern agricultural technologies and production and thereby improving the ability of the rural sector to meet then subsistence need of the poor. It also helps to produce the surplus in primary and intermediary products required for urban consumption, export, and avoid environmental degradation (World Bank, 2003).
Access to finance is a crucial issue in the productivity of agriculture in Bangladesh. If the farmers in Bangladesh are categorized based on land ownership, then we will find that most of the farmers are either marginal farmer or land less farmers producing crop by taking land lease from the affluent people. So, sometimes it is extremely difficult for the marginal farmers to get access to credit as the credits are not collateral free. The lack of deposit facilities force households to rely on inefficient and costly alternatives. The lack of access to medium- and long-term finance inhibits investment by a majority of small and marginal agricultural households in Bangladesh. This inadequate fund of marginal farmers has negative impact on the agricultural productivity of the whole country. In addition capitalists groups are reluctant to invest on agriculture as return from investing is double/triple in other sectors compared to agriculture. Micro credit has been successful in reaching the rural poor with credit for self-
employment, supporting women's empowerment and significantly contributing to poverty alleviation. Nevertheless, micro credit has only had a marginal impact in the agriculture sector as microfinance institutions (MFIs), to a great extent, limit their lending to those possessing less than half an acre of land (the functionally landless). Poor farmers' access to agricultural credit remains very limited. They are usually missed by regular credit facilities. As a result marginal and small farmers are frequently termed as “missing middle" (Raman et al. 1995).
Micro Finance Institution loans are used for agricultural production, trading, processing and transport, resulting in an increase in the use of agricultural inputs and increased output of agricultural production. This leads to enhanced employment opportunities in these sectors for the wider community and reduction in the prices of such products due to increased supply. They also state that trading activities financed by MFIs can help to establish new marketing links and increase the income of traders, and this can lead to reduced migration due to increased employment opportunities and increased income (Zohir et al. 2004).
The initiative primarily aimed at developing the socioeconomic condition of poor rural areas of Balochistan. Later in 1991, it was transformed into a company limited and a non-profit organization named as “Balochistan Rural Support Programme” under the new organizational and administrative structures. Prosperous Balochistan where people especially the poor and women are provided with equal livelihood opportunities are not socially and economically excluded. To harness potential of the rural poor to help themselves, assume control of local development and improve their standard of living. Balochistan Rural Support Programme is governed by Board of directors that has 15 members, including Chief Executive officer and a Chairman. Further structure of organization is; Senior Managers reportable to CEO, Managers; reportable to Senior Managers / CEO, Deputy Managers, Assistant Managers, and Senior Officers. Objective of BRSP is to improve the living condition and quality of life of the disadvantaged rural population through social mobilization and institutional development, to nurture and foster human resources at community level and enable them to plan, implement and manage development initiatives for sustainable development, to organize and improve services in sectors; health, education, rural enterprise, physical infrastructure, agriculture, livestock, water and sanitation, and women empowerment in rural areas (GTZ, 2013).
In Bangladesh, formal financial institutions like government and private commercial banks, State-owned agricultural or rural development bank ( for example, BRDP in Bangladesh), savings and loan cooperatives, microfinance banks, leasing, housing and
V
olum
e XV
Issu
e V
Versio
n I
26
Globa
l Jo
urna
l of H
uman
Soc
ial Sc
ienc
e
© 2015 Global Journals Inc. (US)
-
Year
2015
( E)
Impact of Microcredit on Agricultural Development in District Mastung Balochistan: A Case Study ofBalochistan Rural Support Programme (BRSP) Pakistan

consumer finance companies can offer a wide range of financial products. In between stand financial Nongovernment Organizations (NGOs), self-help groups, small cooperatives and credit unions. Formal services such as microfinance cannot replace loans from friends, relatives, friends, and moneylenders but they do complement them and enable the liquidity constrained rural population to access a wider range of financial services. Microfinance emerged as a noble substitute for informal credit and is considered to be a powerful instrument for poverty alleviation among people who are economically active but financially constrained (Murdoch et al. 2002).
In order to improve farmers’ conditions, there is a need to improve the agricultural production of their farms. Increase in agricultural production will enhance the demand for inputs but the majority of farmers lack financial resources for adopting agricultural innovations. Rural credit in the form of loans, cash or commodity is the only alternative left for the farmers’ improvement purpose. Different institutions are providing credit for agriculture. These institutions are commercial banks, provincial co-operative banks, other provincial co-operative societies, central co-operative banks, agricultural co-operative societies, Zarai Taraqiati Bank Limited (ZTBL), Khushali Bank, governmental organizations and non-governmental organizations (NGOs) like Aga Khan Rural Support Program(AKRSP), National Rural Support Program(NRSP) and Punjab Rural Support Program(PRSP) (Jaffar et al. 2006).
Microfinance (MF) has become a buzzword among the development practioners. The term ‘microfinance' means providing very poor families with very small loans (microcredit) to help them engage in productive activities or develops their tiny businesses (The Microfinance Gateway, 2008). According to the Consultative Group to Assist the Poor (CGAP), microfinance is the supply of loans, savings and other basic financial services to the poor, including working capital loans, consumer credit, pensions, insurance and money transfer services. Similarly, Hossain (2002) defines MF as, the practice of offering small, collateral free loans to members of cooperatives who otherwise would not have access to the capital necessary to begin small business or other income generating activities. The term ‘microfinance' is often used in a much narrower sense, referring principally to microcredit delivered through NGOs for tiny informal business of micro-entrepreneurs (Christen et al. 2003).
Objectives
The general objective of this study was:
1. To investigate the impact of BRSP micro credit scheme on agricultural development.
2. To study the role of micro credit in increasing agricultural production in the study area.
3. To examine the appropriate utilization of micro credit.
II. Materials and Methods
This chapter includes information regarding methods and techniques used to conduct this study. The chapter discusses the details about the study design and how it was carried out. The present research study was all the agricultural credit borrowers of district Mastung who received micro-credit from BRSP for agricultural purpose only.
a) Population Balochistan Rural Support Program (BRSP) is
working in the Mastung district consists of three tehsils • Dasht • Kardigap • Mastung
The targeted population of this study consisted of the micro-credit borrowers of tehsils Mastung, Dasht and Kardigap who borrowed loan from BRSP for agricultural purpose from January 2010 to April 2014. There were total 60 agricultural credit borrowers in the above mentioned Tehsils, who borrowed loan from BRSP for their agricultural purpose in the above said period. The population of the study was homogenous as all of them borrowed loan from BRSP only for agriculture purpose. Majority of the population were having poor economic conditions. Population of the present study had also the similar characteristics of belonging to rural background, low level of education and agricultural occupation.
b) Sample The present study aimed to be conducted in
district Mustang. Therefore to get a representative sample, the researcher applied stratified simple random sampling technique to collect the data from Tehsil Mastung, Dasht and Kardigap. This technique was followed to ensure equal participation of all the strata of the population.
c) Sample Size
It was a survey study and stratified simple random sampling technique was considered suitable to make the sample size representative and for the better generalization of the sample results over the population. According to Gay (2010) that the bigger is the population then smaller will be the sample. The population of the study was 60 respondents therefore the respondents were considered appropriate for representation of the sample. There were 20 micro-credit borrowers in Tehsils Mustung who borrowed loan form BRSP for agricultural purpose. In Dasht from 20 respondents were selected in the sampling frame. While in Kardigap, there were 20 selected using simple random sampling techniques.
V
olum
e XV
Issu
e V
Versio
n I
Globa
l Jo
urna
l of H
uman
Soc
ial Sc
ienc
e
© 2015 Global Journals Inc. (US)
-
27
Year
2015
( E)
Impact of Microcredit on Agricultural Development in District Mastung Balochistan: A Case Study ofBalochistan Rural Support Programme (BRSP) Pakistan

The researcher used survey method to carry out this research study. Keeping in mind the sample size and scope of the present study the survey method was best to be used to collect data from the large pool of cases.
e)
Type of Study
There are two types of studies qualitative and quantitative studies. The Present study is quantitative in nature. This study is conducted by using the quantitative methods and procedures. The study focused on investigating the core research question and verification of proposed hypothesis. As the quantitative research is based on specific to general approach, so this study also aimed to examine the specific objectives and then generalizing the results over the population through making inferences from the sample. Therefore survey was conducted to measure the impact of BRSP Micro-credit scheme on the agricultural development.
f)
Tool for Data Collection
A close ended structured questionnaire was developed to collect data from the respondents.
g)
Interview Questionnaire
Close ended structured questionnaire is a quantitative tool of data collection, which was advocated by Emile Durkheim (1858 - 1917). It is mostly used in survey method to collect data from large number of cases. It is a positivist research method. It includes the low level of involvement of the researcher and high level of involvement of the respondents. A close ended questionnaire is a series of questions asked to individuals to obtain statistically useful information about a given topic. With proper formulation and responsibly administered, structured questionnaires become a useful tool to collect data by which statements can be made about specific groups or people or whole population. So a close ended structured questionnaire was developed for the data collection of the present study. The researcher conducted face to face interviews with each respondent to fill up the questionnaires. It increases not only the accuracy of given information but also assures the high response rate.
h)
Aspects Related to Contents
•
The wording of questions was easy and to the point so that the respondent could easily understand the questions and answer them in a better way.
•
Close ended questions were asked so that the respondents do not lose focus of the topic.
•
Simple language was used so that respondents could understand and answer the questions to meet the objectives of the study.
i)
Aspects Related to Lay out
The questionnaire was divided into following parts
1.
Includes the general profile of the respondents
2.
Measures agricultural development
3.
Measures the economic impact of micro-credit on the borrowers
4.
Includes collecting information regarding impact of micro-credit on living standard of the borrowers
5.
Includes information about procedures and process of BRSP micro-credit program.
j)
Pre Testing and Validity of the Questionnaire
Pre testing is a method to check whether the tool for data collection is reliable and validate to meet the research’s objectives. It is applied on the smaller unit of the sample. Prior to conducting the actual field work and data collection the instrument of data collection was tested to check the accuracy and how well the instrument is measuring the objectives of the research. The pre-testing was done on 05 respondents of the sample. General discussion were done with the respondents in pre testing phase to
make the
questionnaire more reliable and valid according the objectives of the study. Further minor changes were made after consultation with the supervisor, District Manager, BRSP and with seniors in the field of research under consideration. A large number of studies regarding the subject matter have been read by the researcher to construct the validated questionnaire. Through the information collected after pre-testing the questionnaire regarding times of getting loan, utilization of amount, methods adopted for crop production and agricultural production were modified in and finalized for the actual study and data collection. The district manager BRSP also helped in the modification of questionnaire and those suggestions were incorporated in finalizing the questionnaire.
k)
Data Collection and Field Experiences
The data was collected in one month. The researcher first contacted the District Manager, BRSP for the field work and data collection. Before starting the data collection in field; permission was taken from the District Manager, BRSP. He was also briefed regarding the research project. The District Manager appointed social organizers of each Tehsil for the assistance of researcher in the data collection. The researcher personally went to the each respondent and filled up the questionnaire through face to face interviews with them. In the first place the informed consent was taken from the respondents. Secondly they were briefed about the purpose and objective of the research. Thirdly they were given full choice not to answer any question. The researcher faced many issues during the data collection process. Firstly the population was quite scattered and study was aimed at the district level so it was quite hectic and time taking process. Secondly at times
respondents were not available on the site so the researcher had to contact them again. Thirdly it was quite difficult to get information from the female respondents. They were quite hesitant and reluctant.
V
olum
e XV
Issu
e V
Versio
n I
28
Globa
l Jo
urna
l of H
uman
Soc
ial Sc
ienc
e
© 2015 Global Journals Inc. (US)
-
Year
2015
( E)
d) Technique of Data Collection
Impact of Microcredit on Agricultural Development in District Mastung Balochistan: A Case Study ofBalochistan Rural Support Programme (BRSP) Pakistan

researcher had to explain them the questions in detail. It was also observed that they were little bit unhappy due to low amount of loan offered. The inhabitants of the study area were belonging to the rural areas with low socioeconomic conditions. The majority of the people were involved in the agricultural activities. In many villages of the area women were participating in the agricultural activities.
l)
Method of Data Analysis
Data was analyzed by using Statistical Package for Social Sciences (SPSS) software version 17.0. Both descriptive and inferential statistics were used to examine the relationship between the dependent and independent variables. In the first place the impact of micro-credit on agricultural production, economic status and living standard of the borrowers was described by using graphs and frequency tables with their interpretation. Secondly Chi square test was applied to test the association among the variables and to make inferences form the sample. The first section of the analysis includes interpretation of the frequency tables and graphs. The second section includes the results and interpretation of the chi square test.
III.
Results
Analysis and interpretation of data are the most important step in scientific research. Without these steps generalization and prediction cannot be achieved which is the target of scientific research. Generalization and conclusion are drawn on the basis of
characteristics and
attitudes of the respondents.
a)
Sex of respondents
Table 1 : Distributions of the respondents according to
their sex
Sex
Frequency
Percentage
Male
54
90.00
Female
06
10.00
Total
60
100.00
Table-1 it is clear that majority of the respondents 90 percent of the sample were male and 10 percent were females in district Mastung
Balochistan.
b)
Age of respondents
Table 2 :
Distributions of the respondents according to their age
Age
Frequency
Percentage
< 25 years
10
16.66
25-50 years
38
63.33
>50 years 12
20.00
Total
60
100.00
Table-2 it is clear that majority of the respondents 63.33 percent belonged to the age group
of 25 - 50 years and 20.00 percent to more than 50 years where as 16.66 percent respondents were less than 25 years of age in district Mastung Balochistan.
c) Education level of respondents
Table 3 : Distribution of the respondent according to their education level
Education level Frequency Percentage Illiterate 26 43.00 Primary 15 17.00 Middle 82 23.33
Matriculation 10 15.00 Collage/University 01 1.66
Total 60 100.00
Table-3 it is clear that majority of the respondents 43.33% farmers were illiterate, while about 17.00% farmers were Primary level of education, 23.00% were middle, 15.66% matriculation and 1.66% bachelor/master education .
d) Marital status of respondents
Table 4 : Distributions of the respondents according to their marital status
Marital status Frequency Percentage Single 13 21.67
Married 42 70.00
Widow /widower 05 08.33
Total 60 100.00
Table-4 it is clear that majority of the respondents 70.00 percent were married, 22 percent were single and 8 percent were widow/widower in district Mastung Balochistan .
e) Housing conditions of respondents
Table 5 : Distribution of respondents according to their housing conditions
Housing conditions Frequency Percentage
Pacca
35
58.33
Kacha
15
25.00
Mixed
10
16.66
Total
60
100.00
Table-5 it is clear that majority of the respondents 58 percent of the sample respondents had Pacca houses as against 17 percent who had mixed devilling. About 25 percent of the respondent had Kacha houses.
f)
Occupation of the Respondents
Table 6 : Distribution of the respondent according to
their occupation
Occupation
Frequency
Percentage
Agriculture
41
68.33
Labour
9 15.00
V
olum
e XV
Issu
e V
Versio
n I
Globa
l Jo
urna
l of H
uman
Soc
ial Sc
ienc
e
© 2015 Global Journals Inc. (US)
-
29
Year
2015
( E)
Majority of the respondents were illiterate so the
Impact of Microcredit on Agricultural Development in District Mastung Balochistan: A Case Study ofBalochistan Rural Support Programme (BRSP) Pakistan

Business 5
8.33
Private job
3 5.00 Govt. Job
2
3.33
Total
60
100.00
Table-6 shows that majority of the respondents 68.33 percent had agriculture as source of their family income followed by labour 15.00 percent, business 8.33 percent, private job 5.00 percent and government job 3.33 percent.
g)
Source of information BRSP
Table 7 : Distribution of the respondent according to
their source of information
Source of Information
Frequency
Percentage Newspapers/Media
10
16.66
Friends / Relatives
40
66.66 BRSP staffs
l0
16.66
Total
60
100.00
Table-7 it is clear that majority of the respondents 66.66 percent respondents received information about BRSP credit programme from the Friends / Relatives, 16.66 received information from Newspapers/ Media and16.66 BRSP staffs respectively.
h) Agriculture Land Tenure Status of the Respondents
Table 8 : Distributions of respondents according to their agriculture land tenure
Agriculture Land Tenure
Frequency Percentage
Owner 28 46.66 Tenant 18 30.00
Owner cum Tenant 14 23.33 Total 60 100.00
Table-8 it is clears that majority of the respondents 46.66 percent 46.66% were owner ship, 30.00% were tenant farmers and 23.33% were owner cum tenant respondents.
i)
Farm Size of the Respondents
Table 9 : Distributions of respondents according to
agricultural farm size (acres)
Agricultural Farm Size
Frequency
Percentage
Less 5 acres
22
36.66
5-8 acres
18
30.00
8-10 acres
10
16.66
Above 10 acres
10
16.66
Total
60
100.00
Table-9 it is clear that majority of the respondents 36.66% were less 5 acres, 30.00% were 5-8 acres, 16.66% were 8-10 acres and 16.66% were above 10 acres farm size respondents.
j) Times of Received the Amount
Table 10 : Percentage distribution of the respondents’ regarding incidence of received amount from BRSP
Times of Received Amount
Frequency Percentage
Once 52 86.66 Twice 07 11.66 Thrice 01 11.66 Total 60 100.00
Table-10 it is clears that majority of the respondents 86.66 percent had availed the loan facility only for once and that too for the first time. 11.66 percent had availed this facility twice and only 11.66 percent of them took loan three times
k)
Amount of loan received by the respondents
Table 11 : Distributions of respondents according to
their amount of loan received
Received Loan Amount Rs.
Frequency
Percentage
Rs.25000.00
24
40.00
Rs.40000.00
10
16.66
Rs. 50000.00
12
20.00
Rs.60000.00
8 13.33
Rs.80000.00
06
10.00
Total
60
100.00
Table-11 it is clear that majority of the respondents 40.00% were 25000, 16.66% were 40000.00, 20.00% were 50000.00, 13.33% were 60000.00
and 10.00% were above 80000.00 rupees
amount loans.
l)
Purpose of Loan by the respondents
Table 12 : Percentage distribution of the respondent
regarding their purpose before getting loan
Purpose of Getting Loan
Frequency
Percentage
For Seed
22
30.00
For Pesticide
12
23.33
For Fertilizer
16
26.66
Others
10
16.66
Total
60
100.00
Table-12 it is clear that majority of the respondents 30.00% were get for seed, 23.33% were Pesticide, 26.66% were Fertilizer
and 16.66% were Others purposes.
V
olum
e XV
Issu
e V
Versio
n I
30
Globa
l Jo
urna
l of H
uman
Soc
ial Sc
ienc
e
© 2015 Global Journals Inc. (US)
-
Year
2015
( E)
Impact of Microcredit on Agricultural Development in District Mastung Balochistan: A Case Study ofBalochistan Rural Support Programme (BRSP) Pakistan

m) Micro Credit is the Reason for Increased Agriculture Production
Table 13 : Percentage distribution of respondent’s perception regarding micro credit as the reason for
increased agriculture production
Table -13 shows the perception of respondents with regard to micro-credit as a source of increased agricultural production. It describes those 93.33% respondents believe that micro-credit is the reason for increased agriculture production. 6.66% respondents think that micro-credit has no effect on the agricultural production.
n) Positive Role of Micro-credit in Agricultural Development
Table 14 : Percentage distribution of respondent’s perception regarding to what extent micro credit play
positive role in agriculture development
Table-14 shows that majority of the respondents i.e. 76.66% said that micro-credit plays a positive role in agricultural development to great extent , while 13.33% respondents described that it play role to some extent, only 10.00% respondents said that micro-credit has no role in agricultural development.
o) Improvement in House Hold Living Standard of the Respondents
Table 15 : Percentage distribution regarding change/improvement in HH living standard of
the respondents due to micro credit
Table-15 shows that majority 81.66% respondents have improvement in their household living standards due to the microcredit facility and 18.33% respondents said that micro-credit has no improvement in HH living standard.
p)
Change/Improvement in Food/Diet Patterns of the Respondents
Table 16 :
Percentage distribution of respondents
regarding change/improvement in their food/diet patterns
Table-16 shows that there was
change/improvement in food/diet patterns of a considerable majority 81.66% of the respondents and 18.33% respondents said that micro-credit has no improvement in food/diet standard.
Better financial
position made them able to have better diet for themselves and for their family members.
q)
Change/improvement in Health Status of the Respondent
Table 17 :
Percentage distribution of respondents
regarding change/improvement in health status
Table-17 shows that there was change/improvement in health status of a considerable majority 83.33 % of the respondents and 16.66% respondents said that micro-credit has no change health status.
Therefore they became able to spend
more money to maintain their health and get access to the health facilities.
r)
Change/improvement in Children Education of the Respondents
Table 18 :
Percentage distribution of respondents
regarding change/improvement in children’s education
Table-18 shows that 75.00% respondents improved the educational status of their children due to increase in the income, while 25.00% respondents have no improvement in their children’s education.
Increased Agriculture
Production
No. Respondent
Percentage
Yes
56
93.33 No
04
6.66 Total
60
100.00
Change/improvement
in Health status
No. Respondent
Percentage
Yes
50
83.33
No
10
16.66
Total
60
100.00
To what extent
No. Respondent Percentage
to great extent 46 76.66 to some extent 8 13.33
No Effect 6 10.00 Total 60 100.00
Change/improvement
in Children Education
No. Respondent
Percentage
Yes
45
75.00
No
15
25.00
Total
60
100.00
Improvement in HH Living Standard
No. Respondent
Percentage
Yes 49 81.66 No 11 18.33
Total 60 100.00
Change/Improvement
in Food/Diet
No. Respondent
Percentage
Yes
49
81.66
No
11
18.33
Total
60
100.00
V
olum
e XV
Issu
e V
Versio
n I
Globa
l Jo
urna
l of H
uman
Soc
ial Sc
ienc
e
© 2015 Global Journals Inc. (US)
-
31
Year
2015
( E)
Impact of Microcredit on Agricultural Development in District Mastung Balochistan: A Case Study ofBalochistan Rural Support Programme (BRSP) Pakistan

s) Procedure of Getting Microcredit Facility is easy to avail from BRSP
Table 19 : Percentage distribution of respondents regarding microcredit facility is easy to avail
Table-19 shows that respondents were inquired about the procedure of getting loan in which majority of the respondents i.e. 56.66% responded that it was easy to great extent. 36.66% responded that it was easy to some extent and 6.66% responded that it was say not at all.
t) Behaviors of BRSP Staff with the Respondents
Table 20 : Percentage distribution of respondent’s satisfaction regarding behavior of BRSP staff during
getting microcredit facility
Table-20 shows that 66.66% respondents responded that the behavior of the BRSP staff was satisfactory to great extents. 26.66% respondents said that the BRSP staff behavior was satisfactory to some extent and 6.66% say not at all. Due to polite behavior of the staff it was easy for the respondents to negotiate and discuss with them regarding loan procedures.
u) Mode of Receiving the Loan Amount If respondents receive loan amount in lump sum
mode it becomes more helpful for them rather than receiving the amount in installments.
Table 21 : Percentage distribution regarding respondents’ mode of receiving the amount
Table-21 shows that all the respondents i.e. 100% received lump sum amount for agricultural purpose, which shows that the BRSP gives the agricultural loan in lump sum form to make the procedure easy, flexible and more convenient for the borrowers.
v) Procedure of Repayment by the Respondents Respondents were repaying the loan amount by
two methods to the BRSP which were biannually and monthly.
Table 22 : Percentage distribution of respondents regarding procedure of repayment
Table-22 indicates the procedure of returning credit amount to the BRSP, which shows that 70.00% respondents were returning the credit amount biannually and 30.00% respondents were returning the credit amount monthly. It shows that the trend of returning amount was seasonally.
w) Mode of Micro-credit Repayment
There are lots of micro-credit schemes running for improving the economic status of borrowers. Microcredit repayment is a good indicator to measure the economic condition of borrowers.
Table 23 : Percentage Distribution of respondents regarding mode of micro-credit repayment
Table-23 indicates that for majority 61.66% of the respondents repaying of microcredit was easy and they were repaying the microcredit easily. For 38.33% respondents the repayment of microcredit was not easy.
x) Respondents opinion regarding increasing the Loan for Agriculture Purpose
Table 24 : Percentage distribution of respondent’s opinion regarding increasing the loan for agriculture
purpose
Table-24 indicates that for majority 100.00% respondent’s perception regarding loan amount was that it should be increased for the betterment of farmers and for more productive results in agricultural development.
IV. Inferential Analysis
Inferential analysis deal with drawing conclusions, causes and effects and in some cases, making predictions about the properties of a population based on information obtained from a sample.
Procedure of Repayment
No. Respondent
Percentage
Biannually 42 70.00 Monthly 18 30.00
Total 60 100.00
To What Extent No. Respondent Percentage To great extent 40 66.66 To some extent 16 26.66
Not at all 04 6.66 Total 60 100.00
Mode of Received Amount
No. Respondent Percentage
lump sum 60 100.00 Total 60 100.00
To what Extent No. Respondent Percentage To great extent 34 56.66 To some extent 22 36.66
Not at all 04 6.66 Total 60 100.00
Mode of microcredit Repayment
No. Respondent
Percentage
Easy 37 61.66 Difficult 23 38.33
Total 60 100.00
Respondents opinion about increasing
agri-loan
No. Respondent
Percentage
Yes 60 100.00 No 0 0
Total 60 100.00
V
olum
e XV
Issu
e V
Versio
n I
32
Globa
l Jo
urna
l of H
uman
Soc
ial Sc
ienc
e
© 2015 Global Journals Inc. (US)
-
Year
2015
( E)
Impact of Microcredit on Agricultural Development in District Mastung Balochistan: A Case Study ofBalochistan Rural Support Programme (BRSP) Pakistan
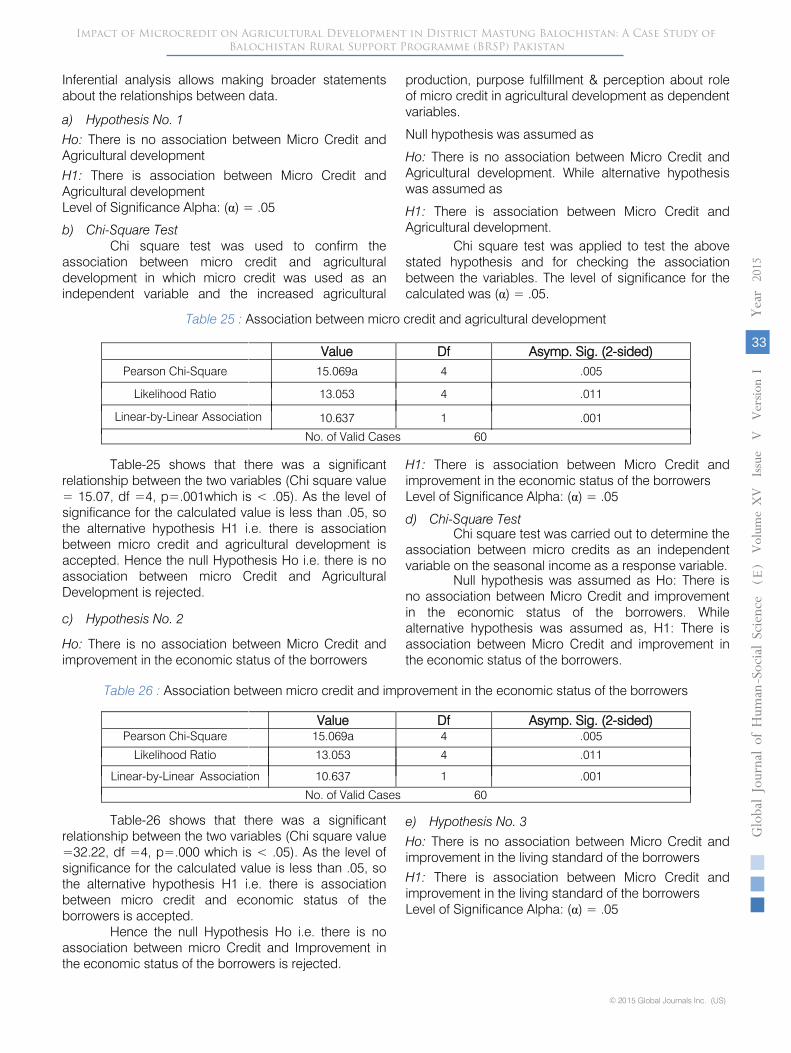
Inferential analysis allows making broader statements about the relationships between data.
a) Hypothesis No. 1 Ho: There is no association between Micro Credit and Agricultural development H1: There is association between Micro Credit and Agricultural development Level of Significance Alpha: (α) = .05
b) Chi-Square Test Chi square test was used to confirm the
association between micro credit and agricultural development in which micro credit was used as an independent variable and the increased agricultural
production, purpose fulfillment & perception about role of micro credit in agricultural development as dependent variables.
Null hypothesis was assumed as
Ho: There is no association between Micro Credit and Agricultural development. While alternative hypothesis was assumed as
H1: There is association between Micro Credit and Agricultural development.
Chi square test was applied to test the above stated hypothesis and for checking the association between the variables. The level of significance for the calculated was (α) = .05.
Table 25 : Association between micro credit and agricultural development
Value Df Asymp. Sig. (2-sided) Pearson Chi-Square
15.069a
4 .005
Likelihood Ratio 13.053
4 .011
Linear-by-Linear Association
10.637 1 .001
No. of Valid Cases 60
Table-25 shows that there was a significant relationship between the two variables (Chi square value = 15.07, df =4, p=.001which is < .05). As the level of significance for the calculated value is less than .05, so the alternative hypothesis H1 i.e. there is association between micro credit and agricultural development is accepted. Hence the null Hypothesis Ho i.e. there is no association between micro Credit and Agricultural Development is rejected.
c) Hypothesis No. 2
Ho: There is no association between Micro Credit and
improvement in the economic status of the borrowers
H1: There is association between Micro Credit and improvement in the economic status of the borrowers Level of Significance Alpha: (α) = .05 d) Chi-Square Test
Chi square test was carried out to determine the association between micro credits as an independent variable on the seasonal income as a response variable.
Null hypothesis was assumed as Ho: There is no association between Micro Credit and improvement in the economic status of the borrowers. While alternative hypothesis was assumed as, H1: There is association between Micro Credit and improvement in the economic status of the borrowers.
Table 26 : Association between micro credit and improvement in the economic status of the borrowers
Value Df Asymp. Sig. (2-sided) Pearson Chi-Square 15.069a
4 .005
Likelihood Ratio 13.053
4 .011 Linear-by-Linear Association
10.637
1 .001 No. of Valid Cases 60
Table-26 shows that there was a significant relationship between the two variables (Chi square value =32.22, df =4, p=.000 which is <
.05). As the level of
significance for the calculated value is less than .05, so the alternative hypothesis H1 i.e. there is association between micro credit and economic status of the borrowers is accepted.
Hence the null Hypothesis Ho i.e. there is no association between micro Credit and Improvement in the economic status of the borrowers is rejected.
e)
Hypothesis No. 3
Ho:
There is no association between Micro Credit and improvement in the living standard of the borrowers
H1:
There is association between
Micro Credit and improvement in the living standard of the borrowers
Level of Significance Alpha: (α) = .05
V
olum
e XV
Issu
e V
Versio
n I
Globa
l Jo
urna
l of H
uman
Soc
ial Sc
ienc
e
© 2015 Global Journals Inc. (US)
-
33
Year
2015
( E)
Impact of Microcredit on Agricultural Development in District Mastung Balochistan: A Case Study ofBalochistan Rural Support Programme (BRSP) Pakistan

f) Chi-Square Test Chi square test was carried out to verify the
relationship between micro credit and living standard of the respondents in which micro credit was used as an independent variable and household living standard, food quality, health practices, and education expenditure as dependent variables.
The third Null hypothesis for the present study was assumed as Ho: There is no association between
Micro Credit and improvement in the living standard of the borrowers. While alternative hypothesis was assumed as, H1: There is association between MC and improvement in the living standard of the borrowers. Chi square test was applied to test the above stated hypothesis and for checking the association between the two variables. The level of significance for the calculated was (α) = .05.
Table 27 : Association between micro credit and improvement in the living standard of the borrowers
Value Df Asymp. Sig. (2-sided) Pearson Chi-Square 15.069a
4 .005
Likelihood Ratio
13.053
4 .011
Linear-by-Linear Association
10.637
1 .001
No. of Valid Cases 60
Table-27 shows that there was a significant relationship between the two variables (Chi square value =28.96, df =4, p=000 which is < .05). As the level of significance for the calculated value is less than .05, so the alternative hypothesis H1 i.e. there is association between micro credit and living standard of the borrowers is accepted. Hence the null Hypothesis Ho i.e. there is no association between micro Credit and improvement in the living standard of the borrowers is rejected.
The above results show that the BRSP micro
credit scheme had positive impact on agricultural development. It is clear from the results that the micro credit scheme significantly increased the agricultural production of the respondents and which substantively increased their seasonal income. Improvement in the economic status of the borrowers made substantial improvement in the living standard of the micro-credit borrowers.
V. Discussion
The main objective of the present study was to see the impact of micro-credit on agricultural development. It was assumed that micro-credit has positive impact on the agricultural development in district Mastung Balochistan.
In Bangladesh, formal financial institutions like government and private commercial banks, State-owned agricultural or rural development bank ( for example, BRDP in Bangladesh), savings and loan cooperatives, microfinance banks, leasing, housing and consumer finance companies can offer a wide range of financial products. In between stand financial Nongovernment Organizations (NGOs), self-help groups, small cooperatives and credit unions. Formal services such as microfinance cannot replace loans from friends, relatives, friends, and moneylenders but they do complement them and enable the liquidity
constrained rural population to access a wider range of financial services. Microfinance emerged as a noble substitute for informal credit and is considered to be a powerful instrument for poverty alleviation among people who are economically active but financially constrained (Murdoch et al.
2002).
The general objective of the present study was the role of micro-credit on agricultural development
in
district Mastung Balochistan. The targeted population of
the current study consisted of Tehsil Dasht, Kardigap and Mastung. There were total 60 agricultural credit
borrowers in the above mentioned Thesils who borrowed loan from BRSP. A close ended structured questionnaire was formulated to collect data from the respondents. Data was collected through face to face interviews with the respondents. Descriptive and inferential statistics were used to analyse the data. Chi Square test was used to measure association of the variables in SPSS. The results of the present study can be summarized as:
It is clear that majority of the respondents 90 percent of the sample were male and 10 percent were females in district Mastung
Balochistan.
The
respondents 63.33 percent belonged to the age group of 25 - 50 years and 20.00 percent to more than 50 years where as 16.66 percent respondents were less than 25 years of age .The respondents 43.33% farmers were illiterate, while about 17.00% farmers were Primary level of education, 23.00% were middle,
15.66%
matriculation and 1.66% bachelor/master education . 70.00 percent were married, 22 percent were single and
8 percent were widow/widower .58 percent of the sample respondents had Pacca houses as against 17 percent who had mixed devilling. About 25 percent of the respondent had Kacha houses. 68.33 percent had agriculture as source of their family income followed by labour 15.00 percent, business 8.33 percent, private job 5.00 percent and government job 3.33 percent.
66.66
percent respondents received information about BRSP
V
olum
e XV
Issu
e V
Versio
n I
34
Globa
l Jo
urna
l of H
uman
Soc
ial Sc
ienc
e
© 2015 Global Journals Inc. (US)
-
Year
2015
( E)
Impact of Microcredit on Agricultural Development in District Mastung Balochistan: A Case Study ofBalochistan Rural Support Programme (BRSP) Pakistan

credit programme from the Friends / Relatives, 16.66 received information from Newspapers/ Media and16.66 BRSP staffs .46.66 percent 46.66% were owner ship, 30.00% were tenant farmers and 23.33% were owner cum tenant respondents. 36.66% were less 5 acres, 30.00% were 5-8 acres, 16.66% were 8-10 acres and 16.66% were above 10 acres farm size respondents. 86.66 percent had availed the loan facility only for once and that too for the first time. 11.66 percent had availed this facility twice and only 11.66 percent of them took loan three times. The respondents 40.00% were 25000, 16.66% were 40000.00, 20.00% were 50000.00, 13.33% were 60000.00 and 10.00% were above 80000.00 rupees amount loans. 30.00% were get for seed, 23.33% were Pesticide, 26.66% were Fertilizer and 16.66% were Others purposes. 93.33% respondents believe that micro-credit is the reason for increased agriculture production. 6.66% respondents think that micro-credit has no effect on the agricultural production. 76.66% said that micro-credit plays a positive role in agricultural development to great extent , while 13.33% respondents described that it play role to some extent, only 10.00% respondents said that micro-credit has no role in agricultural development. 81.66% respondents have improvement in their household living standards due to the microcredit facility and 18.33% respondents said that micro-credit has no improvement in HH living standard.81.66% of the respondents and 18.33% respondents said that micro-credit has no improvement in food/diet standard.83.33 % of the respondents and 16.66% respondents said that micro-credit has no change health status.75.00% respondents improved the educational status of their children due to increase in the income, while 25.00% respondents have no improvement in their children’s education.56.66% responded that it was easy to great extent. 36.66% responded that it was easy to some extent and 6.66% responded that it was say not at all.66.66% respondents responded that the behavior of the BRSP staff was satisfactory to great extents. 26.66% respondents said that the BRSP staff behavior was satisfactory to some extent and 6.66% say not at all.100% received lump sum amount for agricultural purpose.70.00% respondents were returning the credit amount biannually and 30.00% respondents were returning the credit amount monthly .61.66% of the respondents repaying of microcredit was easy and they were repaying the microcredit easily. For 38.33% respondents the repayment of microcredit was not easy.100.00% respondent’s perception regarding loan amount was that it should be increased for the betterment of farmers and for more productive results in agricultural development.
VI. Conclusion and Suggestions
The core objective of the present research was to examine and assess the role of micro-credit on
agricultural development. The study concluded that micro-credit play vital role in the development of agricultural sector. From the study it was concluded that
microcredit have positive impact in the agriculture field, economic status, household living standards of the farmers.
Microcredit for agricultural purpose provides financial support to the farmers for enhancement of agricultural production which led them
towards the
increase in seasonal income also. The study concluded that agricultural loan has positive impact on the agriculture production therefore the respondents were tending towards getting the loan facility. Credit investments in the agriculture sector enhance the crop production and seasonal income. Majority of the respondents were belonging to low socio-economic status therefore greater part of the respondents got loan amount many times for agriculture purpose.
The study concluded that micro-credit
has positive impact on the agricultural development but there is always need for improvement in any program. With reference to the results of the study and keeping in mind the field observations following recommendations have been made to make the micro-credit program more productive for the agricultural micro-credit borrowers.
•
Amount of loan for agriculture purpose may be increased for making the agricultural field more productive for the credit borrowers.
•
Modern facilities for agriculture processes ought to be given in the form of machinery at reasonable prices to make more production at economic rates.
•
Common understanding about the BRSP'S objectives remains poor programme objectives should be discussed in community organization meetings frequently.
•
Community organization leaders should be more active in solving the common community problems.
•
Community organization leaders should be given more monetary incentives for managing community organizations.
•
It was seen during the survey that loaness were not properly trained in the business against which the loan was sanctioned.
•
It should be made compulsory for the MCOs to provide them guidance at their doorstep.
•
BRSP should arrange a benevolent fund so that in case of any natural cal mill, if a person is unable to repay some of his instalments, his remaining instalments may be repaid from that fund.
•
If a person is unable to repay his instalments because of sudden house hold needs, he should be given some relaxation period so that his feelings about BRSP.
•
Agricultural loan facility may be expanded to the rural areas where credit facility is not available.
V
olum
e XV
Issu
e V
Versio
n I
Globa
l Jo
urna
l of H
uman
Soc
ial Sc
ienc
e
© 2015 Global Journals Inc. (US)
-
35
Year
2015
( E)
Impact of Microcredit on Agricultural Development in District Mastung Balochistan: A Case Study ofBalochistan Rural Support Programme (BRSP) Pakistan

• Interest rate must be at the lowest level for making the scheme more productive and beneficial for the credit borrowers.
• There should be proper monitoring and evaluation of the respondents after getting loan.
References Références Referencias
1. Abbas, F., Naeem, M., Sarwar., and Hussain, Sajid., 2005. “Microfinance Route to Income Generation and Poverty Reduction: Evidence from District Faisalabad, Pakistan. Journal of agriculture & social sciences. 1813 2235/2005/01–2–144–147.
2. Adil, S.A. & Badar, H. 2003. “Impact of micro-credit on poverty alleviation and agricultural production -A case study of NRSP, D.G. Khan region [Pakistan]). Journal of Agricultural Research . v. 41(3-4) p. 309-316.
3. Ali, Murad and Qaiser, Tabinda.2011. Utilizing micro-credit for sustainable agricultural rural development. Retrieved 1st February 2012 (http://rupeenews.com/2011/03/utilizing-micro-redit-for-sustainable-agricultural- rural-development/).
4. Aregawi Desta, Tesfay. 2003. The Impact of Microfinance on Poor Women: A case study of Dedebit Credit and Saving Institution (DECSI) in the Eastern Zone of Tigray. (Unpublished Thesis). Addis Ababa University: School of Graduate Studies, Regional and Local Development Studies.
5. Ahmad, S., M.S. Naveed and A. Ghafoor, 2004. Role of micro finance in alleviating rural poverty: A Case Study of Khushhali Bank Programin Rahim Yar Khan– Pakistan. Int. J. Agric. Biol., 6: 426–8Aslam, 2001.
6. Abedullah, N., Khalid, M., & Kouser, S. 2009. The role of agricultural credit in the growth of livestock sector: A case study of Faisalabad. Pakistan Veterinary Journal, 29 (2), 81-84.
7. Amusa, T. A., Enete A. A., & Okon, U. E. 2011. Socioeconomic determinants of cocoyam production among small holder farmers in Ekiti state, Nigeria. International Journal of Agricultural Economics & Rural Development, 4 (2), 97-109.
8. Alam, 1988. Fighting poverty with microcredit: experience in Bangladesh, Oxford University Press, UK.
9. BBI, 2013, Balochistan Board of Investment, Government of the Balochistan , Quetta.
10. BRSP 2013. Balochistan Rural Support Programme". BRSP.org.pk. Retrieved 9 August 2013.
11. Bhaduri, A. 1973. A study in agricultural backwardness under semi-feudalism. The Economic Journal, 83 (1), 120-137.
12. Bhulmall, A. 2000. A cooperative credit society's impact on credit demand in agricultural production. Economic Affairs (Calcutta), 45, 86-91.
13. Bayes, A., 2005. Micro Credit and Women’s Empowerment. World Pr out Assembly. Highland Heights, USA.
14. Bhuvan, I.B. 2007. Performance of Micro-Finance Providers in Karnataka. (Unpublished Thesis). University of Agricultural Sciences, Dharwad.
15. Brau, James C. and Woller, Gary M. 2004. Microfinance: A Comprehensive Review of the Existing Literature. Journal of Entrepreneurial Finance and Business Ventures, Vol. 9, Issue 1, 2004, pp. 1-26.
16. Christen, Delgado, E. 2005. Group Lending: Learning from The International Experience. Urban and Regional Planning Economic Development Handbook. University of Michigan. Taubman College of Architecture and Urban Planning,
17. Fayaz, M., Jan, D., Jan, A. U., & Hussain, B. 2000. Effects of short term credit advanced by ZTBL for enhancement of crop productivity and income of growers. Journal of Agricultural and Biological Science, 1 (4), 15-18.
18. Girabi, F., & Mwakaje, A. E. G. 2013. Impact of microfinance on smallholder farm productivity in Tanzania: The case of Iramba district. Asian Economic and Financial Review, 3(2), 227-242.
19. GTZ, BRSP Initiated with the support of GTZ". PPinewsagency.com. Retrieved 9 August 2013.
20. GOP, 2013. Agriculture: Economic Survey of Pakistan, 2013, Ministry of Food and Agriculture, Government of Pakistan, Islamabad.
21. Government of Balochistan, 2013, Balochistan Development Statistics, Government of the Balochistan , Quetta.
22. Government of Pakistan, 2003, Economic Survey of Pakistan 2002-03, Finance Division, Islamabad.
23. Government of Punjab, 2002, Punjab Development Statistics, Bureau of Statistics, Government of the Punjab, Lahore.
24. Gay, 2010. Accrss to microcredit and its impact on farm profit among rural farmers in dryland of Sudan. Global Advanced Research Journal, 2(3), 88- 102.
25. GOB. (2010). Bangladesh Economic Review, Economic Adviser’s Wing, Finance Division, Ministry of Finance, Government of Peoples Republic of Bangladesh.
26. Grameen Bank Website. Retrieved 11th February 2012 (http://www.grameen-info.org/).
27. Grameen Bank Wikipedia Article. Retrieved 11th February 2012 (http://en.wikipedia.org/wiki/ Grameen_Bank) Gebrehiwot, Ageba (1989).
28. Hossain, Hoque, Seerajul, 2002, Does Micro credit Programs in Bangladesh Increase Household ability to Deal with Economic Hardships (www.mpra.ub,unimuenchen. de/6678/
29. Holvoet, Nathalie. 2005. The Impact of Microfinance on Decision-Making Agency: Evidence from South
V
olum
e XV
Issu
e V
Versio
n I
36
Globa
l Jo
urna
l of H
uman
Soc
ial Sc
ienc
e
© 2015 Global Journals Inc. (US)
-
Year
2015
( E)
Impact of Microcredit on Agricultural Development in District Mastung Balochistan: A Case Study ofBalochistan Rural Support Programme (BRSP) Pakistan
India. Development and Change. Volume 36, Issue 1, pages 75 –102.
30. Islam, K. M. Z. 2011. Microfinance, efficiency and agricultural production in Bangladesh. (Unpublished master’s thesis). Agricultural Economics Unit, Department of Economics and Management, University of Helsinki, Finland.
31. Islam, Z., Bäckman, S., & Sumelius, J. 2011. Technical, economic and allocative efficiency of microfinance borrowers and non-borrowers: evidence from peasant farming in Bangladesh. European Journal of Social Sciences, 18 (3), 36.
32. IFAD, 2001. Pakistan. The Impact of New Credit and Savings Opportunities for Women. Rome, Italy.
33. Javed, M.S., Hassan, S., Adil, S.A., Ahmad, A.S., Chattah, M.W.A., & Nawaz, Z. 2006. Impact assessment of microcredit programme of PRSP on crop productivity. Pakistan Journat of Agrcultural. Science, 43, 3-4.
34. Jaffar, S.S., Javed, K. and Lodhi, T.E. 2006. An Evaluation of Micro Credit Schemes of Small and Medium Enterprise Development Authority (SMEDA). J. Anim. Pl. Sci. 16(3-4): 2006.
35. Jehanzeb, N. 2008. Raising farm productivity through agricultural credit (A Case Study of Zarai Tarraqiati Bank of Pakistan Limited). Sarhad Journal of Agriculture Vol. 24, No. 4, 2008.
36. Kebede, Koomsa. 1995. Agricultural Credit Analysis. National Agricultural Policy Workshop.
37. Khan, Naushad . 2007. The Impact of Micro Credit on Livestock Enterprise Development in District Abbottabad (A Case of SRSP Micro Credit Programme). Sarhad Journal of Agriculture. Vol. 23, No. 4, 2007.
38. Khan, N., Shafi, M. M., Shah, M., Islam, Z., Arif, M., Javed, R., & Shah, N. 2011. Review of past literature on agriculture credit in rural area of Pakistan. Sarhad Journal of Agriculture, 27 (1), 103-110.
39. Khandker, S. R. 1998. Fighting poverty with microcredit: experience in Bangladesh, Oxford University Press, UK.
40. Khan, Naushad . 2011. Review of Past Literature on Agriculture Credit in Rural Area of Pakistan. Sarhad Journal of Agriculture. Vol.27, No.1, 2011.
41. Khandker, Shahid and Zaman, Hassan. 2011. The Impact of Microfinance. Retrieved on 12th February 2012 (http://www.thedailystar.net/newDesign/news- details.php?nid=177457).
42. Kiiru, Joy M. 2007. The Impact of Microfinance on Rural Poor Households’ Income And Vulnerability To Poverty: Case Study Of Makueni District, Kenya.( Unpublished PhD thesis) University of Bonn.
43. Kudi, T.M. 2009. Impact of UNDP microfinance programme on poverty Alleviation among farmers in selected local government areas of Kaduna State, Nigeria. International Journal of Sociology and Anthropology Vol. 1(6) pp. 099- 103.
44. Lodhi , E.T., Luqman A ., Javed , A ., & Asif , M . 2006. “Utilization of Micro-credit by the Female Community : A case study of Azad Jammu and Kashmir (Pakistan). International Journal of Agriculture &Biology. 1560–8530/2006/08.
45. Marcus Omobolanle, & Nosiru. 2010. Microcredits and Agricultural Productivity in Ogun State, Nigeria. WJAS World J. Agric. Sci., 6 (3): 290-296, 2010.
46. Mayoux, L. (2001) Tackling the Down Side: Social Capital, Women‟s Empowerment and Micro-Finance in Cameroon, Development and Change 32(3): 421–50.
47. McCulloch, Neil, & Baulch, B. 2009. Simulating the impact of Policy upon Chronic and Transitory Poverty in Rural Pakistan. Journal of Development Studies.36 (6).
48. Morduch, J. 2002. “Does Microfinance Really Help the Poor? NewEvidence from Flagships Programmes in Bangladesh”, Dept. Of Economics and HIID, Harvard University and Hoover Institution, Stanford University.
49. Manzoor, Z. & Akhtar , S. 2006. “Role of Punjab Rural Support Programme in increasing economic status and poverty alleviation efforts in rural Faisalabad” Journal of Agriculture & Social Sciences. 1813–2235/2006/02–2–110–111.
50. Mushtaq, Rizwan. 2011. Economic Impact of Micro Finance on Borrowers: Evidence from Punjab, Pakistan. Available at SSRN: http://ssrn.com/abstract=1898376 or http://dx. doi.org/10.2139/ssrn.1898376.
51. Malik, S. J., Mushtaq, M., & Gill, M. (1989). Differential access and the rural credit market in pakistan: Some recent evidence. The Pakistan Development Review, 28 (4), 709-716.
52. Miller, C. 2011. Microcredit and crop agriculture: New approachs, technologies and other innovation to address food insecurity among the poor. 2011 Global Microcredit Summit Valladolid, Spain.
53. Malik, S. J. and Hina Nazli 1999, Poverty and Rural Credit: The Case of Pakistan. PIDE Publication.
54. Miah, Marr, Anna, 2006, Challenge to the orthodoxy concerning micro finance and poverty reduction. Micro Finance Journal, Volume 5, No. 2.
55. Morduch, Jonathan (1998), Does Microfinance really help the poor? New Evidence from Flagship Programs in Bangladesh (accessed on 20 August 2005).
56. Mosely, Paul and Hulme David 1998, Micro enterprise finance: Is there a conflict between growth and poverty alleviation? World Development, Volume 26, No. 5, pp. 783-790.
57. Morduch, J., & Haley, B. 2002. Analysis of the effects of microfinance on poverty reduction. New York: NYU Wagner Working Paper.
58. Muhammad, W. 2003. An investigation into effectiveness of micro-credit programme of AKRSP:
V
olum
e XV
Issu
e V
Versio
n I
Globa
l Jo
urna
l of H
uman
Soc
ial Sc
ienc
e
© 2015 Global Journals Inc. (US)
-
37
Year
2015
( E)
Impact of Microcredit on Agricultural Development in District Mastung Balochistan: A Case Study ofBalochistan Rural Support Programme (BRSP) Pakistan

A case study of three villages of sub-division Hunza of district Gilgit. (Unpublished master’s thesis), Agriculture University, Bangladesh.
59. Nosiru, M.O. 2010. Microcredits and agricultural productivity in Ogun State, Nigeria. World Journal of Agricultural Sciences, 6 (3), 290-296.
60. Nazli, Shah, M.K. 2006. Impact assessment of microcredit programme of PRSP on crop productivity. Pakistan Journat of Agrcultural. Science, 43, 3-4.
61. Onoja, A.O., Ibrahim, M., & Achike, A. 2009. Econometric analysis of credit and farm resource technical efficiences’ determinants in Cassava farms in Kogi State, Nigeria: A diagnostic and stochastic frontier approach.
62. Osei-Mensah, A., & Adams, S. 2009. The effect of rural non-farm sector: A case study of Suma Rural Bank in the Jaman District. Journal of Business and Enterprise Development. 120-137.
63. Pitt, Mark and Shahidur R. Khandker 1996. Household and Intra-household Impact of the Grameen Bank and Similar Targeted Credit Programs in Bangladesh; World Bank Discussion Paper No. 320; Washington, D.C.
64. Role of Micro-credit in Economic Revival and Poverty Alleviation. Business and Finance Review. The Daily “The News” May 21, 2001.
65. Roux, M.S, 2008. What can Microfinance contribute to Agriculture in Developing Countries? Proceedings from the International conference, Paris, 4-6 December, 2008.
66. Remenyi, Joe and Quinones, Benjamin. 2000. Microfinance and Poverty Alleviation: Case studies from Asia and the Pacific. New York. 79. p. 131-134, 253-263.
67. Robinsons S. 2001. The Microfinance Revolution: Sustainable Finance for the Poor. Vol. I. The World Bank: Washington D.C.
68. Rahman, A. 1999. Micro-credit initiatives for equitable and sustainable development: Who pays? World development, 27 (1), 67-82.
69. Rahman, H. Z., & Hossain, M. 1995. Rethinking rural poverty: Bangladesh as a case study, Sage Publications India Pvt Ltd.
70. Saleem, M. A., & Ali-Jan, F. 2011. The Impact of agricultural credit on agricultural productivity in Dera Ismail Khan (District) Khyber Pakhtonkhawa Pakistan. European Journal of Business and Management, 3, 38-44.
71. Shah, M. K., Khan, H., Jehanzeb, & Khan, Z. 2008. Impact of agricultural credit on farm productivity and income of farmers in mountainous agriculture in northern Pakistan: A case study of selected villages in district Chitral. Sarhad Journal of Agriculture, 24 (4), 713-718.
72. Sidhu, R., Vatta, K., & Kaur, A. 2008. Dynamics of institutional agricultural credit and growth in Punjab:
contribution and demand-supply gap. Agricultural Economics Research Review, 21.
73. Sumelius, J., Islam, K., & Sipilainen, T. 2008. Access to microfinance: Does it matter for profit efficiency among small scale rice farmers in Bangladesh? European Association of Agricultural Economists.
74. Schreiner, Mark. 2011. Microfinance in Rural Argentina. Center for Social Development Washington University of St. Louis.
75. Suresh, K. 2008. Impact of Micro Finance on Empowerment of Rural Women – A Case Study of Dairy Enterprise in the Tank Management Project Area of North Karnataka. (Unpublished Thesis).The University of Agricultural Sciences, Dharwad.
76. Shah, M.K. 2008. “Impact of Agricultural Credit on Farm Productivity and Income of Farmers in mountainous agriculture in northern Pakistan”. Sarhad Journal of Agriculture. Vol 24 (4) p. 713-718.
77. State Bank of Pakistan 2004. "Legal and Regulatory Framework for Microfinance Institutions" Prepared for International Microfinance conference: I\Microfinance in Pakistan: Innovating and Mainstreaming, Islamabad.
78. Tooley, J. 2000. Serving the needs of the poor: The private education sector in developing countries. Can the Market Save Our Schools? 167-184.
79. Tzannatos Z. 1998. Women and Labour Market Changes in the Global Economy. World Bank.Washington.
80. Tenaw, S., & Islam, K. M. Z. 2009. Rural financial services and effects of microfinance on agricultural productivity and on poverty. University of Helsinki Department of Economics and Management (Discussion Papers series), 1, 28.
81. United Nations World Development Report 2008. Agriculture for Development. (United Nations Organization).
82. Vatta, K and P Singh 2001. The Performance of Self-Help Groups in Punjab: A Study of Hoshiarpur District', Indian Journal of Agricultural Economics, Vol 56(3): 452.
83. Velasco, C., & Chiba, S. 2004. Expanding impact:
innovations in cost-effectively integrating microfinance with education in health. Pro Mujer Bolivia.
84. Wadud, M. A. 2013. Impact of microcredit on agricultural farm performance and food security in Bangladesh. Working paper,
paper no. 14, Institute
of Microfinance (InM), Dhaka, Bangladesh.
85. World Bank, 2003. Pakistan Rural Finance for Growth and Poverty Alleviation, Washington D.C. USA pp: 61.
86. Waheed, S. 2001. Analysis of issue on micro credit: The case of two villages in Punjab. The Pakistan development Review, Part II (winter 2001), Pp. 723-750.
V
olum
e XV
Issu
e V
Versio
n I
38
Globa
l Jo
urna
l of H
uman
Soc
ial Sc
ienc
e
© 2015 Global Journals Inc. (US)
-
Year
2015
( E)
Impact of Microcredit on Agricultural Development in District Mastung Balochistan: A Case Study ofBalochistan Rural Support Programme (BRSP) Pakistan

87. Wood G. and I. Sharif (1997). Who Needs Credit? Poverty and Finance in Bangladesh. Zed Books. London.
88. Wright, G. 1999. „Examining the impact of micro insurance services increasing income or reducing poverty?‟, Small Enterprise Development, 10(1), 38–47.
89. Yehuala, Sisay. 2008. Determinants of Smallholder Farmers Access to Formal Credit: The Case of Metema Woreda, North Gondar, Ethiopia. (Unpublished thesis) Faculty of the Agriculture, Department of Rural Development and Agricultural Extension, School of Graduate Studies, HARAMAYA UNIVERSITY.
90. Yaron, Kebede, Koomsa. 1997. Agricultural Credit Analysis. National Agricultural Policy Workshop.
91. Zaman, Hassan 1999. “Assessing the Impact of Micro-credit on Poverty and Vulnerability in Bangladesh” Development Economics, Policy Research Working Paper, The World Bank.
92. Zeller, M.; Meyer, Richard L. 2002. “The Triangle of Microfinance – Financial Sustainability, Outreach, and Impact”, Published for the International Food Policy Research Institute, the Johns Hopkins University Press, Baltimore and London.
93. Zia uddin, Malik. 2011. Microfinance Services for rural agriculture in Pakistan and Bangladesh. (Unpublished Master Thesis). Swedish University of Agricultural Sciences.
94. Zohir, S. & Matin, I. 2004. Wider impacts of microfinance institutions: issues and concepts, Journal of international development, volume 16, 301-330.
V
olum
e XV
Issu
e V
Versio
n I
Globa
l Jo
urna
l of H
uman
Soc
ial Sc
ienc
e
© 2015 Global Journals Inc. (US)
-
39
Year
2015
( E)
Impact of Microcredit on Agricultural Development in District Mastung Balochistan: A Case Study ofBalochistan Rural Support Programme (BRSP) Pakistan

This page is intentionally left blank
V
olum
e XV
Issu
e V
Versio
n I
40
Globa
l Jo
urna
l of H
uman
Soc
ial Sc
ienc
e
© 2015 Global Journals Inc. (US)
-
Year
2015
( E)
Impact of Microcredit on Agricultural Development in District Mastung Balochistan: A Case Study ofBalochistan Rural Support Programme (BRSP) Pakistan

© 2015. Dr. Okafor Ebele Igwemeka, Ezeaku Hillary Chijindu & Izuchukwu Ogbodo. This is a research/review paper, distributed under the terms of the Creative Commons Attribution-Noncommercial 3.0 Unported License http://creativecommons.org/licenses/by-nc/3.0/), permitting all non-commercial use, distribution, and reproduction in any medium, provided the original work is properly cited.
Global Journal of HUMAN-SOCIAL SCIENCE: E Economics Volume 15 Issue 5 Version 1.0 Year 2015 Type: Double Blind Peer Reviewed International Research Journal Publisher: Global Journals Inc. (USA) Online ISSN: 2249-460x & Print ISSN: 0975-587X
A Disaggregated Analysis on the Effects of Foreign Investment Inflows on Exchange Rate: Evidence from Nigeria By Dr. Okafor Ebele Igwemeka, Ezeaku Hillary Chijindu & Izuchukwu Ogbodo
Caritas University, Nigeria
Abstract- This study is an investigation of the effects foreign investments have on exchange rate in Nigeria. The work covered a period of 1987-2012 using annual data from Central Bank of Nigeria statistical bulletin. A growth model via the Ordinary Least Square method was used to ascertain the relationship between foreign investment inflows and exchange rate in Nigeria. Its main objective is to find the impact which foreign investments, decomposed into foreign direct investment (FDI) and foreign portfolio investment (FPI) have on exchange rate and the bidirectional influences between them. Of course, several studies have endeavored to examine the determinants of exchange rate in Nigeria. This study contributes to the literature by examining a possible determinant of exchange rate that has received less attention in the literature: foreign investment inflows. This paper examines this relationship with a view to determining the extent to which FDI and FPI effect exchange rate in Nigeria employing the Granger causality and OLS techniques. The Granger Causality test further provides insight on the causal direction of the variables. Whereas the causality tests suggest no statistical dependence between both FDI and FPI and exchange rate, the regression analyses reveals exchange rate follows FPI though not significantly while FDI has an insignificant inverse relationship with exchange rate.
Keywords:
foreign direct investment, foreign portfolio investment, exchange rate.
GJHSS-E
Classification : FOR Code: 910109
ADisaggregatedAnalysisontheEffectsofForeignInvestmentInflowsonExchangeRateEvidencefromNigeria
Strictly as per the compliance and regulations of:

A Disaggregated Analysis on the Effects of Foreign Investment Inflows on Exchange Rate:
Evidence from Nigeria Dr. Okafor Ebele Igwemeka α, Ezeaku Hillary Chijindu σ & Izuchukwu Ogbodo ρ
Abstract- This study is an investigation of the effects foreign investments have on exchange rate in Nigeria. The work covered a period of 1987-2012 using annual data from Central Bank of Nigeria statistical bulletin. A growth model via the Ordinary Least Square method was used to ascertain the relationship between foreign investment inflows and exchange rate in Nigeria. Its main objective is to find the impact which foreign investments, decomposed into foreign direct investment (FDI) and foreign portfolio investment (FPI) have on exchange rate and the bidirectional influences between them. Of course, several studies have endeavored to examine the determinants of exchange rate in Nigeria. This study contributes to the literature by examining a possible determinant of exchange rate that has received less attention in the literature: foreign investment inflows. This paper exam-ines this relationship with a view to determining the extent to which FDI and FPI effect exchange rate in Nigeria employing the Granger causality and OLS techniques. The Granger Causality test further provides insight on the causal direction of the variables. Whereas the causality tests suggest no statistical dependence between both FDI and FPI and exchange rate, the regression analyses reveals exchange rate follows FPI though not significantly while FDI has an insignificant inverse relationship with exchange rate. We therefore, recommend an intensive deepening of our stock market and reinforcing our regulatory framework to ensure the safety of investments and enhance investors’ perspective. Keywords: foreign direct investment, foreign portfolio investment, exchange rate.
I. Introduction
igeria, like most developing countries has benefited tremendously from capital flows. Foreign investment comes in two forms: Foreign
Direct Investment (FDI) and Foreign Portfolio Investment (FPI). The former entails a controlling authority over the concerned enterprise; at times it means setting up of new projects. Portfolio investment by contrast is essentially a financial transaction - purchase of stocks, bonds and currencies as assets. Many developing economies have over the years depended heavily on the
Author
α: Department of Banking and Finance, University of Nigeria
Enugu Campus. e-mail: [email protected]
Author
σ: Department of Banking and Finance, Caritas University Amorji-
Nike, Enugu, Nigeria. e-mail: [email protected]
attraction of financial resources from outside in different ways. Official and private capital flows including FDI and FPI as a way of accelerating their economic growth (Odozi, 1988; Ekpo, 1997; Uremadu, 2008). Some nations exhibited a choice for FDI since they regard it as an avenue for overcoming the slow trend in official and private portfolio capital flow (Uremadu, 2008). The need to draw foreign capital in non-debt constituting way is one of the reasons, why emerging economies wish to encourage private capital flows. Thus, there has been a dramatic increase in the magnitude of capital flows from countries in the North to emerging economies across the South where the need is high. According to Siamwalla (1999) the relative low yields in industrial countries together with impressive economic growth and attractive returns in developing, countries motivated investors to relocate their funds to direct investments. He assumes that the growth in international foreign investment inflow is an aftermath of good mixture of macroeconomic variables as well as the drift towards trade globalization, international financial linkages and expansion of production bases overseas. He further states that macroeconomic variables are indicators or main signposts indicating the current trends in the economy. Among the macroeconomic variables identified by Keynes (1930) that study foreign inflows into an economy is exchange rate.
Nigeria as an import dependent economy needs foreign investment to enhance her investment needs. That is why since the emergence of democratic governance in May 1999, she has embarked on some concrete means to encourage cross-border investors into her domestic economy. Some of these means are: the repeal of laws that are adverse to foreign investment increase, promulgation of investment laws, introduction of policies with favorable atmosphere like ease of businesses, fast export and import processing methods, fight against advanced fee frauds, instituting economic and financial crimes commission. These definite measures seem to have been making positive impact on Nigeria’s foreign capital inflows (Uremadu, 2011). However, Nigeria’s share in global flows is still grossly inadequate when compared to the net private capital flows for developing countries worth US$491.0 billion in 2005 (World Bank, 2006). The situation changed in the 1980s when capital flows took the form of foreign direct
N
Volum
e XV
Issu
e V
Versio
n I
Globa
l Jo
urna
l of H
uman
Soc
ial Sc
ienc
e
© 2015 Global Journals Inc. (US)
-
41
Year
2015
( E)
Authorρ: Department of Banking and Finance, Enugu State University ofScience and Technology (ESUT) Enugu, Nigeria.e-mail: [email protected]

investment (FDI) and foreign portfolio investment (FPI). While portfolio investment has been a notable feature of developed economies, it is becoming a very important component of the balance of payments of many emerging economies, such as China, Hong Kong, India, Singapore, Taiwan, Brazil, South Africa etc. (Obadan, 2004). Recently, portfolio investment has gained prominence in Nigeria. Before the middle of 1980s, Nigeria did not record any figure on portfolio investment (inflow or outflow) in her balance of payment (BOP) accounts. This was traceable to the non-internationalization of the country’s money and capital markets as well as the non-disclosure of information on the portfolio investments of Nigerian investors in foreign capital/money markets (CBN 1997:151).However, FDI dominated Nigeria’s capital flows and its benefits are aptly captured by Sadik and Bolbol (2001) in their study. They argued that FDI is the least volatile of capital flows, and more important, can have direct and indirect effects on economic growth. The stability of FDI stems from the fact that direct investors have a longer-term view of the market, thus making them more resistant to herd behaviour, and from the sheer difficulty of liquidating assets at short notices.
With the introduction of various structural reforms, FDI has become a vital source of private external finance for developing countries. It is not like other major types of external private capital flows because it is motivated mostly by the investors long term prospects for making profits in production activities that they indirectly or directly control. Foreign bank lending and portfolio investment on the other hand are often motivated by short- term profit returns that can be determined by some factors, like interest rate, and are inclined to herd behavior. FDI represents investments in production facilities and so can contribute to investible resources and capital formation. Again, it is a way of transferring production technology, skills, innovative capacity, and organizational and managerial practices between locations, and also of procuring international market networks (Mallampally and Suavant, 1999). The international flow of capital is expected to benefit both the source as well as the host country.
The main intensions for countries to seek investments by multinational corporations (MNCs) are to obtain modern technology and knowledge. The assumption is that new technology and knowledge could transfer to domestic firms which will improve their output (Blomstrom and Kokko, 1998). These transfers or spillovers and externalities can occur through various ways.
Spillover may occur when well trained staffs of foreign firms’ setup their own plants or become employed in locally owned firms. The operation of MNCs may lead to the dissemination of information on new technology and production methods also referred to as “the demonstration effect”
By associating with domestic firms, foreign associates may improve the production competence of the host country (Rodriquez Clare, 1996). There may be competition effect, where the emergent of foreign plants may accelerate competitions and so push domestic firms into being more effective and innovative ( Doan, et al, 2010). Another reason why governments make efforts to attract FDI is that it creates employment and FDI may generate foreign exchange for the host country if the MNCs are export oriented. Summarily, in the long run, the transfer of technology and knowhow (indirect) by MNCs to domestic firms may be of more value than direct effects of FDI.
In sharp contrast to other forms of capital flows, FDI has proven to be resilient during financial crisis (Prakash and Assaf, 2001; Haussmann and Fernandez- Arras, 2000; Dudash, 2000 and Lipsey, 2001). The East Asian crisis of 1997-98, Mexican crisis of 1994-95 and the Latin American debt crisis of the 1980s all attest to this. Foreign portfolio investment (FPI) flows have been the most volatile component of capital flow in Nigeria and play an important role in determining the overall balance of payments. This is why Haussmann and Hernandez Arias (2000) further indicate that many host countries regard international debt flows, mostly the short-term ones as “bad cholesterol”, because it is based on interest rate differentials and exchange rate expectations and not on long term considerations. The term “exchange rate” can be defined as the price of one country’s currency in terms of another. Iyoha and Unugbro (2005) defined exchange rate as the domestic price of a unit of foreign currency. It refers to the cost of exchanging one country’s currency for others. Exchange rates are an important yardstick for measuring economic performance, particularly, the impact on price signals, international trade and foreign direct investment. The maintenance of low inflation rates involves higher interest rates, and this leads to the appreciation of the country’s exchange rate. Exchange rate regimes in Nigeria have gone through different levels of changes. As the Governor of the Central Bank of Nigeria observed (Sanusi, 2004, p.1), exchange rate arrangements in the country “shifted from a fixed regime in the 1960s to a pegged arrangement between the 1970s and the mid-1980s, and finally, to the various types of the floating regime since 1986, following the adoption of the Structural Adjustment Program (SAP).” A fixed exchange regime led to an overvaluation of the local currency (i.e., the Naira) and was supported by exchange control regulations that caused instability and distortions in the economy (ibid). On the other hand, floating exchange rates have induced unprecedented volatility in the economy (Olowe, 2009). A low rate of inflation affects economic growth and development negatively due to the immediate impact on investment demand. On the part of net-export, the appreciation of exchange rate hurts export and encourages imports. Nigeria operated
V
olum
e XV
Issu
e V
Versio
n I
42
Globa
l Jo
urna
l of H
uman
Soc
ial Sc
ienc
e
© 2015 Global Journals Inc. (US)
-
Year
2015
( E)
A Disaggregated Analysis on the Effects of Foreign Investment Inflows on Exchange Rate: Evidence from Nigeria

a fixed exchange rate regime prior to the introduction of the SAP in 1986.
Since then, the value of the Naira to the US dollar has depreciated remarkably, reaching its lowest rate of over 150 Naira to one dollar in 2009. As argued by Sanusi (2004), the maintenance of a realistic exchange rate for the Naira is very crucial, given the structure of the economy, and the need to minimize distortions in production and consumption. However, the Nigerian foreign exchange market is peculiar in the sense that the country’s foreign exchange earnings are more than 90 per cent dependent on crude oil export receipts (ibid). The fluctuations in the global oil market have direct impact on the supply of foreign exchange in Nigeria and revenue allocation to the three tiers of government in the country. This is because the oil sector contributes more than 80 per cent of government revenue (ibid). Increased price of crude oil at the global market brings in additional foreign exchange, which in turn induces an upward adjustment in revenue allocation to the three tiers of government in Nigeria. Empirical evidence shows that much of such revenues are utilized for consumption as opposed to production purposes. This, no doubt, pushes up aggregate demand including, imported goods and services. With a high import propensity in the country, the demand on foreign exchange has the impact of depleting the country’s foreign reserve.
In many developing countries exchange rate issues have tended to influence macroeconomic policy discussions during the last few years. This is attributed to the amount of the effect which exchange rate has on decisions to save and invest as well as its being a major determinant of capital inflow and external competitiveness of a country.
In pursuing some economic goals such as the achievement of a balance of payment viability, the maintenance of internal payment, as well as the solutions to the problems of defining, measuring, detecting and correcting situations of real exchange rate misalignment and over valuation, the exchange rate can also be employed to entice new investors.
Exchange Rate Adjustment (ERA) has been undertaken by government for a number of years (Obaseki, 1991). When payments for transactions in a foreign currency are to be made, or received, the rate at which the two currencies change hands will be determined in the foreign exchange. Hence the market price is determined by supply and demand of foreign exchange. Exchange rate is a veritable instrument of economic management and important macro economic indicator used to assess the general performance of an economy (Ojo, 2003). It is noteworthy however, that despite the observed increasing inflows of foreign investments, there has not been any satisfactory attempt to assess its effect on exchange rate in Nigeria. In this study, we explore an econometric analysis of this issue
using appropriate techniques. The rest of the paper is divided into sections as follows: section two comprises a brief survey of related literature and it addresses mainly the theoretical and empirical issues. Section three considers methodology and data while the fourth section is devoted to the empirical findings or results. Section five is the last section and is made of conclusion and recommendations.
II. Literature Review
The relationship between foreign investment and exchange rate has drawn attention from many studies both theoretical and empirical.
The paradigm of
Salter-Swan-Corden-Dorbusch by Corbo and Fisher (1995) serves as the theoretical underpinning to test empirically the incidence of capital flows on exchange rate in emerging economies. The model explains how a surge in capital flows would lead to an appreciation of real exchange rate (Carbo and Fisher, 1995). A rise in capital flows increase real wage, which in turn brings out the rise in domestic demand and hence in prices of non-tradable goods relative to tradable books that are exogenously priced. This is indicative of the presence of “Dutch-Disease Effects” which describes the side effects natural resource booms or increases in capital flows on the competitiveness of export oriented sectors and import competing sectors. However, different
types
of capital flows may have different effects on exchange rate because they affect it through different ways.
Exchange rate movement and exchange rate uncertainty seem to be important factors investors take into consideration in their decision to invest abroad. Foreign capital inflows are generally perceived as something desirable to the industrialized and developing countries. It can eliminate foreign exchange shortages, improve standard of living, deepen and broaden the financial markets. Capital inflows have also helped individual countries to absorb shocks either internal such as harvest failures to external such as fluctuations in commodity price or recessions in industrial economies (Unugbro, 2007). Since the world has moved towards higher integration, a degree of openness for foreign investments in many countries becomes higher. As both developed and emerging economies continue to open their markets to attract foreign capital flows and investors are becoming more interesting in diversifying their
fund flows internationally
the role of foreign investment is increasing important. International investors now have renewed interest in long term projects, that is, FDI and portfolio investment such as making a purchase or sale of financial assets across countries increase the emphasis of both FDI and FPI. Considering the major determinants of foreign investment, exchange rate risk is possibly seen as the most important determinant of foreign investment flows (Aranyarat, 2010).
V
olum
e XV
Issu
e V
Versio
n I
Globa
l Jo
urna
l of H
uman
Soc
ial Sc
ienc
e
© 2015 Global Journals Inc. (US)
-
43
Year
2015
( E)
A Disaggregated Analysis on the Effects of Foreign Investment Inflows on Exchange Rate: Evidence from Nigeria

Phillips, et al, (2008) argues that the linkage between exchange rate risks and FDI can be classified into two major issues consisting of production flexibility and risk aversion. In the production flexibility approach, manufacturers commit to domestic foreign capacity ex ante and to employment decisions ex-post, after the realization of real stocks. Thus, the movements of exchange rate play no role in explaining the level of FDI. This argument is based on the assumption that firms can adjust their variable factors after the realization of exchange rate stocks, as a result, it would not be held if factors were fixed. With the risk aversion approach, the evidence could be grouped into two aspects. The first impact is derived from exchange rate steadiness. A stability of dollar matched with a rise in the level of total investment inflow suggests that international investments would be driven partly by variability of exchange rate. The study of Foad (2005) shows that under the condition of limited potential direct investment, FDI flows from the countries with high level of exchange rate risk into the countries with higher stability in currency. This finding is consistent with Dixit and Pindyck (1994) who shows that FDI in a country with a high level of currency risk provides an uncertain flow of expected return on investment. As a result, the link between FDI and exchange rate stability is positive. Another effect can be obtained through the marginal revenue and cost channels. That is, it focuses on the effect of exchange rate differentiating investment decision based on the loss and profit from the investment. As suggested by Goldberg and Karlstad (1995). Higher volatility in the exchange rate reduces the expected returns functions of firms that make investment decisions in the current period in order to realize profits in future periods. According to Campa (1993) risk neutral firms tend to postpone their decision to enter the foreign market in order to avoid high exchange rate variability and for Nucci and Pozzoco (2001) currency depreciation stimulates aggregate investment responses for Italian manufacturing firms through revenue channels and disincentive investment through cost channel. As long as FDI is somewhat irreversible, there is some positive value to holding off on this investment to acquire more information. Given that there is a finite number of potential direct investments, countries with a high degree of currency risk will lose out to countries with more stable currencies (Foad, 2005).
In the analysis of Aizenman (1992) the finding is that a fixed exchange rate regime is more convenient for FDI than a flexible exchange rate, not minding the type of shock hitting an economy. When there is monetary shock, the nominal shocks reduce expected profits from under a flexible exchange rates regime. For real shocks, flexible exchange rates are linked with higher employment volatility and lower expected returns. This arises because a country having a positive productivity shock usually experiences nominal and real
appreciation which reduces the effect of employment
expansion. For fixed exchange rates, the level of employment and production can be isolated from monetary shocks, and they are related to higher expected returns. These, in turn activate domestic investment and FDI. For real shocks under a fixed exchange rate, a positive productivity shock tends to expand employment and expected returns. So, in the face of productivity shocks, FDI flows will be more under a fixed than under a flexible exchange rate system.
The empirical research mostly finds that increased exchange rate uncertainty has a positive impact on FDI. In the work of Goldberg and Kolstad (1995) using quarterly data to analyze bilateral investment flows between the United States and the United Kingdom, Canada, Japan between
1978 and
1991. They find that exchange rate variability had a positive and statistical significant impact on four of the six bilateral FDI shares, and so real exchange rate variability increased the share of total U.S investment capacity located in Canada and Japan and increased the share of Canadian and U.K investment situated in the united state. Exchange rate variability was insignificant only in situation where problems arose in estimating the regression equations.
Again, Serve (2003) using GARCH model of volatility investigates exchange rate volatility and investment in developing countries and finds that exchange rate uncertainties negatively affect investment in developing countries. The study equally shows that financial systems and the degree of openness of a country are important in establishing the investment effect of exchange rate uncertainty. While more efficient financial system is positively related to investment.
In the case of FPI, Bigger (1979) shows that from international point of view, the overall rate of return from holding foreign financial assets consists of investment returns (dividends and capital gains) on the asset including gains and losses from the movement in exchange rate at the holding period. The volatility of exchange rate is an added source of uncertainty that may create both potential gains and losses to investors across countries. This also shows that the volatility of exchange rate quickly increases foreign investment risk in holding bonds and stocks, however the effect of exchange rate for volatility on international investment is significantly more than investment risk for stock because stocks are more volatile when compared to bonds.
Eun and Resnick (1988) investigate the effect of exchange rate volatility on the risk of foreign stock market investment and show that with the Modern Portfolio Theory (MPT) investors estimate the risk-return nature of financial assets when considering optimal portfolio. In such situation exchange rate volatility leads to portfolio risk. On the other hand, based on efficient
V
olum
e XV
Issu
e V
Versio
n I
44
Globa
l Jo
urna
l of H
uman
Soc
ial Sc
ienc
e
© 2015 Global Journals Inc. (US)
-
Year
2015
( E)
A Disaggregated Analysis on the Effects of Foreign Investment Inflows on Exchange Rate: Evidence from Nigeria

international portfolio strategy, the volatility of exchange rate is rather essential to multinational investors because of its ability to get potential gains from international diversification. Again, they further examined that variability of exchange rate is seen to account for nearly fifty percent of the variability of dollar returns from equity investment in such major countries as Japan, Germany and the United Kingdom.
Corsetti Kondtntionu (2009) shows that the valuation effect of exchange rate volatility acts as fund transfer across countries, with the capital gains to U.S investors following depreciation in dollar balanced by capital losses for foreign investors. This shows that the welfare consequent of redistribution of wealth is actually considerable.
Gazionglu (2008) in a study of the effect of capital inflows and outflows on real exchange rates and the real stock market returns before and after the financial crisis in turkey, finds an asymmetric impact of capital on exchange rate and stock market returns.
III. Methodology
The study applies multiple regression models to investigate the relationship between total foreign capital inflows, disaggregated into foreign direct investment and foreign portfolio investment, and exchange rate in Nigeria. The work covered a period of 1987-2012 using annual data from Central Bank of Nigeria statistical bulletin. The choice of multiple regressions is based on the use of more than single dependent variable in a regression model.
a) Model Specification The selection of the model is based on the
theoretical perspectives of the nexus between foreign capital inflows, which maintains that such inflows have effect on exchange rate. The variables used in this study on the effect of foreign investment inflows on exchange rate in Nigeria are exchange rate (EXR), foreign direct investment (FDI), foreign portfolio investment (FPI). Thus, the growth model is specified as:
i.
Unit root test
Time series data are, if not stationary, prone to problems of spuriousness. Hence, we tested for the presence of unit root. This was necessitated because we wanted to ensure that the parameters estimated are
stationary time series data. We utilized the Augmented Dickey-Fuller (ADF). To reject the null hypothesis that that the data are non- stationary, the ADF statistics must be smaller than the critical values.
Table 1 :
Augmented Dickey-Fuller Unit Root Test
Null Hypothesis: D(EXR) has a unit root
V
olum
e XV
Issu
e V
Versio
n I
Globa
l Jo
urna
l of H
uman
Soc
ial Sc
ienc
e
© 2015 Global Journals Inc. (US)
-
45
Year
2015
( E)
A Disaggregated Analysis on the Effects of Foreign Investment Inflows on Exchange Rate: Evidence from Nigeria
EXR= f (FPI, FDI) - - - - - - - - - (1)
Therefore, mathematically, exchange rate is expressed as a function of foreign capital inflows thus;
Et = f(FCIt ) - - - - - - (2)Where:
Et = Exhcange rate at time tFCIt = Foreign Capital Inflows at time t
When equation (1) is expanded to accommodate indicators of Foreign Capital Inflows, we have:
EXT = α + β1FDI + β2 FPI + µ - - - - - - (3)Where:
EXT= Exchange rateα = Equation constantFDI = Foreign Direct InvestmentFPI = Foreign Portfolio Investmentµ = Error term
Meanwhile, we introduced log in the equation to improve the linearity of the equationMeanwhile, we introduced log in the equation to improve the linearity of the equation
DLEXR = f (DLFPI + DLFDI) - - - - - - - (4)
t-Statistic Prob.*
Augmented Dickey-Fuller test statistic -4.781273 0.0009
Test critical values: 1% level -3.7378535% level -2.99187810% level -2.635542
Durbin-Watson stat 1.994982

Null Hypothesis: D(FDI) has a unit root
Durbin-Watson stat 1.948740
Null Hypothesis: D(FPI) has a unit root
Durbin-Watson stat 1.998083
Source: Authors
Table 1 shows results of tests for stationarity and autocorrelation after transformation of the time series data. This is in effort to make sure that the outcome of the overall result will not be spurious, unreliable and misleading. The results in table 1 shows that the computed ADF test-statistics for all the variables
(EXR, FDI and FPI) are smaller than the critical
values at 1%, 5% and 10% significant levels and the Durbin-Watson statistics are very significant and approximately 2, which means there is no autocorrelation problems in the time series data and prove that the result is reliable.
Analysis of Empirical Results
Table 2 : Regression Results
Source: Authors.
V
olum
e XV
Issu
e V
Versio
n I
46
Globa
l Jo
urna
l of H
uman
Soc
ial Sc
ienc
e
© 2015 Global Journals Inc. (US)
-
Year
2015
( E)
A Disaggregated Analysis on the Effects of Foreign Investment Inflows on Exchange Rate: Evidence from Nigeria
As shown in the table 2 the impact of foreign portfolio investment on exchange rate is positive and non-significant (coefficient of FPI = 0.069, t – value = 1.721). This indicates that a foreign portfolio investment inflow has positive but non-significant impact on
exchange rate in Nigeria. The probability value of 0.1024 confirms the non-significance of the impact. Also, as shown from the table the impact of foreign direct investment inflow was negative and non-significant (coefficient of FDI = -0.017, t – value = -0.155). This
IV.
t-Statistic Prob.*
Augmented Dickey-Fuller test statistic -5.612410 0.0001
Test critical values: 1% level -3.7378535% level -2.991878
10% level -2.635542
t-Statistic Prob.*
Augmented Dickey-Fuller test statistic -5.448983 0.0000
Test critical values: 1% level -3.7378535% level -2.99187810% level -2.635542
Dependent Variable: DLOG(EXR(-1))Method: Least SquaresIncluded observations: 26
Variable Coefficient Std. Error t-Statistic Prob.
C -0.083467 0.087489 -0.954025 0.3527
DLOG(FDI(-1)) -0.017076 0.110509 -0.154521 0.8789
DLOG(FPI(-1)) 0.068595 0.039857 1.721009 0.1024
R-squared 0.579323 Mean dependent var 3.791134Adjusted R-squared 0.511003 S.D. dependent var 1.252650S.E. of regression 0.529971 Akaike info criterion 1.676179Sum squared resid 6.460000 Schwarz criterion 1.821344Log likelihood -0.49033 Hannan-Quinn criter. 1.717981F-statistic 58.33370 Durbin-Watson stat 1.601374Prob(F-statistic) 0.000400

indicates that foreign direct investment inflow has negative and non-significant impact on exchange rate of Nigeria. The probability value of 0.8789 > 0.05 confirms the non-significance of the impact. The coefficient of determination as revealed by R-square (R2) indicates
that 58% of the variations observed in the dependent variable were explained by variations in the independent variables. The probability of F-statistic (0.000400) shows reveals that the overall regression is significant and passes the goodness of fit test.
Table 3 :
Granger Causality
The above table reveals that there is no causal relationship between FDI and exchange rate, and vice versa. However, while FPI does not granger cause exchange rate, the later granger causes FPI thereby indicating the existence of uni-directional causality between the variables.
V.
Conclusion
and
Recommendations
The result above shows that foreign portfolio investment had positive and non-significant impact on exchange rate while foreign direct investment had negative and non-significant impact on exchange rate. The findings of this study follow the suggestion that the composition of foreign investment inflows matters in determining their impacts on exchange rate. Hence, our results show that FDI had negative and non-significant impact on exchange rate in Nigeria. This was confirmed in the studies of Darby, et al, (1999), Bryne and Davis (2003), Benassy-Querre, et al,
(2001).This implies that base-broadening hypothesis holds (as the coefficient of FPI is positive); hence, the amount of FPI in the economy drives up exchange rate. The implication is that foreign portfolio investment has the potential to appreciate exchange rate.
The negative contribution of FDI to exchange rate improvement may be a reflection of Nigeria’s poor business climate. There is need to consciously improve the business environment to enable foreign direct investments contribute positively to exchange rate by encouraging foreign investors in the non-oil sector for exports. This is because the country’s foreign exchange earnings are more than 90 percent dependent on crude oil export receipts and the fluctuations in the global oil market have direct impact on the supply of foreign exchange in Nigeria.
FDI also increase the foreign exchange earnings of developing countries by generating new export products. If however FDI is focused on sectors where there are already competing domestic enterprises, this
may erase investment opportunities for domestic investors. We thus suggest that foreign direct investors should be encouraged by sustainable government policies to invest in the manufacturing sector which will increase the export of finished products and thereby appreciate our exchange rate.
References Références Referencias
1.
Aranyarat, C. (2010). The effect of exchange rate volatility on foreign direct investment and portfolio flows to Thailand.
2.
Bigger, N. (1979). Exchange rate implication of international portfolio diversification. Journal of International Business Studies, 10:64-74.
3.
Blomstrom.M. & Kokko, A. (1998). Multinational corporation and spillover. Journal of Economic Survey, Vol.12.
4.
Campa, J.M. (1993). Entry by foreign firms in the United States under exchange rate uncertainty. Review of Economics and Statistics, 75,614 – 622.
5.
CBN Economic and Financial Review,
Vol.48 (1),7-8.
V
olum
e XV
Issu
e V
Versio
n I
Globa
l Jo
urna
l of H
uman
Soc
ial Sc
ienc
e
© 2015 Global Journals Inc. (US)
-
47
Year
2015
( E)
A Disaggregated Analysis on the Effects of Foreign Investment Inflows on Exchange Rate: Evidence from Nigeria
6. Corbo, V. & Fisher (1995). Macroeconomic adjustments to capital flows. World Bank Policy Research Paper N0.1337.
7. Corsetti, G. & Konstantinou, P. (2009). What drives U.S foreign correlation in stock returns. QuarterlyJournal of Economics, 108,905-939.
8. Dixit, A.K. & Pindyck, R.S. (1994). Investment under uncertainty. International Economic Review, 36, 855 – 873.
Pairwise Granger Causality TestsSample: 1987 2012Lags: 2
Null Hypothesis: Obs F-Statistic Prob.
LOG(FDI(-1)) does not Granger Cause LOG(EXR(-1)) 23 1.23495 0.3143LOG(EXR(-1)) does not Granger Cause LOG(FDI(-1)) 1.11989 0.3480
LOG(FPI(-1)) does not Granger Cause LOG(EXR(-1)) 23 0.27720 0.7611LOG(EXR(-1)) does not Granger Cause LOG(FPI(-1)) 7.52987 0.0042
Source: Authors

9.
Doan,
D. (2010). FDI and economic growth in developing countries: the growth effects of vertical, horizontal and export platform FDI.
10.
Ekpo, A. H. (1995). Foreign direct investment in Nigeria: evidence from times series. CBN
Economic and Financial Review, 35 (1).
11.
Engle F.R. and W.C Granger (1987), “Co-integration and Error Correction: Representation, Estimation and Testing”,
Econometrical, vol 55, pp. 25 1-276
12.
Eun, C.S. & Resnick, B.G. (1988). Exchange rate uncertainty, forward contracts, and international portfolio selection.
Journal of Finance, 43,197-215.
13.
Foad, H. S. (2005). Exchange rate volatility and export oriented FDI Emroy University, Atlanta, G A.
14.
Gazioghi, S. (2008). Stock market returns in an emerging financial market: Turkish case study. Applied Economic, 40 (11),1363-1372.
15.
Goldberg, L.S. & Kolstad, C.D. (1995). Foreign direct investments exchange rate variability, and demand uncertainty. International Economic Review, 36(4), 855 – 873.
16.
Hausmann, R. & Fernandez Ariaz, E. (2000). Foreign direct investment: good cholesterol? IDB
Working Paper,
No. 348.
17.
Iyoha, M. A. & Unugbro, A.O. (2005).International Trade and Finance.
Reversed Edition, Mindex Publishing Benin City.
18.
Keynes, J.M (1930). A treatise on money. In Rajitis, Foreign Direct Investment, Portfolio Investment and macro stability. Economic and political weekly, 29 ( 7).
19.
Khan A, (2007), “Foreign Direct Investment and Economic Growth: The role of Domestic Financial Sector”, PIDE Working Paper.
20.
Lipsey, R.E. (2001). Foreign direct investors in three financial crises. NBER Working Paper, No. 8084.
21.
Mallampally, P. & Sauvant, K.P. (1999). Foreign direct investment in developing countries. Finance and Development, Vol. 36(1).
22.
Nucci, F. & Pozzolo, F. (2001). Investment and the exchange rate: an analysis with firm level panel data.
European
Economic Review, 45, 259-283.
23.
Obadan, M.I. (1982). Direct investment in Nigeria: an empirical analysis. African Studies Review, XXV 91.
24.
Obaseki, P. J. (1991). Foreign exchange management in Nigeria: past, present and future. CBN
Economic and Financial Review, 29(1).
25.
Odozi, V. A. (1998). An overview of foreign direct investment in Nigeria, 1960 – 1995. Occasional Paper, Research Dept. CBN No. 11
26.
Ojo, M.O.(2003). Foreign exchange management strategies under Nigeria’s Structural Adjustment Programme. CBN Bulletin, July 24, 2003.
27.
Onugbo, A. O. (2007). The impact of exchange rate fluctuation on capital inflow: the Nigerian experience
1980 – 2003. The Nigerian Academic Forum, 13(2), 12 – 18.
28.
Onwumere, J.U.J. (2009). Business and Economic Research Methods,
Enugu; Vougasen
Limited.
29.
Philips, S. &
Fredoun, Z.A. (2008). Exchange rates and foreign direct investment: theoretical models and empirical evidence. The Australian Journal of Agriculture and Resource Economics,
52, 505 – 525.
30.
Prakash, L. & Assaf, R. (2001). How beneficial is foreign direct investment for developing countries. Finance and Development, Vol. 38(2).
31.
Rodriquez-Clare, A. (1996). Multinational linkages and economic development, American Economic Review, Vol. 86.
32.
Servein, L. (2003). Real exchange rate uncertainty and private investment in LDCS. The Review of Economics and Statistics, Vol. 85:212-218.
33.
Siamwalla, A., Vajragupta, Y. & Vichyanoad, C. (1999). Foreign capital flows to Thailand: determinants and impact. Thailand Development Research Institute, November 1999.
34.
Uremadu, S. O. (2008). Foreign direct investment, liquidity and real country growth: evidence from Nigeria.
V
olum
e XV
Issu
e V
Versio
n I
48
Globa
l Jo
urna
l of H
uman
Soc
ial Sc
ienc
e
© 2015 Global Journals Inc. (US)
-
Year
2015
( E)
A Disaggregated Analysis on the Effects of Foreign Investment Inflows on Exchange Rate: Evidence from Nigeria

© 2015. Katerina Ristovska & Aneta Ristovska. This is a research/review paper, distributed under the terms of the Creative Commons Attribution-Noncommercial 3.0 Unported License http://creativecommons.org/licenses/by-nc/3.0/), permitting all non-commercial use, distribution, and reproduction in any medium, provided the original work is properly cited.
Global Journal of HUMAN-SOCIAL SCIENCE: E Economics Volume 15 Issue 5 Version 1.0 Year 2015 Type: Double Blind Peer Reviewed International Research Journal Publisher: Global Journals Inc. (USA) Online ISSN: 2249-460x & Print ISSN: 0975-587X
The Impact of Globalization on the Business By Katerina Ristovska & Aneta Ristovska
Abstract- The modern liberal, capitalistic and economic actions become a conglomerate of factors and reasons, analysis, information, mediums, skills and predispositions influencing on the business. The participation on the world's global markets, the internationalization and the transfer of the business activities on all geographic meridians, encountering different and often uncertain environments is a constant business story of the international economic activity for at least three centuries ago. The global economic interaction is as old as it is old the society in its more or less organized form. From the industrial revolution until today, there is ongoing irreversible global economic integration. The reasons are simple, business and profits do not recognize borders, national and cultural unsurpassed characteristics, where more or less a mutual benefit of certain cooperation is recognized, a business connection is immediately established. Making an decision for investment on a foreign location is a process of extensive analysis, thoroughly and profound long-term thinking and scanning of the institutional and legal frameworks that should provide in advance, and to some extent, guaranteed predictability, in terms of responsiveness to a certain dilemmas, how much to be invested, where to direct the capital, what will be the economic benefit and the ability to anticipate, in advance, the given risks.
Keywords: internationalization, global markets, economic integration.
GJHSS-E Classification : FOR Code: 150399
TheImpactofGlobalizationontheBusiness
Strictly as per the compliance and regulations of:

The Impact of Globalization on the Business Katerina Ristovska α & Aneta Ristovska σ
Abstract- The modern liberal, capitalistic and economic actions become a conglomerate of factors and reasons, analysis, information, mediums, skills and predispositions influencing on the business. The participation on the world's global markets, the internationalization and the transfer of the business activities on all geographic meridians, encountering different and often uncertain environments is a constant business story of the international economic activity for at least three centuries ago. The global economic interaction is as old as it is old the society in its more or less organized form. From the industrial revolution until today, there is ongoing irreversible global economic integration. The reasons are simple, business and profits do not recognize borders, national and cultural unsurpassed characteristics, where more or less a mutual benefit of certain cooperation is recognized, a business connection is immediately established. Making an decision for investment on a foreign location is a process of extensive analysis, thoroughly and profound long-term thinking and scanning of the institutional and legal frameworks that should provide in advance, and to some extent, guaranteed predictability, in terms of responsiveness to a certain dilemmas, how much to be invested, where to direct the capital, what will be the economic benefit and the ability to anticipate, in advance, the given risks. Keywords: internationalization, global markets, economic integration.
I. Introduction
he global changes in the world, changes in political, economic and business activities as well as the development of technology, transport and
communications, impose the need for enterprises in its struggle for survival, to change their strategies and go out from the borders of their own country. Limited market, competitive pressure, demand for cheaper resources and the dynamics of the postmodern era, force business leaders to change their focus from traditional targets to alternative measures for successful business and enter on global markets, with the aim of creating competitive advantage.
Major investments don’t tolerate improvisation because the capital and the assets are acquired at the cost of big effort and hard work, and their increase must not turn into big loss. Business entities, by definition, always act rationally, first, when choosing a certain environment they do a detailed scan of the situation, the political and social dependence of the environment, the cultural identification of the social environment, the geographical position of the targeted environment, the possibility for easier access to existing resources and
Author α:
e-mail: [email protected]
technologies, labor force that is compatible with the needs for efficient operations as well as good infrastructural network of the location, because the goods, the products and the services require mobility, quick transfer and availability at every moment, on every market, in general, anywhere and fastest, where there is necessity and need.
II. International Business and The Global Market
International business is a term used to describe all commercial transactions, in general, (private and governmental, sales, investments, logistics and transport) which occur between two or more regions, countries and nations beyond their political borders (Radebaugh & Sullivan, 2007). International business refers to those business activities which include cross-border transactions of goods, services or resources between two or more nations. Transactions of economic resources include capital, skills, people for international production of physical goods or services, such as finance, banking, insurance, construction (Joshi, 2009). According to Rugman and Collinson, international business analyzes transactions that take place across national borders in order to meet the needs of individuals and organizations. These economic transactions consist of trade (imports and exports) and foreign direct investment (Rugman, Collinson, & Hodgetts, 2006). According to Ball, international business is a business whose activities are carried out beyond the borders of their country and not only include international trade and international production but growing service trade in areas such as transport, tourism, advertising, construction, retail and mass communication (Ball, McCulloch Jr., Frantz, Geringer, & Minor, 2002).
The companies that are active in international business are called multinational enterprises. Multinational enterprise is an enterprise or corporation that owns substantial resources and performs various business activities through a network of branches located in different countries and each branch form its business strategy, based on the different market characteristics (Cavusgil, Knight, & Riesenberger, 2008). Multinational company is based in one country but has business activities in several countries. There are opinions that the multinational company is one that is structured and conducts business or property held in many countries or a company organized into global production parts.
T
V
olum
e XV
Issu
e V
Versio
n I
Globa
l Jo
urna
l of H
uman
Soc
ial Sc
ienc
e
© 2015 Global Journals Inc. (US)
-
49
Year
2015
( E)

The reasons why a company becomes a multinational, Ansoff separates into two categories (Ansoff, 1984):
Operational needs: providing materials, equipment, technology and release of surplus production;
Strategic needs: ensuring the inviolability of future changes in the external environment, steady growth (maintaining historic patterns of growth, avoiding stagnation caused by saturation, increasing the volume of business, increasing the rate of growth) and better profitability.
III.
Globalization of Business
The development of international business activities coincided with widespread phenomenon of globalization of markets
(Cavusgil, Knight, &
Riesenberger, 2008). The globalization of markets refers to the growing economic integration and the growing interdependence of countries worldwide. Internationalization of the companies refers to the tendency of the companies to systematically increase the international scope of their business activities, while globalization refers to a macrotrend, intensive economic relations between the countries in the world. Globalization encourages companies to internationalize and to substantially increase the volume and types of cross-border transactions of
goods, services and
capital. Also, the globalization leads to rapid dissemination and diffusion of products, technology and knowledge in the world, regardless of the origin.
The process of globalization is a natural process that is a result of the growing and accelerated process of generalizing of the character and process of
production. The development of science, engineering and technology and the expansion of markets for goods, worldwide, lead to internationalization of economic and financial developments. If globalization is understood as a process that leads to greater economic integration of national economies, as a process of fragmentation of the world economy and the international economy, than
the globalization is a
process of opening of national economies through the
removal of
economic and financial boundaries of national economies and thus their transformation into an international economic and financial market
(Jovanovski,
2007). Globalization is a worldwide trend, through
which economies in the world lose their borders and connect to each other. The companies are no longer imprisoned in their borders and can implement a wide range of business activities around the world. Many companies are present in markets around the world, purchase
raw products
or conduct research and
development worldwide. Trade barriers fall and global trade between countries in goods and services is
growing faster than domestic production. As a result
of this, companies can not afford the luxury to assume that the success of the domestic market will lead to long-term profitability
(Cullen & Parboteeah, 2010). The flow
of money across national borders is free, companies seek better financing rates in the world and investors everywhere are looking for a more favorable return on investment.
The globalization from economic aspect
has two main components: the globalization of markets and globalization of production. The globalization of markets
refers to the merging of historically different and separate national markets into one big global market. In recent years, constantly is discussed that the tastes and preferences of consumers in different countries and nations begin to resemble on a global level and the way that they help in the creating
of
a global market. The
companies that offer standardized products worldwide, help in the creation of a global market. The most common global markets are
not the
markets for mass
consumer products, because there are still differences between countries in terms of tastes and preferences, which still have great meaning and a sort of brake on globalization, but these are the markets for industrial goods and materials that have universal need
in
the
world.
The globalization of production
refers to the tendency of
the
companies to find suppliers of goods
and services from locations around the world, in order to realize the advantage of national differences in price and quality of the factors of production. Companies do this in order to reduce overall costs and thereby
to
improve
the quality or to improve the functionality of their product
offering to compete more effectively(Hill, 2008).
The process of globalization, the fight for survival, constant pressure and the need to preserve and strengthen the market position, force the companies to be willing
to constantly innovate and explore opportunities for achieving competitive advantage and expanding business activities outside the domestic market.
IV.
Factors for Globalization
Entrance of the companies in the global market becomes inevitable not only because of limitation of the domestic market but also because of the globalization; the domestic market share is under threat from foreign competition
(Bartels, Buckley, & Mariano, 2009). There are several specific factors that promote globalization and guide enterprises to strive for business development and growth through the international and global operations and include: political changes, development of technology, international business climate, market development, expenses and competition
(Ball, McCulloch, Geringer, Minor, & McNett, 2001).
V
olum
e XV
Issu
e V
Versio
n I
50
Globa
l Jo
urna
l of H
uman
Soc
ial Sc
ienc
e
© 2015 Global Journals Inc. (US)
-
Year
2015
( E)
The Impact of Globalization on the Business

a) Political changes The globalization trend of unifying and
socializing the global community, as well as, forming preferential trade agreements and unions, such as NAFTA and the European Union, which unite more nations in a single market allow the companies significant market opportunities. Two aspects of this trend, which contribute to the globalization of business operations, are:
⇒ Progressive reduction of barriers for trade and foreign investment by most governments, which leads to intense opening new markets by international companies, which also exported them and build production facilities in them and,
⇒
The privatization of most of the industries in the former communist countries, as well as opening of their economies to the global competition.
b)
Development of technology The development of computing and
communication technologies has enabled increased flow of ideas and information across the borders of the countries, providing introduction of the consumers with the goods worldwide. Internet and networking have enabled smaller companies to compete globally, as a result of the rapid flow of information, regardless of the physical location of the seller or buyer. Also, allows international companies to hold corporate meetings among managers from headquarters and branches, without wasting unnecessary time for travel.
c)
International business climate
The development of communication and information technologies have contributed to the process of globalization, but also provided instruments that facilitated the processes of globalization. Newly emerging markets also recognize the economic benefits, technological development and growth opportunities that globalization provides.
d)
Development of markets
Information and communication technologies, rapid development of international tourism, widespread cultural exchange and improved living standards, in many developing countries have contributed to the emergence of a group of consumers in different countries and regions of the world with similar educational profiles, lifestyle, purchasing power, as well as, aspirations for high quality products. This scenario, in combination with the liberalization of international trade and the availability of global distribution channels, opens great opportunities for companies that want to offer their products to global markets. Large market potential exist outside of the domestic market, and is reason for the companies go out on the foreign markets, generate sales and have opportunities for profit that cannot be achieved at home.
e) Expenses The liberalization of trade and investment flows,
that emerged in the 80s of the last century, which inevitably moved forward, was a great motivation for globalization of the businesses. Trade liberalization, global consumer habits, rising development costs and the need for economies of scale, pressure from foreign competitors in the domestic market as well as the development of information and communication technologies, are considered as drivers of the globalization. Because of the need to introduce new products and investment in research, development and innovation, achieving economies of scale, reduce costs and access to cheaper raw materials; companies are forced to plan activities, taking into consideration the global market. Economies of scale and cost reduction are the main goal of every company’s management. That is why companies decide to locate production in countries where the cost of developing and producing are smaller.
f) Competition One of the reasons that the companies adopt
global strategies is the need of maintaining or gaining a competitive advantage in foreign markets and avoiding competition in the domestic market. Competition in international markets is huge and growing, with more multinational competitors who win markets worldwide. The companies improve their competitive position by opposing competitors in international markets or premature intrusion into the domestic market of the competitor in order to destabilize or to suppress its development.
As the globalization increases the speed and progresses rapidly, more opportunities are opening for the companies, to participate on the international markets. The managers develop and adapt strategies for internationalization in order to transform their organizations into globally competitive enterprises. Managers seek to coordinate the supply, production, marketing and other activities based on international activities. The organization of the company globally is a challenge and requires strategic positioning, organizational skills, a high degree of coordination and integration, attention to the needs of individual markets and the implementation of common processes.
The strategy, in an international context, is an organization plan for positive positioning, compared to the competitors. This plan lead the company to selected customers, markets, products and services in global markets, not just a particular international market. The strategy in an international context should help managers to formulate a strong international vision, allocation of resources, participation on the major markets, implementation of global partnerships and involvement in competitive activities opposing global rivals and establishment of activities that add additional
V
olum
e XV
Issu
e V
Versio
n I
Globa
l Jo
urna
l of H
uman
Soc
ial Sc
ienc
e
© 2015 Global Journals Inc. (US)
-
51
Year
2015
( E)
The Impact of Globalization on the Business

value on a global level (Cavusgil, Yeniyurt, & Townsend, 2004).
When the companies compete outside of their country, they face a number of challenges and pressures. These pressures and challenges to maintain competitiveness, require from the companies to cut costs, in order the consumers do not evaluate their products or services as too expensive. This leads to the need to locate production facilities in places where production costs are lower, and the development of high standardized products in most countries. In the context of the pressure to reduce costs, managers must strive to be ready to respond to local pressures to adapt products to local market requirements, where the company is active. This requires differentiation of their offer and strategies in different countries, in order to preserve the tastes and preferences of consumers, but also the differentiation of distribution channels, management of human resources, and government regulations. Because the strategies and tactics for differentiation of products and services in local markets create additional costs, they can also lead to increased costs for the company. These two pressures that enterprises face, resulting in four basic strategies that the companies use to compete in the global market. These strategies are: international, global, multi-domestic and transnational strategy (Dess, Lumpkin, & Taylor, 2004). The strategy that will be chosen by the company depends on the pressure faced by cost-cutting and the importance of adapting to local markets.
V. Conclusion
Today, the word international company is quite a common phenomenon, which reflects actual business transactions and large expanses between a number of people from different cultures and with different approaches. What unites them in the complex network of relationships is the need of development, rapid exchange of resources and tools and integrated cooperation, which should contribute to ensure cooperation and transfer of capital.
It can be concluded that today's decisions for crossing domestic borders and internationalization of the business is essential for serious growth and development of a business entity. To make a decision to invest outside of the own borders is a complex and comprehensive process. This process is achieved through several stages and approaches that contain a long-term comprehensive analysis and scanning newly elected investment location. Because every business investment represents economic-political and social interaction, during the decision making process, great attention should be paid on choosing stable political system, with tradition of trade market, functional institutions, good law system, which would be a guarantee against unstable environment and potential risks in the country.
To summarize, the decision making process is
time consuming because the analysis of all the factors and potential risks of certain market takes time and resources, but is necessary for making a good decision and return of the investment.
References Références Referencias
1.
Ansoff, H. I.: Implementing Strategic Management, PrenticeHall International, Englewood Cliffs, NJ., 1984.
2.
Ball, A. D., Wendell, H., McCulloch, Jr., Frantz, L. P., Geringer, J. M., Minor, S. M.: International Business – The Challenge of Global Competition, International Edition, McGraw-Hill, 2001.
3.
Bartels, L. F., Buckley P., Mariano G.: Multinational Enterprises’ Foreign Direct Investment Location Decisions within The Global Factory, UNIDO, Vienna, 2009.
4.
Cavusgil, T. S., Yeniyurt, S., Townsend, J.: “The Framework of a Global Company: A Conceptualization and Preliminary Validation”, Industrial Marketing Management 33, 2004.
5.
Cavusgil, T.,
Knight, G.,
Riesenberger, J.: International Business: Strategy, Management and the New Realities, Prentice Hall, 2008.
6.
Cullen, B. J., Parboteeah, K. P.: International Business, Strategy And The Multinational Company, Taylor & Francis, 2010.
7.
Daniels,
D.
J., Radebaugh H.
L., Sullivan P.
D.: International Business: environment and operations, Prentice Hall, 2007.
8.
Dess, G., Lumpkin, G.
T., Taylor, M.: Strategic Management: Creating Competitive Advantages, 2004.
9.
Hill, W. L. C.: Global business today, McGraw-Hill Irwin, 2008.
10.
Joshi, M. R.: International Business, Oxford University Press, 2009.
11.
Jovanovski T.: Megjunarodni Finansii, Euro-Mak Kompanii, Skopje, 2007.
V
olum
e XV
Issu
e V
Versio
n I
52
Globa
l Jo
urna
l of H
uman
Soc
ial Sc
ienc
e
© 2015 Global Journals Inc. (US)
-
Year
2015
( E)
The Impact of Globalization on the Business

Global Journals Inc. (US)
Guidelines Handbook 2015
www.GlobalJournals.org

© Copyright by Global Journals Inc.(US) | Guidelines Handbook
I
FELLOW OF ASSOCIATION OF RESEARCH SOCIETY IN HUMAN SCIENCE (FARSHS)Global Journals Incorporate (USA) is accredited by Open Association of Research Society (OARS), U.S.A and in turn, awards “FARSHS” title to individuals. The 'FARSHS' title is accorded to a selected professional after the approval of the Editor-in-Chief/Editorial Board Members/Dean.
FARSHS accrediting is an honor. It authenticates your research activities. After recognition as FARSHS, you can add 'FARSHS' title with your name as you use this recognition as additional suffix to your status. This will definitely enhance and add more value and repute to your name. You may use it on your professional Counseling Materials such as CV, Resume, and Visiting Card etc.
The following benefits can be availed by you only for next three years from the date of certification:
FARSHS designated members are entitled to avail a 40% discount while publishing their research papers (of a single author) with Global Journals Incorporation (USA), if the same is accepted by Editorial Board/Peer Reviewers. If you are a main author or co-author in case of multiple authors, you will be entitled to avail discount of 10%.
Once FARSHS title is accorded, the Fellow is authorized to organize a symposium/seminar/conference on behalf of Global Journal Incorporation (USA). The Fellow can also participate in conference/seminar/symposium organized by another institution as representative of Global Journal. In both the cases, it is mandatory for him to discuss with us and obtain our consent.
You may join as member of the Editorial Board of Global Journals Incorporation (USA) after successful completion of three years as Fellow and as Peer Reviewer. In addition, it is also desirable that you should organize seminar/symposium/conference at
We shall provide you intimation regarding launching of e-version of journal of your stream time to time.This may be utilized in your library for the enrichment of knowledge of your students as well as it can also be helpful for the concerned faculty members.
least once.
Fellows
The “FARSHS” is a dignified title which is accorded to a person’s name viz. Dr. John E. Hall, FARSS or William Walldroff, M.S., FARSHS.
Ph.D.,

II
II
The FARSHS can go thany suggestions so that proper amendment can take place to improve the same for the
rough standards of OARS. You can also play vital role if you have
benefit of entire research community.
As FARSHS, you will be given a renowned, secure and free professional email address with 100 GB of space e.g. [email protected]. This will include Webmail, Spam Assassin, Email Forwarders,Auto-Responders, Email Delivery Route tracing, etc.
The FARSHS will be eligible for a free application of standardization of their researches. Standardization of research will be subject to acceptability within stipulated norms as the next step after publishing in a journal. We shall depute a team of specialized research professionals who will render their services for elevating your researches to next higher level, which is worldwide open standardization.
The FARSHS member can apply for grading and certification of standards of their educational and Institutional Degrees to Open Association of Research, Society U.S.A.Once you are designated as FARSHS, you may send us a scanned copy of all of your credentials. OARS will verify, grade and certify them. This will be based on your academic records, quality of research papers published by you, and some more criteria. After certification of all your credentials by OARS, they will be published on your Fellow Profile link on website https://associationofresearch.org which will be helpful to upgrade the dignity.
The FARSHS members can avail the benefits of free research podcasting in Global Research Radio with their research documents. After publishing the work, (including published elsewhere worldwide with proper authorization) you can upload your research paper with your recorded voice or you can utilize
request.chargeable services of our professional RJs to record your paper in their voice on
The FARSHS member also entitled to get the benefits of free research podcasting of their research documents through video clips. We can also streamline your conference videos and display your slides/ online slides and online research video clips at reasonable charges, on request.
© Copyright by Global Journals Inc.(US)| Guidelines Handbook

The FARSHS is eligible to earn from sales proceeds of his/her researches/reference/review Books or literature, while publishing with Global Journals. The FARSHS can decide whether he/she would like to publish his/her research in a closed manner. In this case, whenever readers purchase that individual research paper for reading, maximum 60% of its profit earned as royalty by Global Journals, will
be credited to his/her bank account. The entire entitled amount will be credited to his/her bank account exceeding limit of minimum fixed balance. There is no minimum time limit for collection. The FARSS member can decide its price and we can help in making the right decision.
The FARSHS member is eligible to join as a paid peer reviewer at Global Journals Incorporation (USA) and can get remuneration of 15% of author fees, taken from the author of a respective paper. After reviewing 5 or more papers you can request to transfer the amount to your bank account.
MEMBER OF ASSOCIATION OF RESEARCH SOCIETY IN HUMAN SCIENCE (MARSHS)
The ' MARSHS ' title is accorded to a selected professional after the approval of the Editor-in-Chief / Editorial Board Members/Dean.
The “MARSHS” is a dignified ornament which is accorded to a person’s name viz. Dr. John E. Hall, Ph.D., MARSHS or William Walldroff, M.S., MARSHS.
MARSHS accrediting is an honor. It authenticates your research activities. Afterbecoming MARSHS, youcan add 'MARSHS' title with your name as you use this recognition as additional suffix to your status. This will definitely enhance and add more value and repute to your name. You may use it on your professional Counseling Materials such as CV, Resume, Visiting Card and Name Plate etc.
The following benefitscan be availed by you only for next three years from the date of certification.
MARSHS designated members are entitled to avail a 25% discount while publishing their research papers (of a single author) in Global Journals Inc., if the same is accepted by our Editorial Board and Peer Reviewers. If you are a main author or co-author of a group of authors, you will get discount of 10%.
© Copyright by Global Journals Inc.(US) | Guidelines Handbook
As MARSHS, you willbe given a renowned, secure and free professional email address with 30 GB of space e.g. [email protected]. This will include Webmail, Spam Assassin, Email Forwarders,Auto-Responders, Email Delivery Route tracing, etc.
III

We shall provide you intimation regarding launching of e-version of journal of your stream time to time.This may be utilized in your library for the enrichment of knowledge of your students as well as it can also be helpful for the concerned faculty members.
The MARSHS member can apply for approval, grading and certification of standards of their educational and Institutional Degrees to Open Association of Research, Society U.S.A.
Once you are designated as MARSHS, you may send us a scanned copy of all of your credentials. OARS will verify, grade and certify them. This will be based on your academic records, quality of research papers published by you, and some more criteria.
It is mandatory to read all terms and conditions carefully.
© Copyright by Global Journals Inc.(US)| Guidelines Handbook
IV

Auxiliary Memberships
Institutional Fellow of Open Association of Research Society (USA) - OARS (USA)Global Journals Incorporation (USA) is accredited by Open Association of Research Society, U.S.A (OARS) and in turn, affiliates research institutions as “Institutional Fellow of Open Association of Research Society” (IFOARS).The “FARSC” is a dignified title which is accorded to a person’s name viz. Dr. John E. Hall, Ph.D., FARSC or William Walldroff, M.S., FARSC.The IFOARS institution is entitled to form a Board comprised of one Chairperson and three to five board members preferably from different streams. The Board will be recognized as “Institutional Board of Open Association of Research Society”-(IBOARS).
The Institute will be entitled to following benefits:
The IBOARS can initially review research papers of their institute and recommend them to publish with respective journal of Global Journals. It can also review the papers of other institutions after obtaining our consent. The second review will be done by peer reviewer of Global Journals Incorporation (USA) The Board is at liberty to appoint a peer reviewer with the approval of chairperson after consulting us. The author fees of such paper may be waived off up to 40%.
The Global Journals Incorporation (USA) at its discretion can also refer double blind peer reviewed paper at their end to the board for the verification and to get recommendation for final stage of acceptance of publication.
The IBOARS can organize symposium/seminar/conference in their country on behalf of Global Journals Incorporation (USA)-OARS (USA). The terms and conditions can be discussed separately.
© Copyright by Global Journals Inc.(US) | Guidelines Handbook
The Board can also play vital role by exploring and giving valuable suggestions regarding the Standards of “Open Association of Research Society, U.S.A (OARS)” so that proper amendment can take place for the benefit of entire research community. We shall provide details of particular standard only on receipt of request from the Board.
The board members can also join us as Individual Fellow with 40% discount on total fees applicable to Individual Fellow. They will be entitled to avail all the benefits as declared. Please visit Individual Fellow-sub menu of GlobalJournals.org to have more relevant details.
V

We shall provide you intimation regarding launching of e-version of journal of your stream time to time. This may be utilized in your library for the enrichment of knowledge of your students as well as it can also be helpful for the concerned faculty members.
After nomination of your institution as “Institutional Fellow” and constantly functioning successfully for one year, we can consider giving recognition to your institute to function as Regional/Zonal office on our behalf.The board can also take up the additional allied activities for betterment after our consultation.
The following entitlements are applicable to individual Fellows:
Open Association of Research Society, U.S.A (OARS) By-laws states that an individual Fellow may use the designations as applicable, or the corresponding initials. The Credentials of individual Fellow and Associate designations signify that the individual has gained knowledge of the fundamental concepts. One is magnanimous and proficient in an expertise course covering the professional code of conduct, and follows recognized standards of practice.
Open Association of Research Society (US)/ Global Journals Incorporation (USA), as described in Corporate Statements, are educational, research publishing and professional membership organizations. Achieving our individual Fellow or Associate status is based mainly on meeting stated educational research requirements.
Disbursement of 40% Royalty earned through Global Journals : Researcher = 50%, Peer Reviewer = 37.50%, Institution = 12.50% E.g. Out of 40%, the 20% benefit should be passed on to researcher, 15 % benefit towards remuneration should be given to a reviewer and remaining 5% is to be retained by the institution.
We shall provide print version of 12 issues of any three journals [as per your requirement] out of our 38 journals worth $ 2376 USD.
© Copyright by Global Journals Inc.(US)| Guidelines Handbook
Other:
The individual Fellow and Associate designations accredited by Open Association of Research Society (US) credentials signify guarantees following achievements:
The professional accredited with Fellow honor, is entitled to various benefits viz. name, fame, honor, regular flow of income, secured bright future, social status etc.
VI

Note :
″
″
© Copyright by Global Journals Inc.(US) | Guidelines Handbook
In addition to above, if one is single author, then entitled to 40% discount on publishing research paper and can get 10%discount if one is co-author or main author among group of authors.
The Fellow can organize symposium/seminar/conference on behalf of Global Journals Incorporation (USA) and he/she can also attend the same organized by other institutes on behalf of Global Journals.
The Fellow can become member of Editorial Board Member after completing 3yrs. The Fellow can earn 60% of sales proceeds from the sale of reference/review
books/literature/publishing of research paper. Fellow can also join as paid peer reviewer and earn 15% remuneration of author charges and
can also get an opportunity to join as member of the Editorial Board of Global Journals Incorporation (USA)
• This individual has learned the basic methods of applying those concepts and techniques to common challenging situations. This individual has further demonstrated an in–depth understanding of the application of suitable techniques to a particular area of research practice.
In future, if the board feels the necessity to change any board member, the same can be done with the consent of the chairperson along with anyone board member without our approval.
In case, the chairperson needs to be replaced then consent of 2/3rd board members are required and they are also required to jointly pass the resolution copy of which should be sent to us. In such case, it will be compulsory to obtain our approval before replacement.
In case of “Difference of Opinion [if any]” among the Board members, our decision will be final and binding to everyone.
VII

Process of submission of Research Paper
The Area or field of specialization may or may not be of any category as mentioned in ‘Scope of Journal’ menu of the GlobalJournals.org website. There are 37 Research Journal categorized with Six parental Journals GJCST, GJMR, GJRE, GJMBR, GJSFR, GJHSS. For Authors should prefer the mentioned categories. There are three widely used systems UDC, DDC and LCC. The details are available as ‘Knowledge Abstract’ at Home page. The major advantage of this coding is that, the research work will be exposed to and shared with all over the world as we are being abstracted and indexed worldwide.
The paper should be in proper format. The format can be downloaded from first page of ‘Author Guideline’ Menu. The Author is expected to follow the general rules as mentioned in this menu. The paper should be written in MS-Word Format (*.DOC,*.DOCX).
The Author can submit the paper either online or offline. The authors should prefer online submission.Online Submission: There are three ways to submit your paper:
(A) (I) First, register yourself using top right corner of Home page then Login. If you are already registered, then login using your username and password.
(II) Choose corresponding Journal.
(III) Click ‘Submit Manuscript’. Fill required information and Upload the paper.
(B) If you are using Internet Explorer, then Direct Submission through Homepage is also available.
(C) If these two are not conveninet , and then email the paper directly to [email protected].
Offline Submission: Author can send the typed form of paper by Post. However, online submission should be preferred.
© Copyright by Global Journals Inc.(US)| Guidelines Handbook
VIII

Preferred Author Guidelines
MANUSCRIPT STYLE INSTRUCTION (Must be strictly followed)
Page Size: 8.27" X 11'"
• Left Margin: 0.65 • Right Margin: 0.65 • Top Margin: 0.75 • Bottom Margin: 0.75 • Font type of all text should be Swis 721 Lt BT. • Paper Title should be of Font Size 24 with one Column section. • Author Name in Font Size of 11 with one column as of Title. • Abstract Font size of 9 Bold, “Abstract” word in Italic Bold. • Main Text: Font size 10 with justified two columns section • Two Column with Equal Column with of 3.38 and Gaping of .2 • First Character must be three lines Drop capped. • Paragraph before Spacing of 1 pt and After of 0 pt. • Line Spacing of 1 pt • Large Images must be in One Column • Numbering of First Main Headings (Heading 1) must be in Roman Letters, Capital Letter, and Font Size of 10. • Numbering of Second Main Headings (Heading 2) must be in Alphabets, Italic, and Font Size of 10.
You can use your own standard format also. Author Guidelines:
1. General,
2. Ethical Guidelines,
3. Submission of Manuscripts,
4. Manuscript’s Category,
5. Structure and Format of Manuscript,
6. After Acceptance.
1. GENERAL
Before submitting your research paper, one is advised to go through the details as mentioned in following heads. It will be beneficial, while peer reviewer justify your paper for publication.
Scope
The Global Journals Inc. (US) welcome the submission of original paper, review paper, survey article relevant to the all the streams of Philosophy and knowledge. The Global Journals Inc. (US) is parental platform for Global Journal of Computer Science and Technology, Researches in Engineering, Medical Research, Science Frontier Research, Human Social Science, Management, and Business organization. The choice of specific field can be done otherwise as following in Abstracting and Indexing Page on this Website. As the all Global
© Copyright by Global Journals Inc.(US) | Guidelines Handbook
IX

Journals Inc. (US) are being abstracted and indexed (in process) by most of the reputed organizations. Topics of only narrow interest will not be accepted unless they have wider potential or consequences.
2. ETHICAL GUIDELINES
Authors should follow the ethical guidelines as mentioned below for publication of research paper and research activities.
Papers are accepted on strict understanding that the material in whole or in part has not been, nor is being, considered for publication elsewhere. If the paper once accepted by Global Journals Inc. (US) and Editorial Board, will become the copyright of the Global Journals Inc. (US).
Authorship: The authors and coauthors should have active contribution to conception design, analysis and interpretation of findings. They should critically review the contents and drafting of the paper. All should approve the final version of the paper before submission
The Global Journals Inc. (US) follows the definition of authorship set up by the Global Academy of Research and Development. According to the Global Academy of R&D authorship, criteria must be based on:
1) Substantial contributions to conception and acquisition of data, analysis and interpretation of the findings.
2) Drafting the paper and revising it critically regarding important academic content.
3) Final approval of the version of the paper to be published.
All authors should have been credited according to their appropriate contribution in research activity and preparing paper. Contributors who do not match the criteria as authors may be mentioned under Acknowledgement.
Acknowledgements: Contributors to the research other than authors credited should be mentioned under acknowledgement. The specifications of the source of funding for the research if appropriate can be included. Suppliers of resources may be mentioned along with address.
Appeal of Decision: The Editorial Board’s decision on publication of the paper is final and cannot be appealed elsewhere.
Permissions: It is the author's responsibility to have prior permission if all or parts of earlier published illustrations are used in this paper.
Please mention proper reference and appropriate acknowledgements wherever expected.
If all or parts of previously published illustrations are used, permission must be taken from the copyright holder concerned. It is the author's responsibility to take these in writing.
Approval for reproduction/modification of any information (including figures and tables) published elsewhere must be obtained by the authors/copyright holders before submission of the manuscript. Contributors (Authors) are responsible for any copyright fee involved.
3. SUBMISSION OF MANUSCRIPTS
Manuscripts should be uploaded via this online submission page. The online submission is most efficient method for submission of papers, as it enables rapid distribution of manuscripts and consequently speeds up the review procedure. It also enables authors to know the status of their own manuscripts by emailing us. Complete instructions for submitting a paper is available below.
Manuscript submission is a systematic procedure and little preparation is required beyond having all parts of your manuscript in a given format and a computer with an Internet connection and a Web browser. Full help and instructions are provided on-screen. As an author, you will be prompted for login and manuscript details as Field of Paper and then to upload your manuscript file(s) according to the instructions.
© Copyright by Global Journals Inc.(US)| Guidelines Handbook
X

To avoid postal delays, all transaction is preferred by e-mail. A finished manuscript submission is confirmed by e-mail immediately and your paper enters the editorial process with no postal delays. When a conclusion is made about the publication of your paper by our Editorial Board, revisions can be submitted online with the same procedure, with an occasion to view and respond to all comments.
Complete support for both authors and co-author is provided.
4. MANUSCRIPT’S CATEGORY
Based on potential and nature, the manuscript can be categorized under the following heads:
Original research paper: Such papers are reports of high-level significant original research work.
Review papers: These are concise, significant but helpful and decisive topics for young researchers.
Research articles: These are handled with small investigation and applications
Research letters: The letters are small and concise comments on previously published matters.
5.STRUCTURE AND FORMAT OF MANUSCRIPT
The recommended size of original research paper is less than seven thousand words, review papers fewer than seven thousands words also.Preparation of research paper or how to write research paper, are major hurdle, while writing manuscript. The research articles and research letters should be fewer than three thousand words, the structure original research paper; sometime review paper should be as follows:
Papers: These are reports of significant research (typically less than 7000 words equivalent, including tables, figures, references), and comprise:
(a)Title should be relevant and commensurate with the theme of the paper.
(b) A brief Summary, “Abstract” (less than 150 words) containing the major results and conclusions.
(c) Up to ten keywords, that precisely identifies the paper's subject, purpose, and focus.
(d) An Introduction, giving necessary background excluding subheadings; objectives must be clearly declared.
(e) Resources and techniques with sufficient complete experimental details (wherever possible by reference) to permit repetition; sources of information must be given and numerical methods must be specified by reference, unless non-standard.
(f) Results should be presented concisely, by well-designed tables and/or figures; the same data may not be used in both; suitable statistical data should be given. All data must be obtained with attention to numerical detail in the planning stage. As reproduced design has been recognized to be important to experiments for a considerable time, the Editor has decided that any paper that appears not to have adequate numerical treatments of the data will be returned un-refereed;
(g) Discussion should cover the implications and consequences, not just recapitulating the results; conclusions should be summarizing.
(h) Brief Acknowledgements.
(i) References in the proper form.
Authors should very cautiously consider the preparation of papers to ensure that they communicate efficiently. Papers are much more likely to be accepted, if they are cautiously designed and laid out, contain few or no errors, are summarizing, and be conventional to the approach and instructions. They will in addition, be published with much less delays than those that require much technical and editorial correction.
© Copyright by Global Journals Inc.(US) | Guidelines Handbook
XI

The Editorial Board reserves the right to make literary corrections and to make suggestions to improve briefness.
It is vital, that authors take care in submitting a manuscript that is written in simple language and adheres to published guidelines.
Format
Language: The language of publication is UK English. Authors, for whom English is a second language, must have their manuscript efficiently edited by an English-speaking person before submission to make sure that, the English is of high excellence. It is preferable, that manuscripts should be professionally edited.
Standard Usage, Abbreviations, and Units: Spelling and hyphenation should be conventional to The Concise Oxford English Dictionary. Statistics and measurements should at all times be given in figures, e.g. 16 min, except for when the number begins a sentence. When the number does not refer to a unit of measurement it should be spelt in full unless, it is 160 or greater.
Abbreviations supposed to be used carefully. The abbreviated name or expression is supposed to be cited in full at first usage, followed by the conventional abbreviation in parentheses.
Metric SI units are supposed to generally be used excluding where they conflict with current practice or are confusing. For illustration, 1.4 l rather than 1.4 × 10⁻³ m3, or 4 mm somewhat than 4 × 10⁻³ m. Chemical formula and solutions must identify the form used, e.g. anhydrous or hydrated, and the concentration must be in clearly defined units. Common species names should be followed by underlines at the first mention. For following use the generic name should be constricted to a single letter, if it is clear.
Structure
All manuscripts submitted to Global Journals Inc. (US), ought to include:
Title: The title page must carry an instructive title that reflects the content, a running title (less than 45 characters together with spaces), names of the authors and co-authors, and the place(s) wherever the work was carried out. The full postal address in addition with the e-mail address of related author must be given. Up to eleven keywords or very brief phrases have to be given to help data retrieval, mining and indexing.
Abstract, used in Original Papers and Reviews:
Optimizing Abstract for Search Engines
Many researchers searching for information online will use search engines such as Google, Yahoo or similar. By optimizing your paper for search engines, you will amplify the chance of someone finding it. This in turn will make it more likely to be viewed and/or cited in a further work. Global Journals Inc. (US) have compiled these guidelines to facilitate you to maximize the web-friendliness of the most public part of your paper.
Key Words
A major linchpin in research work for the writing research paper is the keyword search, which one will employ to find both library and Internet resources.
One must be persistent and creative in using keywords. An effective keyword search requires a strategy and planning a list of possible keywords and phrases to try.
Search engines for most searches, use Boolean searching, which is somewhat different from Internet searches. The Boolean search uses "operators," words (and, or, not, and near) that enable you to expand or narrow your affords. Tips for research paper while preparing research paper are very helpful guideline of research paper.
Choice of key words is first tool of tips to write research paper. Research paper writing is an art.A few tips for deciding as strategically as possible about keyword search:
© Copyright by Global Journals Inc.(US)| Guidelines Handbook
XII

• One should start brainstorming lists of possible keywords before even begin searching. Think about the most important concepts related to research work. Ask, "What words would a source have to include to be truly valuable in research paper?" Then consider synonyms for the important words.
• It may take the discovery of only one relevant paper to let steer in the right keyword direction because in most databases, the keywords under which a research paper is abstracted are listed with the paper.
• One should avoid outdated words.
Keywords are the key that opens a door to research work sources. Keyword searching is an art in which researcher's skills are bound to improve with experience and time.
Numerical Methods: Numerical methods used should be clear and, where appropriate, supported by references.
Acknowledgements: Please make these as concise as possible.
References
References follow the Harvard scheme of referencing. References in the text should cite the authors' names followed by the time of their publication, unless there are three or more authors when simply the first author's name is quoted followed by et al. unpublished work has to only be cited where necessary, and only in the text. Copies of references in press in other journals have to be supplied with submitted typescripts. It is necessary that all citations and references be carefully checked before submission, as mistakes or omissions will cause delays.
References to information on the World Wide Web can be given, but only if the information is available without charge to readers on an official site. Wikipedia and Similar websites are not allowed where anyone can change the information. Authors will be asked to make available electronic copies of the cited information for inclusion on the Global Journals Inc. (US) homepage at the judgment of the Editorial Board.
The Editorial Board and Global Journals Inc. (US) recommend that, citation of online-published papers and other material should be done via a DOI (digital object identifier). If an author cites anything, which does not have a DOI, they run the risk of the cited material not being noticeable.
The Editorial Board and Global Journals Inc. (US) recommend the use of a tool such as Reference Manager for reference management and formatting.
Tables, Figures and Figure Legends
Tables: Tables should be few in number, cautiously designed, uncrowned, and include only essential data. Each must have an Arabic number, e.g. Table 4, a self-explanatory caption and be on a separate sheet. Vertical lines should not be used.
Figures: Figures are supposed to be submitted as separate files. Always take in a citation in the text for each figure using Arabic numbers, e.g. Fig. 4. Artwork must be submitted online in electronic form by e-mailing them.
Preparation of Electronic Figures for Publication
Even though low quality images are sufficient for review purposes, print publication requires high quality images to prevent the final product being blurred or fuzzy. Submit (or e-mail) EPS (line art) or TIFF (halftone/photographs) files only. MS PowerPoint and Word Graphics are unsuitable for printed pictures. Do not use pixel-oriented software. Scans (TIFF only) should have a resolution of at least 350 dpi (halftone) or 700 to 1100 dpi (line drawings) in relation to the imitation size. Please give the data for figures in black and white or submit a Color Work Agreement Form. EPS files must be saved with fonts embedded (and with a TIFF preview, if possible).
For scanned images, the scanning resolution (at final image size) ought to be as follows to ensure good reproduction: line art: >650 dpi; halftones (including gel photographs) : >350 dpi; figures containing both halftone and line images: >650 dpi.
© Copyright by Global Journals Inc.(US) | Guidelines Handbook
XIII

Color Charges: It is the rule of the Global Journals Inc. (US) for authors to pay the full cost for the reproduction of their color artwork. Hence, please note that, if there is color artwork in your manuscript when it is accepted for publication, we would require you to complete and return a color work agreement form before your paper can be published.
Figure Legends: Self-explanatory legends of all figures should be incorporated separately under the heading 'Legends to Figures'. In the full-text online edition of the journal, figure legends may possibly be truncated in abbreviated links to the full screen version. Therefore, the first 100 characters of any legend should notify the reader, about the key aspects of the figure.
6. AFTER ACCEPTANCE
Upon approval of a paper for publication, the manuscript will be forwarded to the dean, who is responsible for the publication of the Global Journals Inc. (US).
6.1 Proof Corrections
The corresponding author will receive an e-mail alert containing a link to a website or will be attached. A working e-mail address must therefore be provided for the related author.
Acrobat Reader will be required in order to read this file. This software can be downloaded
(Free of charge) from the following website:
www.adobe.com/products/acrobat/readstep2.html. This will facilitate the file to be opened, read on screen, and printed out in order for any corrections to be added. Further instructions will be sent with the proof.
Proofs must be returned to the dean at [email protected] within three days of receipt.
As changes to proofs are costly, we inquire that you only correct typesetting errors. All illustrations are retained by the publisher. Please note that the authors are responsible for all statements made in their work, including changes made by the copy editor.
6.2 Early View of Global Journals Inc. (US) (Publication Prior to Print)
The Global Journals Inc. (US) are enclosed by our publishing's Early View service. Early View articles are complete full-text articles sent in advance of their publication. Early View articles are absolute and final. They have been completely reviewed, revised and edited for publication, and the authors' final corrections have been incorporated. Because they are in final form, no changes can be made after sending them. The nature of Early View articles means that they do not yet have volume, issue or page numbers, so Early View articles cannot be cited in the conventional way.
6.3 Author Services
Online production tracking is available for your article through Author Services. Author Services enables authors to track their article - once it has been accepted - through the production process to publication online and in print. Authors can check the status of their articles online and choose to receive automated e-mails at key stages of production. The authors will receive an e-mail with a unique link that enables them to register and have their article automatically added to the system. Please ensure that a complete e-mail address is provided when submitting the manuscript.
6.4 Author Material Archive Policy
Please note that if not specifically requested, publisher will dispose off hardcopy & electronic information submitted, after the two months of publication. If you require the return of any information submitted, please inform the Editorial Board or dean as soon as possible.
6.5 Offprint and Extra Copies
A PDF offprint of the online-published article will be provided free of charge to the related author, and may be distributed according to the Publisher's terms and conditions. Additional paper offprint may be ordered by emailing us at: [email protected] .
© Copyright by Global Journals Inc.(US)| Guidelines Handbook
XIV

2. Evaluators are human: First thing to remember that evaluators are also human being. They are not only meant for rejecting a paper. They are here to evaluate your paper. So, present your Best.
3. Think Like Evaluators: If you are in a confusion or getting demotivated that your paper will be accepted by evaluators or not, then think and try to evaluate your paper like an Evaluator. Try to understand that what an evaluator wants in your research paper and automatically you will have your answer.
4. Make blueprints of paper: The outline is the plan or framework that will help you to arrange your thoughts. It will make your paper logical. But remember that all points of your outline must be related to the topic you have chosen.
5. Ask your Guides: If you are having any difficulty in your research, then do not hesitate to share your difficulty to your guide (if you have any). They will surely help you out and resolve your doubts. If you can't clarify what exactly you require for your work then ask the supervisor to help you with the alternative. He might also provide you the list of essential readings.
6. Use of computer is recommended: As you are doing research in the field of Computer Science, then this point is quite obvious.
7. Use right software: Always use good quality software packages. If you are not capable to judge good software then you can lose quality of your paper unknowingly. There are various software programs available to help you, which you can get through Internet.
8. Use the Internet for help: An excellent start for your paper can be by using the Google. It is an excellent search engine, where you can have your doubts resolved. You may also read some answers for the frequent question how to write my research paper or find model research paper. From the internet library you can download books. If you have all required books make important reading selecting and analyzing the specified information. Then put together research paper sketch out.
9. Use and get big pictures: Always use encyclopedias, Wikipedia to get pictures so that you can go into the depth.
10. Bookmarks are useful: When you read any book or magazine, you generally use bookmarks, right! It is a good habit, which helps to not to lose your continuity. You should always use bookmarks while searching on Internet also, which will make your search easier.
Before start writing a good quality Computer Science Research Paper, let us first understand what is Computer Science Research Paper? So, Computer Science Research Paper is the paper which is written by professionals or scientists who are associated to Computer Science and Information Technology, or doing research study in these areas. If you are novel to this field then you can consult about
this field
from your supervisor or guide.
TECHNIQUES FOR WRITING A GOOD QUALITY RESEARCH PAPER:
1. Choosing the topic: In most cases, the topic is searched by the interest of author but it can be also suggested by the guides. You can
have several topics and then you can judge that in which topic or subject you are finding yourself most comfortable. This can be done by
asking several questions to yourself, like Will I be able to carry our search in this area? Will I find all necessary recourses to accomplish the search? Will I be able to find all information in this field area? If the answer of these types of questions will be "Yes" then you can choose that topic. In most of the cases, you may have to conduct the surveys and have to visit several places because this field is related to Computer Science and Information Technology. Also, you may have to do a lot of work to find all rise and falls regarding the various data of that subject. Sometimes, detailed information plays a vital role, instead of short information.
11. Revise what you wrote: When you write anything, always read it, summarize it and then finalize it.
© Copyright by Global Journals Inc.(US) | Guidelines Handbook
XV

16. Use proper verb tense: Use proper verb tenses in your paper. Use past tense, to present those events that happened. Use present tense to indicate events that are going on. Use future tense to indicate future happening events. Use of improper and wrong tenses will confuse the evaluator. Avoid the sentences that are incomplete.
17. Never use online paper: If you are getting any paper on Internet, then never use it as your research paper because it might be possible that evaluator has already seen it or maybe it is outdated version.
18. Pick a good study spot: To do your research studies always try to pick a spot, which is quiet. Every spot is not for studies. Spot that suits you choose it and proceed further.
19. Know what you know: Always try to know, what you know by making objectives. Else, you will be confused and cannot achieve your target.
20. Use good quality grammar: Always use a good quality grammar and use words that will throw positive impact on evaluator. Use of good quality grammar does not mean to use tough words, that for each word the evaluator has to go through dictionary. Do not start sentence with a conjunction. Do not fragment sentences. Eliminate one-word sentences. Ignore passive voice. Do not ever use a big word when a diminutive one would suffice. Verbs have to be in agreement with their subjects. Prepositions are not expressions to finish sentences with. It is incorrect to ever divide an infinitive. Avoid clichés like the disease. Also, always shun irritating alliteration. Use language that is simple and straight forward. put together a neat summary.
21. Arrangement of information: Each section of the main body should start with an opening sentence and there should be a changeover at the end of the section. Give only valid and powerful arguments to your topic. You may also maintain your arguments with records.
22. Never start in last minute: Always start at right time and give enough time to research work. Leaving everything to the last minute will degrade your paper and spoil your work.
23. Multitasking in research is not good: Doing several things at the same time proves bad habit in case of research activity. Research is an area, where everything has a particular time slot. Divide your research work in parts and do particular part in particular time slot.
24. Never copy others' work: Never copy others' work and give it your name because if evaluator has seen it anywhere you will be in trouble.
25. Take proper rest and food: No matter how many hours you spend for your research activity, if you are not taking care of your health then all your efforts will be in vain. For a quality research, study is must, and this can be done by taking proper rest and food.
26. Go for seminars: Attend seminars if the topic is relevant to your research area. Utilize all your resources.
12. Make all efforts: Make all efforts to mention what you are going to write in your paper. That means always have a good start. Try to mention everything in introduction, that what is the need of a particular research paper. Polish your work by good skill of writing and always give an evaluator, what he wants.
13. Have backups: When you are going to do any important thing like making research paper, you should always have backup copies of it either in your computer or in paper. This will help you to not to lose any of your important.
14. Produce good diagrams of your own: Always try to include good charts or diagrams in your paper to improve quality. Using several and unnecessary diagrams will degrade the quality of your paper by creating "hotchpotch." So always, try to make and include those diagrams, which are made by your own to improve readability and understandability of your paper.
15. Use of direct quotes: When you do research relevant to literature, history or current affairs then use of quotes become essential but if study is relevant to science then use of quotes is not preferable.
© Copyright by Global Journals Inc.(US)| Guidelines Handbook
XVI

sufficient. Use words properly, regardless of how others use them. Remove quotations. Puns are for kids, not grunt readers. Amplification is a billion times of inferior quality than sarcasm.
32. Never oversimplify everything: To add material in your research paper, never go for oversimplification. This will definitely irritate the evaluator. Be more or less specific. Also too, by no means, ever use rhythmic redundancies. Contractions aren't essential and shouldn't be there used. Comparisons are as terrible as clichés. Give up ampersands and abbreviations, and so on. Remove commas, that are, not necessary. Parenthetical words however should be together with this in commas. Understatement is all the time the complete best way to put onward earth-shaking thoughts. Give a detailed literary review.
33. Report concluded results: Use concluded results. From raw data, filter the results and then conclude your studies based on measurements and observations taken. Significant figures and appropriate number of decimal places should be used. Parenthetical
remarks are prohibitive. Proofread carefully at final stage. In the end give outline to your arguments. Spot out perspectives of further study of this subject. Justify your conclusion by at the bottom of them with sufficient justifications and examples.
34. After conclusion: Once you have concluded your research, the next most important step is to present your findings. Presentation is extremely important as it is the definite medium though which your research is going to be in print to the rest of the crowd. Care should be taken to categorize your thoughts well and present them in a logical and neat manner. A good quality research paper format is essential because it serves to highlight your research paper and bring to light all necessary aspects in your research.
Key points to remember:
Submit all work in its final form. Write your paper in the form, which is presented in the guidelines using the template. Please note the criterion for grading the final paper by peer-reviewers.
Final Points:
A purpose of organizing a research paper is to let people to interpret your effort selectively. The journal requires the following sections, submitted in the order listed, each section to start on a new page.
The introduction will be compiled from reference matter and will reflect the design processes or outline of basis that direct you to make study. As you will carry out the process of study, the method and process section will be constructed as like that. The result segment will show related statistics in nearly sequential order and will direct the reviewers next to the similar intellectual paths throughout the data that you took to carry out your study. The discussion section will provide understanding of the data and projections as to the implication of the results. The use of good quality references all through the paper will give the effort trustworthiness by representing an alertness of prior workings.
27. Refresh your mind after intervals: Try to give rest to your mind by listening to soft music or by sleeping in intervals. This will also improve your memory.
28. Make colleagues: Always try to make colleagues. No matter how sharper or intelligent you are, if you make colleagues you can have several ideas, which will be helpful for your research.
Think technically: Always think technically. If anything happens, then search its reasons, its benefits, and demerits.
30. Think and then print: When you will go to print your paper, notice that tables are not be split, headings are not detached from their descriptions, and page sequence is maintained.
31. Adding unnecessary information: Do not add unnecessary information, like, I have used MS Excel to draw graph. Do not add irrelevant and inappropriate material. These all will create superfluous. Foreign terminology and phrases are not apropos. One should NEVER take a broad view. Analogy in script is like feathers on a snake. Not at all use a large word when a very small one would be
29.
© Copyright by Global Journals Inc.(US) | Guidelines Handbook
XVII

Separating a table/chart or figure - impound each figure/table to a single page Submitting a manuscript with pages out of sequence
In every sections of your document
· Use standard writing style including articles ("a", "the," etc.)
· Keep on paying attention on the research topic of the paper
· Use paragraphs to split each significant point (excluding for the abstract)
· Align the primary line of each section
· Present your points in sound order
· Use present tense to report well accepted
· Use past tense to describe specific results
· Shun familiar wording, don't address the reviewer directly, and don't use slang, slang language, or superlatives
· Shun use of extra pictures - include only those figures essential to presenting results
Title Page:
Choose a revealing title. It should be short. It should not have non-standard acronyms or abbreviations. It should not exceed two printed lines. It should include the name(s) and address (es) of all authors.
Writing a research paper is not an easy job no matter how trouble-free the actual research or concept. Practice, excellent preparation, and controlled record keeping are the only means to make straightforward the progression.
General style:
Specific editorial column necessities for compliance of a manuscript will always take over from directions in these general guidelines.
To make a paper clear
· Adhere to recommended page limits
Mistakes to evade
Insertion a title at the foot of a page with the subsequent text on the next page
© Copyright by Global Journals Inc.(US)| Guidelines Handbook
XVIII

shortening the outcome. Sum up the study, with the subsequent elements in any summary. Try to maintain the initial two items to no more than one ruling each.
Reason of the study - theory, overall issue, purpose Fundamental goal To the point depiction of the research Consequences, including definite statistics - if the consequences are quantitative in nature, account quantitative data; results of any numerical analysis should be reported Significant conclusions or questions that track from the research(es)
Approach:
Single section, and succinct
As a outline of job done, it is always written in past tense
A conceptual should situate on its own, and not submit to any other part of the paper such as a form or table Center on shortening results - bound background information to a verdict or two, if completely necessary What you account in an conceptual must be regular with what you reported in the manuscript Exact spelling, clearness of sentences and phrases, and appropriate reporting of quantities (proper units, important statistics) are just as significant in an abstract as they are anywhere else
Introduction:
The Introduction should "introduce" the manuscript. The reviewer should be presented with sufficient background information to be capable to comprehend and calculate the purpose of your study without having to submit to other works. The basis for the study should be offered. Give most important references but shun difficult to make a comprehensive appraisal of the topic. In the introduction, describe the problem visibly. If the problem is not acknowledged in a logical, reasonable way, the reviewer will have no attention in your result. Speak in common terms about techniques used to explain the problem, if needed, but do not present any particulars about the protocols here. Following approach can create a valuable beginning:
Explain the value (significance) of the study Shield the model - why did you employ this particular system or method? What is its compensation? You strength remark on its appropriateness from a abstract point of vision as well as point out sensible reasons for using it. Present a justification. Status your particular theory (es) or aim(s), and describe the logic that led you to choose them. Very for a short time explain the tentative propose and how it skilled the declared objectives.
Approach:
Use past tense except for when referring to recognized facts. After all, the manuscript will be submitted after the entire job is done. Sort out your thoughts; manufacture one key point with every section. If you make the four points listed above, you will need a
least of four paragraphs.
Abstract:
The summary should be two hundred words or less. It should briefly and clearly explain the key findings reported in the manuscript--must have precise statistics. It should not have abnormal acronyms or abbreviations. It should be logical in itself. Shun citing references at this point.
An abstract is a brief distinct paragraph summary of finished work or work in development. In a minute or less a reviewer can be taught the foundation behind the study, common approach to the problem, relevant results, and significant conclusions or new questions.
Write your summary when your paper is completed because how can you write the summary of anything which is not yet written? Wealth of terminology is very essential in abstract. Yet, use comprehensive sentences and do not let go readability for briefness. You can maintain it succinct by phrasing sentences so that they provide more than lone rationale. The author can at this moment go straight to
© Copyright by Global Journals Inc.(US) | Guidelines Handbook
XIX

principle while stating the situation. The purpose is to text all particular resources and broad procedures, so that another person may use some or all of the methods in one more study or referee the scientific value of your work. It is not to be a step by step report of the whole thing you did, nor is a methods section a set of orders.
Materials:
Explain materials individually only if the study is so complex that it saves liberty this way. Embrace particular materials, and any tools or provisions that are not frequently found in laboratories. Do not take in frequently found. If use of a definite type of tools. Materials may be reported in a part section or else they may be recognized along with your measures.
Methods:
Report the method (not particulars of each process that engaged the same methodology) Describe the method entirely
To be succinct, present methods under headings dedicated to specific dealings or groups of measures Simplify - details how procedures were completed not how they were exclusively performed on a particular day. If well known procedures were used, account the procedure by name, possibly with reference, and that's all.
Approach:
It is embarrassed or not possible to use vigorous voice when documenting methods with no using first person, which would focus the reviewer's interest on the researcher rather than the job. As a result when script up the methods most authors use third person passive voice. Use standard style in this and in every other part of the paper - avoid familiar lists, and use full sentences.
What to keep away from
Resources and methods are not a set of information. Skip all descriptive information and surroundings - save it for the argument. Leave out information that is immaterial to a third party.
Results:
The principle of a results segment is to present and demonstrate your conclusion. Create this part a entirely objective details of the outcome, and save all understanding for the discussion.
The page length of this segment is set by the sum and types of data to be reported. Carry on to be to the point, by means of statistics and tables, if suitable, to present consequences most efficiently.You must obviously differentiate material that would usually be incorporated in a study editorial from any unprocessed data or additional appendix matter that would not be available. In fact, such matter should not be submitted at all except requested by the instructor.
Present surroundings information only as desirable in order hold up a situation. The reviewer does not desire to read the whole thing you know about a topic. Shape the theory/purpose specifically - do not take a broad view. As always, give awareness to spelling, simplicity and correctness of sentences and phrases.
Procedures (Methods and Materials):
This part is supposed to be the easiest to carve if you have good skills. A sound written Procedures segment allows a capable scientist to replacement your results. Present precise information about your supplies. The suppliers and clarity of reagents can be helpful bits of information. Present methods in sequential order but linked methodologies can be grouped as a segment. Be concise when relating the protocols. Attempt for the least amount of information that would permit another capable scientist to spare your outcome but becautious that vital information is integrated. The use of subheadings is suggested and ought to be synchronized with the results section. When a technique is used that has been well described in another object, mention the specific item describing a way but draw the basic
© Copyright by Global Journals Inc.(US)| Guidelines Handbook
XX

Do not present the similar data more than once. Manuscript should complement any figures or tables, not duplicate the identical information. Never confuse figures with tables - there is a difference.
Approach As forever, use past tense when you submit to your results, and put the whole thing in a reasonable order.Put figures and tables, appropriately numbered, in order at the end of the report If you desire, you may place your figures and tables properly within the text of your results part.
Figures and tables If you put figures and tables at the end of the details, make certain that they are visibly distinguished from any attach appendix materials, such as raw facts Despite of position, each figure must be numbered one after the other and complete with subtitle In spite of position, each table must be titled, numbered one after the other and complete with heading All figure and table must be adequately complete that it could situate on its own, divide from text
Discussion:
The Discussion is expected the trickiest segment to write and describe. A lot of papers submitted for journal are discarded based onproblems with the Discussion. There is no head of state for how long a argument should be. Position your understanding of the outcomevisibly to lead the reviewer through your conclusions, and then finish the paper with a summing up of the implication of the study. Thepurpose here is to offer an understanding of your results and hold up for all of your conclusions, using facts from your research andgenerally accepted information, if suitable. The implication of result should be visibly described. Infer your data in the conversation in suitable depth. This means that when you clarify an observable fact you must explain mechanismsthat may account for the observation. If your results vary from your prospect, make clear why that may have happened. If your resultsagree, then explain the theory that the proof supported. It is never suitable to just state that the data approved with prospect, and let itdrop at that.
Make a decision if each premise is supported, discarded, or if you cannot make a conclusion with assurance. Do not just dismissa study or part of a study as "uncertain." Research papers are not acknowledged if the work is imperfect. Draw what conclusions you can based upon the results thatyou have, and take care of the study as a finished work You may propose future guidelines, such as how the experiment might be personalized to accomplish a new idea. Give details all of your remarks as much as possible, focus on mechanisms. Make a decision if the tentative design sufficiently addressed the theory, and whether or not it was correctly restricted. Try to present substitute explanations if sensible alternatives be present. One research will not counter an overall question, so maintain the large picture in mind, where do you go next? The beststudies unlock new avenues of study. What questions remain? Recommendations for detailed papers will offer supplementary suggestions.
Approach:
When you refer to information, differentiate data generated by your own studies from available information Submit to work done by specific persons (including you) in past tense. Submit to generally acknowledged facts and main beliefs in present tense.
Content
Sum up your conclusion in text and demonstrate them, if suitable, with figures and tables. In manuscript, explain each of your consequences, point the reader to remarks that are most appropriate. Present a background, such as by describing the question that was addressed by creation an exacting study. Explain results of control experiments and comprise remarks that are not accessible in a prescribed figure or table, if appropriate. Examine your data, then prepare the analyzed (transformed) data in the form of a figure (graph), table, or in manuscript form.
What to stay away from Do not discuss or infer your outcome, report surroundings information, or try to explain anything. Not at all, take in raw data or intermediate calculations in a research manuscript.
© Copyright by Global Journals Inc.(US) | Guidelines Handbook
XXI

Do not give permission to anyone else to "PROOFREAD" your manuscript.
Methods to avoid Plagiarism is applied by us on every paper, if found guilty, you will be blacklisted by all of our collaboratedresearch groups, your institution will be informed for this and strict legal actions will be taken immediately.) To guard yourself and others from possible illegal use please do not permit anyone right to use to your paper and files.
The major constraint is that you must independently make all content, tables, graphs, and facts that are offered in the paper.You must write each part of the paper wholly on your own. The Peer-reviewers need to identify your own perceptive of theconcepts in your own terms. NEVER extract straight from any foundation, and never rephrase someone else's analysis.
Please carefully note down following rules and regulation before submitting your Research Paper to Global Journals Inc. (US):
Segment Draft and Final Research Paper: You have to strictly follow the template of research paper. If it is not done your paper may getrejected.
© Copyright by Global Journals Inc.(US)| Guidelines Handbook
XXII
THE

CRITERION FOR GRADING A RESEARCH PAPER (COMPILATION)BY GLOBAL JOURNALS INC. (US)
Please note that following table is only a Grading of "Paper Compilation" and not on "Performed/Stated Research" whose grading
solely depends on Individual Assigned Peer Reviewer and Editorial Board Member. These can be available only on request and after
decision of Paper. This report will be the property of Global Journals Inc. (US).
Topics Grades
A-B C-D E-F
Abstract
Clear and concise with
appropriate content, Correct
format. 200 words or below
Unclear summary and no
specific data, Incorrect form
Above 200 words
No specific data with ambiguous
information
Above 250 words
Introduction
Containing all background
details with clear goal and
appropriate details, flow
specification, no grammar
and spelling mistake, well
organized sentence and
paragraph, reference cited
Unclear and confusing data,
appropriate format, grammar
and spelling errors with
unorganized matter
Out of place depth and content,
hazy format
Methods and
Procedures
Clear and to the point with
well arranged paragraph,
precision and accuracy of
facts and figures, well
organized subheads
Difficult to comprehend with
embarrassed text, too much
explanation but completed
Incorrect and unorganized
structure with hazy meaning
Result
Well organized, Clear and
specific, Correct units with
precision, correct data, well
structuring of paragraph, no
grammar and spelling
mistake
Complete and embarrassed
text, difficult to comprehend
Irregular format with wrong facts
and figures
Discussion
Well organized, meaningful
specification, sound
conclusion, logical and
concise explanation, highly
structured paragraph
reference cited
Wordy, unclear conclusion,
spurious
Conclusion is not cited,
unorganized, difficult to
comprehend
References
Complete and correct
format, well organized
Beside the point, Incomplete Wrong format and structuring
© Copyright by Global Journals Inc.(US) | Guidelines Handbook
XXIII

Index
A
Albatross · 22
C
Contradictory · 17, 26
E
Exogenous · 9
F
Felinity · 2
N
Notorious · 34
P
Pessimism · 30Preached · 17
T
Tenant · 47, 53
