impact of measurement uncertainty on the development...
TRANSCRIPT

Integrated Development
Impact of Measurement Uncertainty on
the Development Cycle
Michael Fletcher

Agenda
•Concept Overview
•Quality as an accumulation of error
•Sources of Error
•Flow of Error in System
•Impact of MU on development cycle outputs
•Quality
•Cost
•Time to Market
•Example
•Conclusions
•Questions

Integrated DevelopmentConcept Overview

Integrated Development Environment -
Background
OPERATIONS
DEVELOPMENT
Integrated Development Environment
•Quality
•Time to Market
•Cost

Quality: A Function of Uncertainties
Design Intent
Uncertainty
Tolerance
Analysis
Uncertainty
Mfg
Uncertainty
Measurement
Uncertainty
Product
Quality
Difference between
design intent and
what is allowed by
documentation
Difference between
actual assembly behavior
and simulated behavior
Difference between
documented requirements
and actual component
Difference between what is
measured and the
actual measurement

Quality: A Function of Uncertainties
Design Intent
Uncertainty
Tolerance
Analysis
Uncertainty
Mfg
Uncertainty
Measurement
Uncertainty
Product
Quality
•Determines Design Predictability
•Crosses Organizational Boundaries

The Flow of Uncertainty
Design Intent
Uncertainty
Tolerance
Analysis
Uncertainty
Mfg
Uncertainty
Measurement
Uncertainty

Quality: A Function of Uncertainties
Measurement
Design
Intent
Tolerance
Analysis
Mfg
PRODUCT QUALITY
Measurement data and
error are handed off to
critical development and
mfg decision steps

Driving Down Uncertainty
Design Intent
Uncertainty
Tolerance
Analysis
Uncertainty
Mfg
Uncertainty
Measurement
Uncertainty
Product
Quality
DESIGN
Dimensioning &
Tolerancing Strategy
DESIGN
Advanced Tolerance
Analysis Techniques
Mfg
More precise design
intent,
Process improvements
Physical Metrology
MU Budgets
Appropriate Analysis

Impact of Measurement Uncertainty On
Development
Measurement
Uncertainty
Physical Metrology
MU Budgets
Appropriate AnalysisMisclassification
• Single value vs. capability

Measurement Uncertainty : Scenario 1
Classify unacceptable capability as acceptable
•Move ahead with Development
•Component Qualifications
•Development Builds and Testing
•IQ/OQ/PQ
•Design Verification Builds and Testing
•Fail at some point in these processes

Scenario 1: Impact
• Delay Product Launch (Lost Revenue)
• Tool Changes (Cost)
• Repeat Development work (Delays resources and
impact to other developments)
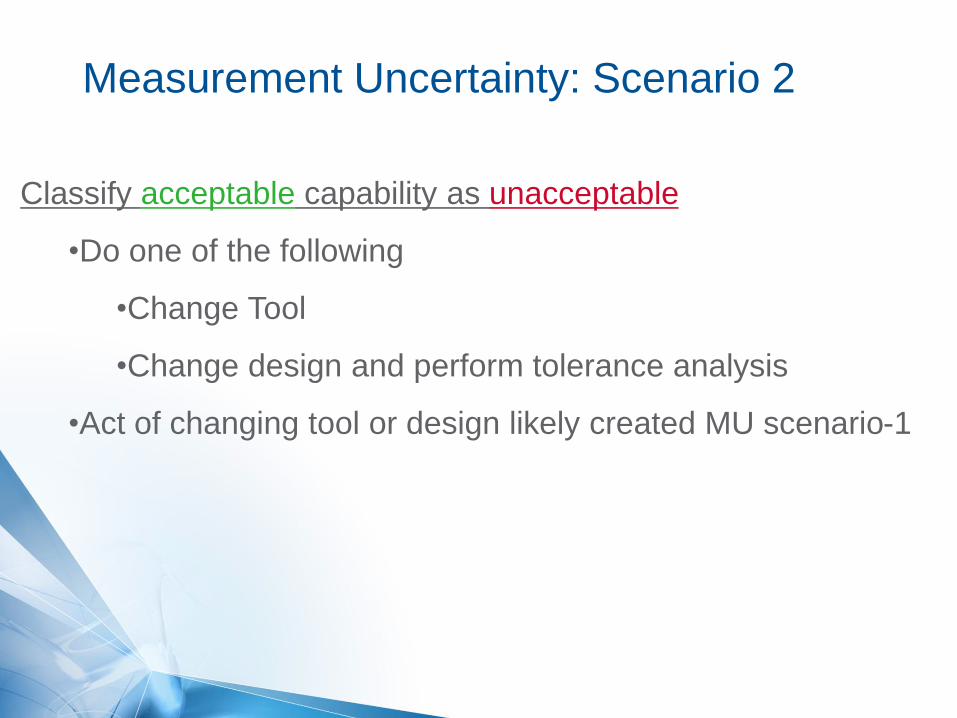
Measurement Uncertainty: Scenario 2
Classify acceptable capability as unacceptable
•Do one of the following
•Change Tool
•Change design and perform tolerance analysis
•Act of changing tool or design likely created MU scenario-1

Integrated DevelopmentMetrology Impact on Development
z
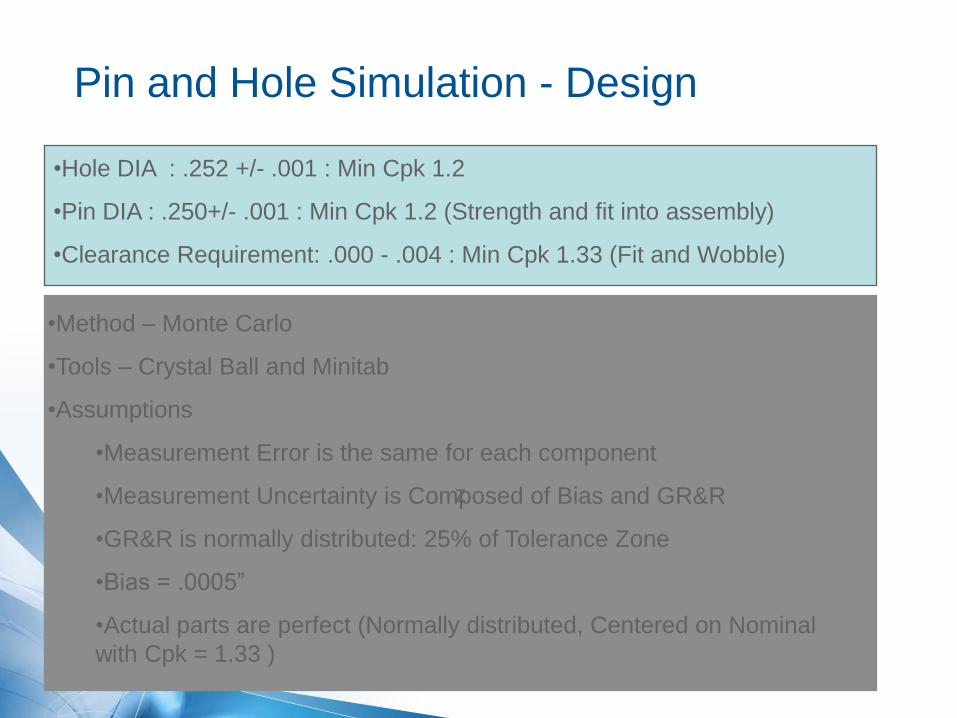
Pin and Hole Simulation - Design
•Hole DIA : .252 +/- .001 : Min Cpk 1.2
•Pin DIA : .250+/- .001 : Min Cpk 1.2 (Strength and fit into assembly)
•Clearance Requirement: .000 - .004 : Min Cpk 1.33 (Fit and Wobble)
•Method – Monte Carlo
•Tools – Crystal Ball and Minitab
•Assumptions
•Measurement Error is the same for each component
•Measurement Uncertainty is Composed of Bias and GR&R
•GR&R is normally distributed: 25% of Tolerance Zone
•Bias = .0005”
•Actual parts are perfect (Normally distributed, Centered on Nominal
with Cpk = 1.33 )

Pin and Hole - Simulation
CPK 1.4
-
=
CPK 1.33CPK 1.33

Pin and Hole - Simulation
Cpk = 0.62Cpk = 0.61
-
=Cpk = 1.6

Pin and Hole - Simulation
Scenario 1 – Led
to believe good
parts are bad
Instruct Mfg to
move process
mean -.0005”

Pin and Hole – Simulation
-
=
Cpk = 1.2Cpk = 1.2
Cpk = 1.6
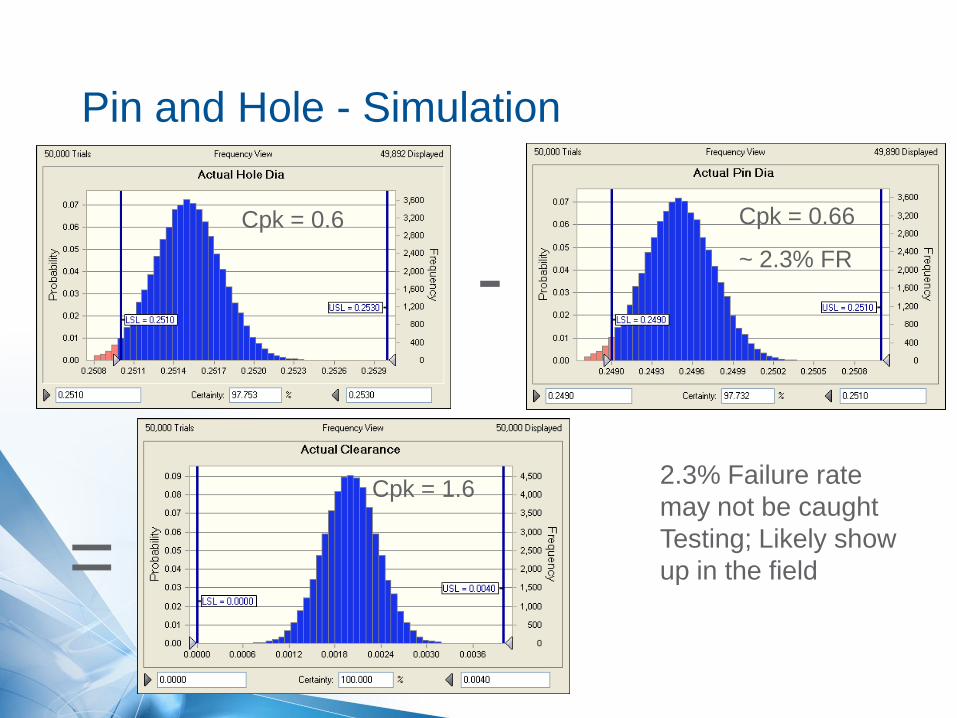
Pin and Hole - Simulation
-
=
Cpk = 0.66
~ 2.3% FR
Cpk = 0.6
Cpk = 1.62.3% Failure rate
may not be caught
Testing; Likely show
up in the field
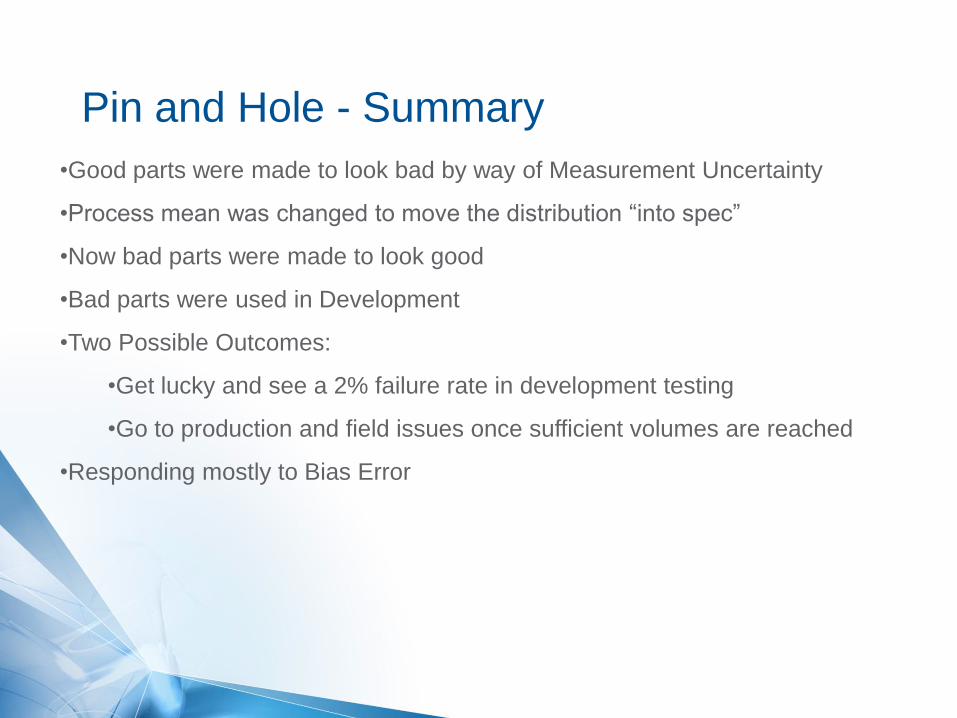
Pin and Hole - Summary
•Good parts were made to look bad by way of Measurement Uncertainty
•Process mean was changed to move the distribution “into spec”
•Now bad parts were made to look good
•Bad parts were used in Development
•Two Possible Outcomes:
•Get lucky and see a 2% failure rate in development testing
•Go to production and field issues once sufficient volumes are reached
•Responding mostly to Bias Error

Key Take-Aways
• Capability of component distributions are more important
than ever because of the predictive design goals
• Error sources in distribution estimates cut across all
disciplines and must be quantified
•All sources must be controlled if predictive goal is to be
reached
•Bias (as a percentage of tolerance) has the larger impact on
misclassification than %GR&R and should be quantified

Thank You

Continuing Work
Bias
GR
R
75.0%60.0%45.0%30.0%15.0%0.0%
350.0%
250.0%
150.0%
50.0%
>
–
–
–
–
–
–
–
–
<
0.00
-2.00
-2.00 -1.75
-1.75 -1.50
-1.50 -1.25
-1.25 -1.00
-1.00 -0.75
-0.75 -0.50
-0.50 -0.25
-0.25 0.00
Cpk Delta
Contour Plot of Cpk Delta vs GRR, Bias