impact of inverted curriculum and modeling instruction on student achievement in science tom...
TRANSCRIPT

Impact of Inverted Curriculum and Modeling Instruction on Student Achievement in Science
Tom Cheatham (MTSU), Jennifer Dye (JP2), Ginger Rowell, Angela Barlow, Robert Carlton (MTSU)
2013 Institute for CTE EducatorsJuly 15-19 MTSU

What does “College and Career Ready (CCR)” mean?
1. HS student complete a “core” curriculum. (4 English, 4 math, 3 science, 3 social science)2. Meet ACT college readiness benchmarks (CRB) (English=18, Reading=21, Math=22, Science=24)
What does it mean to say that a student with an ACT science score of 24 or higher is CR in science?
>= 75% chance of earning a “C” or better in freshman biology or>= 50% chance of earning a “B” or better in freshman biology

Subject US Percent TN PercentEnglish 67% 59%Reading 52% 43%Mathematics 46% 29%Science 31% 21%All Four Subjects 25% 16%
ACT-Tested High School Graduates Meeting CRB 2012
Does CCR require we meet CRB in all 4 subjects?

What are the TN average ACT scores in these 4 areas?
Subject TN ACT Average ACT CRB by Subject
English 19.0 18
Reading 19.4 21
Mathematics 18.7 22
Science 19.2 24
Tennessee 2012 ACT Average Subscores and Corresponding CRB

How can we do better?
ACT claim: Test earlier EXPLORE in 8th GradePLAN in 10th GradeACT in 11th Grade (available on TDOE Report Card)
ACT CRB Benchmarks by Test Test Math ScienceEXPLORE 17 20PLAN 19 21ACT 22 24

We are testing early and often and still only meet CRB in English, on average. Only 21% of TN HS graduates meet CRB in science (2012).
What else can be done to graduate more students CCR in science?
Change the way we teach science!

We may have the best opportunity ever to change how we teach Math/Science: CCSS-M and NGSS
I hope we don’t mess this up.
What else can be done to graduate more students CCR in science?
I will show you data from JP2 using 3 methods.
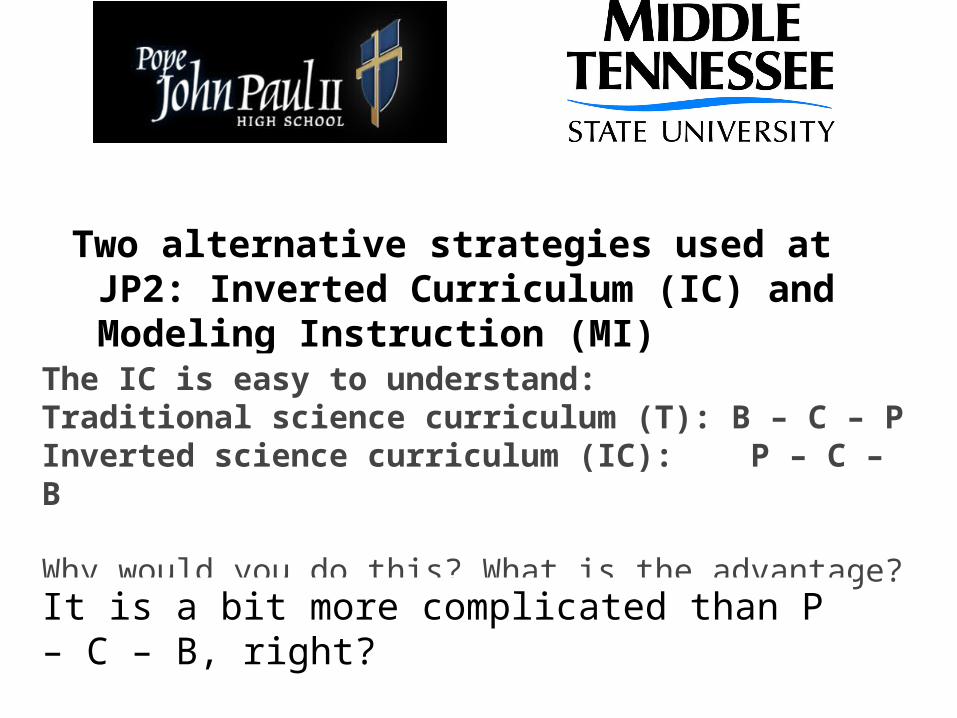
Two alternative strategies used at JP2: Inverted Curriculum (IC) and Modeling Instruction (MI)
The IC is easy to understand:Traditional science curriculum (T): B – C – P Inverted science curriculum (IC): P – C – B
Why would you do this? What is the advantage?
It is a bit more complicated than P – C – B, right?

1. You can’t teach junior/senior level physics to freshman2. What physics can you teach freshman? Conceptual physics?3. Should not teach freshman biology to juniors, right? Molecular?
Who is using the IC in Tennessee? JP2, Webb, Clarksville-Montgomery Co, Hamilton Co., others?

In Modeling Instruction (MI), lectures and traditional content units are replaced with modeling cycles in which students, working in small groups, collaboratively collect data and construct a conceptual model to explain observations of a real-world system. In class, groups engage in model analysis using whiteboards with emphasis on Socratic dialog, responding to challenges, and employing multiple representations (diagrams, graphs or equations). The teacher then guides the development of a generalizable model which students will deploy and use to predict outcomes for new initial conditions or constraints. The modeling cycle concludes when a representative student from each group explains and defends their model of the real-world system, again using whiteboards. The teacher is responsible for ongoing Socratic dialog that challenges misconceptions, for defining the real-world problem, for guiding model development and deployment, and for formative assessment of student understanding. (Robert Carlton, MTSU).
https://vimeo.com/49925916

What does the study look like at JP2?
Eight Graduating classes taught with three methods:2006, 2007, 2008, 2009 [T], (Traditional science curriculum)2010, 2011 [IC], (Inverted curriculum)2012, 2013 [IM2] (Inverted plus modeling C+B)(I know that 2013 graduates …)
JP2 administers PLAN at beginning of 9th grade, ACT at end of 11th grade. Not same as public schools, but PLAN provides a good benchmark upon entry to HS.
Data for JP2 on following slides

PLAN Math PLAN Science PLAN CompTreatment n= Mean Mean MeanT 402 19.41 20.31 20.11IC 214 19.00 19.57 19.26IM2 192 19.53 19.97 19.81All 808 19.33 20.03 19.81Min ALL 8 11 11Max ALL 32 32 31Median All 18 20 19
Pope John Paul II PLAN Scores by Curriculum

ACT Math ACT Science ACT CompTreatment n= Mean Mean MeanT 402 22.49 23.08 23.60IC 214 22.39 23.69 23.64IM2 192 23.45 24.27 24.49All 808 22.69 23.52 23.82Min ALL 13 12 11Max ALL 36 36 35Median All 23 23 23
Pope John Paul II ACT Scores by Curriculum

Changes to College Readiness by Curriculum
Percent who Met CRB in Science/Math by CurriculumTreat N= PLAN-m ACT-m PLAN-s ACT-sT 402 46.0% 53.7% 42.8% 45.3%IC 214 43.9% 55.1% 30.4% 48.1%IM2 192 51.6% 66.7% 35.9% 56.8%m=math; s=science
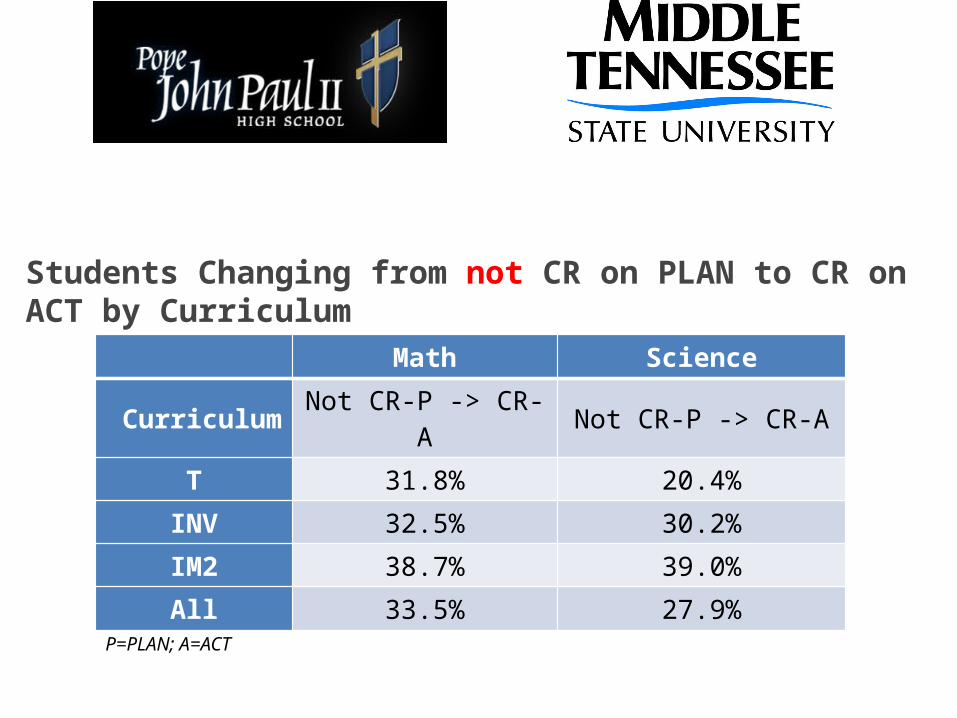
Students Changing from not CR on PLAN to CR on ACT by Curriculum
Math Science
Curriculum Not CR-P -> CR-A Not CR-P -> CR-A
T 31.8% 20.4%
INV 32.5% 30.2%
IM2 38.7% 39.0%
All 33.5% 27.9%P=PLAN; A=ACT

Off-Target on PLAN to CR on ACT by Curriculum
Treatment N= Math % Science %T 402 16.5% 7.8%
Inv 214 13.0% 18.1%IM2 192 16.7% 21.2%All 808 15.6% 13.9%
Traditional IC IC / MI0
20
40
60
80
100
120
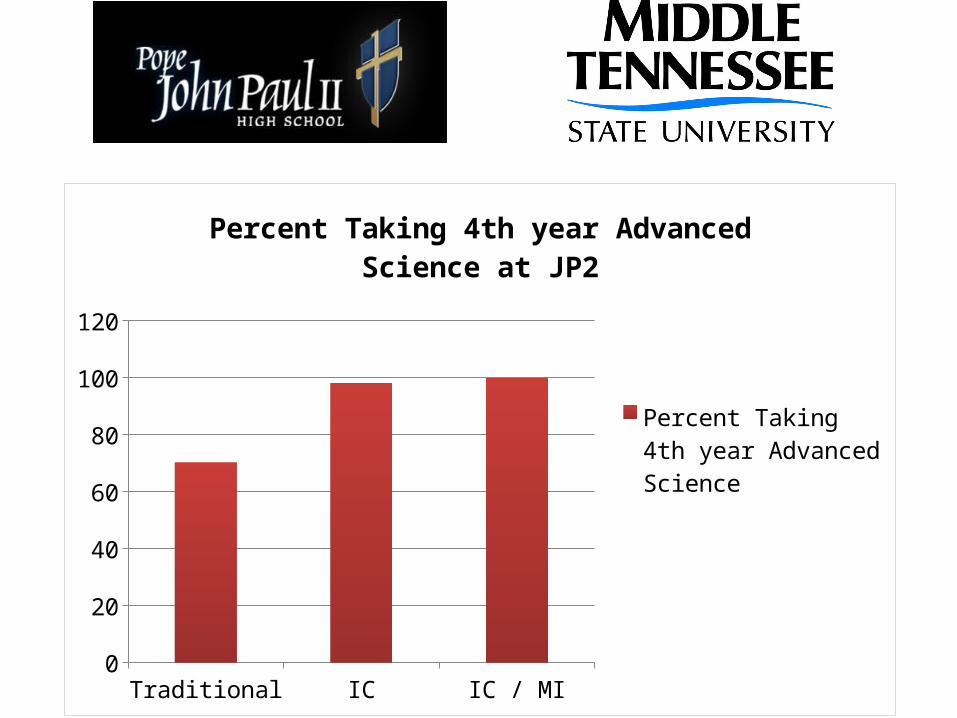
Percent Taking 4th year Advanced Science at JP2
Percent Taking 4th year Advanced Science

Clarksville Montgomery County Senior Math and Science
CMCSS Modeling
CMCSS Control
0
10
20
30
40
50
60
70
80
Percent Taking Advanced Math Senior YearPercent Taking Science Senior Year
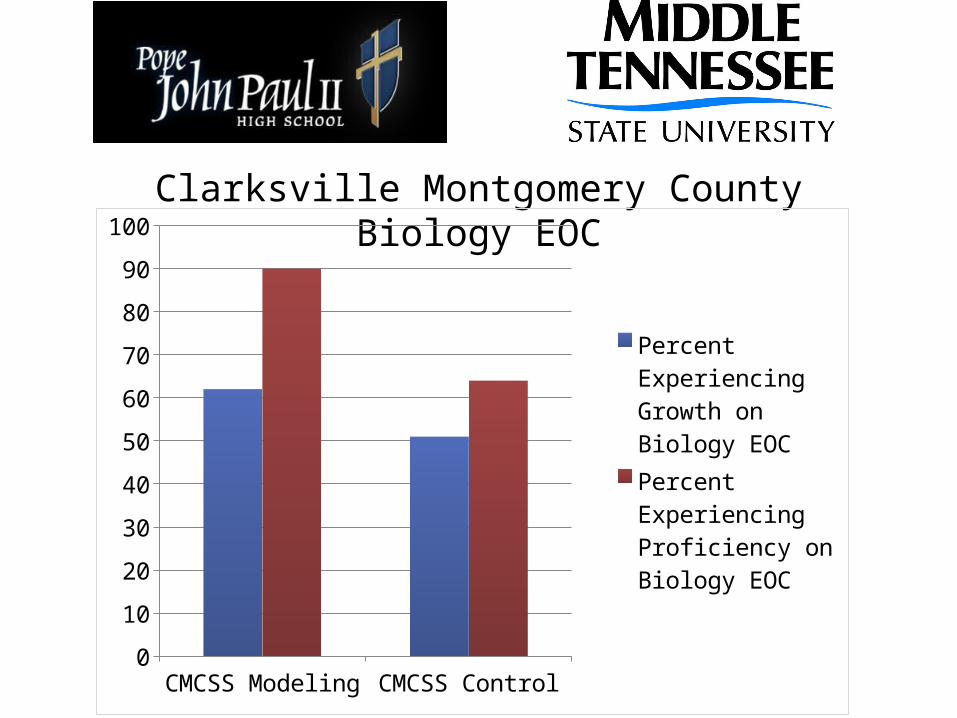
Clarksville Montgomery County Biology EOC
CMCSS Model-ing
CMCSS Control0
10
20
30
40
50
60
70
80
90
100
Percent Experi-encing Growth on Biology EOCPercent Experi-encing Proficiency on Biology EOC