impact of integrated management on yield sustainability in relation to soil quality under a...
TRANSCRIPT
RESEARCH ARTICLE
Impact of Integrated Management on Yield Sustainabilityin Relation to Soil Quality Under a Rice–Wheat Cropping System
Debarati Bhaduri • T. J. Purakayastha •
L. M. Bhar • A. K. Patra • Binoy Sarkar
Received: 21 February 2013 / Revised: 12 August 2013 / Accepted: 22 October 2013 / Published online: 15 February 2014
� The National Academy of Sciences, India 2014
Abstract This study concentrates on developing a soil
quality index (SQI), linking productivity to soil quality indi-
cators, and SQI using grain yield of rice and wheat grown in a
sequence for 8 years in an integrated tillage-water-nutrient
management system. Rice yield was significantly better under
puddling, 3 days of drainage, and both 150 % NPK and
100 % NPK ? FYM treatments, and the yields were posi-
tively correlated with bulk density (BD), available Fe and soil
respiration. The wheat yield was significantly higher under
conventional tillage, five lots of irrigation, and 150 % NPK,
and was positively correlated with BD, water stable aggre-
gates (WSA) and available N. However, it was negatively
correlated with mean weight diameter, soil organic carbon and
hydraulic conductivity. Stepwise regression identified avail-
able Fe, WSA and microbial biomass carbon as the most
important indicators that explained 42 % variability in rice
yield, which further correlated significantly with the PCA-
based SQI (r = ?0.44). Thus, crop yield emerged as an
important indicator for maintaining soil quality to sustain high
productivity under integrated management systems.
Keywords SQI � Indicators � Tillage � Nutrient �Water management � PCA
Introduction
Rice (Oryza sativa L.) and wheat (Triticum aestivum L.) are
two most important food crops that contribute digestible
energy (45 %) and protein (30 %) to the human diet [1]. These
crops are grown sequentially over an area of 24 Mha
throughout South-East Asia, of which the Indo-Gangetic
plains (IGP) grows 32 and 42 % of the rice and wheat,
respectively; representing the region’s share of one quarter to
one-third of total production [2]. However, in recent years, the
productivity of this cropping system in the IGP region has
either stagnated or gone into decline [2, 3]. The causes for yield
stagnation or decline may include changes in soil quality
parameters, perhaps due to repeated transitions from anaero-
bic-rice to aerobic-wheat growing conditions affecting the soil
structure and nutrient transformation [4]. A possible link
between soil quality and climate change [5] may cumulatively
alter crop productivity in future scenario. Soils have several
biological, chemical and physical indicators that interact in a
complex way to give a soil its quality [6]. Traditionally soil
quality has been equated with the agricultural system pro-
ductivity. As an important indicator of system productivity,
crop yield partially depends on soil quality and its associated
indicators, and thus serves as a plant bioassay of the interacting
soil characteristics [7]. The biological variables of soils such as
microbial biomass, enzymatic activities and soil organic
matter [8] and nutrients like N, P [9] are significantly linked to
D. Bhaduri � T. J. Purakayastha � A. K. Patra
Division of Soil Science and Agricultural Chemistry, Indian
Agricultural Research Institute, New Delhi 110012, India
L. M. Bhar
Indian Agricultural Statistical Research Institute,
New Delhi 110012, India
B. Sarkar
Centre for Environmental Risk Assessment and Remediation
(CERAR), Cooperative Research Centre for Contamination
Assessment and Remediation of the Environment (CRC CARE),
University of South Australia, Mawson Lakes Campus,
Mawson Lakes, SA 5095, Australia
Present Address:
D. Bhaduri (&)
Directorate of Groundnut Research, Junagadh 362001,
Gujarat, India
e-mail: [email protected]
123
Natl. Acad. Sci. Lett. (January–February 2014) 37(1):25–31
DOI 10.1007/s40009-013-0202-7
crop yield in various crop rotations. In contrast, limited
information is available on the correlation of crop yield with
the SQI [10], and this warrants further investigation. Few
previous works attempted an effort to correlate the SQI with
system productivity other than rice–wheat system [11, 12].
There are conflicting reports [7, 10] on the impact of dif-
ferent tillage (and puddling) management and nutrient prac-
tices on various soil properties as well as quality in the rice–
wheat system of the Indian subcontinent revealing the role of
non-puddled direct seeding of rice, zero-tillage of wheat and
use of organic manures especially the crop residues. Most of
the previous studies were confined to the development of SQI
from one-time soil sampling and its correlation to combined
yield of the cropping system. However, we attempted to
develop SQIs after the harvest of each crop and correlate both
the soil quality indicators and the quality indices with the
individual yield of each crop. We carried out the present study
by correlating seventeen physical, chemical and biological
indicators and the quality indices developed with the indi-
vidual yield of rice and wheat. Specifically, we examined
integrated water-tillage-nutrient management practices in a
Typic Haplustept of New Delhi, India.
Materials and Methods
Details of Experimental Site
To analyse 17 different quality indicators, soil samples were
collected after the harvest of rice and wheat from an 8-year old
ongoing experiment on a farm operated by the Indian Agri-
cultural Research Institute, New Delhi, India. Rice (cv. Pusa
Sugandh 3) was transplanted (for puddled rice) and directly
sown for non-puddled rice during the wet season (last week of
July to mid of October 2008) and wheat (cv. HD 2687) was
sown during the winter season (mid of November 2008 to end
of March 2009). This area is part of the semi-arid with mean
annual precipitation 650 mm, mean annual temperatures
range 18 �C (min) to 35 �C (max). The soil belongs to the
hyperthermic family of Typic Haplustepts, non-calcareous
and sandy clay loam in texture (48 % sand, 29 % silt, 23 %
clay). The soil had CEC 14.6 cmol (?) kg-1 soil, pH 7.8, EC
0.45 ds m-1, organic carbon 4.8 g kg-1, low available N
(102 mg kg-1), medium available P (9.91 mg kg-1), high
available K (160 mg kg-1) and Fe 9.06 mg kg-1, Mn
3.07 mg kg-1, Zn 1.69 mg kg-1, Cu 2.10 mg kg-1 as
DTPA-extractable micronutrients.
Treatment Details
The experiment was laid out in a split plot design with
three replications. Two tillage treatments, i.e. puddled
(transplanted) and non-puddled (wet seeded rice) for rice,
and the same puddling history for wheat were allocated to
the main plots. Three water treatments both for rice viz.
continuous submergence (W1), irrigation after 1 day of
drainage (W2), and irrigation after 3 days of drainage (W3)
and wheat viz. five irrigations i.e. W1 [crown root initiation
(CRI), tillering, jointing, flowering and dough stages], three
irrigations i.e. W2 (CRI, jointing and flowering stages) and
two irrigations i.e. W3 (CRI and flowering stages) were
allocated to the sub plots. Nine nutrient treatments were
allocated to the sub–sub plots for rice as follows: Control
(T1), 100 % NPK (T2), 150 % NPK (T3), 100 % N [25 %
N substituted by farmyard manure (FYM) (T4), green
manure (T5), biofertilizer (T6), sewage sludge (T7), crop
residues (T8)] ? PK and, 100 % N organic sources (50 %
FYM ? 25 % biofertilizer ? 25 % crop residues/green
manure) (T9). For wheat, splitting was done in each
nutrient treatment plot to impose two tillage treatments, i.e.
conventional tillage (CT) and no-tillage (NT). The rec-
ommended dose of N through urea [CO(NH2)2], P through
single superphosphate (Ca(H2OP4)2�H2O) and K through
muriate of potash (KCl) were applied @ 120, 26.2 and
50 kg ha-1, respectively. N in three splits and uniform
dose of P and K before the transplanting/sowing of the
crops was applied.
Well-decomposed FYM (0.5 % N, 0.25 % P and 0.4 %
K on DW basis), sewage sludge (3.6 % N, 1.2 % P, 0.45 %
K on DW basis), crop residues (rice- 0.58 % N, 0.10 P,
1.38 % K; wheat- 0.49 % N, 0.11 % P, 1.06 % K on DW
basis) and green manure (Sesbania aculeata L.) (2.25 % N,
0.37 % P, 1.25 % on DW basis) at the rate of 2 Mg ha-1
were incorporated 15 days before transplanting or sowing
of the crops. The biofertilizer, Azospirilum brasilense CD
JA was coated on the wheat seed surface and by dipping
the rice seedling roots in an aqueous suspension culture to
maintain a population of about 109 cells g-1 of seed.
Sampling and Methods of Analysis
Composite surface (0–15 cm) soil samples were collected
after the harvest of each crop. The soil samples were
analysed for: bulk density (BD) [13], maximum water-
holding capacity (MWHC) [14], saturated hydraulic con-
ductivity (HC) [15], mean weight diameter (MWD) and
water stable aggregates (WSA) [16, 17] soil organic carbon
(SOC) [18], available N [19], available P [20], available
Zn, Fe, Cu, Mn [21], microbial biomass carbon (MBC)
[22], dehydrogenase activity (DHA) [23], potentially
mineralizable N (PMN) [24] and soil respiration [25].
Metabolic or respiratory quotient (qCO2) was derived as
mg CO2–C per h per mg of MBC. The crop was harvested,
26 D. Bhaduri et al.
123
sun dried for 4–5 days and the grain yield per plot was
recorded as Mg ha-1 after threshing.
Development of SQI
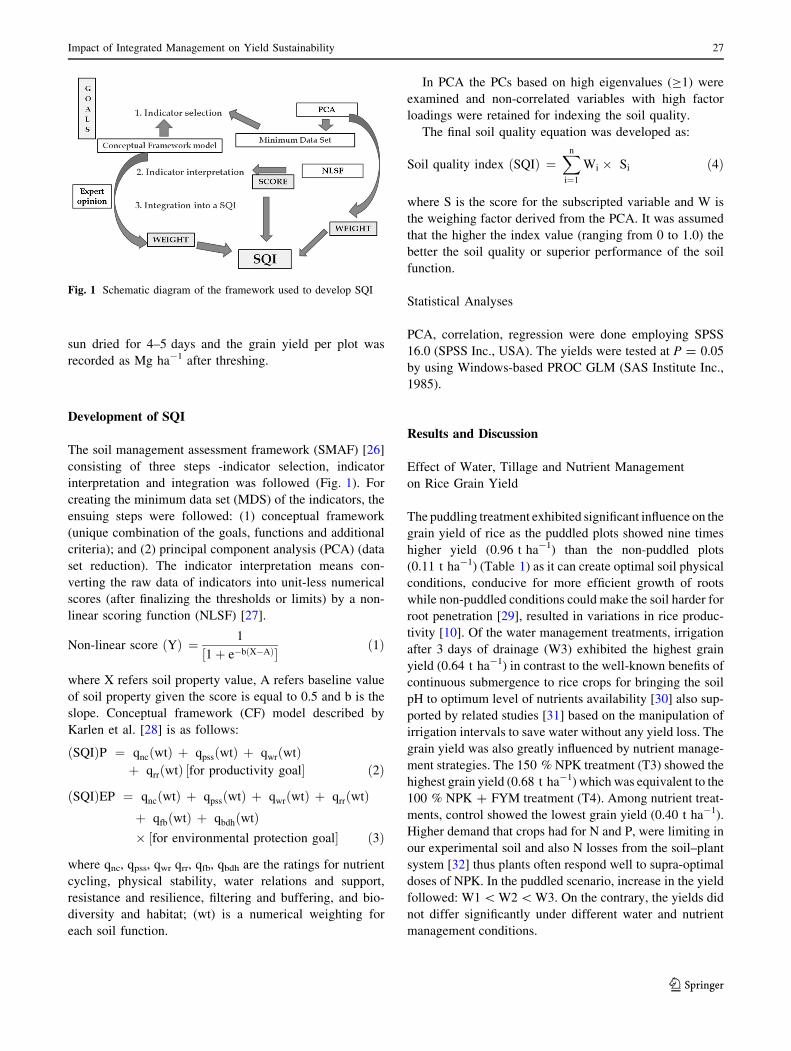
The soil management assessment framework (SMAF) [26]
consisting of three steps -indicator selection, indicator
interpretation and integration was followed (Fig. 1). For
creating the minimum data set (MDS) of the indicators, the
ensuing steps were followed: (1) conceptual framework
(unique combination of the goals, functions and additional
criteria); and (2) principal component analysis (PCA) (data
set reduction). The indicator interpretation means con-
verting the raw data of indicators into unit-less numerical
scores (after finalizing the thresholds or limits) by a non-
linear scoring function (NLSF) [27].
Non-linear score Yð Þ ¼ 1
1þ e�bðX�AÞ½ � ð1Þ
where X refers soil property value, A refers baseline value
of soil property given the score is equal to 0.5 and b is the
slope. Conceptual framework (CF) model described by
Karlen et al. [28] is as follows:
SQIð ÞP ¼ qnc wtð Þ þ qpss wtð Þ þ qwr wtð Þþ qrr wtð Þ for productivity goal½ � ð2Þ
SQIð ÞEP ¼ qnc wtð Þ þ qpss wtð Þ þ qwr wtð Þ þ qrr wtð Þþ qfb wtð Þ þ qbdh wtð Þ� for environmental protection goal½ � ð3Þ
where qnc, qpss, qwr qrr, qfb, qbdh are the ratings for nutrient
cycling, physical stability, water relations and support,
resistance and resilience, filtering and buffering, and bio-
diversity and habitat; (wt) is a numerical weighting for
each soil function.
In PCA the PCs based on high eigenvalues (C1) were
examined and non-correlated variables with high factor
loadings were retained for indexing the soil quality.
The final soil quality equation was developed as:
Soil quality index SQIð Þ ¼Xn
i¼1
Wi � Si ð4Þ
where S is the score for the subscripted variable and W is
the weighing factor derived from the PCA. It was assumed
that the higher the index value (ranging from 0 to 1.0) the
better the soil quality or superior performance of the soil
function.
Statistical Analyses
PCA, correlation, regression were done employing SPSS
16.0 (SPSS Inc., USA). The yields were tested at P = 0.05
by using Windows-based PROC GLM (SAS Institute Inc.,
1985).
Results and Discussion
Effect of Water, Tillage and Nutrient Management
on Rice Grain Yield
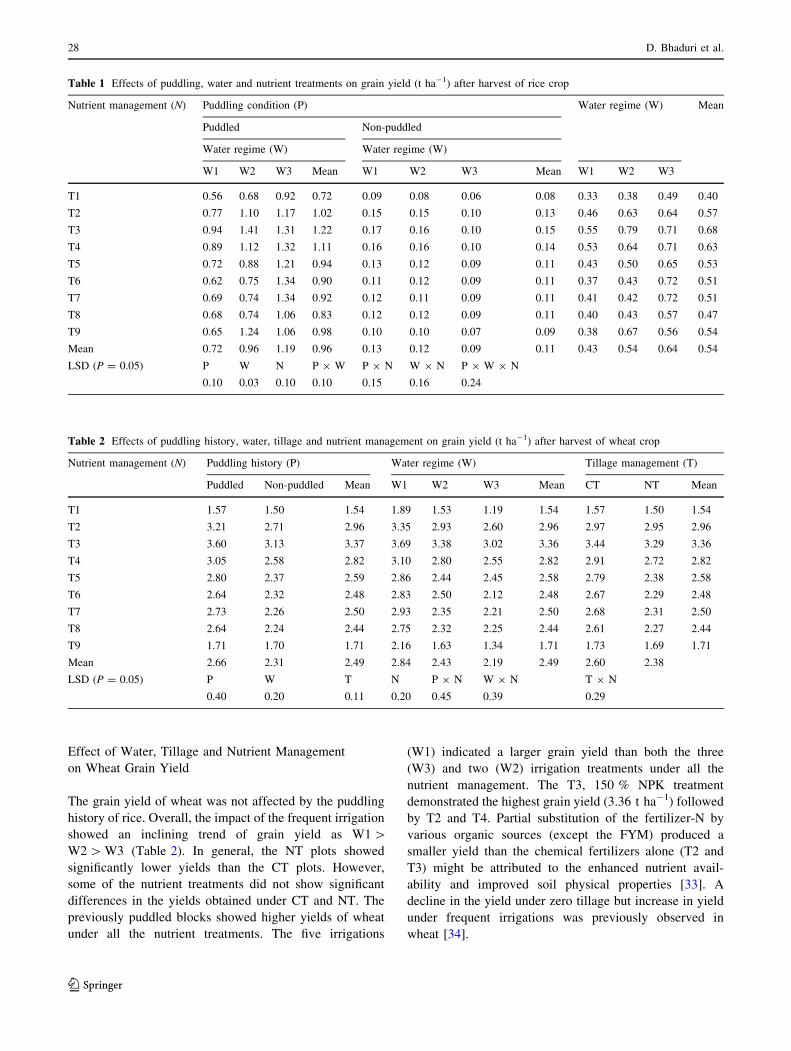
The puddling treatment exhibited significant influence on the
grain yield of rice as the puddled plots showed nine times
higher yield (0.96 t ha-1) than the non-puddled plots
(0.11 t ha-1) (Table 1) as it can create optimal soil physical
conditions, conducive for more efficient growth of roots
while non-puddled conditions could make the soil harder for
root penetration [29], resulted in variations in rice produc-
tivity [10]. Of the water management treatments, irrigation
after 3 days of drainage (W3) exhibited the highest grain
yield (0.64 t ha-1) in contrast to the well-known benefits of
continuous submergence to rice crops for bringing the soil
pH to optimum level of nutrients availability [30] also sup-
ported by related studies [31] based on the manipulation of
irrigation intervals to save water without any yield loss. The
grain yield was also greatly influenced by nutrient manage-
ment strategies. The 150 % NPK treatment (T3) showed the
highest grain yield (0.68 t ha-1) which was equivalent to the
100 % NPK ? FYM treatment (T4). Among nutrient treat-
ments, control showed the lowest grain yield (0.40 t ha-1).
Higher demand that crops had for N and P, were limiting in
our experimental soil and also N losses from the soil–plant
system [32] thus plants often respond well to supra-optimal
doses of NPK. In the puddled scenario, increase in the yield
followed: W1 \ W2 \ W3. On the contrary, the yields did
not differ significantly under different water and nutrient
management conditions.
Fig. 1 Schematic diagram of the framework used to develop SQI
Impact of Integrated Management on Yield Sustainability 27
123
Effect of Water, Tillage and Nutrient Management
on Wheat Grain Yield
The grain yield of wheat was not affected by the puddling
history of rice. Overall, the impact of the frequent irrigation
showed an inclining trend of grain yield as W1 [W2 [ W3 (Table 2). In general, the NT plots showed
significantly lower yields than the CT plots. However,
some of the nutrient treatments did not show significant
differences in the yields obtained under CT and NT. The
previously puddled blocks showed higher yields of wheat
under all the nutrient treatments. The five irrigations
(W1) indicated a larger grain yield than both the three
(W3) and two (W2) irrigation treatments under all the
nutrient management. The T3, 150 % NPK treatment
demonstrated the highest grain yield (3.36 t ha-1) followed
by T2 and T4. Partial substitution of the fertilizer-N by
various organic sources (except the FYM) produced a
smaller yield than the chemical fertilizers alone (T2 and
T3) might be attributed to the enhanced nutrient avail-
ability and improved soil physical properties [33]. A
decline in the yield under zero tillage but increase in yield
under frequent irrigations was previously observed in
wheat [34].
Table 1 Effects of puddling, water and nutrient treatments on grain yield (t ha-1) after harvest of rice crop
Nutrient management (N) Puddling condition (P) Water regime (W) Mean
Puddled Non-puddled
Water regime (W) Water regime (W)
W1 W2 W3 Mean W1 W2 W3 Mean W1 W2 W3
T1 0.56 0.68 0.92 0.72 0.09 0.08 0.06 0.08 0.33 0.38 0.49 0.40
T2 0.77 1.10 1.17 1.02 0.15 0.15 0.10 0.13 0.46 0.63 0.64 0.57
T3 0.94 1.41 1.31 1.22 0.17 0.16 0.10 0.15 0.55 0.79 0.71 0.68
T4 0.89 1.12 1.32 1.11 0.16 0.16 0.10 0.14 0.53 0.64 0.71 0.63
T5 0.72 0.88 1.21 0.94 0.13 0.12 0.09 0.11 0.43 0.50 0.65 0.53
T6 0.62 0.75 1.34 0.90 0.11 0.12 0.09 0.11 0.37 0.43 0.72 0.51
T7 0.69 0.74 1.34 0.92 0.12 0.11 0.09 0.11 0.41 0.42 0.72 0.51
T8 0.68 0.74 1.06 0.83 0.12 0.12 0.09 0.11 0.40 0.43 0.57 0.47
T9 0.65 1.24 1.06 0.98 0.10 0.10 0.07 0.09 0.38 0.67 0.56 0.54
Mean 0.72 0.96 1.19 0.96 0.13 0.12 0.09 0.11 0.43 0.54 0.64 0.54
LSD (P = 0.05) P W N P 9 W P 9 N W 9 N P 9 W 9 N
0.10 0.03 0.10 0.10 0.15 0.16 0.24
Table 2 Effects of puddling history, water, tillage and nutrient management on grain yield (t ha-1) after harvest of wheat crop
Nutrient management (N) Puddling history (P) Water regime (W) Tillage management (T)
Puddled Non-puddled Mean W1 W2 W3 Mean CT NT Mean
T1 1.57 1.50 1.54 1.89 1.53 1.19 1.54 1.57 1.50 1.54
T2 3.21 2.71 2.96 3.35 2.93 2.60 2.96 2.97 2.95 2.96
T3 3.60 3.13 3.37 3.69 3.38 3.02 3.36 3.44 3.29 3.36
T4 3.05 2.58 2.82 3.10 2.80 2.55 2.82 2.91 2.72 2.82
T5 2.80 2.37 2.59 2.86 2.44 2.45 2.58 2.79 2.38 2.58
T6 2.64 2.32 2.48 2.83 2.50 2.12 2.48 2.67 2.29 2.48
T7 2.73 2.26 2.50 2.93 2.35 2.21 2.50 2.68 2.31 2.50
T8 2.64 2.24 2.44 2.75 2.32 2.25 2.44 2.61 2.27 2.44
T9 1.71 1.70 1.71 2.16 1.63 1.34 1.71 1.73 1.69 1.71
Mean 2.66 2.31 2.49 2.84 2.43 2.19 2.49 2.60 2.38
LSD (P = 0.05) P W T N P 9 N W 9 N T 9 N
0.40 0.20 0.11 0.20 0.45 0.39 0.29
28 D. Bhaduri et al.
123
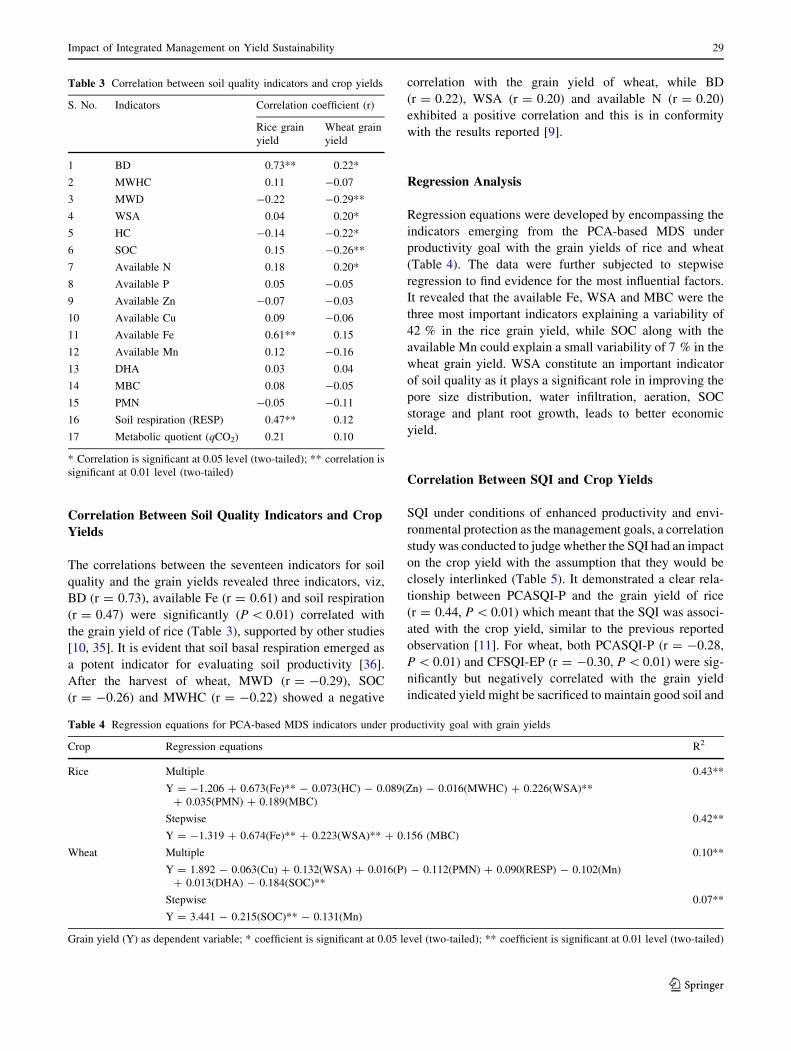
Correlation Between Soil Quality Indicators and Crop
Yields
The correlations between the seventeen indicators for soil
quality and the grain yields revealed three indicators, viz,
BD (r = 0.73), available Fe (r = 0.61) and soil respiration
(r = 0.47) were significantly (P \ 0.01) correlated with
the grain yield of rice (Table 3), supported by other studies
[10, 35]. It is evident that soil basal respiration emerged as
a potent indicator for evaluating soil productivity [36].
After the harvest of wheat, MWD (r = -0.29), SOC
(r = -0.26) and MWHC (r = -0.22) showed a negative
correlation with the grain yield of wheat, while BD
(r = 0.22), WSA (r = 0.20) and available N (r = 0.20)
exhibited a positive correlation and this is in conformity
with the results reported [9].
Regression Analysis
Regression equations were developed by encompassing the
indicators emerging from the PCA-based MDS under
productivity goal with the grain yields of rice and wheat
(Table 4). The data were further subjected to stepwise
regression to find evidence for the most influential factors.
It revealed that the available Fe, WSA and MBC were the
three most important indicators explaining a variability of
42 % in the rice grain yield, while SOC along with the
available Mn could explain a small variability of 7 % in the
wheat grain yield. WSA constitute an important indicator
of soil quality as it plays a significant role in improving the
pore size distribution, water infiltration, aeration, SOC
storage and plant root growth, leads to better economic
yield.
Correlation Between SQI and Crop Yields
SQI under conditions of enhanced productivity and envi-
ronmental protection as the management goals, a correlation
study was conducted to judge whether the SQI had an impact
on the crop yield with the assumption that they would be
closely interlinked (Table 5). It demonstrated a clear rela-
tionship between PCASQI-P and the grain yield of rice
(r = 0.44, P \ 0.01) which meant that the SQI was associ-
ated with the crop yield, similar to the previous reported
observation [11]. For wheat, both PCASQI-P (r = -0.28,
P \ 0.01) and CFSQI-EP (r = -0.30, P \ 0.01) were sig-
nificantly but negatively correlated with the grain yield
indicated yield might be sacrificed to maintain good soil and
Table 3 Correlation between soil quality indicators and crop yields
S. No. Indicators Correlation coefficient (r)
Rice grain
yield
Wheat grain
yield
1 BD 0.73** 0.22*
2 MWHC 0.11 -0.07
3 MWD -0.22 -0.29**
4 WSA 0.04 0.20*
5 HC -0.14 -0.22*
6 SOC 0.15 -0.26**
7 Available N 0.18 0.20*
8 Available P 0.05 -0.05
9 Available Zn -0.07 -0.03
10 Available Cu 0.09 -0.06
11 Available Fe 0.61** 0.15
12 Available Mn 0.12 -0.16
13 DHA 0.03 0.04
14 MBC 0.08 -0.05
15 PMN -0.05 -0.11
16 Soil respiration (RESP) 0.47** 0.12
17 Metabolic quotient (qCO2) 0.21 0.10
* Correlation is significant at 0.05 level (two-tailed); ** correlation is
significant at 0.01 level (two-tailed)
Table 4 Regression equations for PCA-based MDS indicators under productivity goal with grain yields
Crop Regression equations R2
Rice Multiple 0.43**
Y = -1.206 ? 0.673(Fe)** - 0.073(HC) - 0.089(Zn) - 0.016(MWHC) ? 0.226(WSA)**
? 0.035(PMN) ? 0.189(MBC)
Stepwise 0.42**
Y = -1.319 ? 0.674(Fe)** ? 0.223(WSA)** ? 0.156 (MBC)
Wheat Multiple 0.10**
Y = 1.892 - 0.063(Cu) ? 0.132(WSA) ? 0.016(P) - 0.112(PMN) ? 0.090(RESP) - 0.102(Mn)
? 0.013(DHA) - 0.184(SOC)**
Stepwise 0.07**
Y = 3.441 - 0.215(SOC)** - 0.131(Mn)
Grain yield (Y) as dependent variable; * coefficient is significant at 0.05 level (two-tailed); ** coefficient is significant at 0.01 level (two-tailed)
Impact of Integrated Management on Yield Sustainability 29
123
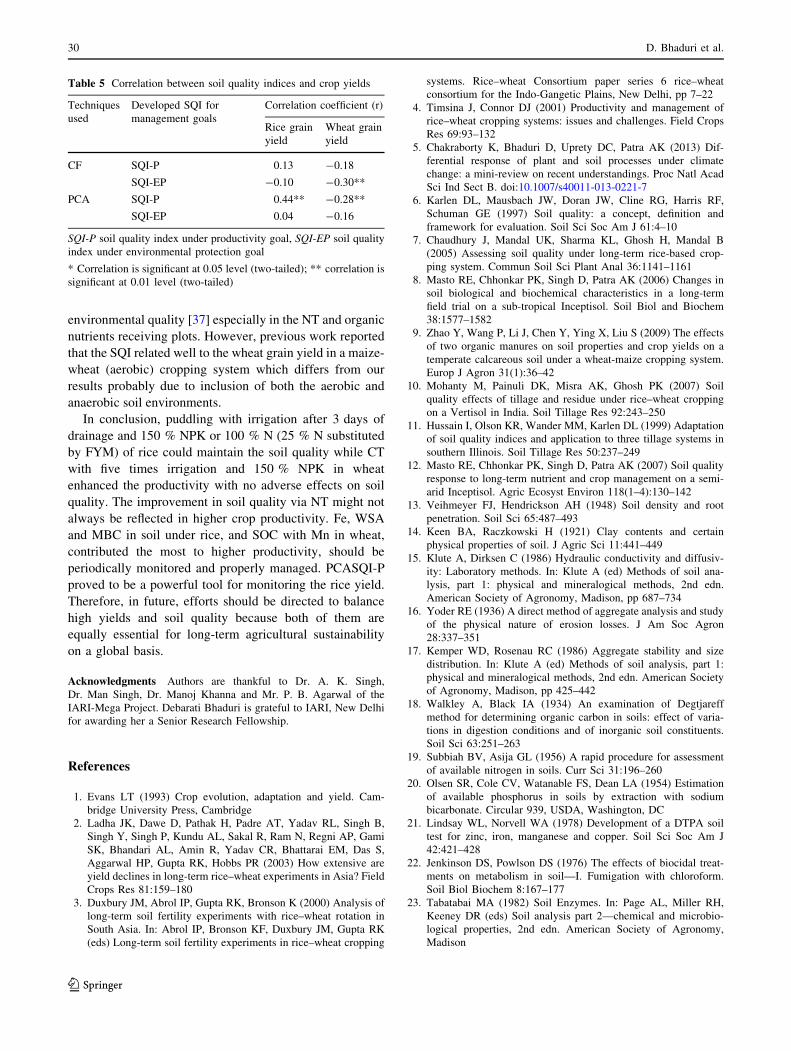
environmental quality [37] especially in the NT and organic
nutrients receiving plots. However, previous work reported
that the SQI related well to the wheat grain yield in a maize-
wheat (aerobic) cropping system which differs from our
results probably due to inclusion of both the aerobic and
anaerobic soil environments.
In conclusion, puddling with irrigation after 3 days of
drainage and 150 % NPK or 100 % N (25 % N substituted
by FYM) of rice could maintain the soil quality while CT
with five times irrigation and 150 % NPK in wheat
enhanced the productivity with no adverse effects on soil
quality. The improvement in soil quality via NT might not
always be reflected in higher crop productivity. Fe, WSA
and MBC in soil under rice, and SOC with Mn in wheat,
contributed the most to higher productivity, should be
periodically monitored and properly managed. PCASQI-P
proved to be a powerful tool for monitoring the rice yield.
Therefore, in future, efforts should be directed to balance
high yields and soil quality because both of them are
equally essential for long-term agricultural sustainability
on a global basis.
Acknowledgments Authors are thankful to Dr. A. K. Singh,
Dr. Man Singh, Dr. Manoj Khanna and Mr. P. B. Agarwal of the
IARI-Mega Project. Debarati Bhaduri is grateful to IARI, New Delhi
for awarding her a Senior Research Fellowship.
References
1. Evans LT (1993) Crop evolution, adaptation and yield. Cam-
bridge University Press, Cambridge
2. Ladha JK, Dawe D, Pathak H, Padre AT, Yadav RL, Singh B,
Singh Y, Singh P, Kundu AL, Sakal R, Ram N, Regni AP, Gami
SK, Bhandari AL, Amin R, Yadav CR, Bhattarai EM, Das S,
Aggarwal HP, Gupta RK, Hobbs PR (2003) How extensive are
yield declines in long-term rice–wheat experiments in Asia? Field
Crops Res 81:159–180
3. Duxbury JM, Abrol IP, Gupta RK, Bronson K (2000) Analysis of
long-term soil fertility experiments with rice–wheat rotation in
South Asia. In: Abrol IP, Bronson KF, Duxbury JM, Gupta RK
(eds) Long-term soil fertility experiments in rice–wheat cropping
systems. Rice–wheat Consortium paper series 6 rice–wheat
consortium for the Indo-Gangetic Plains, New Delhi, pp 7–22
4. Timsina J, Connor DJ (2001) Productivity and management of
rice–wheat cropping systems: issues and challenges. Field Crops
Res 69:93–132
5. Chakraborty K, Bhaduri D, Uprety DC, Patra AK (2013) Dif-
ferential response of plant and soil processes under climate
change: a mini-review on recent understandings. Proc Natl Acad
Sci Ind Sect B. doi:10.1007/s40011-013-0221-7
6. Karlen DL, Mausbach JW, Doran JW, Cline RG, Harris RF,
Schuman GE (1997) Soil quality: a concept, definition and
framework for evaluation. Soil Sci Soc Am J 61:4–10
7. Chaudhury J, Mandal UK, Sharma KL, Ghosh H, Mandal B
(2005) Assessing soil quality under long-term rice-based crop-
ping system. Commun Soil Sci Plant Anal 36:1141–1161
8. Masto RE, Chhonkar PK, Singh D, Patra AK (2006) Changes in
soil biological and biochemical characteristics in a long-term
field trial on a sub-tropical Inceptisol. Soil Biol and Biochem
38:1577–1582
9. Zhao Y, Wang P, Li J, Chen Y, Ying X, Liu S (2009) The effects
of two organic manures on soil properties and crop yields on a
temperate calcareous soil under a wheat-maize cropping system.
Europ J Agron 31(1):36–42
10. Mohanty M, Painuli DK, Misra AK, Ghosh PK (2007) Soil
quality effects of tillage and residue under rice–wheat cropping
on a Vertisol in India. Soil Tillage Res 92:243–250
11. Hussain I, Olson KR, Wander MM, Karlen DL (1999) Adaptation
of soil quality indices and application to three tillage systems in
southern Illinois. Soil Tillage Res 50:237–249
12. Masto RE, Chhonkar PK, Singh D, Patra AK (2007) Soil quality
response to long-term nutrient and crop management on a semi-
arid Inceptisol. Agric Ecosyst Environ 118(1–4):130–142
13. Veihmeyer FJ, Hendrickson AH (1948) Soil density and root
penetration. Soil Sci 65:487–493
14. Keen BA, Raczkowski H (1921) Clay contents and certain
physical properties of soil. J Agric Sci 11:441–449
15. Klute A, Dirksen C (1986) Hydraulic conductivity and diffusiv-
ity: Laboratory methods. In: Klute A (ed) Methods of soil ana-
lysis, part 1: physical and mineralogical methods, 2nd edn.
American Society of Agronomy, Madison, pp 687–734
16. Yoder RE (1936) A direct method of aggregate analysis and study
of the physical nature of erosion losses. J Am Soc Agron
28:337–351
17. Kemper WD, Rosenau RC (1986) Aggregate stability and size
distribution. In: Klute A (ed) Methods of soil analysis, part 1:
physical and mineralogical methods, 2nd edn. American Society
of Agronomy, Madison, pp 425–442
18. Walkley A, Black IA (1934) An examination of Degtjareff
method for determining organic carbon in soils: effect of varia-
tions in digestion conditions and of inorganic soil constituents.
Soil Sci 63:251–263
19. Subbiah BV, Asija GL (1956) A rapid procedure for assessment
of available nitrogen in soils. Curr Sci 31:196–260
20. Olsen SR, Cole CV, Watanable FS, Dean LA (1954) Estimation
of available phosphorus in soils by extraction with sodium
bicarbonate. Circular 939, USDA, Washington, DC
21. Lindsay WL, Norvell WA (1978) Development of a DTPA soil
test for zinc, iron, manganese and copper. Soil Sci Soc Am J
42:421–428
22. Jenkinson DS, Powlson DS (1976) The effects of biocidal treat-
ments on metabolism in soil—I. Fumigation with chloroform.
Soil Biol Biochem 8:167–177
23. Tabatabai MA (1982) Soil Enzymes. In: Page AL, Miller RH,
Keeney DR (eds) Soil analysis part 2—chemical and microbio-
logical properties, 2nd edn. American Society of Agronomy,
Madison
Table 5 Correlation between soil quality indices and crop yields
Techniques
used
Developed SQI for
management goals
Correlation coefficient (r)
Rice grain
yield
Wheat grain
yield
CF SQI-P 0.13 -0.18
SQI-EP -0.10 -0.30**
PCA SQI-P 0.44** -0.28**
SQI-EP 0.04 -0.16
SQI-P soil quality index under productivity goal, SQI-EP soil quality
index under environmental protection goal
* Correlation is significant at 0.05 level (two-tailed); ** correlation is
significant at 0.01 level (two-tailed)
30 D. Bhaduri et al.
123
24. Keeney DR (1982) Nitrogen-availability indices. In: Page AL,
Miller RH, Keeney DR (eds) Soil analysis part 2—chemical and
microbiological properties, 2nd edn. Soil Science Society of
America, Madison, pp 711–733
25. Anderson JPE (1982) Soil respiration. In: Page AL, Miller RH,
Keeney DR (eds) Soil analysis part 2- chemical and microbio-
logical properties, 2nd edn. American Society of Agronomy,
Madison, pp 831–871
26. Andrews SS (1998) Sustainable agriculture alternatives: ecolog-
ical and managerial implications of poultry litter management
alternatives applied to agronomic soils. Ph.D. dissertation. Uni-
versity of Georgia, Athens
27. Wymore AW (1993) Model-based systems engineering. An
introduction to the mathematical theory of discrete systems and to
the tricotyledon theory of system design. CRC, Boca Raton
28. Karlen DL, Wollenhaupt NC, Erbach DC, Berry EC, Swan JB,
Eash NS, Jordahl JL (1994) Crop residue effects on soil quality
following 10-years of no-till corn. Soil Tillage Res 31:149–167
29. Singh KK, Sharma SK (2005) Conservation Tillage and Crop
Residue Management in Rice–wheat Cropping System. In: Abrol
IP, Gupta RK, Malik RK (eds) Conservation agriculture—status
and prospects. Centre for Advancement of Sustainable Agricul-
ture, New Delhi, pp 23–32
30. Sahrawat KL (2005) Fertility and organic matter in submerged
rice soils. Curr Sci 88(5):735–739
31. Cabangon RJ, Tuong TP, Castillo EG, Bao LX, Lu G, Wang G,
Cui Y, Bouman BAM, Li Y, Chen C, Wang J (2004) Effect of
irrigation method and N-fertilizer management on rice yield,
water productivity and nutrient-use efficiencies in typical lowland
rice conditions in China. Paddy Water Environ 2:195–206
32. Dobermann A, Cassman KG (2002) Plant nutrient management
for enhanced productivity in intensive grain production systems
of the United States and Asia. Plant Soil 247:153–175
33. Saha MN, Saha AR, Mandal BC, Ray PK (2000) Effect of long-
term jute-rice–wheat cropping system on crop yields and soil
fertility. In: Abrol IP, Bronson KF, Duxbury JM, Gupta RK (eds)
Long-term soil fertility experiments in rice–wheat cropping sys-
tems. Rice–wheat consortium paper series 6, rice–wheat con-
sortium for the Indo-Gangetic Plains, New Delhi, pp 94–104
34. Bhattacharyya R, Kundu S, Pandey SC, Singh KP, Gupta HS
(2008) Tillage and irrigation effects on crop yields and soil
properties under the rice–wheat system in the Indian Himalayas.
Agric Water Manag 95:993–1002
35. Suswanto T, Shamshuddin J, Syed Omar SR, Mat P, Teh CBS
(2007) Effects of lime and fertiliser application in combination
with water management on rice (Oryza sativa) cultivated on an
acid sulfate soil. Malays J Soil Sci 11:1–16
36. Thuithaisong C, Parkpian P, Shipin OV, Shrestha RP, Naklang K,
DeLaune RD, Jugsujinda A (2011) Soil-quality indicators for
predicting sustainable organic rice production. Comm Soil Sci
Plant Anal 42(5):548–568
37. Bhardwaj AK, Jasrotia P, Hamilton SK, Robertson GP (2011)
Ecological management of intensively cropped agro-ecosystems
improves soil quality with sustained productivity. Agric Ecosyst
Environ 140:419–429
Impact of Integrated Management on Yield Sustainability 31
123