impact of innovation on economic growth: evidence from
TRANSCRIPT
Malaysian Journal of Economic Studies Vol. 57 No. 1, 2020 113
Malaysian Journal of Economic Studies 57(1): 113–132, 2020 ISSN 1511-4554
Impact of Innovation on Economic Growth: Evidence from Malaysia
Siong Hook Lawa
Universiti Putra Malaysia
Tamat Sarmidib Universiti Kebangsaan Malaysia
Lim Thye Gohc
University of Malaya
Abstract: This study empirically investigates the effect of innovation on economic growth using the neoclassical economic growth model. Embarking from the traditional labour growth, physical capital and human capital framework, innovation is postulated to be the main driver for robust economic growth. Using time series techniques, we discover very attention-grabbing findings that highlight the impact of innovation on economic growth for Malaysia. First, the innovation measured by the quantity of a total number of a patent application is statistically insignificant. The result is robust for various innovation measurements, including total local patent application and total foreign patent application. Interestingly, switching to total patent grant instead of a total number of patent application (local or foreign), the empirical result shows a significant impact on economic growth. The finding indirectly reveals the crucial impact of quality innovation rather than the quantity concern. Neglecting both quality and the commercial-isation process of these new technologies may not solve the rigidity of knowledge-commercialisation paradox. Finally, we test for the prominent institutional quality in mediating economic growth under a knowledge-based economy. The interaction between institutional quality and the total patent grant has significantly accelerated the role of innovation channel to economic growth. The empirical findings imply that inadequacy of innovative technology flow over the long term has a detrimental effect on national innovative capacity. Thus, the innovation-economic growth nexus needs to be complemented with a good institutional quality framework, skilled human capital and broader networking to commercialise the innovative product to ensure that the innovation activities promote economic growth.
Keywords: ARDL, economic growth, innovation, institutions, quality innovationJEL classification: O11, O31, O43
a Department of Economics, School of Business and Economics, Universiti Putra Malaysia, 43400 UPM Serdang, Selangor, Malaysia. Email: [email protected] (Corresponding author)
b School of Economics, Faculty of Economics and Management, Universiti Kebangsaan Malaysia, 43600 UKM, Bangi Selangor, Malaysia. Email: [email protected]
c Department of Economics, Faculty of Economics and Adminstration, University of Malaya, 50603 Kuala Lumpur, Malaysia. Email: [email protected]
* Acknowledgement: We are grateful for the financial support from the Fundamental Research Grant Scheme (FRGS), Ministry of Higher Education, Malaysia (Grant No. 5524598, UPM), and useful comments from the participants of Malaysian Institute of Economic Research (MIER) National Economic Outlook Conference, Kuala Lumpur, 27-28 November 2018.
Article Info: Received 11 August 2019; Revised 6 April 2020; Accepted 20 April 2020https://doi.org/10.22452/MJES.vol57no1.6
114 Malaysian Journal of Economic Studies Vol. 57 No. 1, 2020
Siong Hook Law, Tamat Sarmidi and Lim Thye Goh
1. IntroductionSustainable economic growth issue has been a central discussion in the economic development debate. Apart from proposing growth determinants, finding a new feasible growth driver is of utmost importance. Some economists have argued that policies, which embrace openness, competition and productivity improvement, will promote sustainable growth. Others have countered that the strategy should emphasise domestic innovation activity – and preferably high-tech manufacturing. Malaysia, as an emerging economy, also redefines its growth strategy via the New Economic Model (NEM) in 2010 and the Economic Transformation Program by identifying the main key areas to stimulate economic growth. Nevertheless, the question of maintaining high economic growth has been a continuous academic discourse significant subject of ongoing debate.1
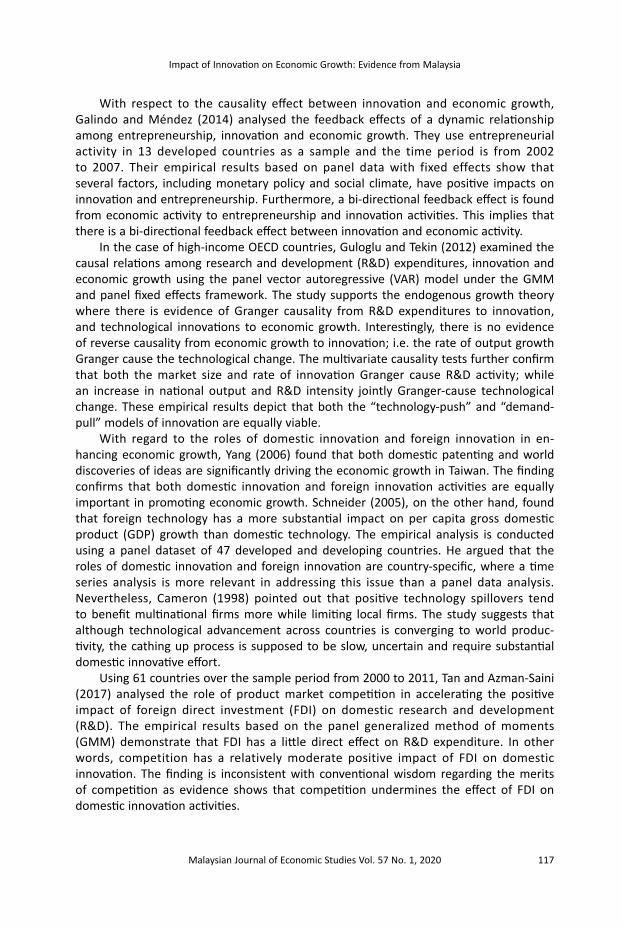
Recent economic growth theories postulate that a new range of innovative products or business model as an outcome of continuous research and innovation is another primary catalyst of productivity and economic growth. Any move towards promoting innovation should be a priority. Figure 1 depicts that the innovation activities of upper-middle-income countries are catching up with the high-income countries
1 The goal of the NEM is to “transform the Malaysian economy to become one with high incomes and quality growth” by 2020. At the time of the plan’s unveiling in 2010, per capita annual income in Malaysia stood at US$7,000, under the plan that figure would more than double to US$15,000. The keys to the plan are “high income, sustainability and inclusiveness”.
Figure 1. Innovations (total patent application) at different income levels
0
200000
400000
600000
800000
1000000
1200000
1400000
1600000
1800000
1997
1998
1999
2000
2001
2002
2003
2004
2005
2006
2007
2008
2009
2010
2011
2012
2013
2014
2015
2016
High-income Upper middle-income
Lower middle-income Low-income

Malaysian Journal of Economic Studies Vol. 57 No. 1, 2020 115
Impact of Innovation on Economic Growth: Evidence from Malaysia
where these two income levels converge to a similar point. In terms of Malaysian innovation performance compared to the world, Malaysia was ranked 35th in 2018 and 37th in 2017 by the World Economic Forum (WEF) based on the Global Innovation Index (GII). The indicator suggests that Malaysia’s innovation has improved comparatively among its peers, but to be in the select group of high-income countries, improvement of innovation will be necessary and the way to move forward.
The dynamic relationship between innovation and economic growth can be traced back to Schumpeter (1939), who argued that competition through innovation and education are important in ensuring economic growth; and these assumptions are supported by empirical studies (Aghion, Bloom, Blundell, Griffith, & Howitt, 2005). According to Schumpeter, innovation which manifest itself in the shape of investment is a driver of economic development. Investment, in turn, is driven by profit expectations. Thus, if a country wants to promote economic growth, then a country should find a way to turn on profit expectations of investment. Another strand of theoretical discussion is the endogenous growth model developed by Romer (1986), where the economic growth is endogenously determined and is influenced by agents’ decisions to maximise profits, taking into consideration aspects related to entrepreneurship by modelling the innovation process. In the endogenous growth literature, many models (Grossman & Helpman, 1991; Romer, 1990) illustrate the function of innovation as a growth engine, and government plays an important role in achieving an optimum level of innovation and R&D. The distinction between Schumpeterian models (Aghion & Howitt, 1992) and Romerian models rest on how they interpret innovation and what drives innovation (quality ladder vs product variety expansion).
This paper examines the effect of innovation on economic growth in Malaysia using time series analysis. According to Mc Morrow and Röger (2009), an economy’s agility to develop cutting edge technologies and adapt to a fast changing technological environment is crucial to its prospects of improving people’s welfare and creating economic prosperity. This study contributes to the literature in three important aspects. First, we utilise the total patent applications and total patent grants as innovation measurements which are both widely used in the literature. However, in this study, we postulate that the innovation measured by the quantity of total number of patent application is not a good choice for innovation proxy. Therefore, this study uses total patent granted which indirectly reveals the crucial impact of the quality innovation instead of total number of patent application which is more of quantity measurement, has shown robust significant impact on economic growth. Second, the autoregressive distributed lag (ARDL) model is applied to evaluate the effect of innovation on economic growth. The ARDL bounds testing methodology develop by Pesaran, Shin and Smith (2001) has few advantages over other cointegration testing. Apart from its effiency to handle the small sample size, the ARDL could estimate a mixture of order of integration, i.e. integration of level [I(0)] and first difference [I(1)]. The estimation uses a single-equation set-up which makes the estimation procedure less complicated. Another advantage is that the interpretation of each variable can be dedicated to different lag-lengths as they enter the model. Third, this study not only uses a linear ARDL model, but it also uses the quantile regression to observe information on the asymmetric and

116 Malaysian Journal of Economic Studies Vol. 57 No. 1, 2020
Siong Hook Law, Tamat Sarmidi and Lim Thye Goh
non-monotonic effects of the conditional variables on the dependent variable. It can capture the impact of rapid changes in innovation on the direction and magnitude of economic performance across different quantiles. Fourth, this study also compares the relative importance of foreign and local innovations in influencing economic growth. Last, this study also examines the role of institutional quality in mediating the effect of innovation-economic growth nexus.
The organisation of the study is as follows. Section 2 delves into the literature. Section 3 lays out the econometric estimation technique and the data sources. Section 4 focuses on the empirical results. Finally, Section 5 concludes.
2. Literature ReviewA well-documented literature among development economists suggests that inno-vation is the seed of productivity growth, hence, resulting in translating high level of innovation engagement to sustainable real GDP growth (Gill & Kharas, 2007; Pece, Simona, & Salisteanu, 2015; Pradhan, Arvin, & Bahmani, 2018). The vital role of innovation as a growth engine and the importance of achieving an optimum level of innovation and R&D to economic growth has its origin from Schumpeter (1939), Romer (1986 and 1990), Grossman and Helpman (1991) and empirically supported by Aghion et al. (2005).
Using recent data, Lee and Kim (2009) revisited the debate and empirically found that factors such as technology, tertiary education and institutions are a significant determinant to economic growth. Interestingly, technology and higher education have been conclusively affecting economic growth for the upper-middle-income and high-income countries, but not for the lower-middle- and low-income countries. On the same account, an economy characterised with good quality education at both secondary and tertiary level and have a high-tech product share in export goods demonstrate resilience in economic growth to any slowdown effect (Eichengreen, Park, & Shin, 2013). This finding highlights the importance of moving up the technology ladder and indicates that innovation-enhancing growth strategies should receive priority.
Innovation management system and market protection for new ideas are other aspects to be considered to enhance further the role of innovation to economic growth. In this regard, Jalles (2010) found that countries with a higher degree of intellectual property rights (IPR), which reflects market protection for new ideas, generally have a higher level of income per capita. Wu, Zhuo and Wu (2017) found that the national innovation system (NIS) has significantly promoted social entrepreneurial action and enhanced economic growth in China’s rural sectors. Hasan and Tucci (2010), on the other hand, stressed the importance of both the quantity (measured by total R&D expenditure) and quality of innovation (the ratio of patents granted in the United States as a proportion of total patents granted by the country) to economic growth. The study which analyses a sample of 58 countries covering 1980-2003 found that both the quantity and quality of inventive activities are associated with economic growth. The findings also demonstrate that those countries that have a high level of patenting, experience a concerted increase in economic growth.
Malaysian Journal of Economic Studies Vol. 57 No. 1, 2020 117
Impact of Innovation on Economic Growth: Evidence from Malaysia
With respect to the causality effect between innovation and economic growth, Galindo and Méndez (2014) analysed the feedback effects of a dynamic relationship among entrepreneurship, innovation and economic growth. They use entrepreneurial activity in 13 developed countries as a sample and the time period is from 2002 to 2007. Their empirical results based on panel data with fixed effects show that several factors, including monetary policy and social climate, have positive impacts on innovation and entrepreneurship. Furthermore, a bi-directional feedback effect is found from economic activity to entrepreneurship and innovation activities. This implies that there is a bi-directional feedback effect between innovation and economic activity.
In the case of high-income OECD countries, Guloglu and Tekin (2012) examined the causal relations among research and development (R&D) expenditures, innovation and economic growth using the panel vector autoregressive (VAR) model under the GMM and panel fixed effects framework. The study supports the endogenous growth theory where there is evidence of Granger causality from R&D expenditures to innovation, and technological innovations to economic growth. Interestingly, there is no evidence of reverse causality from economic growth to innovation; i.e. the rate of output growth Granger cause the technological change. The multivariate causality tests further confirm that both the market size and rate of innovation Granger cause R&D activity; while an increase in national output and R&D intensity jointly Granger-cause technological change. These empirical results depict that both the “technology-push” and “demand-pull” models of innovation are equally viable.
With regard to the roles of domestic innovation and foreign innovation in en-hancing economic growth, Yang (2006) found that both domestic patenting and world discoveries of ideas are significantly driving the economic growth in Taiwan. The finding confirms that both domestic innovation and foreign innovation activities are equally important in promoting economic growth. Schneider (2005), on the other hand, found that foreign technology has a more substantial impact on per capita gross domestic product (GDP) growth than domestic technology. The empirical analysis is conducted using a panel dataset of 47 developed and developing countries. He argued that the roles of domestic innovation and foreign innovation are country-specific, where a time series analysis is more relevant in addressing this issue than a panel data analysis. Nevertheless, Cameron (1998) pointed out that positive technology spillovers tend to benefit multinational firms more while limiting local firms. The study suggests that although technological advancement across countries is converging to world produc-tivity, the cathing up process is supposed to be slow, uncertain and require substantial domestic innovative effort.
Using 61 countries over the sample period from 2000 to 2011, Tan and Azman-Saini (2017) analysed the role of product market competition in accelerating the positive impact of foreign direct investment (FDI) on domestic research and development (R&D). The empirical results based on the panel generalized method of moments (GMM) demonstrate that FDI has a little direct effect on R&D expenditure. In other words, competition has a relatively moderate positive impact of FDI on domestic innovation. The finding is inconsistent with conventional wisdom regarding the merits of competition as evidence shows that competition undermines the effect of FDI on domestic innovation activities.

118 Malaysian Journal of Economic Studies Vol. 57 No. 1, 2020
Siong Hook Law, Tamat Sarmidi and Lim Thye Goh
In short, innovation level is a critical determinant of economic growth.2 Recently, the importance of innovation has been reinforced by both globalisation and advance-ment in information and communication technology which opened up new forms of competition and markets creation for innovative products and services. Nevertheless, a much more systematic approach that analyses the competition-growth nexus is still limited in the case of Malaysia. This study takes the first step in this direction.
3. Empirical Model, Methodology and the DataTo test the effect of innovation on economic growth, this study utilises the frameworks suggested by Mankiw, Romer and Weil (1992), Knight, Loayza and Villaneura (1993) and Law and Azman-Saini (2013). They applied the following Cobb–Douglas production function:
Yt = Ktα Ht
β (PtLt)1-α-β (1)
where Y is real GDP per capita, K is physical capital stock, H is human capital, L is labour, P is a labour-augmenting factor replicating the technological progress (innovation) and institutions effectiveness (institutional quality) in the economy and subscript t indicates time. Let’s say α + β < 1, this indicates that there are diminishing returns for all capital. Labour and labour-augmenting factor are assumed to progress based on the following functions:
Lt = L0ent (2)
Pt = P0egt+Vφ (3)
where n is exogenous rate of growth of the labour force, g is exogenous rate of techno-logical progress, V is a vector of institutions and government policies that could move the technology and efficiency levels in the economy, and φ is a vector of coefficients associated with these institutions and government policies variables.
In this context, the state of labour-augmenting technology (variable P) is subject to exogenous technological change, determined by g and on a country’s institutions and policy position namely corruption, law and order, bureaucratic quality, government stability, transparency and accountability. The technological change is stimulated by innovation such as on number of patents, number of grants, R&D, economic com-plexity and trade mark; and these innovations have a propensity for increasing the productive sector’s efficiency or increasing the productivity of investment. In the steady state, output per active worker (Y/PL) is constant while output per worker (Y/L) rises at the exogenous rate g (the exogenous element of the growth rate of the efficiency variable P).
In reduced form, the output per worker can be reorganised as follows:
RGDPCt = β0 + β1 INNOt + β2 INSt + β3 Kt + β4 HCt + β5 PGt + εt (4)
2 Aghion et al. (2005) investigated the relationship between product market competition and innovation. Using panel data, they found strong evidence of an inverted-U relationship between these variables.
Malaysian Journal of Economic Studies Vol. 57 No. 1, 2020 119
Impact of Innovation on Economic Growth: Evidence from Malaysia
To evaluate the role of institutions in innovation, this study includes the interaction term between innovation and institutions as follows:
RGDPCt = β0 + β1 INNOt + β2 INSt + β3 (INNOt x INSt) + β4 Kt + β5 HCt + β6 PGt + εt (5)
where β is the parameter to be estimated, RGDPC is real GDP per capita, INNO is innovation, INS is institutions, K is physical capital, HC is human capital, PG is population growth, and εt is an error term. If β1 is positive and significant, this demonstrates that innovation is an important determinant factor of economic performance. The remaining parameters namely β2, β3, β4 and β5 are also expected to be positive, which include the interaction term, institutions, physical capital and human capital, whereas the parameter of population growth (β6) is projected to be negative.
3.1 Econometric Estimation Methods
i) ARDL Linear Bounds Test and Level Relations
The autoregressive distributed lagged (ARDL) model assumes that the linear bounds test leads to the conclusion of long-run cointegration and there is no non-linear relationship. Thus, we can expressively estimate the long-run level relationship between the variables based on Pesaran et al. (2001) uniform lag length (p, p, p, p, p, p) as follows:
(6)
The same lag length is contingent on serial correlation or autocorrelation test (if there is a serial correlation problem, then the general to specific (GTS) procedure is employed to obtain different lag length (p, q, r, s, t, u). For example, if ARDL(1,1,1,1,1,1) is the optimal lagged model, then Equation (6) is as follows:
(7)
and the short-run error-correction model (ECM) equation is represented as follows:
(8)
RGDPC RGDPC INNO INSt 0 i t-ii=1
p
jj=0
p
t-j k t-kk=0
p= + + ∆ + ∆ +∑ ∑ ∑β β γ δ λll
l=0
p
t-lK∑ ∆ +
ϕ η θ θ θm t-mm=0
p
nn=0
p
t-n t-1 t-1 t-1HC PG RGDPC INNO INS∆ + ∆ + + + +∑ ∑ 0 1 2
θ θ θ3 4 5K HC PG et-1 t-1 t-1 t+ + +
RGDPC RGDPC INNO INNO INS INSt i t-1 t t-1 t t-1= + + + + + +µ β δ δ δ δ1 2 3 4
δ δ δ δ δ δ ε5 5 6 7 8 9K K HC HC PG PGt t-1 t t-1 t t-1 t+ + + + + +
∆ = + ∆ + ∆ + ∆∑ ∑ ∑RGDPC RGDPC INNO INSt 0 i t-ii=1
jj=0
t-j k t-kk=0
β β γ δp q r
++ ∆ +∑ηmm=0
t-mKs
θ τ φn t-nn=0
oo=1
t-o t-1 tHC PG Z e∆ + ∆ + +∑ ∑v w

120 Malaysian Journal of Economic Studies Vol. 57 No. 1, 2020
Siong Hook Law, Tamat Sarmidi and Lim Thye Goh
where zt-1 = (RGDPCt-1 – α0 – α1INNOt-1 – α2INSt-1 – α3Kt-1 – α4HCt-1 – α5PGt-1) or the error correction term (ECT) and the αs are the ordinary least squares (OLS) estimates of the αs in Equation (8). The φ in Equation (8) is the short-run equation that contains the ECT that evaluates the quickness of adjustment of the short-run deviation to long-run equilibrium. p, q, r, s, v and w are the optimal lagged lengths, selected using the Schwarz Bayesian criterion (SBC).
Based on the above ARDL(1,1,1,1,1,1) model, we can compute the long-run coefficients of the determinants:3
After getting the long-run equation, the error terms of the equation will be the error-correction term. The dependent variable for the short-run is changes (∆) of RGDPC, and all the independent variables as well as in all changes. The short-run equation can be formulated as follows:
(9)
ii) Quantile Regression
To evaluate for the nonlinearity in the relationship between the impact of innovation on economic performance, this study also uses a quantile regression to identify the effects under two dissimilar innovation indicators (Koenker, 2005; Koenker & Bassett, 1978). The purpose for selecting the nonlinear approach can be clarified by the spread of the innovation which is possible to capture using numerous quantiles. A quantile regression can disclose evidence on the unequal and non-linear results of the conditional variables on the dependent variable. In addition, it can detect the outcome of unforeseen changes in innovation on the signal and strength of economic performance across different quantiles. The regular linear regression procedures recap the average association between a set of independent variables (x) and the dependent variable (y) using the conditional mean function E(y|x). This offers merely a partial interpretation of the association, as this study analyses the association at dissimilar points in the conditional spreading of real GDP per capita, the quantile regression provides such capability in investigating the association between innovation and economic performance.
3 The long-run coefficients depend on the lag structure of the ARDL model; thus, different lags will yield different model specifications and derive different long-run elasticity equations.
𝜑𝜑𝐼𝐼𝐼𝐼𝐼𝐼𝐼𝐼 =𝛾𝛾1+𝛾𝛾21−𝛽𝛽𝑖𝑖
; 𝜑𝜑𝐼𝐼𝐼𝐼𝐼𝐼 =𝛿𝛿1+𝛿𝛿21−𝛽𝛽𝑖𝑖
; 𝜑𝜑𝐾𝐾 =1+21−𝛽𝛽𝑖𝑖
; 𝜑𝜑𝐻𝐻𝐻𝐻 =1+21−𝛽𝛽𝑖𝑖
; 𝜑𝜑𝑃𝑃𝑃𝑃 =1+21−𝛽𝛽𝑖𝑖
;
∆ = + ∆ + ∆ + ∆ +− − −
∑ ∑ ∑RGDPC RGDPC INNO INSt i ti=1
jj=0
t k tk=0
α α α αp q r1 1 1
ααmm=0
tKs−
∑ ∆ +1
α αn tn=0
oo=1
t t-1 tHC PG ECT e∆ + ∆ + +− −
∑ ∑v w1 1

Malaysian Journal of Economic Studies Vol. 57 No. 1, 2020 121
Impact of Innovation on Economic Growth: Evidence from Malaysia
3.2 Data
This study utilises yearly time series data spanning from 1985 to 2016 with 32 obser-vations.4 The sources of the data are from the World Development Indicators (WDI) and World Intellectual Property Organization (WIPO). The real gross domestic product (RGDP) per capita is obtained from the WDI in terms of US$ constant prices. Total patent applications and total number of grants are used as a measure of innovation following previous literature and these datasets are obtained from WIPO.
The physical capital stock is measured by using gross investment values based on the perpetual inventory method. Initial physical capital stocks are computed using the assumption that over long periods of time physical capital and output grow at the same rate. Following Hall and Jones (1999), a depreciation rate of 6% and the mean of economic growth rate of the initial 5 years are used to create the initial level of physical capital stock. Total population is used to measure the labour growth rate and human capital is proxied by life expectancy.
In this study, the institutions (INS) datasets utilised are from the International Country Risk Guide (ICRG) – which is a monthly publication of Political Risk Services (PRS). Based on Knack and Keefer’s (1995) study, five PRS indicators are used to compute the institutions, specifically: (i) corruption, (ii) law and order, (iii) government stability, (iv) bureaucratic quality, and (v) democracy and accountability. The first three sub-institutions variables are scaled from 0 to 6, whereas the last two variables are scaled from 0 to 4 and 0 to 12, respectively. These five institutions variables are re-scaled from 0 to 10, where higher values indicate better institutions and vice versa. The aggregate institutions variable is obtained by summing the five sub-indicators above, which shows that the scale ranges from 0 to 50. Several studies have used this dataset in their work, among others, Bekaert, Harvey and Lundblad (2005, 2006), Chong and Calderón (2000), Demetriades and Law (2006), and Law and Azman-Saini (2012).
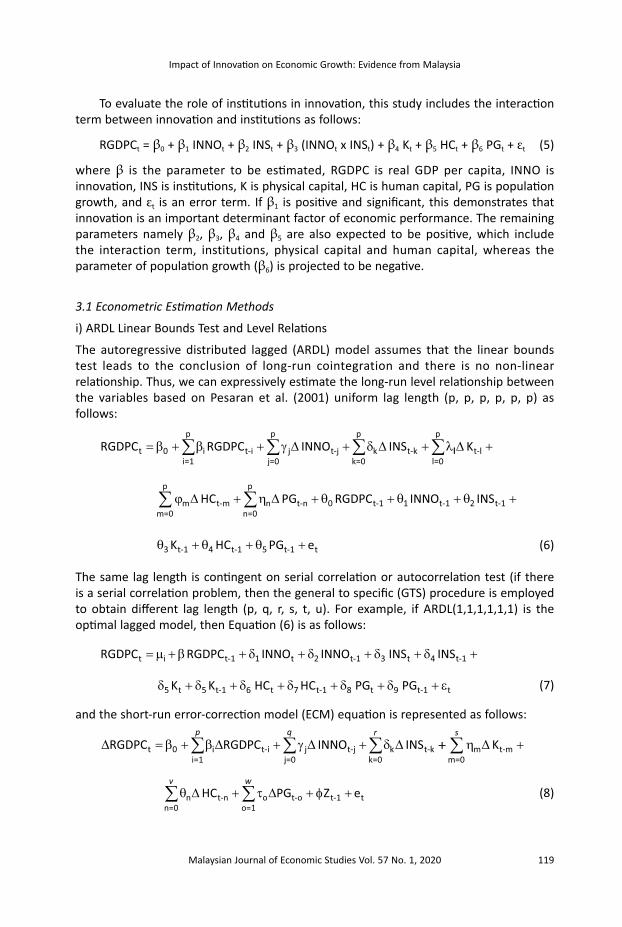
Tables 1 and 2 show the descriptive statistics and correlations of the variables. As shown in Table 2, the correlation demonstrates that real GDP per capita has a positive relationship with total patent application, total patent grants and institutions. Figure 2 presents the time series plots of the datasets used in the empirical analysis.
Table 1. Descriptive statistics
Unit of measurement Mean Std dev Min Max
Real GDP per capita Ringgit constant 2010 prices 7101.86 1998.88 3708.19 11031.82Total patent application % of 100000 labour force 4735.31 2011.52 262 7727Total grants % of 100000 labour force 2112.82 1646.06 132 6983Population growth Percent 2.86 0.36 1.70 3.54Human capital Number of years 72.64 1.60 69.48 75.30Physical capital % of GDP 27.96 7.42 20.57 43.58Institutions Scaled 0 – 50 29.95 2.91 25.14 36.32
4 The sample period stops at 2016 due to unavailability of data on institutions, total number of a patent application and total patent granted in the data sources.

122 Malaysian Journal of Economic Studies Vol. 57 No. 1, 2020
Siong Hook Law, Tamat Sarmidi and Lim Thye Goh
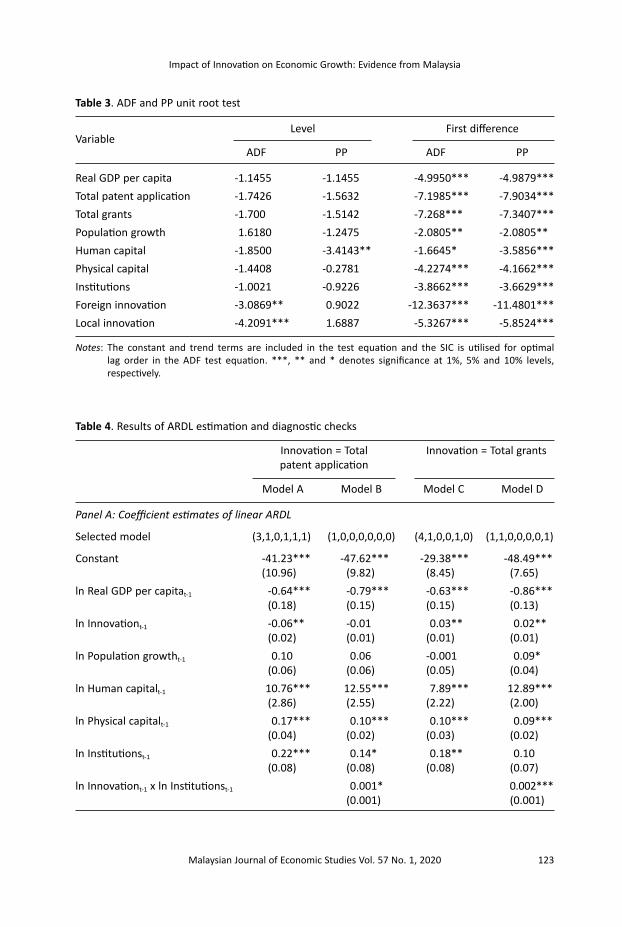
4. Empirical ResultsTable 3 presents the unit root tests based on the Augmented Dickey Fuller (ADF) and Philip Perron (PP) tests. The finding demonstrates that all variables are stationary at integrated order one or I(1). The result fulfils the ARDL bounds test criterion of no variable is integrated of order two or I(2).
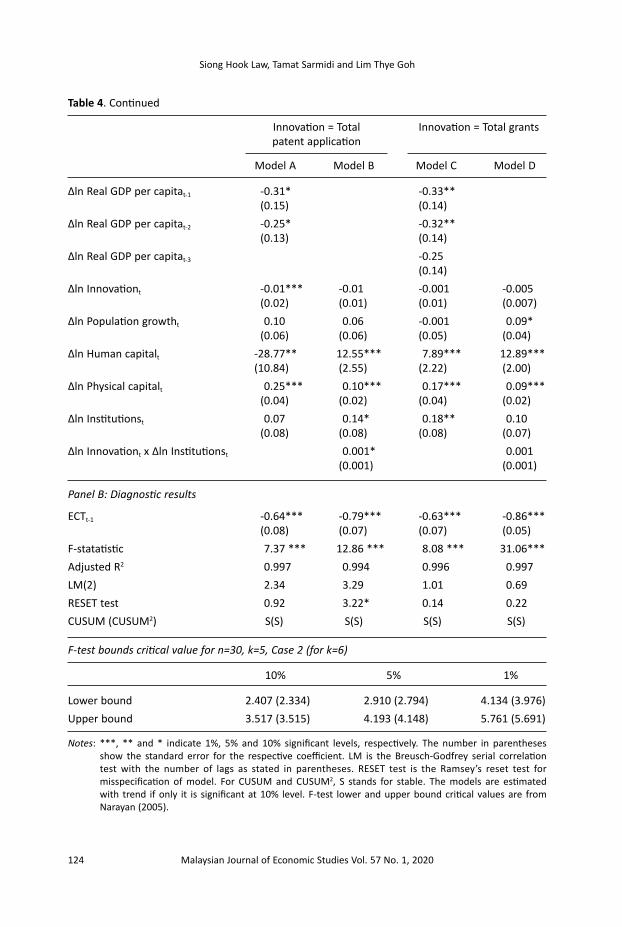
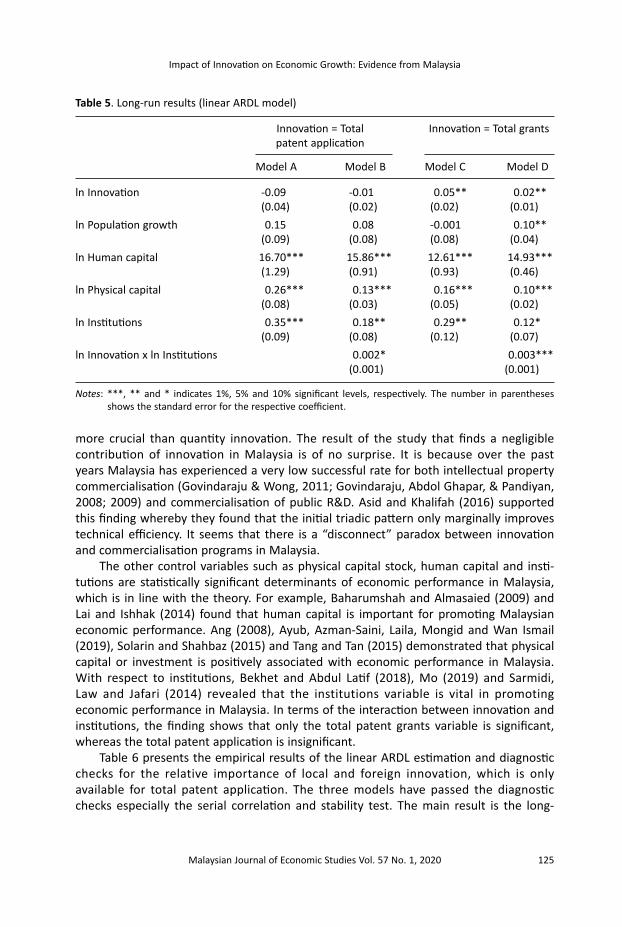
Table 4 presents the empirical results of the linear ARDL estimation and diagnostic checks using the SBC lagged length selection criterion. The four models have passed the diagnostic checks especially the serial correlation and stability test. The main result is the long-run estimation reported in Table 5, where innovation proxy by total patent application is insignificant, but the total patent grants variable is statistically a significant determinant of economic performance. This finding reveals that quality innovation is
Table 2. Correlations
Real GDP Total patent Total Population Human Physical Institutions per capita application grants growth capital capital
Real GDP per capita 1 Total patent application 0.8179 1 Total grants 0.5981 0.1755 1 Population growth -0.9081 -0.5929 0.1755 1 Human capital 0.9875 0.8326 0.8326 -0.8912 1 Physical capital -0.4764 -0.3289 -0.3289 0.4285 -0.5676 1 Institutions -0.0951 -0.0447 -0.0447 0.1158 -0.1637 0.5588 1
Figure 2. Innovations and real GDP per capita of Malaysia
0
2000
4000
6000
8000
10000
12000
050
100150200250300350400450500
1985
1986
1987
1988
1989
1990
1991
1992
1993
1994
1995
1996
1997
1998
1999
2000
2001
2002
2003
2004
2005
2006
2007
2008
2009
2010
2011
2012
2013
2014
2015
2016
LocalPatent ForeignPatent Grants GDPPC
Total number of innovations Real GDP per capita (US$)
Malaysian Journal of Economic Studies Vol. 57 No. 1, 2020 123
Impact of Innovation on Economic Growth: Evidence from Malaysia
Table 3. ADF and PP unit root test
Level First difference
ADF PP ADF PP
Real GDP per capita -1.1455 -1.1455 -4.9950*** -4.9879***Total patent application -1.7426 -1.5632 -7.1985*** -7.9034***Total grants -1.700 -1.5142 -7.268*** -7.3407***Population growth 1.6180 -1.2475 -2.0805** -2.0805**Human capital -1.8500 -3.4143** -1.6645* -3.5856***Physical capital -1.4408 -0.2781 -4.2274*** -4.1662***Institutions -1.0021 -0.9226 -3.8662*** -3.6629***Foreign innovation -3.0869** 0.9022 -12.3637*** -11.4801***Local innovation -4.2091*** 1.6887 -5.3267*** -5.8524***
Notes: The constant and trend terms are included in the test equation and the SIC is utilised for optimal lag order in the ADF test equation. ***, ** and * denotes significance at 1%, 5% and 10% levels, respectively.
Table 4. Results of ARDL estimation and diagnostic checks
Innovation = Total Innovation = Total grants patent application
Model A Model B Model C Model D
Panel A: Coefficient estimates of linear ARDL
Selected model (3,1,0,1,1,1) (1,0,0,0,0,0,0) (4,1,0,0,1,0) (1,1,0,0,0,0,1)
Constant -41.23*** -47.62*** -29.38*** -48.49*** (10.96) (9.82) (8.45) (7.65) ln Real GDP per capitat-1 -0.64*** -0.79*** -0.63*** -0.86*** (0.18) (0.15) (0.15) (0.13) ln Innovationt-1 -0.06** -0.01 0.03** 0.02** (0.02) (0.01) (0.01) (0.01)ln Population growtht-1 0.10 0.06 -0.001 0.09* (0.06) (0.06) (0.05) (0.04) ln Human capitalt-1 10.76*** 12.55*** 7.89*** 12.89*** (2.86) (2.55) (2.22) (2.00) ln Physical capitalt-1 0.17*** 0.10*** 0.10*** 0.09*** (0.04) (0.02) (0.03) (0.02) ln Institutionst-1 0.22*** 0.14* 0.18** 0.10 (0.08) (0.08) (0.08) (0.07)ln Innovationt-1 x ln Institutionst-1 0.001* 0.002*** (0.001) (0.001)
Variable
124 Malaysian Journal of Economic Studies Vol. 57 No. 1, 2020
Siong Hook Law, Tamat Sarmidi and Lim Thye Goh
Table 4. Continued
Innovation = Total Innovation = Total grants patent application
Model A Model B Model C Model D
∆ln Real GDP per capitat-1 -0.31* -0.33** (0.15) (0.14) ∆ln Real GDP per capitat-2 -0.25* -0.32** (0.13) (0.14) ∆ln Real GDP per capitat-3 -0.25 (0.14) ∆ln Innovationt -0.01*** -0.01 -0.001 -0.005 (0.02) (0.01) (0.01) (0.007)∆ln Population growtht 0.10 0.06 -0.001 0.09* (0.06) (0.06) (0.05) (0.04) ∆ln Human capitalt -28.77** 12.55*** 7.89*** 12.89*** (10.84) (2.55) (2.22) (2.00)∆ln Physical capitalt 0.25*** 0.10*** 0.17*** 0.09*** (0.04) (0.02) (0.04) (0.02)∆ln Institutionst 0.07 0.14* 0.18** 0.10 (0.08) (0.08) (0.08) (0.07)∆ln Innovationt x ∆ln Institutionst 0.001* 0.001 (0.001) (0.001) Panel B: Diagnostic results
ECTt-1 -0.64*** -0.79*** -0.63*** -0.86*** (0.08) (0.07) (0.07) (0.05) F-statatistic 7.37 *** 12.86 *** 8.08 *** 31.06***Adjusted R2 0.997 0.994 0.996 0.997LM(2) 2.34 3.29 1.01 0.69RESET test 0.92 3.22* 0.14 0.22CUSUM (CUSUM2) S(S) S(S) S(S) S(S) F-test bounds critical value for n=30, k=5, Case 2 (for k=6)
10% 5% 1%
Lower bound 2.407 (2.334) 2.910 (2.794) 4.134 (3.976)Upper bound 3.517 (3.515) 4.193 (4.148) 5.761 (5.691)
Notes: ***, ** and * indicate 1%, 5% and 10% significant levels, respectively. The number in parentheses show the standard error for the respective coefficient. LM is the Breusch-Godfrey serial correlation test with the number of lags as stated in parentheses. RESET test is the Ramsey’s reset test for misspecification of model. For CUSUM and CUSUM2, S stands for stable. The models are estimated with trend if only it is significant at 10% level. F-test lower and upper bound critical values are from Narayan (2005).
Malaysian Journal of Economic Studies Vol. 57 No. 1, 2020 125
Impact of Innovation on Economic Growth: Evidence from Malaysia
more crucial than quantity innovation. The result of the study that finds a negligible contribution of innovation in Malaysia is of no surprise. It is because over the past years Malaysia has experienced a very low successful rate for both intellectual property commercialisation (Govindaraju & Wong, 2011; Govindaraju, Abdol Ghapar, & Pandiyan, 2008; 2009) and commercialisation of public R&D. Asid and Khalifah (2016) supported this finding whereby they found that the initial triadic pattern only marginally improves technical efficiency. It seems that there is a “disconnect” paradox between innovation and commercialisation programs in Malaysia.
The other control variables such as physical capital stock, human capital and insti-tutions are statistically significant determinants of economic performance in Malaysia, which is in line with the theory. For example, Baharumshah and Almasaied (2009) and Lai and Ishhak (2014) found that human capital is important for promoting Malaysian economic performance. Ang (2008), Ayub, Azman-Saini, Laila, Mongid and Wan Ismail (2019), Solarin and Shahbaz (2015) and Tang and Tan (2015) demonstrated that physical capital or investment is positively associated with economic performance in Malaysia. With respect to institutions, Bekhet and Abdul Latif (2018), Mo (2019) and Sarmidi, Law and Jafari (2014) revealed that the institutions variable is vital in promoting economic performance in Malaysia. In terms of the interaction between innovation and institutions, the finding shows that only the total patent grants variable is significant, whereas the total patent application is insignificant.
Table 6 presents the empirical results of the linear ARDL estimation and diagnostic checks for the relative importance of local and foreign innovation, which is only available for total patent application. The three models have passed the diagnostic checks especially the serial correlation and stability test. The main result is the long-
Table 5. Long-run results (linear ARDL model)
Innovation = Total Innovation = Total grants patent application
Model A Model B Model C Model D
ln Innovation -0.09 -0.01 0.05** 0.02** (0.04) (0.02) (0.02) (0.01) ln Population growth 0.15 0.08 -0.001 0.10** (0.09) (0.08) (0.08) (0.04) ln Human capital 16.70*** 15.86*** 12.61*** 14.93*** (1.29) (0.91) (0.93) (0.46) ln Physical capital 0.26*** 0.13*** 0.16*** 0.10*** (0.08) (0.03) (0.05) (0.02) ln Institutions 0.35*** 0.18** 0.29** 0.12* (0.09) (0.08) (0.12) (0.07) ln Innovation x ln Institutions 0.002* 0.003*** (0.001) (0.001)
Notes: ***, ** and * indicates 1%, 5% and 10% significant levels, respectively. The number in parentheses shows the standard error for the respective coefficient.

126 Malaysian Journal of Economic Studies Vol. 57 No. 1, 2020
Siong Hook Law, Tamat Sarmidi and Lim Thye Goh
Table 6. Linear ARDL estimation results and diagnostic checks
Variable Model A Model B Model C
Panel A: Coefficient estimates of linear ARDL
Selected model (3, 1, 0, 1, 1, 1) (1, 0, 0, 0, 0, 0) (3, 1, 0, 0, 1, 1, 1)Constant -40.40 (10.73)*** -39.20 (11.28)*** -43.12 (12.17)***ln Real GDP per capitat-1 -0.65 (0.17)*** -0.72 (0.16)*** -0.66 (0.18)***ln Foreign innovationt-1 -0.05 (0.02)*** -0.05 (0.02)**ln Local innovationt-1 0.01 (0.02) -0.01 (0.02)ln Population growtht-1 0.09 (0.06) 0.05 (0.06) 0.10 (0.06)ln Human capitalt-1 10.58 (2.80)*** 10.41 (2.90)*** 11.23 (3.14)***ln Physical capitalt-1 0.17 (0.04)*** 0.10 (0.02)*** 0.17 (0.04)***ln Institutionst-1 0.21 (0.07)** 0.15 (0.08)* 0.23 (0.08)**∆ln Real GDP per capitat-1 -0.31 (0.14)** -0.30 (0.15)*∆ln Real GDP per capitat-2 -0.25 (0.12)* -0.23 (0.13)*∆ln Foreign innovationt -0.01 (0.02) -0.01 (0.02)∆ln Local innovationt 0.01 (0.02) -0.01 (0.02)∆ln Population growtht 0.09 (0.06) 0.05 (0.06) 0.10 (0.06)∆ln Human capitalt -31.71 (11.06)** 10.41 (2.90)*** -28.93 (12.53)**∆ln Physical capitalt 0.25 (0.04)*** 0.10 (0.02)*** 0.25 (0.04)***∆ln Institutionst 0.06 (0.08) 0.15 (0.08)* 0.08 (0.09) Panel B: Diagnostic results
ECTt-1 -0.65 (0.08)*** -0.72 (0.07)*** -0.66 (0.08)***F-statstistic 7.66*** 13.40*** 6.43***Adjusted R2 0.997 0.994 0.997LM(2) 2.15 1.63 3.87RESET test 1.01 3.88* 0.75CUSUM (CUSUM2) S(S) S(S) S(S) F-test bounds critical value for n=30, k=5, Case 2 (for k=6)
10% 5% 1%
Lower bound 2.407 (2.334) 2.91 (2.794) 4.134 (3.976)Upper bound 3.517 (3.515) 4.193 (4.148) 5.761 (5.691)
Notes: ***, ** and * indicate 1%, 5% and 10% significant levels, respectively. The number in parentheses shows the standard error for the respective coefficient. LM is the Breusch-Godfrey serial correlation test with the number of lags as stated in parentheses. RESET test is the Ramsey’s reset test for misspecification of model. For CUSUM and CUSUM2, S stands for stable. The models are estimated with trend if only it is significant at 10% level. F-test lower and upper bound critical values are from Narayan (2005).

Malaysian Journal of Economic Studies Vol. 57 No. 1, 2020 127
Impact of Innovation on Economic Growth: Evidence from Malaysia
run estimation reported in Table 7 which reveals that foreign innovation is a significant determinant of economic performance, whereas local innovation is insignificant. Again, our inclusion of both variables in the same model specification indicate that foreign innovation is significant, but not the local innovation.
Table 8 reports the quantile regression results and the finding shows that the effect of innovation (total patent grants) differs considerably, having a strong effect on economic performance at lower quantiles (10 percentile and 25 percentile). This empirical result demonstrates that the effect is much stronger at lower quantiles. Figure 3 presents the coefficient distributions of each variable; the total patent grants variable is diminishing the coefficients which is in line with the lower quantiles whereby the coefficients are significant. This result demonstrates that our innovation variable is not statistically significant as compared to literature in other developed countries (Ang, 2010; Laincz & Peretto, 2006). The institutions variable reveal that higher quantiles level of the coefficients have higher values which are consistent with the literature, where better institutions promote economic performance. The human capital variable also reveals the same pattern.
5. Conclusion Motivated by differences in innovation intensity across countries, this paper analyses an empirical investigation of the role of innovation in economic performance in Malaysia. Using the autoregressive distributed lag (ARDL) bounds test procedure, this study utilises an output per labour framework based on the notion of economic performance capacity. The time series data is from 1985 to 2016. The empirical results indicate that total patents granted that measures the quality of innovation is a statistically significant determinant of economic performance, which implies that quality innovation is more vital compared to quantity innovation. In terms of local and foreign innovations, the foreign innovation has a greater impact on economic performance. With respect to the roles of institutions in the innovation–economic growth nexus, the result reveals that institutions are crucial in accelerating the effect of innovation on economic performance.
Table 7. Long-run results (linear ARDL model) of relative importance of local and foreign innovations
Variable Model A Model B Model C
ln Foreign innovation 0.078 (0.03)** – 0.072 (0.04)**ln Local innovation – 0.023 (0.03) -0.021 (0.03)ln Population growth 0.14 (0.08) 0.07 (0.07) 0.15 (0.08)*ln Human capital 16.16 (1.01)*** 14.42 (1.37)*** 17.04 (2.01)***ln Physical capital 0.26 (0.08)*** 0.14 (0.04)*** 0.25 (0.08)***ln Institutions 0.33 (0.08)*** 0.20 (0.09)** 0.35 (0.10)***
Notes: ***, ** and * indicate 1%, 5% and 10% significant levels, respectively. The number in parentheses shows the standard error for the respective coefficient.

128 Malaysian Journal of Economic Studies Vol. 57 No. 1, 2020
Siong Hook Law, Tamat Sarmidi and Lim Thye Goh
Table 8. Results of quantile regression
Real GDP per capita Coefficient Bootstrap t-stat p-value standard error
Q10 Total grants 0.0002 9.41E-05 2.03* 0.053Institutions 0.0050 0.0041 1.22 0.233Population growth 0.0362 0.1165 0.31 0.759Human capital 14.731 0.7266 20.27*** 0.000Physical capital 0.0984 0.0318 3.09*** 0.005Constant -54.866 -3.3299 16.48*** 0.000 Q25 Total grants 0.0002 9.71E-05 2.07** 0.049Institutions 0.0038 0.0035 1.08 0.290Population growth 0.0352 0.1219 0.29 0.775Human capital 14.6149 0.7901 18.5*** 0.000Physical capital 0.1167 0.0388 3.00*** 0.006Constant -54.389 -3.6071 15.08*** 0.000 Q50 Total grants 0.0002 0.0001 1.67 0.107Institutions 0.0074 0.0024 3.03*** 0.005Population growth 0.1722 0.0893 1.93* 0.065Human capital 15.547 0.5361 29.00*** 0.000Physical capital 0.1253 0.0219 5.71*** 0.000Constant -58.645 -2.4318 24.12*** 0.000 Q75 Total grants 0.0001 0.0001 1.29 0.210Institutions 0.0078 0.0028 2.78*** 0.010Population growth 0.0919 0.0984 0.93 0.359Human capital 15.018 0.5534 27.13*** 0.000Physical capital 0.1430 0.0314 4.55*** 0.000Constant -56.346 -2.4678 22.83*** 0.000 Q90 Total grants 0.0001 0.0002 0.47 0.641Institutions 0.0097 0.0046 2.1** 0.046Population growth 0.1327 0.1473 0.9 0.376Human capital 15.471 0.8063 19.19*** 0.000Physical capital 0.1075 0.0535 2.01* 0.055Constant -58.252 -3.5521 16.4*** 0.000
Note: ***, ** and * denote significance at 1%, 5% and 10% levels, respectively.

Malaysian Journal of Economic Studies Vol. 57 No. 1, 2020 129
Impact of Innovation on Economic Growth: Evidence from Malaysia
Figure 3. Quantile regression graph (the graphs show the estimates of the slope coefficients in the x-axis against the quantiles of economic performance in the y-axis)
In industry 4.0 era, technological advancement and digitisation are two important pillars for a competitive economy. Malaysia has to strategically ensure that the innovation of new technologies is adequate to drive a sustainable and inclusive economy. To achieve these aims, first, our study suggests the imperative of having new stock of novel ideas. We are producing a shallow level of innovation as compared to other countries. Second, the quality of innovation should be of prime importance. A number of new ideas alone may not significantly impact the economic performance.
The current study shows that inadequacy of innovative technology flow over the long term has a detrimental effect on innovative capacity. Premium institutional quality is of utmost priority and urgency. Our study confirms that institutional quality acceler-ates the innovation impact on economic performance. Any move that could shape better institutional quality including improvement of human capital, reduction in the digital literacy gap, innovation tax incentive, and higher quality of networking are vital.
ReferencesAghion, P., Bloom, N., Blundell, R., Griffith, R., & Howitt, P. (2005). Competition and innovation:
An inverted-U relationship. Quarterly Journal of Economics, 120(2), 701-728. https://doi.org/https://doi.org/10.1093/qje/120.2.701
Aghion, P., & Howitt, P. (1992). A model of growth through creative destruction. Econometrica, 60(2), 323-351. https://doi.org/10.2307/2951599

130 Malaysian Journal of Economic Studies Vol. 57 No. 1, 2020
Siong Hook Law, Tamat Sarmidi and Lim Thye Goh
Ang, J.B. (2008). What are the mechanisms linking financial development and economic growth in Malaysia? Economic Modelling, 25(1), 38-53. https://doi.org/10.1016/j.econmod.2007.04.006
Ang, J.B. (2010). Financial reforms, patent protection, and knowledge accumulation in India. World Development, 38(8), 1070-1081. https://doi.org/10.1016/j.worlddev.2009.12.011
Asid, R., & Khalifah, N.A. (2016). The effects of foreign R&D and triadic patent propensity on developing economies efficiency and convergence. Jurnal Ekonomi Malaysia, 50(2), 107-204. https://doi.org/10.17576/JEM-2016-5002-09
Ayub, M., W.N.W. Azman-Saini, Laila, N., Mongid, A. & Wan Ismail. W.Z. (2019). Foreign direct investment and economic growth: The role of democracy. International Journal of Economics and Management, 13(2), 481-493.
Baharumshah, A.Z., & Almasaied, S.W. (2009). Foreign direct investment and economic growth in Malaysia: Interactions with human capital and financial deepening. Emerging Markets Finance and Trade, 45(1), 90-102. https://doi.org/10.2753/REE1540-496X450106
Bekaert, G., Harvey, C.R., & Lundblad, C.T. (2005). Does financial liberalization spur growth? Journal of Financial Economics, 77(1), 3-55. https://doi.org/10.1016/j.jfineco.2004.05.007
Bekaert, G., Harvey, C.R., & Lundblad, C.T. (2006). Growth volatility and financial liberalization. Journal of International Money and Finance, 25(3), 370-403. https://doi.org/10.1016/j.jimonfin.2006.01.003
Bekhet, H.A., & Abdul Latif, N.W. (2018). The impact of technological innovation and governance institution quality on Malaysia’s sustainable growth: Evidence from a dynamic relationship. Technology in Society, 54(August), 27-40. https://doi.org/10.1016/j.techsoc.2018.01.014
Cameron, G. (1998). Innovation and growth: A survey of empirical evidence (Working paper). Oxford, UK: Nuffield College.
Chong, A., & Calderón, C. (2000). Institutional quality and income distribution. Economic Develop-ment and Cultural Change, 48(4), 761-786. https://doi.org/10.1086/452476
Demetriades, P., & Law, S.H. (2006). Finance, institutions and economic development. Interna-tional Journal of Finance & Economics, 11(3), 245-260. https://doi.org/10.1002/ijfe.296
Eichengreen, B., Park, D., & Shin, K. (2013). Growth slowdowns redux: New evidence on the middle-income trap (NBER Working Paper No. 18673). Cambridge, MA: National Bureau of Economic Research. https://doi.org/10.3386/w18673
Galindo, M.Á., & Méndez, M.T. (2014). Entrepreneurship, economic growth, and innovation: Are feedback effects at work? Journal of Business Research, 67(5), 825-829. https://doi.org/10.1016/j.jbusres.2013.11.052
Gill, I., & Kharas, H. (2007). An East Asian renaissance: Ideas for economic growth. Washington, DC: World Bank.
Govindaraju, V.G.R. Chandran, & Wong C.Y. (2011). Patenting activities by developing countries: The case of Malaysia. World Patent Information, 33(1), 51-57. https://doi.org/10.1016/j.wpi.2010.01.001
Govindaraju, V.G.R. Chandran, Abdol Ghapar, F., & Pandiyan, V. (2008). The commercialization of research results among researchers in public universities and research institutions. Asian Profile, 36(3), 235-250.
Govindaraju, V.G.R. Chandran, Abdol Ghapar, F., & Pandiyan, V. (2009). The role of collaboration, market and intellectual property rights awareness in university technology commercial-ization. International Journal of Innovation and Technology Management, 6(4), 363-378. https://doi.org/10.1142/S0219877009001674
Grossman, G.M., & Helpman, E. (1991). Innovation and growth in the global economy. Cambridge, MA: MIT Press.
Guloglu, B., & Tekin, R.B. (2012). A panel causality analysis of the relationship among research and development, innovation, and economic growth in high-income OECD countries. Eurasian Economic Review, 2(1), 32-47. https://doi.org/10.14208/BF03353831

Malaysian Journal of Economic Studies Vol. 57 No. 1, 2020 131
Impact of Innovation on Economic Growth: Evidence from Malaysia
Hasan, I., & Tucci, C.L. (2010). The innovation–economic growth nexus: Global evidence. Research Policy, 39(10), 1264-1276. https://doi.org/10.1016/j.respol.2010.07.005
Hall, R.E., & Jones, C.I. (1999). Why do some countries produce so much more output per worker than others? Quarterly Journal of Economics, 114(1), 83-116. https://doi.org/10.3386/w6564
Jalles, T.J. (2010). How to measure innovation? New evidence of the technology growth linkage. Research in Economics, 64(2), 81-96. https://doi.org/10.1016/j.rie.2009.10.007
Knack, S., & Keefer, P. (1995). Institutions and economic performance: Cross-country tests using alternative institutional measures. Economics & Politics, 7(3), 207-227. https://doi.org/10.1111/j.1468-0343.1995.tb00111.x
Knight, M.D., Loayza, N., & Villanueva, D. (1993). Testing the neoclassical theory of eco-nomic growth: A panel data approach. IMF Staff Papers, 40(3), 512-541. https://doi.org/10.2307/3867446
Koenker, R. (2005). Quantile regression. Cambridge, UK: Cambridge University Press. https://doi.org/10.1017/CBO9780511754098
Koenker, R., & Bassett, G. (1978). Regression quantiles. Econometrica, 46(1), 33-50. https://doi.org/10.2307/1913643
Lai, W.S., & Ishak, Y. (2014). Human capital accumulation and economic growth in Malaysia – Investigating the long-run nexus. Jurnal Ekonomi Malaysia, 48(1), 155-165. https://doi.org/10.17576/JEM-2014-4801-13
Laincz, C., & Peretto, P. (2006). Scale effects in endogenous growth theory: An error of aggregation, not specification. Journal of Economic Growth, 11(3), 263-288. https://doi.org/10.1007/s10887-006-9004-9
Law, S.H., & Azman-Saini, W.N.W. (2012). Institutional quality, governance and financial develop-ment. Economics of Governance, 13(3), 217-236. https://doi.org/10.1007/s10101-012-0112-z
Law, S.H., & Azman-Saini, W.N.W. (2013). Capital account liberalization and economic per-formance in Malaysia. Singapore Economic Review, 58(3). https://doi.org/10.1142/S0217590813500227
Lee, K., & Kim, B. (2009). Both institutions and policies matter but differently for different income groups of countries: Determinants of long-run economic growth revisited. World Development, 37(3), 533-549. https://doi.org/10.1016/j.worlddev.2008.07.004
Mankiw, N.G., Romer, D., & Weil, D.N. (1992). A contribution to the empirics of economic growth. Quarterly Journal of Economics, 107(2), 407-437. https://doi.org/10.2307/2118477
Mo, P.H. (2019). Institutions’ complementarity and coevolution. Malaysian Journal of Economic Studies, 55(1), 133-150. https://doi.org/10.22452/MJES.vol55no1.8
Mc Morrow, K., & Röger, W. (2009). R&D capital and economic growth: The empirical evidence. EIB Papers, 4(1), 94-118.
Narayan, P.K. (2005). The saving and investment nexus for China: Evidence from cointegration tests. Applied Economics, 37(17), 1979-1990. https://doi.org/10.1080/00036840500278103
Pece, A.M., Simona, O.E.O., & Salisteanu, F. (2015). Innovation and economic growth: An empir-ical analysis for CEE countries. Procedia Economics and Finance, 26, 461-467. https://doi.org/10.1016/S2212-5671(15)00874-6
Pesaran, M.H., Shin, Y., & Smith, R.J. (2001). Bounds testing approaches to the analysis of level relationships. Journal of Applied Econometrics, 16(3), 289-326. https://doi.org/10.1002/jae.616
Pradhan, R.P., Arvin, M.B., & Bahmani, S. (2018). Are innovation and financial development causative factors in economic growth? Evidence from a panel granger causality test. Technological Forecasting & Social Change, 132(C), 130-142. https://doi.org/10.1016/j.techfore.2018.01.024
Romer, P.M. (1986). Increasing returns and long-run growth. Journal of Political Economy, 94(5), 1002-1037. https://doi.org/10.1086/261420
132 Malaysian Journal of Economic Studies Vol. 57 No. 1, 2020
Siong Hook Law, Tamat Sarmidi and Lim Thye Goh
Romer, P.M. (1990). Endogenous technological change. Journal of Political Economy, 98(5), S71-S102. https://doi.org/10.1086/261725
Sarmidi, T., Law, S.H., & Jafari, Y. (2014). Resource curse: New evidence on the role of institutions. International Economic Journal, 28(1), 191-206. https://doi.org/10.1080/10168737.2013.787110
Schumpeter, J.A. (1939). Business cycles: A theoretical, historical and satistical analysis of the capitalist process. New York, NY: McGraw-Hill.
Schneider, F. (2005). Shadow economies around the world: What do we really know? European Journal of Political Economy, 21(3), 598-642. https://doi.org/10.1016/j.ejpoleco.2004.10.002
Solarin, S.A., & Shahbaz, M. (2015). Natural gas consumption and economic growth: The role of foreign direct investment, capital formation and trade openness in Malaysia. Renewable and Sustainable Energy Reviews, 42(February), 835-845. https://doi.org/10.1016/j.rser.2014.10.075
Tan, B.-Y., & Azman-Saini, W.N.W. (2017). Foreign direct investment and research & development activity: The role of competition. International Journal of Economics and Management, 11(2), 467-482.
Tang, C.F., & Tan, E.C. (2015). Does tourism effectively stimulate Malaysia’s economic growth? Tourism Management, 46(February), 158-163. https://doi.org/10.1016/j.tourman.2014.06.020
Wu, J., Zhuo, S., & Wu, Z. (2017). National innovation system, social entrepreneurship, and rural economic growth in China. Technological Forecasting and Social Change, 121(August), 238-250. https://doi.org/10.1016/j.techfore.2016.10.014
Yang, C.-H. (2006). Is innovation the story of Taiwan’s economic growth? Journal of Asian Economics, 17(5), 867-878. https://doi.org/10.1016/j.asieco.2006.08.007