impact of information technology governance structures on
TRANSCRIPT

IMPACT OF INFORMATION TECHNOLOGY GOVERNANCE STRUCTURES
ON STRATEGIC ALIGNMENT
by
Fitzroy R. Gordon
APIWAN BORN, PhD, Faculty Mentor and Chair
SUZANNE RICHINS, DHA, Committee Member
AKWASI AMPOFO, DBA, Committee Member
Susan Talley, EdD, Dean of Technology, School of Business and Technology
A Dissertation Presented in Partial Fulfillment
Of the Requirements for the Degree
Doctor of Philosophy
Capella University
December 2012

© Fitzroy Gordon, 2012

Abstract
This dissertation is a study of the relationship between Information Technology (IT)
strategic alignment and IT governance structure within the organization. This dissertation
replicates Asante (2010) among a different population where the prior results continue to
hold, the non-experimental approach explored two research questions but include two
moderating variables industry type and organization size. The model used in this study
was Luftman (2003) Strategic Alignment Model (SAM) which was validated through
previous research. This research used web-based surveys to collect the data from multiple
organizations which include IT executives and managers, and addresses the missing link
between IT governance and strategic alignment of different industries. The sampling
frame were about 3000 business professionals from medium and large sized companies in
the United States of which 138 responded in the time allotted for data collection. The
study tested four hypotheses which were measured using statistical correlation including
Kruskal-Wallis one-way analysis of variance (ANOVA), Mann-Whitney U test and
logistics regression. The study finds that there is not significant relationship between IT
strategic alignment and levels of IT governance structure and federal IT governance
structure within the organization.

ii
Dedication
I dedicate this dissertation to my family. First, I would like to say thank you to my wife
Nickeshia, who toiled with me during those long nights, weeks and months in getting the
dissertation to completion. Second, to my four children Abigaille, Aaron, Alec-Raive, Antoinne
who sacrificed and tolerated daddy during this period, Third, my Mom, who continued to
encourage me during this period. Fourth, to my mother-in-law and sister-in-law who
continuously rooted for me during my period of stress and pressure. Finally, my dad who knew I
started this journey, but passed away. But most importantly my Lord and savior Jesus Christ for
giving me the strength to continue even when I was down and almost out.

iii
Acknowledgments
I would like to acknowledge a few people who made this dissertation possible. Special
thanks to my mentor Dr. Apiwan Born, my mentor and chair, with her help, wisdom and patience
made this dissertation to be a wonderful learning experience. To my committee members Dr.
Suzanne Richins who made herself available to guide and identify areas for improvements and
Dr. Akwasi Ampofo who mentored me through the early stages of my dissertation and present
himself as a valuable resource during my time of need. I really appreciate the help of my doctoral
advisors and the Capella dissertation support team.
I am really thankful and humbled by ISACA, who allowed members of the association to
take part in this research, without their inputs this would not have been possible.
Finally, I want to acknowledge my beautiful and supportive wife Nickeshia who was a
valuable critic in this dissertation process, to my sister-in-law, Taneshia who assisted with the
editing of my proposal and took the time to read and gave valuable feedback on the chapters and
Abigaille my daughter who assisted dad with data analysis.

iv
Table of Contents
Acknowledgments iii
List of Tables viii
List of Figures x
CHAPTER 1. INTRODUCTION 1
Introduction to the Problem 1
Background of the Study 3
Statement of the Problem 5
Purpose of the Study 6
Rationale 7
Research Questions 8
Significance of the Study 10
Definition of Terms 11
Assumptions and Limitations 13
Nature of the Study 14
Organization of the Remainder of the Study 15
CHAPTER 2. LITERATURE REVIEW 17
Introduction to the Literature 17
Information Technology Governance Research 18
Information Technology Governance Theories 20
Information Technology Governance (Structures) 22
Information Technology Governance Archetypes 25
Methodology for Researching IT Governance and IT-Business Alignment 29

v
Recent IT Governance implementations studies 32
IT Strategic Alignment 34
Maturity Models 37
Information Technology Governance Frameworks (Processes) 41
Information Security Role in IT Governance 44
Information Technology Governance Security Regulations 45
Discussion 55
Literature Review Summary 56
CHAPTER 3. METHODOLOGY 58
Purpose of the Study 58
Research Question and Hypotheses 59
Conceptual Framework 61
Instrumentation 62
Operationalization of variables 62
Independent Variable 62
Dependent Variables 63
Moderating Variable 64
Demographics Questions 66
Research Design 68
Appropriateness of design 69
Survey Design 70
Population and Sample 71
Sample Size 72

vi
Validity and Reliability 72
Data Collection Procedures 73
Data Analysis 73
Assumptions and Limitations 75
Ethical Considerations 76
Summary 77
CHAPTER 4. RESULTS 78
Introduction 78
Data Coding 78
Descriptive Statistics 79
Data Analysis and Results 88
Moderating Hypotheses 91
Summary 98
CHAPTER 5. DISCUSSION, IMPLICATIONS, RECOMMENDATIONS 100
Introduction 100
Discussion of Results 101
Theoretical Implications 105
Practical Implications 105
Limitations and Assumptions 106
Recommendation for Future Research 106
Conclusions 107
REFERENCES 109
APPENDIX A. RESEARCH INSTRUMENT 117

vii
APPENDIX B. ADDITIONAL FREQUENCY STATISTICS 135
APPENDIX C. SURVEY RESPONSE FREQUENCY 138

viii
List of Tables
Table 1. Primary Sources and Key Ideas by Stream. 21
Table 2. IT Governance Structural Tradeoffs and the best of both 24
Table 3. The potential decision making patterns of governance performance using
the Weill and Ross archetypes 27
Table 4. Sample IT committee structures that govern the enterprise 28
Table 5. Maturity Model Summary Definition and Descriptions: An executive view
of IT Governance 39
Table 6. Maturity attribute table. 40
Table 7. Recent laws and regulations in the U.S. 46
Table 8. IT Governance Structures 62
Table 9. IT-Business alignment 64
Table 10. Moderating variable measuring Industry Type 65
Table 11. Moderating variable measuring Organization size 66
Table 12. Operationalized constructs 67
Table 13. Relationship between the Research Hypotheses and the Survey Question 67
Table 14. Summary of the questionnaire from the instrument 71
Table 15. Frequencies and Percentages for Demographics- Reporting relations 80
Table 16. Frequencies and Percentages for Demographics-IT organization (Structure) 81
Table 17. Frequencies and Percentages for hierarchical distance from the CEO 81
Table 18. Frequencies and Percentages for department 82
Table 19. Frequencies and Percentages for Age 83
Table 20. Frequencies and Percentages for Educational level 83

ix
Table 21. Frequencies and Percentages for Career level 84
Table 22. Frequencies and Percentages for Industry 85
Table 23. Frequencies and Percentages for Years of industry experience 86
Table 24. Frequencies and Percentages for Number of Employees 87
Table 25. Frequencies and Percentages for Number of IT employees 88
Table 26. Means and Standard Deviations for Revenues and IT Budget as a
Percentage of Revenues 89
Table 27. How is IT organized in your company? 89
Table 28. Kruskal-Wallis Test on IT Business Strategic Alignment by IT
Governance Structure 90
Table 29. Mann-Whitney U Test for IT Business Strategic Alignment by
Federal IT Governance Structure 92
Table 30. Ordinal Regression with IT Governance Structure and Industry
Type predicting IT-Business Maturity Level 94
Table 31. The demonstrated contribution that the IT function has made to the organization‟s
strategic goals. 95
Table 32. Ordinal Regression with IT Governance Structure and Organization
size predicting IT-Business Maturity Level 98
Table 33. Summary of Research Hypotheses 100

x
List of Figures
Figure 1. Conceptual Model for IT governance Independent and dependent variables 15
Figure 2. The stakeholder value as main driver for IT governance 22
Figure 3. Current IT Governance Structures decision making span 25
Figure 4. IT governance collaborations: continuous alignment and re-iterations of
processes from a decision making standpoint 29
Figure 5. Information security process in the ITIL framework 44
Figure 6. InfoSec Architecture (ISA) 45
Figure 8.Conceptual Model for IT governance independent and dependent variables 61

1
CHAPTER 1. INTRODUCTION
Introduction to the Problem
Recently, new legislation relating to governance and the benefits promised from
implementation of such legislations, are high on the agenda of many corporate boards (De Haes
& Grembergen, 2008). Information Technology (IT) governance is now attracting board level
attention (Guldentops, 2004; Ward & Peppard, 2002; Kacperczyk 2009). As the role of IT
expands, its visibility is elevated and the planning and management of information technologies
are increasingly integrated into all organizational planning. Damianides (2005) supports this
claim by emphasizing that “90 percent of corporate board members are regularly informed about
IT issues, two thirds of the same boards approve IT strategy, but only 10 percent make an inquiry
about IT” (p.80).
Moreover, Guldentops (2004) states, “with IT being so pervasive in the business
environment and so critical for the success and survival of enterprises” (p.2), greater focus is
now placed on the planning and implementation of IT across organizations. Key developments in
the body of literature suggest that implementation of an IT governance framework now
frequently play an important role in establishing and maintaining the organizations goals and
objectives. In achieving these objectives participation of leadership and keen management
attention to processes will ensure success (Damianides, 2005).
According to Robinson (2005), IT governance supports three main objectives: “(a)
regulatory and legal compliance, (b) operational excellence, and (c) optimal risk management”
(p.93). Robinson also stated that poor IT performance is commonly the result of failed IT
projects, poor budget management, poor time management and return on investment (ROI).

2
Consequently, the need for any type of governance is evident if organizations are to function
optimally by establishing transparency and accountability.
The term IT governance as described by Loh and Venkatraman (1992), outlined the
mechanisms used to ensure the enablement of the business by necessary IT function capabilities
as a strategic alignment between technology and the business where a resulting increased value is
achieved for the business. De Haes and Grembergen (2007) posits that the Alignment include an
iterative process for decisions relating to “goals, processes, people, business and technology”
(p.37). But despite these clear and specific descriptions, an extensive use of the term IT
governance emerged with multiple meanings in the late 1990‟s when Brown (1997) popularized
the term. As a result of the increased use of the term IT governance, information technology
relationships and methods to do business made a fundamental change to how business processes
and business engagement approach threats that affect the organization both internally and
externally. Additionally, for IT governance to be effective, the decision makers must consider the
right mix of IT security experts and business managers with a comprehensive view of
organization risk appetite.
The IT Governance Institute (2003) purports that “IT governance is designed to give this
perspective and to provide decision makers with a cost-effective approach to address information
security related business risks”. IT governance in itself embodies risk management and the
protection of information assets, and also falls under the ownership of the board of directors and
executives.
Rockart, Earl, and Ross (1996) submit that for an organization to have a successful track
record in IT, it must pursue to have a good business relationship with all business units. IT
activities infiltrate different areas of the organization such as personnel departments and research

3
and development offices, so as to ensure business and technology partnership. Furthermore,
because of this increase expectation of success IT executives are considering strategic alignment
more carefully. To support Rockart‟s idea Damianides (2005) states, “It is an integral part of
enterprise governance and consists of leadership and organizational structures and processes that
ensure that the organization‟s IT sustains and extends the organization‟s strategies and
objectives” (p.80).
Grembergen (2002) emphasized, “IT governance is a combination of factors including
leadership, structure, and processes that ensure that the organization achieves integration of
business and IT” (p.20). The focus of the study will be on the structure element of IT
governance. As an integral element of corporate structure, understanding how IT governance
structure can function optimally is of keen interest to practitioners and scholars alike. To date,
there is little available guidance in the literature, and this study will provide foundational insight
into the workings of IT governance to contribute to the body of knowledge.
This research will explore the relationship between IT governance structure and IT-
business strategic alignment in organizations. The research also take into consideration how
recent legislations such as Sarbanes Oxley (SOX) 2002 and Control Objectives for Information
Technology and related technology (COBIT), has impacted the recent implementation of IT
governance in organizations.
Background of the Study
The relationship that exists between IT governance structures and IT strategic alignment
is important to achieve the goals of organizations (IT Governance Institute, 2003). Research
done by BJorne-Andersen (2010) revealed that IT governance structure comes in two forms,
namely, IT Governance Institute model and a model submitted by Weill and Ross (2004) which

4
introduced IT governance archetypes. The IT governance model according to ITGI (2006)
simply states (a) Strategic alignment between business and IT, (b) Value generation from IT to
business, (c) Management of the IT- resources, (d) Management of risks, security and rules
(e)Performance monitoring of IT-function while the Weill and Ross model states (a) IT
principles, (b) IT architecture (c) IT infrastructure (d) Business Application Needs (e) IT
investment prioritization.
Peterson (2004) also identified that IT governance structure includes the distribution of
IT decision-making rights among different parties in the organization and these IT decision-
making rights include business alignment with IT through IT governance structures, and the
organizations maturity level (Luftman, 2003). Furthermore, IT governance ensures that different
stakeholders work together in a synergistic way to make sure that the benefits of any IT
implementation will be maximized throughout the different business units and a strategic
alignment with the business should then permeate each level of the organization (De Haes &
Grembergen, 2005).
Previous research from seminal and recent IT governance authors provides a background
into the literature. The use of the term IT governance became prevalent in the 1990s and prior to
this, researchers and practitioners used terms such as “IT decision making” (Boynton, Jacobs, &
Zmud,1992; Loh & Venkatraman, 1992), IS organizational structure (Simson, 1995).
Information technology principles (Kayworth & Sambamurthy, 2000), and IT decision making
(Boynton et al., 1992), to describe IT governance structures. With the failures and successes of
implementation of Governance structures and the formalization and achievement of enhanced IT
strategic alignment, researchers such as Grembergen, De Haes and Guldentops (2004), Weill and
Ross (2005) have cited these prominent researchers in subsequent IT governance literature.

5
Well-known features and use of the term, however, was made by the Brown (1997), and
Sambamurthy and Zmud (1999) articles where the term “IT governance framework” was initially
used.
Similiarly, the evolution of IT governance structures has been highlighted in recent
literature. Green (2007) states that “in order to implement IT governance effectively, a holistic
approach needs to be adopted” (p.44). This argument was also supported by Weill (2004). Weill
and Ross (2005) then extended the original structure of centralized, decentralized and federal to
include IT governance archetypes such as business manager monarchy, IT monarchy, feudal,
federal, IT duopoly, and anarchy. Despite these research, studies and applications of IT
governance, notable authors have discussed the inconsistent application of IT governance to
achieve IT strategic alignment (Reich & Benbasat, 1996; Grembergen, 2003) and to date the
literature does not specifically address the relationship between IT strategic alignment processes
and IT governance structures.
Statement of the Problem
Over the past two decades researchers have been contributing varied versions of IT
governance structural arrangements. The bulk of these researches on IT governance have focused
primarily on structural planning, such as differences between centralized, decentralized and
federal governance structures. However, these researchers did not exploit the relationships that
exist between IT governance structure and the levels of IT strategic alignment (Brown & Magill,
1994; Peterson, 2004).
Researchers during this period, who advocated for hybrid governance structures have
since then introduced an extended version of the governance hierarchy (Weill & Ross, 2004;
Weill & Ross, 2005). Authors such as Ko and Fink (2010) submit that IT governance is a fairly

6
new research domain. Brown and Grant (2005) admit that exploration and research is
“incomplete and encourage academics and practitioners alike” to do further research to find a
suitable mechanism to govern IT decisions.
However, Peterson (2004) states that despite the initial existence of IT governance
activities, there still exists the need to measure the relationship between IT governance and IT
strategic alignment. The extant literature did not take into account factors such as maturity levels
of the firm which are understandably reasonable nominal measurements. This research seek to
resolve the problem of how a firm‟s maturity level and IT governance structure impacts IT
strategic alignment by including the moderators industry type and organization size.
Purpose of the Study
The purpose of this quantitative correlation study was to test the extent to which IT
strategic alignment relates to the IT governance structure and federal IT governance structure
within the organization. Further analysis also measured the degree of the impact between these
variables.
The independent variable IT governance structure was defined as a combination of
factors including leadership, structure and processes that ensures that IT governance achieves
integration of business and IT (Grembergen, 2002). The dependent variable IT strategic
alignment was defined as the “combined engagement of all IT units‟ strategic, plans processes,
investments and decision to support the overall functionality and purpose of the organization
goals and objectives” (Khadem, 2007) , and the control and intervening variable include
centralized, decentralized and federal governance structures that contributes to IT planning and
decision making through various committees such as the IT governance, steering and standard
committees.
7
The researcher believes that with the inclusion of Luftman (2003) strategic alignment
model (SAM), which is the basis of this research, organizations will demonstrate improvements
in strategic alignment of the business and functions in IT. This study then explored selected IT
firms made up of business and IT professionals who make decisions regarding the organization
and therefore provide a point of reference for further research and business applications.
Rationale
Research shows that organizations with effective IT governance structures tend to have
better performance by directing, controlling, and coordinating IT activities (Sambamurthy &
Zmud, 1999). A review of the literature shows that inadequate research has been conducted to
address the IT governance structures and maturity models within organizations, and how the
knowledge of IT governance structure and alignment may impact a firm‟s strategic alignment
(Brown & Magill, 2004; Ko & Fink, 2010). The extant literature also revealed IT governance is
an important component of organizational IT capability, and organizations found to generate
substantial returns on IT investments have implemented effective IT governance structures
(Weill & Ross, 2004). According to Weill and Ross (2004), IT investment is now greater than
4.2% of annual revenue and represents 50% of total annual capital investment in many
organizations. As a result, few organizations are now addressing this issue by modifying or
implementing IT governance structures that will focus on IT spending as a strategic priority. This
research will therefore extract and explore data that impact IT strategic alignment based on the
IT governance structure employed, using a maturity model in selected organizations within the
U.S.
Miller (2006) asserts that organizations must measure their current states by assessing not
only their capabilities but also their requirements such as compliance demands and service-level

8
agreements through an IT governance framework. Furthermore, Weill and Ross (2004) suggest
that effective IT governance structures enable some organization to outperform others because
effective governance structures encourage appropriate IT behaviors. With this in mind, this
research provided meaningful data that will impact researchers and businesses alike on the effect
of IT governance on IT strategic alignment through this quantitative study.
Research Questions
In reviewing the literature, it is observed that there exists a gap between IT governance
structures and IT alignment models with varying maturity levels within organizations. According
to Reich and Benbasat (2000) there are organizations that are not aware of factors that contribute
to the alignment of IT functions and because of them not being aware, this in turn affects their
level of alignment. However, this ultimately lead into disorganized units because of a lack of
alignment between business units and information technology (IT) strategy that cause an increase
in operation costs and erosion of the organization‟s competitive advantage (Sage, 2006). The
intent of this dissertation is to examine and test the effects of these relationships. The primary
questions proposed are:
Research Question 1: What type of relationship exists between IT governance structure
and IT-business strategic alignment?
IT governance speaks to the organizations capacity as a unit to specify decision making
rights within the firm to encourage desirable behavior (Weill & Ross, 2004). IT governance has a
combination of factors including leadership, structure and processes that ensures that IT
governance achieves integration of business and IT (Grembergen, 2002). Ko and Fink (2010)
states, “IT governance structure is the single most important predictor of whether an organization

9
will derive value from IT” (p. 664). There are three basic forms of this governance structure,
centralized, decentralized and federal. The following research will expound on these structures.
H10: There is no relationship between IT governance structure and IT-business strategic
alignment.
H1a: There is a positive relationship between IT governance structure and IT-business
strategic alignment.
Research Question 2: What type of relationship exists between federal IT governance structure
and IT-business strategic alignment?
According to Luftman (2003), the federal governance structure is combination of
centralized and decentralized models. Asante (2010) also submitted that the federal mode is the
process where central corporate management makes decision through an IT unit regarding
central systems while the functional unit decides the authority and responsibility regarding
resources.The research questions developed will seek to identify the relationship between each
factor, and the survey instrument will be delivered to the appropriate IT professionals based on
the target population.
The research hypotheses and null hypotheses for the second question are:
H20: There is no relationship between federal IT governance structure and IT-business
strategic alignment.
H2a: There is a positive relationship between federal IT governance structure and IT-
businessstrategic alignment.
In addition to these hypotheses, contributing variables will be studied to discover the
relationship between, industry types, organization size. These hypotheses are:

10
H30: The relationship between IT governance structure and IT-business maturity level
remains the same regardless of industry type.
H3a: The relationship between IT governance structure and IT-business maturity level
varies by industry type.
H40: The relationship between IT governance structure and IT-business maturity level
remains the same regardless of organization size.
H4a: The relationship between IT governance structure and IT-business
maturity level varies by organization size.
Significance of the Study
The significance of this study is to contribute to the literature how a firm‟s IT strategic
alignment is related to the firm‟s IT governance structures by testing the hypotheses of the
relationship between the variables. The study also investigates relationships associated with
industry type and organizations size and how this affect different decision making structures
within the organization. Hirschheim and Sabherwal (2001) research underlined the importance to
note that a shift and increased interest has been placed on IS alignment mainly because, not only
does the IS unit succeed but the organization succeed also.
Nevertheless, sufficient research are not available to indicate an achievement and
sustenance of alignment over a period of time, and consequently, which industries are more
likely to adapt to changes as organizations enter virtual or cloud computing and extensive
technological awareness (Hirschheim & Sabherwal, 2001). Therefore emphasis in these factors
was enhanced by replicating Asante (2010) study by including maturity level as a variable to IT
strategic alignment. Furthermore, an analysis of the findings presented to researchers and U.S
industries the relationship that can be revealed between IT strategic alignment and IT

11
governance. The most significant observation is that Asante (2010) research which also uses
Luftman (2003) instrument will demonstrate that strategic alignment is not a one-time
occurrence but a process of continuing refinement that include some adjustment and
transformation of business processes.
Definition of Terms
Chief executive officer. The Chief executive officer (CEO) is the highest ranking
executive in the organization who oversees the operation of the entire organization. In
educational organizations the CEO will be equivalent to the President of the institution
(Lance,2006)
Chief information officer. The Chief information officer (CIO) is the highest ranking
executive with the responsibility for Information and related technology in the organization. He
oversees the information technology and technology infrastructure of the organization (Lance,
2006)
Control objectives for information technology and related technology. Control objectives
for information technology and related technology (COBIT) was originally released as an IT
process and control framework linking IT to business requirements. It is an open standard for
control over IT and is an independent framework of the underlying technologies within an
organization. “COBIT is maintained and refreshed on a four-year cycle by the IT Governance
Institute” (ITGI, 2006).
Information technology. Information technology (IT) is the structure and backbone of
computer and related technologies, these include, hardware, software and data related
infrastructure within the organization.

12
Information technology infrastructure library. Information technology infrastructure
library (ITIL) sets a formal standard for service management and service delivery. The ITGI
(2004) defines ITIL as “the level of alignment between IT services and actual business needs”.
They also posit that “The core operational processes of IT service management are described
within the two ITIL publications of Service Support and Service Delivery” (ITGI, 2004).
IT governance. According to Peterson (2004), IT governance (ITG) “is the distribution of
IT decision-making rights and responsibilities among different stakeholders in the enterprise”
(p.20), ITG also establish processes and mechanism for the oversight of IT strategic decisions.
(Peterson, 2004). In other words, IT governance is the mechanism to ensure that organizational
strategic processes in place sustains and extends the organizations goals and objectives.
IT governance structure. This is the combination of factors including leadership,
structure and processes that ensures that ITG integration of both business and IT is achievable.
(Grembergen, 2002). Organizations choose from a set IT governance structures or archetypes
including the “basic centralized, decentralized or federal IT governance structures” (Weill &
Ross, 2005).
IT strategic alignment. This is a combination of activities that encompasses each IT unit
activity within the enterprise including processes and investment decisions that enables the
organization goals and objectives (Khadem, 2007). Chan and Reich (2007) define this as a
systemic execution and integration of the organizations business needs with its IT resources.
Sarbanes-Oxley act. Sarbanes-Oxley Act (SOX) constitutes a legal framework regarding
the mandatory disclosure of public companies large or small in how they conduct business,
including retention of records in the interest of the shareholders and customers (ITGI, 2006).

13
Strategic alignment maturity. Strategic alignment maturity (SAM) is a continual process
where an organization IT, business processes and governance within all departments are
effectively merged to achieve the organizations goals and objectives (Luftman, 2003). For an
organization to sustain a high alignment maturity, the organization must be able to operate and
assess its communications, competence, value measurements, governance, partnerships,
technology and skills (Luftman & Kempaiah, 2007).
Assumptions and Limitations
The problem put forward assumes that practitioners are willing to divulge information to
the researcher and the questions submitted will be answered truthfully and completely. It is also
assumed that practitioners will respond to the questions in a timely manner to ensure the research
is current and is addressing its audience appropriately. It is further assumed that the selected
instrument for this study is valid, reliable, and appropriate to the study‟s focus.
To narrow the focus of the study, a few selected industries were used along with selected
areas of the industry. This research direct their attentions to firms that implement IT governance
processes and include CIO, executives and professionals who are part of the decision are making
process in the implementation of IT governance within the organization. This researcher also
includes those professionals who are in a non-managerial role from both IT and business but who
contribute adequately to the research. The target population was from the private and public
sector workers who had the requisite qualification to give a more accurate assessment.
Given this narrow focus, the results of this study cannot be expected to generalize to
other industries or populations. Another limitation is the fact that some participants do not have
the full understanding of IT governance frameworks, and therefore they may not be able to
complete study‟s questionnaires, which will result in lower response rates for some questions.
14
Nature of the Study
The research will use a correlative quantitative analysis using a non-experimental
approach to answer the research question. Non-experimental studies follow a process of
understanding relationships or the correlation between variables (Swanson & Holton, 2005;
Creswell, 2003; Creswell, 2007). The research will be designed to conduct web-based surveys in
collecting the data from multiple organizations which include IT executives and managers, and
will address the missing link between IT governance and strategic alignment of different
industries, thus making it exploratory. Independent and dependent variables will be measured
using an existing instrument. According to Swanson and Holton (2005), quantitative study is a
research approach that often starts with a developed theory that leads to hypothesis, specific
statistical testing and strict analysis. Creswell (2003) added that a “quantitative research often
exemplifies experimental or non-experimental strategy of inquiry that often follows a pre and
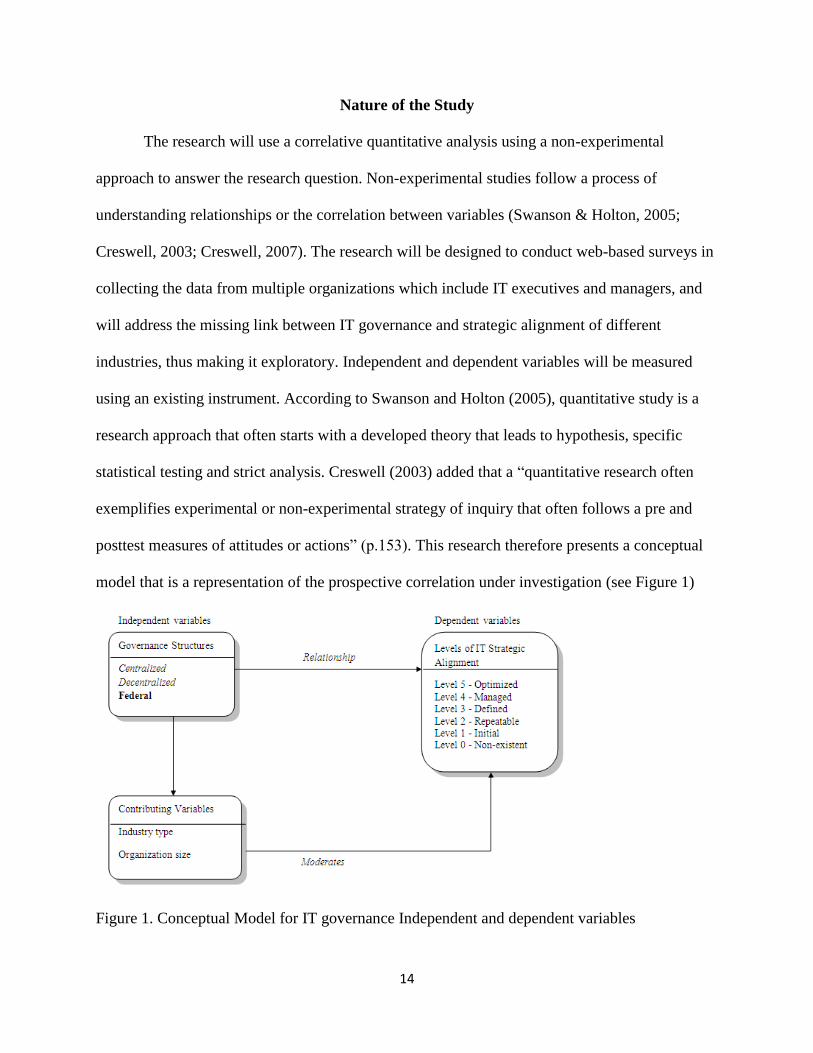
posttest measures of attitudes or actions” (p.153). This research therefore presents a conceptual
model that is a representation of the prospective correlation under investigation (see Figure 1)
Figure 1. Conceptual Model for IT governance Independent and dependent variables

15
The emphasis of this study is to substantiate the relationships that exist between IT
governance and levels of IT Strategic Alignment as presented in Asante (2010) study. The two
primary hypotheses that was used, is similar in nature to the original Asante (2010) study and
measures IT-business strategic alignment levels. In addition, two hypotheses were added that is
relevant to the study that will measure industry type and organizations size. The sampling group
will be CEOs, CIOs, business executives and professionals who are in a non-managerial role
from both IT and business but can contribute adequately to this research. The distribution of the
instrument was a similar method as in the original study, and was distributed to members of the
IT Governance Institute and by way of the institute‟s research online portal. The research goals
were to elicit information relating to the effectiveness of IT and business communication,
measurement of the competency and value of IT, Governance, Partnership, Scope & architecture
of the IT infrastructure and skills.
Organization of the Remainder of the Study
This consists of five chapters: Chapter 1 provided an overview of the study including an
introduction to the problem and, relevant background. The research questions were presented and
the nature of the study was discussed, as well as the limitations and assumptions that will
undergird the study. A statement of significance was provided and relevant terminology was
defined. Chapter 2 presents a detailed review of the literature. The role of information
technology in contemporary business settings is discussed in relation to IT governance, maturity
level, and the relationship to the strategic alignment of IT. A detailed explanation of the research
methodology is presented in chapter 3. The variables for the study are presented in conjunction
with the guiding hypotheses.

16
The instrument is also discussed in detail and the strategies for data collection and
analysis are presented. Protection for human subjects is also assured. Chapter 4 presented
findings and results, and chapter 5 presented the discussion, implications, and recommendations.

17
CHAPTER 2. LITERATURE REVIEW
Introduction to the Literature
This review covers research relating to the phenomenon of Information Technology (IT)
governance usage and IT strategic alignment based on a maturity model. Luftman and Brier
(1999) strategic alignment theory suggests that the harmonious synergy between business and IT
to achieve business strategy and objectives. The term IT governance became prevalent in the
1990s, prior to this, researchers and practitioners used the terms “IT decision making” (Boynton,
Jacobs and Zmud, 1992), and computer system control (Garrity, 1963).The literature focal point
was on existing and past streams of research that converge to give a practical explanation to the
varying use and effective strategic alignment styles of organizations (Weill & Ross, 2004).
Luftman (2003) identified six factors, “communications, competency or value of IT, governance,
partnerships, scope and architecture and finally, the skills of the human resources involved”
(p.10), to demonstrate the strategic alignment model (SAM). The research used the
aforementioned factors to help determine ways to help organizations improve from their present
states to one of mature strategic IT-Business alignment (Lance, 2006).
De Haes and Grembergen (2008) as revealed by Luftman and Rajkumark (2007) in a
recent publication agreed that alignment is vital to an effective implementation of IT governance
and that its success is hinged on convergence, harmony, integration, link and synchronization.
Weill and Ross (2004) in their literature also revealed that IT governance is tied in with strategic
alignment and an organizations return on investment (ROI).
This research will look on two frameworks based on review of literature; first, the Weill
and Ross (2004) Governance areas for decision making:
IT principles
18
IT architecture
IT infrastructure
Business application needs
IT investment prioritization
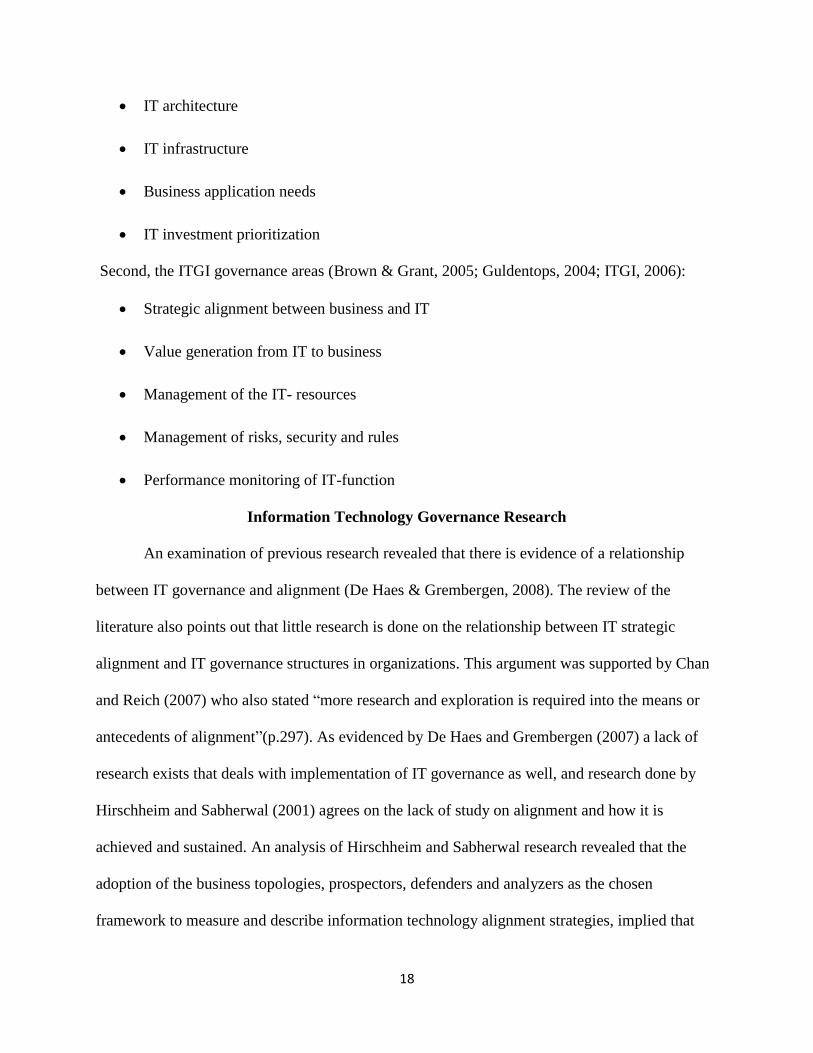
Second, the ITGI governance areas (Brown & Grant, 2005; Guldentops, 2004; ITGI, 2006):
Strategic alignment between business and IT
Value generation from IT to business
Management of the IT- resources
Management of risks, security and rules
Performance monitoring of IT-function
Information Technology Governance Research
An examination of previous research revealed that there is evidence of a relationship
between IT governance and alignment (De Haes & Grembergen, 2008). The review of the
literature also points out that little research is done on the relationship between IT strategic
alignment and IT governance structures in organizations. This argument was supported by Chan
and Reich (2007) who also stated “more research and exploration is required into the means or
antecedents of alignment”(p.297). As evidenced by De Haes and Grembergen (2007) a lack of
research exists that deals with implementation of IT governance as well, and research done by
Hirschheim and Sabherwal (2001) agrees on the lack of study on alignment and how it is
achieved and sustained. An analysis of Hirschheim and Sabherwal research revealed that the
adoption of the business topologies, prospectors, defenders and analyzers as the chosen
framework to measure and describe information technology alignment strategies, implied that

19
these measures fit an aligned behavior, but according to Das, Zahra, and Warkentin, (1991) this
explanation is unsatisfactory and they reasoned that IS strategy are measured by results while
business practices are process oriented. These business topologies are described as:
1. Prospectors. These organizations entrepreneurial problems include finding new market
opportunities. The prospectors organizations are considered innovative in their operations
and are more decentralized in their administrative responsibilities.
2. Defenders. These organizations function best in stable markets. Hence faced with the
problem of maintaining a stable market share. They are specialists in their area and are
centralized in their administrative responsibilities.
3. Analyzers. These organizations collaborates among different departments, this is done by
keeping a balance exploiting new markets while maintaining their existing market share.
They maintain a balance between prospector and defender.
Weill and Ross (2004) provided a simple definition to capture the essence and simplicity
of its meaning, “Specifying the decision rights and accountability framework to encourage
desirable behavior in the use of IT” (p. 8). Webb et al. (2006) gave a similar definition of IT
governance, by stating that “IT governance is the strategic alignment of IT with the business,
such that maximum business value is achieved through the development of effective IT control,
accountability, and risk management”. Muller (2009) stated that although little research exists
that is specific to measuring how IT governance impact the different attributes of IT strategic
alignment, executives of organizations are still pushing IT governance to the forefront of
business decisions. Similar research by Guldentops (2004) posits that framework including
Control Objectives for Information and Related Technologies (COBIT) and Information
20
Technology Infrastructure Library (ITIL) assist in the implementation of IT governance and will
enforce a clear set of goals and directions.
The implementation of IT governance can be affected by a variety decision-making
activities, and the combination of these activities is aligned to ensure that the enterprise
streamline the rules, procedures and process that ensures strategic alignment through the
governance structures. (Huang, 2006; Weill & Ross, 2004; Brown & Grant, 2005). This
alignment according to (Weill, 2004) “encourages desirable behavior in the use of IT” (p.3).
Information Technology Governance Theories
Information Technology units within organization are challenged constantly to produce
and be efficient with additional responsibilities and expanding statutory and legal requirements
while fasting constraints in their budgets. One of the opportunity organizations have in reducing
costs is to go through on action of standardization of processes. Information technology
governance is put in perspective when factors that affect governance structures are classified into
categories (Agarwal & Sambamurthy, 2002; Boddy et al., 2005). IT governance follow two
streams of research, the first focused on single factor such as firm size, and secondly research
using the principles of contingency theory to identify a grouping of factors that impact IT
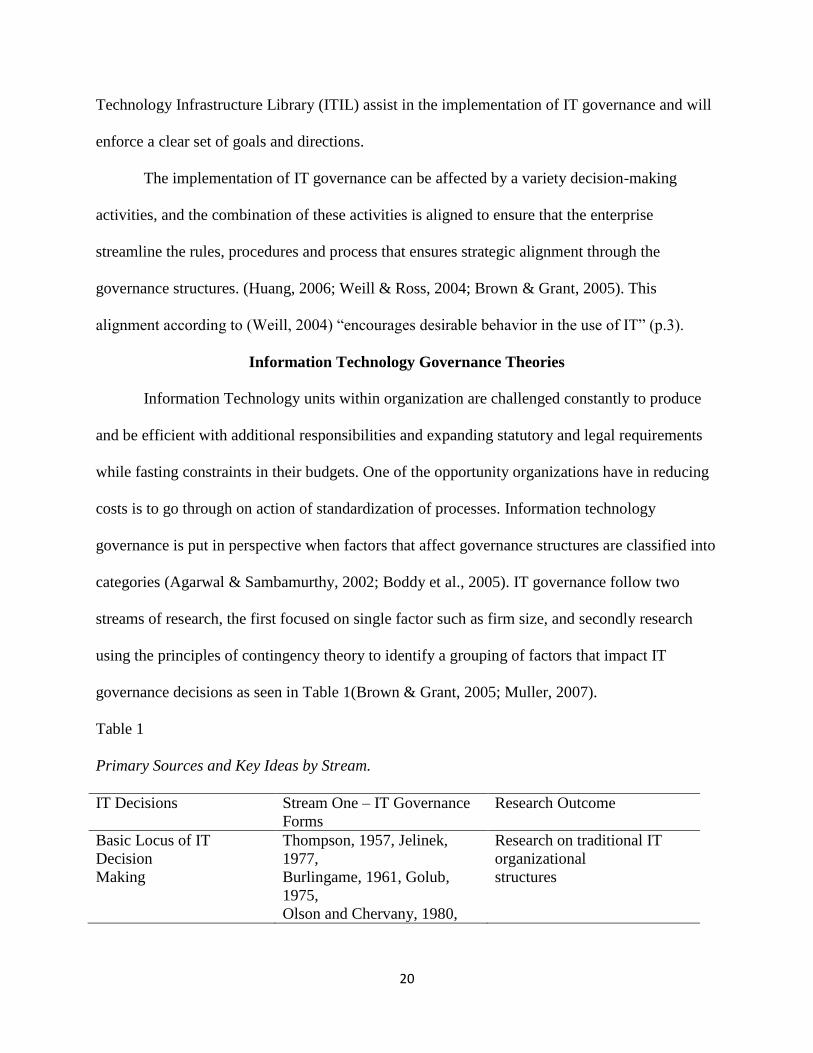
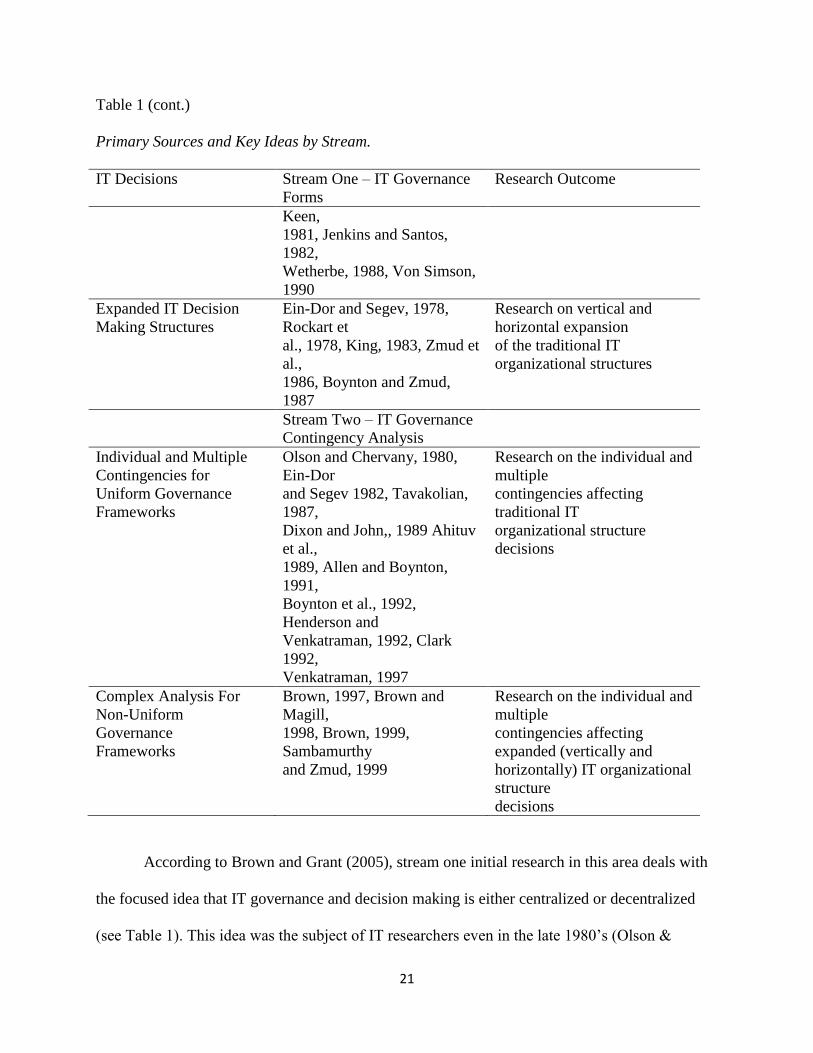
governance decisions as seen in Table 1(Brown & Grant, 2005; Muller, 2007).
Table 1
Primary Sources and Key Ideas by Stream.
IT Decisions Stream One – IT Governance
Forms
Research Outcome
Basic Locus of IT
Decision
Making
Thompson, 1957, Jelinek,
1977,
Burlingame, 1961, Golub,
1975,
Olson and Chervany, 1980,
Research on traditional IT
organizational
structures
21
Table 1 (cont.)
Primary Sources and Key Ideas by Stream.
IT Decisions Stream One – IT Governance
Forms
Research Outcome
Keen,
1981, Jenkins and Santos,
1982,
Wetherbe, 1988, Von Simson,
1990
Expanded IT Decision
Making Structures
Ein-Dor and Segev, 1978,
Rockart et
al., 1978, King, 1983, Zmud et
al.,
1986, Boynton and Zmud,
1987
Research on vertical and
horizontal expansion
of the traditional IT
organizational structures
Stream Two – IT Governance
Contingency Analysis
Individual and Multiple
Contingencies for
Uniform Governance
Frameworks
Olson and Chervany, 1980,
Ein-Dor
and Segev 1982, Tavakolian,
1987,
Dixon and John,, 1989 Ahituv
et al.,
1989, Allen and Boynton,
1991,
Boynton et al., 1992,
Henderson and
Venkatraman, 1992, Clark
1992,
Venkatraman, 1997
Research on the individual and
multiple
contingencies affecting
traditional IT
organizational structure
decisions
Complex Analysis For
Non-Uniform
Governance
Frameworks
Brown, 1997, Brown and
Magill,
1998, Brown, 1999,
Sambamurthy
and Zmud, 1999
Research on the individual and
multiple
contingencies affecting
expanded (vertically and
horizontally) IT organizational
structure
decisions
According to Brown and Grant (2005), stream one initial research in this area deals with
the focused idea that IT governance and decision making is either centralized or decentralized
(see Table 1). This idea was the subject of IT researchers even in the late 1980‟s (Olson &

22
Chervany, 1980). On the other hand, authors such as Brown & Magill (1994) put to rest this
singularity of IT governance research and discussed a second stream of contingency that focuses
on the why and how of IT governance establishment in the firm. The multiple contingency
theories as described by Brown and Grant came up with multiple proposals that “include
organizational structure, business strategy, industry and firm size” (p.697), to determine an
appropriate setting for decision making.
Ideally, effective IT governance can be seen to be the most constant predictor of the value
the organization gets from IT. As shown in Figure 2, the IT Governance Institute identify five
main areas of focus that are driven by stakeholders value namely, strategic alignment, resource
management and performance management these are considered drivers and the other two areas
which are value delivery and risk management are called outcomes.
Figure 2.The stakeholder value as main driver for IT governance
Information Technology Governance Structures
The notion of decision-making responsibilities evolved from a series of independent
assessments and choices within the different business-units of the enterprise, to an expansion of

23
multilateral and multidimensional decision-making (Huang, 2006). Boynton and Zmud (1987)
explored some of the basic governance structures being centralized or decentralized decision
making. Each of these structures have their own advantages and disadvantages, and as Boynton
and Zmud explain, the functional operation of the enterprise necessitates “providing centralized
direction and coordination while recognizing the value of increased discretion regarding IT
decision making on the part of managers throughout the organization” (p.61).
Within the centralized decision-making structure economies of scale becomes a direct
focus, and a primary IT unit sets, mandates and have decision making authority for the
infrastructure, architecture while setting standards for the organization wide business units; but at
times ignore the freedom of these units and may increase frustration because of added
bureaucracies (Huang, 2006; Luftman, 2003). Within the decentralized decision-making
structure customer customization and faster integration of changed processes is the main focus.
This structure assumes authority for their IT infrastructure (Peterson, 2004), but on the other
hand cause duplication and fragment IT products and services because of a multiple operation of
units doing the same processes (Huang, 2006).
An extension of these structures also include an hybrid combination of both decision loci
that address the varied array of IT decision types that is made in an organization by Brown
(1997). This hybrid decision called a federal mode and proposed by Zmud, Boynton and Jacobs
(1986) was used to combine decision making responsibilities. Huang (2006) proposed that the
application of the federal mode was to find a way to separate decision rights for different types
of activities. Huang stated that “core IT decision making such as IT infrastructure and IT
investments would be centralized to ensure enterprise wide consistency and then decisions

24
relating to business applications would be decentralized” (p.15). This allows the organization to
operate more efficiently in both IT and the business unit‟s decision making hierarchy.
Table 2
IT Governance Structural Tradeoffs and the Best of Both
IT Strategic Alignment
Drivers
Centralized
IT
Governance
Decentralized IT
Governance
Federal IT
Governance
IT Synergy
IT Standardization
IT specialization
Business Responsiveness
Business Ownership
Business Flexibility
+
+
+
-
-
-
-
-
-
+
+
+
+
+
+
+
+
+
Note. Taken from Asante, 2010; Peterson, 2004; Brown and Magill, 1998 and Rockart et al.,
1996.
Recent literature now embraces these three modes to show the relational mechanism that
exists within the organization (Brown & Magill, 1998; Peterson, 2004). According to Luftman
(2003) the centralized and decentralized structure combined to form the federal structure and the
usage and implementation of these structures are adapted to bring support within the firm‟s
alignment perspective as seen in table 2. Further research by Weill and Ross (2004) unveiled a
set of classifications that further expand the variations of decision making-structures relating to
IT governance. These structures are taken from political archetypes and include business
monarchy, IT monarchy, feudal, federal, IT duopoly, and anarchy. These archetypes put
emphasis on allocation pattern, with the business monarchy and feudal archetype having
business executives and business unit managers making IT decisions as equal partners, while the
federal archetype have the business unit and corporate management making IT decisions. With
the IT monarchy, IT decisions are made by the head of IT unit only, while the IT duopoly have

25
the duo of IT executive and the business leader making decisions, and finally anarchy do not
have an IT governance mechanism in place.
In summary, figure 3 shows the different governance structures evolution which also
reflects the decision making span for each selected type.
Figure 3. Current IT Governance Structures decision making span.
Information Technology Governance Archetypes
A study done at Harvard business school by Weill and Ross (2004) investigated 256
enterprises to highlight how high performing firms allocate their decision rights using political
archetypes. Weill and Ross demonstrated a set of successful patterns of governance performance
using archetypes based on their research, and then suggested 3 effective IT governance questions
(a)What decision must be made? (decisions class); (b) Who should make this decision?
(structures); (c) How will we make and monitor these decisions? (process and criteria). In Table
26
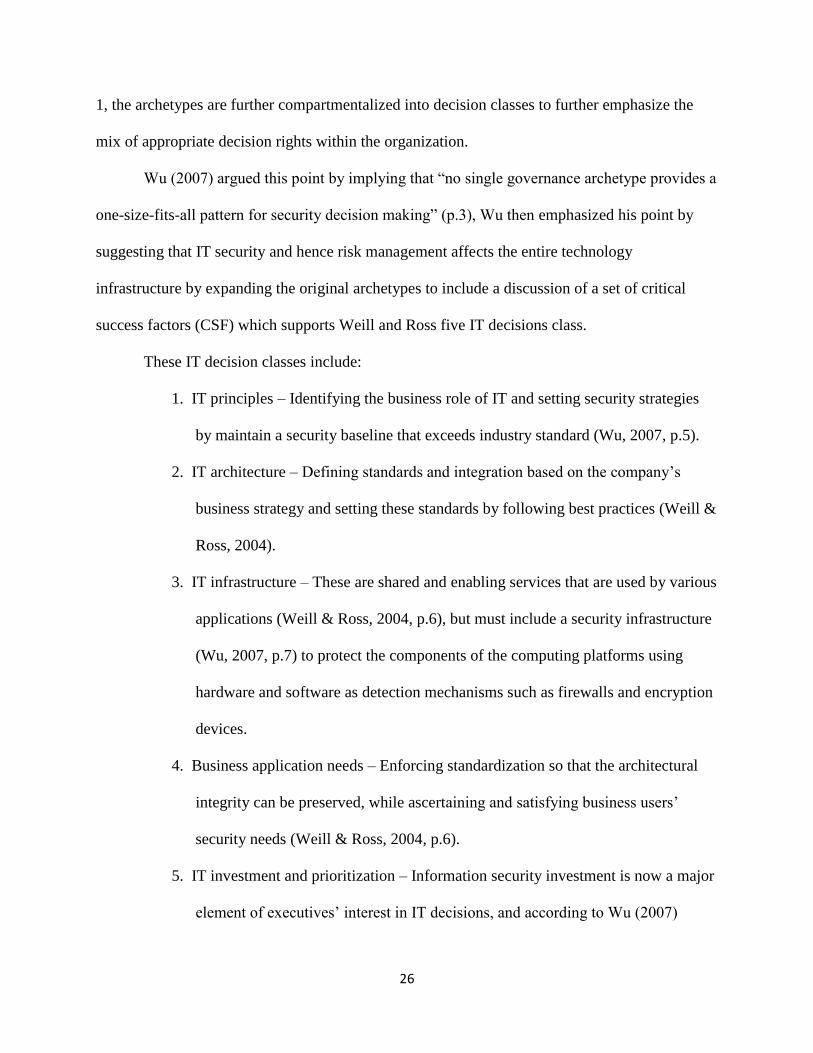
1, the archetypes are further compartmentalized into decision classes to further emphasize the
mix of appropriate decision rights within the organization.
Wu (2007) argued this point by implying that “no single governance archetype provides a
one-size-fits-all pattern for security decision making” (p.3), Wu then emphasized his point by
suggesting that IT security and hence risk management affects the entire technology
infrastructure by expanding the original archetypes to include a discussion of a set of critical
success factors (CSF) which supports Weill and Ross five IT decisions class.
These IT decision classes include:
1. IT principles – Identifying the business role of IT and setting security strategies
by maintain a security baseline that exceeds industry standard (Wu, 2007, p.5).
2. IT architecture – Defining standards and integration based on the company‟s
business strategy and setting these standards by following best practices (Weill &
Ross, 2004).
3. IT infrastructure – These are shared and enabling services that are used by various
applications (Weill & Ross, 2004, p.6), but must include a security infrastructure
(Wu, 2007, p.7) to protect the components of the computing platforms using
hardware and software as detection mechanisms such as firewalls and encryption
devices.
4. Business application needs – Enforcing standardization so that the architectural
integrity can be preserved, while ascertaining and satisfying business users‟
security needs (Weill & Ross, 2004, p.6).
5. IT investment and prioritization – Information security investment is now a major
element of executives‟ interest in IT decisions, and according to Wu (2007)

27
companies are starting to use Net present value (NPV) and Return on investments
(ROI) to make security decisions (p.7).
Through the alignment process, business unit (BU) and IT develop a synergistic force in
the IT governance process, and these decision classes are modeled in table 1 to illustrate the
ownership of the various decisions.
Table 3
The Potential Decision Making Patterns of Governance Performance using the Weill & Ross
Archetypes
Archetype/Style Decision Rights
or ownership
Decision Class 1 Decision Class 2 Decision Class 3
Business
monarchy
Top Managers IT Investments
IT Principles
IT Investments
IT Infrastructure
IT Architecture
IT monarchy IT specialists IT Infrastructure
IT Architecture
IT Infrastructure
IT Architecture
Feudal Each BU making
independent
decisions
Federal Combined C-
level Execs. &
BU with or
without IT input.
Business
application needs
Business
application needs
IT duopoly IT & one other
group (Managers
or Business
Units)
IT Principles
IT Investments
IT Principles
Business
application needs
Anarchy Isolated
individual or
small groups
No Governance No Governance No Governance
Note: Adapted from “IT Governance: How Top Performers Manage IT Decision Rights for
Superior Results” Weill, P. & Ross, J. (2004), p. 27-29. Harvard Business School Press.

28
From a strategic alignment perspective, effective IT governance requires a significant
amount of management time and attention. Table 3 shows the committee structure that made
decisions relating to IT governance (Weill & Ross, 2004).
Table 4
Sample IT committee structures that govern the enterprise.
IT Steering Committee IT Governance Committee Standards Committee
Governed by Senior
Managers/Execs.
Chaired by Chief Information
Officer
Run by top architects who
reports to the CIO and
members of the Governance
committees.
Approve key investments
decisions
Enforces steering committee
mandates related to designs
Determine which specific
standards have become
obsolete.
Ensures reliability, cost
effectiveness, consistent
customer service and easy
access
Enforces implementation and
management of IT architecture
Refers decision to governance
committee
The Chief Information Officer
is a member
Enforce Architectural standards
but allowing flexibility
Top IT leaders are members
Note: Adapted from “IT Governance: How Top Performers Manage IT Decision Rights for
Superior Results” Weill, P. & Ross, J. (2004), p. 14-29. Harvard Business School Press.
A study shared by Weill and Ross showed that UPS transformed IT from a strategic
liability to a strategic advantage through IT governance. With expenses on information
technology increasing and in some cases exceeding 50% of capital expenditure, executives are
now refining the IT governance processes and spending time on “strategic priorities” (p.14). An
observation of Figure 4 shows the iteration process and collaboration needed in making IT
governance decisions. Wu (2007) defends this position and argues that this iterative process

29
involves different factors and scenarios. Weill and Ross agrees and their theory suggests that all
three committees and in some cases ends with the IT steering committee which is headed by
senior management and which the CIO is a member. The decisions to be made in the alignment
process are then either referred or reported to the next committee based on the conversation or
communication on hand. Weill and Ross (2004) also stated that the IT governance matrix allows
decision making at multiple organizational levels, where this result in desirable behaviors.
Figure 4. IT governance collaborations: continuous alignment and re-iterations of processes from
a decision making standpoint.
Methodology for Researching IT Governance and IT-Business Alignment
According to Miles and Snow's (as cited in Sabherwal and Chan, 2001) the “seminal
work on typology of Defenders, Prospectors and Analyzers” (p.11) set the stage for the
discussion of strategic alignment along with Porter (1980) work on strategy and competitive
advantage. Absent in these research however, is the integration of business and IT within a

30
holistic context. Nonetheless, prominent authors have drawn on their research to lay a foundation
of the IT-business alignment discussion (Sabherwal & Chan, 2001; Hirschheim & Sabherwal,
2001). Through this timeline Weill and Broadbent (1993) in their empirical study “Improving
business and information strategy alignment: Learning from the banking industry” investigated
banks in Australia to identify why and how practices within the banks were an enabler or
inhibitor for the attainment of business -IT strategic alignment. The Weill and Broadbent (1993)
survey was done by interview survey instrument and revealed in the literature the early research
on business- IT strategic alignment was mostly through qualitative methods (see also table 1.).
Supporting this trend is the Luftman and Brier (1999) qualitative research, that surveyed business
executives representing over 500 firms in 15 industries where they investigated the reasons
organizations had difficulties in achieving IT strategic alignment and concluded that “there exist
six enablers and six inhibitors that affected the success of IT strategic alignment of which the
most prominent were IT governance through executive support and decision making,
understanding the business, IT and business relations, and leadership” (Asante, 2010).
The problems associated with these researches then led Luftman (2003) to prepare a
study and develop and quantitatively addressed the issues of the inability to identify the lack of
IT-business integration issues effectively through a qualitative mode. The new model developed
addressed the organizations communications maturity, competency and value maturity,
governance maturity, partnership, technology and skill maturity (see table 6). Segars and Grover
(1999) and Sage (2006) also contributed a solution to this concern earlier, where Segar an Grover
employed a multivariate analysis by using a methodology that examined data from 253
organizations and eventually suggested that “five distinct profiles of strategic planning can be
identified based on dimensions of comprehensiveness, formalization, focus, flow, participation

31
and consistency” (Segars and Grover, 1999), while Sage (2006) looked on the lack of IT-
business strategic alignment and what are the dysfunctional effects of such lack of alignment and
the survey instrument were sent to CIOs from 116 federal agencies and 96 participated in the
study.
Therefore, a study on business-IT strategic alignment relationship with IT governance
framework is essential to understand the extent to which an alignment maturity model such as
Luftman (2003) will have an impact to organizations. As a result of Luftman research, other
researchers identified gaps in the extant literature and sought to avail findings as a result of the
business-IT strategic alignment area. Asante (2010) in his study argued that missing from the
literature is the correlation between IT strategic alignment and IT governance. He then conducted
research on the exploration of “Information Technology (IT) strategic alignment and how is this
impacted by IT governance structural elements based on an alignment maturity model and an IT
governance framework” (Asante, 2010, p. 46). Asante (2010) did not prove a correlation within
the maturity framework for the centralized and decentralized mode of IT governance structure.
The participants invited for the study was over 4000 business and IT executives and middle
managers with a response sample size of 300. He also recommended further research to identify
factors that are involved in the governance decisions making process by board members. These
decisions by the board will also include the span of control of managers. Sage (2006) supports
this recommendation but states that the research must include the most relevant of predictor of
alignment which is communications between IT and business executives and non-government
organizations.

32
Recent IT Governance Implementations Studies
Current research into the management of technology practices found in a great number of
corporations around the globe has shown that most organizations are not generating optimal
value from their IT investments (Ross & Weill, 2002). According to Doyle, Ge, and McVay,
(2007), “The most important factor distinguishing top performing from substandard-performing
organizations is the level of leadership by business and senior managers in a handful of key IT
decisions”(p.199). Ross and Weill also states that an “efficient and effective information
infrastructure can enhance shareholder value” (p.87). Conversely, they argue that the image of
the organization can be affected with failures in IT in an “interconnected economy” (p.89),
resulting in an ever increasing drive to ensure controls are in place internally.
Fortunately, Boards of directors can transition into IT governance framework according
Klamm and Watson (2009); these frameworks are by various standards and most are already
existing and are well established sound practices that also provide the necessary guidance and
support materials that enable the organization to adapt and establish an inaugural ground for
governance structure. Beneish, Billings and Hodder (2008) offered that each governance
framework has its own strength and weaknesses, and while they have been developed to serve
different purposes, many share similar functions in achieving the desired objective. In supporting
this claim current literature suggests that ongoing research initiatives are being put together and
integrate the leading frameworks to achieve greater compatibility (Hammersley et al., 2008;
Beneish et al., 2008; Klamm & Watson, 2009). There are currently three leading frameworks in
use today are; (1) Control Objectives for Information and related Technology (COBIT) which
was originally released as an IT process and control framework linking IT to business
requirements. The ITGI (2006) states that “COBIT is an open standard for control over
33
information technology and is independent of the software and hardware platform” additionally
it is maintained and refreshed on a four-year cycle by the IT Governance Institute”. (2)
Information Technology Infrastructure Library (ITIL) which is used as the standard for service
management and delivery. It defines IT quality as the level of alignment between IT services and
actual business needs. (3) The Code of Practice for Information Security Management (ISO/IEC
17799: 2000) which is a widely accepted set of guidelines and controls for information security
(Robinson, 2005).
Hammersley, Myers and Shakespeare (2008) suggested that a large volume of studies
using SOX data has emerged, primarily investigating the characteristics of firms reporting
material weakness (MW) and the effect of internal control reports on market conditions. Ge and
McVay (2005) added that firms reporting MWs are normally smaller in size, have complex
operations and financially weaker (Ge & McVay 2005; Doyle et al.,2007; Klamm & Watson
2009). Boards should then be aware that the stock-price reaction to reports of MWs is negative,
especially for those reports that are severe ( Hammersley et al.,2008; Beneish et al.,2008; Klamm
& Watson, 2009). Carr (as cited in Kordel, 2004) argued that while business capitalize on
opportunities derived from IT, these advantages are slowly dissipating; in some instances these
are overestimation of the strategic benefit, hence can lead to an over expenditure on technology.
Carr also argued that management should understand the importance of IT risk management by
having a strategic plan to highlight vulnerabilities and ensure the business executives also focus
on potential technological vulnerabilities to ensure success in the organization (Kordel, 2004).
Cook, Probert and Martin (2009) emphasized that “by maintaining operational
effectiveness, revenue streams and profitability are more consistent, resulting in improved
financial forecasting and investor confidence” (p.23); they argued that most businesses today

34
need an IT unit to achieve success. With the advent an effective IT office, new revenue streams
and opportunities can be pursued. Customers can be won because of new innovation and
performance by the company and hence an increased value on the organization based on
stakeholder perception (Cook, Probert and Martin, 2009).
IT Strategic Alignment
Information technology and business strategy has become an interwoven process into
today‟s businesses. This occurs because of the pervasive nature of IT within the operations of
most organizations today; whether they are private sector, public traded companies or
government agencies (Damianides, 2005). Damianides observed that “boards are now putting
emphasis on the governance and control over IT on their agendas, and executives and managers
are focusing increased attention on the topic” (p. 78). Hamaker and Hutton (2004) endorsed this
argument and stated that IT governance should be a reflection of the organization, because the
activities of the IT unit touch every area of importance.
Recently, IT strategy and planning became a major component for business alignment,
this have been a growing factor in the IT governance program. Hamaker and Hutton (2004)
added that this occurred mostly because of the fact that “IT is requiring more technical personnel
and insight than other disciplines to understand. Furthermore, IT enables the enterprise, creates
risks, and gives rise to new opportunities” (p.93). On the other hand, Damianides (2005) disputed
this idea and noted that IT has conventionally been seen as a separate function from the business,
and when combined with global complexity, measuring value is difficult for the firm. Whitman
and Mattord (2006) agreed, and disclosed that “efforts to achieve alignment between IT
strategies and the business are not always successful and often go astray” (p.77). Whitman and
Mattord (2006) made this observation on the basis that the alignment of business and IT

35
strategies “is not an event, but a process of continuous adaption and change” (p.54); whereby
technology can create new or modify business practices at a fast rate. This argument is further
supported by Luftman (2003) who states that IT strategic alignment is a combination of factors
that include all its units working together.
Further analysis by Damianides (2005), addressed some of the key success factors for
control and governance of IT in a three strep process:
Step (1)Formation of an IT strategy and IT steering committees, Damianides (2005)
observed that within the organization an IT strategy committee of which the board of directors
are a critical component will ensure that the IT strategy is in alignment to the business strategy,
and that management processes are delivering this strategy. Additionally, the IT steering
committee of which the C-level executives and senior management is a member, ensures that IT
priorities, goals of the organization and effective allocation of resources are achieved, while
examining success and return on investments for the business and IT initiatives. Brown and
Nasuti (2005) agreed that the role of both committees is now an important factor in the
organization as the awareness of IT governance has grown. Additionally, both committees work
together to lead the expansion and coherence of participating business decisions that leads to a
strategic direction for investment priorities and optimization of IT.
Step (2) Aligning IT and the business in strategy and operations, according to Damianides
(2005), is of importance to organizations. Kang (2010) supported this argument and added that
establishing and maintaining interdependence between the business and IT, can make a
commercial and technical success of IT projects and also foster an alignment in the integration of
business and IT strategy.

36
Step (3) Cascading of IT goals and strategy down into the organization, according to
Damiandes (2005), ensures that the proliferation of these goals will be linked to a measurement
system that will then feed the performance of the actors back to management.
Luftman (2003) used a five-level approach to measure the firm Strategic Alignment
Maturity model. Each user chooses a level that best represents his or her organization. The levels
are represented as follow; “Level 1 Initial/ad-hoc process, Level 2 Committed process, Level 3
Established focused process, Level 4 Improved/managed process, Level 5 Optimized process.
These levels are then represented in six areas 1) Effectiveness of IT and Business
Communications 2) Measurement of the Competency 3) Governance of IT 4) Partnerships
between IT and Business Functions 5) Scope and Architecture of the IT Infrastructure and 6)
Skills” (p.10).
Kordel (2004) argued that the ownership of IT by the business is not mature, but business
managers can take control and lead the decision making process. With this continuum the
business leaders gain more control and experience over IT assets that affect their units, and in the
long term manage and invest in technology so as to cut the costs of IT and have increase
participation as business leaders in the management of IT. Interviews conducted by Jeffery and
Leliveld (2004) found the following:
Some business leaders, in an effort not to expose their ignorance of IT, wasted resources
by deciding on initiatives without IT consultation, and then demanded that IT groups
manage the projects well or take the blame. Meanwhile, some CIOs thought keeping
business leaders technologically uninformed translated to job security and thus took little
initiative to bridge the divide. Forty-six percent said business leaders didn't understand
that ROI is not always applicable. For example, a manufacturing company's CIO recalled
37
how, until auditors finally expressed their concern; fellow executives continually
dismissed project proposals for security and disaster-recovery assets because they
couldn't see immediate bottom-line benefits. (p.46)
Maturity Models
Leigh (2006) proposed that it is important to be able to develop established process of
tracking organizations effectiveness. An important factor in this process is the ability to employ a
self-assessment and benchmarking for processes. A model suggested by Leigh (2006) “Carnegie
Mellon's capability maturity model integration (CMMi) is defined with five levels of maturity
and is a good example of how most maturity models are organized” (p.15). Figure 3 lists the
maturity models along with a description of each. The maturity level of the firm addresses the
firm‟s capability to address selected business practices. The tool also has six maturity categories:
communication maturity, competency/value measurement maturity, governance maturity,
partnership maturity, technology scope maturity, skills maturity along with the five levels of
measurement already mentioned.
Within the COBIT framework management guidelines, there exists critical success
factors (CSF), key performance indicators (KPI), key goal indicators (KGI) and maturity models
(IT Governance Institute, 2004). Based on the IT Governance Institute maturity models this
refers to business requirements and control capabilities at different levels (see table 5). The
difference within the organization is measurable and can be recognized as a profile for the
enterprise as it relates to IT governance and control which then can be used as a “support for gap
analysis to determine what needs to be done to achieve a chosen level of maturity” (IT
Governance Institute, 2004). IT Governance Institute (2007) outlined the following:
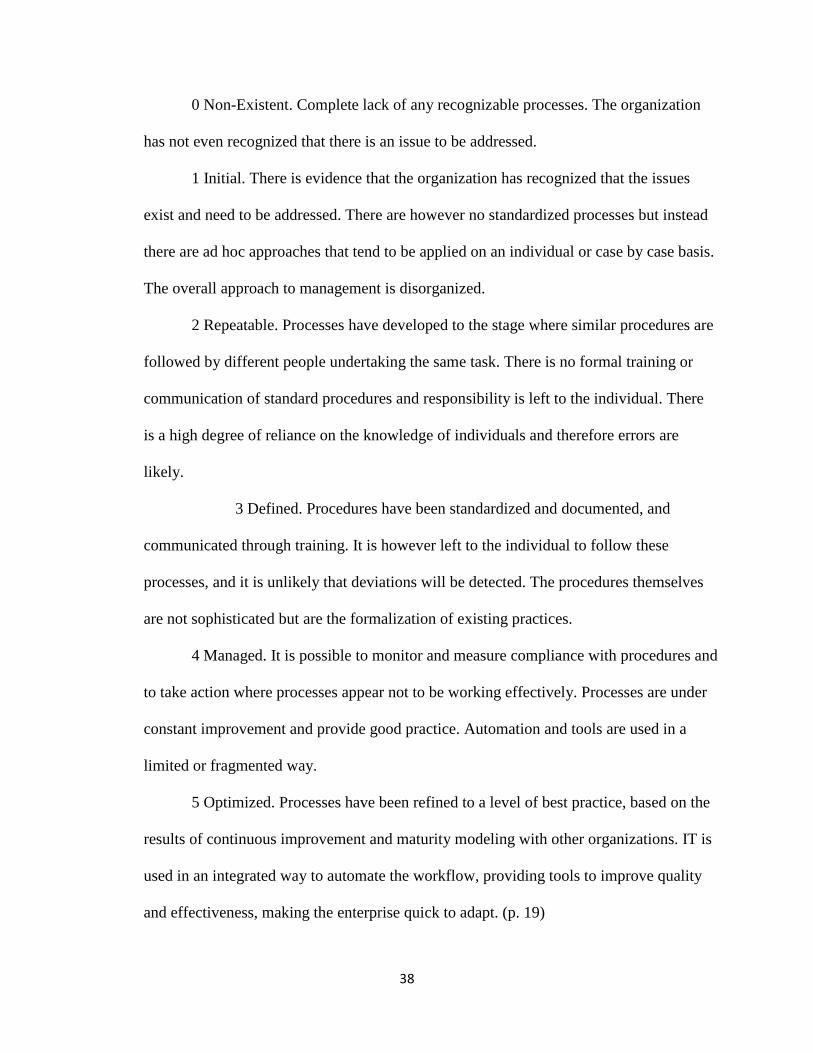
38
0 Non-Existent. Complete lack of any recognizable processes. The organization
has not even recognized that there is an issue to be addressed.
1 Initial. There is evidence that the organization has recognized that the issues
exist and need to be addressed. There are however no standardized processes but instead
there are ad hoc approaches that tend to be applied on an individual or case by case basis.
The overall approach to management is disorganized.
2 Repeatable. Processes have developed to the stage where similar procedures are
followed by different people undertaking the same task. There is no formal training or
communication of standard procedures and responsibility is left to the individual. There
is a high degree of reliance on the knowledge of individuals and therefore errors are
likely.
3 Defined. Procedures have been standardized and documented, and
communicated through training. It is however left to the individual to follow these
processes, and it is unlikely that deviations will be detected. The procedures themselves
are not sophisticated but are the formalization of existing practices.
4 Managed. It is possible to monitor and measure compliance with procedures and
to take action where processes appear not to be working effectively. Processes are under
constant improvement and provide good practice. Automation and tools are used in a
limited or fragmented way.
5 Optimized. Processes have been refined to a level of best practice, based on the
results of continuous improvement and maturity modeling with other organizations. IT is
used in an integrated way to automate the workflow, providing tools to improve quality
and effectiveness, making the enterprise quick to adapt. (p. 19)

39
Table 5
Maturity Model Summary Definition and Descriptions: An executive view of IT
Governance.
Level Maturity Description
0 Non existing No senior management oversight.
1 Initial/Ad hoc Control processes are non-existent or ad hoc.
2 Repeatable and
Intuitive
Basic management processes are established and
repeatable.
3 Defined process The control process is documented, standardized, and
integrated into a standard management process for the
organization.
4 Managed and
Measurable
Detailed measurements of internal control processes and
product quality are collected. Both process and products
are quantitatively understood and controlled.
5 Optimizing Continuous process improvement is enabled by
quantitative feedback from the control processes.
Note: Adapted from “Board Briefing on IT Governance (2nd ed)” IT Governance Institute
(2003)
The IT governance maturity model presents a scale that allows comparison within the
model, the model which is called a maturity attribute table is not industry specific or always
applicable and the nature of the business will determine an appropriate level for insight. The
model has six dimensions and is explained in table 6.
Understanding and awareness
Training and communications
Process and practices
Techniques and automation
Compliance
Expertise

40
Table 6
Maturity attribute table. (ITGI, 2007;Beveridge, n.d)
Understanding
and Awareness
Training and
Communication
Process and
Practices
Techniques
and
Automation
Compliance Expertise
/Skills
1 Recognition Sporadic
communication
on the issues
Ad-hoc
approaches
to process/
practices
2 Awareness Communicatio
n on the
overall issue
and need
Similar
processes
emerge;
largely
intuitive.
Common
tools are
emerging
Inconsistent
monitoring in
isolated areas
3 Understand
need
to act
Informal
training
supports
individual
initiative
Existing
practices
defined,
standardized
and
documented
; sharing of
the better
practices
Currently
available
techniques
are used;
minimum
practices are
enforced;
tool set
becomes
standardized
Inconsistent
monitoring
globally,
measurement
processes are
emerged; IT
Balance
Scorecard ideas
are being
adopted, root
cause analysis
Involve
IT
specialist
4 Understand
full
requirements
Formal
training
supports a
managed
program
Process
ownership
and
responsibilit
ies assigned;
process is
sound, best
practices
applied
Mature
techniques
applied;
standard
tools
enforced;
limited, use
of
technology
IT Balanced
Scorecards
implemented in
some areas with
exceptions noted
by management;
root cause
analysis being
standardized
Involve
all
internal
domain
experts
5 Advanced
forward
looking
understanding
Training and
communication
support
external best
practices and
use of leading
edge
concepts/techni
ques
Best
external
practices
applied.
Sophisticated
techniques
are deployed;
extensive
optimized
use of
technology
Global
application of IT
Balanced
Scorecard and
exceptions are
globally and
consistently
noted by
management
Use of
external
experts
and
industry
leaders
for
guidance

41
Leigh (2006) concluded that the based on the requirements of SOX, organizations are
willing to establish internal control so as to attain a level 3 or higher on key control activities to
satisfy audit requirements.
Information Technology Governance Frameworks (Processes)
Control Objectives for Information and Related Technology (COBIT)
According to Lainhart (2000), COBIT in its management guidelines publication states
“COBIT is an open standard for control over information and related technology for security
development and promoted by the IT Governance Institute” (p.5). The framework has 34 IT
process that are used to assist in its implementation along with 318 well detailed control
objectives for audit guidelines. COBIT also provides an extensive IT security component that
allow for safe practices to support management decision processes in their organization
(Lainhart, 2000, p.65). COBIT is now being seen as the main model for IT Governance;
accordingly, the IT Governance Institute has further built on this leading edge research in
cooperation with world with industry expert‟s analysts and academics, which resulted in a
management guideline for COBIT (ITGI, 2000, p. 5). COBIT has been revised multiple times
and additional publications can be found at the IT Governance Institute website. The framework
assists the enterprise to achieve its goal by adding value, while balancing risks and returns
through the lens of the business.
According to Hawkins, Alhajjaj, and Kelly, (2003), COBIT looks at IT from the business
perspective and places IT as part of the evaluation for meeting business strategy, with the goal to
identify how IT can best contribute to the achievement of the business objective (Hawkins,
Alhajjaj, & Kelly, 2003, p.22).

42
Hawkins et al (2003) also states that, COBIT provides the process and structure that IT
management can use to assess, manage and minimize risk across every aspect of an organization.
In the integration of such a control framework is the critical success factor (CSF) that
enables the organization to ensure that quality service delivery are consistently being delivered to
customers (Lainhart, 2000, p.56). The CSF includes:
1. Representing the most important things to do to increase the probability of success of
the process.
2. They are observable, usually measurable characteristics of the organisation and
process.
3. Are either strategic, technological, organizational or procedural in nature.
4. A focus on obtaining, maintaining and leveraging capability and skills.
5. Are expressed in terms of the process, not necessarily the business.
Businesses are now capitalizing on the value that IT brings; departments within the
organization are now challenged to perform based on the business goals, while simultaneously
satisfying external requirements such as Sarbanes-Oxley (SOX).
To implement an IT governance framework within the organization, it can be an
important step in generating value for technology. Successful COBIT implementation will allow
businesses to see an improvement in conformance as well as statutory requirements. According
to Lainhart (2000) “COBIT can easily be combined with other best practices frameworks and
standards in any organization” (p.57). Information Technology is deeply entrenched within an
organization financial information because the need arise for storage, processing and
management of financial data and document (ITGI, 2000). Thus organizations are mandated to
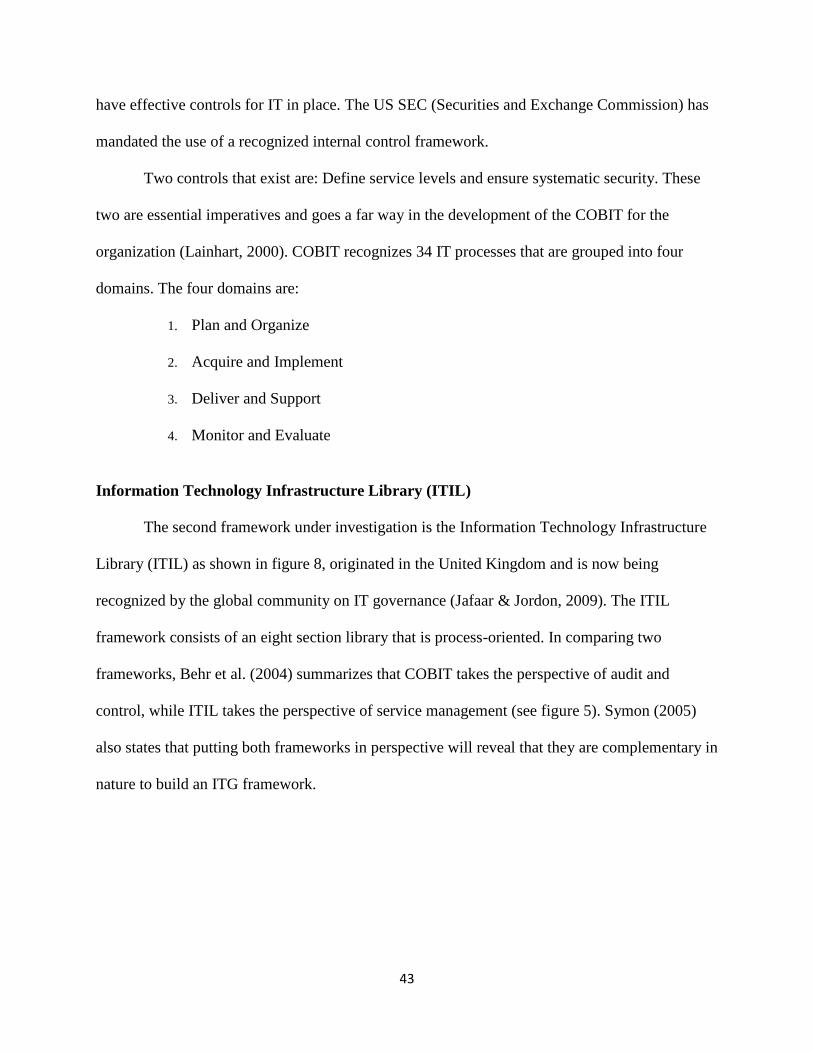
43
have effective controls for IT in place. The US SEC (Securities and Exchange Commission) has
mandated the use of a recognized internal control framework.
Two controls that exist are: Define service levels and ensure systematic security. These
two are essential imperatives and goes a far way in the development of the COBIT for the
organization (Lainhart, 2000). COBIT recognizes 34 IT processes that are grouped into four
domains. The four domains are:
1. Plan and Organize
2. Acquire and Implement
3. Deliver and Support
4. Monitor and Evaluate
Information Technology Infrastructure Library (ITIL)
The second framework under investigation is the Information Technology Infrastructure
Library (ITIL) as shown in figure 8, originated in the United Kingdom and is now being
recognized by the global community on IT governance (Jafaar & Jordon, 2009). The ITIL
framework consists of an eight section library that is process-oriented. In comparing two
frameworks, Behr et al. (2004) summarizes that COBIT takes the perspective of audit and
control, while ITIL takes the perspective of service management (see figure 5). Symon (2005)
also states that putting both frameworks in perspective will reveal that they are complementary in
nature to build an ITG framework.

44
Figure 5. Information security process in the ITIL framework (Weill, 2004)
International Standards Organization (ISO) 17799
The third major governance framework developed by the International Organization for
Standardization (ISO) in December 2000, and is based on the
British Standard 7799. The focus of this standard is security and will also complement a
complete IT governance framework (Jafaar & Jordon, 2009).
Information Security Role in IT Governance
Information security (InfoSec) plays a part in IT governance and compliance and in most
cases makes a successful IT governance plan possible. A properly implemented security program
include confidentiality, integrity and availability, those in charge of this environment ensures that
only those who are authorized have access to sensitive information and that the information is
processed correctly and is available when needed (Killmeyer, 2006).
The InfoSec architecture includes areas that have the necessary policies, standards and
procedures integrated with a compliance framework.

45
Figure 6. InfoSec Architecture (ISA)
As it is with InfoSec, IT governance requires a starting point for assessment, within the
information security architecture (ISA) paradigm (see figure 6), when a new system is
implemented, a preliminary assessment called security baseline need to be performed
(Killmeyer, 2006). The baseline provides a starting point to measure changes in configuration
and improvement to the system. Killmeyer (2006) in his assessment revealed “Research indicates
that understanding the firm mission and vision and inclusion of departmental unit and goals are
important to the maturity level of the firm” (p.140). The streamlining of the firm functions and
process from 0 -5 on the maturity model suggests that their need to be a stable plan in place (see
figure 6 maturity model). Large organizations that have business unit operating independently
should develop a line of business (LOB) security plan that is being used as a baseline document
to understand process environment.
Information Technology Governance Security Regulations
With the increasing discussion on technology governance and compliance with industry
and federal requirements, previous research points out that their need to be a framework for
strategic risk management needs and their also is a need for integration so that various area of

46
strategic business plan can be linked to their overall goals. In having an overall view, the
application of strategic activities within the enterprise can also create strategic risk in other area
of the organization.
Table 7
Recent laws and regulations in the U.S.
Regulation Legislative action Source
Digital Millennium
Copyright Act
(DMCA)
Created a global copyright infringement law
including intellectual properties, and included a
Vessel Hull Design Protection Act to safeguard
all oceans going ships.
1998
(Walton, 2002,
p.153)
Economic
Espionage
Act (EEA)
Makes the theft or use of a organizations trade
secret a federal crime.
1996
(Walton,
2002,p.153)
Government
Information
Security
Reform Act
(GISRA)
Requires security reviews of all U.S.
governmental
computer networks.
2002
(Walton, 2002,
p.153)
Gramm-Leach-
Bliley
Repealed the Glass-Steagill Act, and opened the
banking and finical markets so they could go
into other sectors.
1999
(GLBA) (p.3)
Health Insurance
Portability and
Accountability Act
of
1996 (HIPAA)
Protects the health insurance coverage for
workers and strengthens the security and privacy
of health
data.
1996
(HIPAA) (p.3)
Homeland Security
Act
U.S. governmental department that who‟s
primary
focus is anti-terrorism. Also combined several
other departments from other governmental
agencies.
2002
(p.3)
Sarbanes-Oxley
Act(SOX)
Created new or enhanced standards for all U.S.
publically traded companies.
2002
(p.3)
USA Patriot Act Gave the U.S. Law enforcement more power to
fight terrorism.
2001
(p.3)
Note. Adapted from “: What you should know about legislation affecting our business” Business
Protection Systems International, Inc. by Goldman J. 2003. Continuity Magazine.

47
Industry experts such as Jack Goldman of Business Protection Systems International Inc,
shared a detailed review of legislation affecting businesses (see table 7).
The impact of SOX Legislation (Outcome)
The Sarbanes-Oxley Act of 2002 (SOX) was passed in the United States in response to a
series of significant failures in corporate governance, including Enron (Brown & Nasuti, 2005)
and other institutions such as Arthur Andersen, HealthSouth, Tyco and WorldCom (Moules &
Larsen, 2003;Alkhafaji, 2006 ). The series of irregularities in these companies sent an overflow
of anomalies to other areas of enterprise support unit more-so Information Technology (IT).
Brown and Nasuti argued that the purpose of SOX is to ensure that investors are protected by an
improvement in the reliability and accuracy in financial reporting standards by Securities and
Exchange Commission (SEC) registrants from such anomalies. These include all United States
public companies, some private companies that are registered with SEC and foreign companies
trading on the U.S. stock exchange (Cohen & Qaimmaqami, 2005). Supporting this initiative is
the Securities and Exchange Commission (SEC) and the Public Company Accounting Oversight
Board (PCAOB), the governing bodies controlling the auditing standards of SOX these
institutions have been revising the internal control auditing standards since the passage of the Act
according to Leigh (2006) and Ampofo (2004).
While Damianides (2005) suggests integration between financial reporting and
information technology (IT); with the emergence of Sarbanes-Oxley Act, the auditing and
process controls for information technology governance as increased. Leigh (2006) argued that,
“The Act requires auditors to publicly report on corporate control processes pertaining to
financial reporting and to report to shareholders exactly what control processes are in place and
to what extent they are being followed”(p.13).

48
The Sarbanes-Oxley Act promises to pay attention to the enhancement of corporate
governance by ensuring companies adhere to internal checks and balances and, ultimately,
strengthen corporate accountability (Damianides, 2005; Sutton & Arnold, 2005). According to
Klamm and Watson (2009) this new awareness for good governance is now more than ethical
business practices, but as made its way into law; IT will be crucial in playing a part in the
establishing the foundation for a sound internal control environment. The researchers
methodologies showed that the Sarbanes–Oxley Act legislation has created a greater need for
businesses to have IT controls in place (Damianides, 2005). Klamm and Watson (2009) agreed
with this position and also submit that ensuring the reliability of financial data and
simultaneously maintaining ethical compliance is now prudent, and businesses must be able to
put in place the right technology to ensure compliance is possible.
Brown and Nasuti (2005) in their article, "What ERP systems can tell us about Sarbanes-
Oxley" made salient points regarding of the legislation. They wrote that key sections of the Act
relating to IT include sections 302, 404, 409 and 802:
Section 302: requires the officers of the company to make representation related to the
disclosure of internal controls, procedures, and assurance from fraud.
Section 404: requires an annual assessment of the effectiveness of internal
controls.
Section 409: requires disclosures to the public on a “rapid and current bases” of material
changes to the firm‟s financial condition.
Section 802: requires authentic and immutable record retention. (p. 313)
Damianides (2005) purported that, within this framework, Under Section 302, chief
executive officers (CEOs) and chief financial officers (CFOs) of public companies must

49
personally certify financial statements and the existence and effective operation of disclosure
controls and procedures, he also states that those executives providing the assurance and
accuracy of the reports must also disclose to their audit committee and auditors all significant
control deficiencies and material weakness. Other proponents of SOX legislation, argued that the
scope of the impact is not limited to the CEO, CFO, and auditor, nor is it limited to local or
international companies registered with the SEC (Brown & Nasuti, 2005; Hall & Liedtka, 2007;
Klamm & Watson, 2009), they insists that other executives such as the CIO and senior level staff
involved in decision making can be held responsible for internal control deficiencies.
Recent studies have shown that firms investing in corporate social responsibility (CSR)
and use this as a strategy to increase corporate social performance (CSP) shows a positive
relationship between CSR and the firms performance in the long term (Kang, 2010). While Kang
suggests that the firm investing in these social issues build trust, build image and improve
relationships in the eyes of stakeholders. Freeman (1984) argued that earning trust and building
brands take time within most organization, and during the financial debacle with Enron (Brown
& Nasuti, 2005) followed by the advent of SOX of 2002, research now shows that investor‟s
confidence is being rebuilt as a consequence of the SOX regulation, these theories are confirmed
by authors such as Currall and Epstein (2003), Freeman (1984) and Kacperczyk (2009). Prior to
SOX, some organizations did not have concerns about IT steering committee, quality assurance
and compliance. With SOX legislation now a mandate, public companies and foreign companies
trading on the United States Stock Exchange are now giving more attention to compliance and
transparency in their reporting.
Leigh (2006) identifies two categories of changes that occur in IT project management as
a result of Sarbanes Oxley implementation. The first impact is identified as a primary impact and

50
the other, he called secondary effect. He identified primary impact as changes to IT related
projects that are directly associated with SOX and Secondary effects are those changes resulting
from the primary impact. The primary impact as identified by Leigh remains consistent in the
literature (Damianides, 2005; Cook, Probert & Martin, 2009; Kang, 2010), where it is observed
that there is “increase in process formalization, an increase in project duration, and a need to use
project management software to support audit activities” (p. 24). The secondary effects include
“increase in process maturity, an increase in IT staff, and a breaking down of large projects into
more, smaller projects” (p. 24). Based on this observation, SOX becomes a major enabler to lend
confidence towards a more mature development process in the integration of IT strategic
alignment and the business as demonstrated by Leigh (2006), and supported by Cook, Probert
and Martin (2009).
The integration of SOX within the business processes mandates that projects have a
checklist that must be followed; Section 404 requires an annual assessment of the effectiveness
of those controls, while Section 302 requires the officers of the company to make representation
related to the disclosure of internal controls and procedures as revealed by Brown and Nasuti
(2005). The duration of project implementation as increased, before the passage of Sarbanes-
Oxley 2002, Leigh argued that “there was no need to formally review every project by an outside
committee; Now, additional time is required to prepare a project proposal with the necessary
information, so the IT steering committee will be able to evaluate the merits of the request”
(p.25).
Other proponents of SOX implementation such as Grant, Miller and Alali (2008) also
argued that prior to the introduction of SOX; little information exists for firms as it relates to
understanding control deficiencies in financial reporting. An increase in recent management

51
reporting to the Securities and Exchange Commission (SEC) now provides large amount of data
to measure the impact of control deficiencies. Smith and Wendell (as cited in Grant et al. 2008)
reasoned that these new assessments are forcing companies to locate the issues relating to IT
control deficiencies and fix them. Likewise, other studies based on SOX, identify the impact of
IT control deficiencies on financial reporting (Tseu, 2005), bears a common theme among major
auditing firms that includes “lack of access controls, excessive access to systems and databases,
improper change management, inadequate segregation of duties; and lack of a self-assessment
process” (p.18).
The impact of SOX as also affected Information technology workers as described by
Cook, Probert & Martin (2009). New requirements and increased documentation affects IT
workers at all levels, from line technicians to executives in the organization who has a
responsibility that affect corporate processes and accounting. Schneider and Bruton (2007)
contended that SOX has provided new opportunities for IT professionals, but may require
additional training to assist organizations with compliance. These new requirements prescribed
by SOX section 404 include segregation of some duties that were the responsibility of one
individual is now divided into multiple people. For example Cook et al. stated:
Prior to SOX, the IT worker in charge of supporting a software application that tracks
sales orders would have created user accounts as part of his or her daily responsibilities.
Post SOX implementation, that IT worker must obtain permission and approvals to create
the user account and then turn over the account creation to be done by a separate IT
group. Once that group creates the user and notifies the IT worker, the IT worker can then
notify the user that the account was created. The task that required one worker prior to
the implementation of SOX now requires three workers. Similarly, developers writing

52
application code must now turn the code over to another worker to put the code into
production. (p. 24)
With these exhaustive documentation now required by SOX implementation, the fines
involved for noncompliance with SOX requirements include criminal and civil charges against
the organization and its executives (Alkhafaji, 2007 ; Cook et al., 2009; Grant et al., 2008; Leigh,
2006).
Strategies for the Chief Information Officers (CIOs)
The requirements of Sarbanes-Oxley legislation are to rebuild shareholders confidence;
this is done by enhancing internal controls and timely disclosures to stakeholders and should be a
tool for the CIO. Complying with SOX however, does not completely guarantee non-compliance
in some areas of the process and when this occurs; companies are required to document material
weaknesses in their process (Alkhafaji, 2007; Damianides, 2005; Klamm & Watson, 2009;
Sutton & Arnold, 2005).
Research carried out by Damianides (2005), asserted that the Chief Information Officer
(CIO) should consider turning compliance into competitive advantage by going parallel with the
compliance process, this can be done by building a strong internal control programs within IT
units that will help to, enhance overall IT governance understanding, align project initiatives
with business requirements and make quality decisions that helps the compliance process. The
two most important components the CIO should also consider in the SOX legislations are
sections 404 and 409 (Sutton & Arnold, 2005, p. 120). “Section 404 requires management to
report on the effectiveness of its internal controls over financial reporting.”, and section 409
states that the real-time disclosure of certain material events should be made available.

53
The CIO should retain an IT control subcommittee that ensures that IT compliance
program assigns accountability and responsibility to individuals of this committee. ITGI (2006)
suggests that the subcommittee be a subset of a steering committee and it should oversee the IT
Sarbanes-Oxley compliance process which includes communication and integration with the
overall Sarbanes-Oxley project. Sutton and Arnold (2005) agrees with this process, and with the
passage of the Sarbanes-Oxley Act of 2002, this legislation will alter the CIO‟s position and
previous knowledge relating to IT governance.
Sutton and Arnold (2005) revealed that the Sarbanes-Oxley Act will now equip the CIO
with new responsibilities such as regulatory reporting and internal control documentation. The
change in these responsibilities will reflect in the emerging corporate environment (Bassellier &
Benbasat, 2004; Bassellier, Benbasat, & Reich 2003). Weill (2004) added that an alignment with
the business and IT will lead to transparency and measurement supported by a control
framework. This key factor will ensure a better delivery system and ensure performance that
supports management's and the board's control responsibilities.
The CIO should also consider alternatives as described by Hall and Liedtka (2007), that
uncertainty and inconsistency regarding the use of IT outsourcing still exists. The research
concluded that, “a survey of 261 corporate decision makers by the consulting firm Meta Group
found that 25% had no way of determining the appropriate IT sourcing response to SOX; 21%
intended to outsource more in response to SOX; and 19% intended to outsource less. The same
survey found an additional 17% did not expect SOX to have an effect, positive or negative, on
current IT outsourcing levels” (p. 96).
The benefit of a governance framework as suggested by Cook, Probert and Martin
(2009), is that it will force management to properly perform in the interest of its shareholders. On

54
the other hand, if the company does not have this governance structure in place, then it leaves the
organization vulnerable to manipulation by its management. Orcutt (2009) proposed that the CIO
must be able to identify, understand and evaluate the internal control systems for the generation
of financial reports. This will then disclose material weaknesses as described in the Internal
Control Financial Report (ICFR) as described by Section 404 of SOX legislation and agreed to
by a number of researchers (Alkhafaji, 2007; Damianides, 2005; Klamm & Watson, 2009; Sutton
& Arnold, 2005; Nolan & McFarlan, 2005).
Some of the intended benefits of SOX implementation involved a broad range of
corporate governance reforms that were meant to improve investors‟ protection. Additionally,
this also increases the efficiency of the U.S. public securities markets, primarily by increasing
the disclosure requirements of reporting companies and establishing stronger standards.
Orcutt (2009) articulated that nobody knows whether mandatory internal control
requirements such as Section 404 of SOX are valuable regulatory machinery, they insists that
this legislation need to be proven. The issue with this concept is the lack of a cost benefit
analysis; it would have been useful to understand the benefits that one should expect to flow
from Section 404, if it worked as intended. Orcutt (2009) also suggested that SOX legislation
appear to have created a basis for companies to improve the efficiency of financial management.
The strategy employed by the CIO will either enhance direct cost or improved loss avoidance,
through enhanced security and safeguards. Section 404 also exists to ensure companies develop
Enterprise Risk Management (ERM) programs, which address all sources of risk, not just
financial reporting (Sutton & Arnold, 2005). Xue, Liang and Boulton (2008) supported this
argument which points out that there need to be a framework for strategic risk management. In
their agreement they also endorsed Orcutt arguments, stating a need for integration so that

55
various facets of strategic business risk can be linked with the overall goals of the business where
one aspect of the enterprise may be creating strategic risks analysis for another part of the
business.
Hall and Liedtka (2007) concluded that there are potential benefits of large-scale IT
outsourcing. These facts they say are well known because IT service vendors are aggressively
marketing the idea that they have the time and resources to handle complex SOX
implementation. The benefits to the client include, focus on core business, improved IT
performance, reduced IT cost and finally special arrangement that include the sale of the clients
IT unit that will bring large cash influx to the client. Cook, Probert, and Martin (2009) rejected
the assumption of prosperity and contended that the long term effect can be devastating on the
wider economy; they argued that although the IT industry has rebounded and is projected to be
the fastest growing economy between 2002 to 2012, the threats of outsourcing and off shoring of
IT jobs is present in the minds of many IT professionals at all stages. They even goes further to
say that this is an irreversible trend that will continue to increase.
Discussion
The contribution to the literature domain is to identify how a firm‟s IT governance
structure and IT-business alignment are affected based on the levels of IT strategic alignment.
The aim of this research was to present a framework that demonstrates improvements in strategic
alignment of the business and functions in IT and to respond to a gap based on previous IT
governance research. This quantitative study therefore extract and explore data that impacted IT
governance structure and IT strategic alignment using the Luftman (2003) model and replicating
the Asante (2010) study. Miller (2006) supports Luftman (2003) study by suggesting that
alignment of IT governance with strategic alignment helps organizations measure their current

56
state of capabilities. However, Luftman and Brier (1999) research indicated a distinct difficulty
that faced organizations is the problem of achieving IT strategic alignment. Luftman (2003) then
identified these capabilities as maturity models and the conclusion of this research yield the
answers for strategic alignment level of a company‟s maturity. In addition to a discussion by
Luftman and Kempaiah (2007), organizations must be able to operate and assess its
communication, competence, value measurement, governance, partnerships, technology and
skills and hence bring about a direct connection between IT governance structure and IT-
business alignment.
In addition to maturity levels of the organization, the study adds two moderating
variables, industry type (Kotey, 2007) and organization size (Gupta, 2010), which are
represented in hypotheses 1–4 and are also significant in the research when considering business
entities such as limited liability company, corporation and government sector while looking at
the number of employees and the span of control within the organization (Gupta, 2010).
Finally, for the effective completion of an IT governance process, controls are required to
be in place. Every process has a purpose or objectives, and inputs and outputs. It also has a risk
of objectives not being met. The controls may reduce the probability of an event occurring, or
mitigate the impact of these threats if materialized. The objective of the IT Governance and IT
governance frameworks such as COBIT and ITIL is to generate a comprehensive risk and control
profile.
Literature Review Summary
The integration between information technology governance (ITG) and corporate
governance systems are becoming more complex, especially with the advent of WorldCom,
Enron, and Tyco scandals. Regulators found it necessary to reduce the misuse and the abuse of

57
company‟s resources by executives. The literature revealed that honest and capable boards are
needed to implement and maintain a good governance environment.
Governance framework such as Sarbanes-Oxley (SOX), remind executives that officers
of the corporation is liable for misuse of resources and any actions taken; and shareholders are
now seeing accountability from decision makers in corporations. Alkhafaji, research articulated
that “with corporation complying with Sarbanes-Oxley act a positive implication of corporate
governance resolution and with legislative acts being put into place, corporations have a chance
to gain positive image again by obeying the regulations and practicing good business ethics”
(p.201).
The evolution of SOX will no doubt help companies meet the stringent governance
regulations, since the generation of accurate and transparent reports is in effect meeting the
requirements of SOX. Companies in compliance with SOX will see the benefits, this starts with
the fact that IT issues are now on the agenda of the board meetings and IT issues are dealt with
as important business issues. The literature revealed that the CIO and CFO will have to work
together to comply with SOX requirements, they end up creating a mutually beneficial approach
that integrates both divisions and ensures that IT controls are updated as necessary to financial
reporting processes (Hardy, 2006). Accordingly Hardy states, organizations will never be 100%
free from threats, additionally these organization application of legislation will not guarantee
complete IT assurance and privacy. However, “building a strong governance model within IT
that is designed to ensure accountability and responsiveness to business requirements can lead to
more efficient and effective operations” (p.60) which include an improved organizational
understanding of IT governance among non-IT executives, these executives in effect produce
timely information that will align the IT initiatives with business goals.

58
CHAPTER 3. METHODOLOGY
Purpose of the Study
The purpose of this quantitative correlation study was to test the extent to which levels of
IT strategic alignment (Dependent variable) relates to the IT governance structure (Independent
variable) within the organization, focusing on the study of the federal IT governance structure.
Further analysis also measured the degree of the impact between these variables.
The independent variable IT governance structure was defined as a combination of
factors including leadership, structure and processes that ensured that IT governanceachieves
integration of business and IT (Grembergen, 2002). The dependent variable levels of IT strategic
alignment was defined as the combined engagement of all IT units‟ strategic, plans processes,
investments and decision to support the overall functionality and purpose of the organization
goals and objectives (Khadem, 2007) , and the contributing variables included IT principles, IT
architecture, IT infrastructure, business application needs and IT investment prioritization that
contributes to IT planning and decision making through various committees such as the IT
governance, steering and standard committees.
The researcher believes that with the inclusion of Luftman (2003) strategic alignment
model (SAM), organizations will demonstrate improvements in strategic alignment of the
business and functions in IT. The research explored selected IT firms made up of businesses and
IT professionals who made decisions regarding the organization and therefore provide a point of
reference for further research and business applications.

59
Research Questions and Hypotheses
Two research questions and associated hypotheses were derived from theory and past
research to determine if there was a relationship between federal IT governance structure and
levels of IT strategic alignment. Each hypothesis had an alternative and null statement. An
alternative hypothesis statement (H1a and H2a) indicated a significant mean difference between
the variables while null hypothesis statement (H10, and H20) indicates no difference between the
variables.
In reviewing the literature it was observed that there exists a gap between IT governance
structures and IT alignment models with varying maturity levels within organizations. According
to Reich and Benbasat (2000) there still exists organizations that are not aware of factors that
contribute to the alignment of IT functions and because of them not being aware, this in turn
affects their level of alignment. This in turn may lead to disorganized units because of a lack of
alignment between business units and information technology (IT) strategy that then cause an
increase in operation costs and erosion of the organizations competitive advantage (Sage, 2006).
The intent of this dissertation was to examine and test the effects of these relationships. The
questions proposed were:
Research Question 1: What type of relationship exists between IT governance structure
and IT-business strategic alignment?
IT governance speaks to the organizations capacity as a unit to specify decision making
rights within the firm to encourage desirable behavior (Weill & Ross, 2004). IT governance has a
combination of factors including leadership, structure and processes that ensures that IT
governance achieves integration of business and IT (Grembergen, 2002). Ko and Fink (2010)
states, “IT governance structure is the single most important predictor of whether an organization

60
will derive value from IT” (p. 664). There are three basic forms of this governance structure,
centralized, decentralized and federal, the research expound on these structures.
Research Question 2: What type of relationship exists between federal IT governance
structure and IT-business strategic alignment?
According to Luftman (2003) the federal governance structure is combination of
centralized and decentralized models. Asante (2010) also submitted that the federal mode is the
process where central corporate management makes decision through an IT unit regarding
central systems while the functional unit decides the authority and responsibility regarding
resources. The research questions developed identified the relationship between each factor, and
the survey instrument was delivered to the appropriate IT professionals based on the target
population.
The main research hypotheses and null hypotheses therefore reads:
H10: There is no relationship between IT governance structure and IT-business strategic
alignment.
H1a: There is a positive relationship between IT governance structure and IT-business
strategic alignment.
H20: There is no relationship between federal IT governance structure and IT-business
strategic alignment.
H2a: There is a positive relationship between federal IT governance structure and IT-
business strategic alignment.
In addition to these hypotheses, contributing variables will be studied to discover the
relationship between, industry type, organization size. These hypotheses are:

61
H30: The relationship between IT governance structure and IT-business maturity level
remains the same regardless of industry type.
H3a: The relationship between IT governance structure and IT-business maturity level
varies by industry type.
H40: The relationship between IT governance structure and IT-business maturity level
remains the same regardless of organization size.
H4a: The relationship between IT governance structure and IT-business
Maturity level varies by organization size.
Conceptual Framework
A conceptual framework is a graphical depiction of the constructs and the variables
associated with these constructs that eventually guide the research presented. The research
therefore presents a conceptual model that is a representation of the prospective correlation under
investigation (see Figure 8)
Figure 8. Conceptual Model for IT governance independent and dependent variables

62
Instrumentation
The data for this research was gathered using an existing instrument on how IT strategic
alignment impact IT governance structure (Asante, 2010), and will be adapted with
modifications to include Luftman (2003) strategic alignment model (SAM) and ITG archetypes
research by Weill and Ross (De Haes & Gremebergen, 2007; Weill & Ross, 2004; Wu, 2007;
Ross et al. 2006). Permission was obtained from Luftman to use the instrument.
Operationalization of variables
The following section identified the variables mentioned in the hypotheses, and is then
followed by how these variables were operationalized. Appendix B then showed each variable
frequency using the Luftman questionnaire. The study uses three types of variables; independent
measuring governance structures, dependent variables measuring IT-business alignment and
moderating variables measuring industry type and organization type. Demographic information
was also collected using this instrument.
Independent Variable
The independent variable is a construct that predicts the dependent variable by measuring
governance structures. The independent variable was measured by using the survey questions as
displayed in table 8. The governance structure centralized, decentralized and federal governance
structures were the variables for the hypotheses structures.
Table 8
IT Governance Structures
How is IT organized in your company (Q3) Centralized
Decentralized
Federated/Hybrid

63
Dependent Variables
According to Ampofo (2004), a dependent variable is a construct that is determined by
another construct called the independent variable. The dependent variable measuring IT-business
alignment levels; optimized, managed, defined, repeatable, initial, non-existent was done by
using the survey questions as displayed in table 9, the survey instrument is shown in appendix A.
The dependent variables were measured at the interval nominal, and interval level
respectively while the independent variables were measured at the interval level. The instrument
was uploaded to a commercial web-survey hosting page, which was used to measure the
independent and dependent variables. Before distribution of the research instrument, Institutional
Review Board (IRB) approval was secured and included through the appropriate processes and
permission was included from the authors for the use of the instrument (see Appendix A). The
use of the instrument by Asante was first administered by Luftman (2000) and again in 2003 and
2005 (Luftman, 2003; Sledgianiwski & Luftman, 2005; Luftman, 2005) where he measured over
50 Global 500 companies (Asante, 2010; Luftman, 2003) by using the instrument to assess the
maturity of an organization‟s IT, business strategic alignment; thereby supporting the content
validity and face validity.
Table 12 provides a summary of each hypothesis with its associated dependent variable,
independent variable, moderating variable, levels of measurement, description of each variable
and statistics that was used.
To measure IT-Business alignment, Table 9 displays the varying levels of alignment and
instrument survey questions as suggested by Luftman (2003).

64
Table 9
IT-Business alignment
Measurement of the Competency and Value of (Q10-17)
IT Governance (Q18-24)
Partnerships between IT and Business Functions (Q 25-30)
Alignment
Optimized
Managed
Defined
Repeatable
Initial
Non-existent
Moderating Variable
Industry type and organization size are contributing variables in the study (see Table. 10
and Table 11). A test of interaction was conducted between the variables using the two-way
interaction which is the relationship between an independent variable (IV) and dependent
variable (DV), moderated by a third variable (Norusis, 2008). Whereas, the relationship that exist
with the effect of independent variable (X) on dependent variable (Y) depends on the level of
another variable (Z), and is called an interaction. And is represented as;
Regression Model will be: Y = a + bX+ cZ. It was also recommended the independent variable
and contributing variables are standardized before calculation of the product term, although this
is not essential. For example, Ha: The relationship between IT governance structure (X) and IT-
business maturity level (Y) varies by industry (Z)
According to Norusis (2008), this is done by studying the effect ofa plusb, plus c
interacting with X, where a = mean score, b = teaching method effect, and c = student type

65
effect, the result is “12 independent groups of students, one for each combination of teaching
method and student type” and Y becomes the predicted score (p. 338). However, if there is no
interaction between the methods tested, it makes no sense in studying the main effect of the
methods under investigation. Therefore, “when there is no interaction, the user can predict
average score” for each method (p. 339). On the other hand, when the test presents an
interaction, it becomes more difficult to interpret and at this point a term is needed for the
combination of each method. The researcher then tested the two hypotheses using an analysis-of-
variance around the population values. Each contributing variable is then broken down with
associated hypotheses:
1. Industry type. This term refers to a legal business entity that operates for-profit or
not for-profit to achieve a set objective (Kotey, 2007).To measure this variable a 7-point likert
scale was used where (1) Government/Military, (2) Finance/Banking/Insurance, (3)
Manufacturing, (4) Healthcare/Medical (5) Biotech, (6) Telecommunications, (7) Other and will
inform the research of the legal structure used (Asante, 2010). The study then tested the
following hypotheses H3a: The relationship between IT governance structure and IT-business
maturity level varies by industry type. H30: The relationship between IT governance structure
and IT-business maturity level remains the same regardless of industry type.
Table 10
Moderating variable measuring Industry Type
Industry Type/
As a legal business entity
Government/Military
Finance/Banking/Insurance
Manufacturing
Healthcare/Medical
Biotech
Telecommunications
Other

66
2. Organization size. This is determined by the number of employees, the size of
the firms operations and its span of control within its operations, where the span of control
relates to the number of employees reporting to a specific manager (Gupta, 2010). To measure
this variable a 5-point likert scale was used where (1) represents smallest number of employees
(less than 1,000) and (5) is considered largest (more than 50,000), and will indicate the size the
organization is currently at. The study then tested the following hypotheses H4a: The
relationship between IT governance structure and IT-business maturity level varies by
organization size. H40: The relationship between IT governance structure and IT-business
maturity level remains the same regardless of organization size.
Table 11
Moderating variable measuring Organization size
Organization size/
By number of employees
1 represents (less than 1,000) employees
2 represents (1,000-5,000) employees
3 represents (5,000-10,000) employees
4 represents (10,000-50,000) employees
5 represents (more than 50,000-) employees
Demographics Questions
Questions relating to the company‟s revenue and percentage allocated to Information
Technology along with IT executive reporting relationships, organization of IT, participants
department, age group, educational level, career level, industry type, years of relevant work
experience and size of organization were asked in Section 1.

67
Table 12
Operationalized constructs
Variables Type Measure Description
IT Governance
Structure
(IV) Nominal This is the organizations capacity as a unit
to specify decision making rights within
the firm to encourage desirable behavior
(Weill & Ross, 2004).
Federal IT Governance
Structure
(IV) Nominal
This is a combination of centralized and
decentralized models (Luftman, 2003).
IT Business Maturity
Level
(DV) Ordinal Assessment of the maturity level using
(ITGI, 2003).
Industry Type (Mod) Category legal business entity, that is for-profit or
not-for-profit (Kotey, 2007).
Organization Size (Mod) Category The number of employees, the size of the
firms operations and its span of control
within its operations (Gupta, 2010).
Table 13
Relationship between the Research Hypotheses and the Survey Questions
Research Hypotheses How Survey Questions was Analyzed Survey
Questions
H10: There is no
relationship between IT
governance structure and
IT-business strategic
alignment.
Kruskal-Wallace one-way ANOVA was used to
ascertain the relationship between IT governance
structure and IT-business strategic alignment by
looking on the effectiveness of IT and business
communications, governance and partnership
between IT-business functions.
Questions
4-9,18-24,
25-30 and
31-35
H20: There is no
relationship between federal
IT governance structure and
IT-business strategic
alignment.
Mann-Whitney U test was used to ascertain the
relationship between federal IT governance
structure and IT-business strategic alignment by
looking on the effectiveness of IT and business
communications, governance and partnership
between IT-business functions.
Questions
4-9,18-24,
25-30 and
31-35
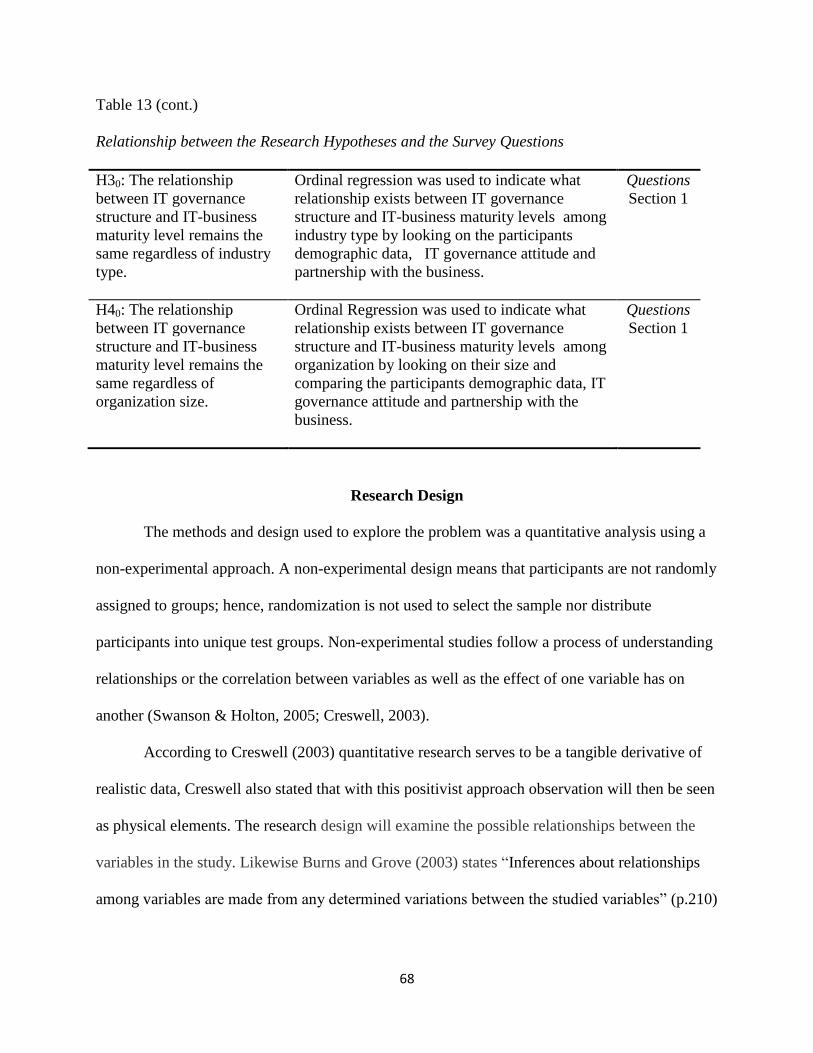
68
Table 13 (cont.)
Relationship between the Research Hypotheses and the Survey Questions
H30: The relationship
between IT governance
structure and IT-business
maturity level remains the
same regardless of industry
type.
Ordinal regression was used to indicate what
relationship exists between IT governance
structure and IT-business maturity levels among
industry type by looking on the participants
demographic data, IT governance attitude and
partnership with the business.
Questions
Section 1
H40: The relationship
between IT governance
structure and IT-business
maturity level remains the
same regardless of
organization size.
Ordinal Regression was used to indicate what
relationship exists between IT governance
structure and IT-business maturity levels among
organization by looking on their size and
comparing the participants demographic data, IT
governance attitude and partnership with the
business.
Questions
Section 1
Research Design
The methods and design used to explore the problem was a quantitative analysis using a
non-experimental approach. A non-experimental design means that participants are not randomly
assigned to groups; hence, randomization is not used to select the sample nor distribute
participants into unique test groups. Non-experimental studies follow a process of understanding
relationships or the correlation between variables as well as the effect of one variable has on
another (Swanson & Holton, 2005; Creswell, 2003).
According to Creswell (2003) quantitative research serves to be a tangible derivative of
realistic data, Creswell also stated that with this positivist approach observation will then be seen
as physical elements. The research design will examine the possible relationships between the
variables in the study. Likewise Burns and Grove (2003) states “Inferences about relationships
among variables are made from any determined variations between the studied variables” (p.210)

69
To support Creswell, Johnson & Onwuegbuzie (2004) states “The major characteristics
of traditional quantitative research are a focus on deduction, confirmation, theory/hypothesis
testing, explanation, prediction, standardized data collection, and statistical analysis” (p. 18).The
basic design of this non-experimental study led to identifying the relationship between IT
strategic alignment and organizational governance factors. The research is suggestive because
the research does not control the participants or the variables used.
The attitude of the sample population was already formed; their behavior, expectations
and attitude were assumed to be constant. The researcher will not influence the participant‟s
opinion.
Appropriateness of Design
A quantitative non-experimental study will focus on the relationship between IT
governance structure and IT strategic alignment; this design enables the collection of data from a
large population. Additionally, a high number of participants from the population will be needed
to represent an adequate sample size from a specific demographic.
According to Creswell (2003), the non-experimental approach is used in this study; this
approach allows the study to see comparisons among the variables presented. In addition a single
researcher can accomplish much more in a short time-frame because the variables were gathered
at the phenomenological level, versus a longitudinal study which will not suffice since it requires
the researcher to gather data over an extended time period. The aim of the study was to focus on
the firms IT governance structure, namely centralized, decentralized and federal IT governance
structures. The two constructs (IT Governance structure, IT Strategic alignment) are viewed as
somewhat stable and measurable at any given point in time without any differences in result

70
within that time-frame. The research will then apply closed ended question from the Luftman
(2003) instrument to test relationships between the variables.
According to Swanson and Holton (2005), these variables in most cases evolve and
change over extended time period, but the hypotheses were deduced to be evaluated within a
specific time-frame regardless of when this time-frame occurs. Moreover, the survey data was
collected at the interval and ordinal levels which mean that inferential statistics along with
specific analysis were employed to analyze the research questions.
Survey Design
The data was gathered through a web-based collection method. The instruments design
encapsulated some of the survey questions used by Luftman (2003) model for IT governance
structures and also included Luftman‟s strategic alignment model (SAM) to answer the research
questions. The resulting response was used to analyze the research responses from the
participants. Using a web-based survey was more efficient and cost effective especially as it
relates to geographical locations of the participants. It was also expected that more responses will
be generated using this medium of survey. A summary of the questions relating to strategic
alignment area is represented in Table 14.
Table 14
Summary of the questionnaire from the instrument
Section Area Questions
Section 1
Section 2
Component 1
Participants demographic survey
Questionnaire
Effectiveness of IT and Business Communications
1-3
4-9

71
Table 14 (cont.)
Summary of the questionnaire from the instrument
Component 2
Component 3
Measurement of the Competency and Value of IT
Governance
10-17
18-24
Component 4 Partnerships between IT and Business Functions 25-30
Component 5 Scope and Architecture of the IT Infrastructure 31-35
Component 6 Skills 36-42
Population and Sample
The foundation of this research was to examine relationships that exist between IT
governance structures and IT strategic alignment in the organization. This was done by
examining firms that implement IT governance processes by sourcing data from their CEOs,
CIOs, business executives and IT professionals who played a part in the implementation of IT
governance within the organization. The research also included those professionals who were in
a non-managerial role from both IT and business but can contribute adequately to this research.
The target population was from the private sector personnel who hold the requisite qualification
to give an accurate assessment.
The sampling frame contained about 3000 business professionals from medium and large
sized companies in the United States and the power analysis will identify the number of survey
response needed. The target population was reached through an online distribution for the
research, these were members of the governance organization, Information Technology
Governance Institute (ITGI) whose membership include IT governance professionals who are
familiar with IT Governance implementations.
72
Sample Size
To calculate the sample size the level of significance needed to reject the null hypotheses,
the effect size of the sample under investigation were considered for the power analysis. In
addition, Cohen (1988) suggests that “an expected effect” was an estimate measurement of the
strength of the relationship, in most research the statistical level of .05 is the norm. This
confidence level suggests the resulting research can be replicated with the probability being
equal to .05 which is the significance level also called alpha (p.278).
Cohen (1988) submitted five factors for power analysis significance level or criterion,
effect size, desired power, estimated variance and sample size; “he states that the objective of the
analysis is to calculate an adequate sampling size so as to optimize as opposed to maximizing
sampling effort within the constraint of time and money” (p.367).
To achieve the calculated sample size of 88; a random sample was used to ensure no
sampling bias affecting the integrity of the survey participants (Swanson & Holton, 2005). This
subset was a representation of the population and ensures that each participant have the same
probability of being selected.
Validity and Reliability
The validity and reliability of the study‟s instrument was proven by several researchers
(Luftman, 2003; Sledgianiwski & Luftman, 2005; Luftman, 2005). Evidence of the instruments
validity and reliability can be seen in recent work of several researchers on the topic who
investigated ITG structures and IT strategic alignment (Asante, 2010; Luftman, 2003; Nash,
2006; Dorociak, 2007). A study should have supported construct validity and reliability to be
acknowledged as a grounded scientific research (Creswell, 2003). Prior to distribution of the
survey, instrument checks were put in place to eliminate redundancy and duplicate entries.

73
Additionally this process was analyzed in the pilot test. Presenting a research to an audience is
stating that the research findings are truthful and valid. The result of the study should also
answer whether the research can be used by another group or this study irrespective of the
population size. Additionally, Robson (2002) states that “Reliability is concerned with the
repeatability of the study; that is, whether the same results can be produced if the same data
collection and analysis methods are employed in a new study” (p. 93). Validity according to
Cooper & Schindler (2003) deals with whether the measurements provide the information
needed to answer the question under investigation; Robson (2002) states it more simply as
“whether the findings are „really‟ about what they appear to be about” (p. 93).
Data Collection Procedures
Data collection for this research was based on existing instruments, which was distributed
using an online web-based survey. It was incumbent on this researcher to clearly define the target
population. “The population is defined in keeping with the objectives of the study” Stat Pac
(2007). The data that was collected by the commercial website was coded and linked through a
secure link on their web server, so as to keep participants privacy as required by the IRB.
Approvals granted by the IRB were provided by a link on the first page of the questionnaire. The
sample reflected the characteristics of the population from which it was drawn. All data that was
collected was uploaded into SPSS for further examination and the data then removed from the
contracted site to maintain confidentiality.
Data Analysis
Data analysis was done using SPSS version 20.0 for Windows (IBM, 2010). Results for
the study were presented in Chapter 4. The collection of data from the sample was distinct
categories that were aligned with the variables presented. Chapter 4 covered data coding,
74
descriptive statistics, data analysis and results, moderating hypothesis and summary sections.
The data coding section included the number of respondents to the survey and information for
missing data. The descriptive statistics included the summary for the presented hypotheses linked
to the dependent and independent variables and also showed its relationship to the research
question and how these questions were answered. The data analysis and results section presented
each hypothesis statistical application and any assumptions that surround each case presented,
and finally the results from these applications. The summary results section reviewed the study
and the design of the study including results and what should be the expectations found in
chapter 5.
Statistical techniques were employed to display where applicable descriptive statistics.
Additionally, graphs were presented to give a graphical overview of the results. A zero-order
correlation table and logistic regression tables and supporting figures were displayed showing the
relationship and effect. Additional techniques such as Kruskal-Wallis and Mann-Whitney U test
was conducted with a significant level of .05 to ascertain the level of responses, in addition an
ordinal logistic regression was computed on the moderating hypotheses to determine if the
independent and dependent variable are affected by these moderation. To identify research
participants, characteristics representing variables were used to profile participants; these
variables include age, years of experience and education level and were presented in tables.
To identify outliers and missing data, samples were collected along with frequency
counts using SPSS; if a case was presented but cannot be statistically part of the sample it was
removed. In cases where 5 percent or more of the item were missing they were removed.
75
To identify patterns with the study group, demographic data was inputted then additional
statistical application was presented and tested. Further, normality was evaluated to ensure
parametric assumptions are met.
Kruskal-Wallis, Mann-Whitney U test and ordinal regression analyses was run to
determine the type of relationship that existed between the IT strategic alignments (Dependent
variable), IT governance structure (Independent variable), with a focus on federal IT governance
structure. Finally, a look on how the two moderating variables, industry type and organization
size affect these relationships.
Assumptions and Limitations
The problem put forward assumes that practitioners are willing to divulge information to
the researcher and the questions submitted was answered truthfully and completely. It was also
assumed that practitioners were responding to the questions in a timely manner to ensure the
research is current and is addressing its audience appropriately. It was further assumed that the
selected instrument for this study was a valid, reliable, and appropriate to the study‟s focus.
To narrow the focus of the study, a few selected industries were used along with selected
areas of the industry. The research direct their attentions to firms that implement IT governance
processes and include CIO, executives and professionals who are a part of the decision making
process in the implementation of IT governance within the organization. This researcher also
includes those professionals who are in a non-managerial role from both IT and business and
who are members of a specific group and demographics, but contributes adequately to the
research. The target population was within the United States and may constitute response from
both private and public sector personnel that hold the requisite qualification to give accurate
assessment.

76
Given this narrow focus, the results of this study cannot be expected to generalize to
other industries or populations. Another limitation is the fact that some participants do not have
the full understanding of IT governance frameworks, and therefore they may not be able to
complete study‟s questionnaires, which will result in lower response rates for some questions.
Another fundamental limitation was the lack of funding and time factor available for
respondents to complete the research instrument.
Ethical Considerations
As required by the Institutional Review Board (IRB), participants who complete an
online survey also need to understand the guidelines set by such board before entering
information in the survey. These guidelines are developed by various professional organizations
and regulatory agencies so as to eliminate potential harm to research subjects. Kvale (1996)
found that “ethical issues that involve research such as informed consent, confidentiality and
consequences for the interviewee should be taken into account with any research” (p.110).
Persons involved in research was informed about the purpose of the investigation and the main
features of the research design; they were also informed about what they are getting into and
with some degree of understanding of how this information will be stored and used (Zikmund,
2003). During the research process, the question of informed consent was answered. According
to Weijer, Goldsand, Emanuel (1999) this is a mechanism that help with the assurance process
that enable people to have an understanding of the research process and what their involvement
means.
Using informed consent can categorically be considered as one of the most important
features of the research process. This process goes beyond a form that is signed on a piece of
paper by an individual, but represents inclusion of an ethics committee and includes approval
77
processes and procedures to proceed in the research. Accordingly, “an informed consent form is
appropriate for all research especially when participants may be exposed to risks” (National
Institutes of Health, 1979).
Summary
This chapter described the methodology with which the researcher conducted an
exploratory research on IT governance structures relationship with IT strategic alignment using
an existing instrument design. The surveys were conducted online and require a pilot test to
ensure an efficient instrument. The researcher will provide a basis for future research on the
topic.

78
CHAPTER 4. RESULTS
Introduction
This chapter provides an analysis using a non-experimental approach on data collected as
described in chapter 3. The analysis is supported by quantitative statistical tables and figures to
describe the results. The purpose of this quantitative correlation study is to test the extent to
which IT strategic alignment relates to the IT governance structure and federal IT governance
structure within the organization. Further analysis also measured the degree of the impact
between these variables.
Data Coding
One hundred and thirty-eight individuals responded to the survey. The data was entered
into SPSS 20 for analysis. Data was screened for accuracy and quality. Missing answers of more
than 5 percent were removed from analysis. Frequencies and percentages were conducted on IT
governance structure, federal IT governance structure, industry type, and IT-business strategic
alignment. The assumption of each analysis was examined prior to conducting the analysis.
The use of frequency distribution allowed responses to be measured and determined if
value were within reasonable scope for measurement; no cases were removed for inaccuracy. An
examination of values was evaluated for inconsistent data with each case, initially, all cases
remained. The occurrence of outliers was tested by the creation of z scores. Z scores were created
for previous years‟ revenue and IT budget as a percentage of revenues and responses were
examined for outliers. Three cases were then removed. The responses from 135 participants were
included in the final data analysis.

79
Descriptive Statistics
Of the 135 participants; Fifty or 37% said that the CIO reported to the CEO, president, or
chairman of the company. Table 15 shows the following frequencies and percentages for
reporting relations.
Table 15.
Reporting relations
Characteristic n %
CIO reports to:
CEO, president, chairman 50 37
CFO 13 10
COO 21 16
Business unit executive 44 33
Other 7 5
Note. Percentages column may be over or under 100%.
When asked how IT is organized, 66 participants, or 49%, selected centralized and 35
participants, or 26%, indicated federated or hybrid. Table 16 shows the following frequencies
and percentages for IT organizational structure.

80
Table 16
IT organizational Structure
Characteristic n %
IT organization
Centralized 66 49
Decentralized 22 16
Matrixed 4 3
Networked 8 6
Federated/hybrid 35 26
Note. Percentages column may be over or under 100%.
Participants were asked to report their hierarchical distance from CEO and many participants
indicated 3–4 levels Fifty-One or 38%, followed by 1 – 2 levels 28%, and greater than 4 levels
21%. Eighteen or 13% participants indicated that they are the CEO. Table 17 shows the
following frequencies and percentages for Hierarchical distance from CEO.
Table 17
Frequencies and Percentages for hierarchical distance from the CEO
Characteristic n %
Hierarchical distance from CEO
CEO 18 13
1 – 2 levels 38 28

81
Table 17 (cont)
Frequencies and Percentages for hierarchical distance from the CEO
Characteristic n %
3 – 4 levels 51 38
More than 4 levels 28 21
Note. Percentages column may be over or under 100%.
Thirty-eight or (28%) participants indicated they work in the IT department, followed by
thirty-one or (23%) in business units and corporate thirty or (22%): It is important to note that
under the category “Others”, the respondents indicated micro-finance and financial consultants
had Seven or (5%) contribution to the study. Table 18 shows the following frequencies and
percentages for department.
Table 18
Frequencies and Percentages for department
Characteristic n %
Department
Business unit 31 23
IT 38 28
Finance 19 14
HR 10 7
Corporate 30 22
Other
Note. Percentages column may be over or under 100%.
7 5

82
Many participants indicated they are 35–45 years old representing Forty-five or 33%,
followed by ages 45–55 representing Thirty-eight or 28%. Twenty participants (14%) indicated
they fell in the age range > 55. Table 19 shows the Age frequencies and percentages.
Table 19
Frequencies and Percentages for Age
Characteristic n %
Age
< 25 13 10
25 – 35 19 14
35 – 45 45 33
45 – 55 38 28
> 55 20 15
Note. Percentages column may be over or under 100%.
Those respondents with a Bachelor‟s degree Fifty-four or 40%, was the most frequent
education level, followed by MBA/Master‟s degree holders Forty-four or 33% and holder of
PhD/Doctorate, Nine or 7%; Respondents indicating other degree was One representing 1% are
holders of professional certification in their field of work. Table 20 shows the following
frequencies and percentages for educational level.

83
Table 20
Frequencies and Percentages for Educational level
Characteristic n %
Education
Some college 18 13
Bachelor‟s degree 54 40
MBA/master‟s degree 44 33
Post master‟s degree 7 5
Ph. D./Doctorate 9 7
Post doctorate 2 2
Other 1 1
Note. Percentages column may be over or under 100%.
Thirty-six participants or 33% identified staff as their career level followed by Executives
at Thirty (5%) and Senior Managers (11, 8%), indicating that 5% of the 135 respondents are a
part of senior management and above. Table 21 shows the following frequencies and percentages
for career level.
Table 21
Frequencies and Percentages for Career level
Characteristic n %
Career level
Entry 2 2
Staff 36 27

84
Table 21 (cont.)
Frequencies and Percentages for Career level
Characteristic n %
Career level
Supervisor 23 17
Manager 18 13
Mid-level manager 15 11
Senior manager 11 8
Executive 30 22
Note. Percentages column may be over or under 100%.
Forty-Five respondents or 33%, indicated they work in the finance, banking, or insurance
industry followed by Healthcare/Medical Sector with Thirty-Two respondents (24%) and
Government/Military with Twenty-six respondents (19%). Table 22 shows the following
frequencies and percentages for industry.
Table 22
Frequencies and Percentages for Industry
Characteristic n %
Industry
Government/military 26 19
Finance/banking/insurance 45 33
Manufacturing 7 5
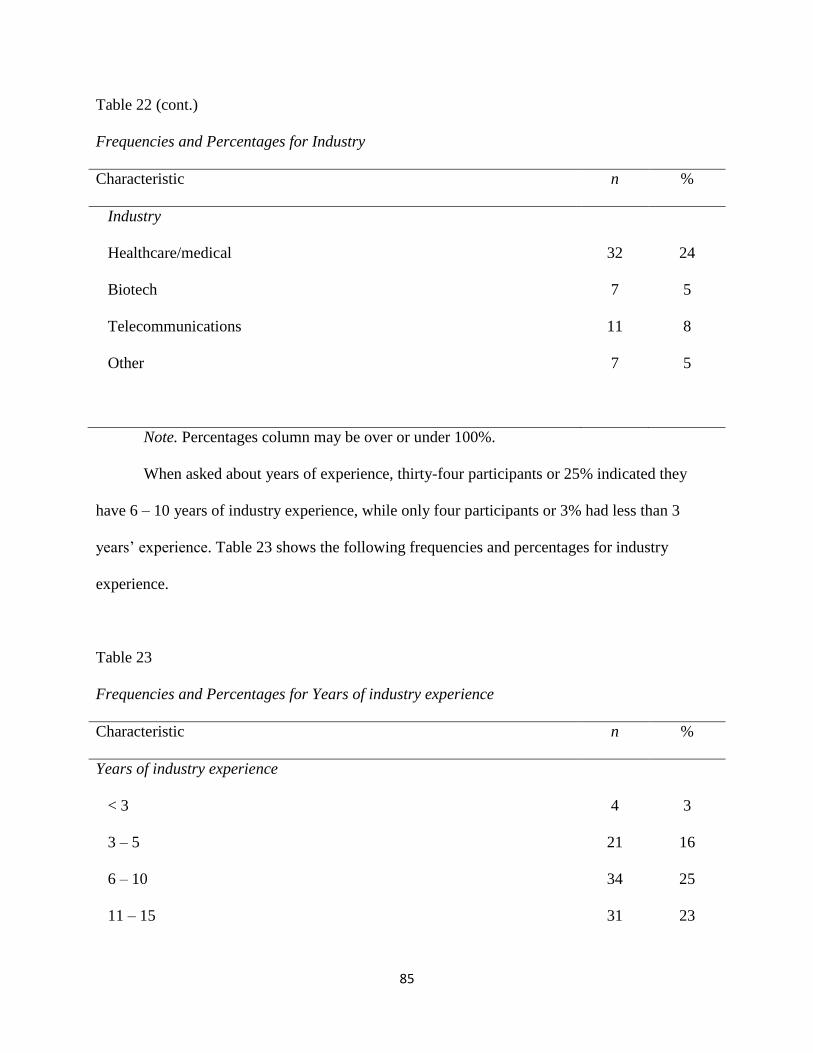
85
Table 22 (cont.)
Frequencies and Percentages for Industry
Characteristic n %
Industry
Healthcare/medical 32 24
Biotech 7 5
Telecommunications 11 8
Other 7 5
Note. Percentages column may be over or under 100%.
When asked about years of experience, thirty-four participants or 25% indicated they
have 6 – 10 years of industry experience, while only four participants or 3% had less than 3
years‟ experience. Table 23 shows the following frequencies and percentages for industry
experience.
Table 23
Frequencies and Percentages for Years of industry experience
Characteristic n %
Years of industry experience
< 3 4 3
3 – 5 21 16
6 – 10 34 25
11 – 15 31 23

86
Table 23 (cont.)
Frequencies and Percentages for Years of industry experience
Characteristic n %
Years of industry experience
16 – 25 27 20
>25 18 13
Note. Percentages column may be over or under 100%.
Sixty participants or 44% indicated their company is comprised of less than 1,000
employees while inversely, three participants or 2% indicates they have over 50,000 employees.
Table 24 shows the following frequencies and percentages for number of employees.
Table 24
Frequencies and Percentages for Number of Employees
Characteristic n %
Number of employees
< 1,000 60 44
1,000 – 5,000 36 27.
5,000 – 10,000 27 20
10,000 – 50,000 9 7
> 50,000 3 2
Note. Percentages column may be over or under 100%.

87
Eighty-two participants or 60% represents a majority of the respondents, said they have
less than 100 employees in the IT department followed by 100–250 with Thirty-Three or 24%.
Table 25 shows the following frequencies and percentages for employees in IT.
Table 25
Frequencies and Percentages for Number of IT employees
Characteristic n %
Number of employees in IT
< 100 82 61
100 – 250 33 24
250 – 500 11 8
500 – 1,000 8 6
> 1,000 1 1
Note. Percentages column may be over or under 100%.
Last years‟ revenues for the companies ranged from $200,000 to $8,600,000,000 with a
mean of $223,996,679.40. IT budget as a percentage of revenue ranged from 0.25% to 15.00%
with a mean of 3.21%. Means and standard deviations for last years‟ revenues and IT budget as a
percentage of revenue are presented in Table 26.
Table 26
Means and Standard Deviations for Revenues and IT Budget as a Percentage of Revenues
Characteristic M SD
Revenue 223,996,679.40 823,151,372.40
IT budget as a percent of revenues 3.21 2.54

88
Table 27 depicts respondents‟ breakdown of how IT is organized in companies. Centralized
organizations accounts for almost 49% of this allocation, while decentralized are represented by
16.3%.
Table 27
How is IT organized in your company?
Frequency Percent Valid Percent Cumulative Percent
Valid
Centralized 66 48.9 48.9 48.9
Decentralizxed 22 16.3 16.3 65.2
Matrixed 4 3.0 3.0 68.1
Networked 8 5.9 5.9 74.1
federated/hybrid 35 25.9 25.9 100.0
Total 135 100.0 100.0
Data Analysis and Results
Hypothesis One
H10: There is no relationship between IT governance structure and IT-business strategic
alignment.
H1a: There is a positive relationship between IT governance structure and IT-business strategic
alignment.
To assess hypothesis one and to determine what type of relationship exists between IT
governance structure and IT-business strategic alignment, a Kruskal-Wallis one-way analysis of
variance (ANOVA) was conducted. Prior to conducting the Kruskal-Wallis, the assumptions
were examined. The assumptions include that samples were drawn from the population at
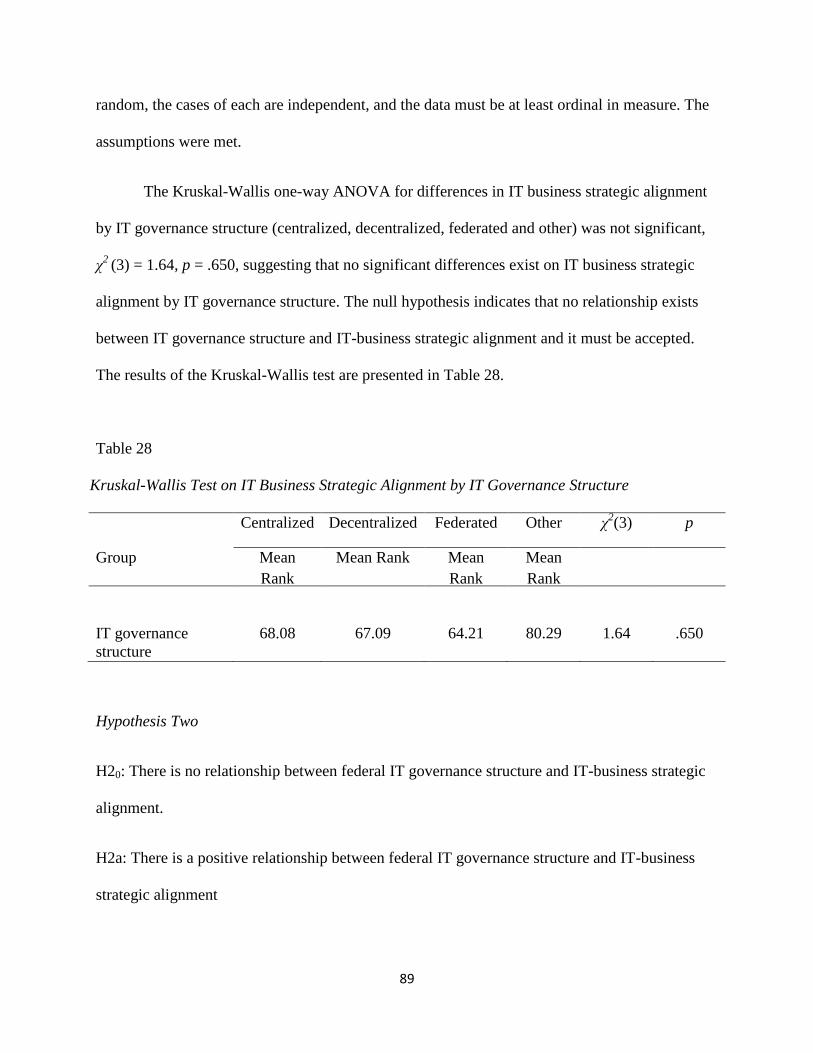
89
random, the cases of each are independent, and the data must be at least ordinal in measure. The
assumptions were met.
The Kruskal-Wallis one-way ANOVA for differences in IT business strategic alignment
by IT governance structure (centralized, decentralized, federated and other) was not significant,
χ2
(3) = 1.64, p = .650, suggesting that no significant differences exist on IT business strategic
alignment by IT governance structure. The null hypothesis indicates that no relationship exists
between IT governance structure and IT-business strategic alignment and it must be accepted.
The results of the Kruskal-Wallis test are presented in Table 28.
Table 28
Kruskal-Wallis Test on IT Business Strategic Alignment by IT Governance Structure
Centralized Decentralized Federated Other χ2(3) p
Group Mean
Rank
Mean Rank Mean
Rank
Mean
Rank
IT governance
structure
68.08 67.09 64.21 80.29 1.64 .650
Hypothesis Two
H20: There is no relationship between federal IT governance structure and IT-business strategic
alignment.
H2a: There is a positive relationship between federal IT governance structure and IT-business
strategic alignment

90
To assess research question two, and to determine what type of relationship exists
between federal IT governance structure and IT-business strategic alignment, a Mann-Whitney U
test was conducted. Prior to analysis, the assumptions of the Mann-Whitney U test include
random samples from the population. IT governance structure and IT-business alignment were
independently observed, where both variables had at minimum an ordinal scale of measurement
(Brace, Kemp & Sneglar, 2006); the assumptions were met.
The Mann-Whitney U test conducted on IT business strategic alignment by federal IT
governance structure was not significant, U = 1617.50, p = .490, indicating there is not a
significant difference on IT business strategic alignment by federal IT governance structure. The
null hypothesis (H20), shows there is no relationship between federal IT governance structure and
IT-business strategic and therefore it must be accepted. The results of the Mann Whitney U tests
are summarized in Table 29.
Table 29
Mann-Whitney U Test for IT Business Strategic Alignment by Federal IT Governance Structure
IT business strategic alignment
U Test U p Mean Rank
Sum of
Ranks
Federated 1617.50 .490 69.33 6932.50
Not federated - - 64.21 2247.50

91
Moderating Hypotheses
Hypothesis Three
H30: The relationship between IT governance structure and IT-business maturity level
remains the same regardless of industry type.
H3a: The relationship between IT governance structure and IT-business maturity level
varies by industry type.
To assess research hypothesis three, and to determine if IT governance structure and
industry type predicts IT-business maturity level, an ordinal logistic regression was conducted.
An ordinal logistic regression is similar to a binary logistic regression, but used in situations
when the categorical outcome variable has more than two levels and is ordered. The predictor
variables are IT governance structure (centralized, decentralized, federated/hybrid, networked,
matrixed, and other) and industry type (government/military, finance/banking/insurance,
manufacturing, healthcare/medical, biotech, and telecomm). The dependent variable is IT-
business maturity level (level 1, level 2, level 3, level 4, and level 5). Level 5 of the dependent
categorical variable is left out and used as the reference category; much like normal dummy-
coding is done. Additionally, the predictor variables are dummy coded because they are
categorical. A code of “1” indicates inclusion in the category, and a code of “0” indicates non-
inclusion in the category.
The significance for the ordinal logistics regression model was observed by the means of
the effects of IT governance structure and industry type which is presented with a 2 coefficient.
If the overall model was significant then we would have used Wald test where it is then
calculated by estimation from a model. Additionally, the prediction of an event occurring for (p)
which is the probability is determined by the Exp (B) or OR (odds ratio). If a significant
92
predictor has a positive B value, then for every one unit increase in the predictor variable, the
odds of the being in one level compared to the reference level increases by Exp (B) percent. If a
significant predictor has a negative B value, then for every one unit increase in the predictor
variable, the odds of the being in one level compared to the reference level decreases by 1 - Exp
(B) percent (Tabachnick & Fidell, 2012). The assumptions of logistic regressions include no
outliers in the data, absence of multicollinearity, and adequate sample size.
Prior to analysis, the assumptions of a logistic regression–sample size, absence of
mutlicollinearity, and absences of outliers-were assessed. LeBlanc and Fitzgerald (2000) wrote,
“Large sample sizes (n > 30 per predictor) are required” (p. 345). With a sample size of 135, the
required minimum sample size of 60 for a logistic regression was met; however the sample size
of 566 for the log linear analysis could not be achieved and therefore ordinal regression analysis
were conducted in place of the log linear analysis. According to LeBlanc and Fitzgerald (2000),
large sample size is required (greater than 30 predictor) with two predictor variables the
recommended minimum sample size is 60. To assess for multicollinearity among the
independent variables, Variance Inflation Factors (VIF) values were created. According to
Stevens (2009), VIF values which give a number more than 10 show the presence of
mulitcollinearity. None of the VIF values were above 4.0, indicating the assumption was met.
To assess for outliers, standardized residuals (z scores) were created within the data set prior to
conducting any analyses, and three cases were removed as outliers. There are no outliers in the
data set. For purposes of this analysis, the predictor variables were recoded. The original
predictor variables were IT governance structure that consists of six categories: centralized,
decentralized, and federated/hybrid, networked, matrixed, and other. For use in the regression
model, the original categories were recoded so that matrixed and networked were included in the

93
„other‟ category, and the revised categories were centralized, decentralize, federated/hybrid, and
other. Industry type was originally composed of government/military,finance/banking/insurance,
manufacturing, healthcare/medical, biotech,and telecomm. For use in the regression analysis, the
original variable levels were recoded so that biotech was combined with healthcare and the levels
were: government/military, finance/banking/insurance, manufacturing,
healthcare/medical/biotech,and telecomm.
The regression analysis was conducted with IT governance structure and industry type
predicting IT-business maturity level. The result of the test was not significant, χ2 (7) = 13.74, p
=.056, indicating with IT governance structure and industry type do not significantly predict IT-
business maturity level. The null hypothesis (H30) states the relationship between IT governance
structure and IT-business maturity level varies by industry type and therefore must be accepted.
The result of the regression is presented in Table 30.
Table 30
Ordinal Regression with IT Governance Structure and Industry Type predicting IT-Business
Maturity Level
Variable Estimate S.E. OR
95% C.I.for OR
Lower Upper Wald P
[Level 1] -2.30 0.78 0.10 -3.84 -0.77 -3.84 .003
[Level 2] -0.49 0.75 0.61 -1.97 0.98 -1.97 .514
[Level 3] 1.03 0.76 2.81 -0.45 2.51 -0.45 .172
[Level 4] 2.90 0.81 18.13 1.30 4.49 1.30 .001
Centralized -0.83 0.58 0.44 -1.97 0.32 -1.97 .156
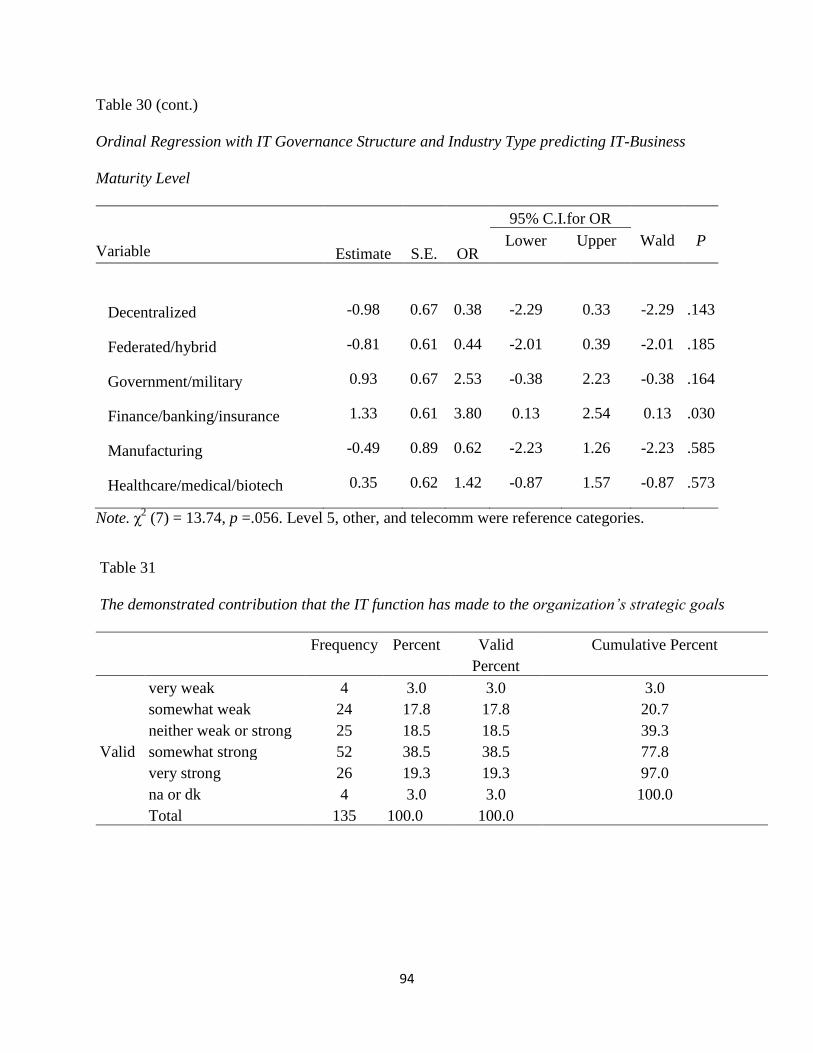
94
Table 30 (cont.)
Ordinal Regression with IT Governance Structure and Industry Type predicting IT-Business
Maturity Level
Variable Estimate S.E. OR
95% C.I.for OR
Lower Upper Wald P
Decentralized -0.98 0.67 0.38 -2.29 0.33 -2.29 .143
Federated/hybrid -0.81 0.61 0.44 -2.01 0.39 -2.01 .185
Government/military 0.93 0.67 2.53 -0.38 2.23 -0.38 .164
Finance/banking/insurance 1.33 0.61 3.80 0.13 2.54 0.13 .030
Manufacturing -0.49 0.89 0.62 -2.23 1.26 -2.23 .585
Healthcare/medical/biotech 0.35 0.62 1.42 -0.87 1.57 -0.87 .573
Note. χ2 (7) = 13.74, p =.056. Level 5, other, and telecomm were reference categories.
Table 31
The demonstrated contribution that the IT function has made to the organization’s strategic goals
Frequency Percent Valid
Percent
Cumulative Percent
Valid
very weak 4 3.0 3.0 3.0
somewhat weak 24 17.8 17.8 20.7
neither weak or strong 25 18.5 18.5 39.3
somewhat strong 52 38.5 38.5 77.8
very strong 26 19.3 19.3 97.0
na or dk 4 3.0 3.0 100.0
Total 135 100.0 100.0

95
According to the Table 31, 38.5% of the respondents said that the demonstrated
contribution that the IT function has made to the accomplishment of the organization‟s strategic
goals issomewhat strong.
Hypothesis Four
H40: The relationship between IT governance structure and IT-business maturity level
remains the same regardless of organization size.
H4a: The relationship between IT governance structure and IT-business maturity level
varies by organization size.
To assess research hypothesis four, and to determine if IT governance structure and
organization size predicts IT-business maturity level, an ordinal logistic regression was
conducted. An ordinal logistic regression is similar to a binary logistic regression, but used in
situations when the categorical outcome variable has more than two levels and is ordered. The
predictor variables is IT governance structure (centralized, decentralized, federated/hybrid,
networked, matrixed, and other) and organization size (l,000 employees or less, 1,001 – 5,000
employees, more than 5,000 employees). The dependent variable is IT-business maturity level
(level 1, level 2, level 3, level 4, and level 5). Level 5 of the dependent categorical variable is
left out and used as the reference category; much like normal dummy-coding is done.
Additionally, the predictor variables are dummy coded because they are categorical. A 1 will
indicate inclusion in the category and a 0 will indicate non-inclusion in the category.
The overall model significance for the ordinal logistic regression is examined by the
collective effect of IT governance structure and organization size, presented with a 2
coefficient. Individual predictors are assessed by the Wald coefficient, if the overall model is
significant. Predicted probabilities of an event occurring is determined by the Exp (B) or OR

96
(odds ratio). If a significant predictor has a positive B value, then for every one unit increase in
the predictor variable, the odds of the being in one level compared to the reference level
increases by Exp (B) percent. If a significant predictor has a negative B value, then for every one
unit increase in the predictor variable, the odds of the being in one level compared to the
reference level decreases by 1 - Exp (B) percent (Tabachnick & Fidell, 2012). The assumptions
of logistic regressions include no outliers in the data, absence of multicollinearity, and adequate
sample size.
Prior to analysis, the assumptions of a logistic regression – sample size, absence of
mutlicollinearity, and absences of outliers - were assessed. According to LeBlanc and Fitzgerald
(2000), large sample sizes (n > 30 per predictor) are required. With a sample size of 135, the
required minimum sample size of 60 was met. To assess for multicollinearity among the
independent variables, VIF values were created. According to Stevens (2009), VIF values greater
than 10 indicate the presence of mulitcollinearity. None of the VIF values were above 4.0,
indicating the assumption was met. To assess for outliers, standardized residuals (z scores) were
created within the data set prior to conducting any analyses, and three cases were removed as
outliers. There are no longer outliers in the data set. For purposes of this analysis, the predictor
variables were recoded. The original predictor variables were IT governance structure that
consists of six categories: centralized, decentralized, federated/hybrid, networked, matrixed, and
other. For use in the regression model, the original categories were recoded so that matrixed and
networked were included in the „other‟ category, and the revised categories were centralized,
decentralize, federated/hybrid, and other. The original levels of organization size were: <1,000,
1,000 - 5,000, 5,000 - 10,000, 10,000 - 50,000,and > 50,000. Data for organization size were
recoded to be: < 1,000, 1,000 - 5,000,and 5,000 or more.

97
The regression analysis was conducted with IT governance structure and organization
size predicting IT-business maturity level. The result of the test was not significant, χ2 (5) = 4.05,
p =.543, indicating with IT governance structure and organization size do not significantly
predict IT-business maturity level. The null hypothesis (H40) states the relationship between IT
governance structure and IT-business maturity level varies by organization size and therefore it
must be accepted. The result of the regression is presented in Table 32.
Table 32
Ordinal Regression with IT Governance Structure and Organization size predicting IT-Business
Maturity Level
Variable Estimate S.E. OR
95% C.I.for OR
Lower Upper Wald p
[Level 1] -2.88 0.60 0.06 -4.06 -1.70 22.87 .001
[Level 2] -1.16 0.55 0.31 -2.24 -0.08 4.43 .035
[Level 3] 0.27 0.54 1.31 -0.79 1.33 0.24 .621
[Level 4] 2.11 0.61 8.24 0.91 3.31 11.85 .001
Centralized -0.24 0.60 0.79 -1.41 0.93 0.16 .689
Decentralized -0.38 0.67 0.68 -1.69 0.92 0.33 .566
Federated/hybrid -0.55 0.61 0.57 -1.76 0.65 0.81 .367
1000 or less -0.63 0.40 0.53 -1.40 0.15 2.48 .116
1001 – 5000 -0.35 0.43 0.71 -1.19 0.50 0.65 .420
Note. χ2 (5) = 4.05, p =.543., Level 5, other, and 5,000 or more employees were used as reference
categories.
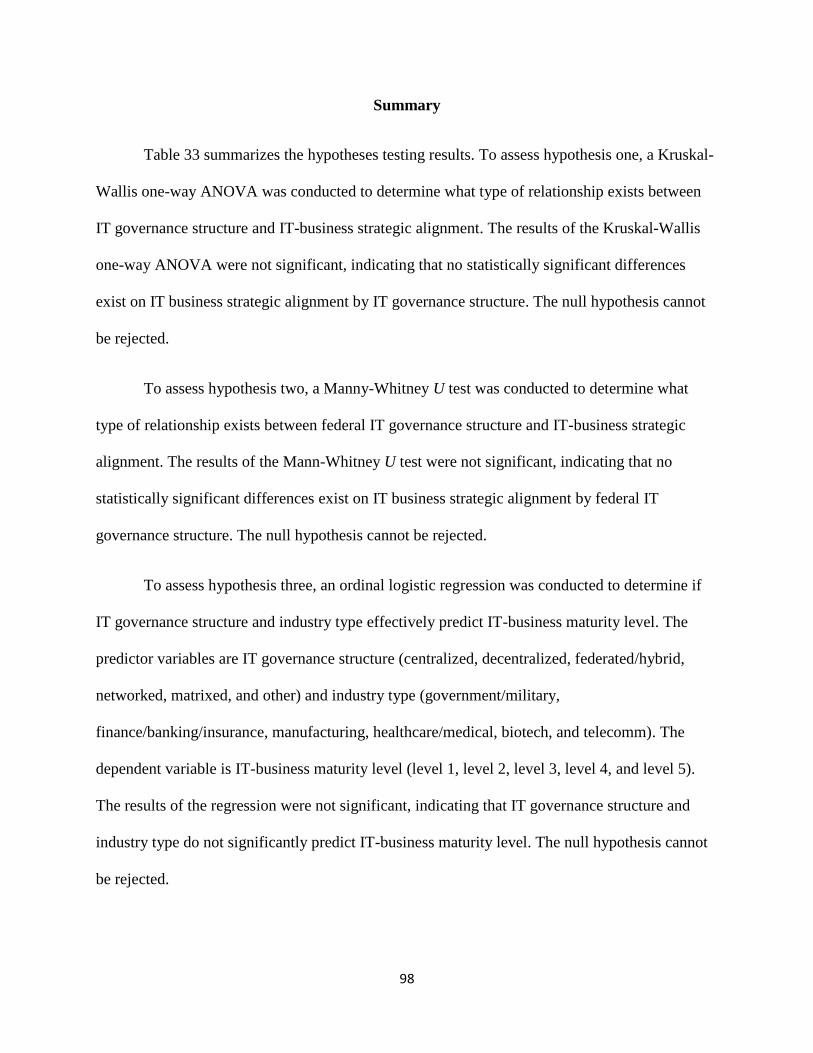
98
Summary
Table 33 summarizes the hypotheses testing results. To assess hypothesis one, a Kruskal-
Wallis one-way ANOVA was conducted to determine what type of relationship exists between
IT governance structure and IT-business strategic alignment. The results of the Kruskal-Wallis
one-way ANOVA were not significant, indicating that no statistically significant differences
exist on IT business strategic alignment by IT governance structure. The null hypothesis cannot
be rejected.
To assess hypothesis two, a Manny-Whitney U test was conducted to determine what
type of relationship exists between federal IT governance structure and IT-business strategic
alignment. The results of the Mann-Whitney U test were not significant, indicating that no
statistically significant differences exist on IT business strategic alignment by federal IT
governance structure. The null hypothesis cannot be rejected.
To assess hypothesis three, an ordinal logistic regression was conducted to determine if
IT governance structure and industry type effectively predict IT-business maturity level. The
predictor variables are IT governance structure (centralized, decentralized, federated/hybrid,
networked, matrixed, and other) and industry type (government/military,
finance/banking/insurance, manufacturing, healthcare/medical, biotech, and telecomm). The
dependent variable is IT-business maturity level (level 1, level 2, level 3, level 4, and level 5).
The results of the regression were not significant, indicating that IT governance structure and
industry type do not significantly predict IT-business maturity level. The null hypothesis cannot
be rejected.
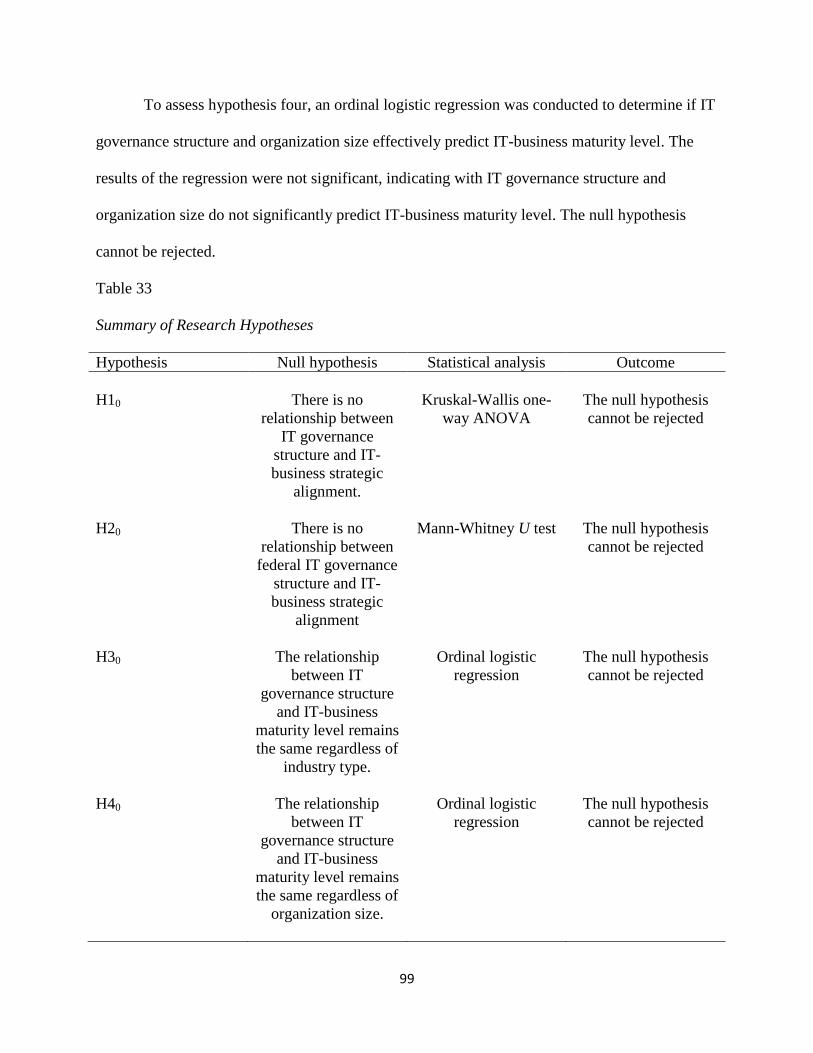
99
To assess hypothesis four, an ordinal logistic regression was conducted to determine if IT
governance structure and organization size effectively predict IT-business maturity level. The
results of the regression were not significant, indicating with IT governance structure and
organization size do not significantly predict IT-business maturity level. The null hypothesis
cannot be rejected.
Table 33
Summary of Research Hypotheses
Hypothesis Null hypothesis Statistical analysis Outcome
H10 There is no
relationship between
IT governance
structure and IT-
business strategic
alignment.
Kruskal-Wallis one-
way ANOVA
The null hypothesis
cannot be rejected
H20 There is no
relationship between
federal IT governance
structure and IT-
business strategic
alignment
Mann-Whitney U test The null hypothesis
cannot be rejected
H30 The relationship
between IT
governance structure
and IT-business
maturity level remains
the same regardless of
industry type.
Ordinal logistic
regression
The null hypothesis
cannot be rejected
H40 The relationship
between IT
governance structure
and IT-business
maturity level remains
the same regardless of
organization size.
Ordinal logistic
regression
The null hypothesis
cannot be rejected

100
CHAPTER 5. DISCUSSION, IMPLICATIONS, RECOMMENDATIONS
Introduction
This chapter discusses the results of the research as well as implications in the field of IT
governance. The challenges associated with IT governance and strategic alignment was also
investigated and will be discussed further. In addition, recommendations will be given on the
subject.The aim of the study was to test the extent to which IT strategic alignment relates to the
IT governance structure and federal IT governance structure within the organization. Further
analysis measured the degree of the impact between these variables. To substantiate the
relationships that exists between IT governance and levels of IT Strategic Alignment as
presented in Asante (2010) study, two primary hypotheses was used. In addition, two hypotheses
were added that is relevant to the study that will measure industry type and organizations size.
The independent variable IT governance structure was defined as a combination of
factors including leadership, structure and processes that ensures that IT governance achieves
integration of business and IT (Grembergen, 2002). The dependent variable IT strategic
alignment as defined by (Khadem, 2007) states that “the combined engagement of all IT units‟
strategic, plans processes, investments and decision to support the overall functionality and
purpose of the organization goals and objectives”, and the control and intervening variable
include centralized, decentralized and federal governance structures that contributes to IT
planning and decision making through various committees such as the IT governance, steering
and standard committees. This quantitative non-experimental research design was chosen
because it allows the collection of data from a large number of participants fitting a particular
demographic profile. As discussed in the limitations section only 135 participants responded to
the questionnaire in time for this research from an original target sample of 3000 business
101
professionals from medium and large sized companies in the United States. A non-experimental
design for this study enabled the researcher to identify differences within the variables presented
and make notation relating to those differences with some confidence.
Two primary research questions were:
1: What type of relationship exists between IT governance structure and IT-business
strategic alignment?
2: What type of relationship exists between federal IT governance structure and IT-
business strategic alignment?
These questions were uploaded to a website and the questionnaire administered by the IT
Governance Institute (ITGI) to members located inside the United States of America. The
questions investigated, Effectiveness of IT and Business Communications, Measurement of the
Competency and Value of IT, Governance, Partnerships between IT and Business Functions,
Scope and Architecture of the IT Infrastructure and skills.
Discussion of Results
H10: There is no relationship between IT governance structure and IT-business strategic
alignment.
The Kruskal-Wallis one-way ANOVA for differences in IT business strategic alignment
by IT governance structure (centralized, decentralized, federated, other) was not significant,
suggesting participants did not respond statistically differently to the question on IT business
strategic alignment based upon their governance structure. The null hypothesis indicated that no
relationship exists between IT governance structure and IT-business strategic alignment;
therefore it cannot be rejected in favor of the alternate hypothesis. The assumptions were met.
The research also show that at 33% of the participants says that their organization are at level 3

102
Established focused process, while only 6% are at the optimized level in appendix C. In addition,
most of the respondents say senior and mid-level IT managers have a good understanding of the
business which suggests that decision making are mostly done by employees who understand
how the business operates. When asked about how metrics and processes are used to measure
IT‟s contribution to the business, 27% of the respondents states they formally assess technical
and cost efficiency using traditional financial measures, such as return on investment (ROI) and
activity based costing (ABC), they also states that they put formal feedback processes in place to
review and take action based on the results of the measures, while 11% say these procedures are
purely technical (Appendix C).Therefore decision making process for IT governance and
strategic alignment can only be successful if the organization has a management buy-in and IT
decision making should be a shared practice between both business and IT managers
(Sambamurthy & Zmud, 1999).
H20: There is no relationship between federal IT governance structure and IT-business
strategic alignment.
To assess research question two, and to determine what type of relationship exists
between federal IT governance structure and IT-business strategic alignment, a Mann-Whitney U
test was conducted. Prior to analysis, the assumptions of the Mann-Whitney U test include
random samples from the populations, IT governance structure and IT-business strategic
alignment were independently discussed, where both variables had at minimum an ordinal scale
of measurement (Brace, Kemp & Sneglar, 2006); the assumptions were met, meaning there were
no significant differences in responses to IT business strategic alignment by Federal IT
governance structure (federated vs. not federated).

103
The Mann-Whitney U test conducted on IT business strategic alignment by
federal IT governance structure was not significant, The value of the U test was 1617.50, which
was not significant with p = .490, indicating there is not a significant difference on IT business
strategic alignment by federal IT governance structure which supports Luftman (2003). When
asked how is IT organized in your company? Thirty-five participants or 25.9% stated that they
are in a federated/hybrid organization.
To assess research hypothesis three, and to determine if IT governance structure and
industry type predicts IT-business maturity level, an ordinal logistic regression was conducted.
Prior to analysis, the assumptions of a logistic regression – sample size, absence of
mutlicollinearity, and absences of outliers - were assessed. According to LeBlanc and Fitzgerald
(2000), “large sample sizes (n > 30 per predictor) are required”(p.345). With a sample size of
135, the required minimum sample size of 60 was met. To assess for multicollinearity among the
independent variables, Variance Inflation Factors (VIF) values were created. According to
Stevens (2009), VIF values in excess 10 shows the presence of mulitcollinearity. None of the
VIF values were above 4.0, indicating the assumption was met. To assess for outliers,
standardized residuals (z scores) were created within the data set prior to conducting any
analyses, and three cases were removed as outliers. There are no outliers in the data set.
The regression analysis was conducted with IT governance structure and industry
type predicting IT-business maturity level. The result of the test was not significant, χ2 (7) =
13.74, p =.056, indicating with IT governance structure and industry type do not significantly
relate to IT-business maturity level.
To assess research hypothesis four, and to determine if IT governance structure and
organization size predicts IT-business maturity level, an ordinal logistic regression was

104
conducted. Prior to analysis, the assumptions of a logistic regression – sample size, absence of
mutlicollinearity, and absences of outliers - were assessed. As indicated earlier LeBlanc and
Fitzgerald (2000), “large sample sizes are required” (p.345). With a sample size of 135, the
required minimum sample size of 60 was met. To assess for multicollinearity among the
independent variables, VIF values were created. According to Stevens (2009), VIF values greater
than 10 indicate the presence of mulitcollinearity. None of the VIF values were above 4.0,
indicating the assumption was met. To assess for outliers, standardized residuals (z scores) were
created within the data set prior to conducting any analyses, and three cases were removed as
outliers. There are no longer outliers in the data set.
The regression analysis was conducted with IT governance structure and organization
size predicting IT-business maturity level. The result of the test was not significant, χ2 (5) = 4.05,
p =.543, indicating with IT governance structure and organization size do not significantly
predict IT-business maturity level. Additionally, According to the Table 31, almost 39% of the
respondents said that the demonstrated contribution that the IT function has made to the
accomplishment of the organization‟s strategic goals is somewhat strong and 19.3% says very
strong, this means that majority of businesses now see IT as an enabler. With IT viewed as an
enabler in the business, Table 21 showed that30% of the respondents are senior management or
executive, IT governance buy-ins and practices are endorsed at the senior level within the
organization.
105
Theoretical Implications
Theoretically, factors that affect governance structures follow two streams of research,
the first focused on single factor such as firm size and look on traditional IT organizational
structures (Agarwal & Sambamurthy, 2002; Boddy et al., 2005). In addition, stream one
continues to investigate expanded IT decision making structures by including research on
vertical and horizontal expansions of the traditional IT governance structures. Stream two uses
the principles of multiple contingency as seen in Table 1; This principle identifies a grouping of
factors that impact IT governance decisions (Brown & Grant, 2005; Muller, 2007), and look on
multiple contingencies for a uniformed governance framework. Stream two was further
investigated theoretically to look on complex analysis for non-uniform governance frameworks
by identifying how the individual and multiple contingencies affect IT organizational structure
decisions as outlined in the responses from this research. This research contributed to theory by
investigating contingencies that look on factors such as effectiveness of IT and business
communications, measurement of the competency and value of IT, governance, partnerships
between IT and business functions, scope and architecture of the IT infrastructure and skills
(Table 17).
Practical Implications
Practitioners who are looking forward for an adaptation toward strategic alignment can
apply principles set out in this research. By examining Figure 4, various committees such as the
standards committee, IT steering committee and IT governance committee, reveals that to work
towards alignment an iteration process that involves collaboration is needed to make governance
decisions by committee members. Currently, various industry standards and frameworks such as

106
Control Objectives for Information and related Technology (COBIT) (This is an IT process and
control framework linking IT to business requirements) are available to boards of directors
which can be used as a transition to apply industry practices (ITGI, 2006; Klamm & Watson,
2009). A practical application of these standards will therefore require adherence to policies and
procedures because in different areas, reporting authorities impose fees and fines to ensure that
compliance are met.
Limitations and Assumptions
There are limitations to the study which hinder the researcher from being able to collect
the appropriate sample size. Sample size collected was 135 and hence an ordinal logistic
regression was used to conduct statistical analysis on H3 and H4.Other limitations include the
time factor as it relates to the sample group to access and complete the instrument online as well
as funding to keep the site going during a specific period of time. The research did go in depth of
standards and frameworks relating to IT governance and strategic alignment, but an
understanding of the different terminologies were provided to sufficiently edify the reader. It was
assumed that the selected population is willing to divulge information truthfully and completely.
The research also assumes all participants are free from bias and have adequately taken the time
to read each question and answer appropriately.
Recommendation for Future Research
An area of future research is to determine how C-level executives (CEO, CIO, COO,
CTO) weighs in on IT governance and Strategic alignment decisions for industries investigated
in this research. In addition, a qualitative replication of this research can prove to answer
questions, such as Effectiveness of IT and Business Communications, Measurement of the
Competency and Value of IT, Governance, Partnerships between IT and Business Functions,

107
Scope and Architecture of the IT Infrastructure and skills; a qualitative research may be able to
adopt a iterative process, that were not able to be given from the quantitative format presented in
this research. Additionally, an investigation into how industry type and organization size
correlates to the levels of maturity.
Finally, a longitudinal research that will investigate the organization from the initial stage
of governance to final implementation of IT governance framework and standards, such as the
(1) Control Objective for Information and Related Information Technologies (COBIT), (2)
Information Technology Infrastructure Library (ITIL) which is used as the standard for service
management and delivery and (3) The Code of Practice for Information Security Management
(ISO/IEC 17799: 2000).
Conclusions
IT governance and strategic alignment should be seen as a pursuit for strategic
planning for the organization. IT standards, IT frameworks and IT investments, after being
implemented and must be managed to enable return on investments. The IT Governance Institute
(ITGI) and other bodies such as ITIL put in place structures and best practices to assist in the
monitoring and controlling of the governance process. According to Robinson (2005), IT
governance supports three main objectives: (a) regulatory and legal compliance, (b) operational
excellence, and (c) optimal risk management. Robinson also stated that poor IT performance is
commonly the result of failed projects, missed deadlines, budget overruns, and poor returns on
investment (ROI). Consequently, the need for governance is evident if organizations are to
function optimally by establishing transparency and accountability.
This research contributed to the body of knowledge to examine the relationship between
IT Governance structure and IT-business strategic alignment. The assumptions for research

108
question one were met. While differences in IT business strategic alignment by IT governance
structure (centralized vs. decentralized vs. federated vs. other) was not significant and suggests
no significant differences exist on IT business strategic alignment by IT governance structure.
The findings did not support the rejection of null hypothesis. Therefore, no relationship exists
between IT governance structure and IT-business strategic alignment and cannot be rejected. For
the second research question, the assumptions were met as well and the analysis for IT business
strategic alignment by federal IT governance structure was not significant, indicating there is not
a significant difference on IT business strategic alignment by federal IT governance structure.
For the moderating hypothesis three indicated, the regression analysis was conducted
with IT governance structure and industry type predicting IT-business maturity level. The results
revealed; IT governance structure and industry type do not significantly predict IT-business
maturity level. However, after carefully looking on the individual results of the moderating
variables; ordinal regression on IT governance structure and industry type predicting IT-
business maturity level showed three levels of significance (see table 30), these were level 1 -
initial , level 4 - managed and finance and banking.
For the moderating hypothesis four indicated, the regression analysis was conducted with
IT governance structure and organization size predicting IT-business maturity level. The result of
the test was not significant, indicating with IT governance structure and organization sizes do not
significantly predict IT-business maturity level. However, after detailed results of the moderating
variables; ordinal regression on IT governance structure and organization size predicting IT-
business maturity level showed three levels of significance (see table 32), these were level 1 -
initial, level 2 – repeatable and level 4 managed.

109
REFERENCES
Agarwal, R. & Sambamurthy, V. (2002). Principles and models for organizing the IT
function. MIS Quarterly Executive, 1(1), 1-16.
Ampofo, A. (2004). An empirical investigation into the relationship of organizational ethical
culture to ethical decision-making by accounting /finance professionals in the insurance
industry in the U.S.A. (Doctoral dissertation) Available from Nova Southeastern
University.
Alkhafaji, A. F. (2007). Corporate governance: The evolution of the Sarbanes-Oxley Act
and its impact on corporate America, Competitiveness Review. 17(30), 193 – 202.
Asante, K. (2010). Information technology (IT) strategic alignment: A correlation study
between the impact of IT governance structures and IT strategic alignment.
(Doctoral dissertation) Available from Proquest database. (UMI No. 3402048)
Beveridge, J. (n.d.). COBIT implementation workshop, retrieved from www.sco.idaho.gov
Bassellier, G., & Benbasat, I. (2004). Business competence of information technology
professionals: conceptual development and influence on IT-business partnerships,
MIS Quarterly, 23(4), 673–694.
Bassellier, G., Benbasat, I., & Reich, B.H. (2003). The influence of business managers'
IT competence on championing IT. Information Systems Research, 14(4), 317-
336.
Beneish, M. D., Billings. M. B., & Hodder. L. D. (2008). Internal control weaknesses and
information uncertainty. The Accounting Review, 83 (3), 665–704.
Boddy, D. & Boonstra, A. & Kennedy, G. (2005). Managing Information Systems: An
Organizational Perspective, Harlow: Prentice-Hall
Boynton, A. C. & Jacobs, G. C. & Zmud, R. W. (1992). Whose Responsibility is IT
Management, Sloan Management Review, (33) 4, 32-39.
Boynton, A., & Zmud, R. (1987). Information Technology Planning in the 1990's:
Directions for Practice and Research. MIS Quarterly, 11(1), 59-71.
Brace, N., Kemp, R., & Snelgar, R. (2006). SPSS for psychologists (3rd
ed.). Mahwah, NJ:
Erlbaum.
Brown, A. E. & Grant, G. G. (2005). Framing the Frameworks: A Review of IT Governance
Research. Communications of AIS, 15, 696-712.

110
Brown, C. V. (1997). Examining the Emergence of Hybrid IS governance Solutions:
Evidence from a Single Case Site, Information Systems Research, 8(1), 69-95.
Brown, C. V., & Magill, S. L. (1998). Re-conceptualizing the context-design issue for the
information systems function.Organization Science, 9(2), 176-194.
Brown, W., & Nasuti, F. (2005). What ERP systems can tell us about Sarbanes-Oxley.
Information Management & Computer Security, 13(4), 31-327.
Burns, N., & Grove, S. (2003). Understanding nursing research, (3rd ed.). Philadelphia, PA: W.
B. Saunders.
Chan, Y. E., & Reich, B. H. (2007). IT alignment: what have we learned? Journal of Information
Technology, 22, 297–315.
Cohen, A. F., & Qaimmaqami, D. J. (2005). The US Sarbanes-Oxley Act of 2002: Summary and
update for non-US issuers. International Journal of Disclosure and Governance, 2(1),
81-107.
Cohen, J. (1988). Statistical power analysis for the behavioral sciences. Second
Edition. Hillsdale, NJ: Erlbaum.
Cook, S.S., Probert, D., & Martin, S. (2009). The lived experience of information
technology workers with Sarbanes-Oxley compliance responsibilities. Journal of
Global Business Issues, 3(1), 23.
Cooper, D.R., & Schindler, P.S. (2003). Business Research Methods (8th ed.). Boston,
MA: McGraw-Hill.
Creswell, J. W. (2003). Research design: Qualitative, quantitative, and mixed methods
approaches (2nd ed.). Thousand Oaks, CA: Sage Publications.
Creswell, J.W. (2007). Qualitative inquiry and research design: choosing among five
approaches (2nd ed.). Thousand Oaks, CA: Sage Publications.
Currall, S., & Epstein. M. (2003). The fragility of organizational trust: Lessons from the
rise and fall of Enron. Organizational Dynamics, 32(2), 193-206.
Damianides, M. (2005). Sarbanes-Oxley and IT governance: new guidance on IT control
and compliance. Information Systems Management, 22 (1), 77-87.
Das, S.R., Zahra, S.A., and Warkentin, M.E., (1991).Integrating the Content and Process of
Strategic MIS Planning with Competitive Strategy, Decision Sciences, (22) 5, 953-984.

111
De Haes, S. & Grembergen, W. V. (2005). IT Governance Structures, Processes and
Relational Mechanisms: Achieving IT/Business Alignment in a Major Belgian Financial
Group, Proceeding of the 38th Annual Hawaii International Conf. on System Science.
De Haes, S.& Grembergen, W.V. (2008). An Exploratory Study into IT Governance
Implementations and its Impact on Business/IT Alignment. DOI:
10.1080/10580530902794786
Doyle, J., Ge, W., & McVay, S. (2007). Determinants of Weaknesses in Internal Control
over Financial Reporting. Journal of Accounting and Economics, 44 (2), 193-223.
Freeman, R.E. (1984). Strategic management: A Stakeholder Approach. Englewood
Cliffs, NJ: Prentice-Hall.
Garrity, J.T. (1963). Top Management and Computer Profits. Harvard Business
Review, (July-August), pp. 6-12.
Ge, W., & McVay, S. (2005). The Disclosure of Material Weaknesses in Internal Control
after the Sarbanes-Oxley Act. Accounting Horizons, 19 (3), 137–158.
Goldman, J. (2003). Business Protection Systems International, Inc. ABC Overview of Sarbanes-
Oxley, HIPAA and Graham-Leach-Bliley Acts: What you should know about legislation
affecting our business, Continuity Magazine.
Grant, G. H., Miller, K. C., & Alali, F. (2008).The effect of IT controls on financial
reporting. Managerial Auditing Journal. 23(8), 803.
Grembergen, W. V. & De Haes, S. D. & Guldentops, E. (2004). Structures, Processes and
relational Mechanisms for IT-Governance, Idea Group.
Guldentops, E. (2004). Key Success factors for implementing IT governance let's not
wait for regulators to tell us what to do. Information Systems Control Journal, 2.
Gupta, A. (2010). Organization‟s size and span of control: Practical Management. Retrieved
from http://www.practical-management.com/Organizational-
Development/Organizational-size-and-span-of-control.htm
Hall, J.A., & Liedtka, S.L. (2007). The Sarbanes-Oxley Act: implications for large scale
IT outsourcing. Communications of the ACM, (50) 3.
Hamaker, S., & Hutton, A. (2004). Principles of governance. Information Systems
Control Journal, 3.
Hammersley, J. L., Myers, & Shakespeare, C. (2008). Market reactions to the disclosure
of internal control weaknesses and to the characteristics of those weaknesses

112
under Section 302 of the Sarbanes Oxley Act of 2002. Review of Accounting
Studies, 13 (1), 141–165.
Hawkins, K. W., Alhajjaj, S., Kelley, S.S., (2003). Using CobiT to Secure Information Assets.
The Journal of Government Financial Management, (52) 2.
Hardy, G (2006). Using IT governance and COBIT to deliver value with IT and respond
to legal, regulatory and compliance challenges. Information Security Technical
Report.11(1), 55-61. doi:10.1016/j.istr.2005.12.004
Hirschheim R. & Sabherwal R. (2001).Detours in the path toward Strategic Information
Systems Alignment: Paradoxical Decisions, Excessive Transformations, and Uncertain
Turnarounds.‟,California Management Review, 44(1), 87-108.
Jeffery, M., and Leliveld, I., (2004). Best Practices in IT Portfolio Management, MIT Sloan
Management Review, (45)3.
Johnson, R.B., & Onwuegbuzie, A.J. (2004). Mixed methods research: A research paradigm
whose time has come. Educational Researcher, 33(7), 14-26.
IT Governance Institute (2003). Board Briefing on IT Governance (2nd ed).
Retrieved April 7, 2008, from www.isaca.org
IT Governance Institute (2004). Information technology governance global status report.
Rolling Meadows, IL: IT Governance Institute. Retrieved from http://www.itgi.org
IT Governance Institute (2006). IT control objectives for Sarbanes-Oxley: The role of IT
in the design and implementation of internal control over financial reporting (2nd
ed.). Rolling Meadows, Ill.: IT Governance Institute.
IT Governance Institute (2007). COBIT 4.1 Executive summary framework. Retrieved from
http://www.itgi.org
Kacperczyk, A. (2009). With greater power comes greater responsibility? Take
overprotection and corporate attention to stakeholders. Strategic Management
Journal, 30(3), 261-285.
Kang, J. (2010). The influence of CEO decision-making and corporate strategy on
corporate social performance (Doctoral dissertation). Available from ProQuest
Dissertation and Theses database.
Kayworth, T. & Sambamurthy, V. (2000). Managing the Information Technology Infrastructure,
Baylor Business Review, 18(1), 13-15.

113
Khadem, K. N. (2007). Aligning enterprise and information technology strategy: A study of the
correlation between strategic alignment and adaptation of enterprise-wide strategy
formulation processes (Doctoral dissertation). Available from ProQuest dissertation and
Theses database.
Killmeyer, J. (2006). Information security architecture: An integrated approach to security in
the organization, Second Edition
Klamm, B.K., & Watson, M.W. (2009). SOX 404 reported internal control weaknesses: A test
of COSO framework components and information technology. Journal of Information
Systems, 23(2), 1–23.
Kordel, L. (2004). IT Governance hands-on: using COBIT to implement IT governance.
Information Systems Control Journal, 2.
Kotey, B., & Folker, C. (2007). Employee training in SMEs: Effect of size and firm type-
family and nonfamily. Journal of small business management.
Kvale, S. (1996). Interviews: An introduction to qualitative research interviewing.
Thousand Oaks, California: Sage Publications.
Lainhart, J. (2000). COBIT: A Methodology for Managing and Controlling Information and
Information Technology Risks and Vulnerabilities. Journal of Information Systems:
14,(1), 21-25.
LeBlanc, M. & Fitzgerald, S. (2000). Research Design and Methodology Section: Logistic
Regression for School Psychologists. School Psychology Quarterly, 15(3), 344-358.
Leigh, M. J. (2006). The impact of the Sarbanes-Oxley Act on IT project management,
Journal of Information Technology Theory and Application, 8(3), 13-30.
Loh, L. & Venkatraman, N. (1992). Diffusion of Information Technology Outsourcing:
Influence Sources and the Kodak Effect, Information Systems Research, 3(4), 334-359.
Luftman, J.N. (2003a). Competing in the information age (2nd ed.), New York: Oxford
University Press.
Luftman, J.N. (2003b). Assessing IT-Business alignment. Information Systems Management,
20(4), 9-15.
Luftman, J. N, & Brier, T. (1999). Achieving and sustaining business-IT alignment.
California Management Review, 42(1), 109-122.
Luftman, J. N, & Kempaiah, R. (2007). An update on Business-IT alignment: A line has
been drawn. MIS Quarterly Executive, 6(3), 165-177.

114
Miles, R. E. & Snow, C. C. (1978). Organization Strategy and Process. NY, New York:
McGraw-Hill
Miller, M. (2006). Ensuring Effective Enterprise It Risk Management. Internal Auditing,
21(6), 24.Retrieved from http://proquest.umi.com.library.capella.edu/pqdweb
National Institutes of Health National Commission for the Protection of Human Subjects of
Biomedical and Behavioral Research. (1979). The Belmont Report: Ethical Principles
and Guidelines for the Protection of Human Subjects of Research. Washington, DC:
retrieved from http://ohsr.od.nih.gov/guidelines/belmont.html.
Nolan, R., & McFarlan, F. W. (2005). Information technology and the board of directors.
Harvard Business Review, 83(10), 96-106.
Olson, M.H. & Chervany, N.L., (1980). The Relationship between Organizational Characteristics
and the Structure of the Information Services Function. MIS Quarterly, 4(2), 57-68.
Orcutt, J.L. (2009). The case against exempting smaller reporting companies from Sarbanes-
oxley section 404: why market-based solutions are likely to harm ordinary investors,
Fordham Journal of Corporate & Financial Law, 14(2), 325 – 415.
Peterson, R. (2004). Crafting Information Technology Governance, Information Systems
Management, 21(4), 7-22.
Porter, M. (1980). Competitive Advantage. NY, New York: Free Press.
Reich, B. H., & Benbasat, I. (1996).Measuring the Linkage Between Business and
Information Technology Objectives. MIS Quarterly, 20, 55-81.
Reich, B.H. & Benbasat, I. (2000). Factors that influence the social dimension of linkage
between business and information technology objectives. Management
Information Systems Quarterly, 81-113.
Robinson, N. (2005). IT excellence starts with governance. Journal of Investment
compliance.
Robson, C. (2002). Real world research (2nd
ed.). Malden: MA , Blackwell,
Rockart, J. E., Earl, M., & Ross, J. W. (1996). Eight Imperatives for the New IT
Organization. Sloan Management Review, 38(1), 43-55.

115
Ross, J.W., Weill, P. (2002). Six IT Decisions Your IT People Shouldn‟t Make. Harvard
Business Review, 84-91.
Sabherwal, R., & Chan, Y. (2001). Alignment between Business and IS Strategies: A Study of
Prospectors, Analyzers, and Defenders. Information Systems Research, 12(1), 11.
Sage, A (2006). A model of factors affecting business and information technology alignment
enabled by enterprise architecture: A structural equation modeling analysis. (Doctoral
dissertation) Available from Capella University
Sambamurthy, V., & Zmud, R. W. (1999). Arrangement for Information Technology
Governance: A theory of multiple contingencies.MIS Quarterly (23)2, 261-290.
Schneider, G.P. & Bruton, C.M. (2007). Sarbanes-Oxley Compliance Provides New
Opportunities for Information Technology Professionals. Academy of Information
and Management Sciences Journal. Cullowhee. 10(2)79-80.
Segars, A., & Grover, V. (1999). Profiles of Strategic Information Systems Planning.
Information Systems Research, 10(3), 199.
Stevens, J. P. (2009). Applied multivariate statistics for the social sciences (5th ed.). Mahwah,
NJ: Routledge Academic.
Sutton, S.G., & Arnold, V. (2005). The Sarbanes-Oxley Act and the changing role of the
CIO and IT function. International Journal of Business Information Systems,
1(2), 118-128. doi:10.1504/IJBIS.2005.007403
Swanson, R. A., & Holton III, E. F. (2005). Research in organizations: Foundations and
methods of inquiry. San Francisco: Berrett-Koelher.
Tseu, M. (2005). Managing IT compliance: sustainability and simplicity for future audits.
Internal Auditing, 20(5) 16-21.
Grembergen, W., De Haes, S., & Guldentops, E. (2004). Structures, Processes and
Relational Mechanisms for IT Governance. Idea Group Publishing.
Von Simson, E. M. (1995). The recentralization of IT, Computerworld, (29)51, 1-5.
Ward, J., & Peppard, J. (2002). Strategic planning for information systems (3rd ed.). New
York: John Wiley & Sons.
Weijer C, Goldsand G., & Emanuel EJ. (1999). Protecting communities in research:
current guidelines and limits of extrapolation. 23(3):275-80

116
Weill, P. (2004). Don‟t Just Lead, Govern: How Top-Performing Firms Govern IT. MIS
Quarterly Executive, 3(1)1–17.
Weill, P., & Broadbent, M. (1993). Improving Business and Information Strategy Alignment:
Learning from the Banking Industry. IBM Systems Journal, 32(1), 162-179.
Weill, P. & Ross, J. (2004). IT Governance: How Top Performers Manage IT Decision
Rights for Superior Results, Harvard Business School Press.
Weill, P. & Ross, J. (2005). A Matrixed Approach to Designing IT Governance.MIT Sloan
Management Review, 46(2), 26.
Whitman, M. E. & Mattord, H.J. (2006). Reading and cases in the management of
information security. Information Security Professionals.
Wu, Y. (2007). Effects of IT governance on Information Security. (Doctoral dissertation).
Available from Proquest Dissertations and Theses database. (UMI No.3377838).
Xue, Y., Liang, H., & Boulton, W. (2008). Information technology governance in
information technology investment decision processes: the impact of
investment characteristics, external environment, and internal context. MIS
Quarterly, 32(1), 67-96.
Zikmund, W. G. (2003). Business research methods. Mason, OH: South Western

117
APPENDIX A. RESEARCH INSTRUMENT
From Assessing IT-Business alignment, by Luftman, J.(2003), Information Systems
Management. Copyright 2003 by Jerry Luftman Reprinted with permission
Instructions
The information you provide will not be used to identify your company. Where two
answers are possible in a question, select the one answer that most influence business and
technology strategic alignment effectiveness in your organization. PLEASE SELECT
ONLY ONE ANSWER PER QUESTION FOR EACH QUESTION. Some questions presented
are multiple choice formats with answers that have boxes that can be checked and unchecked by
double clicking on the box while answers to some questions are on different scales measurement
such as disagree to agree.
Additionally, the answer you provide should indicate your opinion of the behavior or
effectiveness of your organizations management practices concerning strategic alignment
decision as they relate to IT governance. If the answer to a question is not known or unclear
or the question is simply not applicable to your organization, please select the 'don't know
box' N/A or Neutral.
Kindly proceed to the survey questions below. You are allowed to take the survey once from
each computer. Again, thank you very much and your participation is greatly appreciated.
SECTION 1: PARTICIPANTS DEMOGRAPHIC SURVEY

118
4. Hierarchical distance from CEO
Ceo, 1-2 levels 3-4 levels > 4 levels
5. Please indicate Department
Business Unit (BU) IT, Finance, HR, Corporate, Other–Please state ______________
6. Your age group
< 25, 25 – 35, 35 – 45, 45 – 55, > 55
7. Education level (Highest level completed)
GED/High School
Some College
Bachelors Degree
MBA/Masters
Post Masters
Ph.D / Doctorate
Post Doctorate
Other (Please specify) ________________
8. Career Level
Entry Level
Staff
Supervisor
Manager

119
Mid Level Manager
Senior Manager
Executive
Other (Please specify)_______________
9. Please indicate industry
Government/Military
Finance/Banking/Insurance
Manufacturing
Healthcare/Medical
Biotech
Telecommunications
Other, (Please specify) _________________
10. Years of industry relevant experience
Less than 3 years
3 – 5 years
6 – 10 years
11 – 15 years
16 – 25 years
More than 25 years
11. Please indicate number of employees (Size of organization)
< 1,000, 1,000 – 5,000, 5,000 – 10,000, 10,000 – 50,000, > 50,000
12. Number of employees in IT department
< 100, 100 – 250, 250 – 500, 500 – 1,000, > 1,000
SECTION 2: QUESTIONNAIRE
COMPONENT 1: EFFECTIVENESS OF IT AND BUSINESS COMMUNICATION
1. Alignment Maturity Areas:
Communication
Competency
Governance
Partnership
Technology
Skill
2. Explanation of Strategic Alignment Maturity:
A level 1 alignment maturity means that a company lacks the process within all six
identified maturity areas above needed to attain alignment. In a level 5 company, IT and all
other business functions (marketing, finance, R&D, etc.) adapts their strategies together

120
using fully developed processes that includes external partners and customers with all 6
maturity areas.
3. After quickly reviewing the preceding Strategic Alignment Maturity Summary which
level of strategic alignment maturity do you believe best represents your organization today?
Level 1 Initial/ad-hoc process
Level 2 Committed process
Level 3 Established focused process
Level 4 Improved/managed process
Level 5 Optimized process
The next six questions assess the maturity/effectiveness of the elements comprising IT and
Business Communications.
4. To what extent does IT understand the organization‟s business environment (e.g., its
customers, competitors, processes, partners/alliances):
Senior and mid-level IT managers do not understand the business.
Senior and mid-level IT managers have a limited understanding of the business.
Senior and mid-level IT managers have a good understanding of the business.
Understanding of the business by all IT members is encouraged and promoted by senior
managers.
Understanding of the business is required (e.g., tied to performance appraisals) throughout
the IT function.
N/A or don‟t know.
5. To what extent do the business organizations understand the IT environment (e.g., its current
and potential capabilities, systems, services, processes):
Senior and mid-level business managers do not understand IT.
Senior and mid-level business managers have a limited understanding of IT.
Senior and mid-level business managers have a good understanding of IT.
Understanding of IT by all employees is encouraged and promoted by senior management.

121
Understanding of IT is required (e.g., tied to performance appraisals) throughout the
business.
N/A or don‟t know.
6. The following statements pertain to methods (e.g., intranets, bulletin boards, education,
meetings, e-mail) in place to promote organizational education/learning (e.g., of experiences,
problems, objectives, critical success factors). Organizational learning occurs primarily through:
Ad-hoc/casual methods (employee observation, anecdote sharing, peer meetings, etc.)
Informal methods (newsletters, bulletin board notices, computer reports, group e-mail, fax,
etc.)
Regular, clear methods (training, e-mail, phone-mail, intranet, department meetings, etc.)
from mid-level management
Formal, unifying, bonding methods from senior and mid-level management
Formal, unifying, bonding methods from senior and mid-level management, with feedback
measures to monitor and promote effectiveness of learning
N/A or don‟t know.
7. The following question pertains to communications protocol. The IT and business
communication style (e.g., ease of access, familiarity of stakeholders) tends to be:
One-way, from the business; formal and inflexible
One-way, from the business; moderately informal and moderately flexible
Two-way; formal and inflexible
Two-way; moderately informal and moderately flexible
Two-way; informal and flexible
N/A or don‟t know.
8. The following statements pertain to the extent in which there is knowledge sharing
(intellectual understanding and appreciation of the problems/opportunities, tasks, roles,
objectives, priorities, goals, direction, etc.) between IT and business:
Knowledge sharing is on an ad-hoc basis.
Knowledge sharing is somewhat structured and/or structure is beginning to be created.
There is structured sharing around key functional unit processes.
There is formal sharing at the functional unit level and at the corporate level.
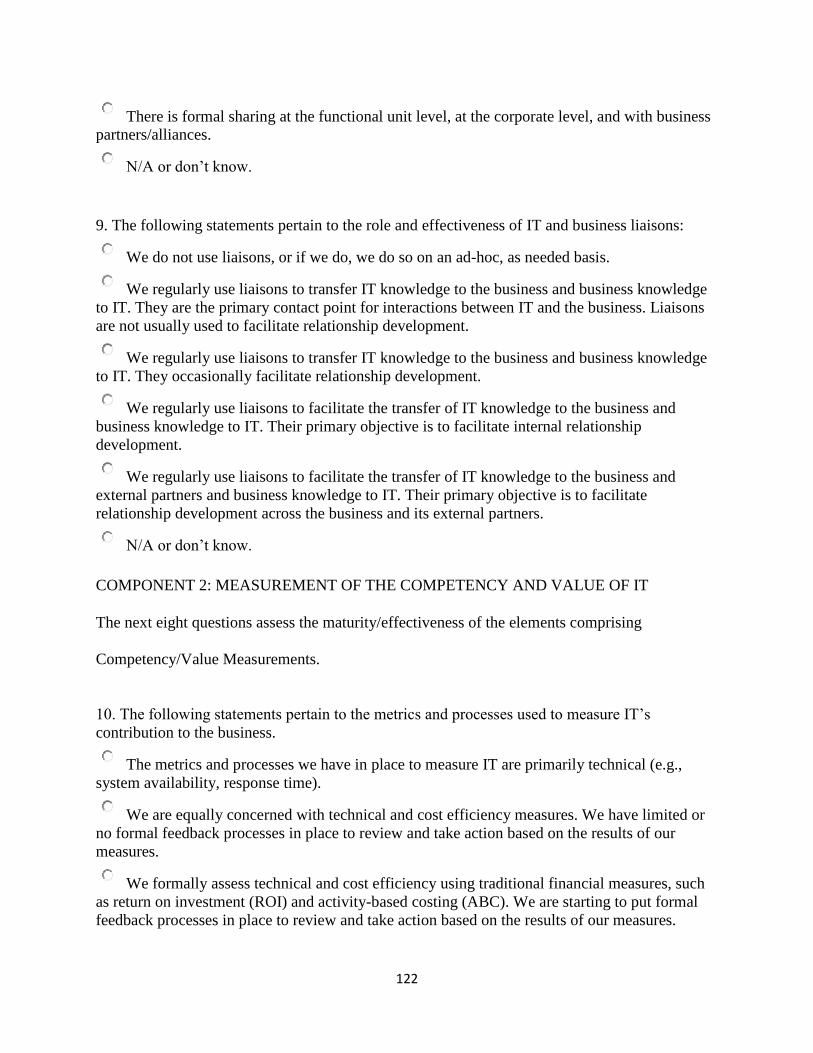
122
There is formal sharing at the functional unit level, at the corporate level, and with business
partners/alliances.
N/A or don‟t know.
9. The following statements pertain to the role and effectiveness of IT and business liaisons:
We do not use liaisons, or if we do, we do so on an ad-hoc, as needed basis.
We regularly use liaisons to transfer IT knowledge to the business and business knowledge
to IT. They are the primary contact point for interactions between IT and the business. Liaisons
are not usually used to facilitate relationship development.
We regularly use liaisons to transfer IT knowledge to the business and business knowledge
to IT. They occasionally facilitate relationship development.
We regularly use liaisons to facilitate the transfer of IT knowledge to the business and
business knowledge to IT. Their primary objective is to facilitate internal relationship
development.
We regularly use liaisons to facilitate the transfer of IT knowledge to the business and
external partners and business knowledge to IT. Their primary objective is to facilitate
relationship development across the business and its external partners.
N/A or don‟t know.
COMPONENT 2: MEASUREMENT OF THE COMPETENCY AND VALUE OF IT
The next eight questions assess the maturity/effectiveness of the elements comprising
Competency/Value Measurements.
10. The following statements pertain to the metrics and processes used to measure IT‟s
contribution to the business.
The metrics and processes we have in place to measure IT are primarily technical (e.g.,
system availability, response time).
We are equally concerned with technical and cost efficiency measures. We have limited or
no formal feedback processes in place to review and take action based on the results of our
measures.
We formally assess technical and cost efficiency using traditional financial measures, such
as return on investment (ROI) and activity-based costing (ABC). We are starting to put formal
feedback processes in place to review and take action based on the results of our measures.

123
We formally assess technical, cost efficiency, and cost effectiveness using traditional
financial measures (e.g., ROI, ABC). We have formal feedback processes in place to review and
take action based on the results of our measures.
We use a multi-dimensional approach with appropriate weights given to technical, financial,
operational, and human-related measures. We have formal feedback processes in place to review
and take action based on the results of our measures. These measures are extended to our
external partners (e.g., vendors, outsourcers, customers).
N/A or don‟t know.
11. The following statements pertain to the use of business metrics to measure contribution to the
business.
We do not measure the value of our business investments, or do so on an ad-hoc basis.
We are concerned with cost efficiency measures at the functional organization level only.
We have limited or no formal feedback processes in place to review and take action based on the
results of our measures.
We formally use traditional financial measures, such as return on investment (ROI) and
activity-based costing (ABC), across functional organizations. We are starting to have formal
feedback processes in place to review and take action based on the results of our measures.
We formally measure value based on the contribution to our customers. We have formal
feedback processes in place to review and take action based on the results of our measures and to
assess contributions across functional organizations.
We use a multi-dimensional approach with appropriate weights given to technical, financial,
operational, and human-related measures. We have formal feedback processes in place to review
and take action based on the results of our measures. These measures are extended to our
external partners (e.g., vendors, outsourcers, customers).
N/A or don‟t know.
12. The following statements pertain to the use of integrated IT and business metrics to measure
IT‟s contribution to the business.
We do not measure the value of our IT business investments, or do so on an ad-hoc basis.
The value measurements for IT and business are not linked. We have limited or no formal
feedback processes in place to review and take action based on the results of our measures.
The value measurements for IT and business are starting to be linked and formalized. We
are also starting to have formal feedback processes in place to review and take action based on
the results of our measures.

124
We formally link the value measurements of IT and business. We have formal feedback
processes in place to review and take action based on the results of our measures and to assess
contributions across functional organizations.
We use a multi-dimensional approach with appropriate weight given to IT and business
measures. We have formal feedback processes in place to review and take action based on the
results of our measures. These measures are extended to our external partners (e.g., vendors,
outsourcers, customers).
N/A or don‟t know.
13. The following statements pertain to the use of service level agreements (SLAs):
We do not use SLAs or do so sporadically.
We have SLAs which are primarily technically oriented (response time, length of computer
downtime, etc.), between the IT and functional organizations.
We have SLAs which are both technically oriented and relationship-oriented (user/customer
satisfaction, IT‟s commitment to the business, etc.) that are between the IT and functional
organizations and also emerging across the enterprise.
We have SLAs which are both technically-oriented and relationship-oriented, between the
IT and functional organizations as well as enterprise wide.
We have SLAs which are both technically-oriented and relationship-oriented, between the
IT and functional organizations as well as at enterprise wide and with our external
partners/alliances.
N/A or don‟t know.
14. The following statements pertain to benchmarking practices. Informal practices are such
things as informal interviews, literature searches, company visits, etc., while formal practices are
such things as environmental scanning, data gathering and analysis, determining best practices,
etc.
We seldom or never perform either informal or formal benchmarks.
We occasionally or routinely perform informal benchmarks.
We occasionally perform formal benchmarks and seldom take action based on the findings.
We routinely perform formal benchmarks and usually take action based on the findings.
We routinely perform formal benchmarks and have a regulated process in place to take
action and measure the changes.

125
N/A or don‟t know.
15. The following statements pertain to the extent of assessment and review of IT investments.
We do not formally assess and/or review.
We assess and/or review only after we have a business or IT problem (i.e., failed IT project,
market share loss).
Assessments and/or reviews are becoming routine occurrences.
We routinely assess and/or review and have a formal process in place to make changes
based on the results.
We routinely assess and/or review and have a formal process in place to make changes
based on the results and measure the changes. Our external partners are included in the process.
N/A or don‟t know.
16. The following statements pertain to the extent to which IT-business continuous improvement
practices (e.g., quality circles, quality reviews) and effectiveness measures are in place.
We do not have any continuous improvement practices in place.
We have a few continuous improvement practices in place, but no effectiveness measures
are in place.
We have a few continuous improvement practices in place and the use of effectiveness
measures is emerging.
We have many continuous improvement practices in place and we frequently measure their
effectiveness.
We have well established continuous improvement practices and effectiveness measures in
place.
N/A or don‟t know.
17. The demonstrated contribution that the IT function has made to the accomplishment of the
organization‟s strategic goals is:
Very weak
Somewhat weak
Neither weak nor strong

126
Somewhat strong
Very strong
N/A or don‟t know.
COMPONENT 3: IT GOVERNANCE
The next seven questions assess the maturity/effectiveness of the elements comprising IT
Governance
18. The following statements pertain to strategic business planning with IT participation.
We do no formal strategic business planning or, if it is done, it is done on an as-needed
basis.
We do formal strategic business planning at the functional unit level with slight IT
participation.
We do formal strategic business planning at the functional unit levels with some IT
participation. There is some inter-organizational planning.
We do formal strategic business planning at the functional unit and across the enterprise
with IT participation.
We do formal strategic business planning at the functional unit, across the enterprise, and
with our business partners/alliances with IT participation.
N/A or don‟t know.
19. The following statements pertain to strategic IT planning with business participation.
We do no formal strategic IT planning or, if it is done, it is done on an as-needed basis.
We do formal strategic IT planning at the functional unit level with slight business
participation.
We formally use traditional financial measures, such as return on investment (ROI) and
activity-based costing (ABC), across functional organizations. We are starting to have formal
feedback processes in place to review and take action based on the results of our measures.We
do formal strategic IT planning at the functional unit levels with some business participation.
There is some inter-organizational planning.
We do formal strategic IT planning at the functional unit and across the enterprise with the
business.

127
We do formal strategic business planning at the functional unit, across the enterprise, and
with our business partners/alliances.
N/A or don‟t know.
20. The following statements pertain to IT budgeting. Our IT function is budgeted as a:
Cost center, with erratic/inconsistent/irregular/changeable spending
Cost center, by functional organization
Cost center with some projects treated as investments
Investment center
Profit center, where IT generates revenues
N/A or don‟t know.
21. The following statements pertain to IT investment decisions. Our IT investment decisions are
primarily based on IT‟s ability to:
Reduce costs.
Increase productivity and efficiency as the focus.
Traditional financial reviews. IT is seen as a process enabler.
Business effectiveness is the focus. IT is seen as a process driver or business strategy
enabler.
Create competitive advantage and increase profit. Our business partners see value.
N/A or don‟t know.
22. The following statements pertain to IT steering committee(s) with senior level IT and
business management participation.
We do not have formal/regular steering committee(s).
We have committee(s) which meet informally on an as-needed basis.
We have formal committees, which meet regularly and have emerging effectiveness.
We have formal, regular committee meetings with demonstrated effectiveness.

128
We have formal, regular committee meetings with demonstrated effectiveness that include
strategic business partners sharing decision-making responsibilities.
N/A or don‟t know.
23. The following statements pertain to how IT projects are prioritized. Our IT project
prioritization process is usually:
In reaction to a business or IT need.
Determined by the IT function.
Determined by the business function.
Mutually determined between senior and mid-level IT and business management.
Mutually determined between senior and mid-level IT and business management and with
consideration of the priorities of any business partners/alliances.
N/A or don‟t know.
24. The ability of the IT function to react/respond quickly to the organization‟s changing
business needs is:
Very weak
Somewhat weak
Neither weak nor strong
Somewhat strong
Very strong
N/A or don‟t know.
COMPONENT 4: PARTNERSHIP
The next six questions assess the maturity/effectiveness of the elements comprising IT and
Business Partnership.
25. IT is perceived by the business as:
A cost of doing business
Emerging as an asset
A fundamental enabler of future business activity

129
A fundamental driver of future business activity
A partner with the business that co-adapts/improvises in bringing value to the firm
N/A or don‟t know.
26. The following statements pertain to the role of IT in strategic business planning.
IT does not have a role.
IT is used to enable business processes.
IT is used to drive business processes.
IT is used to enable or drive business strategy.
IT co-adapts with the business to enab/e/drive strategic objectives.
N/A or don‟t know.
27. The following statements pertain to the sharing (by IT and business management) of the risks
and rewards (e.g., bonuses) associated with IT-based initiatives (i.e., a project is late and over
budget because of business requirement changes).
IT takes all the risks and does not receive any of the rewards.
IT takes most of the risks with little reward.
Sharing of risks and rewards is emerging.
Risks and rewards are always shared.
Risks and rewards are always shared and we have formal compensation and reward systems
in place that induce managers to take risks.
6 N/A or don‟t know.
28. The following statements pertain to formally managing the IT/business relationship. To what
extent are there formal processes in place that focus on enhancing the partnership relationships
that exist between IT and business (e.g., cross-functional teams, training, risk/reward sharing):
We don‟t manage our relationships.
We manage our relationships on an ad-hoc basis.
We have defined programs to manage our relationships, but IT or the business does not
always comply with them. Conflict is seen as creative rather than disruptive.
We have defined programs to manage our relationships and both IT and the business

130
comply with them.
We have defined programs to manage our relationships, both IT and the business comply
with them, and we are continuously improving them.
N/A or don‟t know.
29. The following statements pertain to IT and business relationship and trust.
There is a sense of conflict and mistrust between IT and the business.
The association is primarily an “arm‟s length” transactional style of relationship.
IT is emerging as a valued service provider.
The association is primarily a long-term partnership style of relationship.
The association is a long-term partnership and valued service provider.
N/A or don‟t know.
30. The following statements pertain to business sponsors/champions. Our IT-based initiatives:
Do not usually have a senior level IT or business sponsor/champion.
Often have a senior level IT sponsor/champion only.
Often have a senior level IT and business sponsor/champion at the functional unit level.
Often have a senior level IT and business sponsor/champion at the corporate level.
Often have a senior level IT and the CEO as the business/sponsor champion.
N/A or don‟t know.
COMPONENT 5 : SCOPE & ARCHITECTURE OF THE IT INFRASTRUCTURE
The next five questions assess the maturity/effectiveness of the elements comprising Scope and
Architecture of IT Infrastructure.
31. The following statements pertain to the scope of your IT systems. Our primary systems are:
Traditional office support (e.g., e-mail, accounting, word processing, legacy systems)
Transaction-oriented (e.g., back office support)
Business process enablers (IT supports business process change)

131
Business process drivers (IT is a catalyst for business process change)
Business strategy enablers/drivers (IT is a catalyst for changes in the business strategy)
N/A or don‟t know.
32. The following statements pertain to the articulation of and compliance with IT standards. Our
IT standards are:
Non-existent or not enforced
Defined and enforced at the functional unit level but not across different functional units
Defined and enforced at the functional unit level with emerging coordination across
functional units
Defined and enforced across functional units
Defined and enforced across functional units, and with joint coordination among our
strategic business partners/alliances
N/A or don‟t know.
33. The following statements pertain to the scope of architectural integration. The components of
our IT infrastructure are:
Not well integrated
Integrated at the functional unit with emerging integration across functional units
Integrated across functional units
Integrated across functional units and our strategic business partners/alliances
Evolving with our business partners
N/A or don‟t know.
34. The following statements pertain to the level of disruption caused by business and IT changes
(e.g., implementation of a new technology, business process, merger/acquisition). Most of the
time, a business or IT change is:
Not readily transparent (very disruptive)
Transparent at the functional level only
Transparent at the functional level and emerging across all remote, branch, and mobile
locations

132
Transparent across the entire organization
Transparent across the organization and to our business partners/alliances
N/A or don‟t know.
35. The following statements pertain to the scope of IT infrastructure flexibility to business and
technology changes. Our IT infrastructure is viewed as:
A utility providing the basic IT services at minimum cost
Emerging as driven by the requirements of the current business strategy
Driven by the requirements of the current business strategy
Emerging as a resource to enable fast response to changes in the marketplace
A resource to enable and drive fast response to changes in the marketplace.
N/A or don‟t know.
COMPONENT 6: SKILLS
The next seven questions assess the maturity/effectiveness of the elements comprising Human
Resources/Skills.
36. The following statements pertain to the extent the organization fosters an innovative
entrepreneurial environment. Entrepreneurship is:
Discouraged
Moderately encouraged at the functional unit level
Strongly encouraged at the functional unit level
Strongly encouraged at the functional unit and corporate levels
Strongly encouraged at the functional unit, corporate level, and with business
partners/alliances
N/A or don‟t know.
37. The following statements pertain to the cultural locus of power in making IT-based decisions.
Our important IT decisions are made by:
Top business management or IT management at the corporate level only
Top business or IT management at corporate level with emerging functional unit level
influence

133
Top business management at corporate and functional unit levels, with emerging hared
influence from IT management
Top management (business and IT) across the organization and emerging influence from
our business partners/alliances.
Top management across the organization with equal influence from our business
partners/alliances.
N/A or don‟t know.
38. The following statements pertain to your organization‟s readiness for change.
We tend to resist change.
We recognize the need for change and change readiness programs are emerging.
Change readiness programs providing training and necessary skills to implement change are
in place at the functional unit level.
Change readiness programs are in place at the corporate level.
Change readiness programs are in place at the corporate level and we are proactive and
anticipate change.
N/A or don‟t know.
39. The following statements pertain to career crossover opportunities among IT and business
personnel.
Job transfers rarely or never occur.
Job transfers occasionally occur within the functional organization.
Job transfers regularly occur for management level positions usually at the functional level.
Job transfers regularly occur for all position levels and within the functional units.
Job transfers regularly occur for all position levels, within the functional units, and at the
corporate level.
N/A or don‟t know.
40. The following statements pertain to employee opportunities to learn about and support
services outside the employee‟s functional unit (e.g., programmers trained in product/service
production functions, customer service trained in systems analysis) using programs such as cross
training and job rotation. The organization:
Does not provide opportunities to learn about support services outside the employee‟s
functional unit.

134
Opportunities are dependent on the functional unit.
Formal programs are practiced by all functional units.
Formal programs are practiced by all functional units and across the enterprise.
Opportunities are formally available across the enterprise and with business
partners/alliances.
N/A or don‟t know.
41. The following statements pertain to the interpersonal interaction (e.g., trust, confidence,
cultural, social, and political environment) that exists across IT and business units in our
organization.
There is minimum interaction between IT and business units.
The association is primarily an “arm‟s length” transactional style of relationship.
Trust and confidence among IT and business is emerging.
Trust and confidence among IT and business is achieved.
Trust and confidence is extended to external customers and partners.
N/A or don‟t know.
42. The following statements pertain to the IT organization‟s ability to attract and retain the best
business and technical professionals.
There is no formal program to retain IT professionals. Recruiting demands are filled
ineffectively.
IT hiring is focused on technical expertise.
IT hiring is focused equally on technical and business expertise. Retention programs are in
place.
Formal programs are in place to attract and retain the best IT professionals with both
technical and business skills.
Effective programs are in place to attract and retain the best IT professionals with both
technical and business skills.
N/A or don‟t know.
Thank you for your participation
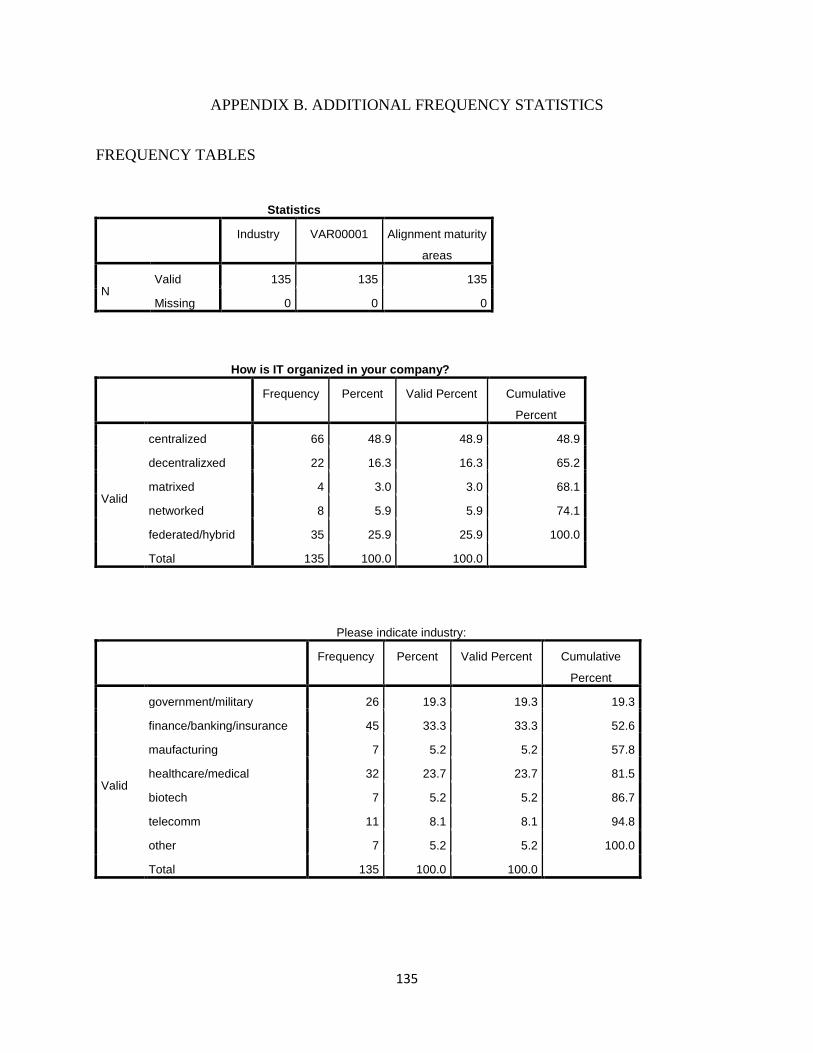
135
APPENDIX B. ADDITIONAL FREQUENCY STATISTICS
FREQUENCY TABLES
Statistics
Industry VAR00001 Alignment maturity
areas
N Valid 135 135 135
Missing 0 0 0
How is IT organized in your company?
Frequency Percent Valid Percent Cumulative
Percent
Valid
centralized 66 48.9 48.9 48.9
decentralizxed 22 16.3 16.3 65.2
matrixed 4 3.0 3.0 68.1
networked 8 5.9 5.9 74.1
federated/hybrid 35 25.9 25.9 100.0
Total 135 100.0 100.0
Please indicate industry:
Frequency Percent Valid Percent Cumulative
Percent
Valid
government/military 26 19.3 19.3 19.3
finance/banking/insurance 45 33.3 33.3 52.6
maufacturing 7 5.2 5.2 57.8
healthcare/medical 32 23.7 23.7 81.5
biotech 7 5.2 5.2 86.7
telecomm 11 8.1 8.1 94.8
other 7 5.2 5.2 100.0
Total 135 100.0 100.0

136
Strategic Alignment Maturity Levels
Frequency Percent Valid
Percent
Cumulative
Percent
Valid
level 1 initial/ad-hoc process 14 10.4 10.4 10.4
level 2 committed process 38 28.1 28.1 38.5
level 3 established focused
process 45 33.3 33.3 71.9
level 4 improved managed process 30 22.2 22.2 94.1
level 5 optimized process 8 5.9 5.9 100.0
Total 135 100.0 100.0
IT Business Alignment Maturity Components
Frequency Percent Valid Percent Cumulative
Percent
Valid
communication 16 11.9 11.9 11.9
competency 14 10.4 10.4 22.2
governance 45 33.3 33.3 55.6
partnership 28 20.7 20.7 76.3
technology 25 18.5 18.5 94.8
skill 7 5.2 5.2 100.0
Total 135 100.0 100.0

137
The demonstrated contribution that the IT function has made to the accomplishment of
the organization’s strategic goals is:
Frequency Percent Valid Percent Cumulative
Percent
Valid
very weak 4 3.0 3.0 3.0
somewhat weak 24 17.8 17.8 20.7
neither weak or strong 25 18.5 18.5 39.3
somewhat strong 52 38.5 38.5 77.8
very strong 26 19.3 19.3 97.0
na or dk 4 3.0 3.0 100.0
Total 135 100.0 100.0
number of employees
Frequency Percent Valid Percent Cumulative
Percent
Valid
<1000 60 44.4 44.4 44.4
1000 - 5000 36 26.7 26.7 71.1
5000 - 10000 27 20.0 20.0 91.1
10000 - 50000 9 6.7 6.7 97.8
>50000 3 2.2 2.2 100.0
Total 135 100.0 100.0

138
APPENDIX C. SURVEY RESPONSE FREQUENCY

139