impact of iasi data density in the assimilation of a...
TRANSCRIPT

Impact of IASI data density in the assimilation of a convective-scale
model
Vincent GUIDARD
Pierre BROUSSEAU and Florence RABIER
Météo-France and CNRS / CNRM-GAME

2ITSC-17 – Monterey CA, 14-20 April 2010
Overview
1. IASI in operational NWP models1.a- Data selection1.b- Data usage1.c- Impact on forecasts
2. Increasing IASI density: what impact ?2.a- Analysis increments2.b- Observation errors2.c- Impact on forecasts
Conclusion
ITSC-17 – Monterey CA, 14-20 April 2010
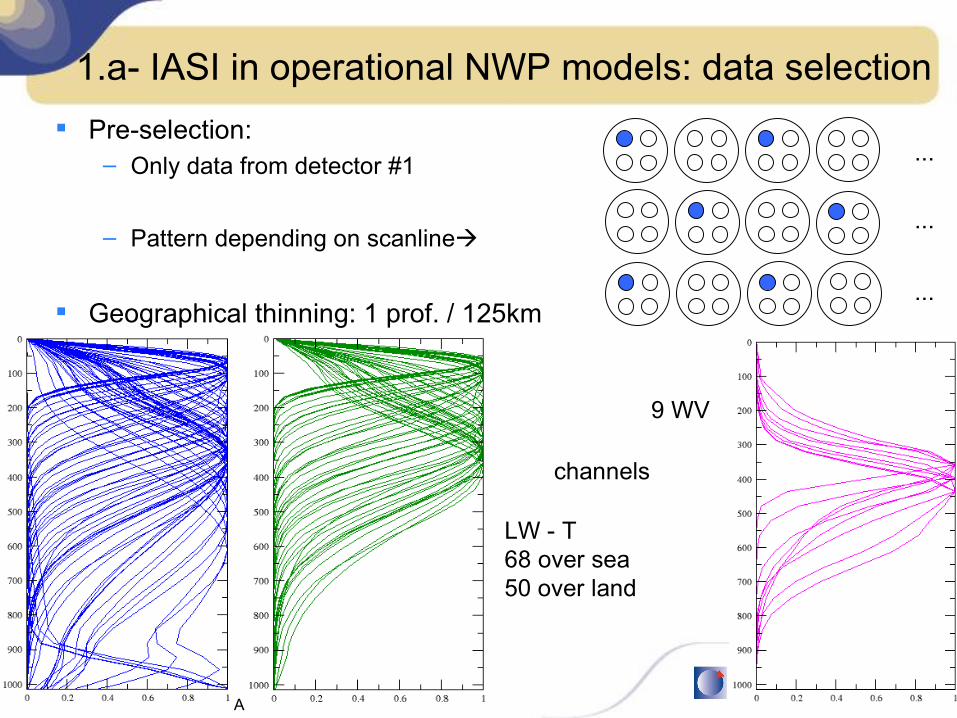
Pre-selection:– Only data from detector #1
– Pattern depending on scanline
Geographical thinning: 1 prof. / 125km
1.a- IASI in operational NWP models: data selection
9 WV
LW - T68 over sea50 over land
channels
...
...
...

ITSC-17 – Monterey CA, 14-20 April 2010
Number of assimilated channels per profile for a typical 3-hour assimilation window
example for 27th February 2010 @ 09 UTC assimilation time
1.b- IASI in NWP models: data usage in AROME
Such a coverage only twice a day
Cloud detection: McNally & Watts (2003)
5ITSC-17 – Monterey CA, 14-20 April 2010
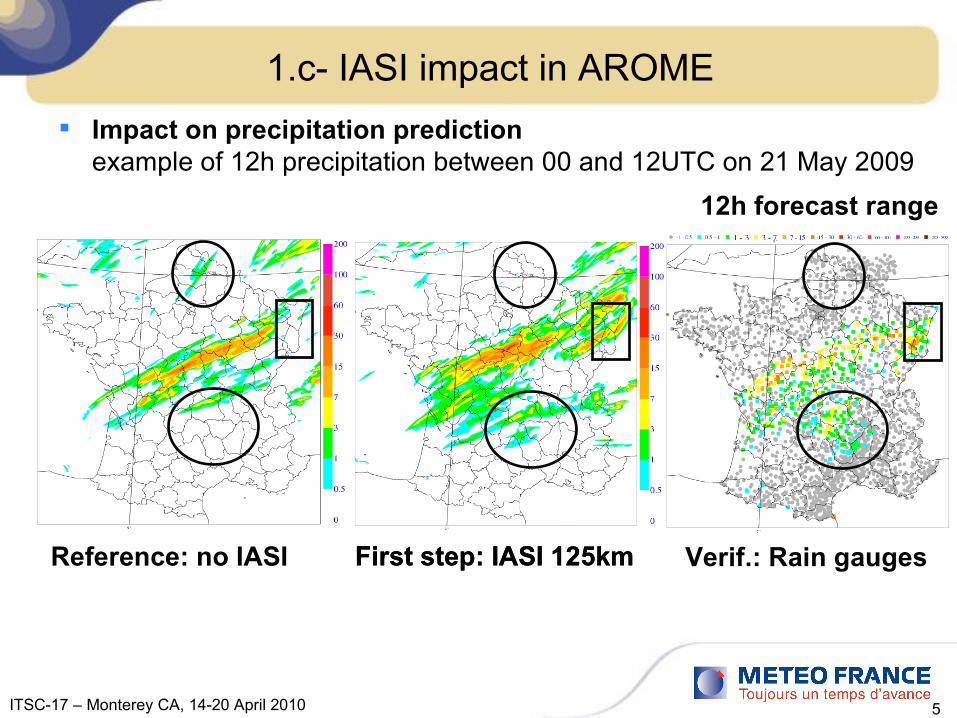
1.c- IASI impact in AROME
Impact on precipitation predictionexample of 12h precipitation between 00 and 12UTC on 21 May 2009
Reference: no IASI
12h forecast range
First step: IASI 125kmFirst step: IASI 125km Verif.: Rain gauges

6ITSC-17 – Monterey CA, 14-20 April 2010
2.a- IASI 125km versus IASI 80km
1 fov over 8125km thinning
1 fov over 280km thinning

ITSC-17 – Monterey CA, 14-20 April 2010
2.a- Analysis increments: temperature at 500 hPa
No IASI
IASI @ 125km IASI @ 80km
1 isoline every 0.2K

ITSC-17 – Monterey CA, 14-20 April 2010
2.a- Analysis increments: spectra for temperature
Assimilating IASI at a higher density leads to larger analysis increments at all wavelengthes
Altitude: 10.3km Altitude: 5.3km
Scale: ~650km Scale: ~6.5km

ITSC-17 – Monterey CA, 14-20 April 2010
2.b- Observation error estimation
Signal of horizontal observation error correlation for IASI @ 80km ?
Hollingsworth-Lonnberg:obs minus guess for channel 0109averaged in function of distanceprovides R + HBHT
Desroziers et al (2005):Using obs minus guess and obs minus analysis, provides full Rin particular, sigma_o
K
Distance (km)
K

10ITSC-17 – Monterey CA, 14-20 April 2010
2.c- Impact on rainfall forecasts
• FAR vs. PODgreen = IASI @125 kmred = IASI @80 kmstats over 3 weeksin December 2009
• POD is better@ 80 km
• FAR is =

11ITSC-17 – Monterey CA, 14-20 April 2010
Conclusion
IASI has a positive impact both in global and convective-scale NWP More data will be used
– More channels, especially in the water vapour band– Cloud affected radiances (eg. Nadia Fourrié's talk)– At a higher horizontal resolution
�
Tuning observation error statistics may be needed– Inter-channel correlation (see Vincent Guidard's poster)– Take into account horizontal correlations or
find the optimal separation distance
LAM specific issue in bi-Fourier space: if information only on one part of the domain,increments may look bad (-->).An additional constraint coming from thecoupling model may be introduced in the cost function (Guidard & Fischer, 2008)